1972 best year ever for tokyo stock prices
TRANSCRIPT
International
1972 best year ever for Tokyo stock prices Chemical stocks joined in the upsurge in spite of falling earnings and subpar performance by chemical companies
Japan's chemical industry came close last year to fulf i l l ing the alchemist 's dream of turning lead into gold—at least in the stock market. As earnings statements sagged in one of the industry's dullest postwar years (C&EN, Jan . 1, page 10), chemical stocks seemed to move in another world . The majority of the 10 largest Japanese chemical producers ( including five diversified fiber makers) saw their share prices double or triple on the Tokyo Stock E x change, and the top performer among these issues, Teijin, Ltd., came close to quadrupl ing in the year's t rading. TSE'S price index for its entire chemical sec
t ion, numbering 95 firms, bul led upward to a 78% gain in 1972.
Mitsui Toatsu Chemicals is l ikely to be the only f i rm among the 10 largest chemical firms to show increased earnings for the year, and its marginal 0.2% net profit on sales follows a loss in 1971. Unitika, Ltd., wrote off a $30 mi l l i on loss i n 1972. Nei ther f i rm pa id d i v i dends during the year, yet stock prices for both more than t r ip led. M o s t of the other 10 firms, despite the steady gain in their share prices, suffered substant i a l drops in earnings.
Chemica l shares weren't alone in the stock market scramble. T S E , i n fact, enjoyed the greatest b u l l market i n its history in 1972, sweeping prices upward almost across the board. A s the year's final session closed, the T S E index for al l issues stood at a record high of 401.70—just over twice that of a year earlier. (The N e w Y o r k Stock Exchange composite index rose only 14% in 1972.) "In this market ," says one banker in Tokyo, " a stock that didn ' t add at least 30% last year was a real loser." C h e m i
cals, fibers, and steel were among market leaders, though these industries have lagged business as a whole in coping wi th the recession that's now fading away in Japan .
A l l this upward movement is i n contrast to the relatively modest gains made during 1972 by the stocks of the 20 largest U . S . basic chemical and fiber companies. The biggest gainer was R o h m and Haas, up 61%. The average gain was about 14%. Eigh t of the 20 stocks actually lost ground over the year wi th Celanese, the biggest loser, down 43%. A n d a l l this happened during the best business year for U . S . chemical makers since 1966.
Where, then, was the demand that has pushed Japanese stock quotations so sharply upward? The short answer is Japan's industr ial firms themselves. They opened 1972 wi th a burst of trading that never slackened. A c cording to Da iwa Securities Co. , i n dustrial firms bought $534 mi l l ion more shares on the T S E through September than they sold—nearly three times
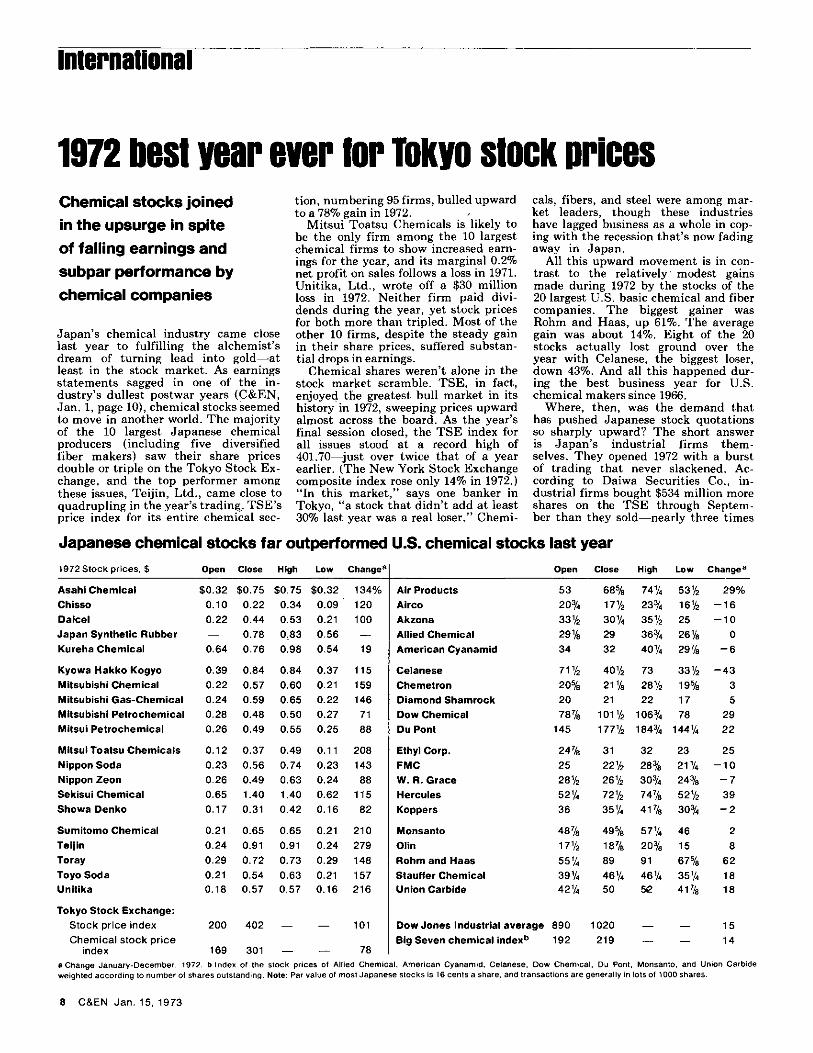
Japanese chemical stocks far outperformed U.S. chemical stocks last year 1972 Stock prices, $ Open Close High Low Change8 Open Close High Low Change9
Asahi Chemical $0.32 $0.75 $0.75 $0.32 134% Air Products 53 68% 74% 53% 29% Chisso 0.10 0.22 0.34 0.09 120 Airco 20% 17 1 / 2 23% 16% -16 Daicel 0.22 0.44 0.53 0.21 100 Akzona 331/2 3oy4 35% 25 -10 Japan Synthetic Rubber — 0.78 0.83 0.56 — Allied Chemical 29% 29 36% 26% 0 Kureha Chemical 0.64 0.76 0.98 0.54 19 American Cyanamid 34 32 40% 29% - 6
Kyowa Hakko Kogyo 0.39 0.84 0.84 0.37 115 Celanese 711/2 4oy2 73 33% -43 Mitsubishi Chemical 0.22 0.57 0.60 0.21 159 Chemetron 20% 21% 28% 19% 3 Mitsubishi Gas-Chemical 0.24 0.59 0.65 0.22 146 Diamond Shamrock 20 21 22 17 5 Mitsubishi Petrochemical 0.28 0.48 0.50 0.27 71 Dow Chemical 78% ioiy 2 106% 78 29 Mitsui Petrochemical 0.26 0.49 0.55 0.25 88 Du Pont 145 177% 184% 144% 22
Mitsui Toatsu Chemicals 0.12 0.37 0.49 0.11 208 Ethyl Corp. 24% 31 32 23 25 Nippon Soda 0.23 0.56 0.74 0.23 143 FMC 25 22% 28% 21% -10 Nippon Zeon 0.26 0.49 0.63 0.24 88 W. R. Grace 28% 26% 30% 24% - 7 Sekisui Chemical 0.65 1.40 1.40 0.62 115 Hercules 52V4 72% 74% 52% 39 Showa Denko 0.17 0.31 0.42 0.16 82 Koppers 36 35% 41% 30% - 2
Sumitomo Chemical 0.21 0.65 0.65 0.21 210 Monsanto 48% 49% 57% 46 2 Teijin 0.24 0.91 0.91 0.24 279 Olin 17 1 / 2
18% 20% 15 8 Toray 0.29 0.72 0.73 0.29 148 Rohm and Haas 55 y4 89 91 67% 62 Toyo Soda 0.21 0.54 0.63 0.21 157 Stauffer Chemical 39 y4 46% 46% 35% 18 Unitika 0.18 0.57 0.57 0.16 216 Union Carbide 42y4 50 52 41% 18
Tokyo Stock Exchange: Stock pr ice index 200 402 — — 101 Dow Jones Industrial average 890 1020 — — 15 Chemica l s tock pr ice Big Seven chemical index b 192 219 — 14
index 169 301 — — 78 Big Seven chemical index b
a Change January-December, 1972. b Index of the stock prices of Allied Chemical, American Cyanamid, Celanese, Dow Chemical, Du Pont, Monsanto, and Union Carbide weighted according to number of shares outstanding. Note: Par value of most Japanese stocks is 16 cents a share, and transactions are generally in lots of 1000 shares.
8 C & E N J a n . 15, 1973
their net purchases in a l l of 1971. Banks were also in a bu l l i sh mood, making net purchases of almost $400 mi l l i on through September, and insurance firms weren't far behind. However, bank purchases fell off greatly after the Japanese government moved in A p r i l to temper their t rading on the exchanges, and insurance firms in recent months have also dropped far behind industr ial companies i n trading on the T S E .
Corporate portfolios have always been a big factor i n Japan's equity structure. Interlocked shareholding is common among an industr ia l f i rm and its ma in suppliers and customers, and among the clusters of companies that make up Japan's unique combines. A good example is M i t s u b i s h i Corp. , Japan's largest t rading f i rm wi th annual sales of more than $15 b i l l i on . M o s t of the 40-odd pr inc ipa l firms i n the M i t s u b i s h i combine hold smal l percentages of the giant f irm's stock, adding up to about one th i rd of its equity. M i t s u b i s h i Corp. , i n turn , holds shares in more than half of the combine's other firms. Such in terlocking means that a sizable port ion of many stock issues isn't actively traded and, incidental ly, makes share prices more sensitive to demand than overall size of l isted issues would imp ly . The pattern of T S E trading last year, i n fact, was a steady shift of stock from individuals into corporate hands. P r i vate investors had sold $1.3 b i l l ion more shares through September than they bought. (Individuals held about 40% of T S E - l i s t e d shares in 1971, a decline from their 50% holding in 1958.)
The recent recession itself was one root of the companies' stock market raid. The sharp drop i n capi ta l spending by many key industries (13% down for steel estimated i n the year ending this M a r c h , for example, and about 50% down for both petrochemicals and synthetic fibers) and generally sluggish business act ivi ty in the first half combined to cut demand for the bank loans on which Japanese industry ordinar i ly relies so heavily. A t the same t ime, the money supply swelled as the B a n k of J apan converted to yen the foreign trade receipts that continued to funnel into the country's already towering exchange reserves.
Interest rates on bank loans have moved steadily downward since late 1970, leading the banks last J u l y to cut interest rates on deposits for the first t ime i n 11 years—a reluctant step in a country where family savings are an inst i tut ion. W i t h the banks at pains to keep loans moving, the upshot has been a surge of corporate buying in land, long a b u l l market in Japan, and i n stocks. The latter move s imply followed the custom of boosting interlocked shareholdings at the start, though f i nancia l observers in Tokyo admit that speculation also entered the picture as share prices continued to c l imb .
Price-to-earnings ratios rose steeply during the year, reaching 23.24 for a l l
T S E stocks by year's end. B u t Japanese firms do not consolidate earnings of subsidiaries in their reporting, so that actual P / E ratios in many cases are rather lower. (The median P / E ratio for the 20 largest U . S . chemical and fiber companies was 15 at year's end.)
The T S E had only one significant break in its 1972 c l imb, when the U . K . floated the exchange rate for sterling, and the T S E index recovered in less than a week. H o w long can J . P . M o r gan's classic rule about the market— that it w i l l fluctuate—be thwarted? Predictions are as varied in Tokyo as on W a l l Street, but a plausible case can be made for a gradual, shallow decline in price levels during 1973. Japanese in dustry as a whole is well out of recession now, and reviving need for operating and capi tal investment funds should draw away many firms from the brokerages.
If official policy succeeds in slackening Japan's net foreign trade earnings, the money supply w i l l t ighten further. Also, closer scrutiny of how commercial bank loans are being used has been promised by the B a n k of Japan . B u t these are steps that work gradually. A move to reduce corporate portfolios could well be compensated by a return of private investors if Japan's economy continues to pick up as it has in the past quarter. Tokyo businessmen are quick to point out that the upswing is based on domestic demand, not foreign
trade. D a i w a Securities ' econometric forecasting model now predicts 12.7% real growth in the year beginning this A p r i l . A d d i n g a 10% yen revaluation in A p r i l to the premises merely lowers the forecast to 10.8% real growth. Revaluation has lost much of its terror to the Japanese, and corrall ing the bulls may take a longish t ime on the T S E .
I N D U S T R Y / B U S I N E S S
SOCMA head urges harder line on trade If this year's first meeting of the Synthetic Organic Chemicals Manufacturing Association ( S O C M A ) is any indication, 1973 w i l l be a significant year for developments i n trade legislation and international trade talks. The associat ion probably is the chemical industry's most active and best informed trade group on international trade matters, and the new S O C M A president, Haro ld C . Whit temore, Jr . , devoted the better part of his recent press briefing in N e w York C i t y to trade. A n d if S O C M A is starting to renew its emphasis on trade, then important trade developments probably are in the wind .
Referring to the major international trade talks that are tentatively scheduled to start this fal l , M r . Whit temore called for the U . S . to take a hard line i n
Who has the experience to supply or develop exactly the right catalyst for you?
Houdry has it. If we don't have the specialty
catalyst you want in our arsenal already, we'll find it for you...or
develop it for you. Just define your problem and turn us loose on it. As the most experienced merchant catalyst producer in North America, we can take on your toughest catalyst problems. For more information, call (215) 687-6150. Houdry Division, Air Products and Chemicals, Inc., 5 Executive Mall, Swedesford Road, Wayne, Pa. 19087.
J a n . 15, 1973 C & E N 9
HOUDRY DIVISION