163-2007: a legend is not just a legend
TRANSCRIPT
1
Paper 163-2007
A Legend is Not Just a Legend Wendi L. Wright
ABSTRACT This intermediate level presentation will show the many ways to change the legend in a graph, to make it more meaningful and to make it stand out more clearly on the plot. Using PROC GPLOT and the LEGEND statement, this paper demonstrates how; 1) legends can be moved to different places on the graph; 2) labels of the legend values can be changed; 3) the shape of the legend can be made vertical rather than horizontal and; 4) adding color can emphasize your legend.
INTRODUCTION The data used in this example contain the following variables. These include counts of the number of hits for three websites for each day and a total count across all three.
• Date – format yymmdd8. • Day – day of month in $char2. format • Web1 – hits on Website 1 • Web2 – hits on Website 2 • Web3 – hits on Website 3 • Total – total number of hits on all three websites
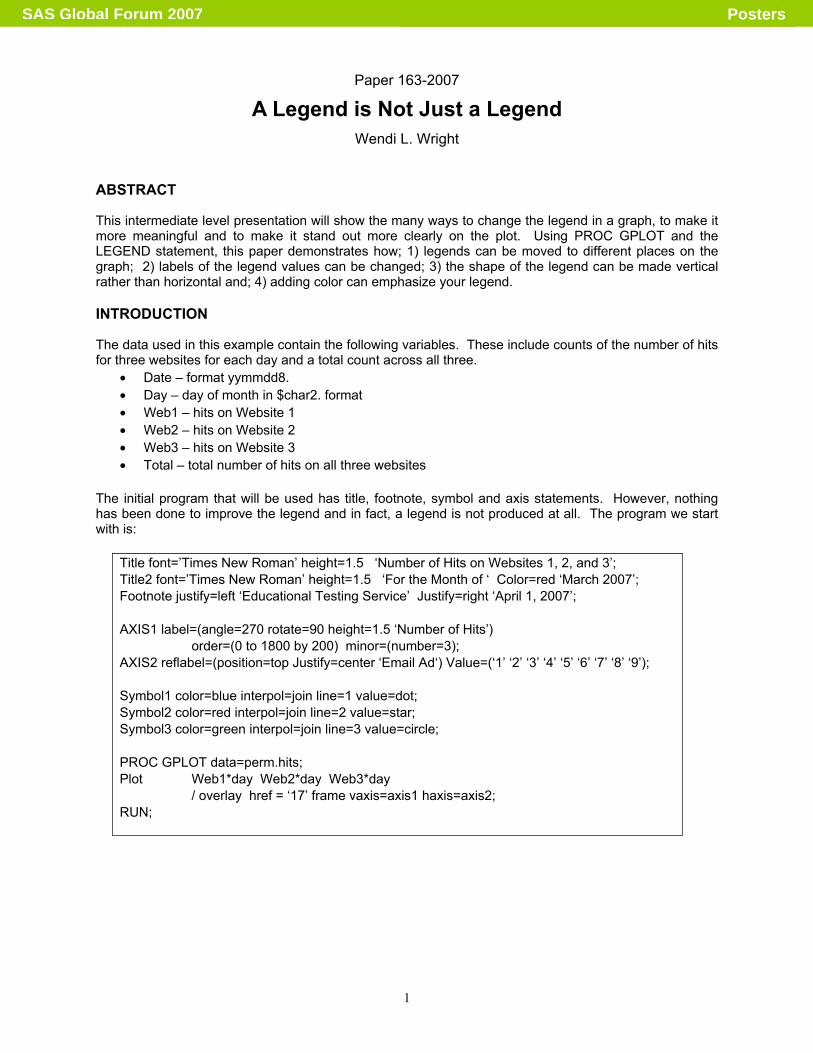
The initial program that will be used has title, footnote, symbol and axis statements. However, nothing has been done to improve the legend and in fact, a legend is not produced at all. The program we start with is:
Title font=’Times New Roman’ height=1.5 ‘Number of Hits on Websites 1, 2, and 3’; Title2 font=’Times New Roman’ height=1.5 ‘For the Month of ‘ Color=red ‘March 2007’; Footnote justify=left ‘Educational Testing Service’ Justify=right ‘April 1, 2007’; AXIS1 label=(angle=270 rotate=90 height=1.5 ‘Number of Hits’) order=(0 to 1800 by 200) minor=(number=3); AXIS2 reflabel=(position=top Justify=center ‘Email Ad‘) Value=(‘1’ ‘2’ ‘3’ ‘4’ ‘5’ ‘6’ ‘7’ ‘8’ ‘9’); Symbol1 color=blue interpol=join line=1 value=dot; Symbol2 color=red interpol=join line=2 value=star; Symbol3 color=green interpol=join line=3 value=circle; PROC GPLOT data=perm.hits; Plot Web1*day Web2*day Web3*day / overlay href = ‘17’ frame vaxis=axis1 haxis=axis2; RUN;
SAS Global Forum 2007 Posters
2
The code above produces the following graph:
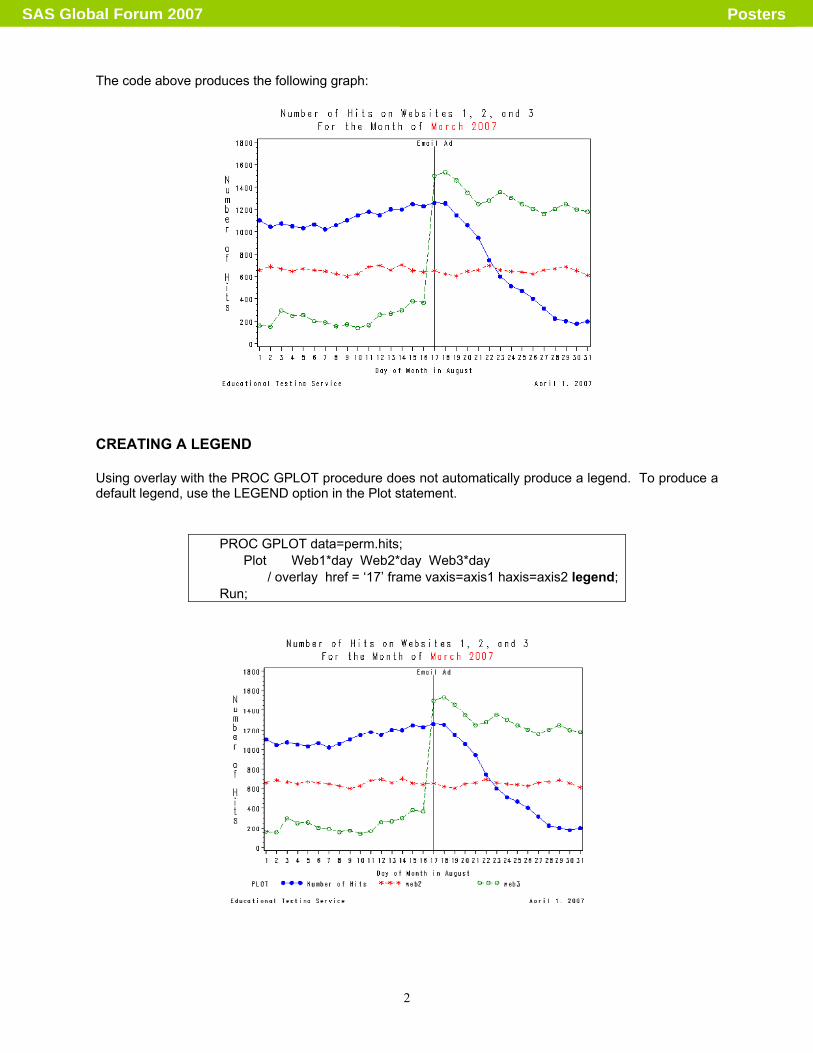
CREATING A LEGEND Using overlay with the PROC GPLOT procedure does not automatically produce a legend. To produce a default legend, use the LEGEND option in the Plot statement.
PROC GPLOT data=perm.hits; Plot Web1*day Web2*day Web3*day / overlay href = ‘17’ frame vaxis=axis1 haxis=axis2 legend;
Run;
SAS Global Forum 2007 Posters
3
THE LEGEND STATEMENT LEGEND statements specify the characteristics of the legend, but do not create the legend. The characteristics that can be specified on this statement include the position and appearance of the legend box, the text and appearance of the legend label, the appearance of the legend entries, including the size and shape of the legend values, and the text of the labels for the legend values. You can have up to 99 different legend statements defined in your program, but only one can be used in any single plot. To identify which one to use for a specific plot, specify legend=legendx (where x is the number of the defined legend statement you are referring to) on the plot statement.
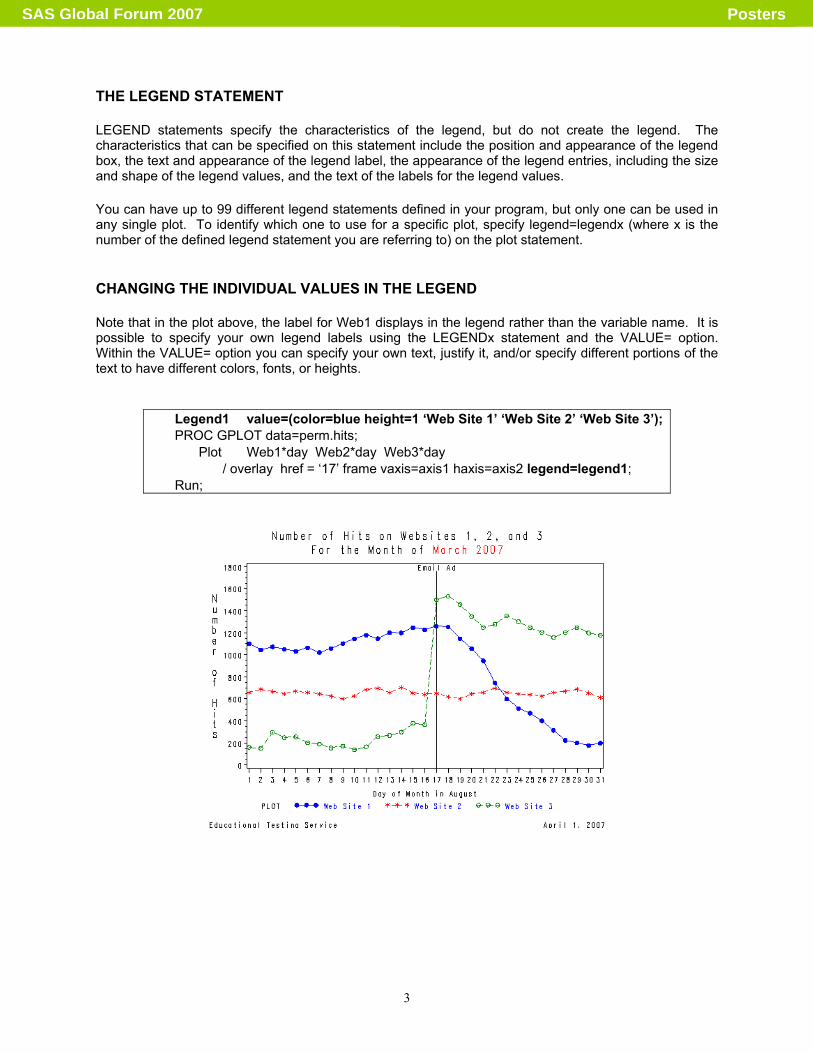
CHANGING THE INDIVIDUAL VALUES IN THE LEGEND Note that in the plot above, the label for Web1 displays in the legend rather than the variable name. It is possible to specify your own legend labels using the LEGENDx statement and the VALUE= option. Within the VALUE= option you can specify your own text, justify it, and/or specify different portions of the text to have different colors, fonts, or heights.
Legend1 value=(color=blue height=1 ‘Web Site 1’ ‘Web Site 2’ ‘Web Site 3’);PROC GPLOT data=perm.hits;
Plot Web1*day Web2*day Web3*day / overlay href = ‘17’ frame vaxis=axis1 haxis=axis2 legend=legend1;
Run;
SAS Global Forum 2007 Posters
4
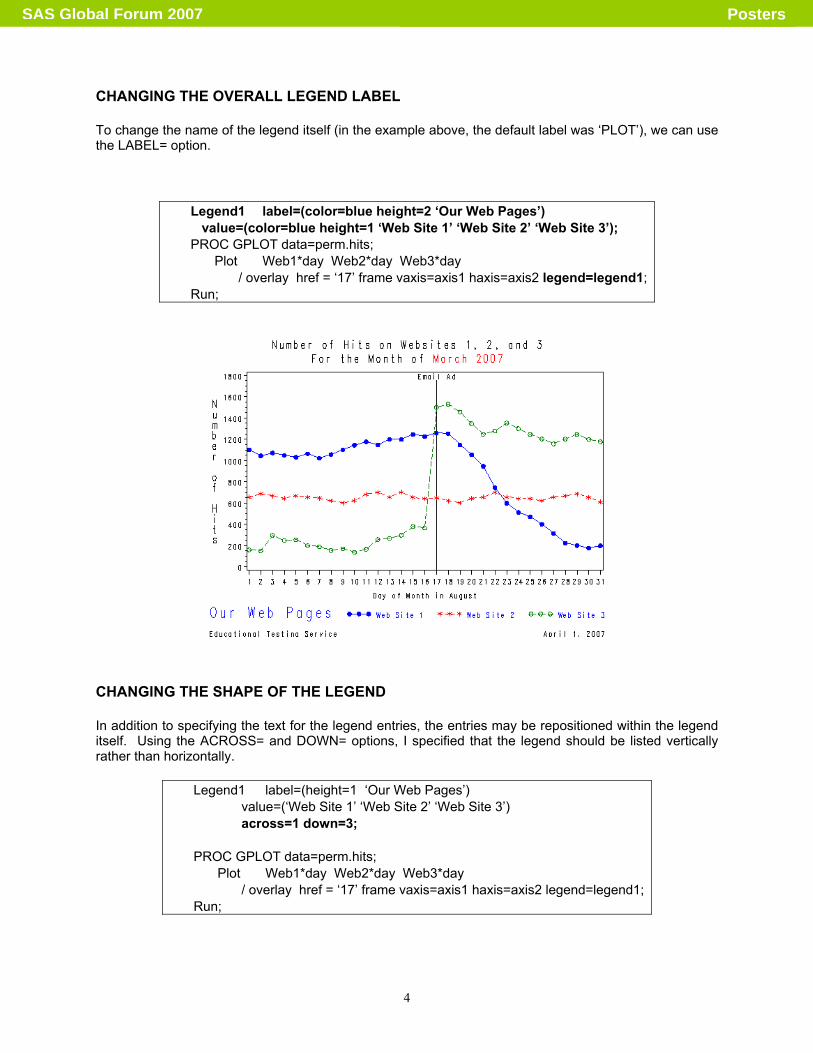
CHANGING THE OVERALL LEGEND LABEL To change the name of the legend itself (in the example above, the default label was ‘PLOT’), we can use the LABEL= option.
Legend1 label=(color=blue height=2 ‘Our Web Pages’) value=(color=blue height=1 ‘Web Site 1’ ‘Web Site 2’ ‘Web Site 3’); PROC GPLOT data=perm.hits;
Plot Web1*day Web2*day Web3*day / overlay href = ‘17’ frame vaxis=axis1 haxis=axis2 legend=legend1;
Run;
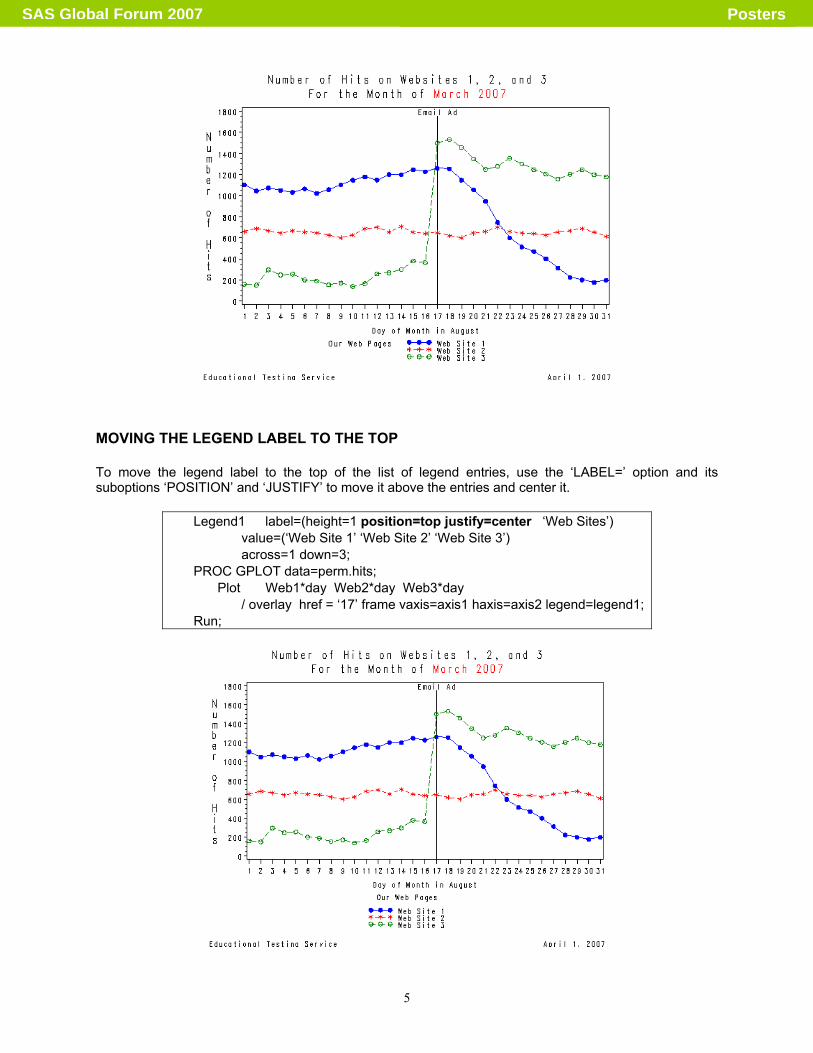
CHANGING THE SHAPE OF THE LEGEND In addition to specifying the text for the legend entries, the entries may be repositioned within the legend itself. Using the ACROSS= and DOWN= options, I specified that the legend should be listed vertically rather than horizontally.
Legend1 label=(height=1 ‘Our Web Pages’) value=(‘Web Site 1’ ‘Web Site 2’ ‘Web Site 3’) across=1 down=3; PROC GPLOT data=perm.hits;
Plot Web1*day Web2*day Web3*day / overlay href = ‘17’ frame vaxis=axis1 haxis=axis2 legend=legend1;
Run;
SAS Global Forum 2007 Posters
5
MOVING THE LEGEND LABEL TO THE TOP To move the legend label to the top of the list of legend entries, use the ‘LABEL=’ option and its suboptions ‘POSITION’ and ‘JUSTIFY’ to move it above the entries and center it.
Legend1 label=(height=1 position=top justify=center ‘Web Sites’) value=(‘Web Site 1’ ‘Web Site 2’ ‘Web Site 3’) across=1 down=3; PROC GPLOT data=perm.hits;
Plot Web1*day Web2*day Web3*day / overlay href = ‘17’ frame vaxis=axis1 haxis=axis2 legend=legend1;
Run;
SAS Global Forum 2007 Posters
6
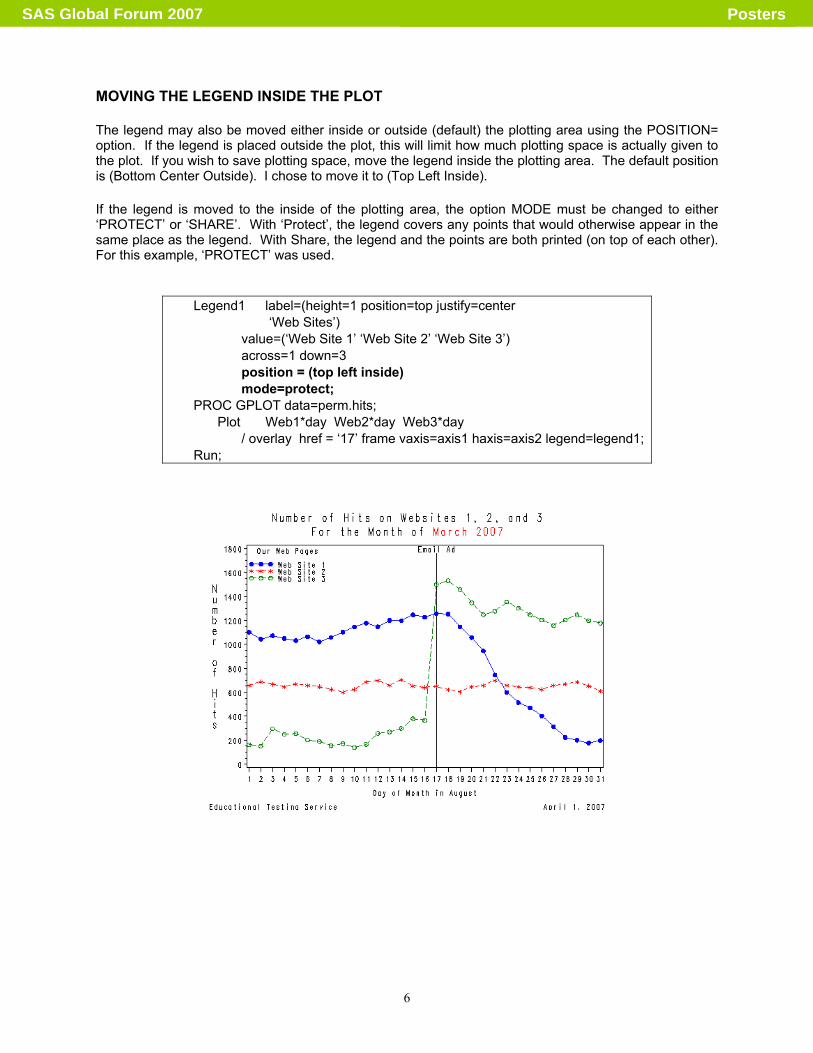
MOVING THE LEGEND INSIDE THE PLOT The legend may also be moved either inside or outside (default) the plotting area using the POSITION= option. If the legend is placed outside the plot, this will limit how much plotting space is actually given to the plot. If you wish to save plotting space, move the legend inside the plotting area. The default position is (Bottom Center Outside). I chose to move it to (Top Left Inside). If the legend is moved to the inside of the plotting area, the option MODE must be changed to either ‘PROTECT’ or ‘SHARE’. With ‘Protect’, the legend covers any points that would otherwise appear in the same place as the legend. With Share, the legend and the points are both printed (on top of each other). For this example, ‘PROTECT’ was used.
Legend1 label=(height=1 position=top justify=center ‘Web Sites’) value=(‘Web Site 1’ ‘Web Site 2’ ‘Web Site 3’) across=1 down=3 position = (top left inside) mode=protect; PROC GPLOT data=perm.hits;
Plot Web1*day Web2*day Web3*day / overlay href = ‘17’ frame vaxis=axis1 haxis=axis2 legend=legend1;
Run;
SAS Global Forum 2007 Posters
7
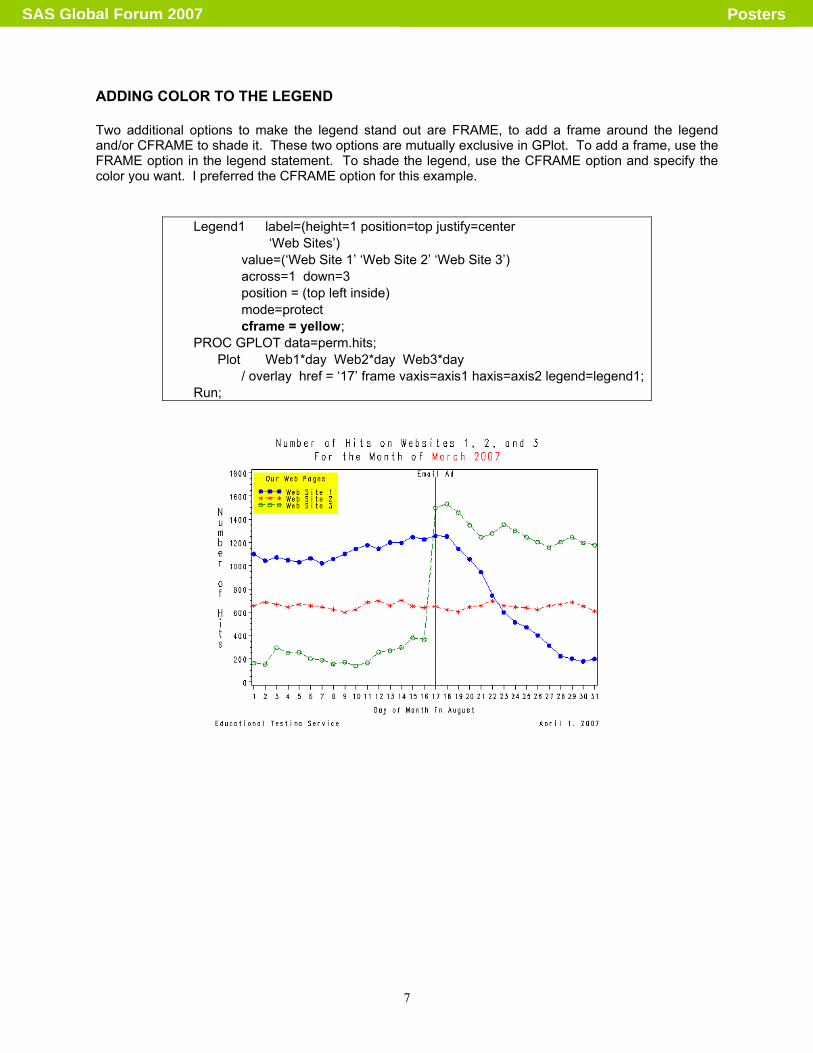
ADDING COLOR TO THE LEGEND Two additional options to make the legend stand out are FRAME, to add a frame around the legend and/or CFRAME to shade it. These two options are mutually exclusive in GPlot. To add a frame, use the FRAME option in the legend statement. To shade the legend, use the CFRAME option and specify the color you want. I preferred the CFRAME option for this example.
Legend1 label=(height=1 position=top justify=center ‘Web Sites’) value=(‘Web Site 1’ ‘Web Site 2’ ‘Web Site 3’) across=1 down=3 position = (top left inside) mode=protect cframe = yellow; PROC GPLOT data=perm.hits;
Plot Web1*day Web2*day Web3*day / overlay href = ‘17’ frame vaxis=axis1 haxis=axis2 legend=legend1;
Run;
SAS Global Forum 2007 Posters
8
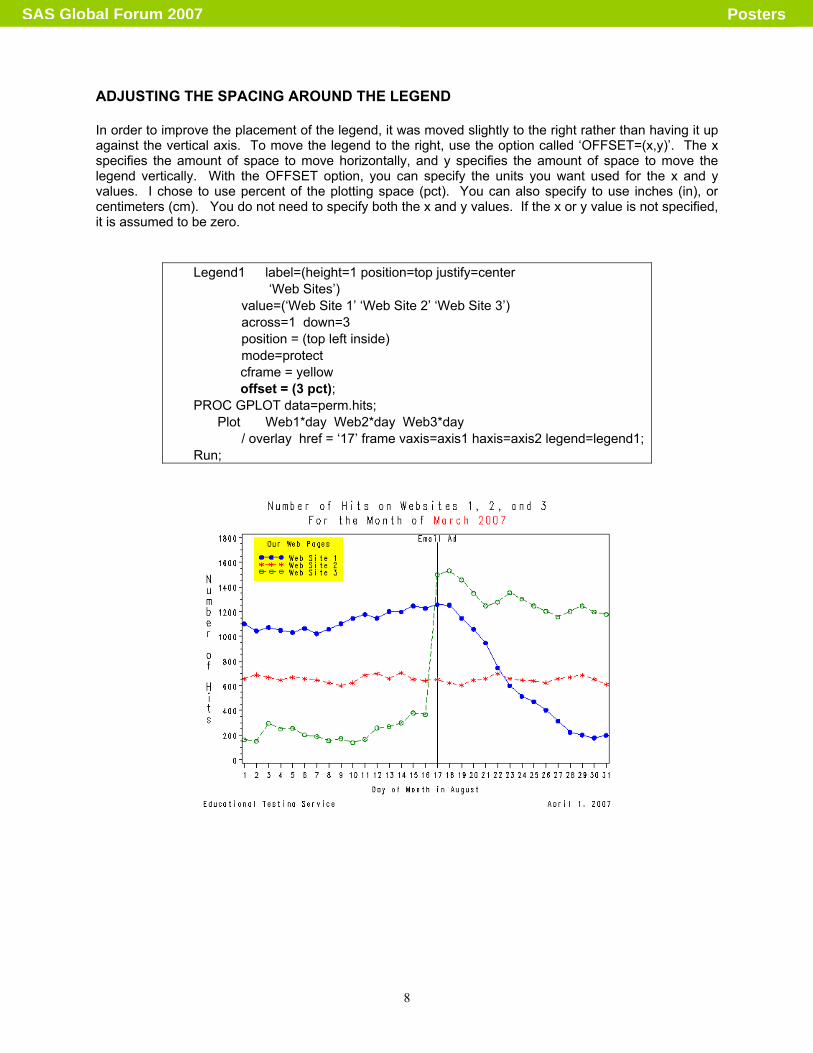
ADJUSTING THE SPACING AROUND THE LEGEND In order to improve the placement of the legend, it was moved slightly to the right rather than having it up against the vertical axis. To move the legend to the right, use the option called ‘OFFSET=(x,y)’. The x specifies the amount of space to move horizontally, and y specifies the amount of space to move the legend vertically. With the OFFSET option, you can specify the units you want used for the x and y values. I chose to use percent of the plotting space (pct). You can also specify to use inches (in), or centimeters (cm). You do not need to specify both the x and y values. If the x or y value is not specified, it is assumed to be zero.
Legend1 label=(height=1 position=top justify=center ‘Web Sites’) value=(‘Web Site 1’ ‘Web Site 2’ ‘Web Site 3’) across=1 down=3 position = (top left inside) mode=protect cframe = yellow offset = (3 pct); PROC GPLOT data=perm.hits;
Plot Web1*day Web2*day Web3*day / overlay href = ‘17’ frame vaxis=axis1 haxis=axis2 legend=legend1;
Run;
SAS Global Forum 2007 Posters
9
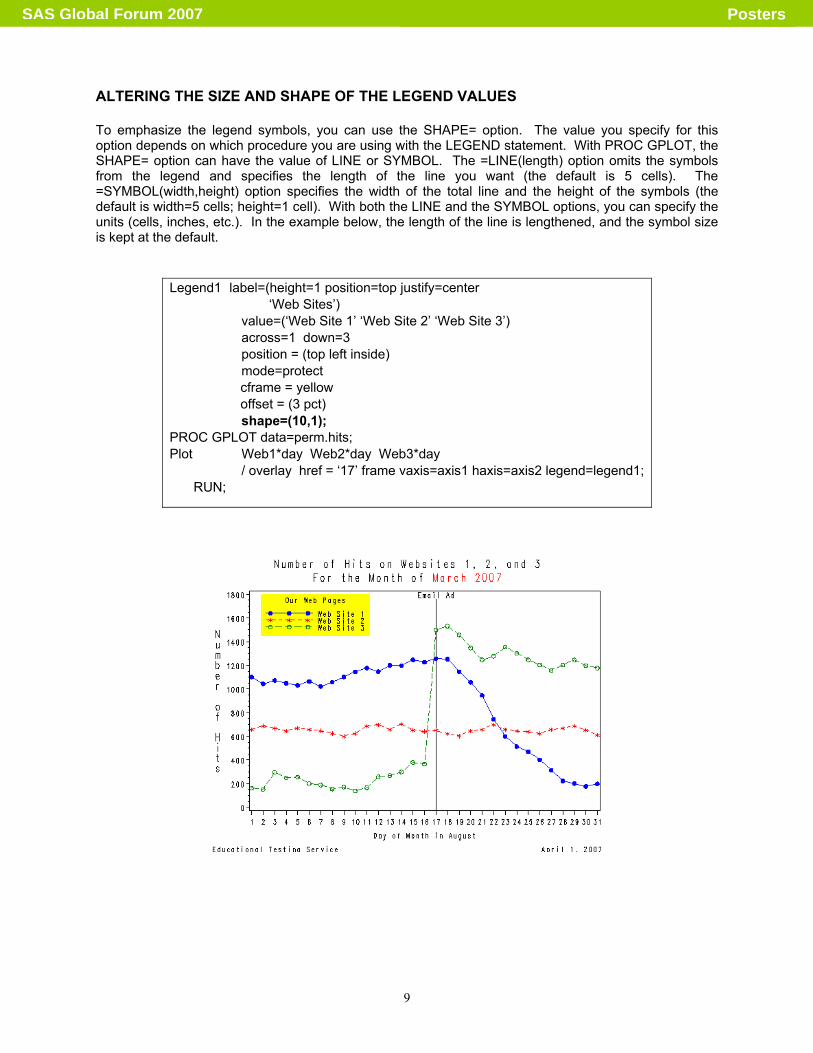
ALTERING THE SIZE AND SHAPE OF THE LEGEND VALUES To emphasize the legend symbols, you can use the SHAPE= option. The value you specify for this option depends on which procedure you are using with the LEGEND statement. With PROC GPLOT, the SHAPE= option can have the value of LINE or SYMBOL. The =LINE(length) option omits the symbols from the legend and specifies the length of the line you want (the default is 5 cells). The =SYMBOL(width,height) option specifies the width of the total line and the height of the symbols (the default is width=5 cells; height=1 cell). With both the LINE and the SYMBOL options, you can specify the units (cells, inches, etc.). In the example below, the length of the line is lengthened, and the symbol size is kept at the default.
Legend1 label=(height=1 position=top justify=center ‘Web Sites’) value=(‘Web Site 1’ ‘Web Site 2’ ‘Web Site 3’) across=1 down=3 position = (top left inside) mode=protect cframe = yellow offset = (3 pct) shape=(10,1); PROC GPLOT data=perm.hits; Plot Web1*day Web2*day Web3*day / overlay href = ‘17’ frame vaxis=axis1 haxis=axis2 legend=legend1; RUN;
SAS Global Forum 2007 Posters
10
CONCLUSION The options described here are by no means exhaustive of what you can do with the LEGEND statement in the SAS Graph system. Please refer to the documentation (link below) to learn what else is possible. http://support.sas.com/onlinedoc/913/docMainpage.jsp at left, click on SAS Graph Reference,
SAS Graph Concepts, SAS/Graph Statements,
then LEGEND statement
AUTHOR CONTACT Your comments and questions are valued and welcome. Contact the author at: Wendi L. Wright 1351 Fishing Creek Valley Rd. Harrisburg, PA 17112 Phone: (717) 513-0027 E-mail: [email protected] SAS and all other SAS Institute Inc. product or service names are registered trademarks or trademarks of SAS Institute, Inc. in the USA and other countries. ® indicates USA registration. Other brand and product names are trademarks of their respective companies.
SAS Global Forum 2007 Posters