16 q3 earnings deck final
TRANSCRIPT

Malibu Boats, Inc.Third Quarter 2016Earnings Results
May 4th, 2016
Safe Harbor StatementThis presentation includes “forward-looking statements,” within the meaning of the U.S. Securities Act of 1933, as amended and the U.S.Securities Act of 1934, as amended. All statements in this presentation that are not purely historical, including, without limitation, statementsregarding Malibu Boats, Inc.’s (“Malibu Boats”) intentions, hopes, beliefs, expectations, representations, projections, estimates, plans orpredictions of the future are forward-looking statements within the meaning of the Private Securities Litigation Reform Act of 1995. Forward-looking statements are not based on historical information and include, without limitation, statements regarding our future financial conditionand results of operations, business strategy and plans and objectives of management for future operations. Forward-looking statements can beidentified by such words and phrases as “believes,” “anticipates,” “expects,” “intends,” “estimates,” “may,” “should,” “continue,” and similarexpressions, comparable terminology or the negative thereof.
All forward-looking statements involve risks and uncertainties including, but not limited to, the risk that Malibu Boats will not be able to grow itsmarket share in the performance sport boat industry, successfully introduce new products, meet it’s outlook targets and obtain its expectedresults from the acquisition of its Australian licensee. It is important to note that Malibu Boats’ actual results could differ materially from those inany such forward-looking statements. Factors that could cause actual results to differ materially include, but are not limited to, general industry,economic and business conditions, demand for Malibu Boats’ products, changes in consumer preferences, competition within our industry,reliance on a network of independent dealers, Malibu Boats’ ability to manage its manufacturing levels and large fixed cost base, the successfulintroduction of new products and other factors. Many of these risks and uncertainties are outside Malibu Boats’ control, and there may be otherrisks and uncertainties which Malibu Boats does not currently anticipate because they relate to events and depend on circumstances that mayor may not occur in the future. Malibu Boats’ business could be affected by a number of other factors, including the risk factors listed from timeto time in Malibu Boats’ SEC reports including, but not limited to, the Annual Report on Form 10-K for the year ended June 30, 2015. Theserisks, assumptions and uncertainties are not necessarily all of the important factors that could cause actual results to differ materially fromthose expressed in any of our forward-looking statements. Malibu Boats can give no assurance that its expectations will be achieved. MalibuBoats cautions investors not to place undue reliance on the forward-looking statements contained in this presentation. All forward-lookingstatements that we have included in this presentation are based on information available to us on the date of this presentation. Malibu Boatsdisclaims any obligation and does not undertake to update or revise any forward-looking statements in this presentation. Comparison of resultsfor current and prior periods are not intended to express any future trends or indications of future performance, unless expressed as such, andshould only be viewed as historical data.
2
Use and Definition of Non-GAAP Financial Measures
This presentation includes the following financial measures defined as non-GAAP financial measures by the SEC: Adjusted EBITDA, adjusted EBITDA Marginand Adjusted Fully Distributed Net Income. These measures have limitations as analytical tools and should not be considered as an alternative to, or moremeaningful than, net income as determined in accordance with GAAP or as an indicator of our liquidity. Our presentation of these non-GAAP financialmeasures should also not be construed as an inference that our results will be unaffected by unusual or non-recurring items. Our computations of these non-GAAP financial measures may not be comparable to other similarly titled measures of other companies.
We define Adjusted EBITDA as earnings (loss) before interest expense, income taxes, depreciation, amortization and non-cash, non-recurring or non-operatingexpenses, including certain professional fees and acquisition and integration related expenses, non-cash compensation expense and offering relatedexpenses. We define Adjusted EBITDA Margin as Adjusted EBITDA divided by net sales. Management believes Adjusted EBITDA and Adjusted EBITDAMargin are useful because they allow management to evaluate our operating performance and compare the results of our operations from period to period andagainst our peers without regard to our financing methods, capital structure and non-recurring or non-operating expenses. We exclude the items listed abovefrom net income in arriving at Adjusted EBITDA because these amounts can vary substantially from company to company within our industry depending uponaccounting methods and book values of assets, capital structures, the methods by which assets were acquired and other factors.
We define Adjusted Fully Distributed Net Income (“AFDNI”) as net income attributable to Malibu Boats, Inc. (i) excluding income tax expense, (ii) excluding theeffect of non-recurring and non-cash items, (iii) assuming the exchange of all Units (“LLC Units”) of Malibu Boats Holdings, LLC (the “LLC”) into shares of ClassA common stock, which results in the elimination of noncontrolling interest in the LLC, and (iv) reflecting an adjustment for income tax expense on fullydistributed net income before income taxes (assuming no income attributable to non-controlling interests) at our estimated effective income tax rate. AFDNI is anon-GAAP financial measure because it represents net income (loss) attributable to Malibu Boats, Inc., before non-recurring or non-cash items and the effectsof noncontrolling interests in the LLC. We use AFDNI to facilitate a comparison of our operating performance on a consistent basis from period to period that,when viewed in combination with our results prepared in accordance with GAAP, provides a more complete understanding of factors and trends affecting ourbusiness than GAAP measures alone. We believe AFDNI assists our board of directors, management and investors in comparing our net income (loss) on aconsistent basis from period to period because it removes non-cash or non-recurring items, and eliminates the variability of noncontrolling interest as a result ofmember owner exchanges of LLC Units into shares of Class A Common Stock.
A reconciliation of our net income (loss) as determined in accordance with GAAP to Adjusted EBITDA and Adjusted EBITDA Margin and of our net income(loss) attributable to Malibu Boats, Inc. to AFDNI is provided in the appendix to these slides.
3

Jack SpringerChief Executive Officer
MALIBU BOATS, INC.
Quarter Commentary
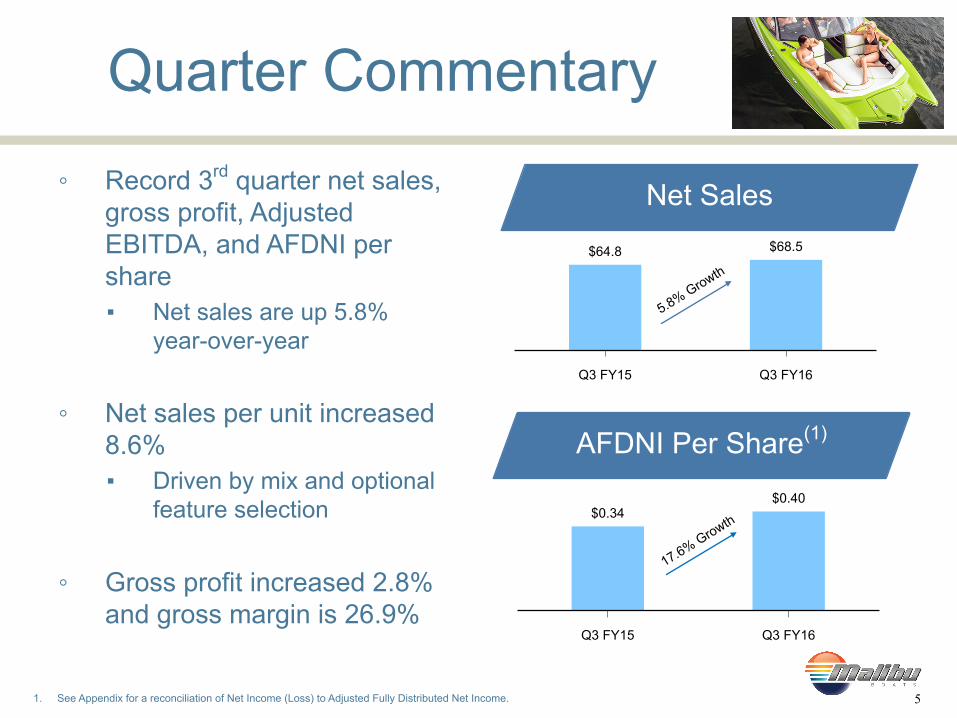
◦ Record 3rd quarter net sales,gross profit, AdjustedEBITDA, and AFDNI pershare▪ Net sales are up 5.8%
year-over-year
◦ Net sales per unit increased8.6% ▪ Driven by mix and optional
feature selection
◦ Gross profit increased 2.8%and gross margin is 26.9%
1. See Appendix for a reconciliation of Net Income (Loss) to Adjusted Fully Distributed Net Income.
Q3 FY15 Q3 FY16
$64.8 $68.5
Q3 FY15 Q3 FY16
$0.34$0.40
5.8% Growth
17.6% Growth
5
Net Sales
AFDNI Per Share(1)
Market Commentary
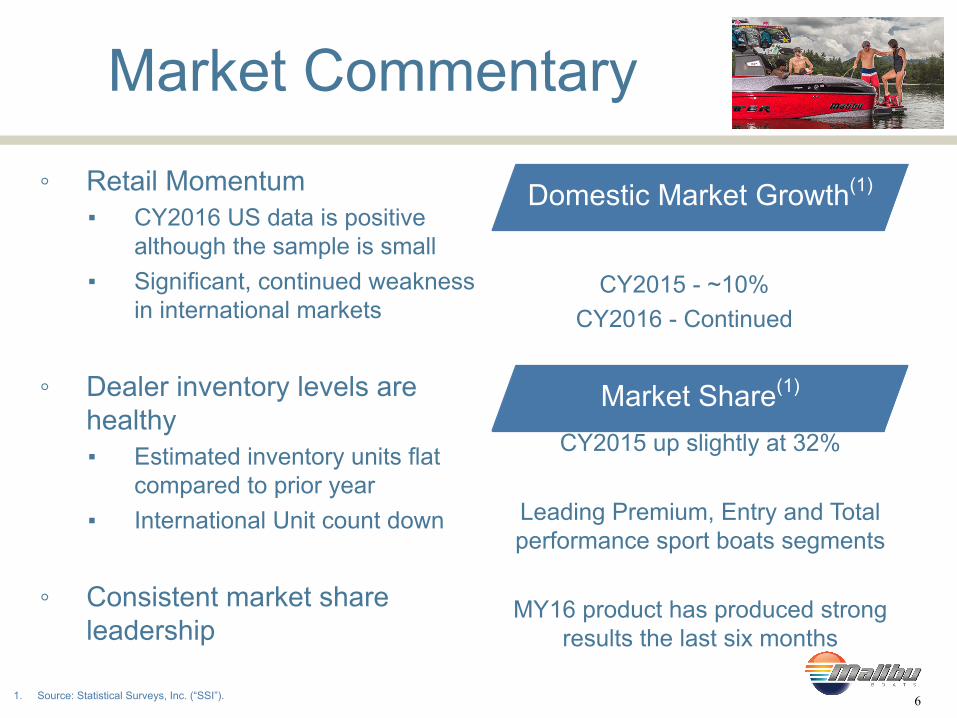
◦ Retail Momentum▪ CY2016 US data is positive
although the sample is small ▪ Significant, continued weakness
in international markets
◦ Dealer inventory levels arehealthy▪ Estimated inventory units flat
compared to prior year▪ International Unit count down
◦ Consistent market shareleadership
CY2015 - ~10%CY2016 - Continued
CY2015 up slightly at 32%
Leading Premium, Entry and Totalperformance sport boats segments
MY16 product has produced strongresults the last six months
6
Domestic Market Growth(1)
Market Share(1)
1. Source: Statistical Surveys, Inc. (“SSI”).

Key Takeaways◦ US boating industry is still in recovery and continues to show healthy growth although the rate has begun
to moderate as expected
◦ International challenges continue due to currency headwinds and weakened foreign economies. The impact of this has been worse than we anticipated
◦ Monitoring of macroeconomic factors such as foreign markets and oil prices has continued to add uncertainty to the picture
◦ MY2016 Product – Continued Momentum▪ New Models including the Axis A20 and Malibu 25 LSV, 20 VTX, and the ultra
premium M235 have performed at or above expectations▪ New and updated features – backup camera, steering wheel controls and power
driver's seat have all been well-received▪ Integrated surf system with Surf Band and hydraulic Surf Gate and power wedge
continue to provide a competitive advantage
◦ Trailer vertical integration continues to have a positive impact on marginsand provides great value for our dealers and customers
7

Wayne WilsonChief Financial Officer
MALIBU BOATS, INC.
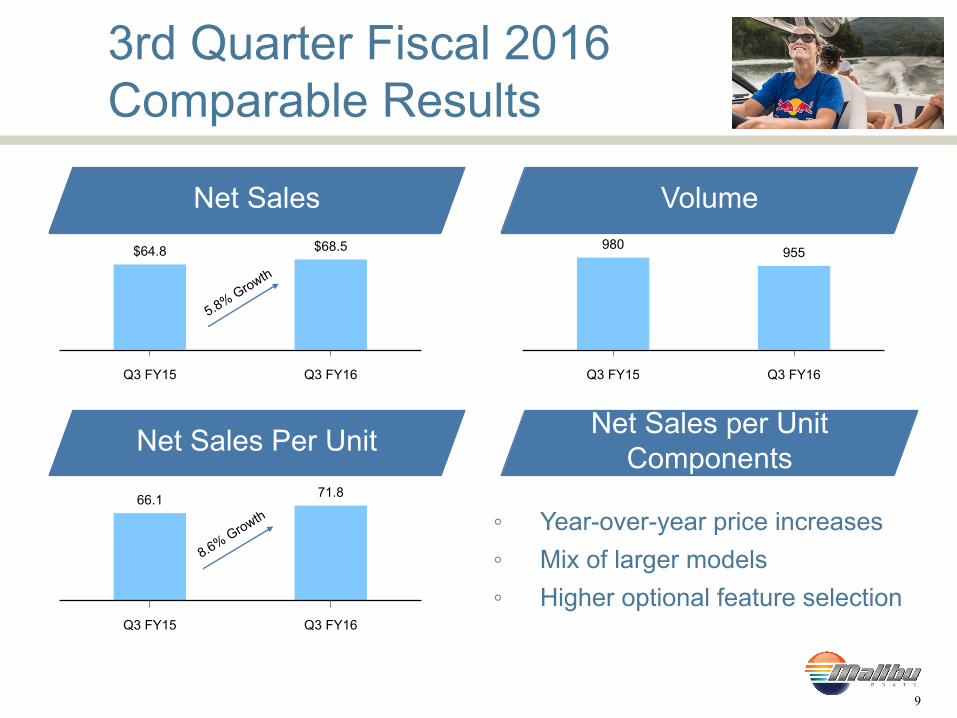
Q3 FY15 Q3 FY16
980 955
Q3 FY15 Q3 FY16
66.1 71.8
3rd Quarter Fiscal 2016Comparable Results
◦ Year-over-year price increases◦ Mix of larger models◦ Higher optional feature selection
Q3 FY15 Q3 FY16
$64.8 $68.5
5.8% Growth
Net Sales Volume
Net Sales per UnitComponents
8.6% Growth
Net Sales Per Unit
9
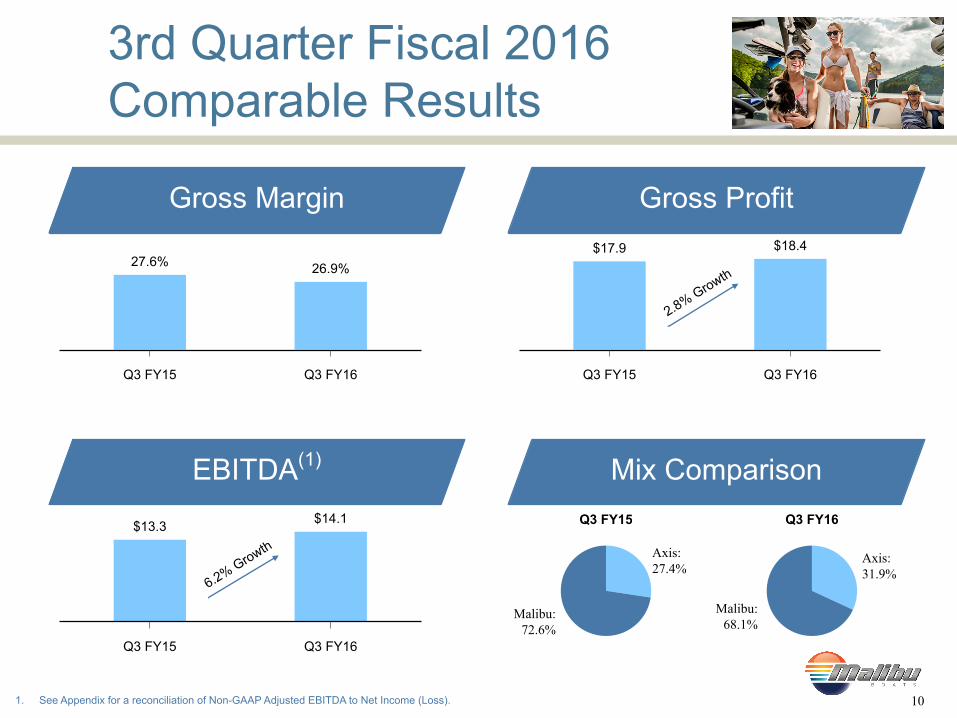
3rd Quarter Fiscal 2016Comparable Results
Q3 FY15 Q3 FY16
27.6% 26.9%
Gross Margin
Q3 FY15 Q3 FY16
$17.9 $18.4
2.8% Growth
Gross Profit
Q3 FY15 Q3 FY16
$13.3 $14.1
6.2% Growth
EBITDA(1) Mix Comparison
1. See Appendix for a reconciliation of Non-GAAP Adjusted EBITDA to Net Income (Loss).
Q3 FY16
Axis:31.9%
Malibu:68.1%
Q3 FY15
Axis:27.4%
Malibu:72.6%
10

Full Year Outlook
Metric TargetUnit Volume Low to mid single digit
Mix Axis % up slightly Y/Y
Net Sales per Unit Mid single digits
Gross Margin Down slightly Y/Y
Legal Expenses $1-1.5 million
Adjusted EBITDA Margin Essentially flat
Capital Expenditures >$6 million
11

Appendix
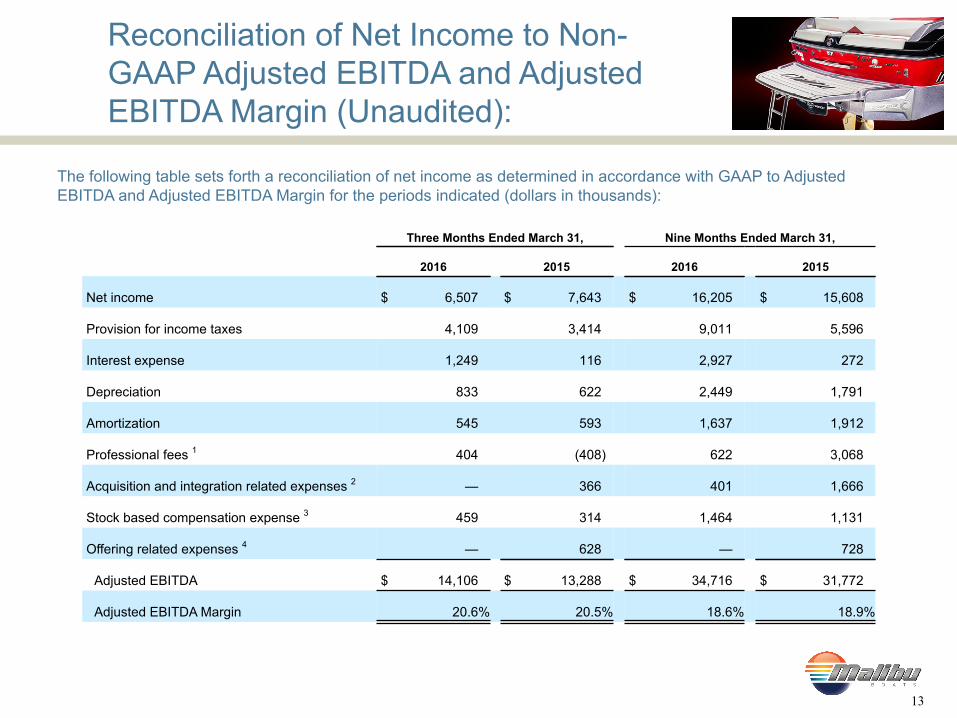
Reconciliation of Net Income to Non-GAAP Adjusted EBITDA and AdjustedEBITDA Margin (Unaudited):
The following table sets forth a reconciliation of net income as determined in accordance with GAAP to AdjustedEBITDA and Adjusted EBITDA Margin for the periods indicated (dollars in thousands):
Three Months Ended March 31, Nine Months Ended March 31,
2016 2015 2016 2015
Net income $ 6,507 $ 7,643 $ 16,205 $ 15,608
Provision for income taxes 4,109 3,414 9,011 5,596
Interest expense 1,249 116 2,927 272
Depreciation 833 622 2,449 1,791
Amortization 545 593 1,637 1,912
Professional fees 1 404 (408) 622 3,068
Acquisition and integration related expenses 2 — 366 401 1,666
Stock based compensation expense 3 459 314 1,464 1,131
Offering related expenses 4 — 628 — 728
Adjusted EBITDA $ 14,106 $ 13,288 $ 34,716 $ 31,772
Adjusted EBITDA Margin 20.6% 20.5% 18.6% 18.9%
13

Reconciliation of Net Income to Non-GAAP Adjusted EBITDA and AdjustedEBITDA Margin (Unaudited):
(1) Represents legal and advisory fees related to our intellectual property litigation with Pacific Coast Marine Windshields Ltd.("PCMW"), Nautique Boat Company, Inc., and MasterCraft Boat Company, LLC. In addition, income from the settlement of ourpatent infringement litigation with Nautique in February 2015 is included in the three and nine months ended March 31, 2015.
(2) Represents legal and advisory fees as well as integration related costs incurred in connection with ongoing and completedacquisition activities, including our acquisition of Malibu Boats Pty. Ltd. completed on October 23, 2014.
(3) Represents equity-based incentives awarded to key employees under the Malibu Boats, Inc. Long-Term Incentive Plan and profitinterests issued under the previously existing limited liability company agreement of the LLC.
(4) For the three and nine months ended March 31, 2015, this represents legal, accounting and other expenses directly related to ourApril 2015 tender offer and for the nine months ended March 31, 2015, expenses directly related to our follow-on offering thatclosed on July 15, 2014. There were no such offerings for the three and nine months ended March 31, 2016.
14

Three Months Ended March31,
Nine Months Ended March 31,2016
2016 2015 2016 2015Net income attributable to Malibu Boats, Inc. $ 5,776 $ 4,365 $ 14,438 $ 9,008Provision for income taxes 4,109 3,414 9,011 5,596Professional fees 1 404 (408) 622 3,068Acquisition and integration related expenses 2 — 366 401 1,666Fair market value adjustment for interest rate swap 3 510 — 685 —Stock based compensation expense 4 459 314 1,464 1,131Offering related expenses 5 — 628 — 728Net income attributable to non-controlling interest 6 731 3,278 1,767 6,600Fully distributed net income before income taxes 11,989 11,957 28,388 27,797Income tax expense on fully distributed income before incometaxes 7 4,256 4,245 10,078 9,868Adjusted fully distributed net income $ 7,733 $ 7,712 $ 18,310 $ 17,929
Adjusted Fully Distributed Net Income per share of Class ACommon Stock 8:Basic $ 0.40 $ 0.34 $ 0.94 $ 0.79Diluted $ 0.40 $ 0.34 $ 0.94 $ 0.79
Weighted average shares of Class A Common Stockoutstanding used in computing Adjusted Fully DistributedNet Income 9:Basic 19,380,638 22,678,824 19,375,330 22,601,655Diluted 19,380,638 22,678,824 19,375,330 22,601,655
Reconciliation of Non-GAAP AdjustedFully Distributed Net Income (Unaudited):
15
(1) Represents legal and advisory fees related to our intellectual property litigation with Pacific Coast Marine Windshields Ltd., Nautique Boat Company, Inc.,and MasterCraft Boat Company, LLC. In addition, income from the settlement of our patent infringement litigation with Nautique in February 2015 isincluded in the three and nine months ended March 31, 2015.
(2) Represents legal and advisory fees as well as integration related costs incurred in connection with ongoing and completed acquisition activities, including ouracquisition of Malibu Boats Pty. Ltd. completed on October 23, 2014.
(3) Represents the change in the fair value of our interest rate swap entered into on July 1, 2015.
(4) Represents equity-based incentives awarded to certain of our employees under the Malibu Boats, Inc. Long-Term Incentive Plan and profit interests issuedunder the previously existing limited liability company agreement of the LLC.
(5) For the three and nine months ended March 31, 2015, this represents legal, accounting and other expenses directly related to our April 2015 tender offer andfor the nine months ended March 31, 2015, expenses directly related to our follow-on offering that closed on July 15, 2014. There were no such offerings forthe three and nine months ended March 31, 2016.
(6) Reflects the elimination of the non-controlling interest in the LLC as if all LLC members had fully exchanged their LLC Units forshares of Class A Common Stock.
(7) Reflects income tax expense at an estimated normalized annual effective income tax rate of 35.5% of income before income taxes for the three and ninemonths ended March 31, 2016 and 2015, assuming the conversion of all LLC Units into shares of Class A Common Stock and the tax impact of excludingoffering related expenses. The estimated normalized annual effective income tax rate is based on the federal statutory rate plus a blended state rate adjustedfor deductions under Section 199 of the Internal Revenue Code of 1986, as amended, state taxes attributable to the LLC, and foreign income taxesattributable to our Australian based subsidiary.
(8) Adjusted fully distributed net income divided by the shares of Class A Common Stock outstanding in (9) below.
(9) Represents the weighted average shares outstanding during the applicable period calculated as (i) the weighted average shares outstanding during theapplicable period of Class A Common Stock, (ii) the weighted average shares outstanding of LLC Units held by non-controlling interests assuming they wereexchanged into Class A Common Stock on a one-for-one basis and (iii) the weighted average fully vested restricted stock units outstanding during theapplicable period that were convertible into Class A Common Stock and granted to directors for their services.
16
Reconciliation of Non-GAAP AdjustedFully Distributed Net Income (Unaudited):