14th wealth creation study
DESCRIPTION
Equity InvestmentTRANSCRIPT

Thematic Study17 December 2009
Raamdeo Agrawal ([email protected]) / Shrinath Mithanthaya ([email protected])We thank Mr Dhruv Mehta ([email protected]), Investment Consultant, for his invaluable contribution to this report.
14TH ANNUAL WEALTH CREATION STUDY (2004-2009)
THE BIGGESTTHE BIGGESTTHE BIGGESTTHE BIGGESTTHE BIGGEST THE FASTESTTHE FASTESTTHE FASTESTTHE FASTESTTHE FASTEST THE MOST CONSISTENTTHE MOST CONSISTENTTHE MOST CONSISTENTTHE MOST CONSISTENTTHE MOST CONSISTENT
WWWWWealthealthealthealthealth 5-5-5-5-5-YYYYYearearearearear AppearedAppearedAppearedAppearedAppeared 10-10-10-10-10-YYYYYearearearearear
RankRankRankRankRank CompanyCompanyCompanyCompanyCompany CreatedCreatedCreatedCreatedCreated CompanyCompanyCompanyCompanyCompany PricePricePricePricePrice CompanyCompanyCompanyCompanyCompany in WCin WCin WCin WCin WC PricePricePricePricePrice
(Rs b)(Rs b)(Rs b)(Rs b)(Rs b) CAGR (%)CAGR (%)CAGR (%)CAGR (%)CAGR (%) Study (x)Study (x)Study (x)Study (x)Study (x) CAGR (%)CAGR (%)CAGR (%)CAGR (%)CAGR (%)1 Reliance Inds. 1,514 Unitech 122 H D F C 10 252 Bharti Airtel 891 Areva T&D 97 Sun Pharma. 10 243 B H E L 588 BF Utilities 84 Reliance Inds. 10 224 NMDC 578 Opto Circuits 84 Hero Honda Motor 10 215 O N G C 471 NMDC 71 Infosys Tech. 10 26 ITC 436 Shri.City Union. 70 Asian Paints 9 187 Infosys Tech. 405 United Spirits 64 Nestle India 9 178 Larsen & Toubro 291 Jindal Steel 64 HDFC Bank 9 169 S A I L 265 Sterling Intl 62 ITC 9 1610 H D F C 193 Chettinad Cement 58 Ambuja Cem. 9 11
TTTTTOP 10 WEALOP 10 WEALOP 10 WEALOP 10 WEALOP 10 WEALTH CREATH CREATH CREATH CREATH CREATTTTTORS (200ORS (200ORS (200ORS (200ORS (20044444 - 200 - 200 - 200 - 200 - 20099999)))))
India's NTD Era (Next TIndia's NTD Era (Next TIndia's NTD Era (Next TIndia's NTD Era (Next TIndia's NTD Era (Next Trillion Dollar of GDP) will berillion Dollar of GDP) will berillion Dollar of GDP) will berillion Dollar of GDP) will berillion Dollar of GDP) will bemarked by sustained boom in discretionary spend,marked by sustained boom in discretionary spend,marked by sustained boom in discretionary spend,marked by sustained boom in discretionary spend,marked by sustained boom in discretionary spend,
savings and investmentsavings and investmentsavings and investmentsavings and investmentsavings and investment
Winner Categories and Category Winners will enjoyWinner Categories and Category Winners will enjoyWinner Categories and Category Winners will enjoyWinner Categories and Category Winners will enjoyWinner Categories and Category Winners will enjoyexponential growth in profitsexponential growth in profitsexponential growth in profitsexponential growth in profitsexponential growth in profits
Category Winners bought at reasonable valuationCategory Winners bought at reasonable valuationCategory Winners bought at reasonable valuationCategory Winners bought at reasonable valuationCategory Winners bought at reasonable valuationcreate significant wealth over the long termcreate significant wealth over the long termcreate significant wealth over the long termcreate significant wealth over the long termcreate significant wealth over the long term
HIGHLIGHTSHIGHLIGHTSHIGHLIGHTSHIGHLIGHTSHIGHLIGHTS

Contents
Objective, Concept and Methodology ........................................................................ 3
Wealth Creation Study 2004-2009: Findings ......................................................... 4-18
Theme 2010: Winner Categories + Category Winners ...................................... 20-34
Market Outlook .................................................................................................... 36-39
Appendix I: MOSL 100 – Biggest Wealth Creators .......................................... 41-42
Appendix II: MOSL 100 – Fastest Wealth Creators ......................................... 43-44
Appendix III: MOSL 100 – Wealth Creators (alphabetical) .............................. 45-46
217 December 2009
Wealth Creation Study 2004-2009
Abbreviations and Terms used in this report
ABBREVIATION / TERM DESCRIPTION
2004, 2009, etc Reference to years for India are financial year ending March, unless otherwise stated
Avg AverageCAGR Compound Annual Growth Rate; All CAGR calculations are for 2004 to 2009
unless otherwise statedL to P / P to L Loss to Profit / Profit to Loss. In such cases, calculation of PAT CAGR is not possible
Price CAGR In the case of aggregates, Price CAGR refers to Market Cap CAGR
RS B Indian Rupees in billion
WC Wealth Creation / Wealth CreatedWealth Created Increase in Market Capitalization over the last 5 years, duly adjusted for corporate
events such as fresh equity issuance, mergers, demergers, share buybacks, etc.

Wealth Creation Study 2004-2009
Objective, Concept and Methodology
ObjectiveThe foundation of Wealth Creation is in buying businesses at a price substantially lowerthan their “intrinsic value” or “expected value”. The lower the market value is comparedto the intrinsic value, the higher is the margin of safety. In this year’s study, we continueour endeavor to cull out the characteristics of businesses, which create value for theirshareholders.
As Phil Fisher says, “It seems logical that even before thinking of buying any commonstock, the first step is to see how money has been most successfully made in thepast.” Our Wealth Creation studies are attempts to study the past as a guide to the futureand gain insights into How to Value a Business.
ConceptWealth Creation is the process by which a company enhances the market value of thecapital entrusted to it by its shareholders. It is a basic measure of success for any commercialventure. Wealth Creation is achieved by the rational actions of a company in a sustainedmanner.
MethodologyFor the purpose of our study*, we have identified the top 100 Wealth Creators in the Indianstock market for the period 2004-2009. These companies have the distinction of havingadded at least Rs1b to their market capitalization over this period of five years, afteradjusting for dilution. We have termed the group of Wealth Creators as the ‘MOSL - 100’.The biggest and fastest Wealth Creators have been listed in Appendix I and II on page 41and 43, respectively. Ranks have been accorded on the basis of Size and Speed of WealthCreation (speed is price CAGR during the period under study).
On the cover page, we have presented the top 10 companies in terms of Size of WealthCreation (called THE BIGGEST), the top 10 companies in terms of Speed of WealthCreation (called THE FASTEST), and the top 10 companies in terms of their frequency ofappearance as wealth creators in our Wealth Creation studies (called THE MOSTCONSISTENT).
Theme 2010Our Theme for 2010 is Winner Categories + Category Winners, discussion onwhich starts from page 20.
* Capitaline database has been used for this study
317 December 2009
Wealth Creation Study 2004-2009
Wealth Creation
2004-2009The 14TH Annual Study
Findings
Findings
417 December 2009
Wealth Creation Study 2004-2009

517 December 2009
Wealth Creation Study 2004-2009 Findings
Wealth Creation
2004-2009
The Biggest Wealth Creators
TOP 10 BIGGEST WEALTH CREATORS
RANK COMPANY NET WEALTH CREATED PRICE PAT P/E (X)RS B % SHARE CAGR (%) CAGR (%) FY09 FY04
1 Reliance Inds. 1,514 15.6 28.3 24.3 15.7 14.62 Bharti Airtel 891 9.2 32.3 68.9 14.8 49.03 B H E L 588 6.1 37.8 36.7 23.5 22.54 NMDC 578 6.0 70.6 58.8 14.2 9.95 O N G C 471 4.9 6.8 13.2 10.3 13.86 ITC 436 4.5 21.6 15.4 21.4 16.27 Infosys Tech. 405 4.2 16.5 36.2 13.0 26.58 Larsen & Toubro 291 3.0 36.2 45.6 11.3 13.49 S A I L 265 2.7 24.5 19.7 6.5 5.3
10 H D F C 193 2.0 17.0 21.8 17.6 18.6
BIGGEST WEALTH CREATORS AND WEALTH CREATED (RS B): OIL & GAS DOMINATES
Reliance Industries is No.1Reliance Industries has emerged as the biggestwealth creator for the third time in a row.
Although the absolute wealth created is lower thanthe previous two years, its share in total wealthcreated has increased - 11.4% in FY07, 12% inFY08 and 15.6% in FY09.
For the last six years, the biggest wealth creator inIndia has emerged from Oil & Gas - the first threeyears led by ONGC and next three by Reliance.
Six companies have featured in the top 10 wealthcreators for three consecutive years - Reliance,Bharti, ONGC, BHEL, L&T and SAIL.
Key FindingReliance has commenced gas production in KG-D6 basin, and continues to aggressively pursue itsother E&P activity. In FY10, it has also mergedReliance Petroleum with itself. Further, its closestcompetitor in wealth creation - Bharti - is facingsector headwinds. Thus, Reliance is likely to sustainits top position for the next couple of years at least.
73262
3411,247
377383
2451,0301,065
1,6781,856
3,0771,514
9119961997199819992000200120022003200420052006200720082009 Reliance Inds
Reliance IndsReliance Inds
ONGCONGCONGC
WiproWipro
Hind. LeverWipro
Hind. LeverHind. Lever
Hind. LeverHind. Lever

617 December 2009
Wealth Creation Study 2004-2009 Findings
Wealth Creation
2004-2009
The Fastest Wealth Creators
TOP 10 FASTEST WEALTH CREATORS
RANK COMPANY PRICE PRICE PAT MCAP (RS B) P/E (X)APPREN. (X) CAGR (%) CAGR (%) FY09 FY04 FY09 FY04
1 Unitech 54 122 121 56.7 1.1 7.7 7.62 Areva T&D 29 97 68 48.6 1.4 21.5 8.13 BF Utilities 21 84 L to P 12.1 0.6 260.5 -4 Opto Circuits 21 84 61 16.3 0.7 11.6 5.15 NMDC 14 71 59 621.3 43.0 14.2 9.96 Shri.City Union. 14 70 45 14.9 0.6 12.7 3.47 United Spirits 12 64 69 65.1 2.8 21.9 13.28 Jindal Steel 12 64 38 185.9 15.8 12.1 5.29 Sterling Intl 11 62 -32 36.0 3.2 - 17.4
10 Chettinad Cement 10 58 P to L 13.5 1.4 - 9.9
HISTORY OF FASTEST WEALTH CREATOR (PRICE APPRECIATION - X)
Unitech is No.1Unitech is the Fastest Wealth Creator during2004-09, for the second time in a row.
Its 5-year stock price CAGR is a staggering 122%,albeit significantly lower than the last year figure of284%.
Unitech has featured among the Top 10 fastestwealth creators for the last four years in a row, B FUtilities for the last three years and NMDC for thelast two years.
This year, NMDC has the unique distinction offeaturing in both the biggest and the fastest wealthcreators list.
Key FindingIn nine of the top 10 fastest wealth creators, at leasttwo of the following three conditions hold true: (1)Base market cap less than Rs4b, (2) Base P/E insingle digit, and (3) PAT growth of over 35%. In sixcases, all the three hold true.
723
75223
6669
5075
136182
665
54
30
837
19961997199819992000200120022003200420052006200720082009 Unitech
UnitechB F Utilities
Matrix LabsMatrix Labs
Matrix Labse-Serve
WiproInfosys
Satyam ComputersSSI
Dr Reddy's LabsCipla
Satyam Computers

717 December 2009
Wealth Creation Study 2004-2009 Findings
Wealth Creation
2004-2009
Most Consistent Wealth Creators
TOP 10 CONSISTENT WEALTH CREATORS
RANK COMPANY APPEARED IN LAST 10-YR PRICE PAT P/E (X)10 WC STUDIES (X) CAGR (%) CAGR (%) 2009 2004
1 H D F C 10 24.9 21.8 17.6 18.62 Sun Pharma. 10 24.0 39.4 18.2 25.13 Reliance Inds. 10 21.9 24.3 15.7 14.64 Hero Honda Motor 10 20.9 12.0 16.7 13.45 Infosys Tech. 10 2.0 36.2 13.0 26.56 Asian Paints 9 18.0 19.7 20.8 19.77 Nestle India 9 17.2 15.2 28.1 23.28 HDFC Bank 9 15.9 34.5 18.3 21.19 ITC 9 15.9 15.4 21.4 16.2
10 Ambuja Cem. 9 10.8 33.0 7.7 14.6
HDFC is Most ConsistentFive companies - HDFC, Sun Pharma, RelianceInds, Hero Honda and Infosys - have featuredamong the top 100 wealth creators in each of thelast 10 years. HDFC is ranked as the mostconsistent by virtue of its 10-year price CAGR beingthe highest.
This year, eight of the top 10 most consistent wealthcreators are consumer-facing businesses with strongfranchise. Our past studies have also clearlyestablished the dominance of consumer-facingcompanies in consistent wealth creation.
Key FindingBusinesses like FMCG, Pharma and Banking arenon-cyclical and have a high degree of customercaptivity. With consumerism in India poised to rise,these businesses should continue to create wealthconsistently.
CONSUMER FACING COMPANIES SCORE HIGH ON CONSISTENT WEALTH CREATION
PharmaCipla (4)Dr Reddy's Lab (3)GSK Pharma (2)Piramal Health. (4)Ranbaxy Lab (4)Sun Pharma (2)
FMCGAsian Paints (3)ITC (5)Nestle India (1)
OthersHero Honda (5)HDFC (5)HDFC Bank (1)
ITInfosys (3)Wipro (3)Satyam (2)
OthersReliance Inds (2)Ambuja Cement (1)
Consistent Wealth Creators - 2005 to 2009
Non-Consumer FacingConsumer Facing
Number in brackets indicates times appearedwithin top 10 in last five years, 2005 to 2009

817 December 2009
Wealth Creation Study 2004-2009 Findings
Wealth Creators (Wealthex)
Comparative Performance
v/s BSE Sensex
SENSEX V/S WEALTH CREATORS: HIGHER EARNINGS GROWTH, LOWER VALUATIONMAR-04 MAR-05 MAR-06 MAR-07 MAR-08 MAR-09 5-YEAR
CAGR (%)
BSE Sensex 5,591 6,493 11,280 13,072 15,644 9,709 11.7CAGR (%) 16.1 42.0 32.7 29.3 11.7YoY Performance (%) 16.1 73.7 15.9 19.7 (37.9)
Wealthex - based to Sensex 5,591 7,050 12,600 14,759 20,877 14,206 20.5CAGR (%) 26.1 50.1 38.2 39.0 20.5YoY Performance (%) 26.1 78.7 17.1 41.4 (32.0)
Sensex EPS (Rs) 348 450 523 718 833 825 18.8YoY Performance (%) 29.1 16.4 37.3 16.0 (1.0)Sensex P/E (x) 16.0 14.4 21.6 18.2 18.8 11.8
Wealthex EPS (Rs) 381 533 616 840 1085 1126 24.2YoY Performance (%) 39.7 15.6 36.4 29.2 3.7Wealthex P/E (x) 14.7 13.2 20.5 17.6 19.2 12.6
WEALTH CREATORS’ INDEX V/S BSE SENSEX (31.3.04 TO 31.3.09)
Superior performance over benchmarkWe have compared the performance of Wealthex(top 100 Wealth Creators index) with the BSESensex on three parameters - (1) marketperformance, (2) earnings growth, and (3) valuation.
Market performance: The Wealthex beat theSensex in each of five years, FY04 through FY09.Over the entire period, the Wealthex outperformedthe Sensex by 83%.
Earnings growth: In three of five years, Wealthexearnings growth was significantly better than theSensex, and in two years, it was almost in line. Overthe five-year period, Wealthex earnings CAGR was24.2% compared to 18.8% for the Sensex.
Valuation: The Wealthex average P/E was 16.3x,lower than 16.8x for the Sensex.Key FindingWealth creating companies tend to initially trade ata discount to market valuation. With superiorearnings growth over time, they get re-rated and endup at a premium to market valuation, leading tooutperformance.
0
8,000
16,000
24,000
32,000
Mar
-04
Jun-
04
Sep-
04
Dec
-04
Mar
-05
Jun-
05
Sep-
05
Dec
-05
Mar
-06
Jun-
06
Sep-
06
Dec
-06
Mar
-07
Jun-
07
Sep-
07
Dec
-07
Mar
-08
Jun-
08
Sep-
08
Dec
-08
Mar
-09
Wealthex - Rebased Sensex
80% Outperformance

917 December 2009
Wealth Creation Study 2004-2009 Findings
Wealth Creators
Classification By
Industry
WEALTH CREATORS: CLASSIFICATION BY INDUSTRY (RS B)WEALTH SHARE OF WEALTH PRICE PAT P/E (X)
INDUSTRY CREATED CREATED (%) CAGR CAGR 2009 2004(RS B) 2009 2004 (%) (%)
Oil & Gas (4) 2,126 22.1 43.3 15.5 16.9 12.8 13.6Metals (10) 1,458 15.1 6.5 35.5 32.9 10.1 9.2Engineering (13) 1,167 12.1 5.0 32.5 36.8 15.0 17.6FMCG (16) 1,044 10.8 0.7 18.4 14.3 21.0 17.6Telecom (4) 1,012 10.5 0.0 30.3 61.5 16.5 48.4Banking & Finance (12) 889 9.2 15.3 22.4 24.7 8.7 9.6IT (5) 492 5.1 7.4 12.4 33.2 12.6 29.6Pharma (9) 427 4.4 5.6 22.5 29.2 17.3 22.6Auto (8) 357 3.7 6.0 14.5 16.7 16.8 18.5Others (7) 198 2.1 3.6 21.4 27.9 7.9 10.3Cement (6) 186 1.9 2.2 15.1 29.0 8.3 14.6Ultility (3) 143 1.5 4.0 14.0 0.9 18.4 10.0Construction / Real Estate (1) 56 0.6 0.0 121.6 120.9 7.7 7.6Media (1) 53 0.5 0.4 -3.6 21.9 14.9 48.0Retail (1) 29 0.3 0.0 50.2 70.0 21.8 40.5Total 9,637 100.0 100.0 20.5 24.3 12.6 14.7
NEW ECONOMY PERFORMANCE IN THE TOP 100 WEALTH CREATORS
Value migration: Oil & Gas continues to be thelargest wealth creating sector. However, over thelast five years, its share has fallen from 43% ofwealth created to 22%, clearly indicating valuemigration to sectors such as Telecom and FMCG.
Telecom's rising share of wealth created can beattributed to superior PAT CAGR of 62% over thelast 5 years. On the other hand, FMCG PAT CAGRis a muted 14%; however, the sector has seen avaluation re-rating, more so given the flight to safetyphenomenon during the market downturn in FY09.
Old v/s New Economy: Wealth creation in NewEconomy businesses - IT, Telecom, Media and Retail- has not been able to sustain momentum due toslowdown in IT following global economic crisis.However, the longer term trend is clearly up.
Key FindingBanking has lost some share of wealth created dueto the economic slowdown in FY09 and 1HFY10.However, the outlook is improving from 2HFY10. Asa secular business with reasonable valuation, Indianbanking holds potential for huge wealth creation.
1 5
10 1110
12
16
10
1
20
2000-05 2001-06 2002-07 2003-08 2004-09
No of Companies % Wealth Created

1017 December 2009
Wealth Creation Study 2004-2009 Findings
Wealth Creators
Classification By
MNCs v/s Indian Companies
WEALTH CREATORS: MNCs V/S INDIAN COMPANIES MNC WEALTH CREATION BY SECTOR
2004-2009MNC INDIAN
Number of Wealth Creators 23 77% Wealth Created 13.8 86.2Sales CAGR (%) 19.5 22.0PAT CAGR (%) 19.3 25.1Price CAGR (%) 16.3 21.3P/E - 2004 (x) 18.8 14.1P/E - 2009 (x) 16.6 12.1RoE - 2004 (%) 28.0 20.2RoE - 2009 (%) 28.2 19.4
MNCs ARE WANING IN WEALTH CREATION BUT RECOVER SOMEWHAT IN 2004-2009
Will the foreign hand rise again?In each of our first four Wealth Creation studies,Hindustan Lever (now renamed as HindustanUnilever) was the biggest wealth creator, signifyingthe era of the MNCs.
However, for the past several years, MNCs havelost significant share both in terms of number ofcompanies and amount of wealth created.
FY04-09 marks a semblance of the MNCresurgence, with number of top wealth creatingcompanies more than doubling from 10 to 23 andshare of wealth created increasing from 7% to 14%.A major factor for this resurgence is FMCG, led byITC, Hindustan Unilever and Nestle.
Key FindingPAT CAGR of MNCs is typically lower than that ofIndian companies. However, they still enjoy premiumvaluations. The main reasons are higher RoE andhealthy dividend payout.
19 168
12 10 10
43
21
10 11
23
50
15
3023
3 27 10 7 7
14
1994-99 1995-00 1996-01 1997-02 1998-03 1999-04 2000-05 2001-06 2002-07 2003-08 2004-09
Top Wealth Creating MNCs Share of Wealth Created (%)
Auto10%
Engg13%
FMCG63%
Cement7%
Pharma4%
Others3%

1117 December 2009
Wealth Creation Study 2004-2009 Findings
Wealth Creators
Classification By
Ownership: State v/s Private
WEALTH CREATORS: STATE-OWNED V/S PRIVATELY-OWNED PSU WEALTH CREATION BY SECTOR
2004-2009
STATE-OWNED PRIVATE
Number of Wealth Creators in Top 100 16 84Share of Wealth Created (%) 27.0 73.0Sales CAGR (%) 16.9 24.5PAT CAGR (%) 18.2 29.4Price CAGR (%) 16.2 22.8P/E - 2004 (x) 10.9 18.6P/E - 2009 (x) 10.0 14.3RoE - 2004 (%) 22.0 20.1RoE - 2009 (%) 20.1 20.1
DEREGULATION DIMINISHES ROLE OF STATE-OWNED COMPANIES IN WEALTH CREATED
PSUs underperform private companies2004-2009, PSUs (public sector undertakings)underperformed their private counterparts on allfronts - sales growth was lower, PAT growth waslower, RoE declined and price CAGR was alsosignificantly lower.
Number of PSUs among top wealth creators is thelowest in the last six years. In fact, two large PSUs- Indian Oil and HPCL - feature among the top 10wealth destroyers during 2004-09.
Of the wealth created by the PSUs, 60% camethrough commodity businesses - Mining & Metals(37%) and Oil & Gas (23%).
Key FindingAssessment of the 16 PSU wealth creators indicatestwo key criteria for PSU stocks: (1) those with highregulatory entry barriers -SBI, Punjab National Bank(few new banking licenses), Bharat Electronics (nearmonopoly with defence sector), NMDC (mininglicenses) and (2) advantage of legacy - GAIL (hugepipeline network), and Concor (strong relationshipswith Indian Railways for container movement).
28 3026
18
25
16
48.5 50.6
35.9
24.8
34.6
27.0
1999-2004 2000-2005 2001-2006 2002-2007 2003-2008 2004-2009
No of PSUs % Wealth Created
Banks13%
Engg25%
Mining & Metals37%
Oil & Gas23%
Others2%

1217 December 2009
Wealth Creation Study 2004-2009 Findings
92
18 2117
76
56
35 33 33
19 20 222828
32
49
<2 2-5 5-10 10-20 20-50 50-100 100-200 >200
Price CAGR (%) PAT CAGR (%)
Avg Price CAGR: 21%Avg PAT CAGR: 24%
Wealth Creators
Classification By
Age Group and Market Cap
WEALTH CREATORS: CLASSIFICATION BY AGE-GROUP
NO. OF NO. OF WEALTH CREATED % SHARE PAT PRICE
YEARS COS. (RS B) OF WC CAGR (%) CAGR (%)
0-10 7 1,005 10.4 83.5 33.711-20 24 1,646 17.1 17.4 14.721-30 19 1,303 13.5 30.7 19.531-40 10 2,746 28.5 27.7 28.441-50 14 1,115 11.6 22.4 24.651-60 13 667 6.9 27.0 14.561-70 4 237 2.5 31.3 22.471-80 2 229 2.4 9.6 10.081-90 3 147 1.5 15.8 19.3
>90 4 542 5.6 20.4 20.2Total 100 9,637 100.0 24.3 20.5
PRICE CAGR AND PAT CAGR BY BASE MARKET CAP RANGE
Young for speed, old for sizeIt has been consistently observed through ourWealth Creation studies, that young companies (10years since incorporation or less) generate thefastest wealth, as they record the highest earningsgrowth on a low base.
During 2004-09, the 5 companies in the 0-10 yearsbracket generated 84% PAT CAGR and 34% priceCAGR, significantly higher than the average of 24%and 21%, respectively.
Older companies gain in size, but their stock pricestend to appreciate much more slowly.
Small is beautiful74 of the top 100 wealth creating companies had abase market cap of less than Rs50b in 2004. Thesecompanies grew significantly ahead of average, bothin terms of earnings and stock price.
Key FindingIdentifying high-growth companies at an early stageis one of the keys to successful investing.
Base Market Cap Range (Rs b)

1317 December 2009
Wealth Creation Study 2004-2009 Findings
Wealth Creators
Classification By
Sales and Earnings Growth
WEALTH CREATORS: CLASSIFICATION BY SALES GROWTH
SALES GR. NO. OF SHARE PRICE PAT ROE (%) P/E (X)RANGE COS. OF WC CAGR CAGR
(%) (%) (%) (%) 2009 2004 2009 2004
0-10 9 2.8 16.0 10.8 15.0 13.7 15.7 12.410-20 35 29.0 12.7 15.9 20.3 23.4 11.2 12.920-30 26 35.0 26.7 28.2 17.6 17.8 13.8 14.630-40 16 16.5 25.2 40.2 24.7 25.4 14.3 25.240-50 9 14.6 34.0 51.9 23.6 19.1 13.8 25.8>50 5 2.1 43.3 65.8 21.7 13.5 7.9 16.4
Total 100 100.0 20.5 24.3 20.1 21.0 12.6 14.7
PRICE CAGR BY 2004-09 PAT GROWTH RANGE CLASSIFICATION BY PAT GROWTH
Growth offers margin of safetyClearly, high sales/earnings growth and stock pricegrowth are positively correlated. Typically, highgrowth is accompanied by somewhat premiummarket valuations. However, this should not be adeterrent to buying these stocks.
As can be seen from the adjacent tables, companieswith sales/earnings growth of over 30% have allseen their P/E de-rated in 2009 over 2004. Still, dueto the sheer high growth, their stocks have deliveredPrice CAGR significantly higher than average.
Thus, high growth is a major source of margin ofsafety.
Key FindingDuring 2004-09, the fastest growing sectors weremainly cyclicals - metals, engineering and realestate. One interesting non-cyclical exception wasfinancial services. Going forward too, select financialservices stocks should continue their run of highgrowth, and generate wealth at rapid pace.
PAT Growth Range (%)
12
20
3642
61
13
26
0-10 10-20 20-30 30-40 40-50 50-70 >70
PAT GR. NO. OF SHARE OF P/E (X)
RANGE (%) COS WC (%) 2009 2004
0-10 12 6.1 18.9 14.110-20 24 22.2 10.8 12.420-30 18 25.1 13.4 15.630-40 17 18.7 14.8 21.340-50 12 8.5 10.7 14.950-70 9 17.1 14.8 30.8>70 8 2.3 5.4 11.6
Total 100 100.0 12.6 14.7

1417 December 2009
Wealth Creation Study 2004-2009 Findings
Wealth Creators
Classification By
RoE
WEALTH CREATORS: PRICE CAGR BY ROE
Indian markets prefer growth over qualityIn Indian markets, Price CAGR has a directcorrelation between PAT CAGR but a rather inversecorrelation with RoE. Consistently, low base yearRoE companies have performed better on themarkets than their high RoE counterparts bydelivering superior PAT growth.
Thus, during 2004-09, companies with 2004 RoE inthe range of 5-15% have delivered PAT CAGR of36-46%, translating into the highest Price CAGRof 29-33%.
Key FindingBargains are found when markets are blind to change.Anticipating change in profitability ahead of thecrowd continues to be rewarded in the markets.
WEALTH CREATORS: CLASSIFICATION BY BASE ROE
2004 ROE NO. OF SHARE OF PRICE PAT ROE (%) P/E (X)
RANGE (%) COS. WC (%) CAGR (%) CAGR (%) 2009 2004 2009 2004
<5 5 1 23 L to L -2.4 -37.5 - -5-10 13 5 29 36 15 7 15 2010-15 11 19 33 46 21 12 16 2715-20 17 26 22 23 15 17 13 1320-25 15 16 15 20 22 22 11 1325-30 18 16 17 21 22 26 12 1430-40 14 9 24 37 33 36 11 17>40 7 8 16 15 31 60 13 12
Total 100 100 21 24 20 21 13 15
23
33
15
24
1622
29
17
<5 5-10 10-15 15-20 20-25 25-30 30-40 >40
Avg Price CAGR: 21%
2004 ROE Range (%)

1517 December 2009
Wealth Creation Study 2004-2009 Findings
Wealth Creators
Classification By
Valuation Parameters
WEALTH CREATORS: CLASSIFICATION BY VALUATION PARAMETERS (MARCH 2004)
NO. OF COS % WEALTH CREATED PRICE CAGR %
P/E (x)<5 9 3 305-10 22 18 2510-15 21 32 1815-20 19 14 1820-25 13 13 28>25 16 20 20Total 100 100 21
Price/Book (x)<1 8 3 361-2 21 9 212-3 26 47 213-4 14 6 184-5 6 8 21>5 25 26 19Total 100 100 21
Price/Sales (x)<0.50 13 3 580.50-1.00 12 9 311.00-1.50 17 24 241.50-2.00 13 14 202.00-3.00 18 14 293.00-5.00 12 16 12>5.00 15 21 21Total 100 100 21
Single-digit PE stocks more likely tooutperformStocks trading at P/E of less than 5x in 2004 offereda return of 30% compounded for the next five years.This is the highest compared to any other P/E band,indicating that stocks bought at single-digit P/Es aremore likely to outperform.
Watch out for Price/Book of less than 1x …Stocks trading at P/B of less than 1x in 2004 offereda return of 36% compounded for the next five years.All other Price/Book bands just about managedaverage returns.
… and Price/Sales of up to 1xStocks trading at Price/Sales of up to 1x in 2004offered a return of 31-58% compounded for the nextfive years.

1617 December 2009
Wealth Creation Study 2004-2009 Findings
Wealth Creators
Classification By
Valuation Parameters (contd.)
WEALTH CREATORS: CLASSIFICATION BY VALUATION PARAMETERS (MARCH 2004)
NO. OF COS % WEALTH CREATED PRICE CAGR %
Payback Ratio (x)<0.25 9 3 740.25-0.50 13 15 390.50-1.00 19 11 251-1.5 18 41 191.5-2 25 22 21>2 16 9 11Total 100 100 21
2004 2009SENSEX WEALTH CREATORS SENSEX WEALTH CREATORS
Median P/E 16.4 14.6 12.2 14.2Median P/B 3.1 2.8 2.2 2.7Media P/S 2.3 1.8 2.0 1.9
Payback ratio of less than 1x guarantees highreturnsWe define Payback ratio as Market Cap divided byprofits of the next five years.
When companies are in high growth phase, it isdifficult to value them using conventional measures.Payback ratio is based on empirical wisdom thatmarkets try and seek visibility of five years. Clearly,lower the payback ratio the better.
In hindsight, we find that stocks of companies whichoffered a payback ratio of less than 1x in 2004,offered significantly high returns.
Key FindingA sure shot formula for multi-baggers is -
P/E of less than 10xPrice/Book of less than 1xPrice/Sales of 1x or lessPayback ratio of 1x or less.
However, as 2004 median valuations for wealthcreators indicate, such stocks are not easily found.
MEDIAN VALUATIONS (X)

1717 December 2009
Wealth Creation Study 2004-2009 Findings
TOP-10 WEALTH DESTROYERS (2004-2009)
COMPANY WEALTH DESTROYED PRICERS B % SHARE CAGR (%)
Ranbaxy Labs. 137 8 -19I O C L 129 8 -5Tata Motors 125 7 -17ICICI Bank 125 7 -21H P C L 81 5 -12Satyam Computer 72 4 -24Oriental Bank 45 3 -18Tata Steel 44 3 -2Reliance Infra. 40 2 -8MTNL 37 2 -12Total of Above 835 49Total Wealth Destroyed 1,704 100
WEALTH DESTRUCTION BY INDUSTRY
Wealth destroyed is 17% of wealth createdDuring 2004-09, Indian stock markets deliveredcompounded return of 12%. Still, there wassignificant wealth destruction of Rs1,782b (17% ofwealth created).
Most of the wealth destruction was due to company-specific developments - US FDA ban on two unitsof Ranbaxy, JLR acquisition by Tata Motors,accounting scam at Satyam Computer and Corusacquisition by Tata Steel.
HPCL has featured in the list of top wealthdestroyers for the third successive year.
Key FindingDuring the bull run of 2003-08, wealth destroyed wasonly 0.2% of the wealth created. In other words, whenthe markets are buoyant, most stocks participateregardless of quality.
It is only during market downturns (as in FY09) thatthe true, sustainable wealth creators are separatedfrom the also-rans.
Metals, 6
Auto, 13
Pharma, 12IT, 11
Others, 24
Oil & Gas, 17
Banking & Finance, 16
Wealth Destroyers

1817 December 2009
Wealth Creation Study 2004-2009 Findings
WEALTH CREATION BY COMPANIES WITH ENTRY BARRIERS
COMPANY NO OF WEALTH CREATED % OFCOMPANIES RS B TOTAL
Companies with Entry Barriers 66 8,314 86Others 34 1,323 14Total 100 9,637 100
In the next section of this report, we discussbusinesses and companies with Entry Barriers.
Our study shows that companies with Entry Barriersenjoy exponential growth in profits. When boughtat reasonable valuation, they create significantwealth over the long term.
In fact, the list of top Wealth Creators between 2004and 2009 already proves this point. Of the top 100Wealth Creators, 66 had strong Entry Barriers. Evenmore interestingly, they accounted for adisproportionate 86% share of the wealth created.
We are convinced this phenomenon will persist inthe years to come.
Wealth Creators
and
Entry Barriers

1917 December 2009
Wealth Creation Study 2004-2009
THIS PAGE IS INTENTIONALLY LEFT BLANK

2017 December 2009
Wealth Creation Study 2004-2009
Wealth Creation
2004-2009The 14TH Annual Study
Theme 2010
Theme 2009

2117 December 2009
Wealth Creation Study 2004-2009 Theme 2009
Winner Categories + Category WinnersFormula for sustained wealth creation in India's NTD Era
Report OutlineThe outline of the investment theme covered in this report is as follows -1. Winner Categories = India's NTD opportunity + Scalability2. Category Winners = Winner Categories + Entry Barriers + Great management3. Winning investments = Category Winners + Reasonable valuation
The following pages develop each of the above ideas.
1. Recap of India's NTD Era
1.1 IntroductionIn 2007, we first wrote about India's NTD i.e. Next Trillion Dollars (of GDP). It took Indiaover 60 years since independence to create its first US$1 trillion of GDP in FY08. However,growing nominally @ 12-15% per annum and at current US$/INR rates, India will add thenext trillion dollar of GDP in 5-6 years. This journey is currently on.
India's FY10E nominal GDP is estimated at US$1.3 trillion. Assuming 12.4% annual growth(7% real and 5% inflation), India's GDP in FY15 works out to US$2.3 trillion i.e. additionof US$1 trillion in the next 5 years.
INDIA SHOULD ADD US$1 TRILLION GDP OVER THE NEXT FIVE YEARS (GDP IN US$ TRILLION)
0.6
1.3
2.3
0.0
0.5
1.0
1.5
2.0
2.5
FY90
FY91
FY92
FY93
FY94
FY95
FY96
FY97
FY98
FY99
FY00
FY01
FY02
FY03
FY04
FY05
FY06
FY07
FY08
FY09
FY10
EFY
11E
FY12
EFY
13E
FY14
E
FY15
E
5% CAGR
16% CAGR
12% CAGR
Source: MOSL
1.2 The Chinese experienceChina achieved its first trillion dollar GDP in 1998. It took about six years to add thesecond trillion in 2005. However, the third trillion took just 3 years, and all of the fourthcame in just one year, 2008, when China's GDP hit US$4 trillion. India is hopefully on itsway to mimicking the Chinese experience. Whether we will do it somewhat slower orfaster is just a matter of time.
After taking 60 years toget to its first US$1 trillion
GDP in FY08 …
… India is on its way to addits NTD (Next Trillion
Dollar) in the next 5 years
India's NTD journey issimilar to that of China
between 1998 and 2005

2217 December 2009
Wealth Creation Study 2004-2009 Theme 2009
CHINA (GDP IN US$ TRILLION)
Source: MOSL
Minimizing the risk of forecastingIt is said, "Prediction is very difficult, especially if it's about the future." Knowing this, wehave largely relied on hindsight to get a sense of how the NTD Era may play out. Thus,we believe, India's journey from US$1 trillion to US$2 trillion GDP will broadly be anextension of its journey from US$0.5 trillion to US$1 trillion GDP.
Further, even US$2 trillion is not a destination, but a milestone in India's ongoing journeytowards US$4 trillion GDP in the subsequent 5-7 years, and so on. Thus, forecastingerror of a year or two on either side is unlikely to have a major long-term impact.
We see a huge consumption and savings/investment boom in India's NTD Era, which willthrow up several Winning Categories. (For the purposes of this report, Winner Categoriesare those which are expected to grow annually @ 18%+ i.e. at least 1.5x faster than ournominal GDP growth rate assumption of ~12%.
1.3 Consumption boom in the NTD EraIn this section, we draw heavily upon McKinsey Global Institute's brilliant report titledThe Bird of Gold: The Rise of India's Consumer Market1 (dated May 2007). Thereport captures how growth in GDP will shift India's demographics, which in turn, willalter the economy's consumption landscape. The key conclusions of the report are -
1.3.1 India's aggregate consumption to quadruple during 2005-25
Source: McKinsey Global Institute
By 2025, India is poised tobecome the world's fifth
largest consuming countryfrom current position
of twelfth
5 5 4 3 29 12 12
1225
16
4
14
1 31
2
3
1985 1995 2005 2015 2025
710
17
34
704xAggregate consumptionacross income brackets
trillion, Indian rupees, 2000 Globals (>1,000)
Household income brackets'000 Indian rupees, 2000
Strivers (500-1,000)
Seekers (200-500)
Aspirers (90-200)
Deprived (<90)
MiddleClass
4.2
3.3
1.9
1.00.6
0
1
2
3
4
5
1980
1982
1984
1986
1988
1990
1992
1994
1996
1998
2000
2002
2004
2006
2008
Indian GDP may wellmimic China with a lag
of about 10 years
India will see a sustainedboom in consumption
1 - The report can be downloadedfrom www.mckinsey.com/mgi

2317 December 2009
Wealth Creation Study 2004-2009 Theme 2009
1.3.2 Poverty will fall sharplyDeprived class will fall from 93% in 1985 and 54% in 2005 to 22% by 2025. (Deprivedclass is defined as households with income less than Rs90,000 pa, in constant 2000 rupees).
POVERTY WILL DECLINE FROM 93% IN 1985 TO 22% BY 2025
Source: McKinsey Global Institute
Source: McKinsey Global Institute
1.3.3 Middle class will swell 12x from 50m in 2005 to 583m by 20251985 to 2005 saw a wave of 400m Aspirers (i.e. people moving out of poverty); 2005 to2025 will see a tsunami of over 400m Seekers (i.e. lower middle class) and 120m Strivers(i.e. upper middle class), further fuelling the consumption boom.
FIRST ASPIRERS AND THEN SEEKERS WILL BECOME THE LARGEST INCOME BRACKETS
9380
5435
22
618
41
43
36
419
32
9755 928 1,107 1,278 1,429
1985 1995 2005 2015 2025
Share of population in each income brackets%, millions of people
Household income brackets'000 Indian rupees, 2000
Globals (>1,000)Strivers (500-1,000)
Seekers (200-500)
Aspirers (90-200)
Deprived (<90)
100%
Household income brackets'000 Indian rupees, 2000
Globals (>1,000)
Strivers (500-1,000)
Seekers (200-500)
Aspirers (90-200)
Deprived (<90)
Number of households in each income brackets%, millions of people
0
20
40
60
80
100
120
140
1985 1990 1995 2000 2005 2010 2015 2020 2025
Actual Forecast
Poverty will continue tofall sharply …
… and India's middle classwill swell
CONVERTING CONSTANT RUPEES TO CURRENT VALUE
One small challenge in McKinsey Global Institute's report is that all rupee values are expressed inconstant 2000 rupee terms. The numbers may sometimes be better understood if re-stated in currentvalue terms.
This can be done by bringing in the inflation factor. Assuming inflation at about 5%, the 2005 numbersneeds to be multiplied by an inflation factor of 1.3x, 2015 numbers by 2.1x and 2025 numbers by 3.4x.
Thus, for instance, projected 2025 aggregate consumption at then market value works out to Rs237trillion, compared to Rs26 trillion in FY08, a CAGR of ~14%.
YEAR INFLATOR / (DEFLATOR) - X
2005 1.32015 2.12025 3.4

2417 December 2009
Wealth Creation Study 2004-2009 Theme 2009
Source: McKinsey Global Institute
1.3.5 Several categories will grow exponentiallyThere will be a significant rise in consumption pie for Alcoholic beverages, Transportvehicles, Healthcare services, Education & recreation and Communication.
CATEGORY GROWTH TRENDS (RS BILLION, CONSTANT 2000 PRICES)
CATEGORY 2005 % SHARE 2015 % SHARE CAGR (%)
Food, beverages, tobacco 7,147 21.7 11,547 17.9 4.9Food 6,565 20.0 10,366 16.1 4.7Non-alcoholic beverages 346 1.1 750 1.2 8.0Alcoholic beverages 115 0.3 291 0.5 9.7Tobacco 121 0.4 139 0.2 1.4
Transportation 2,788 8.5 6,395 9.9 8.7Fuel 1,008 3.1 3,024 4.7 11.6Services 1,633 5.0 2,968 4.6 6.2Two-wheelers 99 0.3 250 0.4 9.7Cars, UVs * 49 0.1 153 0.2 12.1
Housing, Utilities, etc 2,019 6.1 4,032 6.3 7.2Personal Products & Services 1,273 3.9 3,044 4.7 9.1
Personal and household services 987 3.0 2,301 3.6 8.8Personal non-durables 256 0.8 673 1.0 10.1Jewelry 30 0.1 70 0.1 8.8
Healthcare 1,148 3.5 3,076 4.8 10.4Medical services / equipment 364 1.1 1,835 2.8 17.6Pharmaceuticals 784 2.4 1,241 1.9 4.7
Apparel and footwear 931 2.8 1,847 2.9 7.1Education and recreation 1,198 3.6 3,195 5.0 10.3
Education 1,148 3.5 3,076 4.8 10.4Recreation 50 0.2 119 0.2 9.1
Household products 484 1.5 959 1.5 7.1Communication 344 1.0 1,090 1.7 12.2Total 32,892 100.0 64,456 100.0 7.0* Excludes vehicles registered with companies Source: McKinsey Global Institute
1.3.6 Implications for the NTD EraSustained consumption boom led by the middle classSeveral potential Winner Categories - Processed foods, Alcoholic beverages, 2-wheelers & cars, Auto finance, Airlines, White goods, Entertainment media, Telecom,Education and Healthcare.
1.3.4 Discretionary spend will increase from 52% in 2005 to 70% in 2025
SPENDING PATTERNS WILL EVOLVE MARKEDLY OVER THE NEXT 20 YEARS
Health careEducation & recreationCommunication
Transporation
Personal Products & ServicesHousehold ProductHousing & UtilitiesApparel
Food, beverages,& Tobacco
Share of average households consumption%, '000 Indian rupees, 2000 Necessities
Discretionary spending
5642 34 25
5
65
5
14
1212
10
1117
1920
36
5 69
4 7 9 13
3
32
311
98
4213
1995 2005 2015 2025
60 24814082100%
Discretionary spend will rise@ 10% in real terms
Food will remain the largestcategory; Communication
and Transportation willgrow the fastest

2517 December 2009
Wealth Creation Study 2004-2009 Theme 2009
1.4 Savings/Investment boom in the NTD EraIn the last 6 years to FY09, India's Gross Domestic Savings is up from 30% of GDP to39%, clocking a CAGR of 20%. Gross Fixed Capital Formation has grown even stronger- from 25% of GDP to 35% of GDP, a CAGR of 22%.
INDIA'S SAVINGS AND GROSS FIXED CAPITAL FORMATION GROWING MUCH FASTER THAN GDP
8 1012
1518
21
29.8 31.7 34.2 35.7 37.7 39.0
FY04 FY05 FY06 FY07 FY08 FY09
India's GDS (Rs trillion) % to GDP
CAGR 20%
79
1113
1619
25.028.4
31.0 32.5 34.0 34.8
FY04 FY05 FY06 FY07 FY08 FY09
India's GFCF (Rs trillion) % to GDP
CAGR 22%
15 1721
2632
38
9 1115
1924
28
0.720.740.74
0.560.65
0.71
FY04 FY05 FY06 FY07 FY08 FY09
Deposits (Rs t) Credit (Rs t) CD Ratio (x)
Deposits CAGR: 20%Credit CAGR: 26% 829
1,059
2,218
667
1,561
2,014
FY04 FY05 FY06 FY07 FY08 FY09
Insurance Premium (Rs b)CAGR: 27%
Source: MOSL
1.4.1 Savings boom - huge opportunity for financial intermediationIn 7-8 years' time, India's GDP may touch US$2.5 trillion. At then 40% of GDP, India'ssavings would almost equal current GDP. High growth in savings implies a huge opportunityfor financial intermediation services such as banks, insurance and stockbroking. This isreflected in a corresponding surge in deposits, credit and life insurance premiums.
SURGE IN FINANCIAL SERVICES - BANKING AND INSURANCE
Source: MOSL
1.4.2 Rising capital formation - Engineering/Construction boom to sustainThe economy's capital formation can be broadly broken down into: (1) 55% Construction(residential/non-residential buildings and infrastructure such as roads, bridges, etc); and(2) 45% Machinery and equipment.
Rising capital formation is also corroborated by the Government's huge thrust oninfrastructure with Eleventh Plan (FY08-12) spend expected to be 2.3x that of TenthPlan. This implies massive opportunity for:1. Turnkey engineering/construction services;2. Real estate, specially housing;3. Construction inputs - cement, steel, paints electricals, etc; and4. Capital goods companies, specially those supplying to the power sector.
Along with consumption, theboom in savings and
investment will sustain
Savings boom spellsopportunity for financial
intermediation …
… and investment boomimplies huge demand for
turnkey services, real estate,construction inputs and
capital goods

2617 December 2009
Wealth Creation Study 2004-2009 Theme 2009
INDIA'S THRUST ON INFRASTRUCTURE SPEND
SECTOR TENTH PLAN (FY02-07) ELEVENTH PLAN (FY08-12) GROWTH
(RS B) (% SHARE) (RS B) (% SHARE) (X)
Electricity 2,982 33.6 6,165 30.4 2.1Roads & Bridges 1,449 16.3 3,118 15.4 2.2Telecom 1,234 13.9 2,670 13.2 2.2Railways 1,197 13.5 2,580 12.7 2.2Irrigation 1,115 12.6 2,231 11.0 2.0Water supply, Sanitation 648 7.3 1,991 9.8 3.1Ports 41 0.5 739 3.6 18.1Airports 68 0.8 347 1.7 5.1Storage 48 0.5 224 1.1 4.6Gas 87 1.0 205 1.0 2.4Total 8,868 100.0 20,272 100.0 2.3
Source: Planning Commission
1.4.3 Implications for the NTD EraSustained savings-led investment boomSeveral potential Winner Categories - Banks, Brokerages, Insurance, Housing Finance,Credit Rating, Engineering - Turnkey, Construction, Real estate, Cement, Steel, Paints,Power utilities, Power generation equipment, Power transmission equipment,Infrastructure asset-owners and Gas distribution.
1.5 Corporate profitability boom in the NTD EraIn the NTD Era, boom in consumption, savings and investments will lead to a boom incorporate profits. Again, going by past data, the profit of listed, top 100 profit-makingcompanies in India registered a CAGR of 21% during FY99-FY04 and by a further 18%during FY04-09. In both the periods, the growth rate was 1.5x that of nominal GDP growth.There is no reason to believe why this profit growth multiple cannot be sustained over thenext five years.
2. Winner Categories in the NTD Era
Winner Categories = India's NTD opportunity + Scalability
The process of arriving at the final list of Winner Categories in the NTD era led us toseveral insights -
Value migrates from basic spend to discretionary spend categoriesWinner categories emerge when demand hits the J-curveCategories which can become large in relation to the economy emerge winnersConsolidated categories will benefit more than fragmented ones.
2.1 Basic spend v/s Discretionary spend categoriesBasic spend on needs such as food and clothing do not increase in the same proportion asincrease in incomes and prosperity, In contrast, discretionary spends tend to show exponentialgrowth. Thus, over time, value migrates from basic spend categories to discretionaryspend categories.
TOTAL PAT OF TOP 100 COMPANIES
1981
332
861
FY99 FY04 FY09
21%
18%
Source: MOSL
Winner Categories are thosewhich will grow 1.5x faster
than GDP growth
Discretionary spendcategories will outperform
basic spend categories

2717 December 2009
Wealth Creation Study 2004-2009 Theme 2009
Source: MOSL
Example 2: Public sector banks v/s Private sector banksFor quite some time, public sector banks stood for basic banking services. Then, privatebanks entered the arena with several "discretionary" (i.e. value added) elements such asATMs and phone banking. Hence, value continues to migrate to private sector banks, bothin terms of revenue/profits and market capitalization.
HDFC BANK'S INCOME GROWS FASTER THAN SBI ... ... AS DOES MARKET CAP (RS B)
400
700
1,000
1,300
1,600
FY04 FY05 FY06 FY07 FY08 FY09
Cars ('000) Motorcycles - Re-based Bicycles - Re-based
0
450
900
1,350
1,800
Dec-04
Dec-05
Dec-06
Dec-07
Dec-08
Dec-09
Maruti Hero Honda - Rebased
Example 1: Bicycles v/s Two-wheelers v/s CarsAs regards the need for personal transport, bicycles and two-wheelers represent the basicspend, whereas cars are the discretionary spend. Given rising prosperity in India, valuehas started to migrate to cars in terms of higher growth rates than the other two categories.
BICYCLES V/S TWO-WHEELERS V/S CARS MARUTI V/S HERO HONDA: SHARE PRICE MOVEMENT
0
50
100
150
200
FY04 FY05 FY06 FY07 FY08 FY09
HDFC Bank Income (Rs b) SBI Income - Re-based
0
125
250
375
500
FY04 FY05 FY06 FY07 FY08 FY09
HDFC Bank SBI - Re-based
Source: MOSL
2.2 J-curve demand - the key to Winner CategoriesDemand for a category hits the J-curve when product price matches with affordability fora large section of customers (see diagram on next page).
J-curves can occur when incomes rise or product prices fall or both happen simultaneously.Increasingly, as categories attain scale, benefits get passed on to customers by way oflower prices, leading to demand J-curves. The NTD Era will see several categories hittingdemand J-curves and emerging as Winner Categories.
Cars should grow fasterthan 2-wheelers …
… and private banks fasterthan public sector banks
Categories which witnessdemand J-curves will emerge
as Winner Categories

2817 December 2009
Wealth Creation Study 2004-2009 Theme 2009
Source: Industry/Company/MOSL
2.3 Categories with scalability and size are potential winnersCategories which have the capability to become large in relation to the economy arepotential winners. For instance, Construction activity accounts for a sizable 18% of Indianeconomy and continues to grow rapidly. Likewise, in India, barely 5% of total retailing isorganized, In contrast, in the US, a single retailing company, Wal-mart, has sales of aboutUS$400b, ~3% of US GDP.
CONSTRUCTION AND RETAIL GROWTH HAVE OUTPERFORMED GDP
DEMAND J-CURVE
FALLING PRODUCT PRICE ACCELERATES J-CURVE MAGGI NOODLES HITS J-CURVE
IN WIRELESS TELECOM NESTLE'S PREPARED DISHES SALES (TONNES)
162
256
386
5513 35
960.9 0.8 0.6
1.5
2.3
1.9
1.2
FY03 FY04 FY05 FY06 FY07 FY08 FY09
Wireless users (m) Revenue per minute (Rs)
40,000
65,000
90,000
115,000
140,000
CY03 CY04 CY05 CY06 CY07 CY08
Note: Construction data is from National Accounts data; Retail is aggregate sales of leading listed players
2,000
4,000
6,000
8,000
10,000
FY04 FY05 FY06 FY07 FY08
Construction (Rs b) GDP - Re-based
0
3,000
6,000
9,000
12,000
FY04 FY05 FY06 FY07 FY08 FY09
Retail (Rs b) GDP - Re-based
Demand J-curve occurs whenproduct price matches
affordability for a largesection of customers
Wireless Telecom andMaggi Noodles are classic
cases of J-curve demand
Categories like OrganizedRetail which are small today
have significant room forscaling up

2917 December 2009
Wealth Creation Study 2004-2009 Theme 2009
2.5 Final list of Winner CategoriesFrom among the several potential Winner Categories emerging from India's imminentconsumption and investment boom, we arrive at the final list of Winner Categories afterconsidering the following -
The category should have grown @ 18%+ (1.5x expected GDP growth of 12%) in thefive years to FY09. Where there is volatile pricing impact (e.g. Cement, Oil marketing),volume growth should be over 10.5% (1.5x expected real GDP growth of 7%).To play the domestic NTD Era, we avoid categories vulnerable to global shocks.
2.4 Consolidated categories will benefit more than fragmented onesIf a category is highly fragmented, then even if it scales up, the benefits get diluted as theyare shared by a large number of players (eg Real estate). In contrast, in categories whichenjoy scale and are consolidated in nature, all incremental growth is shared by few incumbentplayers. For instance, Oil marketing in India is a Rs5.7 trillion (US$125b) category, largelyshared by just three players. Likewise, for quite some time, BHEL was a monopoly in thepower equipment category.
We have plotted major categories in the matrix of growth and consolidation. High-growthcategories combined with consolidation tend to be Winner Categories.
CATEGORY CONSOLIDATION AND GROWTH MATRIX
Source: MOSLHighlighted quadrants are the Winner Categories
Categories combining highgrowth with consolidation
are Winner Categories

3017 December 2009
Wealth Creation Study 2004-2009 Theme 2009
We avoid categories which are too fragmented and/or do not offer listed plays.We avoid categories where returns are capped by regulation.
Our final list contains 21 Winner Categories.
WINNER CATEGORIES IN INDIA'S NTD ERA
1. Alcoholic beverages 12. Finance - Housing2. Auto - 2-wheelers 13. FMCG - Personal Care3. Auto - Cars & UVs 14. FMCG - Processed Food4. Auto - Tractors 15. Gas distribution5. Capital Goods - Power equipment 16. Infrastructure6. Construction 17. Insurance7. Engineering - Turnkey 18. Media - Entertainment8. Finance - Banks, Private sector 19. Real Estate9. Finance - Banks, Public sector 20. Retailing10. Finance - Brokerages 21. Telecom11. Finance - Credit rating
Source: Company/MOSL
3. Category Winners in the NTD Era
Category Winners = Winner Categories + Entry Barriers + Great Management
Having identified Winner Categories, the next step is to pick Category Winners. CategoryWinners are companies best placed to exploit the exponential business opportunityin the Winner Categories for a very long time.
Apart from emerging from a Winner Category, the other key success factors for CategoryWinners are: (1) Entry Barriers and (2) Great management.
3.1 What are Entry Barriers?Entry Barrier is a simple synonym for sustainable competitive advantage. Thereare two tests to confirm whether a company enjoys an Entry Barrier: (1) Market sharestability, and (2) High return on capital.
"The existence of barriers to entry means that incumbent firms are able to do whatpotential rivals cannot. Being able to do what rivals cannot is the definition of competitiveadvantage. Thus, barriers to entry and incumbent competitive advantage are simply twoways of describing the same thing."- Bruce Greenwald and Judd Kahn in their book Competition Demystified
In its strictest sense, an Entry Barrier is one which prevents new competitors from enteringan incumbent company's market place. This is possible in only few cases e.g.
If a company enjoys patent protection for its product; andIf there are government regulations preventing new entrants into a category, e.g. vialicensing requirements.
All our Winner Categoriesenjoy high growth with
high-to-mediumconsolidation in terms
of number of players
Category Winners arecompanies from WinnerCategories which enjoy(1) Entry Barriers and(2) Great management
Entry Barrier is another termfor competitive advantage

3117 December 2009
Wealth Creation Study 2004-2009 Theme 2009
In a broader sense, a company may be said to enjoy an Entry Barrier if it is difficult for anew firm to enter the category - or for existing rivals to expand - and cause a major,permanent erosion of the company's market share. The key words here are "difficult"and "major, permanent".
Example 1: Horlicks v/s Milo in malted beverageWe believe GlaxoSmithkline Consumer's Horlicks enjoys a strong Entry Barrier in themalted beverages category. Still, that did not prevent Nestle from entering the categorywith Milo and arithmetically lowering Horlicks' market share. However, over time,Horlicks' Entry Barrier asserted itself, and Nestle had to completely withdraw Milo fromthe market. Thus, there was no major, permanent erosion of Horlicks' share.
Example 2: Indian wireless telecomSeveral new players have entered - or are ready to enter - the Indian wireless telecomcategory: Tata DOCOMO, UniNor, Etisalat, Shyam-Sistema, etc. Obviously, as soon asthey enter, the market shares of all incumbent players will be lowered. However, that isnot reason enough to conclude that the incumbents do not enjoy Entry Barriers.
The losses being incurred by new entrants are already suggesting that entry into the categoryis difficult. Over time, the Horlicks-Milo episode could play out here as well, andincumbents would have suffered no major, permanent erosion of their market sharesand profitability
3.2 Analysis of Entry BarriersBruce Greenwald and Judd Kahn in their book Competition Demystified talk of threekinds of Entry Barriers - (1) Demand side, (2) Supply side, and (3) Economies of scale.
Demand-side Entry Barriers: Some companies have access to market demand thattheir competitors cannot match. This may arise from one or more of the following factors:1. Customer captivity due to a strongly differentiated product/brand, force of habit or
high switching costs, including the difficulty of searching for substitutes; and2. Strong distribution network.
Demand-side Entry Barriers such as trusted brands are intangible and typically result infirms enjoying very high return on capital.
TOP 10 BRAND COMPANIES BY LONG-TERM ADJUSTED RETURN ON CAPITAL
COMPANY LAST REPORTED ANNUAL (RS M) ADJUSTED ROCE (%)
SALES ADJ. PAT PAT MARGIN (%) LATEST 10-YR AVG
Hero Honda Motor 123,152 11,806 9.6 50 80Nestle India 43,277 5,360 12.4 171 71Godrej Consumer 10,871 1,615 14.9 34 70Colgate Palmolive 16,983 2,860 16.8 179 67Hindustan Unilever 201,924 24,800 12.3 105 67Castrol India 22,624 2,633 11.6 91 58GlaxoSmithKline Pharma 16,653 4,483 26.9 57 52Abbott India 6,953 605 8.7 45 48Astrazeneca Pharma 3,548 740 20.9 72 47P & G Hygiene 7,742 1,804 23.3 54 44Note: Adjusted RoCE is arrived by deducting Cash & Cash Equivalents (CCE) from Capital Employed.Correspondingly, we have lowered EBIT by imputed income of 8% of CCE.
Horlicks has proved itsEntry Barrier in malted
beverage …
… but will incumbentwireless players make it?
3 kinds of Entry Barriers -(1) Demand-side,
(2) Supply-side and(3) Economies of Scale

3217 December 2009
Wealth Creation Study 2004-2009 Theme 2009
Supply-side Entry Barriers: These mainly arise from the company being the lowestcost provider of goods/services in the category due to one or more of the following:1. Patent protection for products and/or production processes; and2. Privileged access to critical inputs (eg captive ore mines).
Low-cost Entry Barriers typically involve huge capital outlays, leading to lower return oncapital than firms with demand-side Entry Barriers.
Economies of scale: If an incumbent company has huge scale of operations, it leads tolow unit fixed costs which competitors find difficult to match.
Our analysis suggests that most Category Winners enjoy varying degrees of allthe three kinds of Entry Barriers.
3.3 Great ManagementApart from Entry Barriers, Category Winner companies need to have a great management.What constitutes a great management is highly subjective and a full topic of discussion initself. For the purposes of this report, a great management is one which -
Successfully defends - or even increases - the company's Entry Barrier; andManages all other tactical and operational matters to grow at least in line with theWinner Category, if not faster.
3.3 Winning investments = Category Winners + Reasonable valuationMore often than not, Category Winners are companies which are already acknowledgedas such by the stock market. Hence, in the market's best understanding, it values thesecompanies at valuations which prima facie do not seem attractive. Still, Category Winnersbought at reasonable (not necessarily cheap) valuations lead to great investments.
The combination of a Winning Category and Entry Barriers leads to a sustained superiorfinancial performance of Category Winners. This, in most cases, is extremely difficult toaccurately value in advance. Thus, so long as investors don't buy into bubblevaluations, the initial handicap of slightly premium valuations gets neutralizedover 2-3 years, resulting in significant outperformance of Category Winners overa 3-5 year timeframe.
"We are partial to putting out large amounts of money where we won't have to makeanother decision. If you buy something because it's undervalued, then you have to thinkabout selling it when it approaches your calculation of its intrinsic value. That's hard. But,if you can buy a few great companies, then you can sit on your ass. That's a good thing."- Charlie Munger, co-owner of Berkshire Hathaway, in his book
Poor Charlie's Almanack
We believe most Category Winners are stocks where investors won't have to make asecond decision (of selling). At first glance, they don't seem to be undervalued. But, overtime, their greatness plays out and the investments begin to pay off.
Occasionally, the market does confer "setback valuations" to Category Winners. Thismust be considered has a great opportunity to place large bets for handsome returns.
Category Winners tend toenjoy all 3 kinds of Entry
Barriers in varying degrees
Category Winners also havegreat managements which
defend or raise theEntry Barrier
Category Winners bought atreasonable valuation …
… outperform significantlyover the long term

3317 December 2009
Wealth Creation Study 2004-2009 Theme 2009
0
300
600
900
1,200
FY04 FY05 FY06 FY07 FY08 FY09
Wireless users:11x in 5 years(35m to 386m)
Bharti Airtel Mcap:4x in 5 years
(Rs287b to Rs1,200b)
India's GDP: 2x in 5 years (US$0.6t to US$1.2t)
Sensex: 1.7x in 5 years(5,591 to 9,709)
Example: Indian Wireless (Winner Category) + Bharti (Category Winner)
A classic example of Winner Category + Category Winner is that of Indian Wireless andBharti Airtel.
Winner Category - During FY0-4-09, wireless user base expanded 11x, significantlyfaster than India's GDP which expanded 2x over the period.
Category Winner - Bharti's sales grew 7.5x during FY04-09 and its market cap grew 4xover the period, compared to 1.7x for the Indian stock market.
WINNER CATEGORY (WIRELESS TELECOM) + CATEGORY WINNER (BHARTI)
4. Model portfolio for India's NTD era
We have applied our understanding of Entry Barriers to the NTD Era Winner Categoriesto create a portfolio of 15 Category Winners using the "Winning Investments EvaluationMatrix", as shown on page 34.
MODEL PORTFOLIO FOR INDIA'S NTD ERA
WINNER CATEGORY CATEGORY WINNER REMARK ON ENTRY BARRIER
Auto - 2-wheelers Hero Honda Motor Market leaderAuto - Cars & UVs Maruti Suzuki Appropriate product mix; widest distribution and service networkAuto - Cars & UVs / Tractors Mahindra & Mahindra Market leader in UVs and tractors; excellent track record of innovationsCapital Goods - Power equipment B H E L A near monopoly in thermal power plantsEngineering - Turnkey Larsen & Toubro The preferred engineering/construction company for complex projectsFinance - Banks, Private sector HDFC Bank High brand equity; most consistent performance track recordFinance - Banks, Public sector State Bank of India Largest bank with highest reach; offers play on insurance as wellFinance - Credit Rating CRISIL No.1 in India; group of global No.1, Standard & PoorFinance - Housing H D F C Long-standing market leader with lowest processing costsFMCG - Personal Care Dabur India Strong positioning in the Ayurveda / herbal products platformFMCG - Processed Food Nestle India Near monopoly in instant noodles and infant nutritionInfrastructure Mundra Port One of the largest ports on the Gujarat coastMedia - Entertainment Sun TV Dominant market share in South IndiaRetailing Pantaloon Retail Market leader by far; significant early mover advantageTelecom Bharti Airtel Highest market share, lowest cost, well-recognized brand
Source: Company/MOSL
As we believe India's NTD Era will at least be an extension - if not a vastly superiorversion - of the past 5-6 years, we back-tested the performance of the above portfolio.

3417 December 2009
Wealth Creation Study 2004-2009
Expectedly, the portfolio would have significantly outperformed the market over varioustime periods.
MODEL NTD PORTFOLIO BACKTESTED
COMPANY PRICE (RS) POINT-TO-POINT RETURN IF PURCHASED IN (%)
(10-DEC-09) MAR-09 MAR-08 MAR-07 MAR-06 MAR-04
B H E L 2,292 52 11 103 104 658Bharti Airtel 342 9 -17 -10 66 343CRISIL 4,323 60 38 62 150 765Dabur India 165 68 51 74 100 531H D F C 2,721 93 14 79 104 323HDFC Bank 1,786 85 35 88 131 372Hero Honda Motor 1,675 56 143 144 89 241Larsen & Toubro 1,687 151 12 108 177 1,075Maruti Suzuki 1,591 105 92 94 82 220Mahindra & Mahindra 1,040 171 50 33 66 348Nestle India 2,617 68 75 180 126 314Pantaloon Retail 355 119 -9 -2 0 676State Bank of India 2,296 115 44 145 151 302BSE Sensex 17,189 77 10 31 52 207No. of outperformers 7 11 11 12 13
% of total 54 85 85 92 100Average Return 89 41 85 104 474Outperformance 12 31 53 51 267Note: Mundra Port and Sun TV not included due to short listing history Source: MOSL
Currently, there is no bubble valuation in the Indian markets or in any of these stocks.Hence, we expect this "Winner Categories + Category Winners" portfolio tosignificantly outperform the markets during India's NTD Era.
Category Winners in Invest Zone are winning investments
WINNING INVESTMENTS EVALUATION MATRIX
Bharti and Hero Hondaare rare cases of Category
Winners available atpessimistic valuations
Our model NTD portfolio of15 Category Winners would
have outperformed ifpurchased anytime in
the last 5 years

3517 December 2009
Wealth Creation Study 2004-2009
THIS PAGE IS INTENTIONALLY LEFT BLANK

3617 December 2009
Wealth Creation Study 2004-2009
Wealth Creation
2004-2009The 14TH Annual Study
Market Outlook

3717 December 2009
Wealth Creation Study 2004-2009 Market Outlook
Market Outlook
India's corporate profit to GDP is set to bottom outAfter a high of 7.1% in FY08, India's corporate profit to GDP has corrected to 4.7% inFY10E. We believe corporate profit to GDP has bottomed out and should hit new highs inthe next 4-5 years on the back of sustained economic performance.
INDIA'S CORPORATE PROFITS TO GDP (%)
Source: MOSL
Interest rates will remain stable or tend to move higherThe government's economic stimulus packages and high fiscal deficit have already createdinflationary conditions. So, interest rates can at best be expected remain stable. If foodinflation persists at current high levels, the RBI may even consider hiking interest rates ina calibrated manner without hurting growth.
Source: MOSL
Sensex EPS: Expect 15-20% growth beyond FY11After a two year earnings growth holiday in FY09 and FY10, we expect Sensex EPS toclock 29% growth in FY11E. However, beyond that, it should revert back to its long-termaverage growth rate of 15-20%.
FY93 TO FY11E - SENSEX EPS PERFORMANCE (RS)
825 817833
523450
236 272280266181129
250 291 278
81216
348
718
1,060
FY93
FY94
FY95
FY96
FY97
FY98
FY99
FY00
FY01
FY02
FY03
FY04
FY05
FY06
FY07
FY08
FY09
FY10
E
FY11
E
FY93-96: 45%
FY96-03: 1% CAGR
FY03-08: 25%
FY08-10E:-1% CAGR
FY11E:+29%
2.4 2.31.8 1.9 2.1 2.3
4.4
5.35.7
6.6 7.1
5.14.7
3.5 3.3 3.1
1995
1996
1997
1998
1999
2000
2001
2002
2003
2004
2005
2006
2007
2008
2009
2010
E
15-year average: 3.9x

3817 December 2009
Wealth Creation Study 2004-2009 Market Outlook
INTEREST RATES IN INDIA WILL REMAIN STABLE OR TEND TO MOVE HIGHER
Source: MOSL
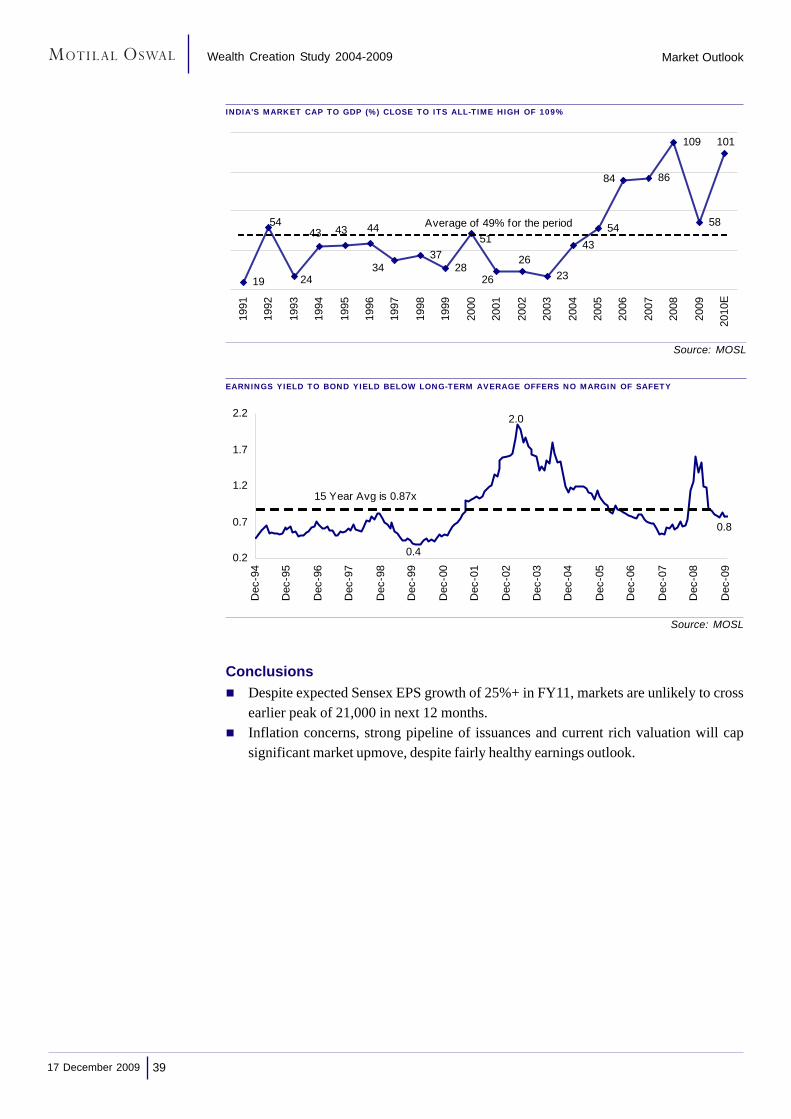
Significant P/E re-rating not expected from current levelsSensex P/E has expanded significantly since the market bottom in December 2008 onexpectation of buoyant earnings growth in FY11 and beyond.
However, we expect P/E to remain at current levels due to a significant increase in supplyof paper from government as well as private corporate sector.
In fact, cash-rich, high return on capital companies which will not need to raise freshcapital to fund their growth are likely to enjoy higher P/E multiples going forward.
SENSEX P/E ALMOST 20% HIGHER THAN LONG-TERM AVERAGE
Source: MOSL
No margin of safety at current levelsIndia's market cap to GDP is already close to its all-time high of 109% of GDP. Earningsyield to bond yield is also below its 15-year average of 0.9x, suggesting no margin ofsafety at current levels.
1,700
6,700
11,700
16,700
21,700
Dec
-09
Dec
-08
Dec
-07
Dec
-06
Dec
-05
Dec
-04
Dec
-03
Dec
-02
Dec
-01
Dec
-00
Dec
-99
Dec
-98
Dec
-97
Dec
-96
Dec
-95
Dec
-94
7
12
17
22
27Sensex P/E ( LHS) Sensex ( RHS )
15 Year Average 14.3x
7.4
9.3
5.3
7.6
0
3
6
9
12
Dec
-00
Dec
-01
Dec
-02
Dec
-03
Dec
-04
Dec
-05
Dec
-06
Dec
-07
Dec
-08
Dec
-09
3917 December 2009
Wealth Creation Study 2004-2009
Source: MOSL
EARNINGS YIELD TO BOND YIELD BELOW LONG-TERM AVERAGE OFFERS NO MARGIN OF SAFETY
Market Outlook
INDIA'S MARKET CAP TO GDP (%) CLOSE TO ITS ALL-TIME HIGH OF 109%
Source: MOSL
ConclusionsDespite expected Sensex EPS growth of 25%+ in FY11, markets are unlikely to crossearlier peak of 21,000 in next 12 months.Inflation concerns, strong pipeline of issuances and current rich valuation will capsignificant market upmove, despite fairly healthy earnings outlook.
19
3728
23
4354
86
109
5854
24
43 43
34
51
84
26
26
44
101
1991
1992
1993
1994
1995
1996
1997
1998
1999
2000
2001
2002
2003
2004
2005
2006
2007
2008
2009
2010
E
Average of 49% for the period
2.0
0.8
0.40.2
0.7
1.2
1.7
2.2
Dec
-94
Dec
-95
Dec
-96
Dec
-97
Dec
-98
Dec
-99
Dec
-00
Dec
-01
Dec
-02
Dec
-03
Dec
-04
Dec
-05
Dec
-06
Dec
-07
Dec
-08
Dec
-09
15 Year Avg is 0.87x

4017 December 2009
Wealth Creation Study 2004-2009
Wealth Creation
2004-2009The 14TH Annual Study
Appendix

4117 December 2009
Wealth Creation Study 2004-2009
Appendix IMOSL 100 – Biggest Wealth Creators
RANK COMPANY WEALTH CREATED CAGR (%) ROE (%) P/E (X)
NO. NAME RS B % SHARE PRICE PAT SALES FY09 FY04 FY09 FY04
1 Reliance Inds. 1,514 15.7 28 24 22 13 16 16 152 Bharti Airtel 891 9.2 32 69 49 28 14 15 493 B H E L 588 6.1 38 37 27 24 12 23 224 NMDC 578 6.0 71 59 39 38 21 14 105 O N G C 471 4.9 7 13 15 20 21 10 146 ITC 436 4.5 22 15 18 24 25 21 167 Infosys Tech. 405 4.2 16 36 34 33 38 13 268 Larsen & Toubro 291 3.0 36 46 29 28 19 11 39 S A I L 265 2.7 24 20 16 22 50 6 5
10 H D F C 193 2.0 17 22 29 17 25 18 1911 Hind. Unilever 188 2.0 9 7 15 121 83 21 1912 State Bank of India 186 1.9 13 20 16 16 18 7 913 HDFC Bank 173 1.8 21 35 45 15 19 18 2114 Jindal Steel 170 1.8 64 38 44 29 36 12 515 Sun Pharma. 155 1.6 28 39 33 25 29 18 2516 Hind.Zinc 146 1.5 35 46 25 19 27 7 1117 GAIL (India) 130 1.3 11 8 15 19 25 11 1018 Hero Honda Motor 116 1.2 17 12 16 34 64 17 1319 Sterlite Inds. 115 1.2 27 44 32 9 14 20 1920 Cipla 93 1.0 19 20 22 18 24 22 2321 Tata Comm 90 0.9 20 6 3 8 7 29 1522 Nestle India 90 0.9 20 15 15 113 79 28 2323 Tata Power 83 0.9 15 12 11 11 10 18 1424 Maruti Suzuki 80 0.8 9 18 18 13 15 18 2625 Bank of India 73 0.8 30 24 23 26 26 4 326 Hind. Copper 70 0.7 21 Loss 22 - 12 - -27 Sesa Goa 70 0.7 53 81 51 43 31 4 1028 Dabur India 63 0.7 30 30 17 51 38 23 2229 ACC 60 0.6 18 43 17 25 15 9 2330 Axis Bank 57 0.6 23 46 47 18 24 8 1231 A B B 57 0.6 22 35 36 26 21 17 2732 Unitech 56 0.6 122 121 37 26 9 8 833 Siemens 56 0.6 22 34 42 29 28 15 2334 Adani Enterprises 55 0.6 46 21 10 20 20 20 735 Bosch 55 0.6 18 22 19 20 26 15 1836 Kotak Mah. Bank 53 0.5 28 29 60 7 13 35 3137 Zee Entertainment 53 0.5 -5 22 19 13 6 15 4838 Neyveli Lignite 48 0.5 9 -6 3 9 17 17 839 Container Corpn 47 0.5 15 17 14 21 26 12 1340 Colgate-Palmolive 47 0.5 29 22 13 134 44 22 1641 Grasim Inds 47 0.5 8 16 16 17 22 9 1342 Asian Paints 46 0.5 21 20 20 33 28 21 2043 Union Bank (I) 45 0.5 23 19 21 24 27 4 344 Divi's Lab. 43 0.4 27 42 31 34 32 15 2545 Reliance Capital 43 0.4 22 56 55 14 8 9 1646 GSK Pharma 41 0.4 12 27 9 37 26 16 2647 Crompton Greaves 37 0.4 41 41 22 32 22 11 1148 M & M 37 0.4 11 20 21 17 20 12 1549 Ambuja Cements 36 0.4 13 33 26 25 17 8 1550 GE Shipping 33 0.3 8 24 16 28 31 2 5
RANKED ACCORDING TO THE BIGGEST WEALTH CREATORS

4217 December 2009
Wealth Creation Study 2004-2009
Appendix IMOSL 100 – Biggest Wealth Creators (contd.)
RANK COMPANY WEALTH CREATED CAGR (%) ROE (%) P/E (X)
NO. NAME RS B % SHARE PRICE PAT SALES FY09 FY04 FY09 FY04
51 Sterling Intl 33 0.3 62 -32 -18 1 6 11,993 15152 Areva T&D 32 0.3 97 68 37 31 10 21 853 Bharat Electronics 31 0.3 12 19 11 20 25 9 1354 Lupin 30 0.3 16 33 20 30 22 14 2655 Titan Inds. 29 0.3 50 70 34 29 9 22 4056 Marico 29 0.3 36 20 18 39 32 26 1357 Glenmark Pharma. 29 0.3 34 39 20 18 19 18 2058 United Spirits 24 0.2 64 69 31 10 8 22 1359 Wipro 22 0.2 2 27 33 24 26 12 3560 Exide Inds. 22 0.2 27 31 29 23 22 12 1361 Godrej Consumer 21 0.2 27 20 17 30 153 21 1462 Punjab Natl.Bank 21 0.2 4 23 20 24 24 4 863 Financial Tech. 21 0.2 53 96 68 21 23 8 2464 GTL 21 0.2 24 3 25 9 6 25 765 EIH 20 0.2 19 43 15 14 4 20 5166 Shree Cement 20 0.2 38 113 41 48 5 4 3867 GSK Consumer 19 0.2 23 20 14 25 16 16 1568 Natl. Aluminium 19 0.2 3 12 10 13 20 11 1669 Britannia Inds 19 0.2 18 9 17 22 28 19 1370 Sterling Biotech 17 0.2 15 37 32 13 14 16 2371 Cummins India 17 0.2 14 32 29 31 17 8 1872 Shriram Transport 17 0.2 49 75 71 26 40 6 373 Jain Irrigation 16 0.2 39 44 39 13 11 21 1874 Castrol India 16 0.2 11 14 13 55 39 15 1875 CRISIL 16 0.2 40 50 40 40 19 14 1876 Motherson Sumi 16 0.2 25 7 23 17 35 34 1677 Opto Circuits 15 0.2 84 61 47 35 32 12 578 HMT 15 0.2 13 Loss 3 - - - -79 Bhushan Steel 14 0.1 46 36 26 21 15 4 380 Pidilite Inds. 14 0.1 23 19 22 20 20 15 1281 United Breweries 13 0.1 56 86 30 7 8 34 6282 Tata Tea 13 0.1 12 12 12 9 10 23 2083 Thermax 13 0.1 19 40 40 30 16 8 1684 Chettinad Cement 12 0.1 58 P to L 28 - 11 - 1085 Century Textiles 12 0.1 18 25 12 16 10 9 1286 Oracle Fin.Serv. 12 0.1 5 32 26 20 18 9 2487 Guj Gas Company 12 0.1 24 20 20 23 30 11 988 BF Utilities 11 0.1 84 L to P 15 2 - 261 -89 Voltas 11 0.1 32 45 26 35 21 6 1090 Blue Star 11 0.1 40 41 30 49 25 8 891 Engineers India 11 0.1 10 34 4 25 10 8 2392 Alstom Projects 11 0.1 20 12 31 34 28 14 1093 P & G Hygiene 11 0.1 13 14 6 41 37 14 1494 Tata Tele. Mah. 11 0.1 7 Loss 27 43 - - -95 Piramal Health 11 0.1 7 8 11 23 48 15 1596 ICI (India) 11 0.1 19 22 3 30 21 6 797 Shriram City Union 11 0.1 70 45 46 17 32 13 398 Astrazeneca Pharma 10 0.1 30 25 15 64 25 19 1699 Madras Aluminium 10 0.1 36 4 10 12 30 27 7
100 EID Parry 10 0.1 29 74 6 72 13 2 8
RANKED ACCORDING TO THE BIGGEST WEALTH CREATORS

4317 December 2009
Wealth Creation Study 2004-2009
Appendix IIMOSL 100 – Fastest Wealth Creators
RANK COMPANY PRICE CAGR (%) ROE (%) P/E (X)
NO. NAME APPRN. (X) PRICE PAT SALES FY09 FY04 FY09 FY04
1 Unitech 54 122 121 37 26 9 8 82 Areva T&D 29 97 68 37 31 10 21 83 BF Utilities 21 84 L to P 15 2 - 261 -4 Opto Circuits 21 84 61 47 35 32 12 55 NMDC 14 71 59 39 38 21 14 106 Shriram City Union 14 70 45 46 17 32 13 37 United Spirits 12 64 69 31 10 8 22 138 Jindal Steel 12 64 38 44 29 36 12 59 Sterling Intl 11 62 -32 -18 1 6 11,993 151
10 Chettinad Cement 10 58 P to L 28 - 11 - 1011 United Breweries 9 56 86 30 7 8 34 6212 Sesa Goa 8 53 81 51 43 31 4 1013 Financial Tech. 8 53 96 68 21 23 8 2414 Titan Inds. 7 50 70 34 29 9 22 4015 Shriram Transport 7 49 75 71 26 40 6 316 Adani Enterprises 7 46 21 10 20 20 20 717 Bhushan Steel 7 46 36 26 21 15 4 318 Crompton Greaves 6 41 41 22 32 22 11 1119 Blue Star 5 40 41 30 49 25 8 820 CRISIL 5 40 50 40 40 19 14 1821 Jain Irrigation 5 39 44 39 13 11 21 1822 Shree Cement 5 38 113 41 48 5 4 3823 B H E L 5 38 37 27 24 12 23 2224 Madras Aluminium 5 36 4 10 12 30 27 725 Larsen & Toubro 5 36 46 29 28 19 11 326 Marico 5 36 20 18 39 32 26 1327 Hind.Zinc 4 35 46 25 19 27 7 1128 Glenmark Pharma. 4 34 39 20 18 19 18 2029 Bharti Airtel 4 32 69 49 28 14 15 4930 Voltas 4 32 45 26 35 21 6 1031 Dabur India 4 30 30 17 51 38 23 2232 Bank of India 4 30 24 23 26 26 4 333 Astrazeneca Pharma 4 30 25 15 64 25 19 1634 Colgate-Palmolive 4 29 22 13 134 44 22 1635 EID Parry 4 29 74 6 72 13 2 836 Kotak Mah. Bank 4 28 29 60 7 13 35 3137 Reliance Inds. 3 28 24 22 13 16 16 1538 Sun Pharma. 3 28 39 33 25 29 18 2539 Exide Inds. 3 27 31 29 23 22 12 1340 Sterlite Inds. 3 27 44 32 9 14 20 1941 Divi's Lab. 3 27 42 31 34 32 15 2542 Godrej Consumer 3 27 20 17 30 153 21 1443 Motherson Sumi 3 25 7 23 17 35 34 1644 S A I L 3 24 20 16 22 50 6 545 GTL 3 24 3 25 9 6 25 746 Guj Gas Company 3 24 20 20 23 30 11 947 Pidilite Inds. 3 23 19 22 20 20 15 1248 GSK Consumer 3 23 20 14 25 16 16 1549 Axis Bank 3 23 46 47 18 24 8 1250 Union Bank (I) 3 23 19 21 24 27 4 3
RANKED ACCORDING TO THE FASTEST WEALTH CREATORS

4417 December 2009
Wealth Creation Study 2004-2009
Appendix IIMOSL 100 – Fastest Wealth Creators (contd.)
RANK COMPANY PRICE CAGR (%) ROE (%) P/E (X)
NO. NAME APPRN. (X) PRICE PAT SALES FY09 FY04 FY09 FY04
51 Siemens 3 22 34 42 29 28 15 2352 Reliance Capital 3 22 56 55 14 8 9 1653 A B B 3 22 35 36 26 21 17 2754 ITC 3 22 15 18 24 25 21 1655 Asian Paints 3 21 20 20 33 28 21 2056 Hind. Copper 3 21 Loss 22 - 12 - -57 HDFC Bank 3 21 35 45 15 19 18 2158 Tata Comm 3 20 6 3 8 7 29 1559 Alstom Projects 2 20 12 31 34 28 14 1060 Nestle India 2 20 15 15 113 79 28 2361 Thermax 2 19 40 40 30 16 8 1662 ICI (India) 2 19 22 3 30 21 6 763 EIH 2 19 43 15 14 4 20 5164 Cipla 2 19 20 22 18 24 22 2365 Century Textiles 2 18 25 12 16 10 9 1266 Bosch 2 18 22 19 20 26 15 1867 ACC 2 18 43 17 25 15 9 2368 Britannia Inds 2 18 9 17 22 28 19 1369 H D F C 2 17 22 29 17 25 18 1970 Hero Honda Motor 2 17 12 16 34 64 17 1371 Infosys Tech. 2 16 36 34 33 38 13 2672 Lupin 2 16 33 20 30 22 14 2673 Tata Power 2 15 12 11 11 10 18 1474 Container Corpn 2 15 17 14 21 26 12 1375 Sterling Biotech 2 15 37 32 13 14 16 2376 Cummins India 2 14 32 29 31 17 8 1877 State Bank of India 2 13 20 16 16 18 7 978 HMT 2 13 Loss 3 - - - -79 P & G Hygiene 2 13 14 6 41 37 14 1480 Ambuja Cements 2 13 33 26 25 17 8 1581 GSK Pharma 2 12 27 9 37 26 16 2682 Bharat Electronics 2 12 19 11 20 25 9 1383 Tata Tea 2 12 12 12 9 10 23 2084 GAIL (India) 2 11 8 15 19 25 11 1085 Castrol India 2 11 14 13 55 39 15 1886 M & M 2 11 20 21 17 20 12 1587 Engineers India 2 10 34 4 25 10 8 2388 Maruti Suzuki 2 9 18 18 13 15 18 2689 Hind. Unilever 2 9 7 15 121 83 21 1990 Neyveli Lignite 2 9 -6 3 9 17 17 891 GE Shipping 1 8 24 16 28 31 2 592 Grasim Inds 1 8 16 16 17 22 9 1393 Piramal Health 1 7 8 11 23 48 15 1594 Tata Tele. Mah. 1 7 Loss 27 43 - - -95 O N G C 1 7 13 15 20 21 10 1496 Oracle Fin. Serv. 1 5 32 26 20 18 9 2497 Punjab Natl. Bank 1 4 23 20 24 24 4 898 Natl. Aluminium 1 3 12 10 13 20 11 1699 Wipro 1 2 27 33 24 26 12 35
100 Zee Entertainment 1 -5 22 19 13 6 15 48
RANKED ACCORDING TO THE FASTEST WEALTH CREATORS

4517 December 2009
Wealth Creation Study 2004-2009
Appendix IIIMOSL 100 – Wealth Creators (alphabetical)
SR. COMPANY BIGGEST FASTEST CAGR (%) ROE (%) P/E (X)
NO. NAME RANK WC (RS B) RANK PRICE CAGR (%) PAT SALES FY09 FY04 FY09 FY04
1 ABB 31 57 53 22 35 36 26 21 17 272 ACC 29 60 67 18 43 17 25 15 9 233 Adani Enterprises 34 55 16 46 21 10 20 20 20 74 Alstom Projects 92 11 59 20 12 31 34 28 14 105 Ambuja Cements 49 36 80 13 33 26 25 17 8 156 Areva T&D 52 32 2 97 68 37 31 10 21 87 Asian Paints 42 46 55 21 20 20 33 28 21 208 Astrazeneca Pharma 98 10 33 30 25 15 64 25 19 169 Axis Bank 30 57 49 23 46 47 18 24 8 12
10 B H E L 3 588 23 38 37 27 24 12 23 2211 Bank of India 25 73 32 30 24 23 26 26 4 312 BF Utilities 88 11 3 84 L to P 15 2 - 261 -13 Bharat Electronics 53 31 83 12 19 11 20 25 9 1314 Bharti Airtel 2 891 29 32 69 49 28 14 15 4915 Bhushan Steel 79 14 17 46 36 26 21 15 4 316 Blue Star 90 11 19 40 41 30 49 25 8 817 Bosch 35 55 66 18 22 19 20 26 15 1818 Britannia Inds 69 19 68 18 9 17 22 28 19 1319 Castrol India 74 16 86 11 14 13 55 39 15 1820 Century Textiles 85 12 65 18 25 12 16 10 9 1221 Chettinad Cement 84 12 10 58 P to L 28 - 11 - 1022 Cipla 20 93 64 19 20 22 18 24 22 2323 Colgate-Palmolive 40 47 34 29 22 13 134 44 22 1624 Container Corpn 39 47 74 15 17 14 21 26 12 1325 CRISIL 75 16 20 40 50 40 40 19 14 1826 Crompton Greaves 47 37 18 41 41 22 32 22 11 1127 Cummins India 71 17 76 14 32 29 31 17 8 1828 Dabur India 28 63 31 30 30 17 51 38 23 2229 Divi's Lab. 44 43 41 27 42 31 34 32 15 2530 EID Parry 100 10 35 29 74 6 72 13 2 831 EIH 65 20 63 19 43 15 14 4 20 5132 Engineers India 91 11 88 10 34 4 25 10 8 2333 Exide Inds. 60 22 39 27 31 29 23 22 12 1334 Financial Tech. 63 21 13 53 96 68 21 23 8 2435 GAIL (India) 17 130 85 11 8 15 19 25 11 1036 GE Shipping 50 33 92 8 24 16 28 31 2 537 GSK Consumer 67 19 48 23 20 14 25 16 16 1538 GSK Pharma 46 41 81 12 27 9 37 26 16 2639 Glenmark Pharma. 57 29 28 34 39 20 18 19 18 2040 Godrej Consumer 61 21 42 27 20 17 30 153 21 1441 Grasim Inds 41 47 93 8 16 16 17 22 9 1342 GTL 64 21 45 24 3 25 9 6 25 743 Guj Gas Company 87 12 46 24 20 20 23 30 11 944 H D F C 10 193 69 17 22 29 17 25 18 1945 HDFC Bank 13 173 57 21 35 45 15 19 18 2146 Hero Honda Motor 18 116 70 17 12 16 34 64 17 1347 Hind. Copper 26 70 56 21 Loss 22 - 12 - -48 Hind. Unilever 11 188 90 9 7 15 121 83 21 1949 Hind.Zinc 16 146 27 35 46 25 19 27 7 1150 HMT 78 15 78 13 Loss 3 - - - -
ALPHABETICALLY ARRANGED

4617 December 2009
Wealth Creation Study 2004-2009
Appendix IIIMOSL 100 – Wealth Creators (alphabetical, contd.)
SR. COMPANY BIGGEST FASTEST CAGR (%) ROE (%) P/E (X)
NO. NAME RANK WC (RS B) RANK PRICE CAGR (%) PAT SALES FY09 FY04 FY09 FY04
51 ICI (India) 96 11 62 19 22 3 30 21 6 752 Infosys Tech. 7 405 71 16 36 34 33 38 13 2653 ITC 6 436 54 22 15 18 24 25 21 1654 Jain Irrigation 73 16 21 39 44 39 13 11 21 1855 Jindal Steel 14 170 8 64 38 44 29 36 12 556 Kotak Mah. Bank 36 53 36 28 29 60 7 13 35 3157 Larsen & Toubro 8 348 25 36 46 29 28 19 11 358 Lupin 54 30 72 16 33 20 30 22 14 2659 M & M 48 37 87 11 20 21 17 20 12 1560 Madras Aluminium 99 10 24 36 4 10 12 30 27 761 Marico 56 29 26 36 20 18 39 32 26 1362 Maruti Suzuki 24 80 89 9 18 18 13 15 18 2663 Motherson Sumi 76 16 43 25 7 23 17 35 34 1664 Natl. Aluminium 68 19 99 3 12 10 13 20 11 1665 Nestle India 22 90 60 20 15 15 113 79 28 2366 Neyveli Lignite 38 48 91 9 -6 3 9 17 17 867 NMDC 4 578 5 71 59 39 38 21 14 1068 O N G C 5 471 96 7 13 15 20 21 10 1469 Opto Circuits 77 15 4 84 61 47 35 32 12 570 Oracle Fin. Serv. 86 12 97 5 32 26 20 18 9 2471 P & G Hygiene 93 11 79 13 14 6 41 37 14 1472 Pidilite Inds. 80 14 47 23 19 22 20 20 15 1273 Piramal Health 95 11 94 7 8 11 23 48 15 1574 Punjab Natl.Bank 62 21 98 4 23 20 24 24 4 875 Reliance Capital 45 43 52 22 56 55 14 8 9 1676 Reliance Inds. 1 1,514 37 28 24 22 13 16 16 1577 S A I L 9 265 44 24 20 16 22 50 6 578 Sesa Goa 27 70 12 53 81 51 43 31 4 1079 Shree Cement 66 20 22 38 113 41 48 5 4 3880 Shriram City Union 97 11 6 70 45 46 17 32 13 381 Shriram Transport 72 17 15 49 75 71 26 40 6 382 Siemens 33 56 51 22 34 42 29 28 15 2383 State Bank of India 12 186 77 13 20 16 16 18 7 984 Sterling Biotech 70 17 75 15 37 32 13 14 16 2385 Sterling Intl 51 33 9 62 -32 -18 1 6 - 15186 Sterlite Inds. 19 115 40 27 44 32 9 14 20 1987 Sun Pharma. 15 155 38 28 39 33 25 29 18 2588 Tata Comm 21 90 58 20 6 3 8 7 29 1589 Tata Power 23 83 73 15 12 11 11 10 18 1490 Tata Tea 82 13 84 12 12 12 9 10 23 2091 Tata Tele. Mah. 94 11 95 7 Loss 27 43 - - -92 Thermax 83 13 61 19 40 40 30 16 8 1693 Titan Inds. 55 29 14 50 70 34 29 9 22 4094 Union Bank (I) 43 45 50 23 19 21 24 27 4 395 Unitech 32 56 1 122 121 37 26 9 8 896 United Breweries 81 13 11 56 86 30 7 8 34 6297 United Spirits 58 24 7 64 69 31 10 8 22 1398 Voltas 89 11 30 32 45 26 35 21 6 1099 Wipro 59 22 100 2 27 33 24 26 12 35
100 Zee Entertainment 37 53 82 12 22 19 13 6 15 48
ALPHABETICALLY ARRANGED

4717 December 2009
Wealth Creation Study 2004-2009

This report is for the personal information of the authorized recipient and does not construe to be any investment, legal or taxation advice to you. Motilal OswalSecurities Limited (hereinafter referred as MOSt) is not soliciting any action based upon it. This report is not for public distribution and has been furnished to you solelyfor your information and should not be reproduced or redistributed to any other person in any form.
The report is based upon information that we consider reliable, but we do not represent that it is accurate or complete, and it should not be relied upon such. MOSt orany of its affiliates or employees shall not be in any way responsible for any loss or damage that may arise to any person from any inadvertent error in the informationcontained in this report. MOSt or any of its affiliates or employees do not provide, at any time, any express or implied warranty of any kind, regarding any matterpertaining to this report, including without limitation the implied warranties of merchantability, fitness for a particular purpose, and non-infringement. The recipients ofthis report should rely on their own investigations.
MOSt and/or its affiliates and/or employees may have interests/ positions, financial or otherwise in the securities mentioned in this report. To enhance transparency,MOSt has incorporated a Disclosure of Interest Statement in this document. This should, however, not be treated as endorsement of the views expressed in the report.
This information is subject to change without any prior notice. MOSt reserves the right to make modifications and alternations to this statement as may be requiredfrom time to time. Nevertheless, MOSt is committed to providing independent and transparent recommendations to its clients, and would be happy to provideinformation in response to specific client queries.
For more copies or other information, contactInstitutional: Navin Agarwal. Retail: Manish Shah
Phone: (91-22) 39825500 Fax: (91-22) 22885038. E-mail: [email protected]
© Motilal Oswal Securities Ltd, 3rd Flr, Hoechst House, Nariman Point, Mumbai 400 021 Tel: +91 22 3892 5500 Fax: 2281 6161