13 financial report - claremont mckenna college...the global economic environment and its effects on...
TRANSCRIPT
2012–2013 Financial Report
CLAREMONT MCKENNA COLLEGEANNUAL FINANCIAL REPORT
2013 and 2012
CONTENTS
Financial Highlights
Treasurer's Report
Report of Independent Auditors
Statements of Financial Position
Statements of Activities
Statements of Cash Flows
Notes to Financial Statements
Page
14
9
10
11
13
5
1
Financial Highlights
●
●
●
●
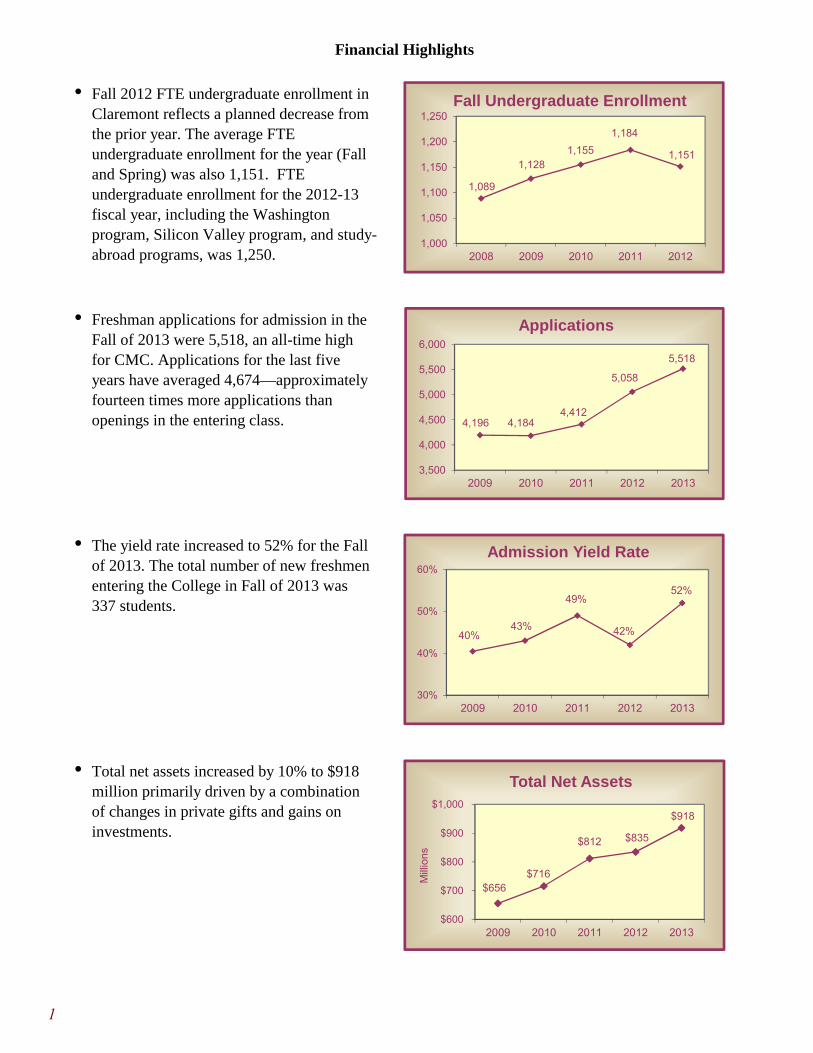
Fall 2012 FTE undergraduate enrollment in Claremont reflects a planned decrease from the prior year. The average FTE undergraduate enrollment for the year (Fall and Spring) was also 1,151. FTE undergraduate enrollment for the 2012-13 fiscal year, including the Washington program, Silicon Valley program, and study-abroad programs, was 1,250.
Freshman applications for admission in the Fall of 2013 were 5,518, an all-time high for CMC. Applications for the last five years have averaged 4,674—approximately fourteen times more applications than openings in the entering class.
The yield rate increased to 52% for the Fall of 2013. The total number of new freshmen entering the College in Fall of 2013 was 337 students.
Total net assets increased by 10% to $918 million primarily driven by a combination of changes in private gifts and gains on investments.
1,089
1,1281,155
1,184
1,151
1,000
1,050
1,100
1,150
1,200
1,250
2008 2009 2010 2011 2012
Fall Undergraduate Enrollment
4,196 4,1844,412
5,058
5,518
3,500
4,000
4,500
5,000
5,500
6,000
2009 2010 2011 2012 2013
Applications
40%43%
49%
42%
52%
30%
40%
50%
60%
2009 2010 2011 2012 2013
Admission Yield Rate
$656 $716
$812 $835
$918
$600
$700
$800
$900
$1,000
2009 2010 2011 2012 2013
Mill
ions
Total Net Assets
1

Financial Highlights
●
●
●
●
Total investments increased by 16.9% in 2013, after fees and spending for operations. The net increase was primarily attributable to new gifts and realized and unrealized gains.
The unit market value increased by 11.5%. Unit market value reflects general market performance after spending for operations.
The spending rate (spending amount per unit divided by unit market value at the beginning of the year) increased as a result of the decline in the unit market value by the end of fiscal year 2012, which became the beginning of the year value for 2013.
Endowment per student increased as a result of the increase in the market value of the endowment as of June 30, 2013, and the decrease in FTE enrollment in Fall 2012. Total endowment at June 30, 2013, was $599 million.
$543
$594
$648$623
$728
$500
$600
$700
$800
2009 2010 2011 2012 2013
Mill
ions
Total Investments
$459
$504
$575$541
$603
$300
$400
$500
$600
$700
$800
2009 2010 2011 2012 2013
Unit Market Value
$330 $379
$428 $398
$467
$200
$300
$400
$500
$600
2009 2010 2011 2012 2013
Tho
usan
ds
Endowment Per Student
4.7%
6.1%5.5%
4.8%5.2%
3%
4%
5%
6%
7%
8%
2009 2010 2011 2012 2013
Spending Rate
2

Financial Highlights
●
●
●
●
The total tuition discount (financial aid divided by tuition and fees revenues) decreased as part of a planned multi-year reduction. CMC's discount is lower than the 2012 median discount of 37.6% for Moody’s Aa small institutions.
CMC’s endowment and a prudent spending policy produce sufficient investment income to make a significant contribution toward covering the operational costs of a CMC education. The investment income contribution ratio remained consistent between 2012 and 2013.
Total resources to debt decreased in 2013 as a result of new bonds issued by the College. CMC’s ratio of 5.2 is lower than the 2012 median value of 5.8 for Moody’s Aa small institutions (enrollments typically under 3,000 FTE). Moody's Investors Services assigned a rating of Aa2 with a stable outlook to CMC's Series 2012 Revenue Bonds.
CMC experienced growth in net tuition per student at a rate higher than the rate of increase in gross tuition, which was a direct result of a small decrease in the tuition discount. This dollar level places CMC higher than the 2012 median net tuition per student of $25,887 for Moody's Aa small institutions.
4.34.8 5.4 5.6 5.2
0
2
4
6
8
10
2009 2010 2011 2012 2013
Total Resources to Debt
$23.0 $24.5
$26.3
$28.7 $30.3
$20
$25
$30
$35
2009 2010 2011 2012 2013
Tho
usan
ds
Net Tuition Per Student
37.1%36.5%
37.1%
35.2% 35.0%
32%
34%
36%
38%
40%
2009 2010 2011 2012 2013
Total Tuition Discount
31% 31% 31%
28% 28%
20%
25%
30%
35%
40%
2009 2010 2011 2012 2013
Investment IncomeContribution Ratio
3
Financial Highlights
●
●
●
●
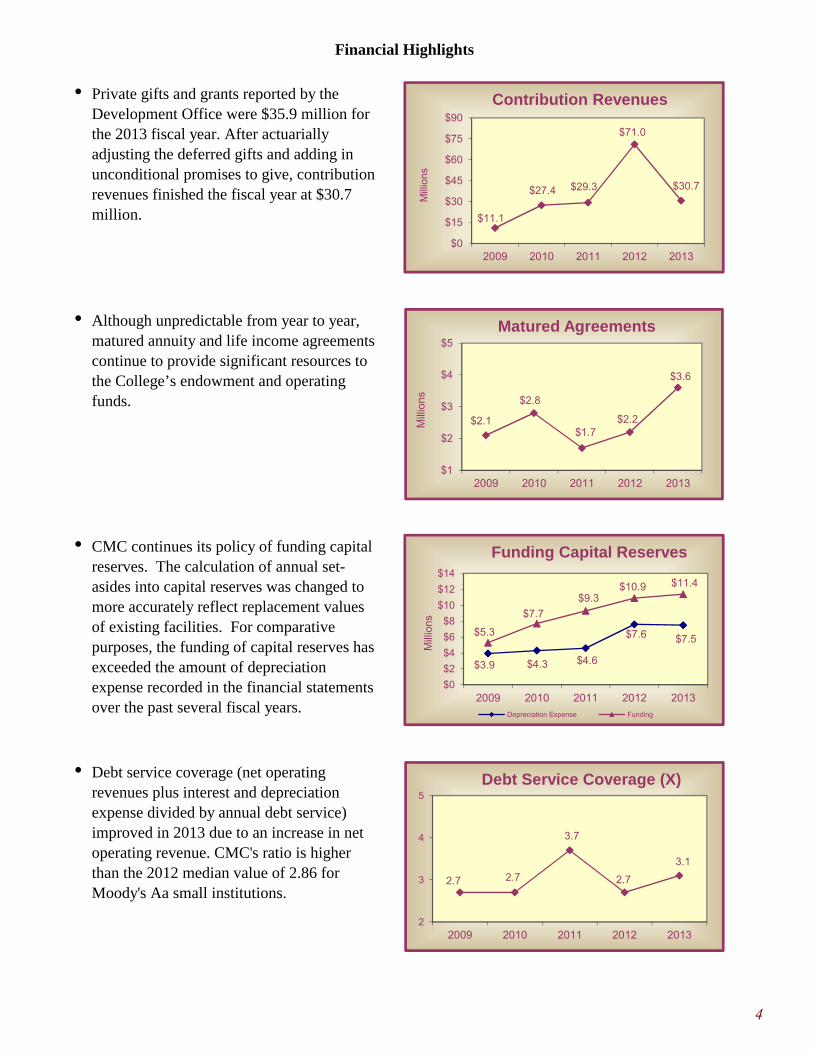
CMC continues its policy of funding capital reserves. The calculation of annual set-asides into capital reserves was changed to more accurately reflect replacement values of existing facilities. For comparative purposes, the funding of capital reserves has exceeded the amount of depreciation expense recorded in the financial statements over the past several fiscal years.
Private gifts and grants reported by the Development Office were $35.9 million for the 2013 fiscal year. After actuarially adjusting the deferred gifts and adding in unconditional promises to give, contribution revenues finished the fiscal year at $30.7 million.
Although unpredictable from year to year, matured annuity and life income agreements continue to provide significant resources to the College’s endowment and operating funds.
Debt service coverage (net operating revenues plus interest and depreciation expense divided by annual debt service) improved in 2013 due to an increase in net operating revenue. CMC's ratio is higher than the 2012 median value of 2.86 for Moody's Aa small institutions.
$11.1
$27.4 $29.3
$71.0
$30.7
$0
$15
$30
$45
$60
$75
$90
2009 2010 2011 2012 2013
Mill
ions
Contribution Revenues
$2.1
$2.8
$1.7$2.2
$3.6
$1
$2
$3
$4
$5
2009 2010 2011 2012 2013
Mill
ions
Matured Agreements
$3.9 $4.3 $4.6
$7.6 $7.5$5.3
$7.7
$9.3$10.9 $11.4
$0
$2
$4
$6
$8
$10
$12
$14
2009 2010 2011 2012 2013
Mill
ions
Funding Capital Reserves
Depreciation Expense Funding
2.7 2.7
3.7
2.7
3.1
2
3
4
5
2009 2010 2011 2012 2013
Debt Service Coverage (X)
4
Office of the Treasurer
Bauer Center, 500 E. Ninth Street, Claremont, California 91711-6400 Tel: 909.621.8116 Fax: 909.607.7655 www.cmc.edu
Member of The Claremont Colleges
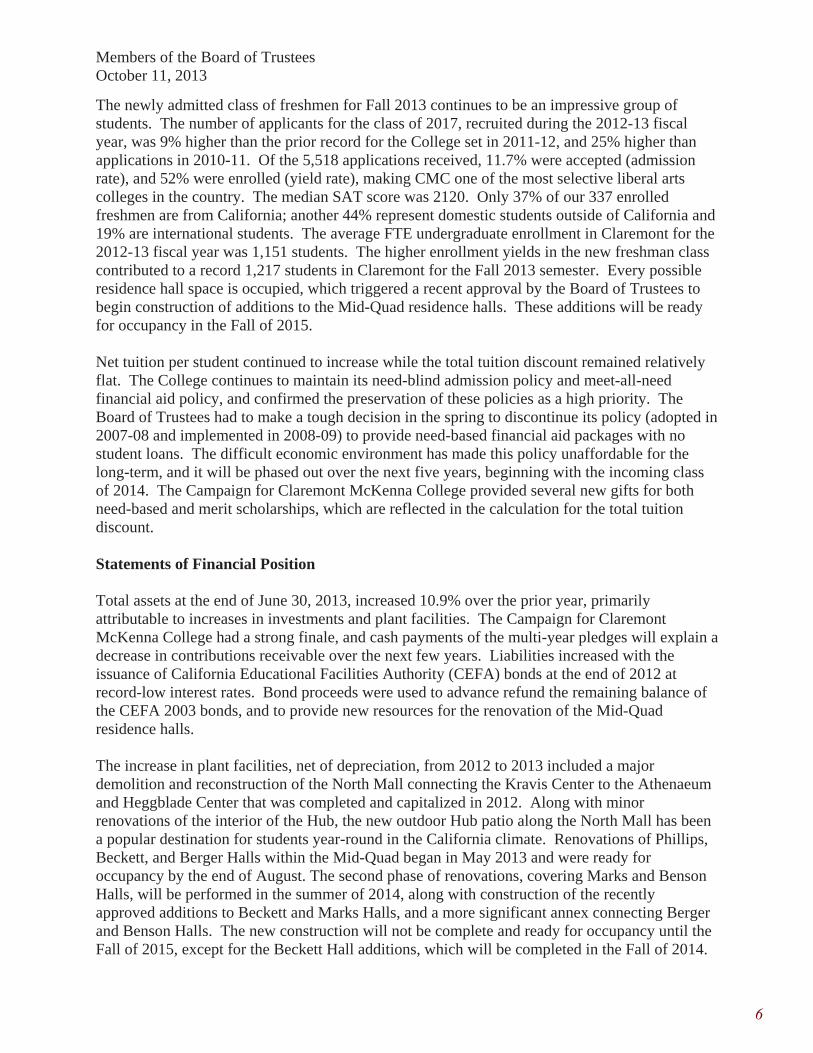
October 11, 2013 Members of the Board of Trustees Claremont McKenna College Claremont, California Ladies and Gentlemen: The fiscal year that ended on June 30, 2013, marked the end of President Pamela Gann’s tenure as the fourth President of Claremont McKenna College. After 14 years in that role, President Gann will spend the next year in preparation for her return to the classroom in the fall of 2014 as the Trustee Professor of Legal Studies and George R. Roberts Fellow. One of the most notable achievements of the fiscal year was the celebration of victory at the end of the Campaign for Claremont McKenna College. The Campaign was formally launched in 2008 with a $600 million goal, and reached $635 million at the end of the fiscal year, which represents the largest amount raised in a campaign to date compared to all other American liberal arts colleges. After an external search, the Board of Trustees announced the appointment of Hiram Chodosh as the next President of CMC. President Chodosh officially assumed his role on July 1, 2013, and has enthusiastically immersed himself in life at the College. Full of new ideas and dreams, President Chodosh has also embraced many CMC traditions, including being “ponded” by students on his birthday, that our relatively young college has shared with him. With the completion of the Campus Master Plan and significant building projects that have transformed the west end of the campus over the past two years, the Board of Trustees approved moving forward with the new Roberts Pavilion to replace the obsolete Ducey Gymnasium. The Roberts Pavilion is expected to make another transformative physical contribution to the campus and is eagerly anticipated by the student body. The new facility will hold up to 2,000 people by using the arena floor for College-hosted major events, and will accommodate fitness and recreational uses for CMC students as well as varsity competitions in the CMS Athletic program. The investment portfolio is the largest asset of the College, and management closely monitors the global economic environment and its effects on financial markets. The return on CMC’s endowment for the year was 17%, net of fees. CMC’s one-year return is tracking near the top of the Cambridge Associates database of preliminary returns for college and university investment pools and is in the top quartile of the same database over the trailing three-, five-, and ten-year periods. In response to the changing economic conditions and expectations of future earnings, the Board of Trustees adopted changes to the College’s spending policy in October 2012, to more conservatively smooth the effects of short-term investment results on the operating budget, and to reduce the spending rate in future years without immediate drastic reductions in operations. The changes will be phased over two years and should be fully implemented with the 2014-15 budget year, barring any drastic changes in the financial markets.
5
Members of the Board of Trustees October 11, 2013
The newly admitted class of freshmen for Fall 2013 continues to be an impressive group of students. The number of applicants for the class of 2017, recruited during the 2012-13 fiscal year, was 9% higher than the prior record for the College set in 2011-12, and 25% higher than applications in 2010-11. Of the 5,518 applications received, 11.7% were accepted (admission rate), and 52% were enrolled (yield rate), making CMC one of the most selective liberal arts colleges in the country. The median SAT score was 2120. Only 37% of our 337 enrolled freshmen are from California; another 44% represent domestic students outside of California and 19% are international students. The average FTE undergraduate enrollment in Claremont for the 2012-13 fiscal year was 1,151 students. The higher enrollment yields in the new freshman class contributed to a record 1,217 students in Claremont for the Fall 2013 semester. Every possible residence hall space is occupied, which triggered a recent approval by the Board of Trustees to begin construction of additions to the Mid-Quad residence halls. These additions will be ready for occupancy in the Fall of 2015.
Net tuition per student continued to increase while the total tuition discount remained relatively flat. The College continues to maintain its need-blind admission policy and meet-all-need financial aid policy, and confirmed the preservation of these policies as a high priority. The Board of Trustees had to make a tough decision in the spring to discontinue its policy (adopted in 2007-08 and implemented in 2008-09) to provide need-based financial aid packages with no student loans. The difficult economic environment has made this policy unaffordable for the long-term, and it will be phased out over the next five years, beginning with the incoming class of 2014. The Campaign for Claremont McKenna College provided several new gifts for both need-based and merit scholarships, which are reflected in the calculation for the total tuition discount.
Statements of Financial Position
Total assets at the end of June 30, 2013, increased 10.9% over the prior year, primarily attributable to increases in investments and plant facilities. The Campaign for Claremont McKenna College had a strong finale, and cash payments of the multi-year pledges will explain a decrease in contributions receivable over the next few years. Liabilities increased with the issuance of California Educational Facilities Authority (CEFA) bonds at the end of 2012 at record-low interest rates. Bond proceeds were used to advance refund the remaining balance of the CEFA 2003 bonds, and to provide new resources for the renovation of the Mid-Quad residence halls.
The increase in plant facilities, net of depreciation, from 2012 to 2013 included a major demolition and reconstruction of the North Mall connecting the Kravis Center to the Athenaeum and Heggblade Center that was completed and capitalized in 2012. Along with minor renovations of the interior of the Hub, the new outdoor Hub patio along the North Mall has been a popular destination for students year-round in the California climate. Renovations of Phillips, Beckett, and Berger Halls within the Mid-Quad began in May 2013 and were ready for occupancy by the end of August. The second phase of renovations, covering Marks and Benson Halls, will be performed in the summer of 2014, along with construction of the recently approved additions to Beckett and Marks Halls, and a more significant annex connecting Berger and Benson Halls. The new construction will not be complete and ready for occupancy until the Fall of 2015, except for the Beckett Hall additions, which will be completed in the Fall of 2014.
6

Members of the Board of Trustees October 11, 2013
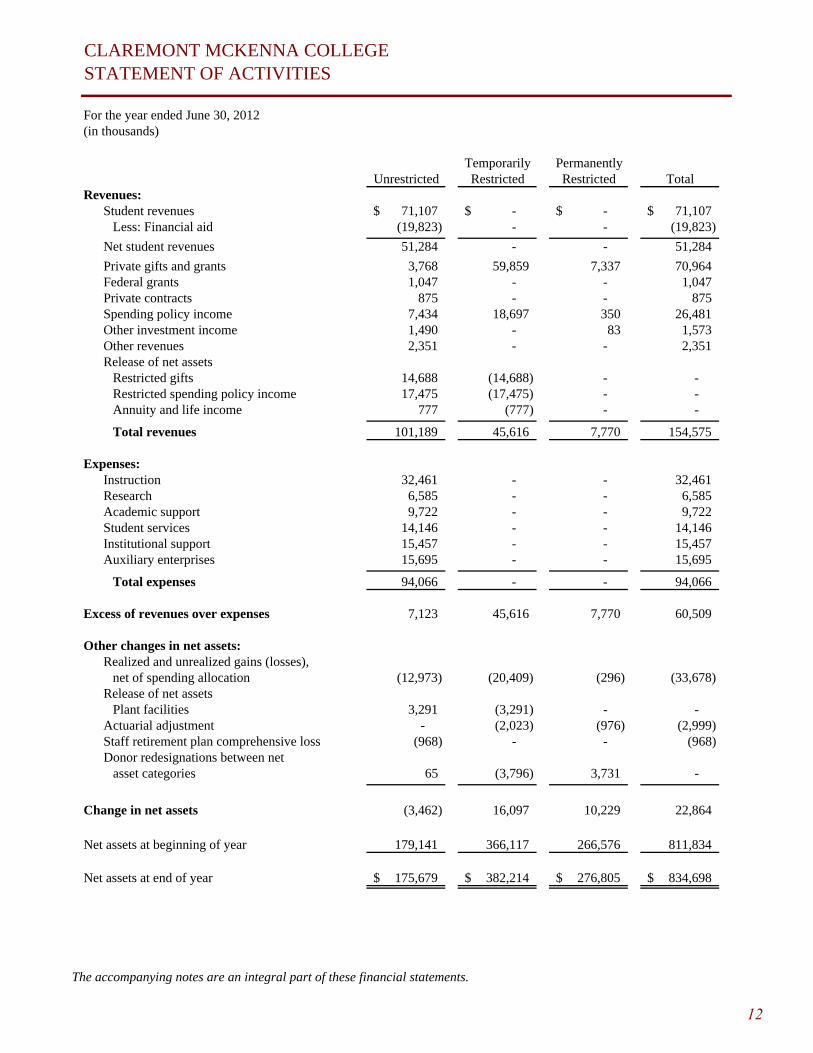
Statement of Activities
The statement of activities provides greater detail of the changes in net assets during the fiscal year. Net assets increased 10% from the prior year, driven by a combination of changes in private gifts and realized and unrealized gains on investments. Total revenues decreased 24.9% from the prior year. A multi-year pledge was received late in the 2012 fiscal year, driving an unusual increase in private gifts for that year.
Total operating expenses increased by 3.7% from the prior year, though there were fluctuations in increases of the various categories of expenses. Employee costs increased 6.2%, representing increases for normal salary adjustments, new positions, and a 7.9% increase in employee benefits, primarily driven by continued increases in health insurance. Additional expenses for interest on CEFA bonds issued during the year were allocated to project-related expense categories.
Positive performance in the financial markets accounted for big swings in the various categories of changes in net assets. In addition to realized and unrealized gains on investments, actuarial adjustments for liabilities in the College’s gift annuity program and changes in the liability for the frozen staff retirement plan are driven by market performance.
The Board of Trustees adopted a new policy for funding its capital reserves. Rather than connecting the funding to the amount of depreciation expense, which is based on the historic cost of the assets, management worked with an outside consultant to develop an extensive inventory of its current facilities. With an end goal of preserving our existing facilities into the future, an integrated facilities plan was developed to track renewal and replacement of the existing facilities and to assign appropriate replacement costs of the assets. An annual transfer of unrestricted net assets is budgeted and transferred to the capital reserves based on the data in the integrated facilities plan to more accurately reflect the replacement values. The plan is updated annually and reviewed by the Buildings & Grounds Committee of the Board of Trustees.
Statements of Cash Flows
Net cash flows increased almost $1.2 million for fiscal year 2013. The net cash used in operating activities of almost $14.9 million and investing activities of $19.8 million was offset by net cash provided by financing activities of almost $36 million. Cash outside of the investment pool continues to be managed using a multi-tiered structure based on the timeline of the expected use of cash, particularly related to the needs for capital projects, and is reviewed regularly by the Finance and Investment Committees of the Board of Trustees.
Summary
The 2012-13 fiscal year was upbeat for CMC, highlighted by the very successful completion of its Campaign for Claremont McKenna College, the positive investment performance, the record-setting admission statistics, and the physical rewards of recent investments in facilities.
CMC publicly acknowledged and thanked President Gann for her numerous accomplishments with a named professorship. As a chapter in CMC’s short history closes, another begins with the welcoming of President Chodosh. The many events of his inaugural celebration took place in
7

Members of the Board of Trustees October 11, 2013
early October 2013 around the theme of “Liberal Arts in Action”, giving the broader CMC community an opportunity to affirm its confidence in all aspects of the CMC leadership as the College takes the next step toward planning for the future.
Respectfully submitted,
Robin J. Aspinall Vice President for Business and Administration and Treasurer
8

REPORTOFINDEPENDENTAUDITORS
TheBoardofTrusteesClaremontMcKennaCollegeReportontheFinancialStatements
WehaveauditedtheaccompanyingfinancialstatementsofClaremontMcKennaCollege,whichcomprisethestatementsof financialpositionasof June30, 2013and2012, and the related statementsof activities andcashflowsfortheyearsthenended,andtherelatednotestothefinancialstatements.Management’sResponsibilityfortheFinancialStatements
Management is responsible for the preparation and fair presentation of these financial statements inaccordancewithaccountingprinciplesgenerallyaccepted intheUnitedStatesofAmerica;this includesthedesign,implementation,andmaintenanceofinternalcontrolrelevanttothepreparationandfairpresentationoffinancialstatementsthatarefreefrommaterialmisstatement,whetherduetofraudorerror.Auditor’sResponsibility
Ourresponsibilityistoexpressanopiniononthesefinancialstatementsbasedonouraudits.WeconductedourauditsinaccordancewithauditingstandardsgenerallyacceptedintheUnitedStatesofAmerica.Thosestandards require thatweplan andperform the audits to obtain reasonable assurance aboutwhether thefinancialstatementsarefreefrommaterialmisstatement.Anauditinvolvesperformingprocedurestoobtainauditevidenceabouttheamountsanddisclosuresinthefinancialstatements.Theproceduresselecteddependontheauditor’sjudgment,includingtheassessmentoftherisksofmaterialmisstatementofthefinancialstatements,whetherduetofraudorerror.Inmakingthoserisk assessments, the auditor considers internal control relevant to the entity’s preparation and fairpresentation of the financial statements in order to design audit procedures that are appropriate in thecircumstances,butnotforthepurposeofexpressinganopinionontheeffectivenessoftheentity’sinternalcontrol.Accordingly,weexpressnosuchopinion.Anauditalso includesevaluating theappropriatenessofaccountingpoliciesusedandthereasonablenessofsignificantaccountingestimatesmadebymanagement,aswellasevaluatingtheoverallpresentationofthefinancialstatements.We believe that the audit evidence obtained is sufficient and appropriate to provide a basis for our auditopinion.Opinion
Inouropinion,thefinancialstatementsreferredtoabovepresentfairly,inallmaterialrespects,thefinancialpositionofClaremontMcKennaCollegeasofJune30,2013and2012,andtheresultsofitsactivitiesanditscashflowsfortheyearsthenendedinaccordancewithaccountingprinciplesgenerallyacceptedintheUnitedStatesofAmerica.
LosAngeles,CaliforniaOctober21,2013
9

CLAREMONT MCKENNA COLLEGESTATEMENTS OF FINANCIAL POSITION
June 30, 2013 and 2012(in thousands)
2013 2012ASSETS
Cash 1,659$ 407$ Accounts and notes receivable, net (Note 2) 16,997 17,050 Prepaid expenses and deposits 5,501 4,641 Contributions receivable, net (Note 3) 206,175 208,529 Beneficial interest in trusts (Note 3) 5,860 5,752 Investments (Note 4) 727,983 622,632 Plant facilities, net (Note 6) 186,499 178,484
Total assets 1,150,674$ 1,037,495$
LIABILITIES AND NET ASSETS
Liabilities:Accounts payable and accrued liabilities 16,124$ 11,688$ Funds held in trust for others 2,853 2,796 Deposits and deferred revenues 1,289 1,041 Staff retirement liability 1,196 2,128 Life income and annuities payable (Note 9) 43,276 42,316 Capital lease obligation (Note 7) 1,072 1,228 Bonds payable (Note 10) 162,349 137,567 Government advances for student loans 3,224 3,217 Asset retirement obligation (Note 8) 847 816
Total liabilities 232,230 202,797
Net Assets (Note 13):Unrestricted 211,540 175,679 Temporarily restricted 413,013 382,214 Permanently restricted 293,891 276,805
Total net assets 918,444 834,698
Total liabilities and net assets 1,150,674$ 1,037,495$
The accompanying notes are an integral part of these financial statements.
10

CLAREMONT MCKENNA COLLEGESTATEMENT OF ACTIVITIES
For the year ended June 30, 2013(in thousands)
Temporarily PermanentlyUnrestricted Restricted Restricted Total
Revenues:Student revenues 72,995$ -$ -$ 72,995$
Less: Financial aid (20,355) - - (20,355)
Net student revenues (Note 15) 52,640 - - 52,640
Private gifts and grants 3,675 18,970 8,057 30,702 Federal grants 910 - - 910 Private contracts 658 - - 658 Spending policy income 7,599 19,340 323 27,262 Other investment income 1,790 - 191 1,981 Other revenues 1,958 - - 1,958 Release of net assets
Restricted gifts 20,743 (20,743) - - Restricted spending policy income 18,259 (18,259) - - Annuity and life income 365 (365) - -
Total revenues 108,597 (1,057) 8,571 116,111
Expenses:Instruction 34,490 - - 34,490 Research 7,459 - - 7,459 Academic support 8,598 - - 8,598 Student services 13,985 - - 13,985 Institutional support 16,243 - - 16,243 Auxiliary enterprises 16,787 - - 16,787
Total expenses 97,562 - - 97,562
Excess of revenues over expenses 11,035 (1,057) 8,571 18,549
Other changes in net assets:Realized and unrealized gains (losses),
net of spending allocation 22,864 36,911 313 60,088 Release of net assets
Plant facilities 1,145 (1,145) - - Actuarial adjustment - 2,567 1,777 4,344 Staff retirement plan comprehensive gain 765 - - 765 Donor redesignations between net
asset categories 52 (6,477) 6,425 -
Change in net assets 35,861 30,799 17,086 83,746
Net assets at beginning of year 175,679 382,214 276,805 834,698
Net assets at end of year 211,540$ 413,013$ 293,891$ 918,444$
The accompanying notes are an integral part of these financial statements.
11
CLAREMONT MCKENNA COLLEGESTATEMENT OF ACTIVITIES
For the year ended June 30, 2012(in thousands)
Temporarily PermanentlyUnrestricted Restricted Restricted Total
Revenues:Student revenues 71,107$ -$ -$ 71,107$
Less: Financial aid (19,823) - - (19,823)
Net student revenues 51,284 - - 51,284
Private gifts and grants 3,768 59,859 7,337 70,964 Federal grants 1,047 - - 1,047 Private contracts 875 - - 875 Spending policy income 7,434 18,697 350 26,481 Other investment income 1,490 - 83 1,573 Other revenues 2,351 - - 2,351 Release of net assets
Restricted gifts 14,688 (14,688) - - Restricted spending policy income 17,475 (17,475) - - Annuity and life income 777 (777) - -
Total revenues 101,189 45,616 7,770 154,575
Expenses:Instruction 32,461 - - 32,461 Research 6,585 - - 6,585 Academic support 9,722 - - 9,722 Student services 14,146 - - 14,146 Institutional support 15,457 - - 15,457 Auxiliary enterprises 15,695 - - 15,695
Total expenses 94,066 - - 94,066
Excess of revenues over expenses 7,123 45,616 7,770 60,509
Other changes in net assets:Realized and unrealized gains (losses),
net of spending allocation (12,973) (20,409) (296) (33,678) Release of net assets
Plant facilities 3,291 (3,291) - - Actuarial adjustment - (2,023) (976) (2,999) Staff retirement plan comprehensive loss (968) - - (968) Donor redesignations between net
asset categories 65 (3,796) 3,731 -
Change in net assets (3,462) 16,097 10,229 22,864
Net assets at beginning of year 179,141 366,117 266,576 811,834
Net assets at end of year 175,679$ 382,214$ 276,805$ 834,698$
The accompanying notes are an integral part of these financial statements.
12

CLAREMONT MCKENNA COLLEGESTATEMENTS OF CASH FLOWS
For the years ended June 30, 2013 and June 30, 2012(in thousands)
2013 2012Cash flows from operating activities:
Change in net assets 83,746$ 22,864$ Adjustments to reconcile change in net assets to net cash used in operating activities:
Depreciation expense 7,498 7,563 Amortization and accretion expense (115) 19 Loss on disposal of plant facilities 36 1,498 Allowance for doubtful student loan accounts 24 32 Comprehensive (gain)/loss on staff retirement plan (765) 968 Discount on life income contract gifts (3,140) (2,878) Realized and unrealized (gain)/loss on investments (91,636) 7,600 Loss on debt defeasance 18 232 Non-cash gifts (8,826) (1,700) Adjustment of actuarial liability for annuities payable 6,298 7,044 Decrease/(increase) in accounts and contributions receivable 2,564 (43,164) Decrease/(increase) in beneficial interest in trusts (108) (501) Decrease/(increase) in prepaid expenses and deposits (860) (77) (Decrease)/increase in accounts payable and accrued liabilities 4,436 (2,767) (Decrease)/increase in funds held in trust for others 57 (13) (Decrease)/increase in deposits and deferred revenues 248 (174) Contributions restricted for long-term investments (14,199) (10,049) Defined benefit plan contributions over expense (167) (252)
Net cash (used in)/provided by operating activities (14,891) (13,755)
Cash flows from investing activities:Purchase of plant facilities (15,396) (12,064) Purchases of investments (638,508) (424,237) Proceeds from sales of investments 634,271 443,872 Loans made to students and employees (2,367) (1,846) Collection of student and employee loans 2,185 2,177
Net cash (used in)/provided by investing activities (19,815) 7,902
Cash flows from financing activities:Payments to annuity and life income beneficiaries (4,742) (5,224) Investment income for annuity and life income investments 1,892 2,110 Proceeds from borrowings 26,021 - Principal payments for borrowings (1,418) (1,272) Contributions restricted for life income contracts 4,018 3,513 Contributions restricted for endowment 9,909 6,273 Contributions restricted for plant expenditures and student loans 272 263 Increase/(decrease) in government advances for student loans 6 10
Net cash (used in)/provided by financing activities 35,958 5,673
Net (decrease)/increase in cash 1,252 (180)
Cash at beginning of year 407 587
Cash at end of year 1,659$ 407$
Supplemental disclosure of cash flows:Interest paid 7,171$ 6,696$
Supplemental disclosure of noncash financing activity:Capital lease obligation 152$ 494$
The accompanying notes are an integral part of these financial statements.
13
CLAREMONT MCKENNA COLLEGENOTES TO THE FINANCIAL STATEMENTS
June 30, 2013 and 2012
NOTE 1 - SUMMARY OF SIGNIFICANT ACCOUNTING POLICIES:
Basis of Presentation:
Net Asset Categories:
Revenue Recognition:
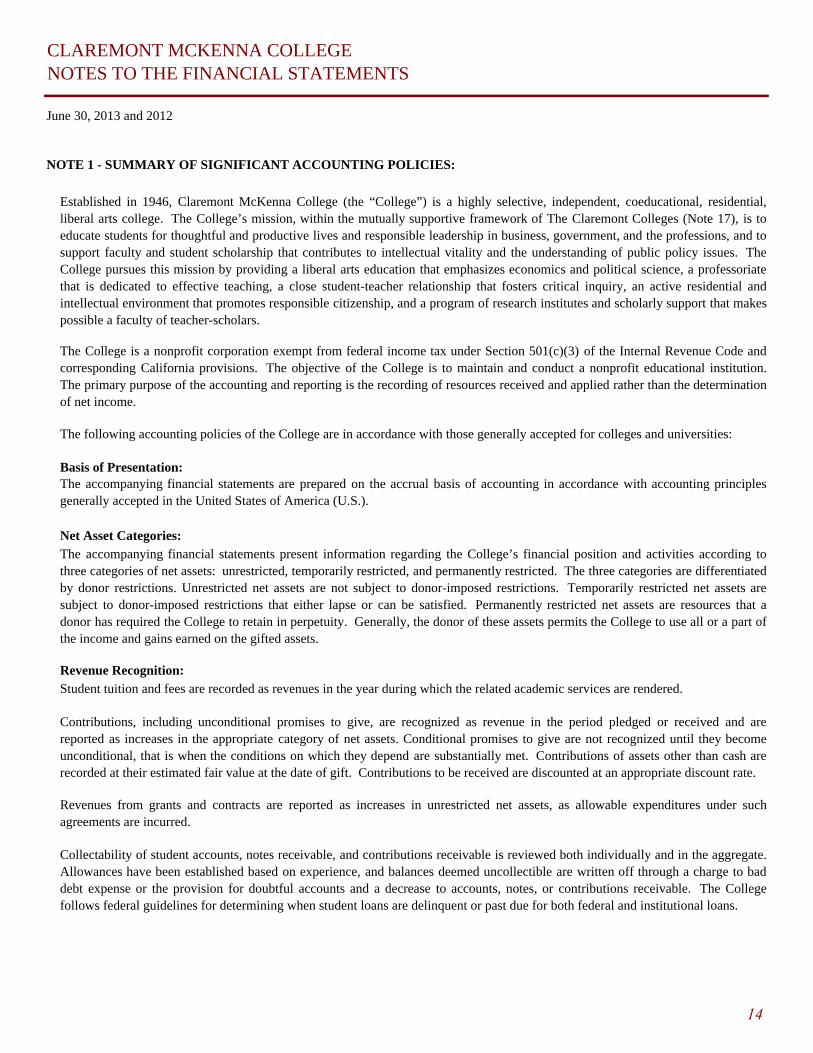
Established in 1946, Claremont McKenna College (the “College”) is a highly selective, independent, coeducational, residential,liberal arts college. The College’s mission, within the mutually supportive framework of The Claremont Colleges (Note 17), is toeducate students for thoughtful and productive lives and responsible leadership in business, government, and the professions, and tosupport faculty and student scholarship that contributes to intellectual vitality and the understanding of public policy issues. TheCollege pursues this mission by providing a liberal arts education that emphasizes economics and political science, a professoriatethat is dedicated to effective teaching, a close student-teacher relationship that fosters critical inquiry, an active residential andintellectual environment that promotes responsible citizenship, and a program of research institutes and scholarly support that makespossible a faculty of teacher-scholars.
The College is a nonprofit corporation exempt from federal income tax under Section 501(c)(3) of the Internal Revenue Code andcorresponding California provisions. The objective of the College is to maintain and conduct a nonprofit educational institution.The primary purpose of the accounting and reporting is the recording of resources received and applied rather than the determinationof net income.
The following accounting policies of the College are in accordance with those generally accepted for colleges and universities:
The accompanying financial statements are prepared on the accrual basis of accounting in accordance with accounting principlesgenerally accepted in the United States of America (U.S.).
The accompanying financial statements present information regarding the College’s financial position and activities according tothree categories of net assets: unrestricted, temporarily restricted, and permanently restricted. The three categories are differentiatedby donor restrictions. Unrestricted net assets are not subject to donor-imposed restrictions. Temporarily restricted net assets aresubject to donor-imposed restrictions that either lapse or can be satisfied. Permanently restricted net assets are resources that adonor has required the College to retain in perpetuity. Generally, the donor of these assets permits the College to use all or a part ofthe income and gains earned on the gifted assets.
Student tuition and fees are recorded as revenues in the year during which the related academic services are rendered.
Collectability of student accounts, notes receivable, and contributions receivable is reviewed both individually and in the aggregate.Allowances have been established based on experience, and balances deemed uncollectible are written off through a charge to baddebt expense or the provision for doubtful accounts and a decrease to accounts, notes, or contributions receivable. The Collegefollows federal guidelines for determining when student loans are delinquent or past due for both federal and institutional loans.
Revenues from grants and contracts are reported as increases in unrestricted net assets, as allowable expenditures under suchagreements are incurred.
Contributions, including unconditional promises to give, are recognized as revenue in the period pledged or received and arereported as increases in the appropriate category of net assets. Conditional promises to give are not recognized until they becomeunconditional, that is when the conditions on which they depend are substantially met. Contributions of assets other than cash arerecorded at their estimated fair value at the date of gift. Contributions to be received are discounted at an appropriate discount rate.
14

CLAREMONT MCKENNA COLLEGENOTES TO THE FINANCIAL STATEMENTS
June 30, 2013 and 2012
NOTE 1 – SUMMARY OF SIGNIFICANT ACCOUNTING POLICIES: Continued
Release of Donor-Imposed Restrictions:
Allocation of Certain Expenses:
Cash:
Cash Held in Separate Accounts:
Concentration of Credit Risk:
Investments:
The expiration of a donor-imposed restriction on a contribution or on endowment income is recognized in the period in which therestriction substantially expires. At that time, the related resources are reclassified to unrestricted net assets. A restriction expireswhen the stipulated time period has elapsed, when the stipulated purpose for which the resource was restricted has been fulfilled, orwhen unexpended endowment earnings are appropriated by the Board of Trustees. It is the College’s policy to release therestrictions on contributions of cash or other assets received for the acquisition of long-lived assets when the long-lived assets areplaced into service.
Certain amounts previously received from donors have been transferred among net asset categories due to changes in donorrestrictions.
Expenses are generally reported as decreases in unrestricted net assets. The Statements of Activities present expenses by functionalclassification. Depreciation and the cost of operation and maintenance of plant facilities are allocated to functional categories basedon building square footage dedicated to that specific function. Interest expense is allocated based on the use of the relatedborrowings.
For the purposes of reporting cash flows, cash includes demand deposit bank accounts. Resources invested in money market fundsare classified as cash equivalents, except that any such investments managed as part of the investment pool are classified asinvestments.
The California Student Aid Commission requires institutions participating in the Cal Grant program to maintain funds advanced in aseparate interest bearing account to properly handle and manage the funds. The funds are the property of the State, and unspentfunds are to be returned according to the State's required timelines along with interest earned.
Financial instruments that potentially subject the College to concentrations of credit risk consist principally of cash deposits atfinancial institutions and investments in marketable securities. At times, balances in the College’s cash and investment accountsexceed the Federal Deposit Insurance Corporation (FDIC) or Securities Investors Protection Corporation (SIPC) insured limits. Concentration of credit risk with respect to receivables are limited due to the large number of students from which amounts are due,with no one account being significant.
Where permitted by law, the College pools investments for management purposes. The remainder of investments are managed asseparate investments. Marketable securities are reported at fair market value. Non-marketable investments are carried at estimatedfair value provided by the management of the non-marketable investment partnerships or funds at June 30, 2013 and 2012. TheCollege reviews and evaluates the values provided by the investment managers and agrees with the valuation methods andassumptions used in determining the fair value of the investments. Because non-marketable investments are not readily marketable,the estimated value is subject to uncertainty and such differences could be material.
15
CLAREMONT MCKENNA COLLEGENOTES TO THE FINANCIAL STATEMENTS
June 30, 2013 and 2012
NOTE 1 – SUMMARY OF SIGNIFICANT ACCOUNTING POLICIES: Continued
Investments: Continued
Derivatives:
Management of Pooled Investments:
Endowment Funds:
The cost of securities sold is determined by the average cost method and is used to compute realized gains and losses. Unrealizedgains and losses reflect the changes in the market values of investments from the prior year. Investment income and gains and losseson investments are reported as increases or decreases in unrestricted net assets unless their use is temporarily or permanentlyrestricted by explicit donor stipulation or by law. The date of record for investments is the trade date.
Certain investments held by the College may include derivative instruments as part of their investment strategy, but the College doesnot invest directly in derivatives.
The College follows an investment policy which anticipates a greater long term return through investing for capital appreciation, andaccepts lower current yields from dividends and interest. In order to offset the effect of lower current yields for current operations,the Board of Trustees has adopted a spending policy for pooled investments. The amount of investment return available for currentoperations is determined by applying an increase of 4.0% to the prior year unit spending rate, provided that the resulting calculationfalls within a collar of 4.5% to 5.5% of a twelve quarter average unit market value. If the ordinary income portion of pooledinvestments return is insufficient to provide the full amount of investment return specified, the balance may be appropriated fromrealized gains of the pooled investments. Cumulative net realized gains and transfers of ordinary income in excess of the spendingpolicy (“cumulative gains”) are held in their respective net asset categories and are available for appropriation under the College’sspending policy. At June 30, 2013 and 2012, these cumulative gains totaled approximately $83,710,000 and $74,942,000,respectively. The Board of Trustees may, at its discretion, approve additional spending for special projects. The Board of Trusteesadopted a new investment policy in October 2012. The amount of investment return available for curent operations will bedetermined by applying an increase of 2.0% to the prior year unit spending rate, provided that the resulting calculation falls within acollar of 4.5% to 5.5% of a twenty quarter average unit market value.
The Board of Trustees of the College interpreted the California Uniform Prudent Management of Institutional Funds Act (UPMIFA)to state that the College, in the absence of explicit donor stipulations to the contrary, may appropriate for expenditure or accumulateso much of an endowment fund as the College determines prudent for the uses, benefits, purposes, and duration for which theendowment fund is established. As a result of this interpretation, the College classifies as permanently restricted net assets theoriginal value of gifts donated to the endowment, original value of subsequent gifts to the endowment, and accumulations to theendowment made in accordance with the direction of the applicable donor gift instrument. The remaining portion of the donor-restricted endowment fund that is not classified in permanently restricted net assets is classified as temporarily restricted net assetsuntil those amounts are appropriated for expenditure by the College in a manner consistent with the standard of prudence prescribedby UPMIFA which includes the:
(1) Duration and preservation of the fund
(2) Mission of the College and the donor-restricted endowment fund
(3) General economic conditions
(4) Possible effects of inflation and deflation
(5) Expected total return from income and appreciation of investments
(6) Other resources of the College
(7) Investment policy of the College.
16
CLAREMONT MCKENNA COLLEGENOTES TO THE FINANCIAL STATEMENTS
June 30, 2013 and 2012
NOTE 1 – SUMMARY OF SIGNIFICANT ACCOUNTING POLICIES: Continued
Plant Facilities:
Annuity and Life Income Contracts and Agreements:
Income Taxes:
Use Of Estimates:
The College has legal title to annuity and life income contracts and agreements subject to life interests of beneficiaries. Nosignificant financial benefit is now being or can be realized until the contractual obligations are released. However, the costs ofmanaging these contracts and agreements are included in unrestricted expenses.
The College uses the actuarial method of recording annuity and life income contracts and agreements. Under this method, the assetis recorded at fair value when a gift is received. The present value of the aggregate annuity payable is recorded as a liability, basedupon life expectancy tables, and the remainder is recorded as a contribution in the appropriate net asset category. The liabilityaccount is credited with investment income and gains and is charged with investment losses and payments to beneficiaries. Periodicadjustments are made between the liability account and the net asset account for actuarial gains and losses. The actuarial liability isbased on the present value of future payments discounted at rates ranging from 1.2% to 7.6% and over estimated lives according tothe Annuity 2000 Mortality Tables.
The College is subject to additional legally mandated annuity reserve requirements by the State of California on its California giftannuity contracts. On December 2, 1998, the Insurance Commission Chief Counsel granted the College permission to invest itsreserves for California annuities pursuant to Insurance Code Section 11521.2(b). This approval is subject to the followingconditions: (1) maintain a nationally recognized statistical organization bond rating of “A” or better and (2) maintain an endowmentto gift annuity ratio of at least 10:1.
Plant facilities consist of property, plant, and equipment which are stated at cost, representing the original purchase price or the fairmarket value at the date of the gift, less accumulated depreciation computed on a straight-line basis over the estimated useful lives ofbuildings, permanent improvements, and equipment. Plant purchases with a useful life of five years or more and a cost equal to orgreater than $100,000 for land improvements and buildings and $25,000 for equipment are capitalized. Estimated useful lives aregenerally 7 years for equipment, 50 years for buildings and 25 years for permanent improvements. Building improvements thatextend the remaining useful life of the building will be depreciated over a period not to exceed 20 years. Assets are retired at theircost less accumulated depreciation at the time they are sold, impaired, or no longer in use. Each year the College transfers to itscapital project reserves an amount to allow for the preservation of its existing facilities into the future. Asset retirement obligationsare recorded based on estimated settlement dates and methods.
No significant property or equipment has been pledged as collateral or otherwise subject to lien for the years ended June 30, 2013and 2012. Proceeds from the disposal of equipment acquired with federal funds will be transferred to the federal awarding agency.No property or equipment has been acquired with restricted assets where title may revert to another party.
The College had no unrecognized tax benefits and/or obligations at June 30, 2013 and 2012.
The preparation of financial statements in conformity with accounting principles generally accepted in the U.S. requires managementto make estimates and assumptions that affect the reported amounts of assets and liabilities and disclosure of contingent assets andliabilities at the date of the financial statements and the reported amounts of revenues and expenses during the reporting period.Actual results could differ from those estimates.
17

CLAREMONT MCKENNA COLLEGENOTES TO THE FINANCIAL STATEMENTS
June 30, 2013 and 2012
NOTE 1 – SUMMARY OF SIGNIFICANT ACCOUNTING POLICIES: Continued
Fair Value of Financial Instruments:
Investments in cash equivalents, mutual funds, and certain domestic and international equities are valued based on quoted marketprices, and are therefore typically classified within Level 1.
Investments in fixed income and other investment funds valued using net asset value per share (NAV) or its equivalent as reportedby investment managers, which are audited under AICPA guidelines and that have trading activity and the ability to redeem at NAVon or near the reporting date, are included within Level 2.
Certain investments in hedge funds, private equity funds, or other private investments, and the College's beneficial interest in trustsvalued utilizing unobservable inputs, and which have had no trading activity or cannot be redeemed at NAV or its equivalent on ornear the reporting date are therefore classified within Level 3. These assets are presented in the accompanying financial statements atfair value. The College’s determination of fair value is based upon the best available information provided by the investmentmanager and may incorporate management assumptions and best estimates after considering a variety of internal and externalfactors. Such value generally represents the College’s proportionate share of the partner’s capital of the investment partnerships asreported by their general partners. For these investments, the College, through its monitoring activities, agrees with the fair marketvalue as determined by the investment managers.
Inputs are used in applying the valuation techniques and broadly refer to the assumptions that the College uses to make valuationdecisions, including assumptions about risk. Inputs may include quoted market prices, recent transactions, manager statements,periodicals, newspapers, provisions within agreements with investment managers and other factors. An investment’s level within thefair value hierarchy is based on the lowest level of any input that is significant to the fair value measurement. The categorization ofan investment within the hierarchy is based upon the pricing transparency of the investment and does not necessarily correspond tothe College’s perceived risk of that investment.
A financial instrument is defined as a contractual obligation that ultimately ends with the delivery of cash or an ownership interest inan entity. Disclosures included in these notes regarding the fair value of financial instruments have been derived using externalmarket sources, estimates using present value or other valuation techniques. Determination of the fair value of notes receivables,which are primarily federally sponsored student loans with the U.S. government, mandated interest rates and repayment terms aresubject to significant restrictions as to their transfer or disposition, and is not practical because such a determination cannot be madewithout incurring excessive costs.
The College carries most investments at fair value in accordance with generally accepted accounting principles. Fair value isdefined as the price that would be received to sell an asset (i.e. the "exit price") in an orderly transaction between market participantsat the measurement date. Accounting standards have established a fair value hierarchy that prioritizes the inputs to valuationtechniques used to measure fair value.
The hierarchy gives the highest priority to unadjusted quoted prices in active markets for identical assets or liabilities (Level 1 measurements) and the lowest priority to unobservable inputs (Level 3 measurements).
The three levels of the fair value hierarchy are as follows:
Level 1 – Inputs that reflect unadjusted quoted prices in active markets for identical assets or liabilities that the College has theability to access at the measurement date;Level 2 – Inputs other than quoted prices that are observable for the asset either directly or indirectly, including inputs in marketsthat are not considered to be active;Level 3 – Inputs that are unobservable.
18
CLAREMONT MCKENNA COLLEGENOTES TO THE FINANCIAL STATEMENTS
June 30, 2013 and 2012(in thousands)
NOTE 1 – SUMMARY OF SIGNIFICANT ACCOUNTING POLICIES: Continued
Fair Value of Financial Instruments: Continued
Reclassifications:
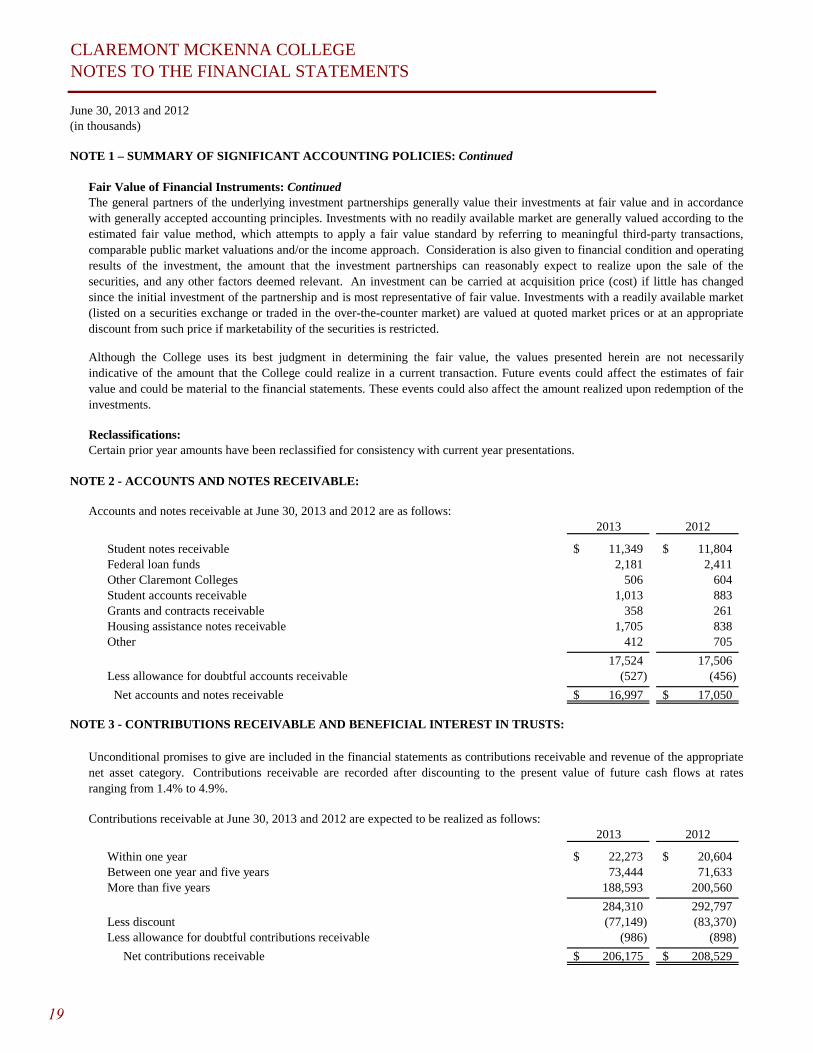
NOTE 2 - ACCOUNTS AND NOTES RECEIVABLE:
2013 2012
Student notes receivable 11,349$ 11,804$ Federal loan funds 2,181 2,411 Other Claremont Colleges 506 604 Student accounts receivable 1,013 883 Grants and contracts receivable 358 261 Housing assistance notes receivable 1,705 838 Other 412 705
17,524 17,506 Less allowance for doubtful accounts receivable (527) (456)
Net accounts and notes receivable 16,997$ 17,050$
NOTE 3 - CONTRIBUTIONS RECEIVABLE AND BENEFICIAL INTEREST IN TRUSTS:
2013 2012
Within one year 22,273$ 20,604$ Between one year and five years 73,444 71,633 More than five years 188,593 200,560
284,310 292,797 Less discount (77,149) (83,370) Less allowance for doubtful contributions receivable (986) (898)
Net contributions receivable 206,175$ 208,529$
Certain prior year amounts have been reclassified for consistency with current year presentations.
Contributions receivable at June 30, 2013 and 2012 are expected to be realized as follows:
The general partners of the underlying investment partnerships generally value their investments at fair value and in accordancewith generally accepted accounting principles. Investments with no readily available market are generally valued according to theestimated fair value method, which attempts to apply a fair value standard by referring to meaningful third-party transactions,comparable public market valuations and/or the income approach. Consideration is also given to financial condition and operatingresults of the investment, the amount that the investment partnerships can reasonably expect to realize upon the sale of thesecurities, and any other factors deemed relevant. An investment can be carried at acquisition price (cost) if little has changedsince the initial investment of the partnership and is most representative of fair value. Investments with a readily available market(listed on a securities exchange or traded in the over-the-counter market) are valued at quoted market prices or at an appropriatediscount from such price if marketability of the securities is restricted.
Although the College uses its best judgment in determining the fair value, the values presented herein are not necessarilyindicative of the amount that the College could realize in a current transaction. Future events could affect the estimates of fairvalue and could be material to the financial statements. These events could also affect the amount realized upon redemption of theinvestments.
Accounts and notes receivable at June 30, 2013 and 2012 are as follows:
Unconditional promises to give are included in the financial statements as contributions receivable and revenue of the appropriatenet asset category. Contributions receivable are recorded after discounting to the present value of future cash flows at ratesranging from 1.4% to 4.9%.
19
CLAREMONT MCKENNA COLLEGENOTES TO THE FINANCIAL STATEMENTS
June 30, 2013 and 2012(in thousands)
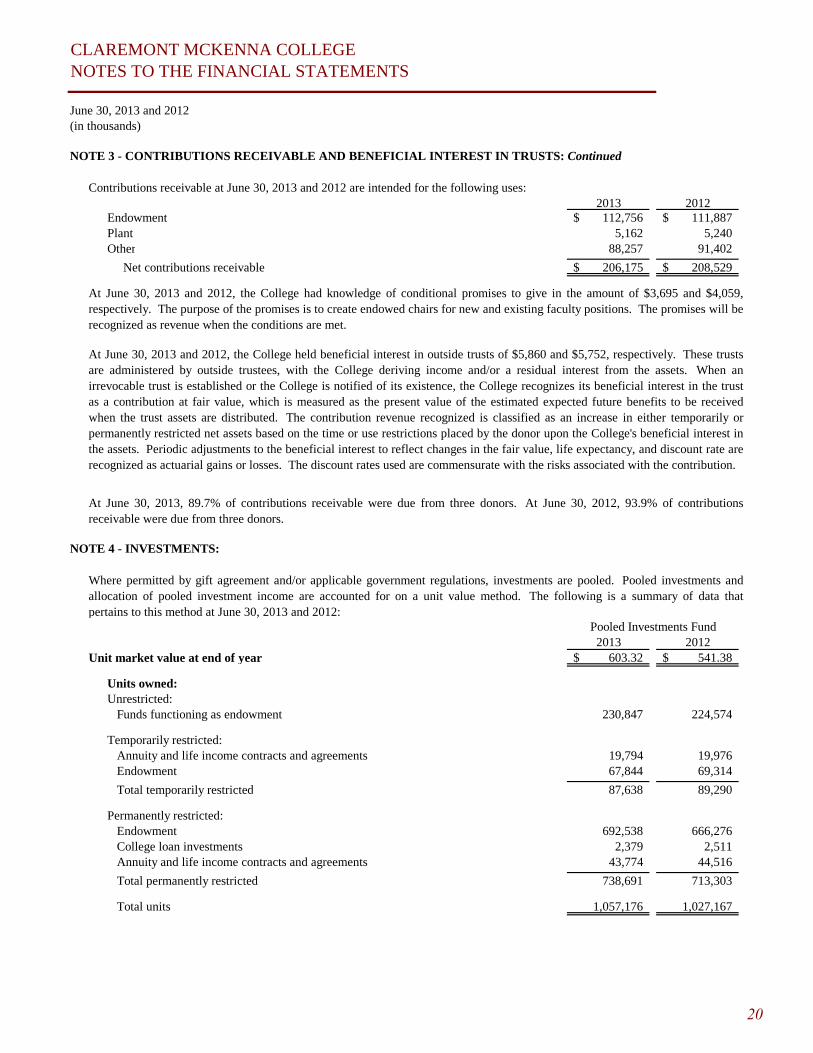
NOTE 3 - CONTRIBUTIONS RECEIVABLE AND BENEFICIAL INTEREST IN TRUSTS: Continued
2013 2012Endowment 112,756$ 111,887$ Plant 5,162 5,240 Other 88,257 91,402
Net contributions receivable 206,175$ 208,529$
NOTE 4 - INVESTMENTS:
2013 2012Unit market value at end of year 603.32$ 541.38$
Units owned:Unrestricted: Funds functioning as endowment 230,847 224,574
Temporarily restricted: Annuity and life income contracts and agreements 19,794 19,976 Endowment 67,844 69,314
Total temporarily restricted 87,638 89,290
Permanently restricted: Endowment 692,538 666,276 College loan investments 2,379 2,511 Annuity and life income contracts and agreements 43,774 44,516
Total permanently restricted 738,691 713,303
Total units 1,057,176 1,027,167
At June 30, 2013 and 2012, the College had knowledge of conditional promises to give in the amount of $3,695 and $4,059,respectively. The purpose of the promises is to create endowed chairs for new and existing faculty positions. The promises will berecognized as revenue when the conditions are met.
At June 30, 2013 and 2012, the College held beneficial interest in outside trusts of $5,860 and $5,752, respectively. These trustsare administered by outside trustees, with the College deriving income and/or a residual interest from the assets. When anirrevocable trust is established or the College is notified of its existence, the College recognizes its beneficial interest in the trustas a contribution at fair value, which is measured as the present value of the estimated expected future benefits to be receivedwhen the trust assets are distributed. The contribution revenue recognized is classified as an increase in either temporarily orpermanently restricted net assets based on the time or use restrictions placed by the donor upon the College's beneficial interest inthe assets. Periodic adjustments to the beneficial interest to reflect changes in the fair value, life expectancy, and discount rate arerecognized as actuarial gains or losses. The discount rates used are commensurate with the risks associated with the contribution.
At June 30, 2013, 89.7% of contributions receivable were due from three donors. At June 30, 2012, 93.9% of contributionsreceivable were due from three donors.
Where permitted by gift agreement and/or applicable government regulations, investments are pooled. Pooled investments andallocation of pooled investment income are accounted for on a unit value method. The following is a summary of data thatpertains to this method at June 30, 2013 and 2012:
Contributions receivable at June 30, 2013 and 2012 are intended for the following uses:
Pooled Investments Fund
20

CLAREMONT MCKENNA COLLEGENOTES TO THE FINANCIAL STATEMENTS
June 30, 2013 and 2012(in thousands)
NOTE 4 - INVESTMENTS: Continued
Amounts allocated in accordance with spending policy for pooled investments: 2013 2012Net pooled investment income 2,568$ 1,731$ Pooled investment gains appropriated 26,492 26,539
Total spending policy income and gains 29,060 28,270
Other investment income 1,981 1,573 Less amounts allocated to annuity and life income contracts and agreements (1,798) (1,789)
Total investment income 29,243$ 28,054$
Realized and unrealized gains/(losses), net of spending allocation 60,088 (33,678)
Total investment returns 89,331$ (5,624)$
2013 2012Cash equivalents 20,119$ 14,753$ Domestic equities 173,450 161,169 International equities 145,619 122,068 Domestic treasuries 26,501 26,846 Global fixed income 87,869 76,929 Assets whose use is limited (Note 11) 27,881 3,371 Private investments: Long/short equity 44,764 23,592 Absolute return funds 82,708 79,525 Private equity and venture capital 71,019 71,141 Real estate, energy, and timber 48,053 43,238
Total investments 727,983$ 622,632$
By category: 2013 2012Endowment and funds functioning as endowment: Pooled investments 598,024$ 519,814$ Separately invested 1,123 769
Total endowment and funds functioning as endowment 599,147 520,583
Annuity and life income contracts: Pooled investments 38,352$ 34,915$ Separately invested 14,403 15,003
Total annuity and life income contracts and agreements 52,755 49,918
Other: Pooled 1,435$ 1,360$ Separately invested 74,646 50,771 Total other 76,081 52,131
Total by category 727,983$ 622,632$
It is the College's policy to establish and maintain a diversified investment portfolio. The carrying value of investments are basedon the quoted market prices, analytical pricing methods for investments for which there is no market, and the carrying value oflimited partnership net assets in proportion to the College's interest. The carrying values are considered fair values, except for realestate and other investments. The following schedule summarizes the assets in pooled investments and the assets held as separateinvestments at June 30, 2013 and 2012:
Investment income related to College investments for the years ended June 30, 2013 and 2012, net of management and custodyfees of $4,117 and $3,825, respectively, is as follows:
21
CLAREMONT MCKENNA COLLEGENOTES TO THE FINANCIAL STATEMENTS
June 30, 2013 and 2012(in thousands)
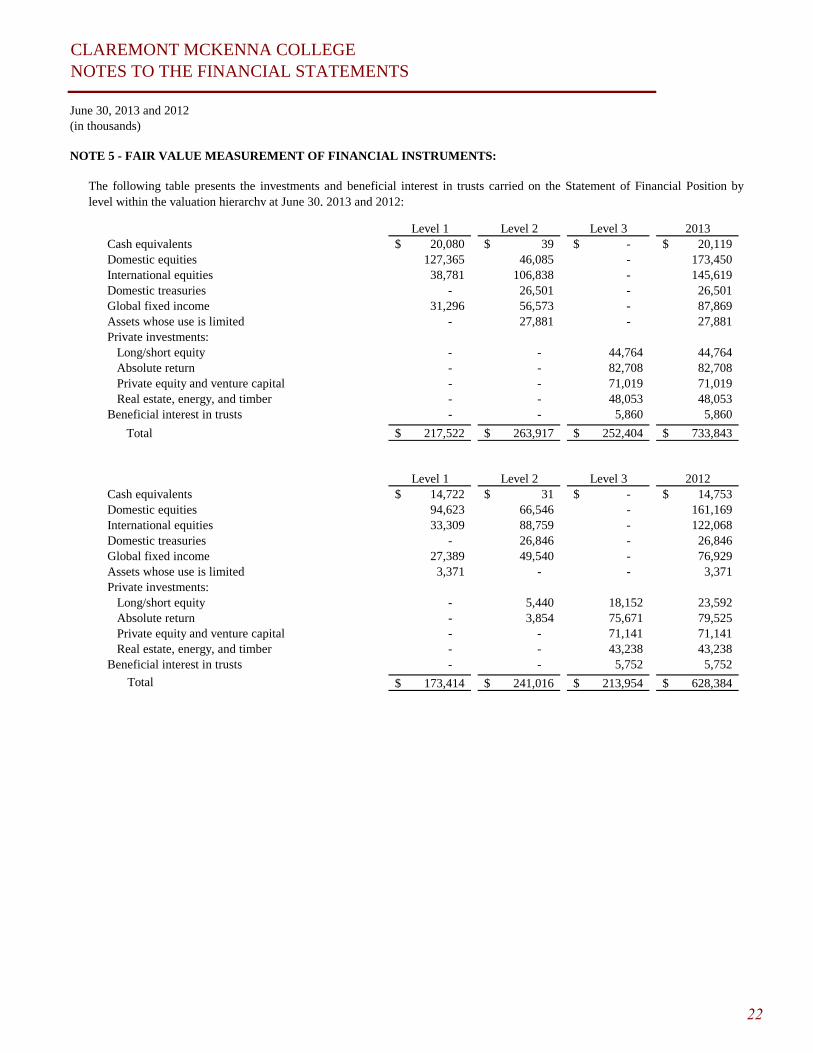
NOTE 5 - FAIR VALUE MEASUREMENT OF FINANCIAL INSTRUMENTS:
Level 1 Level 2 Level 3 2013Cash equivalents 20,080$ 39$ -$ 20,119$ Domestic equities 127,365 46,085 - 173,450 International equities 38,781 106,838 - 145,619 Domestic treasuries - 26,501 - 26,501 Global fixed income 31,296 56,573 - 87,869 Assets whose use is limited - 27,881 - 27,881 Private investments: Long/short equity - - 44,764 44,764 Absolute return - - 82,708 82,708 Private equity and venture capital - - 71,019 71,019 Real estate, energy, and timber - - 48,053 48,053 Beneficial interest in trusts - - 5,860 5,860
Total 217,522$ 263,917$ 252,404$ 733,843$
Level 1 Level 2 Level 3 2012Cash equivalents 14,722$ 31$ -$ 14,753$ Domestic equities 94,623 66,546 - 161,169 International equities 33,309 88,759 - 122,068 Domestic treasuries - 26,846 - 26,846 Global fixed income 27,389 49,540 - 76,929 Assets whose use is limited 3,371 - - 3,371 Private investments: Long/short equity - 5,440 18,152 23,592 Absolute return - 3,854 75,671 79,525 Private equity and venture capital - - 71,141 71,141 Real estate, energy, and timber - - 43,238 43,238 Beneficial interest in trusts - - 5,752 5,752
Total 173,414$ 241,016$ 213,954$ 628,384$
The following table presents the investments and beneficial interest in trusts carried on the Statement of Financial Position bylevel within the valuation hierarchy at June 30, 2013 and 2012:
22

CLAREMONT MCKENNA COLLEGENOTES TO THE FINANCIAL STATEMENTS
June 30, 2013 and 2012(in thousands)
NOTE 5 - FAIR VALUE MEASUREMENT OF FINANCIAL INSTRUMENTS: Continued
Real estate, BeneficialLong/short Absolute Private equity & energy, and Interest
equity return Venture capital timber in Trusts TotalBalance at July 1, 2011 15,767$ 69,396$ 74,380$ 33,667$ 5,251$ 198,461$ Purchases 30 6,976 14,485 10,456 - 31,947 Sales (1,723) (1,596) (22,596) (6,251) - (32,166) Transfers in 6,412 - - - - 6,412 Realized gain/(loss), net (535) (10) 19 1,248 - 722 Unrealized gain/(loss), net (1,799) 905 4,597 2,434 - 6,137 Interest/dividends - - 256 1,684 - 1,940 Actuarial adjustment - - - - 501 501
Balance at July 1, 2012 18,152$ 75,671$ 71,141$ 43,238$ 5,752$ 213,954$ Purchases 20,599 39 9,062 6,468 - 36,168 Sales (1,189) (10,946) (24,813) (8,028) - (44,976) Transfers in 1,149 3,854 - - - 5,003 Realized gain/(loss), net (23) 1,165 8,526 2,185 - 11,853 Unrealized gain/(loss), net 6,076 12,925 6,097 2,815 - 27,913 Interest/dividends - - 1,006 1,375 - 2,381 Actuarial adjustment - - - - 108 108
Balance at June 30, 2013 44,764$ 82,708$ 71,019$ 48,053$ 5,860$ 252,404$
Strategies
Fair Value at Unfunded Redemption Redemption and OtherJune 30, 2013 Commitments Frequency Notice Period Restrictions
Domestic equities 46,085$ none 7 to 60 days 7 to 30 days (1)International equity funds 106,838 none 15 to 90 days 7 to 60 days (1)Domestic treasuries 26,501 none 15 to 90 days 7 to 60 days (1)Global fixed income 56,573 none 7 to 30 days 7 to 10 days (1)Long/short equity 44,764 none qtrly to 3 years 30 to 90 days (2)
Absolute return 82,708 none qtrly to 3 years 30 to 90 days (2)
Private equity and venture capital 71,019 31,555$ 1 - 15 years none (3)Real estate, energy, and timber 48,053 45,654 1 - 15 years none (3)
Total 482,541$ 77,209$
The following table includes a roll forward of the amounts for assets classified within Level 3 at June 30, 2013 and 2012:
The following table shows the fair value, unfunded commitments and redemption restrictions for investments reported at Net AssetValue at June 30, 2013:
Net appreciation/(depreciation) on investments and beneficial interest in trusts are reflected in the line "Realized and unrealizedgains/(losses), net of spending allocation" and "Other investment income," respectively, on the Statement of Activities. Alsoincluded in those accounts are net unrealized gains/(losses) on investments and actuarial adjustment on beneficial interest in trustsfor Level 3 assets still held at June 30, 2013 and 2012 of $27,913 and $6,137, respectively. The College's policy is to recognizetransfers in and transfers out of Level 1, Level 2, and Level 3 at the beginning of the reporting period. Transfers in to Level 3during the period ending June 30, 2013 and 2012 is due to change in liquidity terms.
23
CLAREMONT MCKENNA COLLEGENOTES TO THE FINANCIAL STATEMENTS
June 30, 2013 and 2012(in thousands)
NOTE 5 - FAIR VALUE MEASUREMENT OF FINANCIAL INSTRUMENTS: Continued
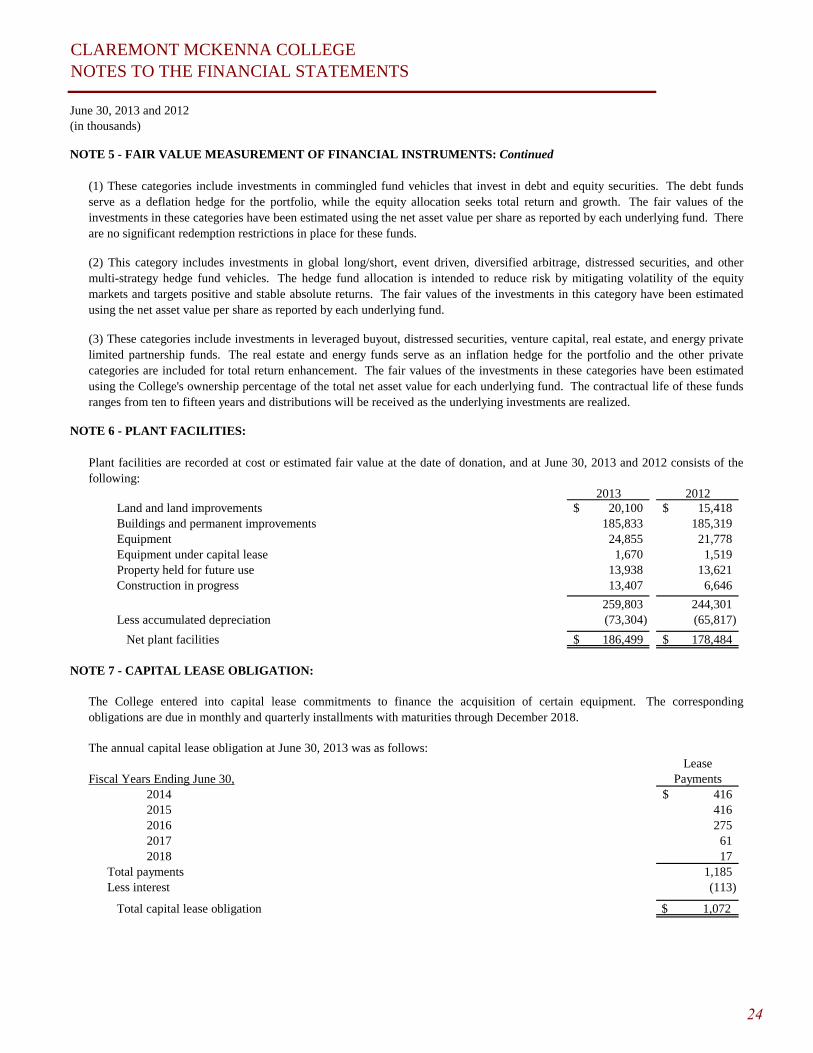
NOTE 6 - PLANT FACILITIES:
2013 2012 Land and land improvements 20,100$ 15,418$ Buildings and permanent improvements 185,833 185,319 Equipment 24,855 21,778 Equipment under capital lease 1,670 1,519 Property held for future use 13,938 13,621 Construction in progress 13,407 6,646
259,803 244,301 Less accumulated depreciation (73,304) (65,817)
Net plant facilities 186,499$ 178,484$
NOTE 7 - CAPITAL LEASE OBLIGATION:
LeaseFiscal Years Ending June 30, Payments
2014 416$ 2015 416 2016 275 2017 61 2018 17
Total payments 1,185 Less interest (113)
$ 1,072
Total capital lease obligation
Plant facilities are recorded at cost or estimated fair value at the date of donation, and at June 30, 2013 and 2012 consists of thefollowing:
The College entered into capital lease commitments to finance the acquisition of certain equipment. The correspondingobligations are due in monthly and quarterly installments with maturities through December 2018.
The annual capital lease obligation at June 30, 2013 was as follows:
(1) These categories include investments in commingled fund vehicles that invest in debt and equity securities. The debt fundsserve as a deflation hedge for the portfolio, while the equity allocation seeks total return and growth. The fair values of theinvestments in these categories have been estimated using the net asset value per share as reported by each underlying fund. Thereare no significant redemption restrictions in place for these funds.
(2) This category includes investments in global long/short, event driven, diversified arbitrage, distressed securities, and othermulti-strategy hedge fund vehicles. The hedge fund allocation is intended to reduce risk by mitigating volatility of the equitymarkets and targets positive and stable absolute returns. The fair values of the investments in this category have been estimatedusing the net asset value per share as reported by each underlying fund.
(3) These categories include investments in leveraged buyout, distressed securities, venture capital, real estate, and energy privatelimited partnership funds. The real estate and energy funds serve as an inflation hedge for the portfolio and the other privatecategories are included for total return enhancement. The fair values of the investments in these categories have been estimatedusing the College's ownership percentage of the total net asset value for each underlying fund. The contractual life of these fundsranges from ten to fifteen years and distributions will be received as the underlying investments are realized.
24
CLAREMONT MCKENNA COLLEGENOTES TO THE FINANCIAL STATEMENTS
June 30, 2013 and 2012(in thousands)
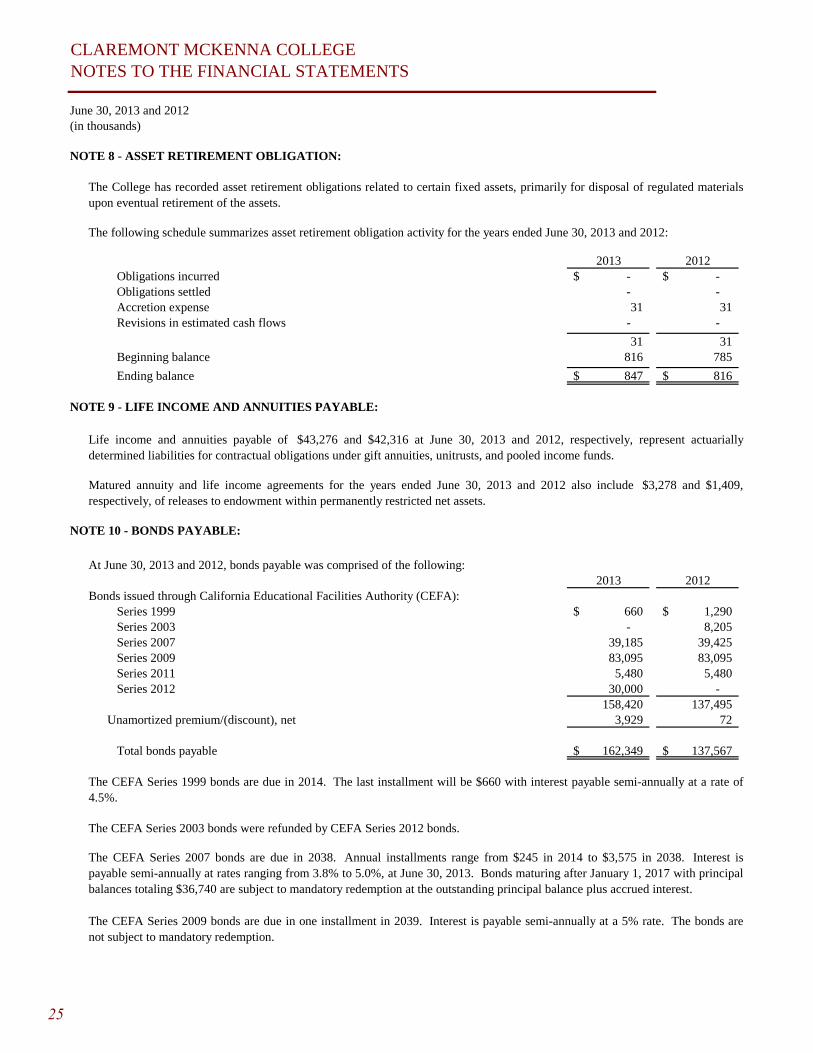
NOTE 8 - ASSET RETIREMENT OBLIGATION:
2013 2012 Obligations incurred -$ -$ Obligations settled - - Accretion expense 31 31 Revisions in estimated cash flows - -
31 31 Beginning balance 816 785
Ending balance 847$ 816$
NOTE 9 - LIFE INCOME AND ANNUITIES PAYABLE:
NOTE 10 - BONDS PAYABLE:
2013 2012Bonds issued through California Educational Facilities Authority (CEFA):
Series 1999 660$ 1,290$ Series 2003 - 8,205 Series 2007 39,185 39,425 Series 2009 83,095 83,095 Series 2011 5,480 5,480 Series 2012 30,000 -
158,420 137,495 Unamortized premium/(discount), net 3,929 72
Total bonds payable 162,349$ 137,567$
The CEFA Series 1999 bonds are due in 2014. The last installment will be $660 with interest payable semi-annually at a rate of4.5%.
The following schedule summarizes asset retirement obligation activity for the years ended June 30, 2013 and 2012:
At June 30, 2013 and 2012, bonds payable was comprised of the following:
The College has recorded asset retirement obligations related to certain fixed assets, primarily for disposal of regulated materialsupon eventual retirement of the assets.
The CEFA Series 2003 bonds were refunded by CEFA Series 2012 bonds.
The CEFA Series 2007 bonds are due in 2038. Annual installments range from $245 in 2014 to $3,575 in 2038. Interest ispayable semi-annually at rates ranging from 3.8% to 5.0%, at June 30, 2013. Bonds maturing after January 1, 2017 with principalbalances totaling $36,740 are subject to mandatory redemption at the outstanding principal balance plus accrued interest.
Life income and annuities payable of $43,276 and $42,316 at June 30, 2013 and 2012, respectively, represent actuariallydetermined liabilities for contractual obligations under gift annuities, unitrusts, and pooled income funds.
Matured annuity and life income agreements for the years ended June 30, 2013 and 2012 also include $3,278 and $1,409,respectively, of releases to endowment within permanently restricted net assets.
The CEFA Series 2009 bonds are due in one installment in 2039. Interest is payable semi-annually at a 5% rate. The bonds arenot subject to mandatory redemption.
25

CLAREMONT MCKENNA COLLEGENOTES TO THE FINANCIAL STATEMENTS
June 30, 2013 and 2012(in thousands)
NOTE 10 - BONDS PAYABLE: Continued
The maturity of bonds payable at June 30, 2013, is as follows:Principal
Fiscal Years Ending June 30, Amount2014 1,160$ 2015 1,235 2016 1,290 2017 1,335 2018 1,385
Thereafter 152,015 158,420$
NOTE 11 - ASSETS WHOSE USE IS LIMITED:
NOTE 12 - EMPLOYEE BENEFIT PLANS:
The CEFA Series 2012 bonds are due in 2042. Annual installments range from $255 in 2014 to $22,260 in 2042. Interest ispayable semi-annually at rates ranging from 2.3% to 5.0%, at June 30, 2013. Bonds maturing after January 1, 2033 are subject tomandatory redemption, in part, by lot, from mandatory sinking fund payments deposited. The Bonds maturing on January 1, 2042are not subject to mandatory redemption prior to their stated maturity. Refunding proceeds of approximately $8,397 weredeposited into an irrevocable trust with an escrow agent to provide for the redemption of the CEFA Series 2003 bonds. As aresult, the CEFA Series 2003 bonds liability have been removed from the Statement of Financial Position.
The College participates, with other members of The Claremont Colleges (Note 17), in a defined contribution retirement planwhich provides retirement benefits to eligible personnel through Teachers Insurance and Annuity Association and The CollegeRetirement Equity Fund. Under this defined contribution plan, College and participant contributions are used to purchaseindividual annuity contracts and investments equivalent to retirement benefits earned. Vesting provisions are full and immediate.Benefits commence upon retirement, and pre-retirement survivor death benefits are provided. College contributions to the plan forthe years ended June 30, 2013 and 2012 totaled $3,771 and $3,553, respectively.
Indenture requirements of bond financing (see Note 10, "Bonds Payable") provide for the establishment and maintenance ofvarious accounts with trustees. The indenture terms limit the use of these funds to capital expenditures and debt service paymentsas outlined in the agreements. Assets whose use is limited are comprised of cash equivalents and government obligations recordedat market value, which approximates fair value. Assets whose use is limited totaled $27,881 and $3,371, respectively, at June 30,2013 and 2012.
Interest expense was $7,342 and $6,845 for the years ended June 30, 2013 and 2012, respectively.
The CEFA Series 2012, 2011, 2009, 2007, 2003, and 1999 bond agreements contain various restrictive covenants which includemaintenance of certain financial ratios, as defined in the agreements.
The College holds CEFA bonds that are reported at an amortized cost of $158,420 and $137,495 at June 30, 2013 and 2012,respectively, in the Statement of Financial Position. These CEFA bonds have an approximate fair value of $164,329 and $148,267at June 30, 2013 and 2012, respectively. The College determined these CEFA bonds to be Level 2 measurements in the fair valuehierarchy.
The CEFA Series 2011 bonds are due in 2030. Annual installments range from $245 in 2015 to $480 in 2030. Interest is payablesemi-annually at rates ranging from 4.0% to 5.3%, at June 30, 2013. Bonds maturing after January 1, 2026 with principal balancestotaling $1,770 are subject to mandatory redemption at the outstanding principal balance plus accrued interest. Refundingproceeds of approximately $5,687 were deposited into an irrevocable trust with an escrow agent to provide for the partialredemption of the CEFA Series 1999 bonds. As a result, a portion of the CEFA Series 1999 bonds liability have been removedfrom the Statement of Financial Position.
26

CLAREMONT MCKENNA COLLEGENOTES TO THE FINANCIAL STATEMENTS
June 30, 2013 and 2012(in thousands)
NOTE 12 - EMPLOYEE BENEFIT PLANS: Continued
NOTE 13 - NET ASSETS:
At June 30, 2013 and 2012, net assets consists of the following:2013 2012
Unrestricted: For operations and designated purposes 1,700$ 577$ Student loans 2,447 3,140 Board designated endowment funds 135,509 108,757 Plant facilities 71,884 63,205 Total unrestricted 211,540$ 175,679$
Temporarily restricted: Restricted for specific purposes 105,355$ 112,035$ Annuity and life income contracts and agreements 2,448 848 Term endowments 140,072 150,557 Portion of perpetual endowment fund subject to a time restriction under California UPMIFA: Without purpose restriction 15,069 12,709 With purpose restriction 150,069 106,065 Total temporarily restricted 413,013$ 382,214$
Permanently restricted: Student loans 11,647$ 11,873$ Annuity and life income contracts and agreements 11,060 10,550 Endowment 271,184 254,382 Total permanently restricted 293,891$ 276,805$
The Claremont University Consortium administers a defined benefit plan (the "Plan") covering substantially all nonacademicemployees of the College, along with those of the other Claremont Colleges. The Plan is funded in accordance with the EmployerRetirement Income Security Act of 1974 ("ERISA"). The benefits are based on a percent of each year's base compensation. Planassets are invested primarily in a diversified group of equity and fixed-income securities. The College's allocation of the netpension cost for the years ended June 30, 2013 and 2012 was $201 and $182, respectively. A decision was made to curtail thePlan in June, 2004. Under the curtailment, the accrued benefits earned at June 30, 2005 were frozen and no future benefits will beearned under the plan. The impact of the curtailment was a reduction to the benefit obligation. Eligible plan participants beganreceiving benefits under the defined contribution retirement plan in July, 2005. Additional information on the Plan can beobtained from the audited financial statements of Claremont University Consortium.
27
CLAREMONT MCKENNA COLLEGENOTES TO THE FINANCIAL STATEMENTS
June 30, 2013 and 2012(in thousands)
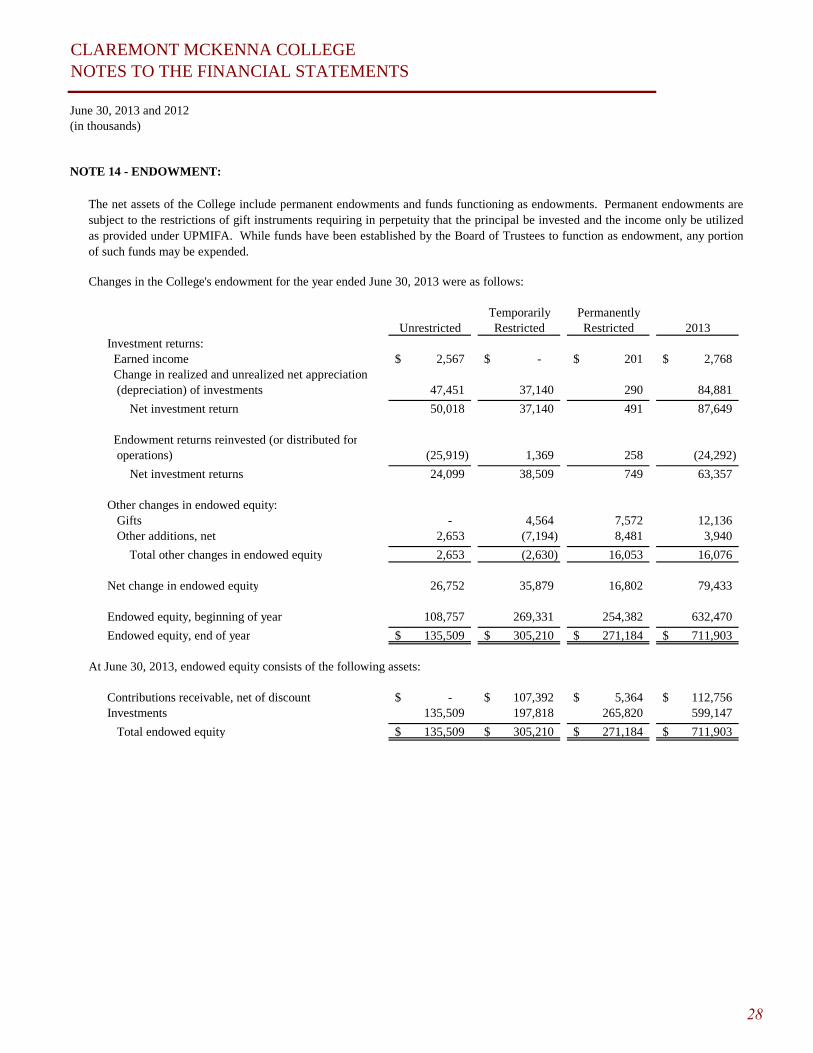
NOTE 14 - ENDOWMENT:
Changes in the College's endowment for the year ended June 30, 2013 were as follows:
Temporarily PermanentlyUnrestricted Restricted Restricted 2013
Investment returns: Earned income 2,567$ -$ 201$ 2,768$ Change in realized and unrealized net appreciation (depreciation) of investments 47,451 37,140 290 84,881
Net investment return 50,018 37,140 491 87,649
Endowment returns reinvested (or distributed for operations) (25,919) 1,369 258 (24,292)
Net investment returns 24,099 38,509 749 63,357
Other changes in endowed equity: Gifts - 4,564 7,572 12,136 Other additions, net 2,653 (7,194) 8,481 3,940
Total other changes in endowed equity 2,653 (2,630) 16,053 16,076
Net change in endowed equity 26,752 35,879 16,802 79,433
Endowed equity, beginning of year 108,757 269,331 254,382 632,470
Endowed equity, end of year 135,509$ 305,210$ 271,184$ 711,903$
At June 30, 2013, endowed equity consists of the following assets:
Contributions receivable, net of discount -$ 107,392$ 5,364$ 112,756$ Investments 135,509 197,818 265,820 599,147
Total endowed equity 135,509$ 305,210$ 271,184$ 711,903$
The net assets of the College include permanent endowments and funds functioning as endowments. Permanent endowments aresubject to the restrictions of gift instruments requiring in perpetuity that the principal be invested and the income only be utilizedas provided under UPMIFA. While funds have been established by the Board of Trustees to function as endowment, any portionof such funds may be expended.
28
CLAREMONT MCKENNA COLLEGENOTES TO THE FINANCIAL STATEMENTS
June 30, 2013 and 2012(in thousands)
NOTE 14 - ENDOWMENT: Continued
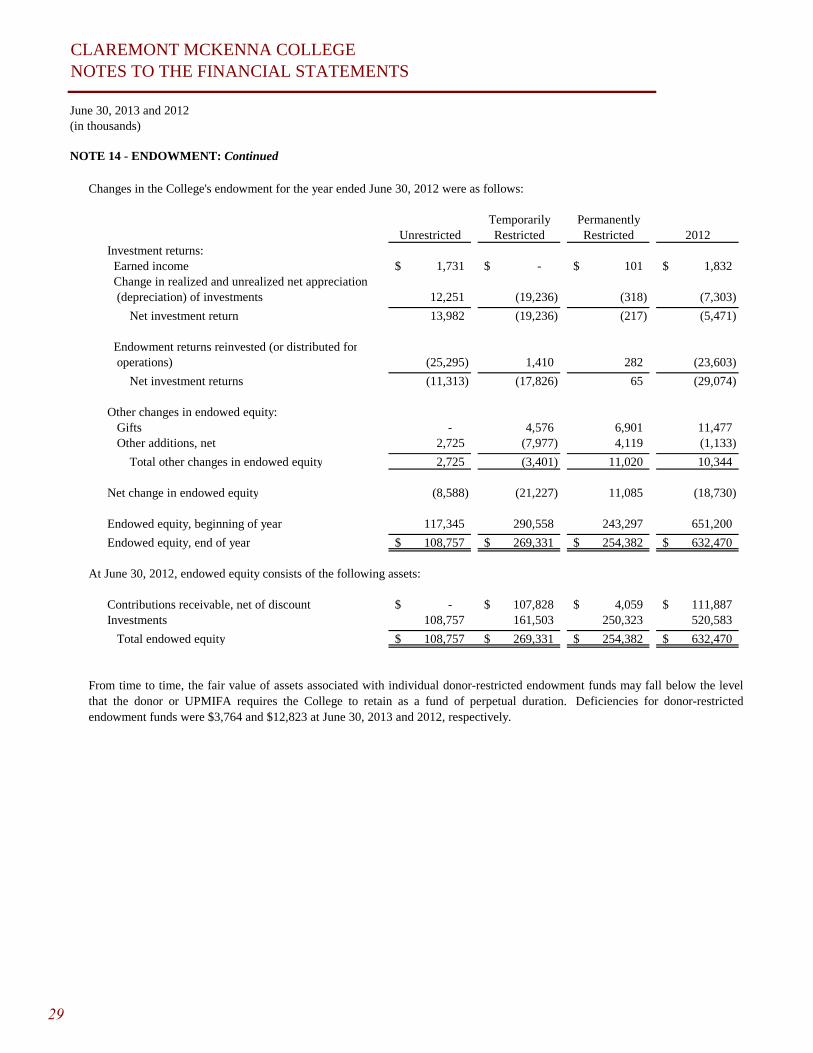
Changes in the College's endowment for the year ended June 30, 2012 were as follows:
Temporarily PermanentlyUnrestricted Restricted Restricted 2012
Investment returns: Earned income 1,731$ -$ 101$ 1,832$ Change in realized and unrealized net appreciation (depreciation) of investments 12,251 (19,236) (318) (7,303)
Net investment return 13,982 (19,236) (217) (5,471)
Endowment returns reinvested (or distributed for operations) (25,295) 1,410 282 (23,603)
Net investment returns (11,313) (17,826) 65 (29,074)
Other changes in endowed equity: Gifts - 4,576 6,901 11,477 Other additions, net 2,725 (7,977) 4,119 (1,133)
Total other changes in endowed equity 2,725 (3,401) 11,020 10,344
Net change in endowed equity (8,588) (21,227) 11,085 (18,730)
Endowed equity, beginning of year 117,345 290,558 243,297 651,200
Endowed equity, end of year 108,757$ 269,331$ 254,382$ 632,470$
At June 30, 2012, endowed equity consists of the following assets:
Contributions receivable, net of discount -$ 107,828$ 4,059$ 111,887$ Investments 108,757 161,503 250,323 520,583
Total endowed equity 108,757$ 269,331$ 254,382$ 632,470$
From time to time, the fair value of assets associated with individual donor-restricted endowment funds may fall below the levelthat the donor or UPMIFA requires the College to retain as a fund of perpetual duration. Deficiencies for donor-restrictedendowment funds were $3,764 and $12,823 at June 30, 2013 and 2012, respectively.
29

CLAREMONT MCKENNA COLLEGENOTES TO THE FINANCIAL STATEMENTS
June 30, 2013 and 2012(in thousands)
NOTE 15 - NET STUDENT REVENUES:
Student revenues for the years ended June 30, 2013 and 2012 consist of the following:
2013 2012
Tuition and fees 58,236$ 56,379$ Room and board 14,759 14,728
Gross student revenues 72,995 71,107
Less financial aid: Sponsored (14,407) (13,005) Unsponsored (5,948) (6,818)
Total financial aid (20,355) (19,823)
Net student revenues 52,640$ 51,284$
NOTE 16 - INSTITUTIONAL SUPPORT FUNDRAISING EXPENSE:
NOTE 17 - AFFILIATED INSTITUTIONS:
NOTE 18 - RELATED PARTY TRANSACTIONS:
The College is a member of an affiliated group of colleges known as The Claremont Colleges. Each college is a separate corporate entity governed by its own board of trustees. Claremont University Consortium, a member of this group, is the centralcoordinating institution which provides common student and administrative services, including certain central facilities utilized byall The Claremont Colleges. The costs of these services and facilities are shared by the members of the group. Amounts paid bythe College for such services and use of facilities for the years ended June 30, 2013 and 2012 totaled $5,271 and $5,198,respectively.
The College holds investments in certain limited partnerships in which certain members of the Board of Trustees are limitedpartners or are affiliated with management of the related partnerships. Investments at June 30, 2013 and 2012 totaled $17,965 and$21,285, respectively.
The College receives contributions and promises to give from members of the Board of Trustees. For the year ended June 30,2013 and 2012, the College received $12,248 and $52,724, respectively, of total contribution revenue from members of the Boardof Trustees. At June 30, 2013 and 2012, contributions receivable from members of the Board of Trustees totaled $200,258 and$200,939, respectively.
"Sponsored" student aid consists of funds provided by external entities or income from endowment funds restricted for financialaid, whereas "unsponsored" aid consists of funds provided by the College.
Included in Institutional Support expenses are $4,521 and $4,249 of expenditures related to fundraising for the years ended June30, 2013 and 2012, respectively.
30
CLAREMONT MCKENNA COLLEGENOTES TO THE FINANCIAL STATEMENTS
June 30, 2013 and 2012(in thousands)
NOTE 19 - COMMITMENTS AND CONTINGENCIES:
NOTE 20 - SUBSEQUENT EVENTS:
Subsequent events have been evaluated through October 21, 2013, which corresponds to the date when the financial statements areavailable for issuance.
Certain federal grants, including financial aid which the College administers and for which it receives reimbursements, are subjectto audit and final acceptance by federal granting agencies. Current and prior year costs of such grants are subject to adjustmentupon audit. The amount of expenditures that may be disallowed by the grantor, if any, cannot be determined at this time, althoughthe College expects such amounts, if any, would not have a significant impact on the financial position of the College.
Occasionally, the College is involved in lawsuits arising in the ordinary course of its operations. The College's management doesnot expect the ultimate resolution of pending legal actions to have a material effect on the financial position or results of operationof the College.
Subsequent events are events or transactions that occur after the statement of financial position date but before financialstatements are available to be issued. The College recognizes in the financial statements the effects of all subsequent events thatprovide additional evidence about conditions that existed at the date of the statement of financial position, including the estimatesinherent in the process of preparing the financial statements. The College’s financial statements do not recognize subsequentevents that provide evidence about conditions that did not exist at the date of the statement of financial position but arose after thestatement of financial position date and before financial statements are available to be issued.
31

For additional copies, please contactRobin J. Aspinall
Vice President for Business and Administration and Treasurer
Bauer Center, 500 East Ninth StreetClaremont, California 91711-6400
(909) [email protected]