12 multiple regression (missing text) - dravilla.weebly.com · 1/11/18 2 •predicting a dv with 2...
TRANSCRIPT

1/11/18
1
MULTIPLE REGRESSION
•___________ a DV with an IV•E.g., predicting school performance with # of study hours
•Yields R-value•Denotes ________ and ________ of relationship
•Works just like correlation coefficient (i.e., r-value)
Regression
R = 0.0 R = +1.0R = -1.0
Strong Weak Weak Strong
-0.5-0.7 -0.3 +0.5+0.3 +0.7
Null PositiveNegative
•How much have we “_________” the DV?•What percentage of the DV has been “__________” by the IV?
•Calculation: R * R = R2
•If R-value between studying and grades is 0.5•Then, R2 = 0.5 * 0.5 = 0.25•25% of variance in grades is explained by studying
•Also means 75% of variance in grades must be explainable by ___________
Regression
R2

1/11/18
2
•Predicting a DV with 2 or more IVs
•Major benefits:•Allows prediction of DV with more accuracy than if using one predictor alone•Can allow you to predict DV with greater accuracy
•Can determine how “_____” and “_____” predictors are when working together
Multiple Regression
•Predicting success in college (GPA)
•Predictors:•# of hours studying•# of classes attended•# of textbook pages read
•All of this can be entered into a single multiple regression analysis
Multiple Regression
•Can reveal things single regression cannot
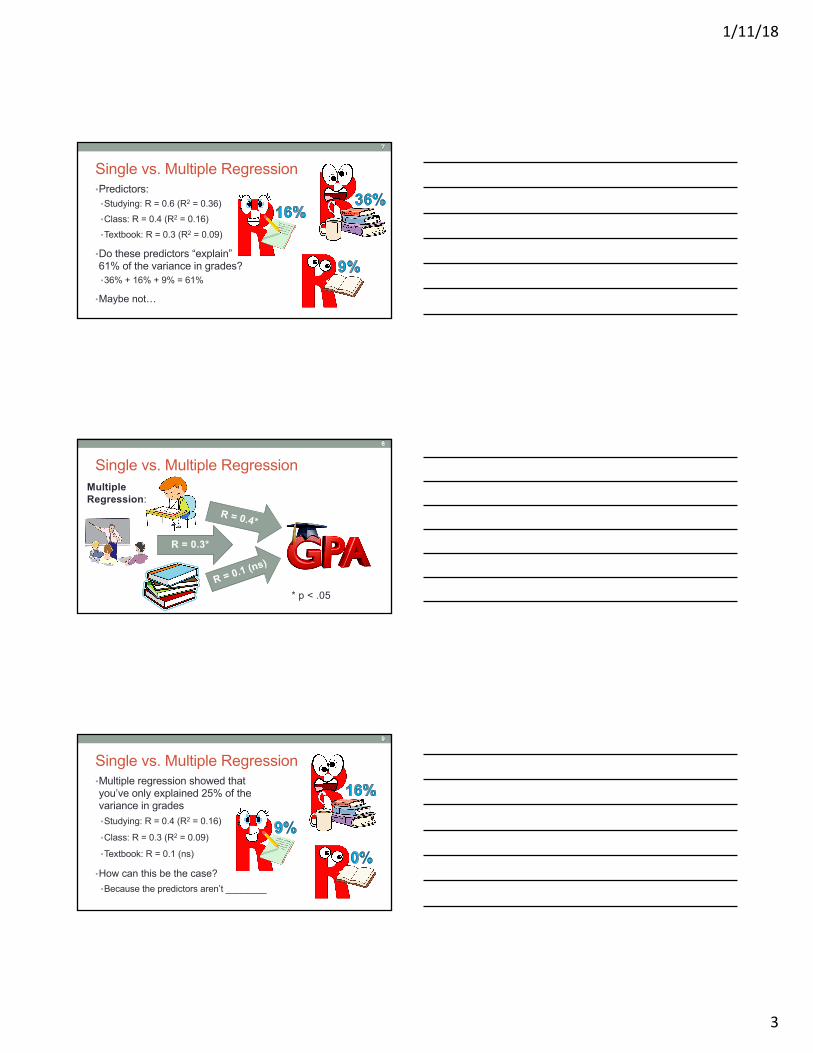
Single vs. Multiple Regression
R = 0.4*
* p < .05
Single Regression:
1/11/18
3
•Predictors:•Studying: R = 0.6 (R2 = 0.36)•Class: R = 0.4 (R2 = 0.16)•Textbook: R = 0.3 (R2 = 0.09)
•Do these predictors “explain” 61% of the variance in grades?•36% + 16% + 9% = 61%
•Maybe not…
Single vs. Multiple Regression
Single vs. Multiple Regression
R = 0.3*
* p < .05
Multiple Regression:
•Multiple regression showed that you’ve only explained 25% of the variance in grades•Studying: R = 0.4 (R2 = 0.16)
•Class: R = 0.3 (R2 = 0.09)
•Textbook: R = 0.1 (ns)
•How can this be the case?•Because the predictors aren’t ________
Single vs. Multiple Regression

1/11/18
4
•Some predictors are “__________”•I.e., not uniquely predictive
•Let’s say you’re taking a class where you would do just as well going to class or reading the textbook•If we run a single regression on these IVs
•Going to class: R = .6•Reading textbook: R = .6
Multiple Regression
•But, we know that doing either one is just as good as the other
•Multiple regression reveals “uniqueness” of each predictor•If going to class is just as good as reading textbook…
•Multiple regression:•Going to class: R = .3•Reading textbook: R = .3
Multiple Regression
Amount of variance explained is “______” between the two predictors
We both shrank!
We had to share
•Multiple regression reveals “uniqueness” of each predictor•If going to class is better at predicting good grades than reading the textbook•Multiple regression:
•Going to class: R = .6•Reading textbook: R = .0
Multiple Regression
Explained variance goes to the more _______ predictor
I’m the best
predictor!
I add nothing
L

1/11/18
5
•Multicollinearity – when multiple IVs predict the DV in the same way•The IVs predict the same variance in the DV
•I.e., they lack “unique” predictive value
Multicollinearity
•Often, one IV becomes the “______” over the others•IV can predict the same variance other IVs can andpredict some variance others cannot (i.e., unique variance)
•Multiple regression can show…•What combination of IVs best predicts the DV•How much does each IV “uniquely” predicts the DV
Multiple Regression
I’m the best
predictor!
I add a little more predictive
power
I add nothing
•Multiple Regression can be done in several ways…•Simultaneous Multiple Regression•Hierarchical Multiple Regression•Stepwise Multiple Regression
Multiple Regression
•Simultaneous Multiple Regression•All IVs are entered into predictive model simultaneously
•The ________ and most ______ predictors come out on top

1/11/18
6
•Example: Predicting outcome of drug treatment program
•Predictors…•Duration of addiction•Duration of treatment•Social support •Mental well-being•Socioeconomic status•Neighborhood crime rates
Simultaneous Multiple Regression
•Example: Predicting positive outcome of drug treatment
•Single Regression analysis revealed…•Duration of addiction: R2 = 15%•Duration of treatment: R2 = 3%•Social support: R2 = 18%•Mental well-being: R2 = 16%•Socioeconomic status : R2 = 20%•Neighborhood crime rates : R2 = 24%
Simultaneous Multiple Regression
•Example: Predicting positive outcome of drug treatment
•Simultaneous Multiple Regression analysis revealed…•Duration of addiction: R2 = 15%•Duration of treatment: R2 = 3%•Social support: R2 = 9%•Mental well-being: R2 = 8%•Socioeconomic status : R2 = 2%•Neighborhood crime rates : R2 = 22%
Simultaneous Multiple Regression
IV#2 much more ______ and _____ predictor
IVs _______ in the type of variance they were able to predict
Both were ______ predictors

1/11/18
7
•Example: Predicting positive outcome of drug treatment
•Simultaneous Multiple Regression analysis revealed…•Duration of addiction: R2 = 15%•Duration of treatment: R2 = 3%•Social support: R2 = 9%•Mental well-being: R2 = 8%•Socioeconomic status : R2 = 2%•Neighborhood crime rates : R2 = 22%
Simultaneous Multiple Regression
This model explains 59% of the variance in drug treatment program
We can now predict success of treatment program with 59% more _________
Simultaneous Multiple Regression•Simultaneous Multiple Regression…
•Can predict DV with higher accuracy than using a single predictor
•Can reveal what predictors are the strongest and most unique•Reveals __________, when IVs predict the same variance in the DV
•Hierarchical Multiple Regression•IVs are entered into predictive model one at a time
•Can assess whether a variable is still predictive of a DV after another predictor has “_______________” or “_________”•Step 1: Predictor #1 explains some of the variance in the DV•Step 2: That explained variance is removed from the equation•Step 3: Assess whether Predictor #2 can explain any of the remaining (____________) variance•I.e., does the additional predictor “add” anything to the model?
Hierarchical Multiple Regression

1/11/18
8
•Example: Does socioeconomic status (SES) still predict drug recovery after controlling for neighborhood crime?•Step 1: Estimate how much variance in drug recovery is explained by neighborhood crime rates
Hierarchical Multiple Regression
R2 = 24%
•Example: Does socioeconomic status (SES) still predict drug recovery after controlling for neighborhood crime?•Step 2: Remove explained variance from DV
Hierarchical Multiple Regression
•Example: Does socioeconomic status (SES) still predict drug recovery after controlling for neighborhood crime?•Step 3: Assess whether SES can predict remaining variance
Hierarchical Multiple Regression
R2 = 2% (ns)

1/11/18
9
•The hierarchical model is often drawn like this
Hierarchical Multiple Regression
IV DV
Mediator
R = .38* (.02)* p < .05
•Revealed that the only reason SES is predictive of drug recovery is because SES is related with neighborhood crime
Hierarchical Multiple Regression
IV DV
Mediator
R = .38* (.02)* p < .05
•Mediator – variable that “________” other variables•SES determines what type of neighborhood you live in•Neighborhood crime rates then determine recovery outcomes
Hierarchical Multiple Regression
IV Mediator DV

1/11/18
10
•Hierarchical multiple regression can reveal the order of prediction•Variable#1 predicts variable#2, which then predicts variable#3
Hierarchical Multiple Regression
IV Mediator DV
•Stepwise Multiple Regression•________, statistical procedure that detects the most powerful predictors, one at a time
•Typically done when researchers aren’t sure what variables may be important predictors
•Example: Predicting likelihood of developing schizophrenia
Stepwise Multiple Regression
•Researcher enters everything they can think of as possible predictors of schizophrenia•Mental / emotional factors (stress, other mental illnesses, etc.)•Social factors (social support, socioeconomic status, etc.)•Physical factors (general health, history of illnesses, etc.)•Genetic factors (family history of mental illness)•Environmental factors (air quality, exposure to pesticides, etc.)
•All of this data is entered into a statistical program, which performs the stepwise analysis
Stepwise Multiple Regression

1/11/18
11
•First the program tests each factor _________ to see which is the strongest predictor•E.g., strongest predictor of schizophrenia is family history
•All of the variance that can be explained by this predictor is ________ from the DV
•Then all of the remaining predictors are tested to find the strongest predictor of the remaining (unexplained) variance•E.g., after taking into account family history, life stress is now the strongest predictor of schizophrenia
•_______ process until no remaining variables are predictive
Stepwise Multiple Regression
•Stepwise Multiple Regression is a type of “_________ analysis”•Simply allows the data to reveal potential predictors
• Isn’t driven by theoretical predictions (i.e., hypotheses)•Typically done to explore avenues for future research
Stepwise Multiple Regression
•High likelihood of ______________•Saying something is a significant predictor, when it isn’t in the real world
•Every significance test has 5% of Type-I error•Stepwise analyses runs dozens of significance tests
•Each type of multiple regression serves a different purpose•Simultaneous Multiple Regression
•Predicting DV with multiple predictors, allowing us to predict DV with higher _______ than using a single predictor
•Hierarchical Multiple Regression•Determining the order of prediction, allowing us to discover __________
•Stepwise Multiple Regression•Exploring what variables may be potential predictors of a DV
Overview