12-0 chapter 12: outline returns the historical record average returns: the first lesson the...
Post on 20-Dec-2015
216 views
TRANSCRIPT
12-1
Chapter 12: Outline
• Returns
• The Historical Record
• Average Returns: The First Lesson
• The Variability of Returns: The Second Lesson
• More on Average Returns
• Capital Market Efficiency
12-2
Risk, Return and Financial Markets
• We can examine returns in the financial markets to help us determine the appropriate returns on non-financial assets
• Lessons from capital market history• There is a reward for bearing risk• The greater the potential reward, the greater
the risk• This is called the risk-return trade-off
12-3
Dollar Returns
• Total dollar return = income from investment + capital gain (loss) due to change in price
• Example:• You bought a bond for $950 one year ago. You
have received two coupons of $30 each. You can sell the bond for $975 today. What is your total dollar return?
• Income = 30 + 30 = 60• Capital gain = 975 – 950 = 25• Total dollar return = 60 + 25 = $85
12-4
Percentage Returns
• It is generally more intuitive to think in terms of percentages than in dollar returns
• Dividend yield = income / beginning price
• Capital gains yield = (ending price – beginning price) / beginning price
• Total percentage return = dividend yield + capital gains yield
12-5
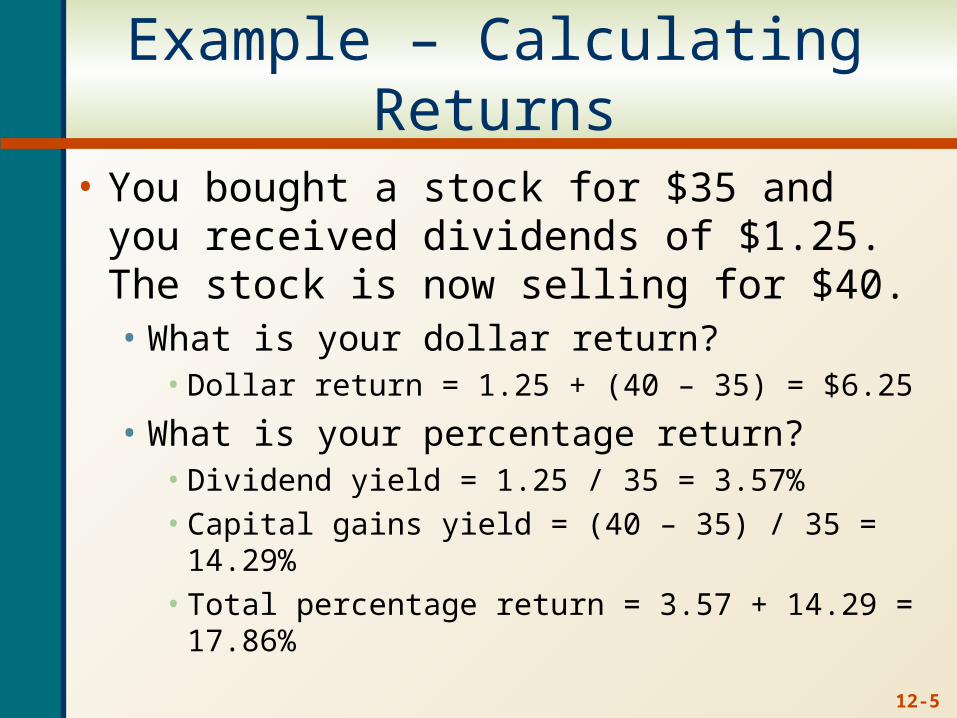
Example – Calculating Returns
• You bought a stock for $35 and you received dividends of $1.25. The stock is now selling for $40.• What is your dollar return?
• Dollar return = 1.25 + (40 – 35) = $6.25
• What is your percentage return?• Dividend yield = 1.25 / 35 = 3.57%• Capital gains yield = (40 – 35) / 35 = 14.29%• Total percentage return = 3.57 + 14.29 = 17.86%
12-6
The Importance of Financial Markets
• Financial markets allow companies, governments and individuals to increase their utility• Savers have the ability to invest in financial assets
so that they can defer consumption and earn a return to compensate them for doing so
• Borrowers have better access to the capital that is available so that they can invest in productive assets
• Financial markets also provide us with information about the returns that are required for various levels of risk
12-7
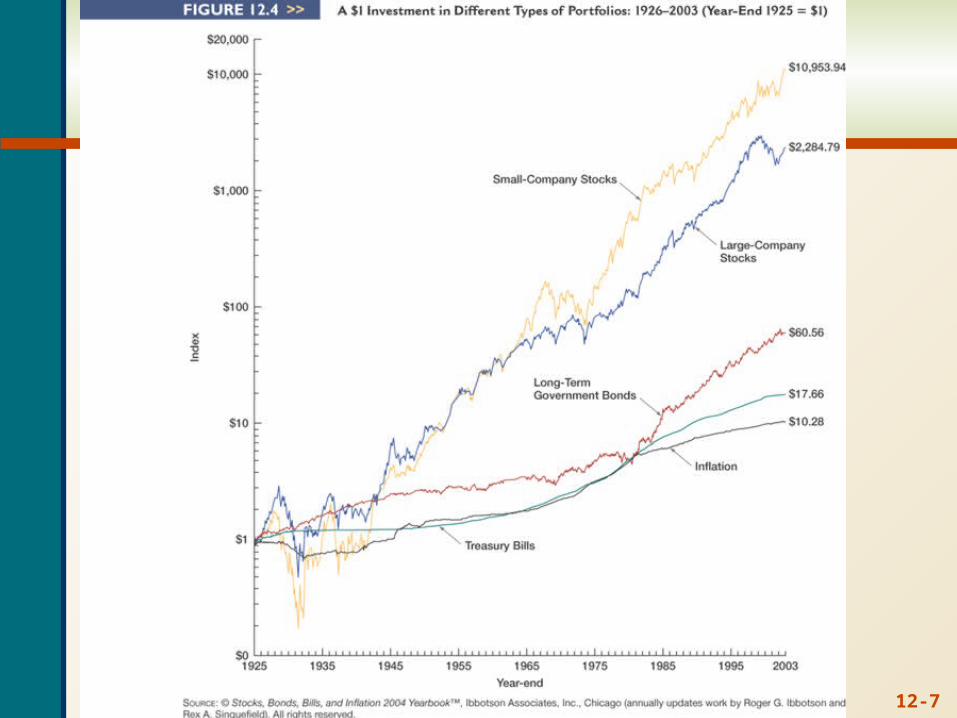
Figure 12.4
12-8
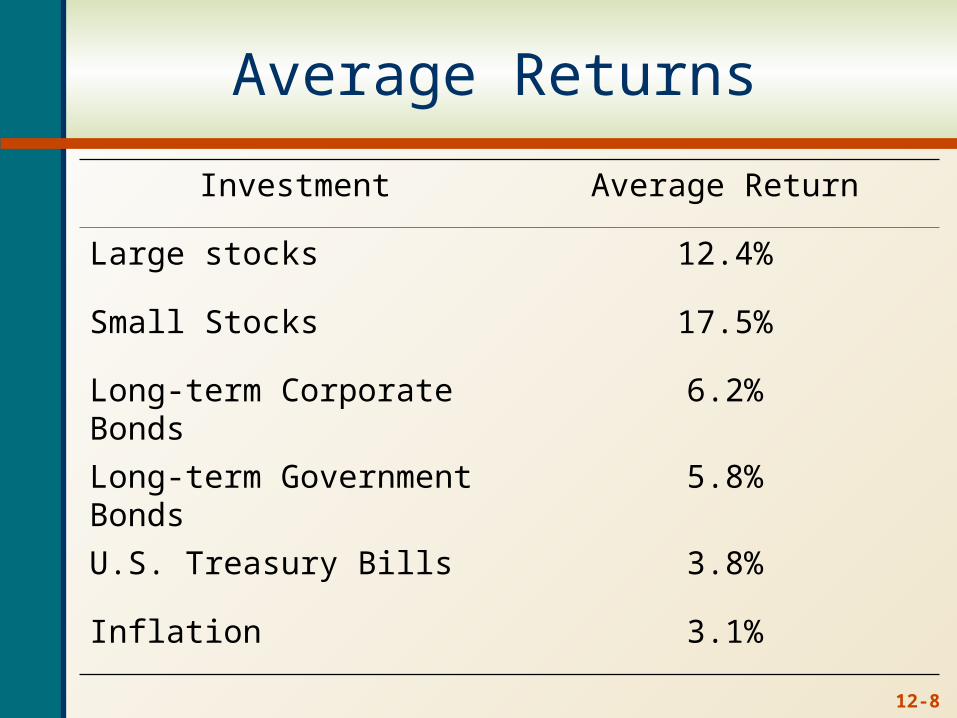
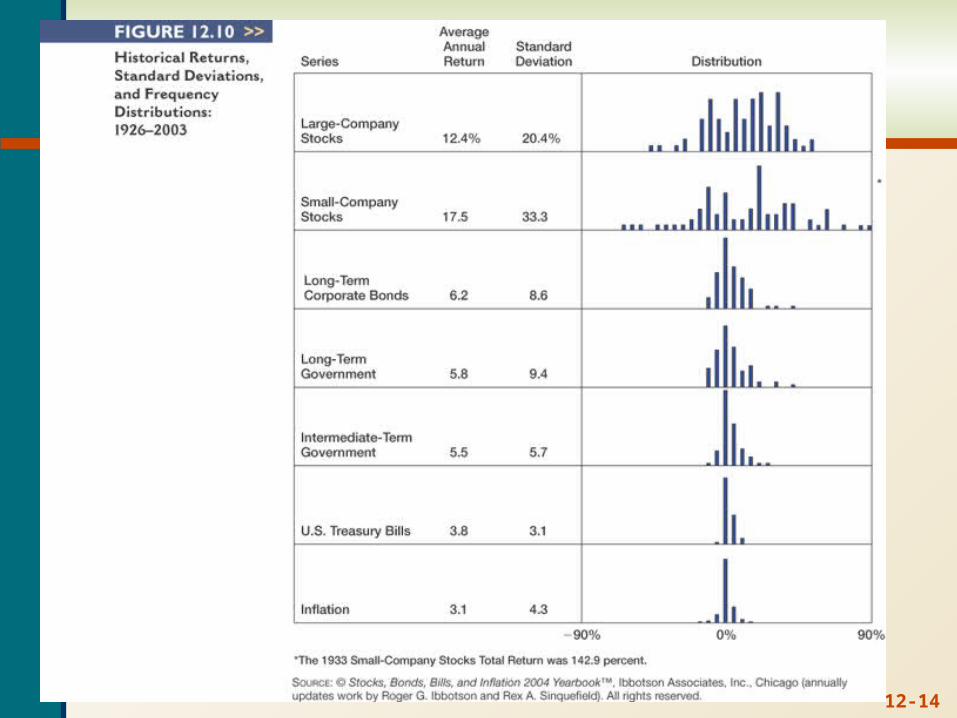
Average Returns
Investment Average Return
Large stocks 12.4%
Small Stocks 17.5%
Long-term Corporate Bonds 6.2%
Long-term Government Bonds
5.8%
U.S. Treasury Bills 3.8%
Inflation 3.1%
12-9
Risk Premiums
• The “extra” return earned for taking on risk
• Treasury bills are considered to be risk-free
• The risk premium is the return over and above the risk-free rate
12-10
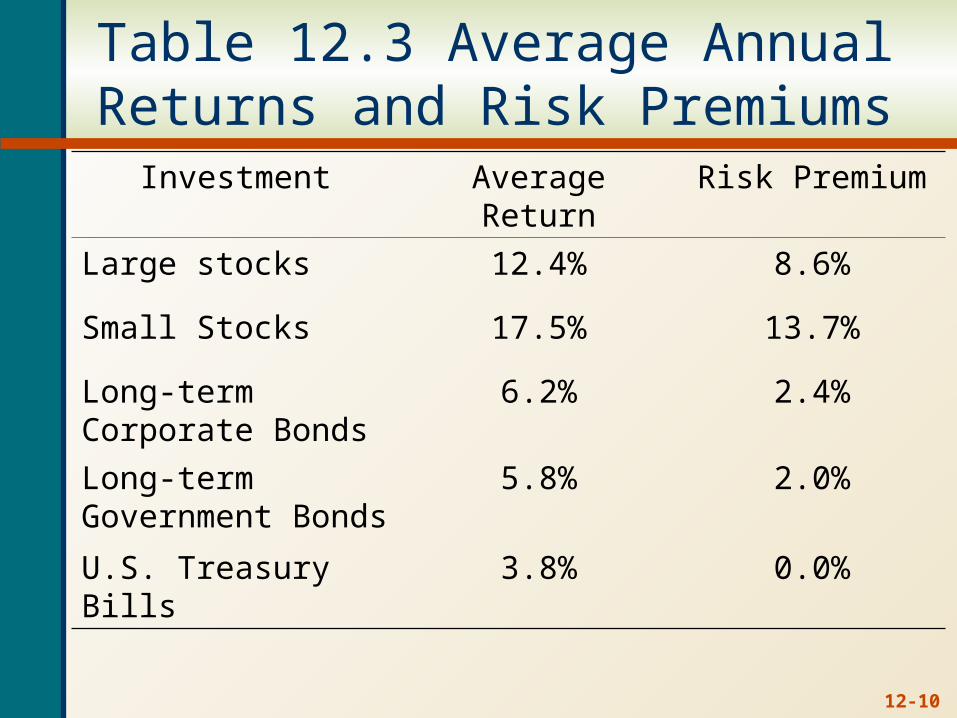
Table 12.3 Average Annual Returns and Risk Premiums
Investment Average Return Risk Premium
Large stocks 12.4% 8.6%
Small Stocks 17.5% 13.7%
Long-term Corporate Bonds
6.2% 2.4%
Long-term Government Bonds
5.8% 2.0%
U.S. Treasury Bills 3.8% 0.0%
12-11
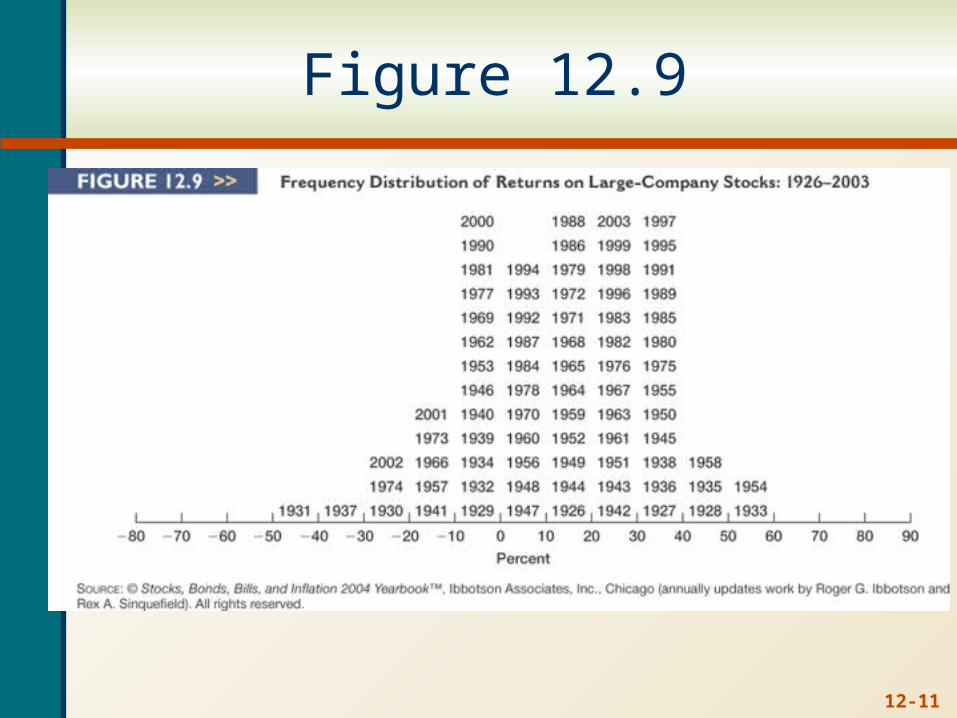
Figure 12.9
12-12
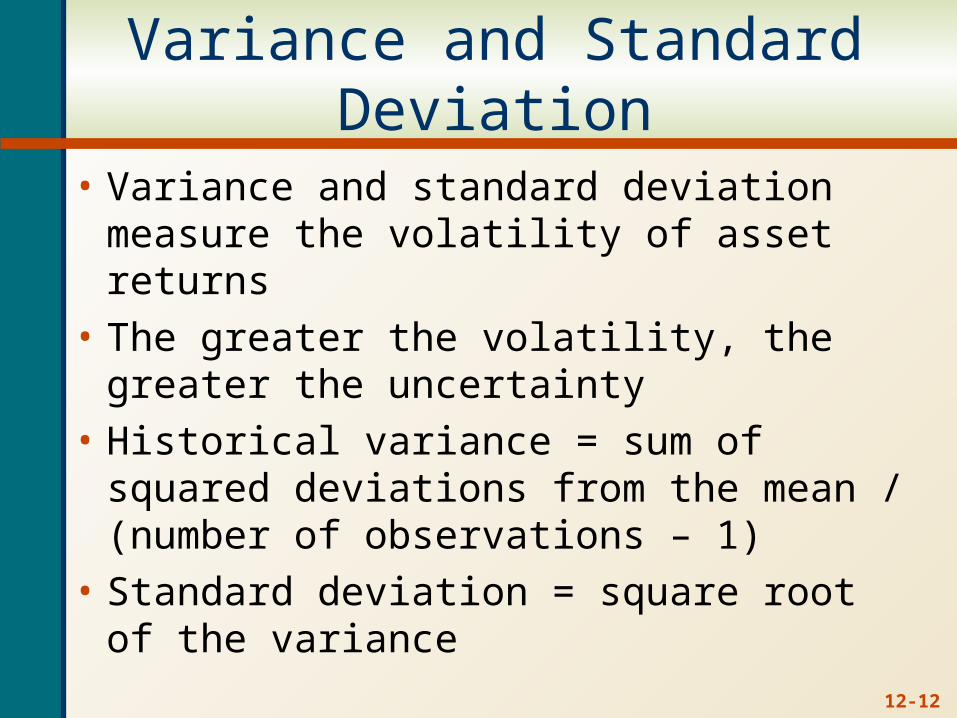
Variance and Standard Deviation
• Variance and standard deviation measure the volatility of asset returns
• The greater the volatility, the greater the uncertainty
• Historical variance = sum of squared deviations from the mean / (number of observations – 1)
• Standard deviation = square root of the variance
12-13
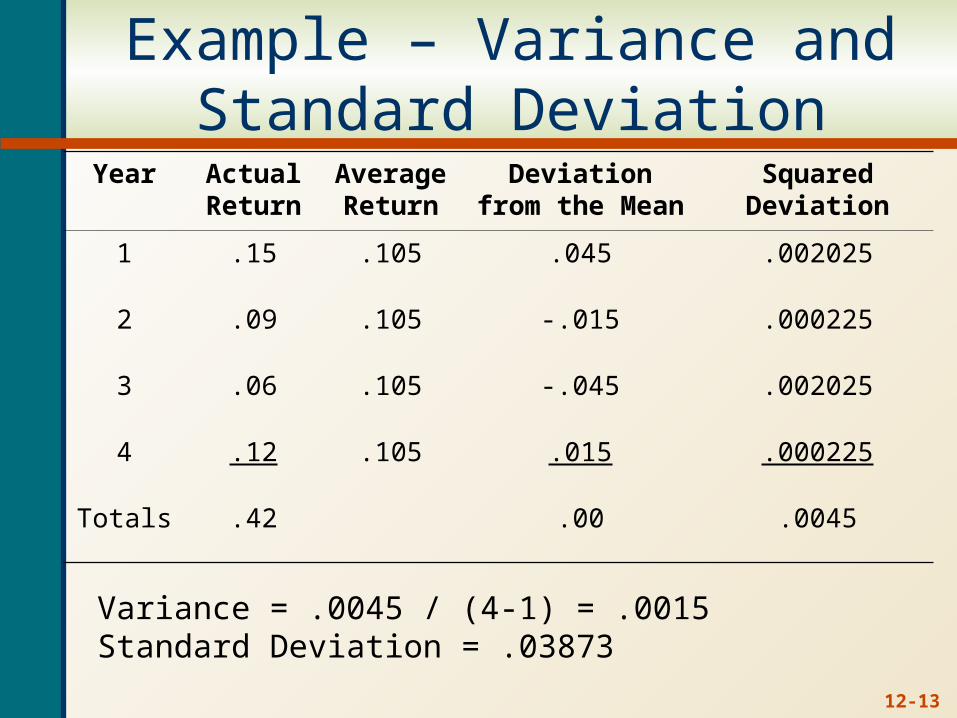
Example – Variance and Standard Deviation
Year Actual Return
Average Return
Deviation from the Mean
Squared Deviation
1 .15 .105 .045 .002025
2 .09 .105 -.015 .000225
3 .06 .105 -.045 .002025
4 .12 .105 .015 .000225
Totals .42 .00 .0045
Variance = .0045 / (4-1) = .0015 Standard Deviation = .03873
12-14
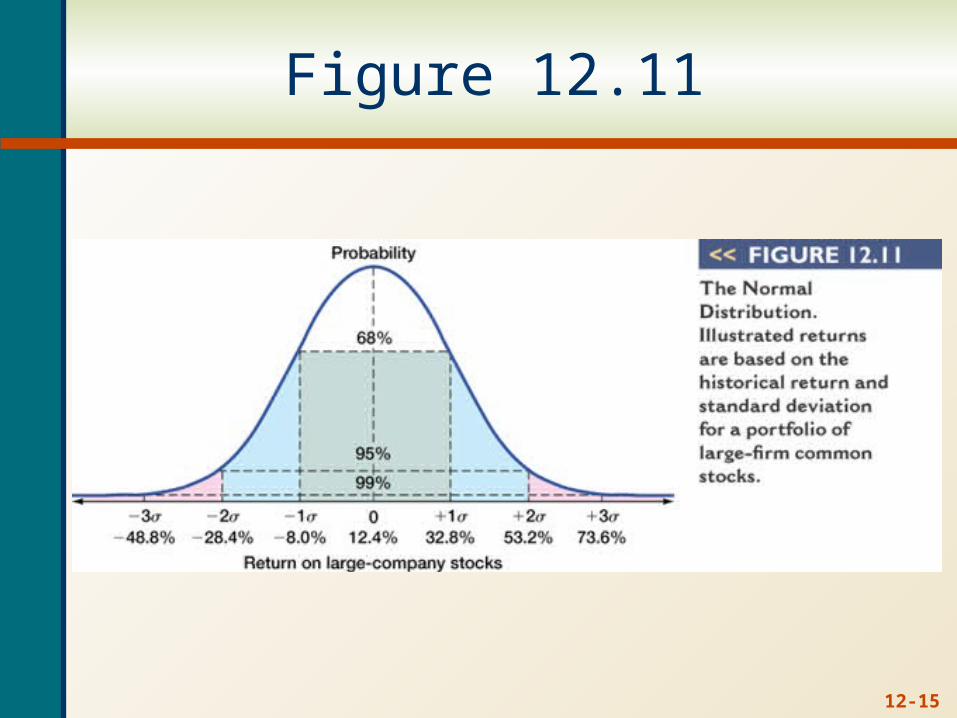
12-15
Figure 12.11
12-16
Arithmetic vs. Geometric Mean
• Arithmetic average – return earned in an average period over multiple periods
• Geometric average – average compound return per period over multiple periods
• The geometric average will be less than the arithmetic average unless all the returns are equal
• Which is better?• The arithmetic average is overly optimistic for
long horizons
12-17
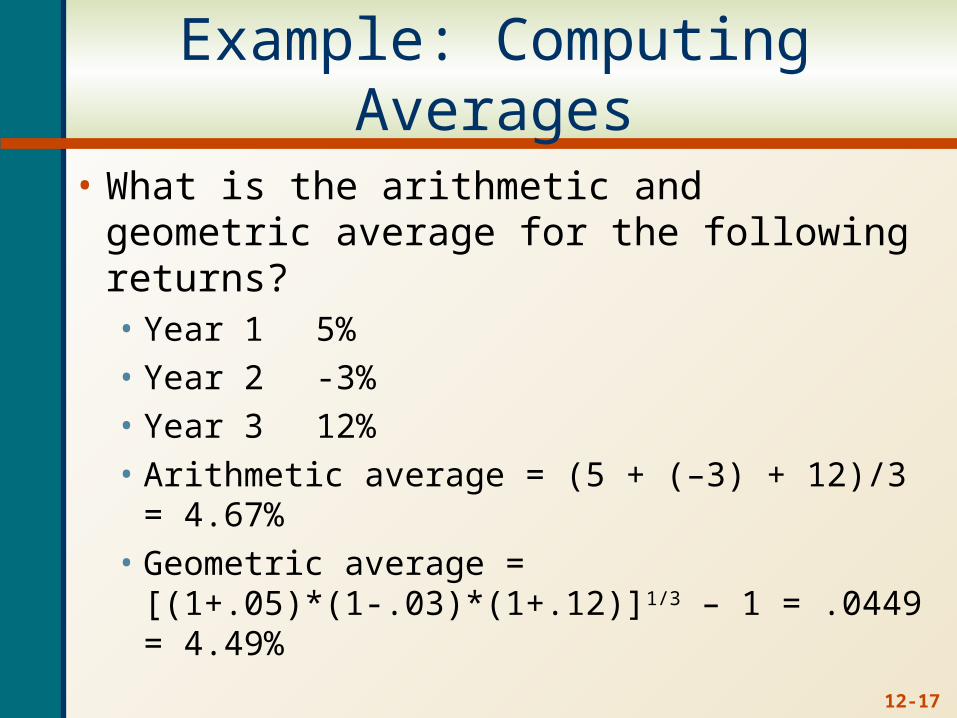
Example: Computing Averages
• What is the arithmetic and geometric average for the following returns?• Year 1 5%• Year 2 -3%• Year 3 12%• Arithmetic average = (5 + (–3) + 12)/3 = 4.67%• Geometric average =
[(1+.05)*(1-.03)*(1+.12)]1/3 – 1 = .0449 = 4.49%
12-18
Efficient Capital Markets
• Stock prices are in equilibrium or are “fairly” priced
• If this is true, then you should not be able to earn “abnormal” or “excess” returns
• Efficient markets DO NOT imply that investors cannot earn a positive return in the stock market
12-19
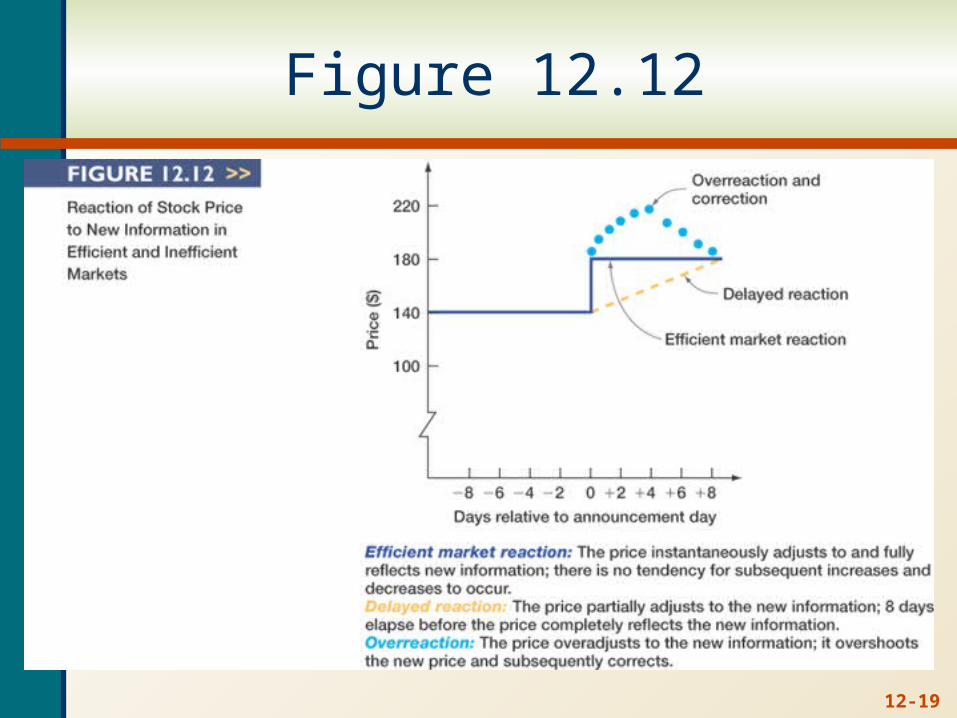
Figure 12.12
12-20
What Makes Markets Efficient?
• There are many investors out there doing research• As new information comes to market, this
information is analyzed and trades are made based on this information
• Therefore, prices should reflect all available public information
• If investors stop researching stocks, then the market will not be efficient
12-21
Common Misconceptions about EMH
• Efficient markets do not mean that you can’t make money
• They do mean that, on average, you will earn a return that is appropriate for the risk undertaken and there is not a bias in prices that can be exploited to earn excess returns
• Market efficiency will not protect you from wrong choices if you do not diversify – you still don’t want to put all your eggs in one basket
12-22
Strong Form Efficiency
• Prices reflect all information, including public and private
• If the market is strong form efficient, then investors could not earn abnormal returns regardless of the information they possessed
• Empirical evidence indicates that markets are NOT strong form efficient and that insiders could earn abnormal returns
12-23
Semistrong Form Efficiency
• Prices reflect all publicly available information including trading information, annual reports, press releases, etc.
• If the market is semistrong form efficient, then investors cannot earn abnormal returns by trading on public information
• Implies that fundamental analysis will not lead to abnormal returns
• Empirical evidence suggests that some stocks are semistrong form efficient, but not all. Larger, more closely followed stocks are more likely to be semistrong form efficient. Small, more thinly traded stocks may not be semistrong form efficient but liquidity costs may wipe out any abnormal returns that are available.
12-24
Weak Form Efficiency
• Prices reflect all past market information such as price and volume
• If the market is weak form efficient, then investors cannot earn abnormal returns by trading on market information
• Implies that technical analysis will not lead to abnormal returns
• Empirical evidence indicates that markets are generally weak form efficient