111125 mtg corporate presentation final
TRANSCRIPT
1
Modern Times Group MTG AB
“A Modern Media Group
for Modern Times”
November 2011
2
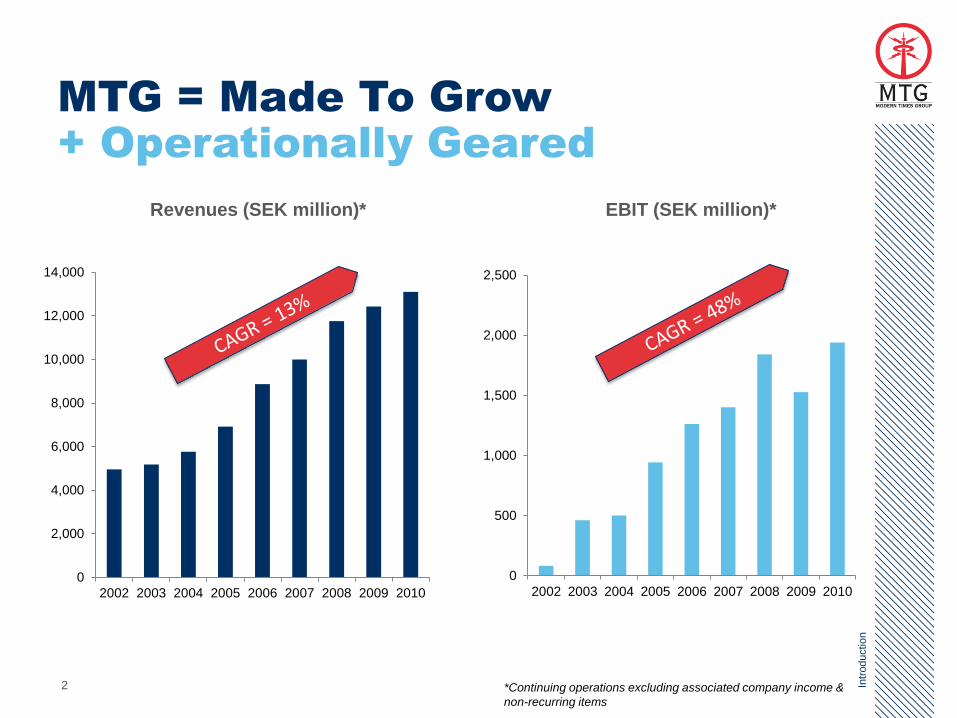
MTG = Made To Grow
+ Operationally Geared
Intr
oductio
n
0
2,000
4,000
6,000
8,000
10,000
12,000
14,000
2002 2003 2004 2005 2006 2007 2008 2009 2010
0
500
1,000
1,500
2,000
2,500
2002 2003 2004 2005 2006 2007 2008 2009 2010
Revenues (SEK million)* EBIT (SEK million)*
*Continuing operations excluding associated company income &
non-recurring items
3
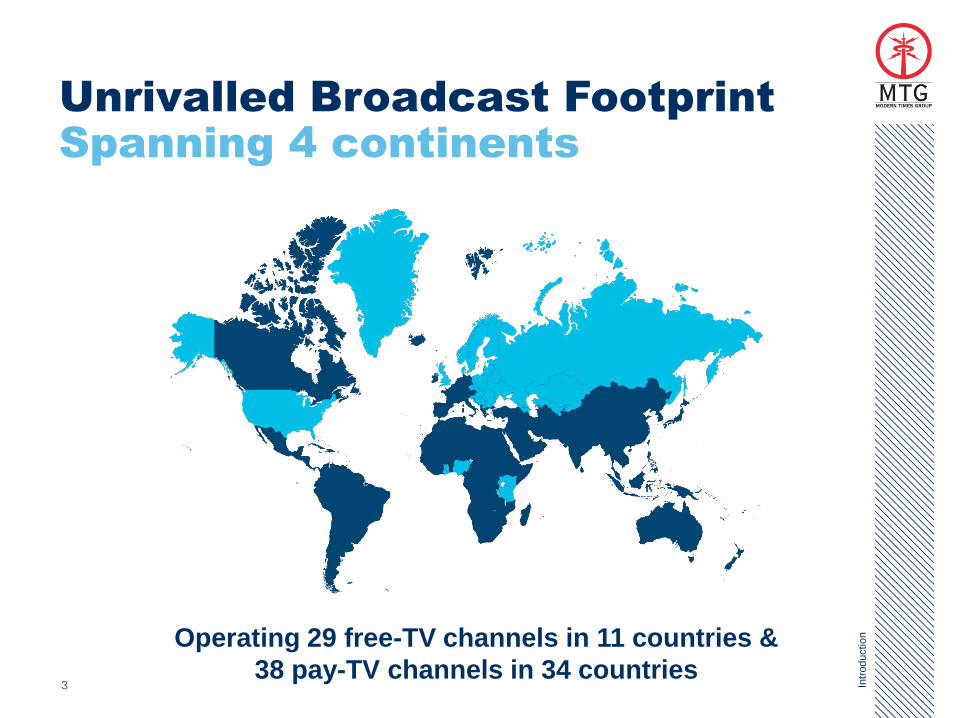
Operating 29 free-TV channels in 11 countries &
38 pay-TV channels in 34 countries
Unrivalled Broadcast Footprint
Spanning 4 continents
Intr
oductio
n
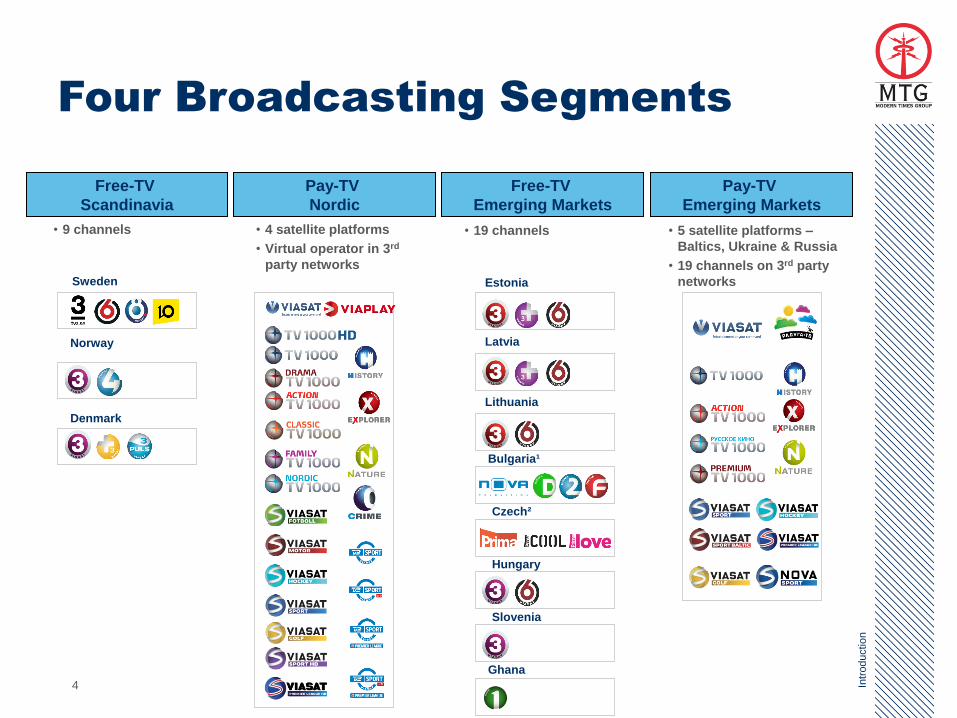
Four Broadcasting Segments
Sweden
Norway
Denmark
Estonia
Latvia
Lithuania
Bulgaria¹
Czech²
Hungary
Slovenia
Ghana
• 4 satellite platforms
• Virtual operator in 3rd
party networks
• 19 channels • 5 satellite platforms –
Baltics, Ukraine & Russia
• 19 channels on 3rd party
networks
• 9 channels
Free-TV
Scandinavia
Pay-TV
Nordic
Free-TV
Emerging Markets
Pay-TV
Emerging Markets
4 Intr
oductio
n
5
0%
10%
20%
30%
40%
50%
60%
70%
80%
90%
100%
2006 2007 2008 2009 2010
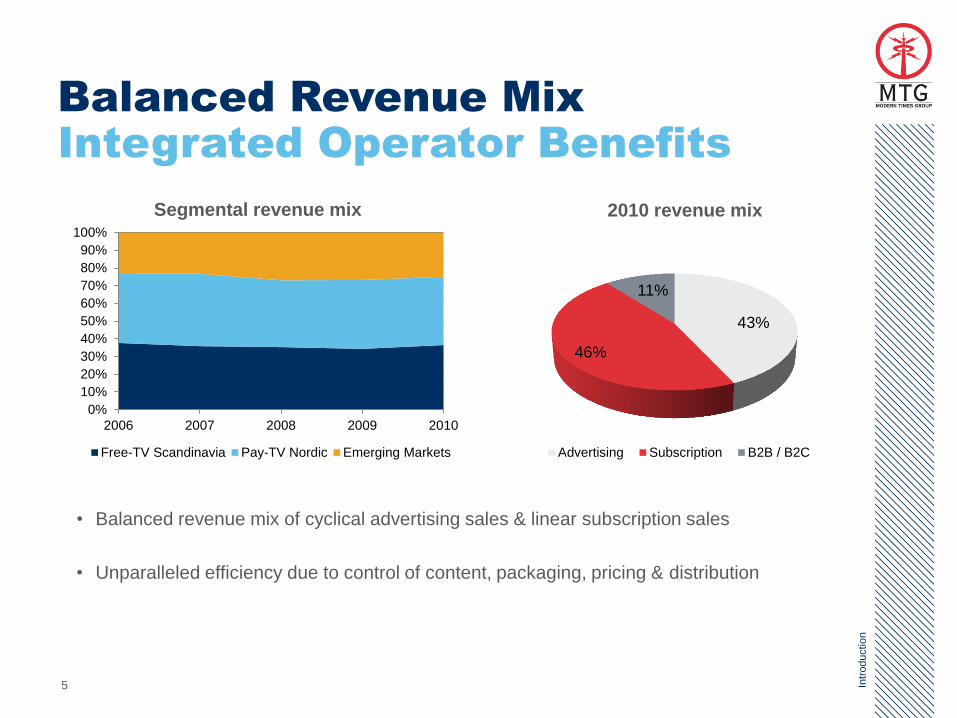
Free-TV Scandinavia Pay-TV Nordic Emerging Markets
2010 revenue mix Segmental revenue mix
43%
46%
11%
Advertising Subscription B2B / B2C
• Balanced revenue mix of cyclical advertising sales & linear subscription sales
• Unparalleled efficiency due to control of content, packaging, pricing & distribution
Balanced Revenue Mix
Integrated Operator Benefits
Intr
oductio
n
6 Fre
e-T
V S
candin
avia
110
160
210
260
310
360
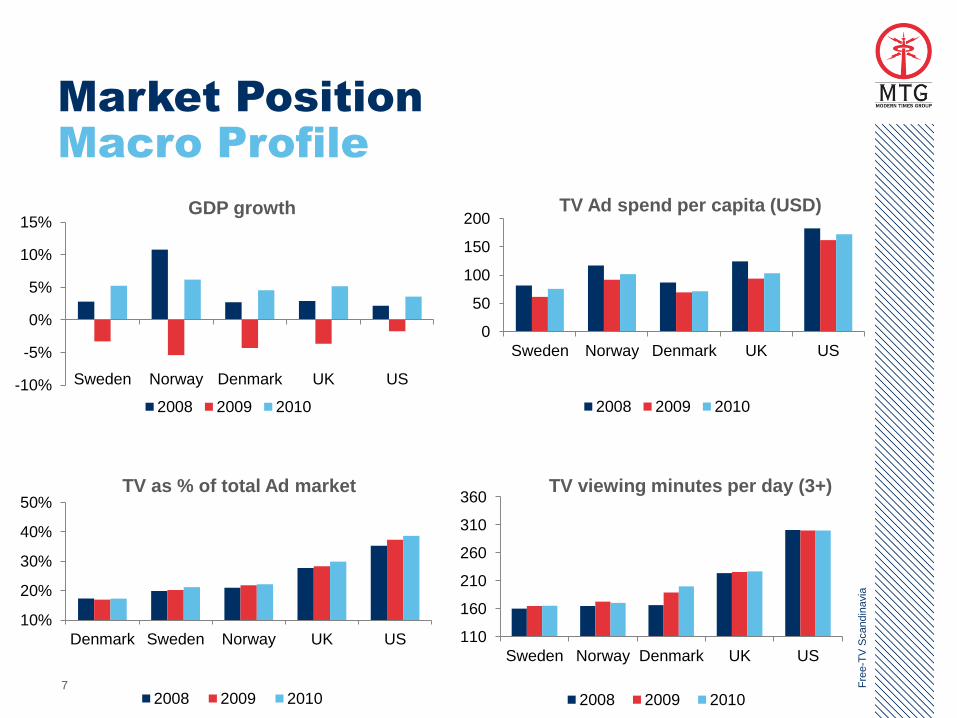
Sweden Norway Denmark UK US
2008 2009 2010
Market Position
Macro Profile
TV as % of total Ad market
10%
20%
30%
40%
50%
Denmark Sweden Norway UK US
2008 2009 2010
TV viewing minutes per day (3+)
0
50
100
150
200
Sweden Norway Denmark UK US
2008 2009 2010
TV Ad spend per capita (USD) GDP growth
-10%
-5%
0%
5%
10%
15%
Sweden Norway Denmark UK US
2008 2009 2010
7 Fre
e-T
V S
candin
avia
8
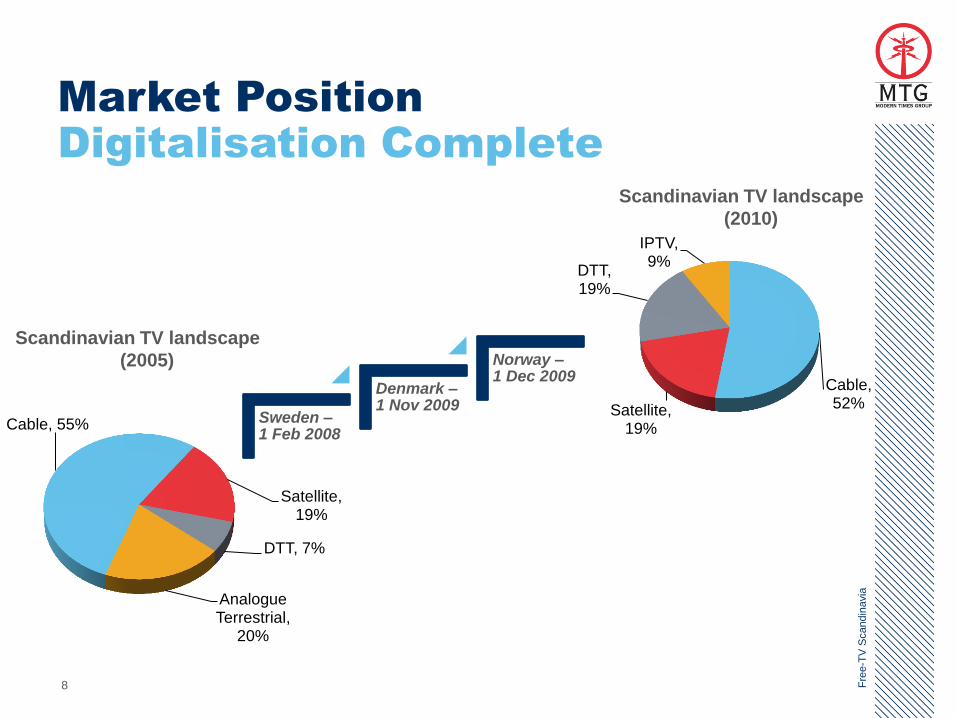
Market Position
Digitalisation Complete
Sweden – 1 Feb 2008
Denmark – 1 Nov 2009
Norway – 1 Dec 2009
Fre
e-T
V S
candin
avia
Scandinavian TV landscape
(2010)
Cable, 52% Satellite,
19%
DTT, 19%
IPTV, 9%
Cable, 55%
Satellite, 19%
DTT, 7%
Analogue Terrestrial,
20%
Scandinavian TV landscape
(2005)
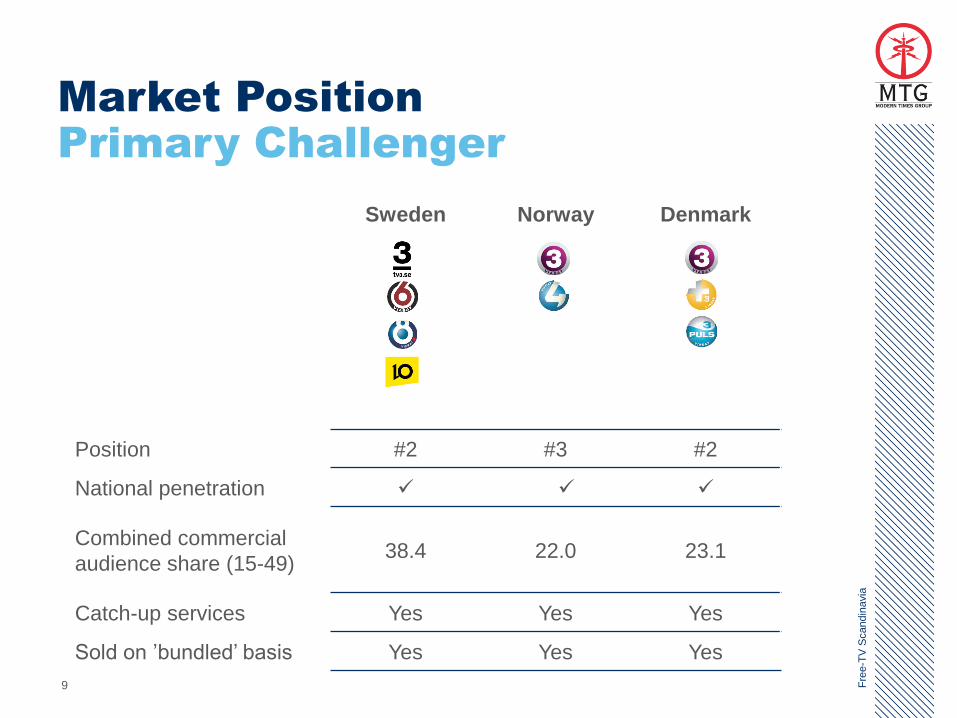
Sweden Norway Denmark
Position #2 #3 #2
National penetration
Combined commercial
audience share (15-49) 38.4 22.0 23.1
Catch-up services Yes Yes Yes
Sold on ’bundled’ basis Yes Yes Yes
9
Market Position
Primary Challenger
Fre
e-T
V S
candin
avia
The Opportunity
Breaking the Monopoly
10 Fre
e-T
V S
candin
avia
0%
10%
20%
30%
40%
50%
60%
70%
80%
90%
100%
Bonnier MTG ProSiebenSat.1
2003 2010
11
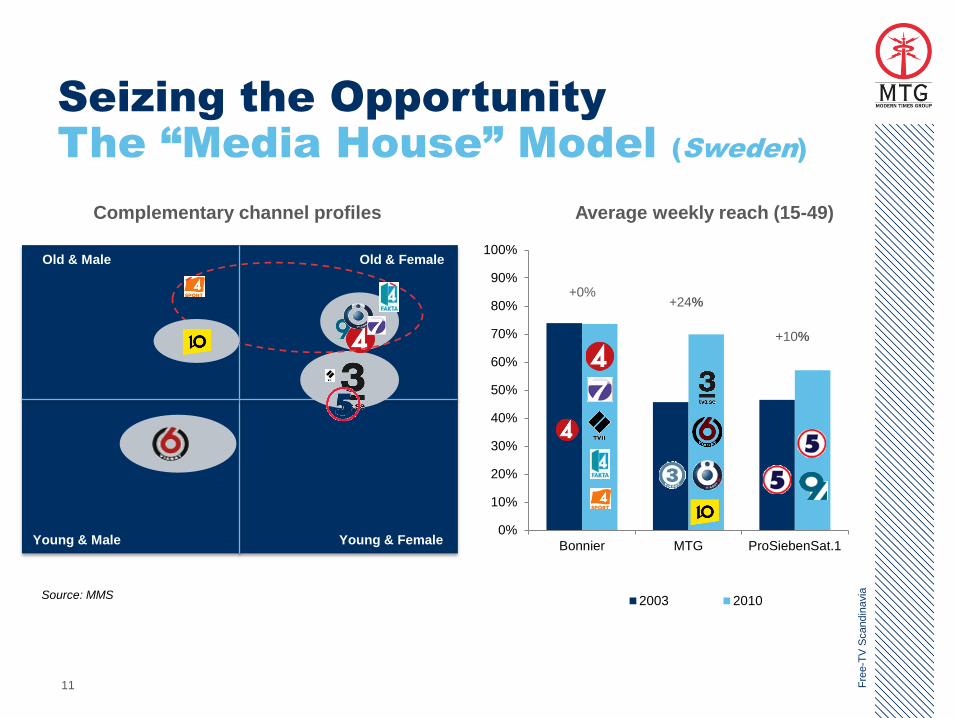
Seizing the Opportunity
The “Media House” Model (Sweden)
Fre
e-T
V S
candin
avia
Source: MMS
Complementary channel profiles Average weekly reach (15-49)
+0% +24%
+10%
Old & Male Old & Female
Young & Male Young & Female
TV4, 87% MTG, 7%
Other, 6%
Print, 63% Direct advertising,
14%
Internet, 14%
Radio, 4% TV, 5%
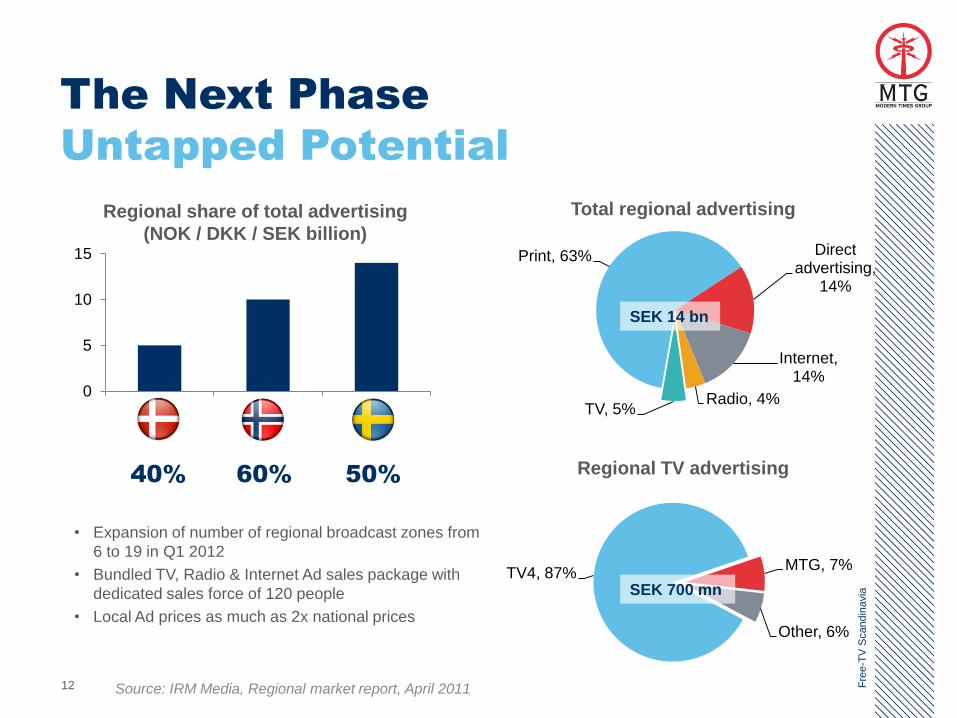
The Next Phase
Untapped Potential
Regional share of total advertising
(NOK / DKK / SEK billion)
50% 40% 60%
Source: IRM Media, Regional market report, April 2011
0
5
10
15
12 Fre
e-T
V S
candin
avia
Total regional advertising
Regional TV advertising
SEK 14 bn
SEK 700 mn
• Expansion of number of regional broadcast zones from
6 to 19 in Q1 2012
• Bundled TV, Radio & Internet Ad sales package with
dedicated sales force of 120 people
• Local Ad prices as much as 2x national prices
13
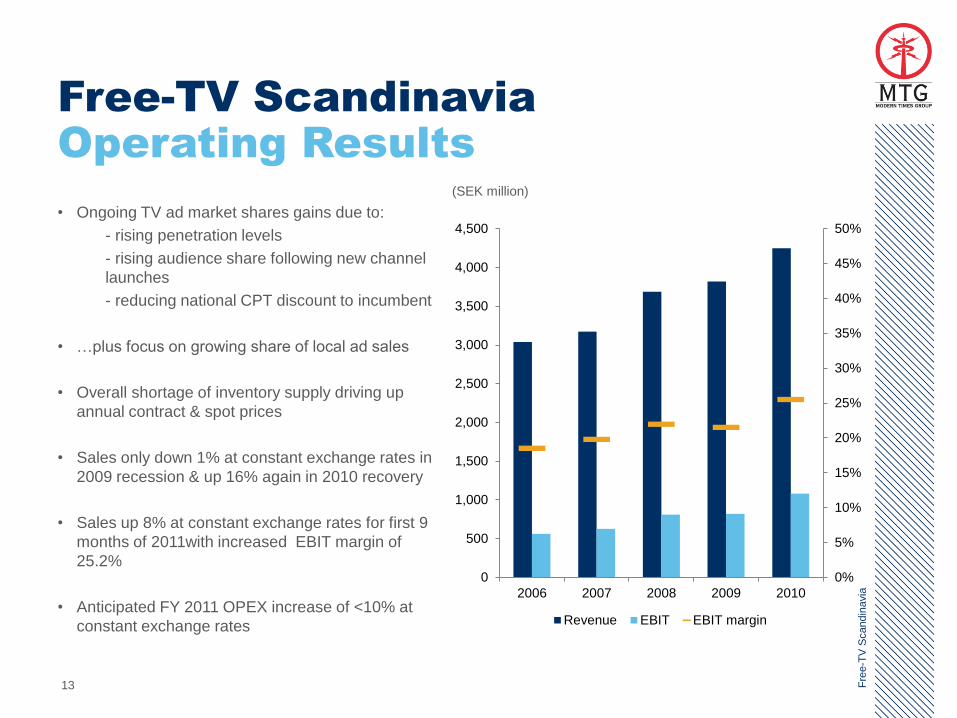
Free-TV Scandinavia
Operating Results
• Ongoing TV ad market shares gains due to:
- rising penetration levels
- rising audience share following new channel
launches
- reducing national CPT discount to incumbent
• …plus focus on growing share of local ad sales
• Overall shortage of inventory supply driving up
annual contract & spot prices
• Sales only down 1% at constant exchange rates in
2009 recession & up 16% again in 2010 recovery
• Sales up 8% at constant exchange rates for first 9
months of 2011with increased EBIT margin of
25.2%
• Anticipated FY 2011 OPEX increase of <10% at
constant exchange rates
Fre
e-T
V S
candin
avia
(SEK million)
0%
5%
10%
15%
20%
25%
30%
35%
40%
45%
50%
0
500
1,000
1,500
2,000
2,500
3,000
3,500
4,000
4,500
2006 2007 2008 2009 2010
Revenue EBIT EBIT margin

14 Fre
e-T
V E
merg
ing M
ark
ets
0
10
20
30
40
50
60
2008 2009 2010
0
100
200
300
Minutes per day 2010
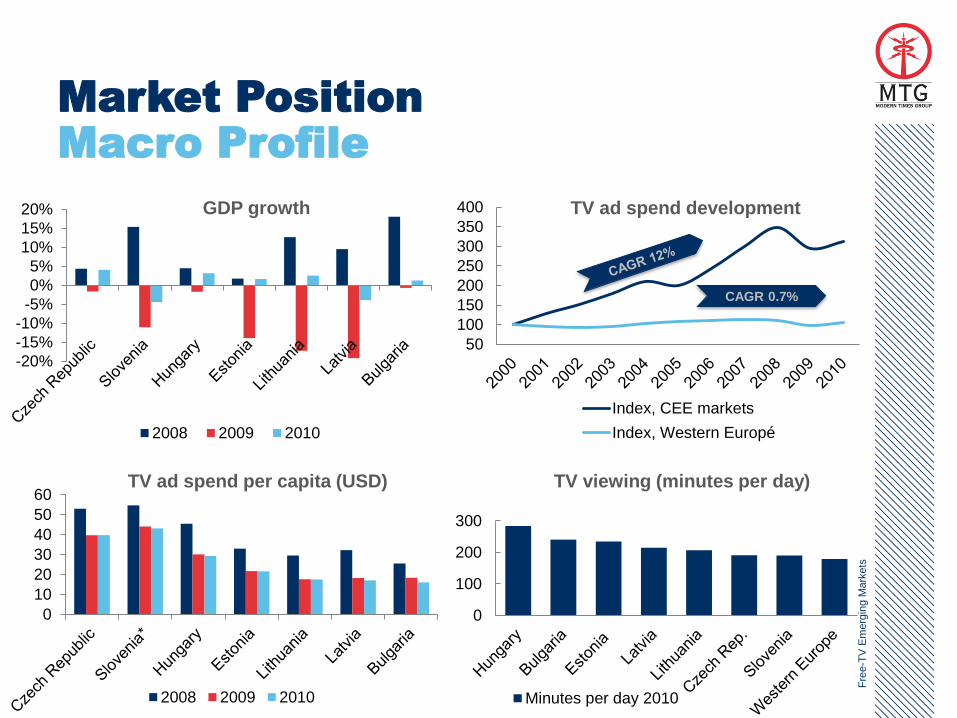
Market Position
Macro Profile
TV viewing (minutes per day)
Fre
e-T
V E
merg
ing M
ark
ets
-20%
-15%
-10%
-5%
0%
5%
10%
15%
20%
2008 2009 2010
GDP growth
TV ad spend per capita (USD)
50
100
150
200
250
300
350
400
Index, CEE markets
Index, Western Europé
TV ad spend development
CAGR 0.7%
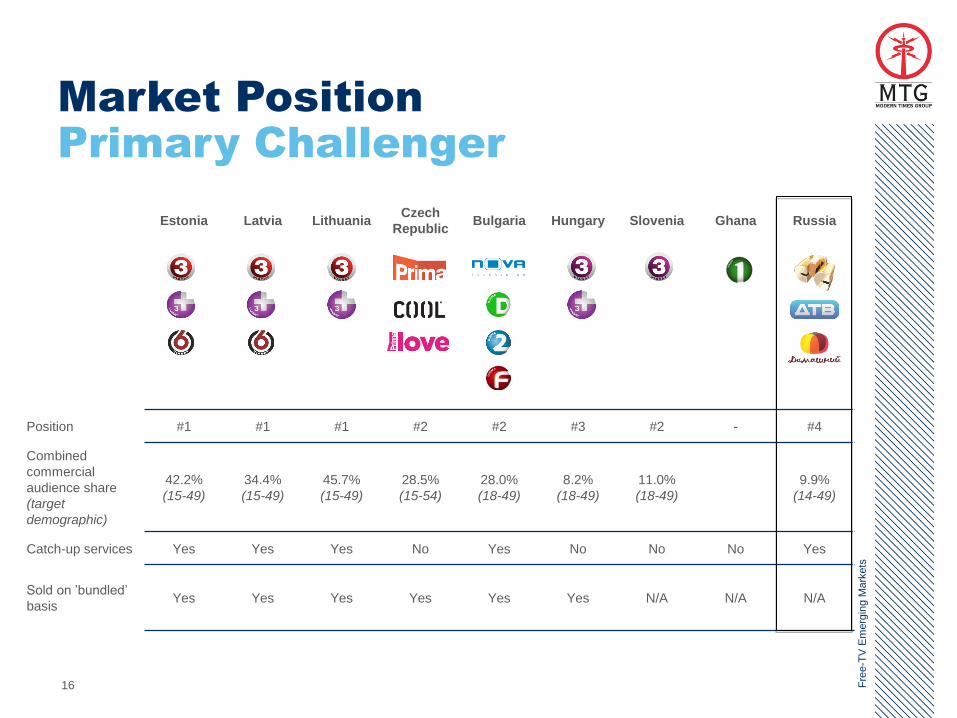
16
Market Position
Primary Challenger
Estonia Latvia Lithuania Czech
Republic Bulgaria Hungary Slovenia Ghana Russia
Position #1 #1 #1 #2 #2 #3 #2 - #4
Combined
commercial
audience share
(target
demographic)
42.2%
(15-49)
34.4%
(15-49)
45.7%
(15-49)
28.5%
(15-54)
28.0%
(18-49)
8.2%
(18-49)
11.0%
(18-49)
9.9%
(14-49)
Catch-up services Yes Yes Yes No Yes No No No Yes
Sold on ’bundled’
basis Yes Yes Yes Yes Yes Yes N/A N/A N/A
Fre
e-T
V E
merg
ing M
ark
ets
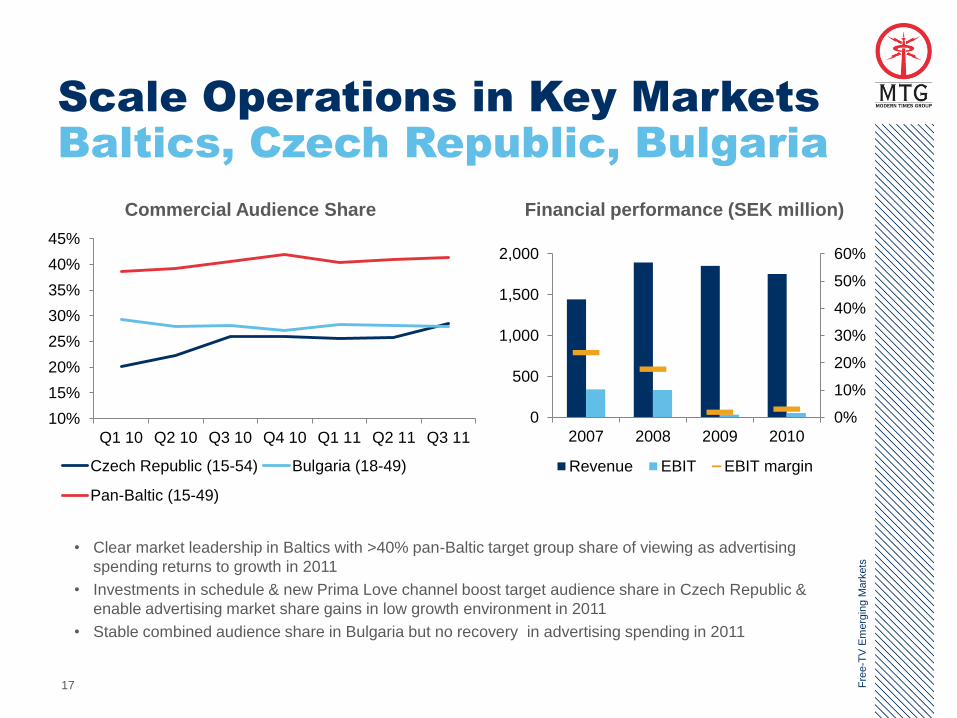
Scale Operations in Key Markets
Baltics, Czech Republic, Bulgaria
17
0%
10%
20%
30%
40%
50%
60%
0
500
1,000
1,500
2,000
2007 2008 2009 2010
Revenue EBIT EBIT margin
Financial performance (SEK million) Commercial Audience Share
• Clear market leadership in Baltics with >40% pan-Baltic target group share of viewing as advertising
spending returns to growth in 2011
• Investments in schedule & new Prima Love channel boost target audience share in Czech Republic &
enable advertising market share gains in low growth environment in 2011
• Stable combined audience share in Bulgaria but no recovery in advertising spending in 2011
Fre
e-T
V E
merg
ing M
ark
ets
10%
15%
20%
25%
30%
35%
40%
45%
Q1 10 Q2 10 Q3 10 Q4 10 Q1 11 Q2 11 Q3 11
Czech Republic (15-54) Bulgaria (18-49)
Pan-Baltic (15-49)
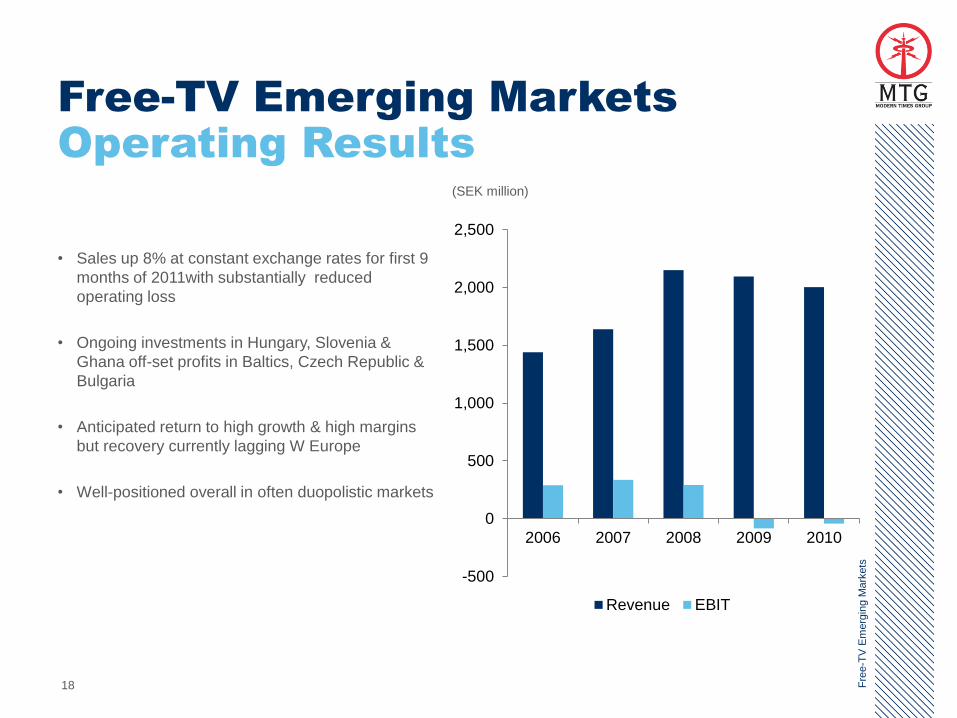
18
Free-TV Emerging Markets
Operating Results
• Sales up 8% at constant exchange rates for first 9
months of 2011with substantially reduced
operating loss
• Ongoing investments in Hungary, Slovenia &
Ghana off-set profits in Baltics, Czech Republic &
Bulgaria
• Anticipated return to high growth & high margins
but recovery currently lagging W Europe
• Well-positioned overall in often duopolistic markets
Fre
e-T
V E
merg
ing M
ark
ets
-500
0
500
1,000
1,500
2,000
2,500
2006 2007 2008 2009 2010
Revenue EBIT
(SEK million)
0%
5%
10%
15%
20%
25%
0
100 000
200 000
300 000
400 000
500 000
600 000
700 000
2005 2006 2007 2008 2009 2010
Sales EBIT
48%
19%
32%
13%
-3%
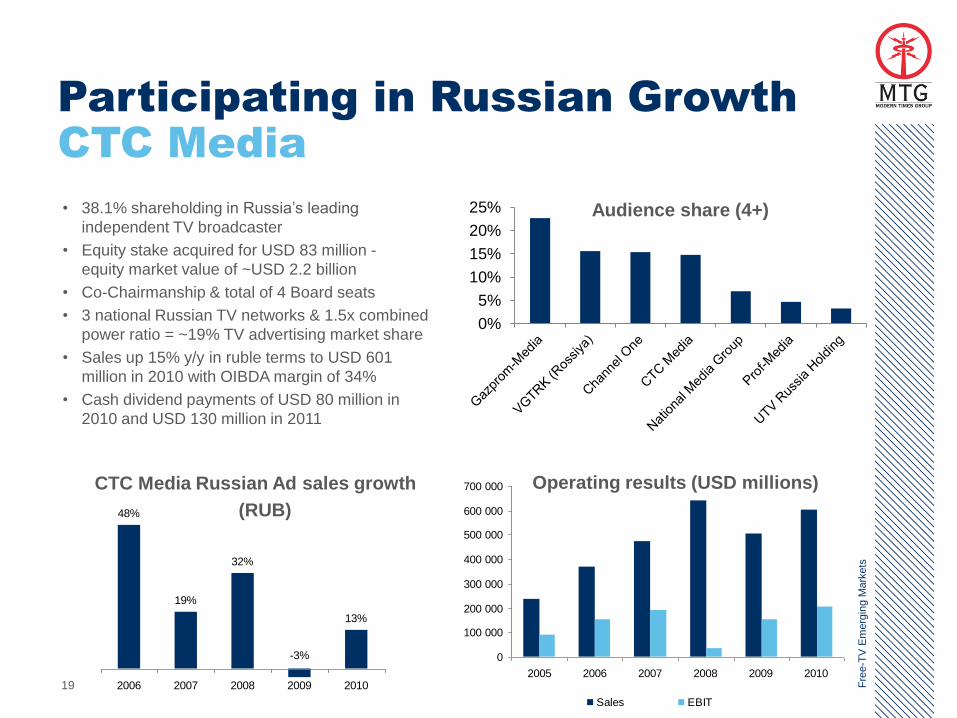
2006 2007 2008 2009 201019
Participating in Russian Growth
CTC Media
Operating results (USD millions)
• 38.1% shareholding in Russia’s leading
independent TV broadcaster
• Equity stake acquired for USD 83 million -
equity market value of ~USD 2.2 billion
• Co-Chairmanship & total of 4 Board seats
• 3 national Russian TV networks & 1.5x combined
power ratio = ~19% TV advertising market share
• Sales up 15% y/y in ruble terms to USD 601
million in 2010 with OIBDA margin of 34%
• Cash dividend payments of USD 80 million in
2010 and USD 130 million in 2011
CTC Media Russian Ad sales growth
(RUB)
Audience share (4+)
Fre
e-T
V E
merg
ing M
ark
ets
20 Pay-T
V N
ord
ic
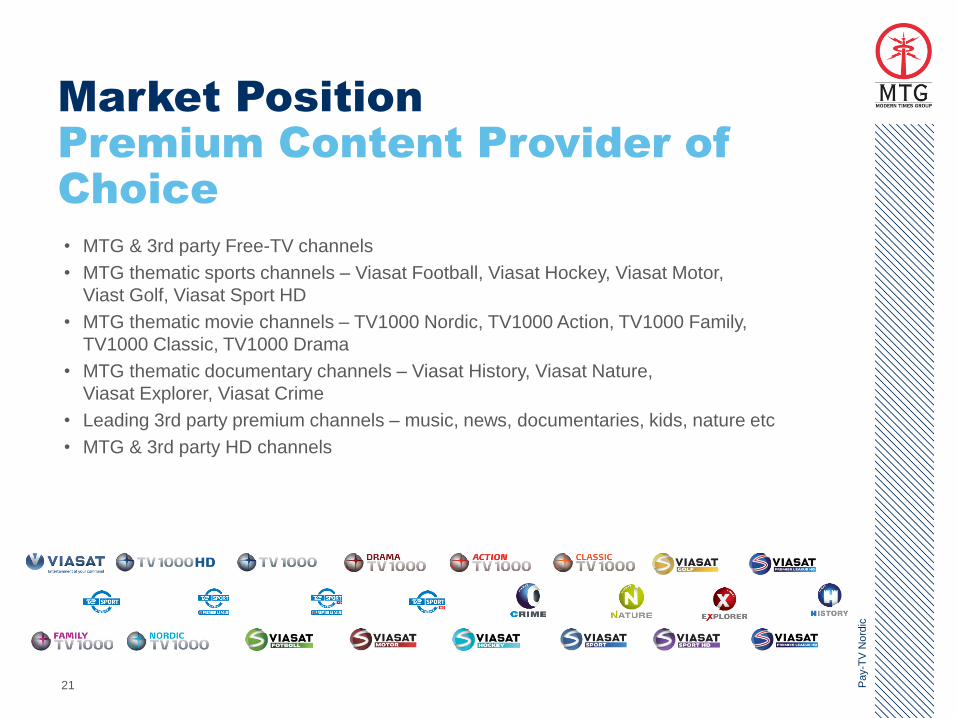
21
Market Position
Premium Content Provider of
Choice
• MTG & 3rd party Free-TV channels
• MTG thematic sports channels – Viasat Football, Viasat Hockey, Viasat Motor,
Viast Golf, Viasat Sport HD
• MTG thematic movie channels – TV1000 Nordic, TV1000 Action, TV1000 Family,
TV1000 Classic, TV1000 Drama
• MTG thematic documentary channels – Viasat History, Viasat Nature,
Viasat Explorer, Viasat Crime
• Leading 3rd party premium channels – music, news, documentaries, kids, nature etc
• MTG & 3rd party HD channels
Pay-T
V N
ord
ic
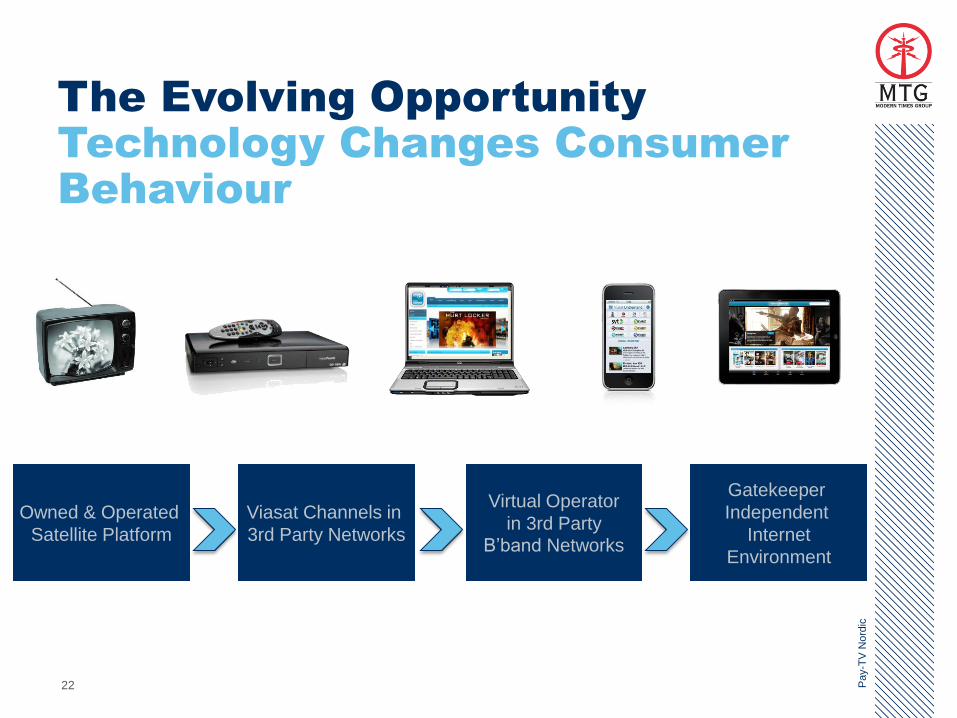
22
The Evolving Opportunity
Technology Changes Consumer
Behaviour
Owned & Operated
Satellite Platform
Viasat Channels in
3rd Party Networks
Virtual Operator
in 3rd Party B’band Networks
Gatekeeper
Independent
Internet
Environment
Pay-T
V N
ord
ic
0
50
100
150
200
250
2006 2007 2008 2009 2010
HDTV PVR Multi-room
0
1,000
2,000
3,000
4,000
5,000
2006 2007 2008 2009 2010
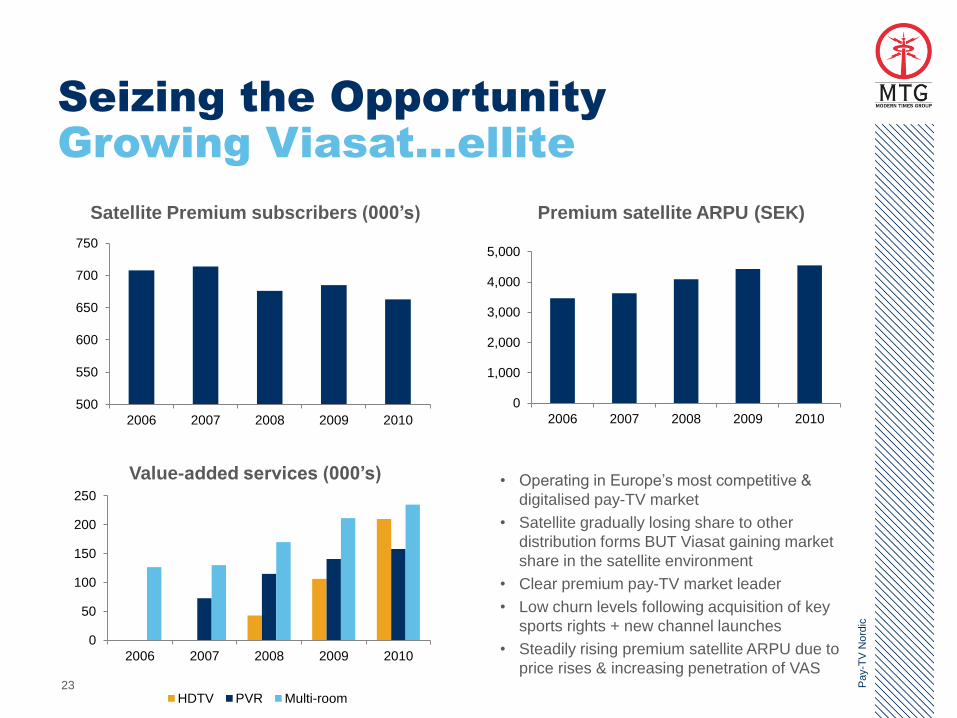
23
Seizing the Opportunity
Growing Viasat...ellite
Pay-T
V N
ord
ic
500
550
600
650
700
750
2006 2007 2008 2009 2010
Premium satellite ARPU (SEK)
Value-added services (000’s)
Satellite Premium subscribers (000’s)
• Operating in Europe’s most competitive &
digitalised pay-TV market
• Satellite gradually losing share to other
distribution forms BUT Viasat gaining market
share in the satellite environment
• Clear premium pay-TV market leader
• Low churn levels following acquisition of key
sports rights + new channel launches
• Steadily rising premium satellite ARPU due to
price rises & increasing penetration of VAS
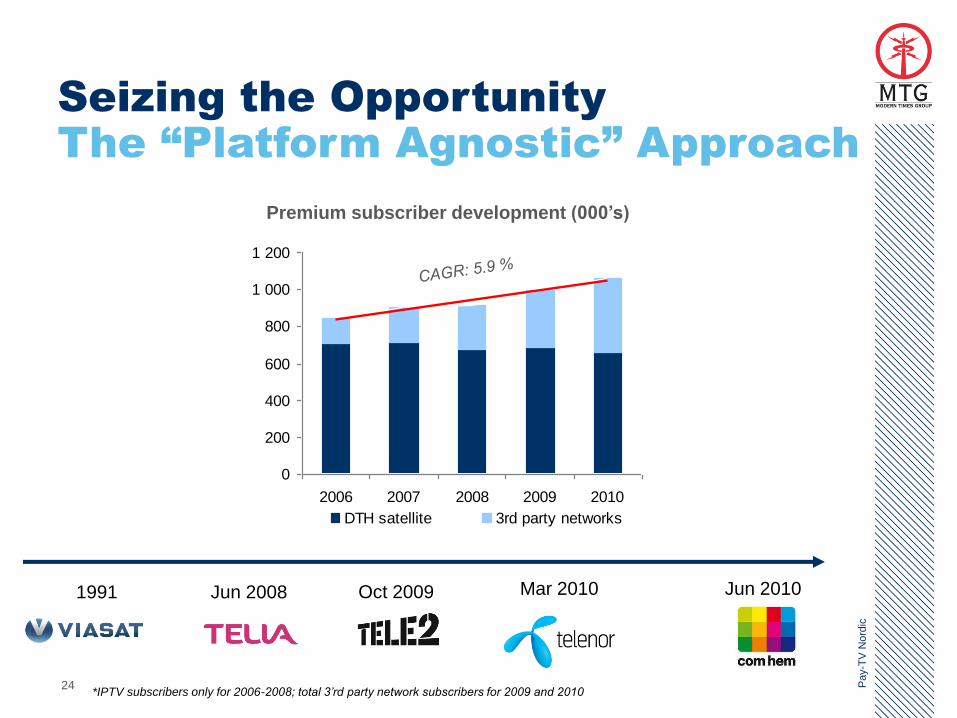
24
Seizing the Opportunity
The “Platform Agnostic” Approach
Pay-T
V N
ord
ic
Premium subscriber development (000’s)
*IPTV subscribers only for 2006-2008; total 3’rd party network subscribers for 2009 and 2010
Jun 2008 Oct 2009 Mar 2010 Jun 2010
0
200
400
600
800
1 000
1 200
2006 2007 2008 2009 2010
DTH satellite 3rd party networks
1991
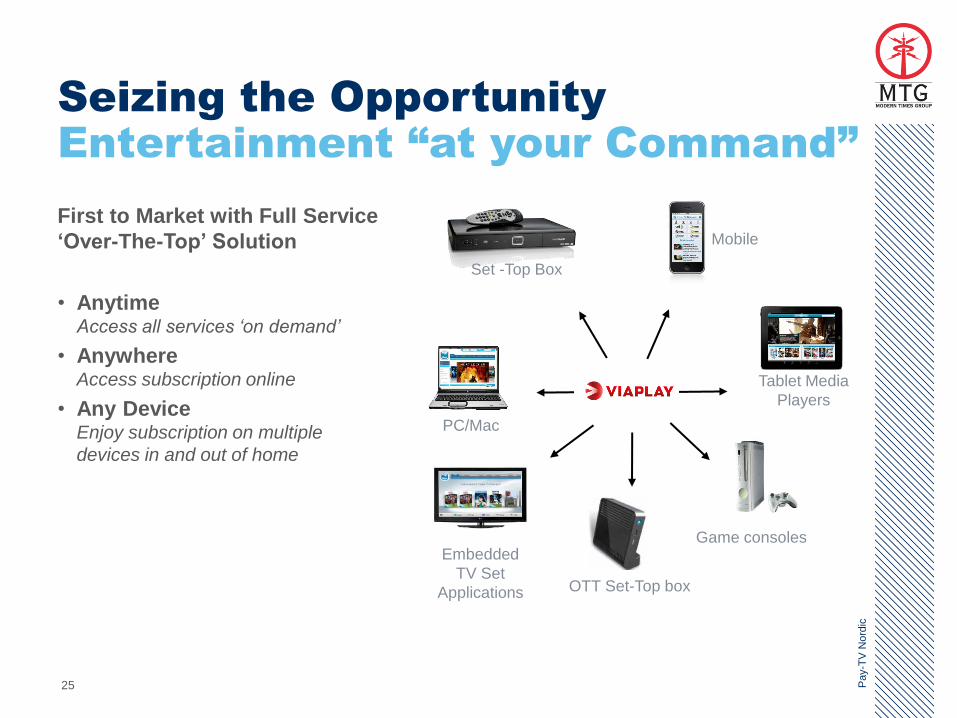
25
Seizing the Opportunity
Entertainment “at your Command”
First to Market with Full Service
‘Over-The-Top’ Solution
• Anytime Access all services ‘on demand’
• Anywhere Access subscription online
• Any Device Enjoy subscription on multiple
devices in and out of home
Pay-T
V N
ord
ic
Set -Top Box
PC/Mac
Mobile
Tablet Media
Players
OTT Set-Top box
Game consoles Embedded
TV Set
Applications
26
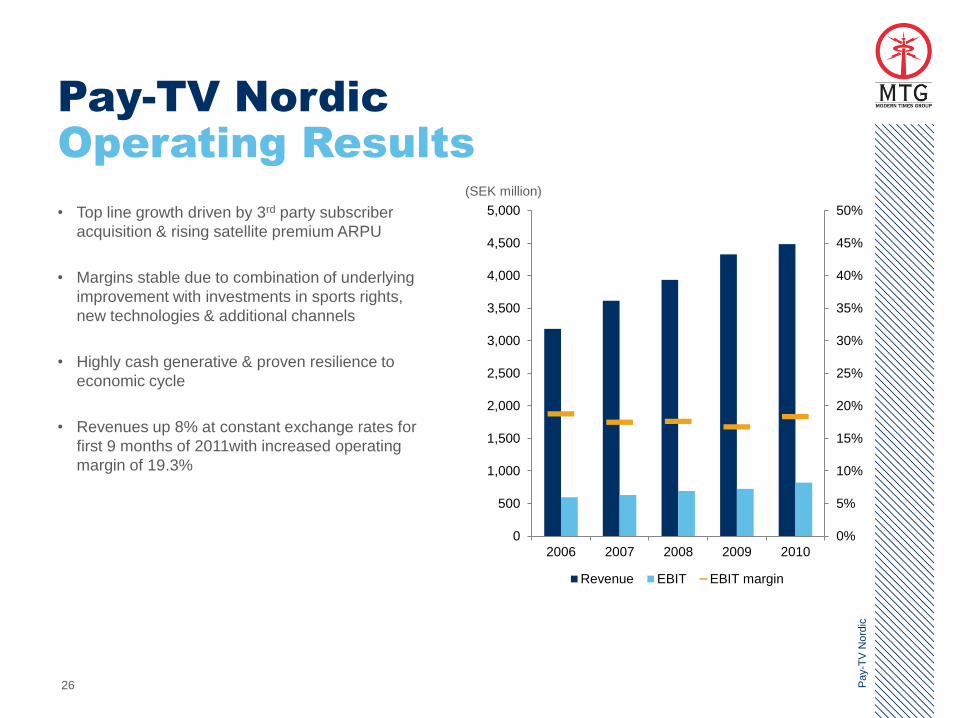
Pay-TV Nordic
Operating Results
• Top line growth driven by 3rd party subscriber
acquisition & rising satellite premium ARPU
• Margins stable due to combination of underlying
improvement with investments in sports rights,
new technologies & additional channels
• Highly cash generative & proven resilience to
economic cycle
• Revenues up 8% at constant exchange rates for
first 9 months of 2011with increased operating
margin of 19.3%
Pay-T
V N
ord
ic
0%
5%
10%
15%
20%
25%
30%
35%
40%
45%
50%
0
500
1,000
1,500
2,000
2,500
3,000
3,500
4,000
4,500
5,000
2006 2007 2008 2009 2010
Revenue EBIT EBIT margin
(SEK million)
27 Pay-T
V E
merg
ing M
ark
ets
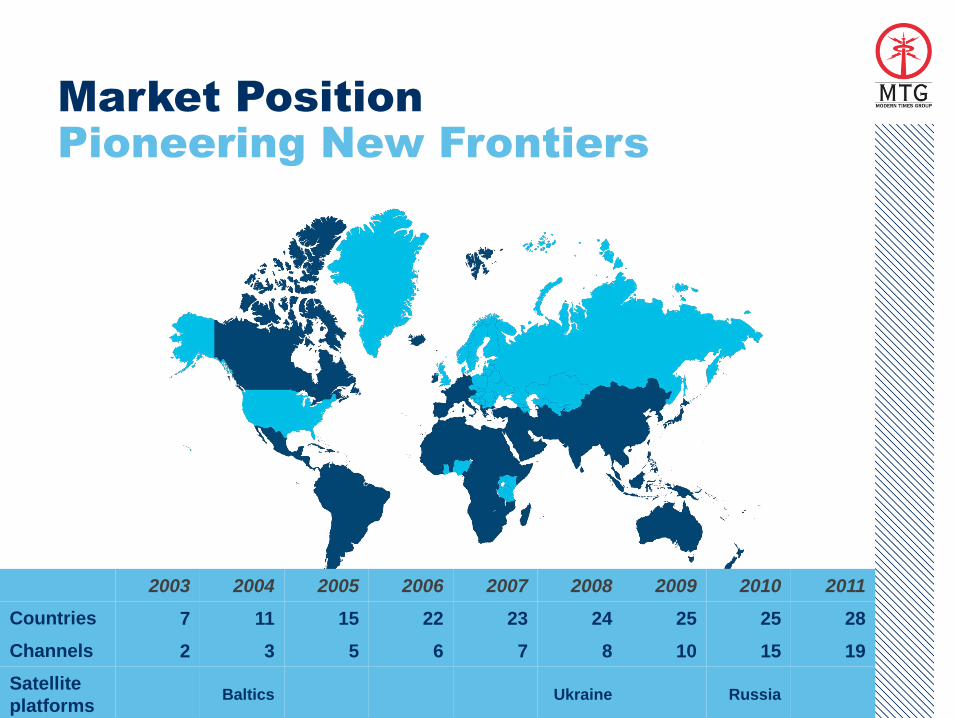
Market Position
Pioneering New Frontiers
28
2003 2004 2005 2006 2007 2008 2009 2010 2011
Countries 7 11 15 22 23 24 25 25 28
Channels 2 3 5 6 7 8 10 15 19
Satellite
platforms Baltics Ukraine Russia
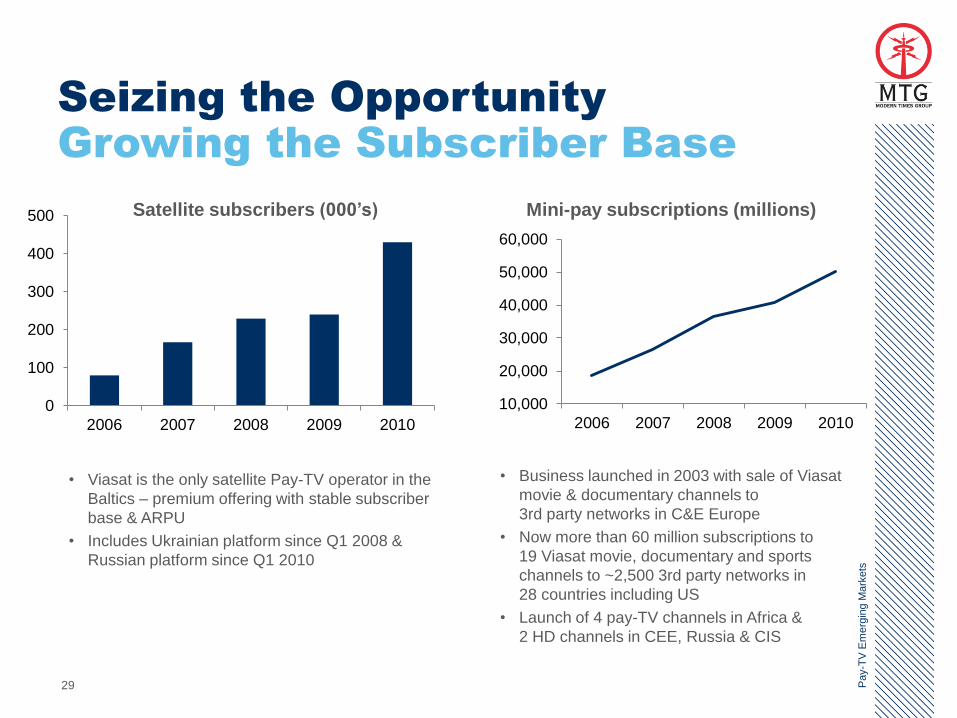
29
Seizing the Opportunity
Growing the Subscriber Base
• Viasat is the only satellite Pay-TV operator in the
Baltics – premium offering with stable subscriber
base & ARPU
• Includes Ukrainian platform since Q1 2008 &
Russian platform since Q1 2010
Pay-T
V E
merg
ing M
ark
ets
Mini-pay subscriptions (millions) Satellite subscribers (000’s)
• Business launched in 2003 with sale of Viasat
movie & documentary channels to
3rd party networks in C&E Europe
• Now more than 60 million subscriptions to
19 Viasat movie, documentary and sports
channels to ~2,500 3rd party networks in
28 countries including US
• Launch of 4 pay-TV channels in Africa &
2 HD channels in CEE, Russia & CIS
10,000
20,000
30,000
40,000
50,000
60,000
2006 2007 2008 2009 20100
100
200
300
400
500
2006 2007 2008 2009 2010
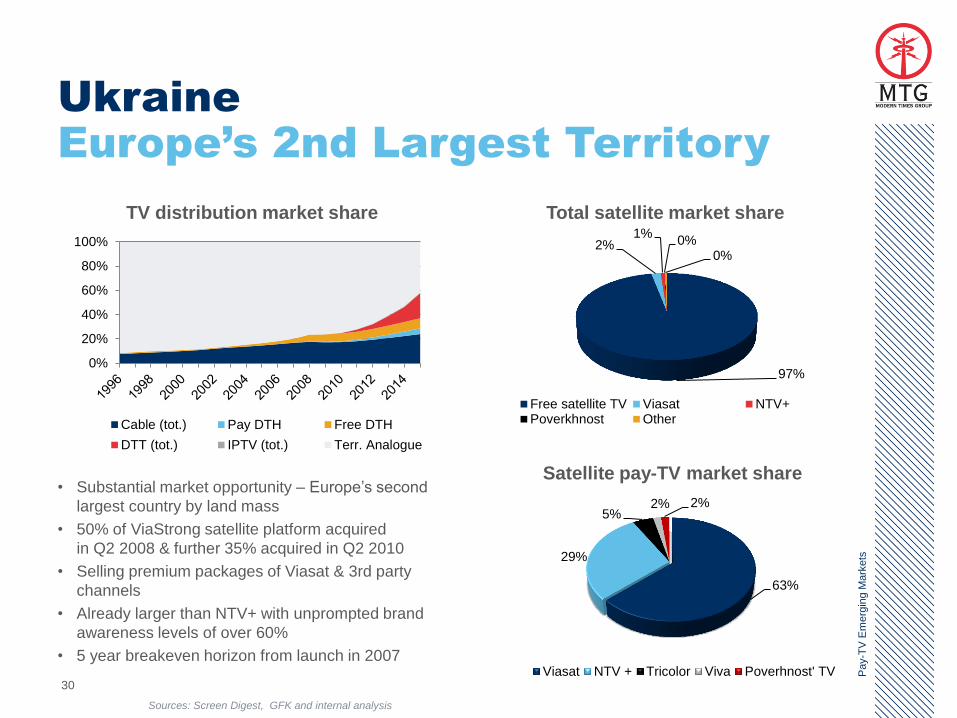
63%
29%
5% 2% 2%
Viasat NTV + Tricolor Viva Poverhnost' TV30
Ukraine
Europe’s 2nd Largest Territory
Pay-T
V E
merg
ing M
ark
ets
Satellite pay-TV market share
Total satellite market share
• Substantial market opportunity – Europe’s second
largest country by land mass
• 50% of ViaStrong satellite platform acquired
in Q2 2008 & further 35% acquired in Q2 2010
• Selling premium packages of Viasat & 3rd party
channels
• Already larger than NTV+ with unprompted brand
awareness levels of over 60%
• 5 year breakeven horizon from launch in 2007
97%
2% 1%
0% 0%
Free satellite TV Viasat NTV+Poverkhnost Other
0%
20%
40%
60%
80%
100%
Cable (tot.) Pay DTH Free DTH
DTT (tot.) IPTV (tot.) Terr. Analogue
TV distribution market share
Sources: Screen Digest, GFK and internal analysis
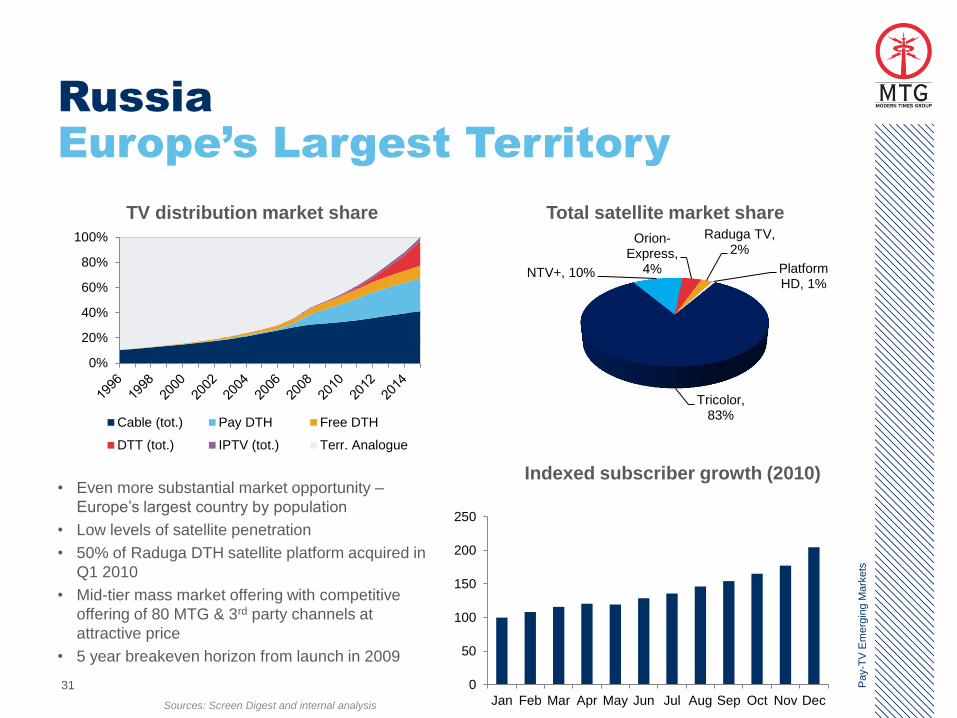
Tricolor, 83%
NTV+, 10%
Orion-Express,
4%
Raduga TV, 2%
Platform HD, 1%
31
Russia
Europe’s Largest Territory
• Even more substantial market opportunity –
Europe’s largest country by population
• Low levels of satellite penetration
• 50% of Raduga DTH satellite platform acquired in
Q1 2010
• Mid-tier mass market offering with competitive
offering of 80 MTG & 3rd party channels at
attractive price
• 5 year breakeven horizon from launch in 2009
Pay-T
V E
merg
ing M
ark
ets
Total satellite market share TV distribution market share
Indexed subscriber growth (2010)
0%
20%
40%
60%
80%
100%
Cable (tot.) Pay DTH Free DTH
DTT (tot.) IPTV (tot.) Terr. Analogue
Sources: Screen Digest and internal analysis
0
50
100
150
200
250
Jan Feb Mar Apr May Jun Jul Aug Sep Oct Nov Dec
32
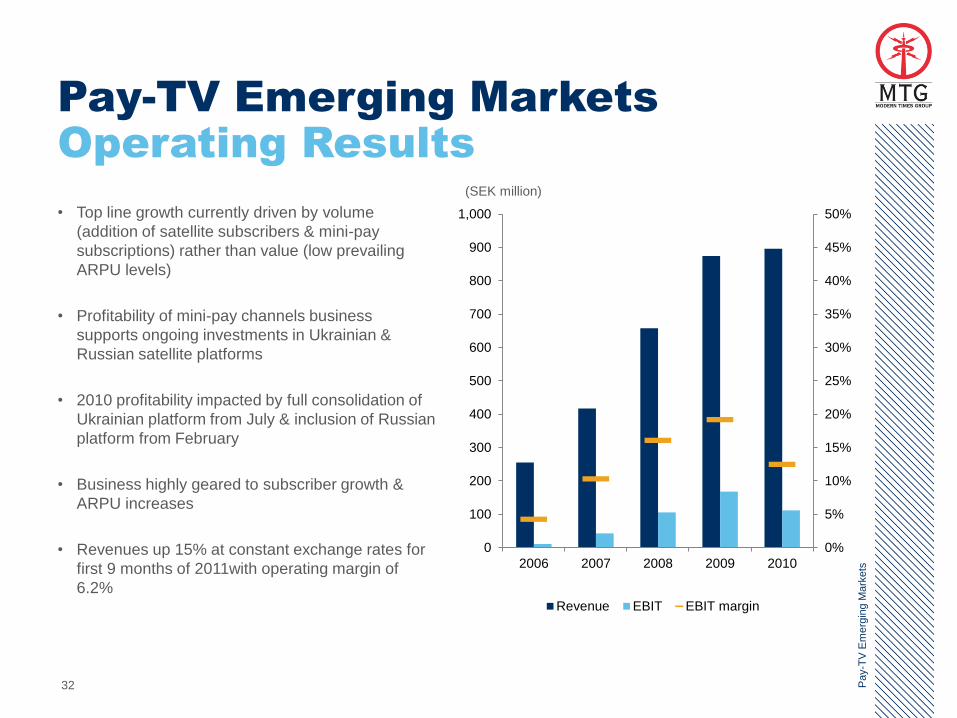
Pay-TV Emerging Markets
Operating Results
• Top line growth currently driven by volume
(addition of satellite subscribers & mini-pay
subscriptions) rather than value (low prevailing
ARPU levels)
• Profitability of mini-pay channels business
supports ongoing investments in Ukrainian &
Russian satellite platforms
• 2010 profitability impacted by full consolidation of
Ukrainian platform from July & inclusion of Russian
platform from February
• Business highly geared to subscriber growth &
ARPU increases
• Revenues up 15% at constant exchange rates for
first 9 months of 2011with operating margin of
6.2%
Pay-T
V E
merg
ing M
ark
ets
0%
5%
10%
15%
20%
25%
30%
35%
40%
45%
50%
0
100
200
300
400
500
600
700
800
900
1,000
2006 2007 2008 2009 2010
Revenue EBIT EBIT margin
(SEK million)

33
34
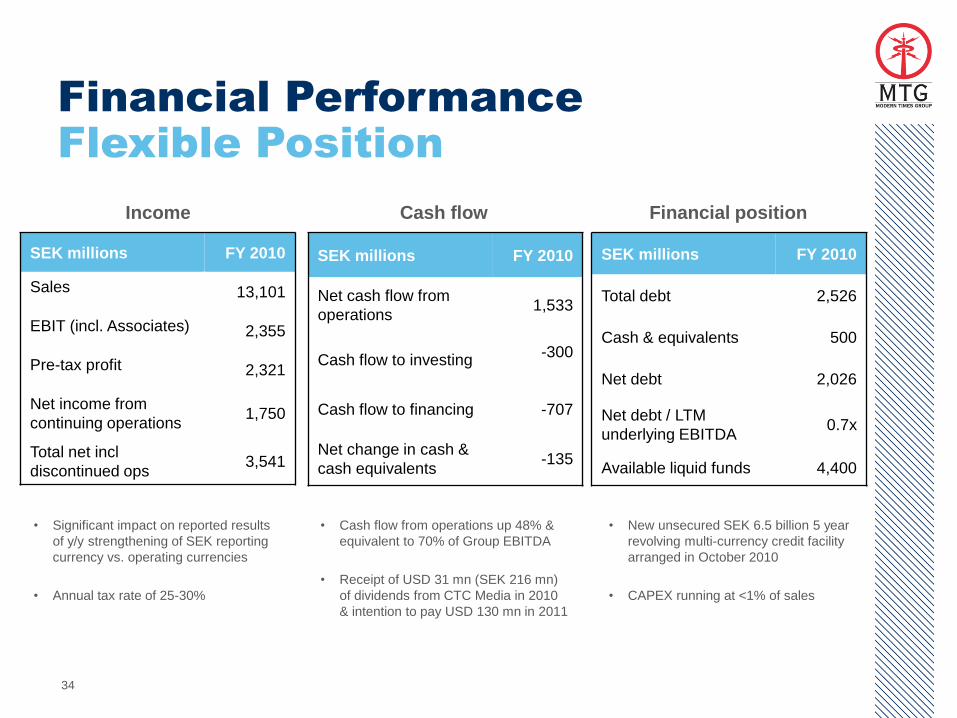
Financial Performance
Flexible Position
SEK millions FY 2010
Sales 13,101
EBIT (incl. Associates) 2,355
Pre-tax profit 2,321
Net income from
continuing operations 1,750
Total net incl
discontinued ops 3,541
SEK millions FY 2010
Net cash flow from
operations 1,533
Cash flow to investing -300
Cash flow to financing -707
Net change in cash &
cash equivalents -135
SEK millions FY 2010
Total debt 2,526
Cash & equivalents 500
Net debt 2,026
Net debt / LTM
underlying EBITDA 0.7x
Available liquid funds 4,400
Income Cash flow Financial position
• Significant impact on reported results
of y/y strengthening of SEK reporting
currency vs. operating currencies
• Annual tax rate of 25-30%
• Cash flow from operations up 48% &
equivalent to 70% of Group EBITDA
• Receipt of USD 31 mn (SEK 216 mn)
of dividends from CTC Media in 2010
& intention to pay USD 130 mn in 2011
• New unsecured SEK 6.5 billion 5 year
revolving multi-currency credit facility
arranged in October 2010
• CAPEX running at <1% of sales
35
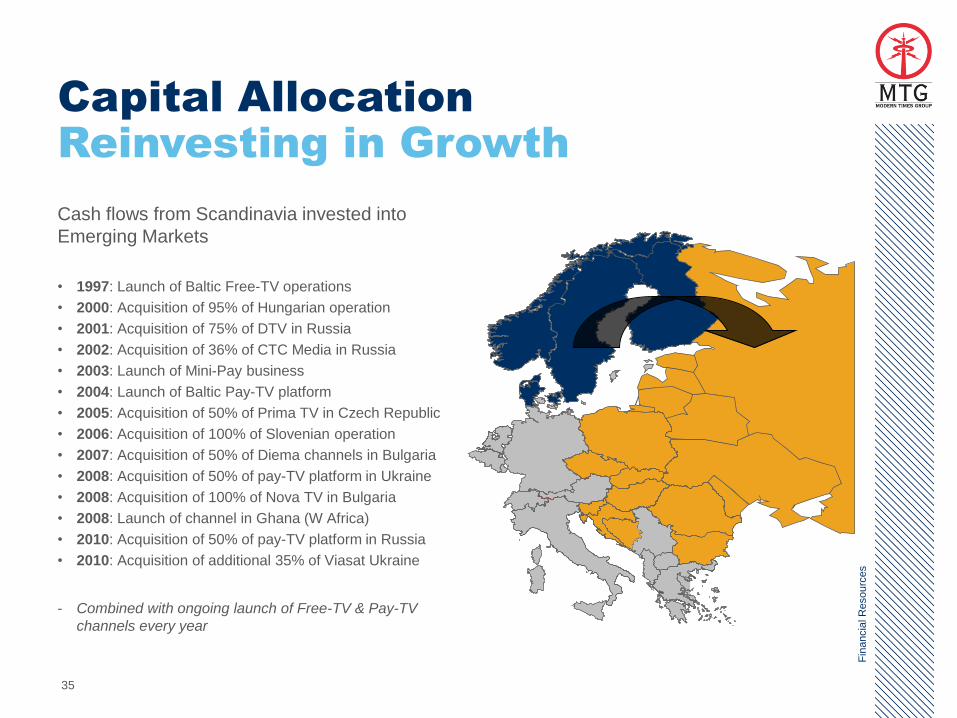
Capital Allocation
Reinvesting in Growth
Cash flows from Scandinavia invested into
Emerging Markets
• 1997: Launch of Baltic Free-TV operations
• 2000: Acquisition of 95% of Hungarian operation
• 2001: Acquisition of 75% of DTV in Russia
• 2002: Acquisition of 36% of CTC Media in Russia
• 2003: Launch of Mini-Pay business
• 2004: Launch of Baltic Pay-TV platform
• 2005: Acquisition of 50% of Prima TV in Czech Republic
• 2006: Acquisition of 100% of Slovenian operation
• 2007: Acquisition of 50% of Diema channels in Bulgaria
• 2008: Acquisition of 50% of pay-TV platform in Ukraine
• 2008: Acquisition of 100% of Nova TV in Bulgaria
• 2008: Launch of channel in Ghana (W Africa)
• 2010: Acquisition of 50% of pay-TV platform in Russia
• 2010: Acquisition of additional 35% of Viasat Ukraine
- Combined with ongoing launch of Free-TV & Pay-TV
channels every year
Fin
ancia
l R
esourc
es
36
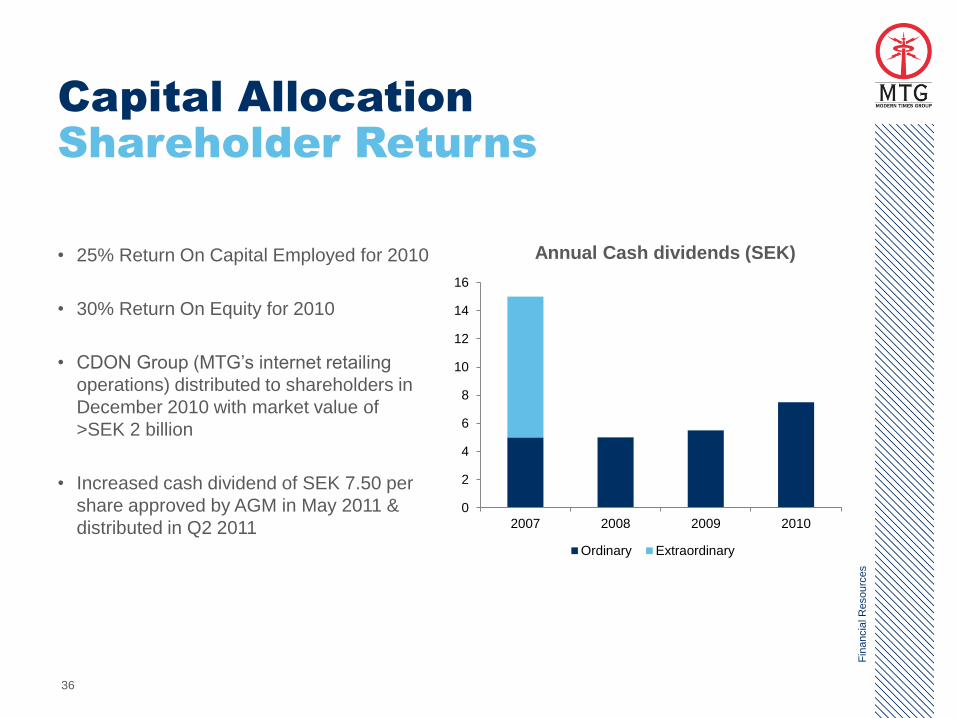
Capital Allocation
Shareholder Returns
• 25% Return On Capital Employed for 2010
• 30% Return On Equity for 2010
• CDON Group (MTG’s internet retailing
operations) distributed to shareholders in
December 2010 with market value of
>SEK 2 billion
• Increased cash dividend of SEK 7.50 per
share approved by AGM in May 2011 &
distributed in Q2 2011
Fin
ancia
l R
esourc
es
Annual Cash dividends (SEK)
0
2
4
6
8
10
12
14
16
2007 2008 2009 2010
Ordinary Extraordinary

37
38
The Lean & Mean
Broadcasting Machine
• Operationally geared growth company with balanced & diversified revenue
mix
• Driving growth primarily through organic expansion & start-ups
• Challenger to incumbents in structurally evolving markets
• Successful multi-channel, multi-platform, multi-territory media house model
• Efficient integrated operating structure yields competitive advantage &
synergies
• Investing healthy cash flows from Nordic region into emerging markets
• Strict cost control, cash management & capital allocation
• Strong & flexible financial position
• Delivering enhanced shareholder returns
Sum
mary
39
For Further Information, please visit www.mtg.se or contact:
MTG Investor Relations
Tel: +44 7768 440 414 / +44 759 009 8188
Email: [email protected]
Nasdaq OMX: ‘MTGA’, ‘MTGB’
Conta
ct
info
rmatio
n