11 assessing college & career readiness july 17, 2012
TRANSCRIPT
11
Assessing College & Career Readiness
July 17, 2012
2
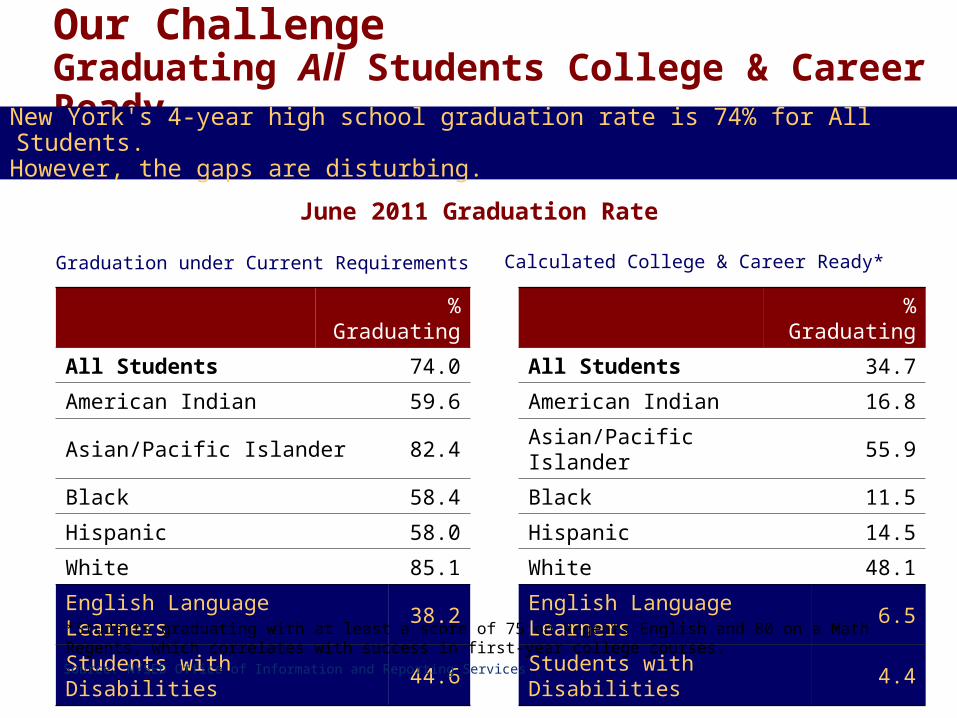
Our Challenge Graduating All Students College & Career Ready
New York's 4-year high school graduation rate is 74% for All Students.However, the gaps are disturbing.
June 2011 Graduation Rate
Graduation under Current Requirements Calculated College & Career Ready*
% Graduating % Graduating
All Students 74.0 All Students 34.7
American Indian 59.6 American Indian 16.8
Asian/Pacific Islander 82.4 Asian/Pacific Islander 55.9
Black 58.4 Black 11.5
Hispanic 58.0 Hispanic 14.5
White 85.1 White 48.1
English Language Learners 38.2 English Language Learners 6.5
Students with Disabilities 44.6 Students with Disabilities 4.4
*Students graduating with at least a score of 75 on Regents English and 80 on a Math Regents, which correlates with success in first-year college courses.Source: NYSED Office of Information and Reporting Services
3
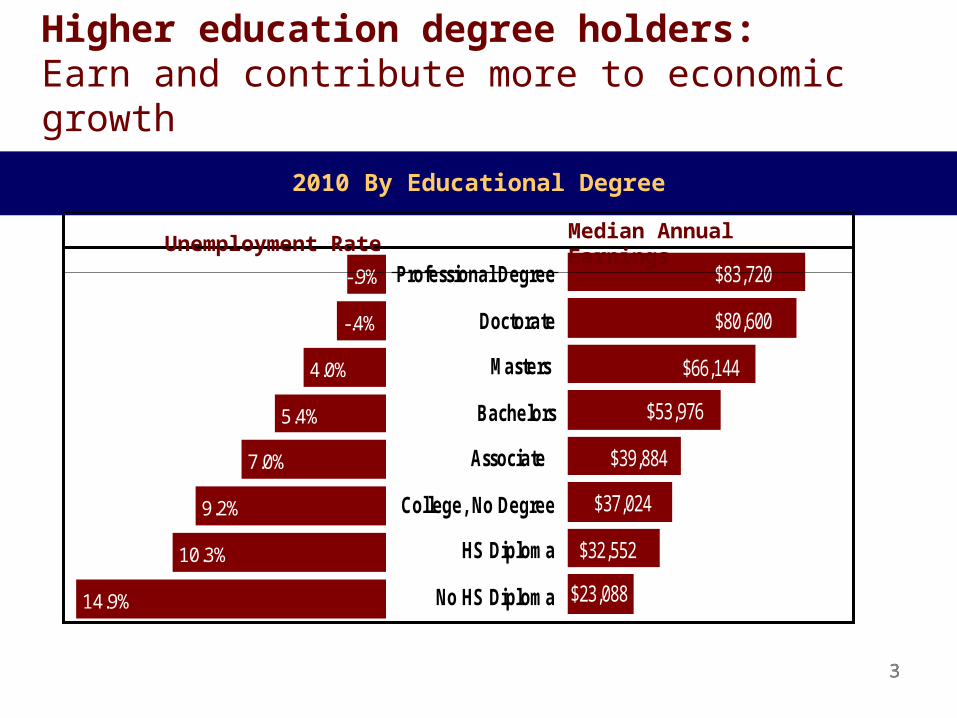
$66,144
$53,976
$39,884
$37,024
$32,552
$23,088
$80,600
$83,720
No HS Diploma
HS Diploma
College, No Degree
Associate
Bachelors
Masters
Doctorate
Professional Degree
14.9%
10.3%
9.2%
7.0%
5.4%
4.0%
-.4%
-.9%
Higher education degree holders:Earn and contribute more to economic growth
3
2010 By Educational Degree
Unemployment Rate Median Annual Earnings
4
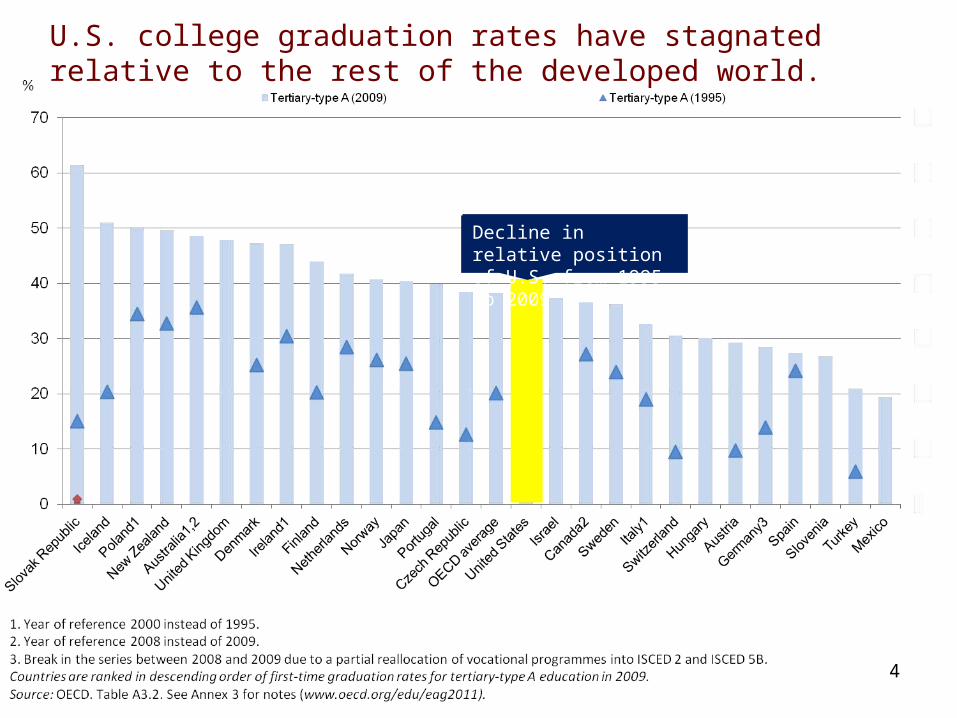
U.S. college graduation rates have stagnated relative to the rest of the developed world.
Decline in relative position of U.S. from 1995 to 2009

5
Over 50% of students in NYS two-year institutions of higher education take at least one remedial course.
Source: NYSED Administrative Data for all Public, Independent and Proprietary 2- and 4-year institutions of higher education
6
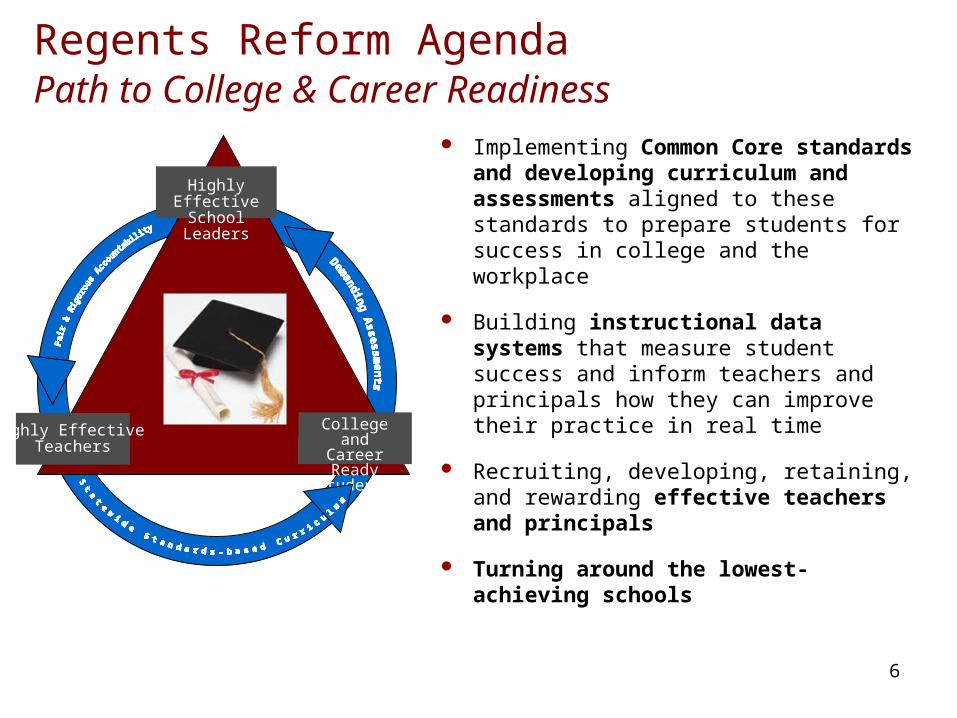
Regents Reform AgendaPath to College & Career Readiness
College and Career Ready
Students
Highly EffectiveSchool Leaders
Highly Effective Teachers
Implementing Common Core standards and developing curriculum and assessments aligned to these standards to prepare students for success in college and the workplace
Building instructional data systems that measure student success and inform teachers and principals how they can improve their practice in real time
Recruiting, developing, retaining, and rewarding effective teachers and principals
Turning around the lowest-achieving schools
In the 21st Century Economy, College Readiness = Career Readiness
Research by Achieve, ACT, and others indicate a high degree of convergence.
The knowledge and skills that high school graduates will need to be successful in college are the same as those they will need to be successful in a job that:
pays enough to support a family well above the poverty level,
provides benefits, and offers clear pathways for career advancement
through further education and training.
ACT. (2006). Ready for College and Ready for Work: Same or different? Iowa City, IA.American Diploma Project (2005). Rising to the Challenge: Are High School Graduates Prepared for College and Work? Washington, DC.
8
Alignment of Performance Standards toCollege & Career Readiness
• In 2010, national experts conducted analyses of New York State assessment data and performance in first-year college courses
• Admissions directors of two- and four-year public and private colleges in the Western NY, Central NY, Hudson Valley, and New York City regions supported the experts’ determination that Regents scores ranging from 75 to 85 in ELA and Math were required for success in entry-level credit-bearing courses
• In 2010, NYSED reset the performance standards on grades 3 – 8 ELA and Math assessments such that a designation of Meets Proficiency Standard (Level 3) was indicative of a 75% chance of achieving a college- and career-ready score on the ELA and Math Regents exams
2010
9
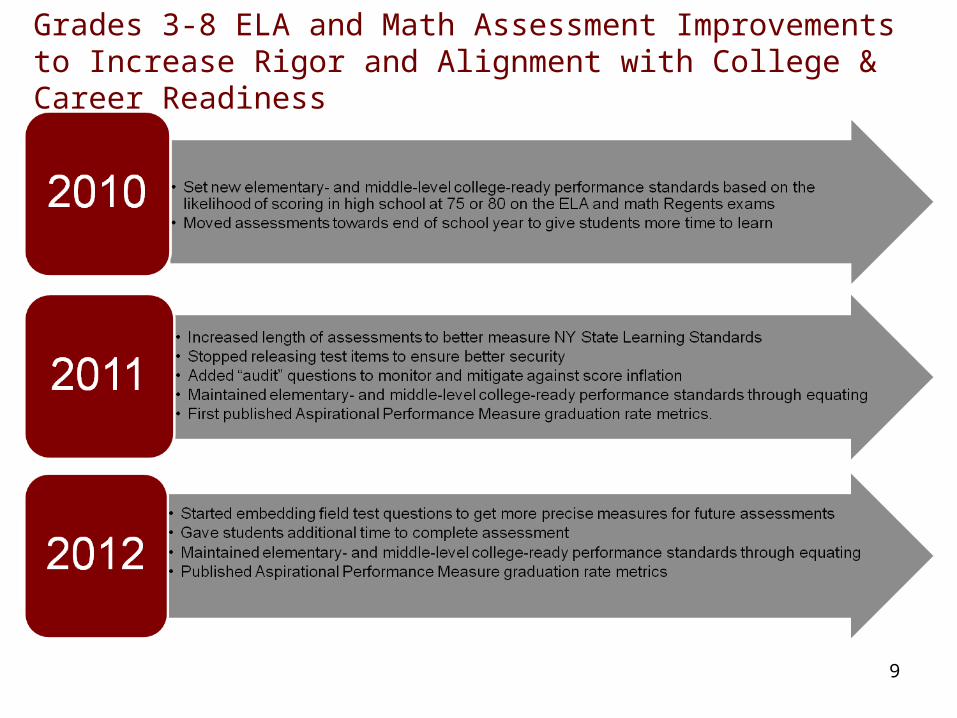
Grades 3-8 ELA and Math Assessment Improvements to Increase Rigor and Alignment with College & Career Readiness
1010
2012Grade 3-8 English Language Arts and
Mathematics Results
1111
66
9
66
6
66
3
65
6
65
2
65
066
7
66
5
66
5
66
1
65
566
9
66
7
66
1
66
2
65
767
0
67
0
67
5
66
7
66
7
66
1
66
8
67
3
67
2
66
4
66
8
65
9
66
3 67
2
66
8
66
3
66
4
65
566
4 67
4
67
0
66
3
66
5
65
8
65
566
6
Grade 3 Grade 4 Grade 5 Grade 6 Grade 7 Grade 8
2006 2007 2008 2009 2010 2011 2012
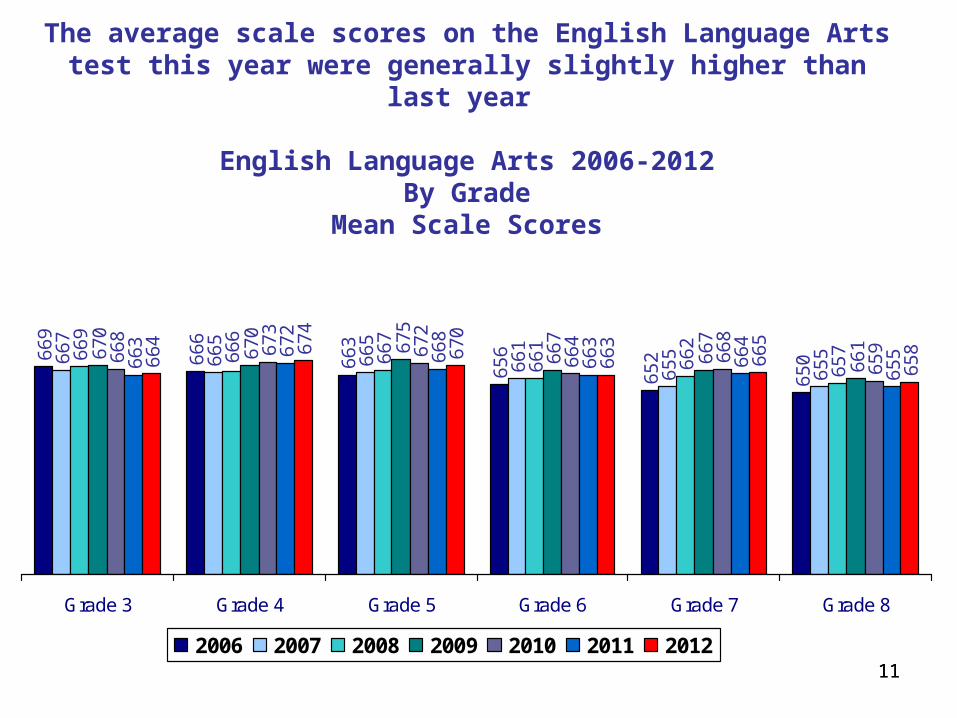
The average scale scores on the English Language Arts test this year were generally slightly higher than last year
English Language Arts 2006-2012By Grade
Mean Scale Scores
1212
67
7
67
6
66
6
65
6
65
2
685
674
668
663
657
688
683
680
675
674
666
692
689
686
680
681
6756
93
687
685
680
677
677687
688
686
682
679
677688
690
687
683
679
679
65
1
680
Grade 3 Grade 4 Grade 5 Grade 6 Grade 7 Grade 8
2006 2007 2008 2009 2010 2011 2012
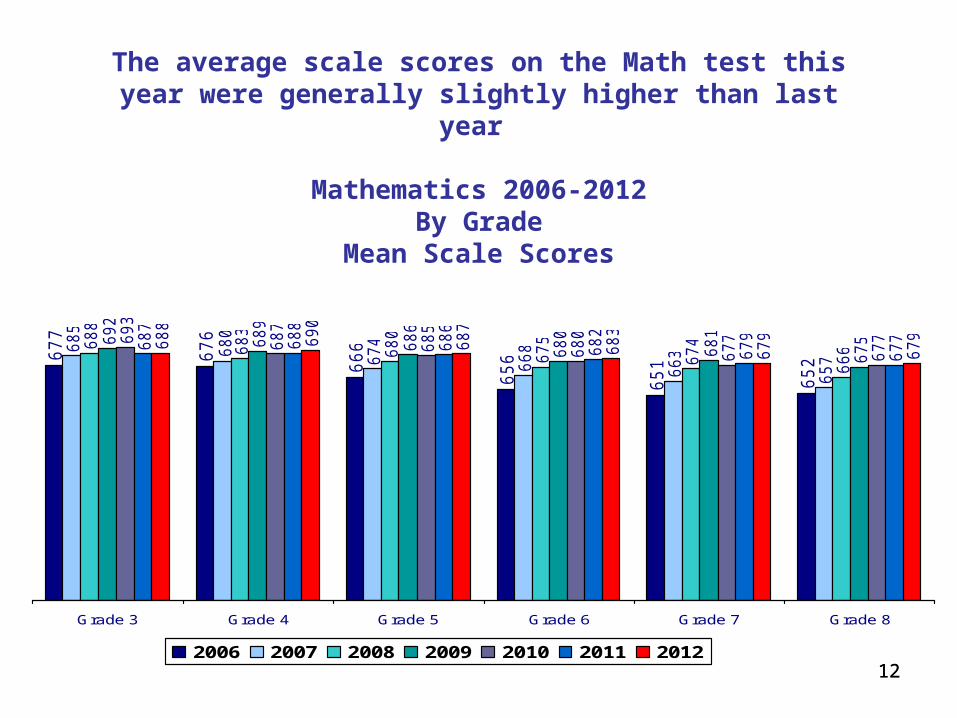
The average scale scores on the Math test this year were generally slightly higher than last year
Mathematics 2006-2012By Grade
Mean Scale Scores
1313
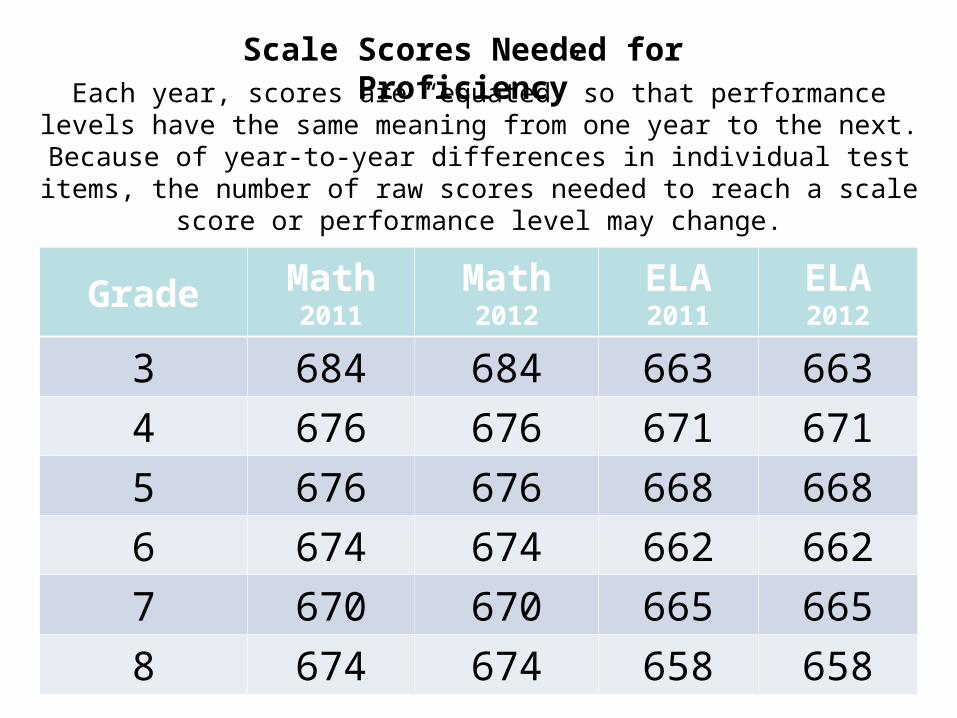
Each year, scores are “equated” so that performance levels have the same meaning from one year to the next. Because of year-to-year differences in
individual test items, the number of raw scores needed to reach a scale score or performance level may change.
Grade Math2011
Math2012
ELA2011
ELA2012
3 684 684 663 663
4 676 676 671 671
5 676 676 668 668
6 674 674 662 662
7 670 670 665 665
8 674 674 658 658
Scale Scores Needed for Proficiency
1414
Grades 3-8 ELA Results

1515
55.1 percent of grades 3-8 students across the State met or exceeded the proficiency standard, a small increase from last year
English Language Arts 2006 – 2012Grades 3-8 Combined
Percentage of Students Scoring at Levels 3 and 4
63.4%68.5%
77.4%
53.2% 55.1%52.8%
Grades 3-8
2006 2007 2008 2009 2010 2011 2012
Grades 3-8: 1,205,120 1,228,362 1,207,778 1,200,460 1,196,283 1,195,432 1,192,129
2006 2007 2008 2009 2010 2011 2012
Number of Students Tested
1616
69
.0%
68
.6%
67
.1%
60
.4%
56
.4%
49
.3% 6
1.5
%
67
.1%
68
.0%
68
.1%
63
.2%
57
.8%
57
.0%
63
.4%
70
.1%
71
.1%
77
.6%
66
.9%
70
.0%
56
.1% 6
8.5
%
75
.8%
76
.9%
82
.2%
80
.9%
80
.3%
68
.5% 77
.4%
54
.7%
56
.7%
52
.5%
54
.2%
50
.0%
51
.0%
53
.2%
55
.9%
56
.7%
53
.8%
55
.8%
47
.8%
46
.9%
52
.8%
59
.4%
57
.6%
55
.7%
52
.3%
50
.3%
55
.1%
55
.5%
Grade 3 Grade 4 Grade 5 Grade 6 Grade 7 Grade 8 Grades 3-8
2006 2007 2008 2009 2010 2011 2012
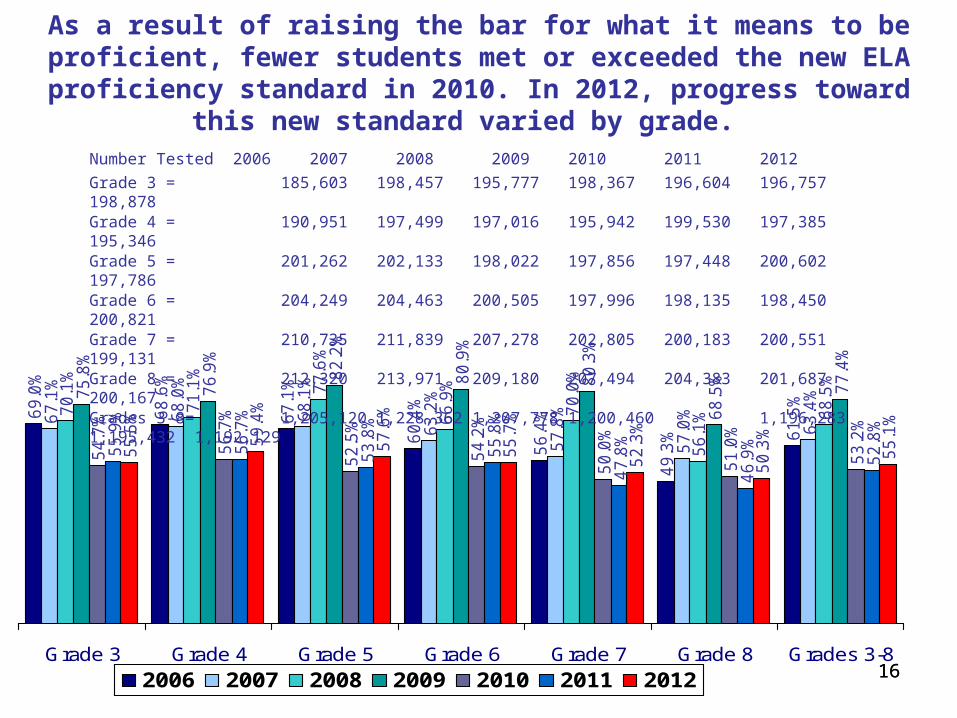
Grade 3 = 185,603 198,457 195,777 198,367 196,604 196,757 198,878Grade 4 = 190,951 197,499 197,016 195,942 199,530 197,385 195,346Grade 5 = 201,262 202,133 198,022 197,856 197,448 200,602 197,786Grade 6 = 204,249 204,463 200,505 197,996 198,135 198,450 200,821Grade 7 = 210,735 211,839 207,278 202,805 200,183 200,551 199,131Grade 8 = 212,320 213,971 209,180 207,494 204,383 201,687 200,167Grades 3-8= 1,205,120 1,228,362 1,207,778 1,200,460 1,196,283 1,195,432 1,192,129
Number Tested 2006 2007 2008 2009 2010 2011 2012
As a result of raising the bar for what it means to be proficient, fewer students met or exceeded the new ELA proficiency standard in 2010.
In 2012, progress toward this new standard varied by grade.
1717
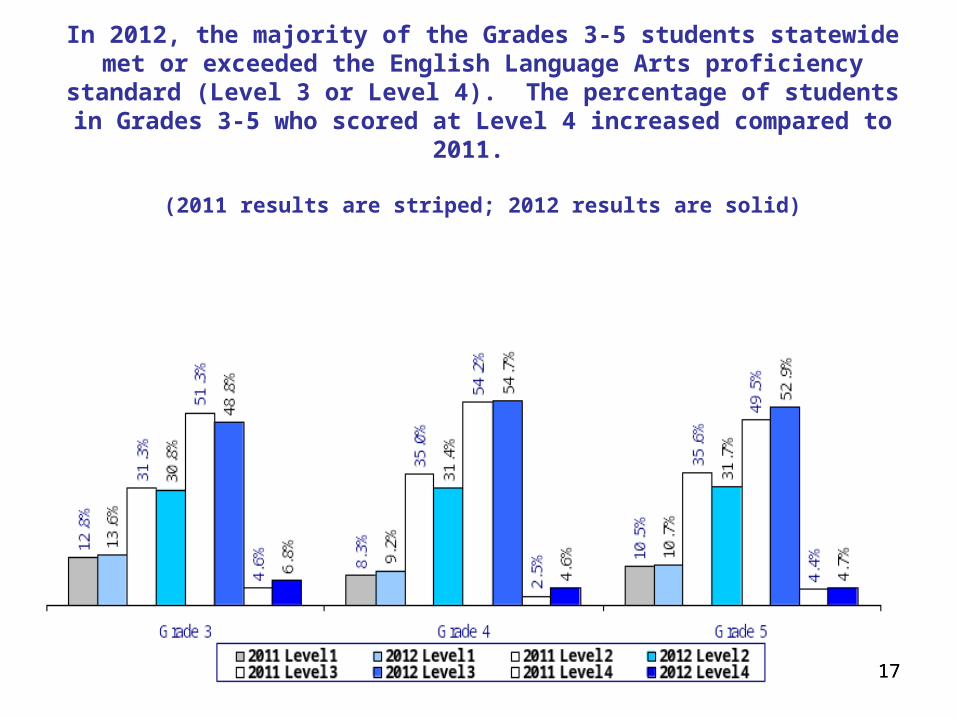
In 2012, the majority of the Grades 3-5 students statewide met or exceeded the English Language Arts proficiency standard (Level 3 or
Level 4). The percentage of students in Grades 3-5 who scored at Level 4 increased compared to 2011.
(2011 results are striped; 2012 results are solid)

1818
In 2012, the majority of the Grades 6-8 students statewide met or exceeded the English Language Arts proficiency standard (Level 3 or
Level 4). The percentage of students who scored at Level 4 compared to 2011 varied by grade level.
(2011 results are striped; 2012 results are solid)

1919
11.7 percent of English Language Learners met or exceeded the ELA
proficiency standard
16.2% 18.0%25.1%
36.4%
14.3% 12.6% 11.7%
Grades 3-8
2006 2007 2008 2009 2010 2011 2012
2006 2007 2008 2009 2010 2011 2012Grades 3-8: 27,507 72,082 73,199 74,854 79,348 81,869 79,552
Number of ELL Students Tested
2020
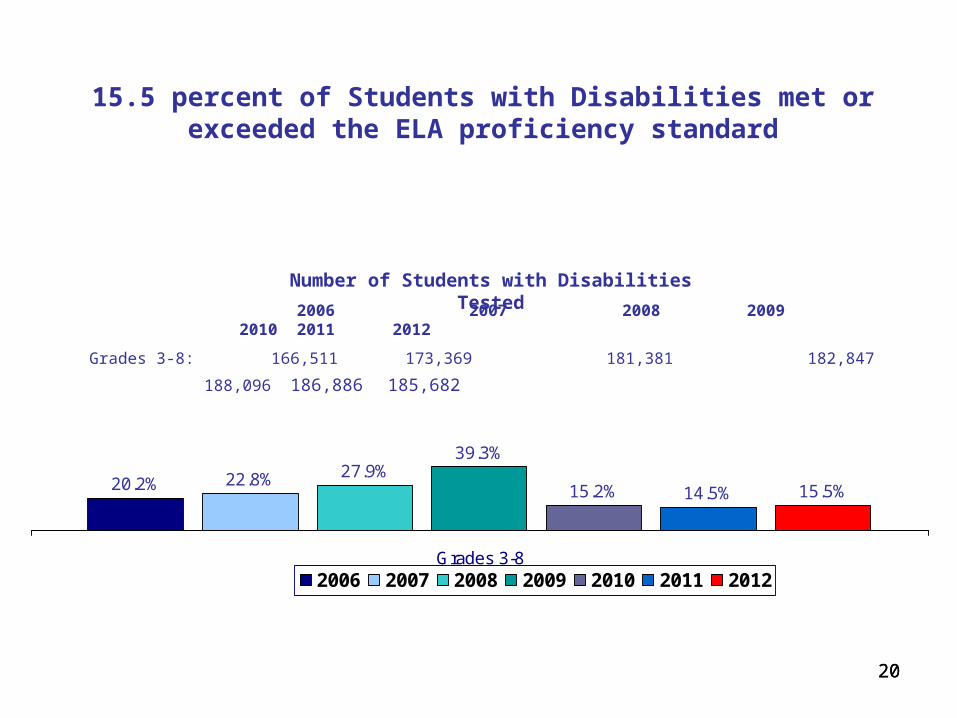
15.5 percent of Students with Disabilities met or exceeded the ELA proficiency standard
20.2% 22.8% 27.9%15.2% 14.5% 15.5%
39.3%
Grades 3-8
2006 2007 2008 2009 2010 2011 2012
Grades 3-8: 166,511 173,369 181,381 182,847 188,096 186,886 185,682
2006 2007 2008 2009 2010 2011 2012
Number of Students with Disabilities Tested
2121
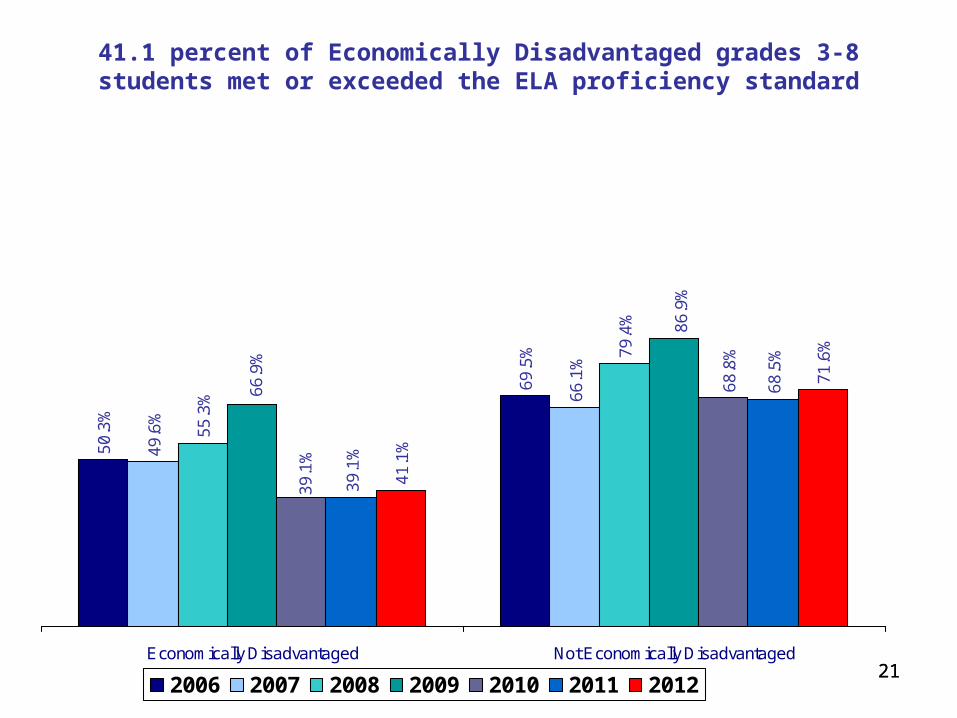
41.1 percent of Economically Disadvantaged grades 3-8 students met or exceeded the ELA proficiency standard5
0.3
%
69
.5%
49
.6%
66
.1%
55
.3%
79
.4%
39
.1%
68
.5%
41
.1%
71
.6%
66
.9%
86
.9%
39
.1%
68
.8%
Economically Disadvantaged Not Economically Disadvantaged
2006 2007 2008 2009 2010 2011 2012
2222
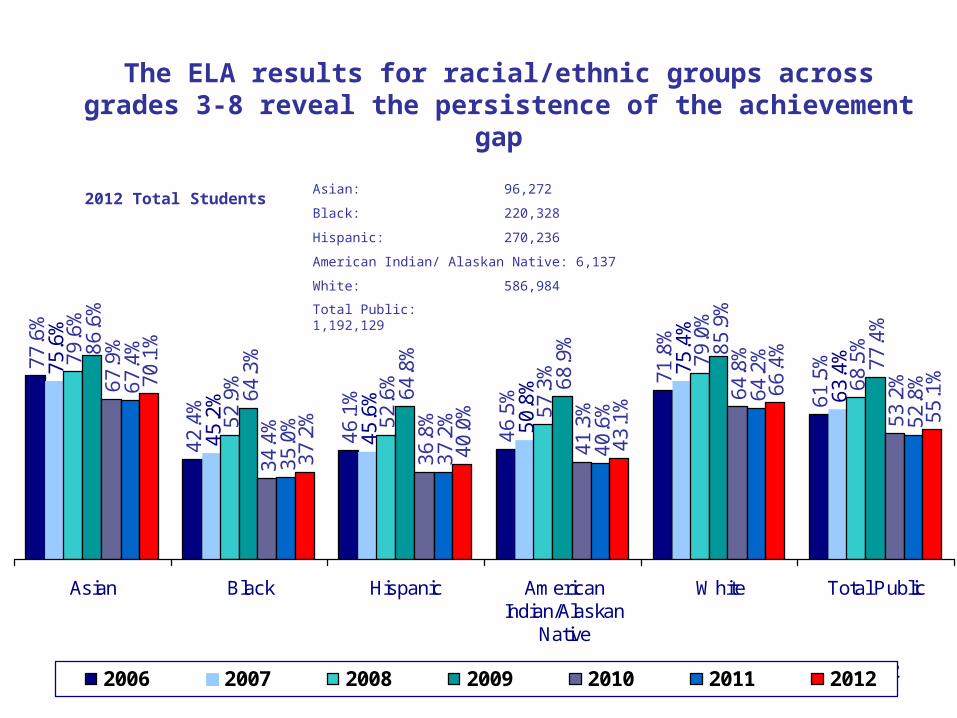
The ELA results for racial/ethnic groups across grades 3-8 reveal the persistence of the achievement gap
75
.6%
45
.2%
45
.6%
50
.8%
75
.4%
63
.4%79
.6%
52
.9%
52
.6%
57
.3%
79
.0%
68
.5%
64
.3%
64
.8%
68
.9% 85
.9%
77
.4%
67
.9%
34
.4%
36
.8%
41
.3%
64
.8%
53
.2%67
.4%
35
.0%
37
.2%
40
.6%
64
.2%
52
.8%7
0.1
%
37
.2%
40
.0%
43
.1%
66
.4%
55
.1%
77
.6%
42
.4%
46
.1%
46
.5%
71
.8%
61
.5%
86
.6%
Asian Black Hispanic AmericanIndian/Alaskan
Native
White Total Public
2006 2007 2008 2009 2010 2011 2012
2012 Total StudentsAsian: 96,272
Black: 220,328
Hispanic: 270,236
American Indian/ Alaskan Native: 6,137
White: 586,984
Total Public: 1,192,129
2323
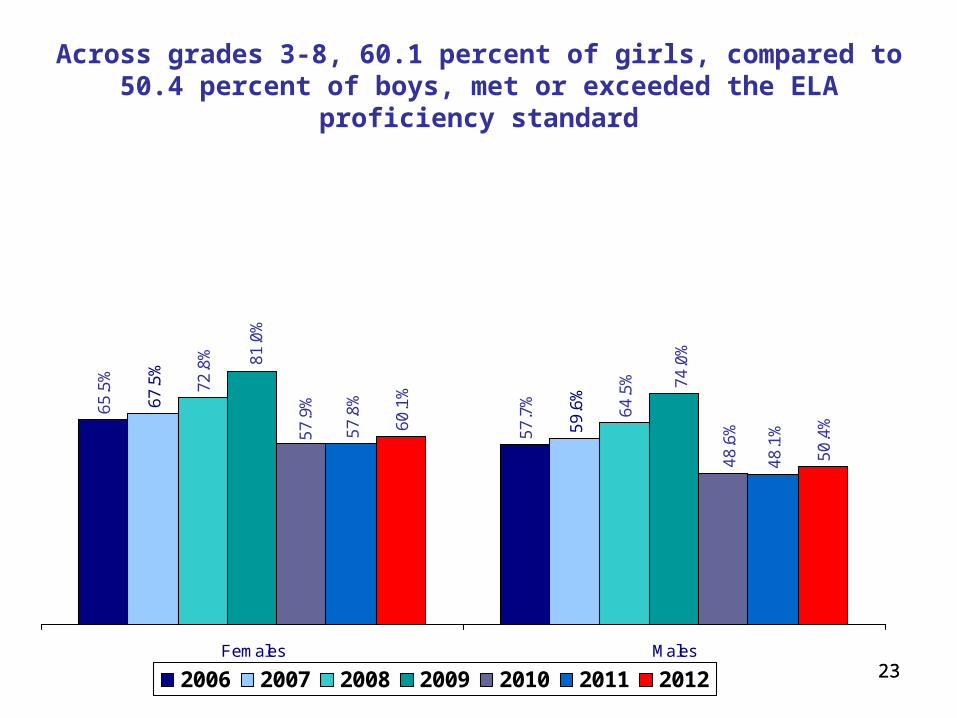
Across grades 3-8, 60.1 percent of girls, compared to 50.4 percent of boys, met or exceeded the ELA proficiency standard
65
.5%
57
.7%67
.5%
59
.6%7
2.8
%
64
.5%
57
.8%
48
.1%6
0.1
%
50
.4%
81
.0%
74
.0%
57
.9%
48
.6%
Females Males
2006 2007 2008 2009 2010 2011 2012
2424
50
.7%
37
.3%
52
.4%
56
.7%
69
.2%
82
.9%
61
.5%
50
.8%
38
.7%
54
.9% 62
.0% 7
3.0
%
84
.8%
63
.4%
57
.6%
46
.4%
60
.6%
66
.8% 7
6.7
% 87
.5%
68
.5%
43.9
%
27.8
%
47.5
%
60.2
%
52.8
%
46
.9%
28
.1%
42
.0% 49
.0%
62
.4%
77
.2%
55
.1%
68
.8%
56
.9%
70
.9%
76
.3% 84
.2% 91
.8%
77
.4%
42
.4%
29
.1%
43
.1%
49
.6% 6
1.5
%
74
.9%
53
.2%
40.3
%
75.0
%
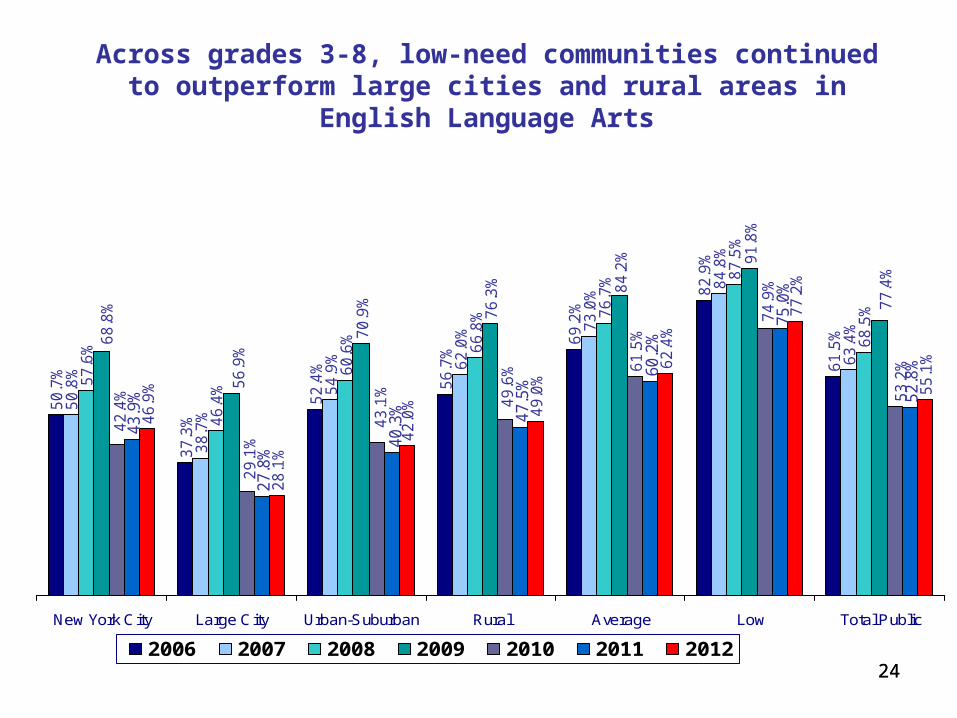
New York City Large City Urban-Suburban Rural Average Low Total Public
2006 2007 2008 2009 2010 2011 2012
Across grades 3-8, low-need communities continued to outperform large cities and rural areas in English Language Arts
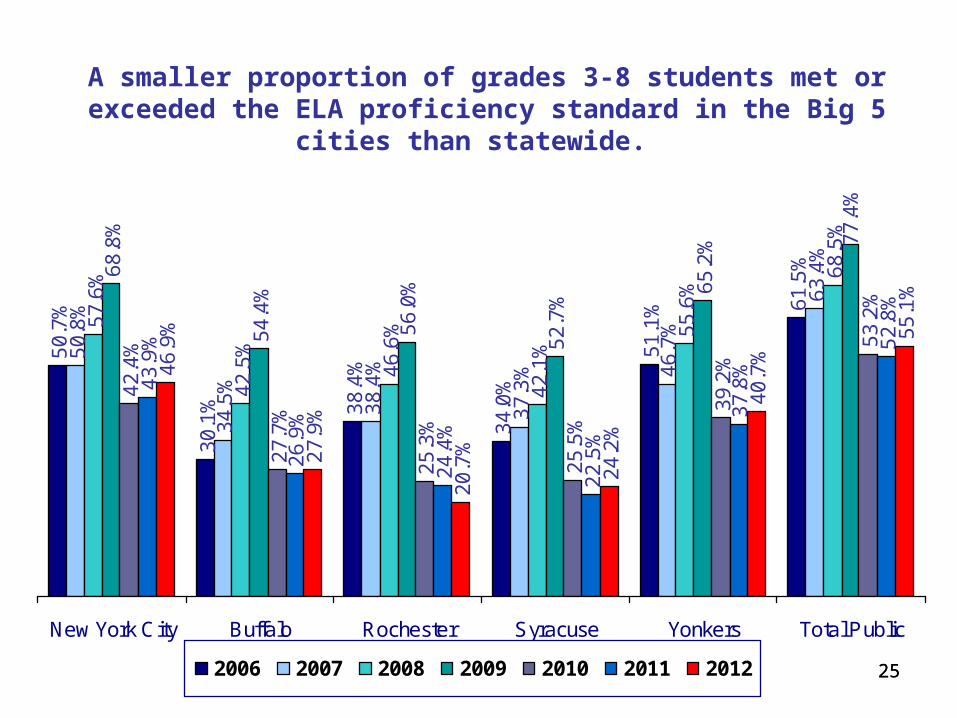
2525
50
.7%
30
.1% 38
.4%
34
.0%
51
.1% 6
1.5
%
50
.8%
34
.5%
38
.4%
37
.3% 4
6.7
%
63
.4%
57
.6%
42
.5%
46
.6%
42
.1%
55
.6%
68
.5%
68
.8%
54
.4%
56
.0%
52
.7%
65
.2%
42
.4%
27
.7%
25
.3%
25
.5%
39
.2%
53
.2%
43
.9%
26
.9%
24
.4%
22
.5%
37
.8%
52
.8%
46
.9%
27
.9%
20
.7%
24
.2%
40
.7%
55
.1%
77
.4%
New York City Buffalo Rochester Syracuse Yonkers Total Public
2006 2007 2008 2009 2010 2011 2012
A smaller proportion of grades 3-8 students met or exceeded the ELA proficiency standard in the Big 5 cities than statewide.
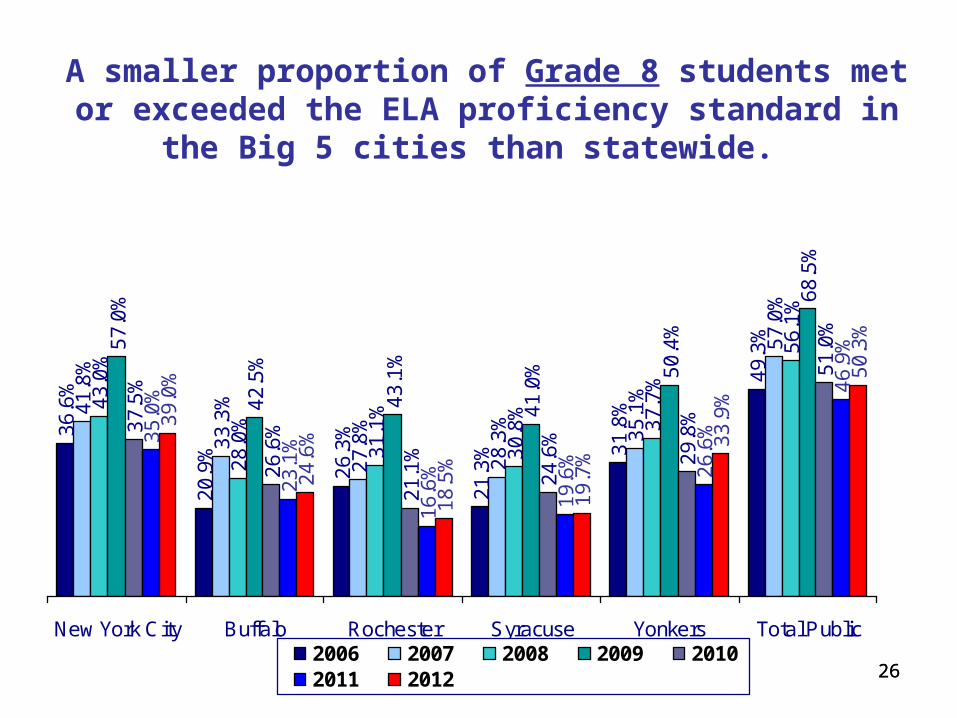
2626
36
.6%
20
.9%
26
.3%
21
.3% 3
1.8
%
49
.3%
41
.8%
33
.3%
27
.8%
28
.3%
35
.1%
57
.0%
43
.0%
28
.0%
31
.1%
30
.8%
37
.7%
56
.1%
57
.0%
42
.5%
43
.1%
41
.0% 50
.4%
68
.5%
37
.5%
26
.6%
21
.1%
24
.6%
29
.8%
51
.0%
35
.0%
23
.1%
16
.6%
19
.6% 26
.6%
46
.9%
39
.0%
24
.6%
18
.5%
19
.7%
33
.9%
50
.3%
New York City Buffalo Rochester Syracuse Yonkers Total Public2006 2007 2008 2009 20102011 2012
A smaller proportion of Grade 8 students met or exceeded the ELA proficiency standard in the Big 5 cities
than statewide.
2727
6.1
%
2.6
%
1.7
%
2.6
%
4.5
% 8.7
%
7.3
%
3.3
%
2.0
%
3.0
%
5.4
% 10
.2%
2.7
%
0.9
%
0.5
%
0.7
%
1.3
%
3.5
%
3.2
%
1.1
%
0.4
%
0.9
%
1.4
%
4.0
%
New York City Buffalo Rochester Syracuse Yonkers Total Public
2009 2010 2011 2012
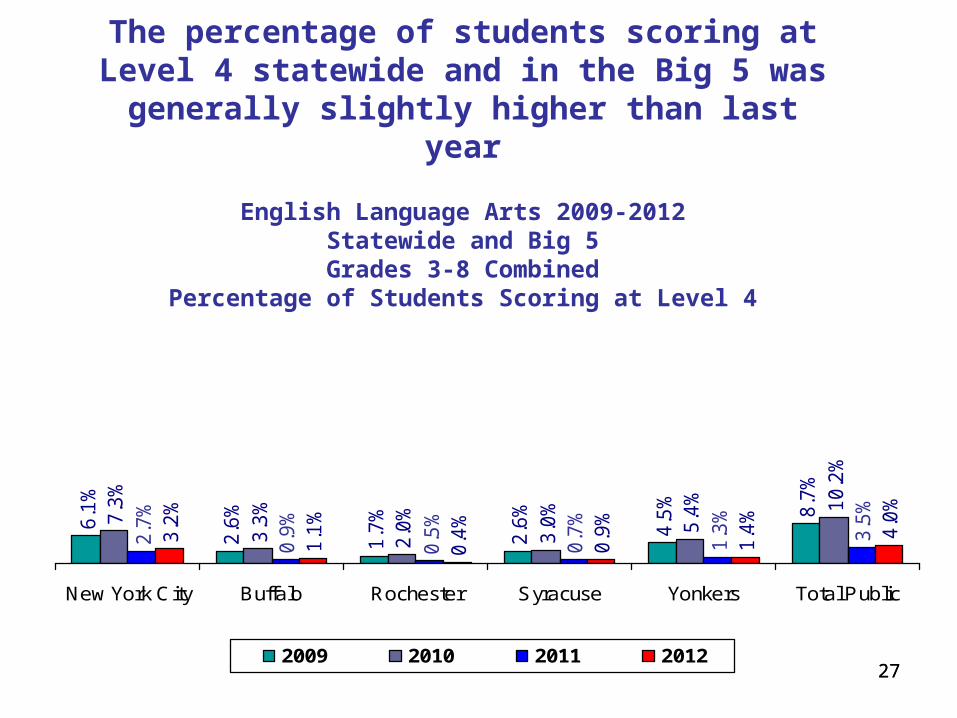
The percentage of students scoring at Level 4 statewide and in the Big 5 was generally slightly
higher than last year
English Language Arts 2009-2012Statewide and Big 5
Grades 3-8 CombinedPercentage of Students Scoring at Level 4
2828
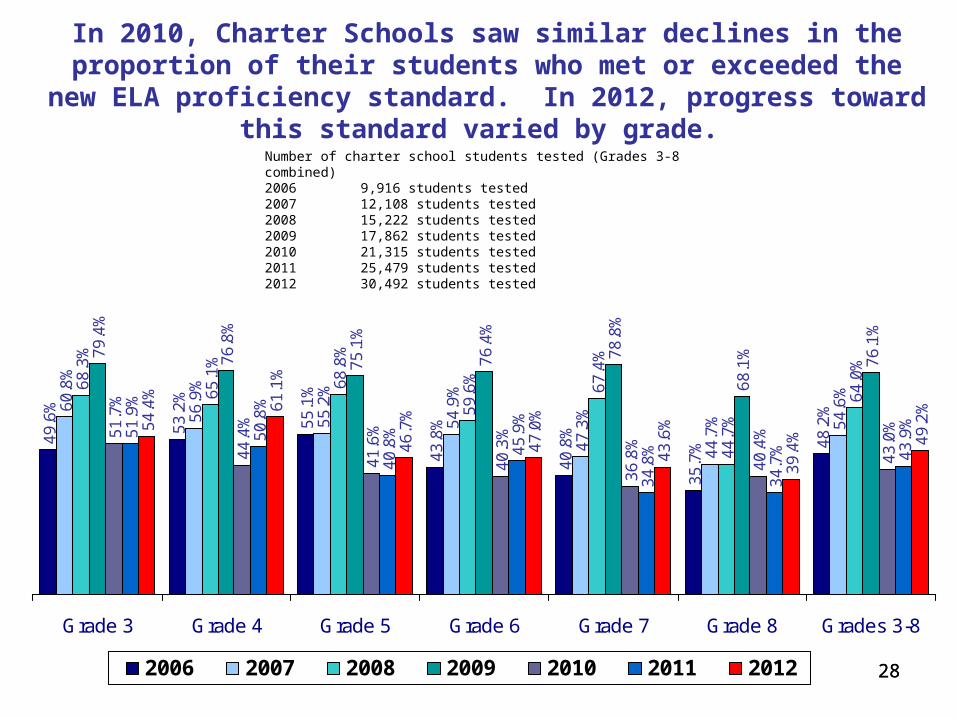
In 2010, Charter Schools saw similar declines in the proportion of their students who met or exceeded the new ELA proficiency
standard. In 2012, progress toward this standard varied by grade.
49
.6%
53
.2%
55
.1%
43
.8%
40
.8%
35
.7% 4
8.2
%60
.8%
56
.9%
55
.2%
54
.9%
47
.3%
44
.7% 54
.6%6
8.3
%
65
.1%
68
.8%
59
.6%
67
.4%
44
.7%
64
.0%
79
.4%
76
.8%
75
.1%
76
.4%
78
.8%
68
.1% 76
.1%
51
.7%
44
.4%
41
.6%
40
.3%
36
.8%
40
.4%
43
.0%51
.9%
50
.8%
40
.8%
45
.9%
34
.8%
34
.7% 43
.9%54
.4%
61
.1%
46
.7%
47
.0%
43
.6%
39
.4% 49
.2%
Grade 3 Grade 4 Grade 5 Grade 6 Grade 7 Grade 8 Grades 3-8
2006 2007 2008 2009 2010 2011 2012
Number of charter school students tested (Grades 3-8 combined)2006 9,916 students tested2007 12,108 students tested2008 15,222 students tested 2009 17,862 students tested 2010 21,315 students tested2011 25,479 students tested2012 30,492 students tested
2929
Grades 3-8 Mathematics Results
3030
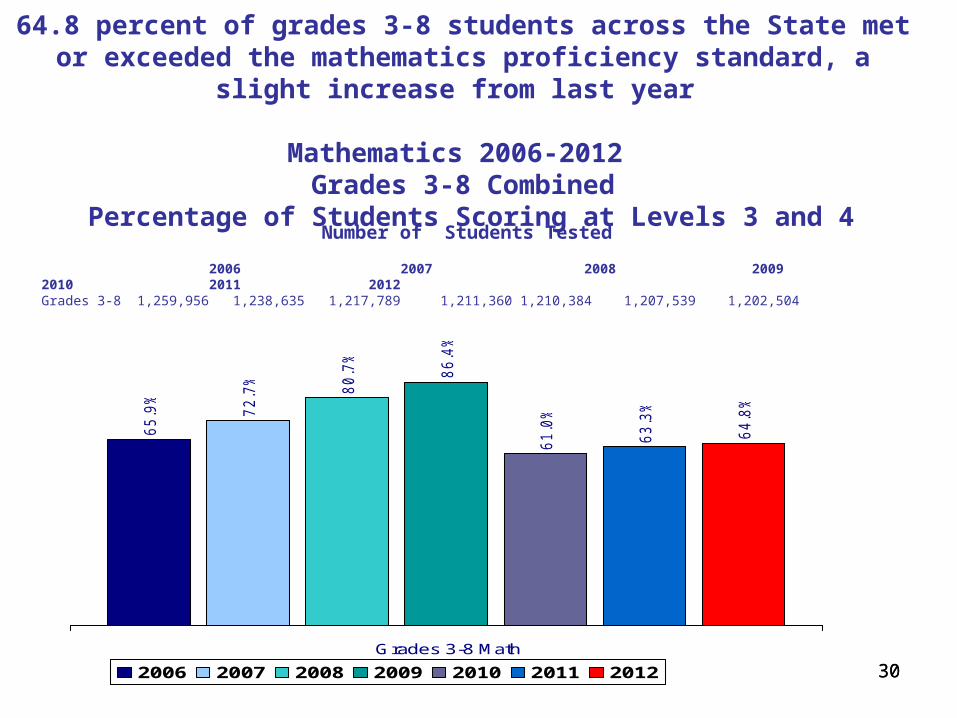
64.8 percent of grades 3-8 students across the State met or exceeded the mathematics proficiency standard, a slight increase from last year
Mathematics 2006-2012 Grades 3-8 Combined
Percentage of Students Scoring at Levels 3 and 4
65
.9%
72
.7%
80
.7%
86
.4%
61
.0%
63
.3%
64
.8%
Grades 3-8 Math
2006 2007 2008 2009 2010 2011 2012
2006 2007 2008 2009 2010 2011 2012
Number of Students Tested
Grades 3-8 1,259,956 1,238,635 1,217,789 1,211,360 1,210,384 1,207,539 1,202,504
3131
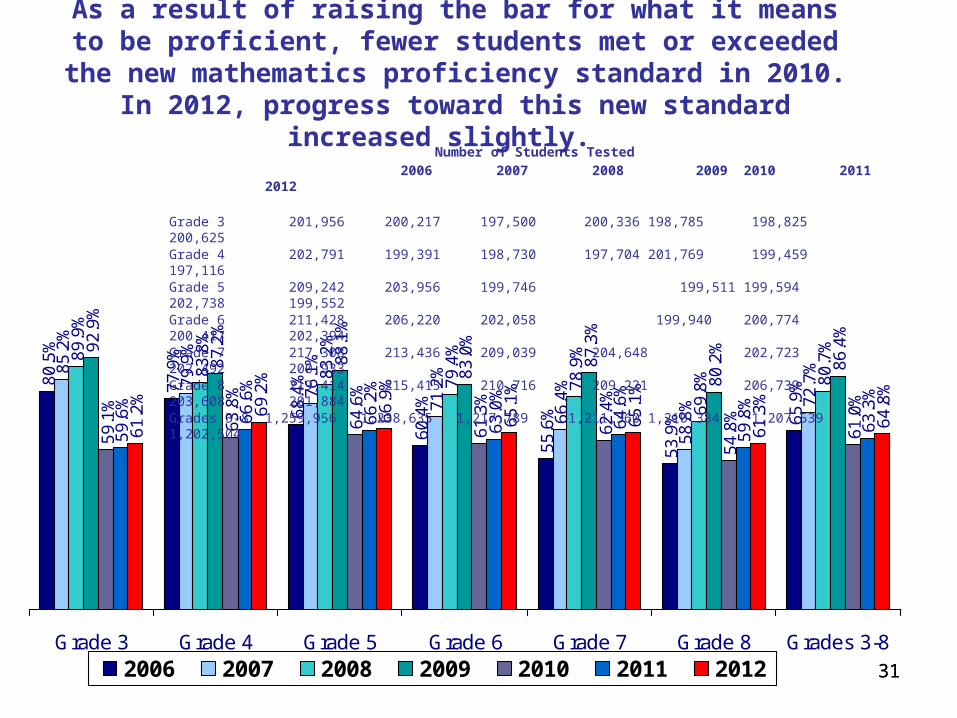
As a result of raising the bar for what it means to be proficient, fewer students met or exceeded the new mathematics
proficiency standard in 2010. In 2012, progress toward this new standard increased slightly.
80
.5%
77
.9%
68
.4%
60
.4%
55
.6%
53
.9% 6
5.9
%
85
.2%
79
.9%
76
.1%
71
.2%
66
.4%
58
.8% 7
2.7
%
89
.9%
83
.8%
83
.2%
79
.4%
78
.9%
69
.8% 80
.7%9
2.9
%
87
.2%
88
.1%
83
.0%
87
.3%
80
.2%
86
.4%
59
.1%
63
.8%
64
.6%
61
.3%
62
.4%
54
.8%
61
.0%
59
.6%
66
.6%
66
.2%
63
.0%
64
.6%
59
.8%
63
.3%
61
.2%
69
.2%
66
.9%
65
.1%
65
.1%
61
.3%
64
.8%
Grade 3 Grade 4 Grade 5 Grade 6 Grade 7 Grade 8 Grades 3-8
2006 2007 2008 2009 2010 2011 2012
Number of Students Tested 2006 2007 2008 2009 2010 2011 2012
Grade 3 201,956 200,217 197,500 200,336 198,785 198,825 200,625Grade 4 202,791 199,391 198,730 197,704 201,769 199,459 197,116Grade 5 209,242 203,956 199,746 199,511 199,594 202,738 199,552Grade 6 211,428 206,220 202,058 199,940 200,774 200,417 202,394Grade 7 217,308 213,436 209,039 204,648 202,723 202,492 200,933Grade 8 219,414 215,415 210,716 209,221 206,739 203,608 201,884Grades 3-8 1,259,956 1,238,635 1,217,789 1,211,360 1,210,384 1,207,539 1,202,504
3232
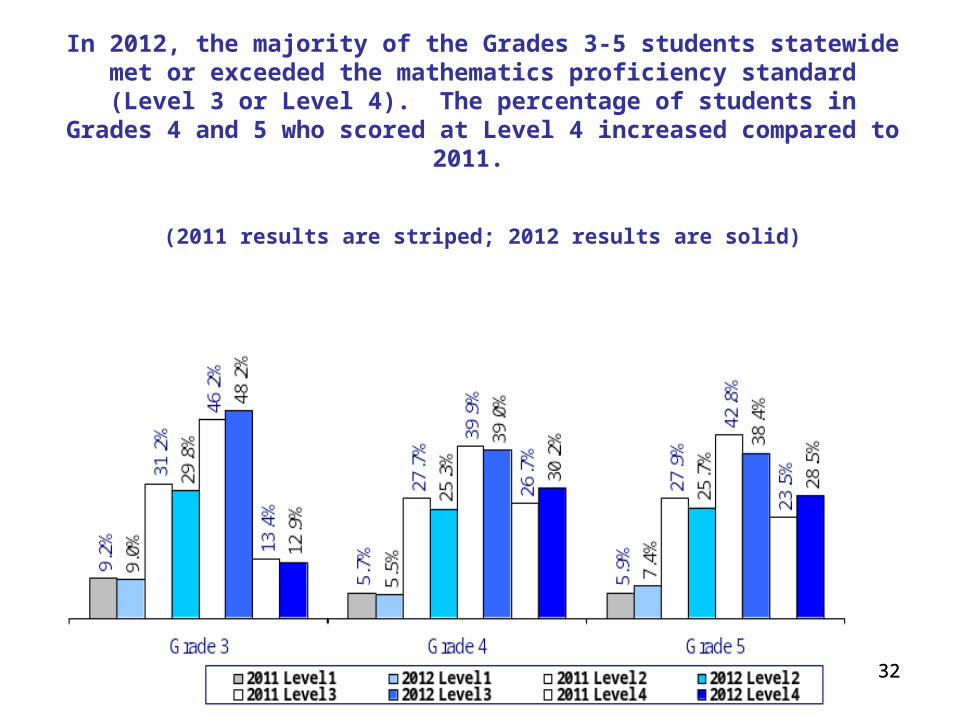
In 2012, the majority of the Grades 3-5 students statewide met or exceeded the mathematics proficiency standard (Level 3 or Level 4). The
percentage of students in Grades 4 and 5 who scored at Level 4 increased compared to 2011.
(2011 results are striped; 2012 results are solid)
3333
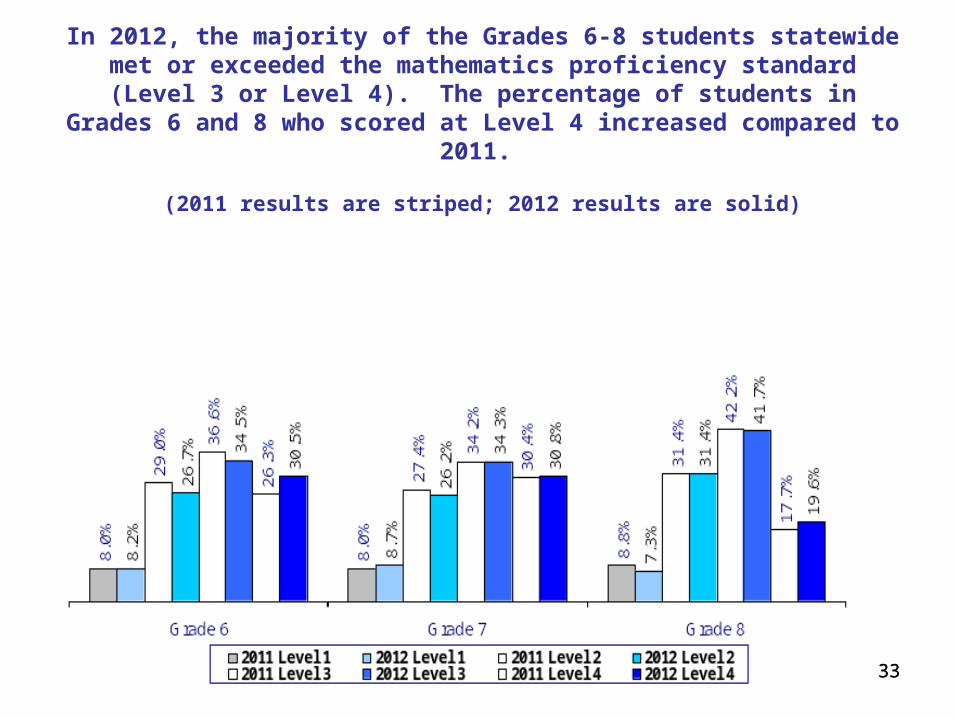
In 2012, the majority of the Grades 6-8 students statewide met or exceeded the mathematics proficiency standard (Level 3 or Level 4). The
percentage of students in Grades 6 and 8 who scored at Level 4 increased compared to 2011.
(2011 results are striped; 2012 results are solid)
3434
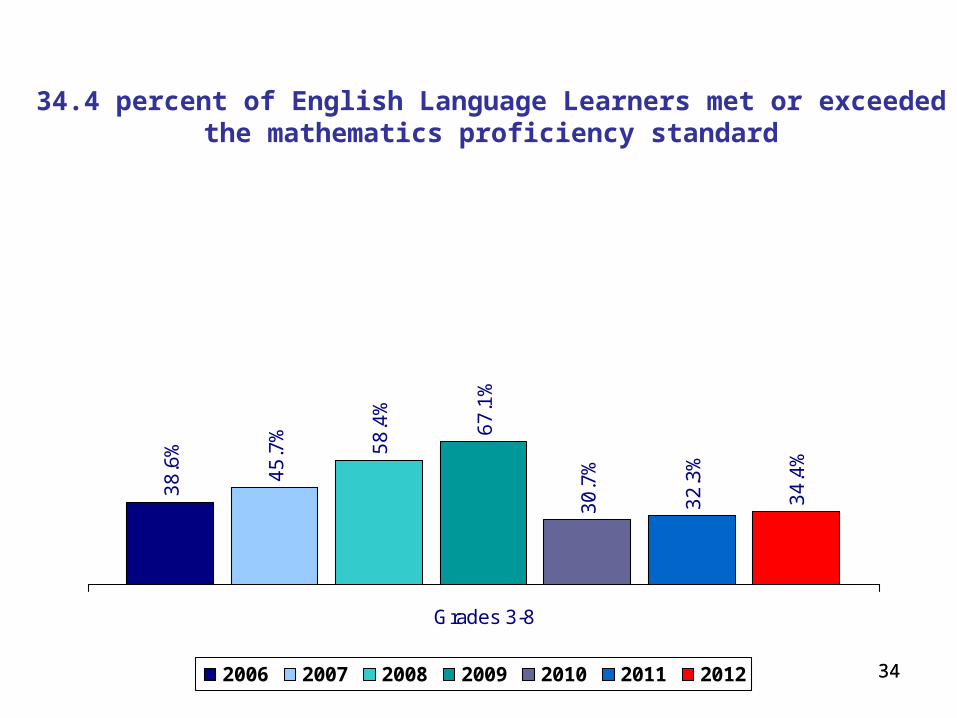
38
.6%
45
.7%
58
.4%
67
.1%
30
.7%
32
.3%
34
.4%
Grades 3-8
2006 2007 2008 2009 2010 2011 2012
34.4 percent of English Language Learners met or exceeded the mathematics proficiency standard
3535
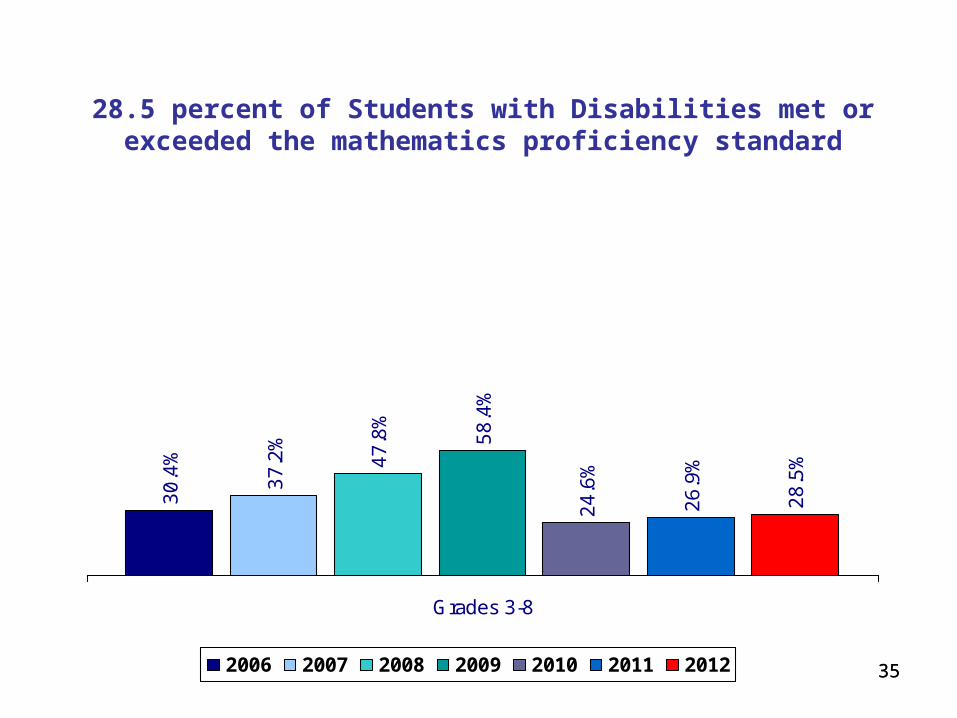
30
.4%
37
.2%
47
.8%
58
.4%
24
.6%
26
.9%
28
.5%
Grades 3-8
2006 2007 2008 2009 2010 2011 2012
28.5 percent of Students with Disabilities met or exceeded the mathematics proficiency standard
3636
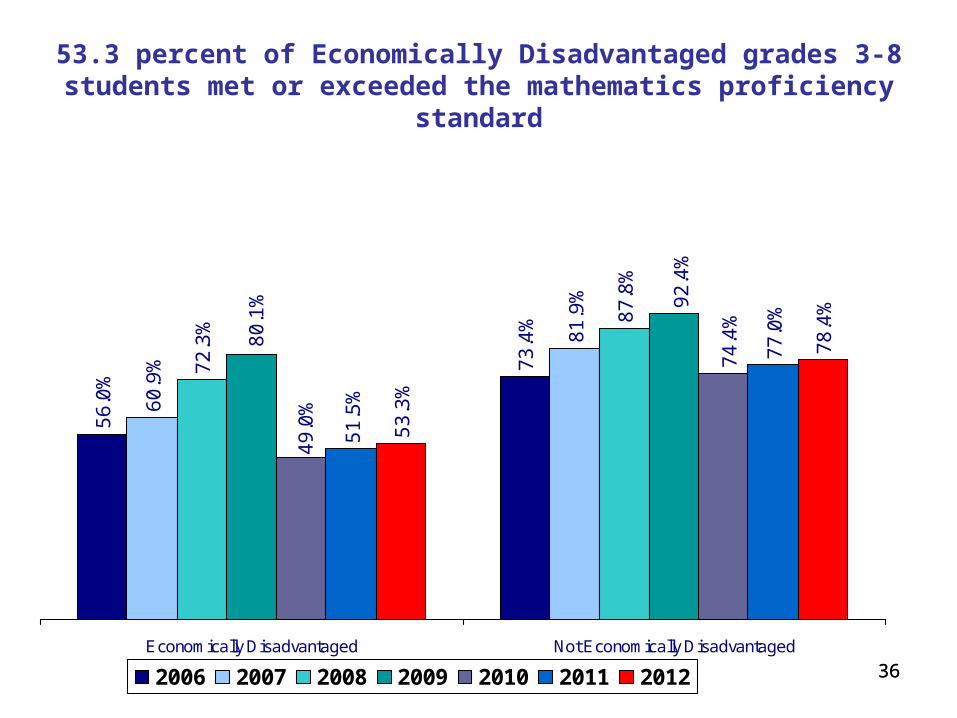
53.3 percent of Economically Disadvantaged grades 3-8 students met or exceeded the mathematics proficiency standard
56
.0%
73
.4%
60
.9%
81
.9%
72
.3%
87
.8%
51
.5%
77
.0%
53
.3%
78
.4%
80
.1% 92
.4%
49
.0%
74
.4%
Economically Disadvantaged Not Economically Disadvantaged
2006 2007 2008 2009 2010 2011 2012
3737
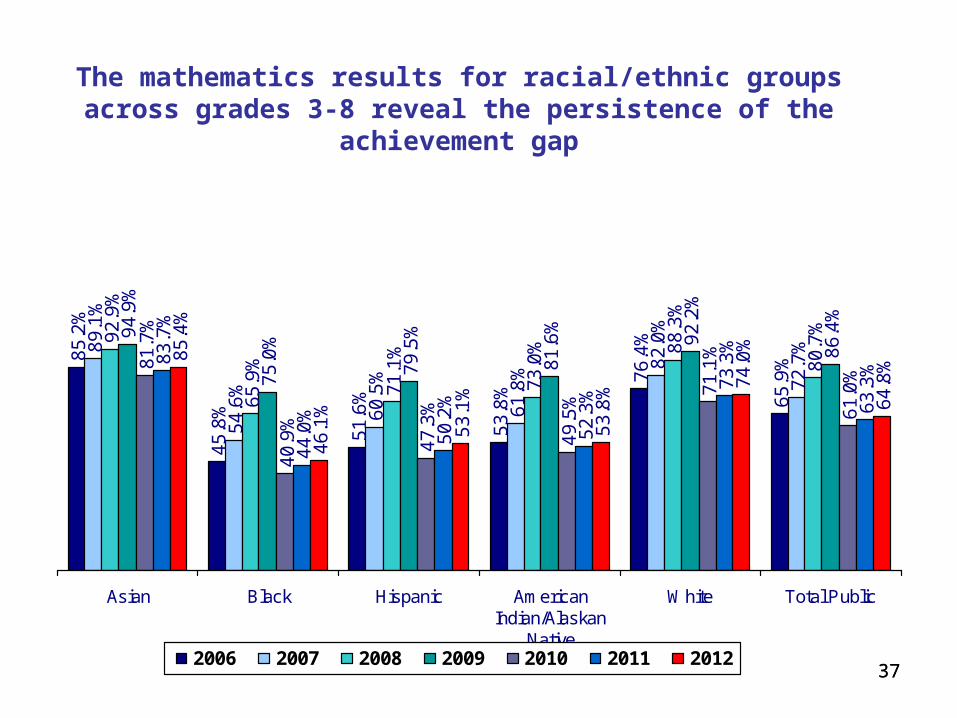
85
.2%
45
.8%
51
.6%
53
.8%
76
.4%
65
.9%
89
.1%
54
.6%
60
.5%
61
.8% 8
2.0
%
72
.7%9
2.9
%
65
.9%
71
.1%
73
.0% 8
8.3
%
80
.7%94
.9%
75
.0%
79
.5%
81
.6%
92
.2%
86
.4%
81
.7%
40
.9%
47
.3%
49
.5%
71
.1%
61
.0%
83
.7%
44
.0%
50
.2%
52
.3%
73
.3%
63
.3%
85
.4%
46
.1%
53
.1%
53
.8% 7
4.0
%
64
.8%
Asian Black Hispanic AmericanIndian/Alaskan
Native
White Total Public
2006 2007 2008 2009 2010 2011 2012
The mathematics results for racial/ethnic groups across grades 3-8 reveal the persistence of the achievement gap
3838
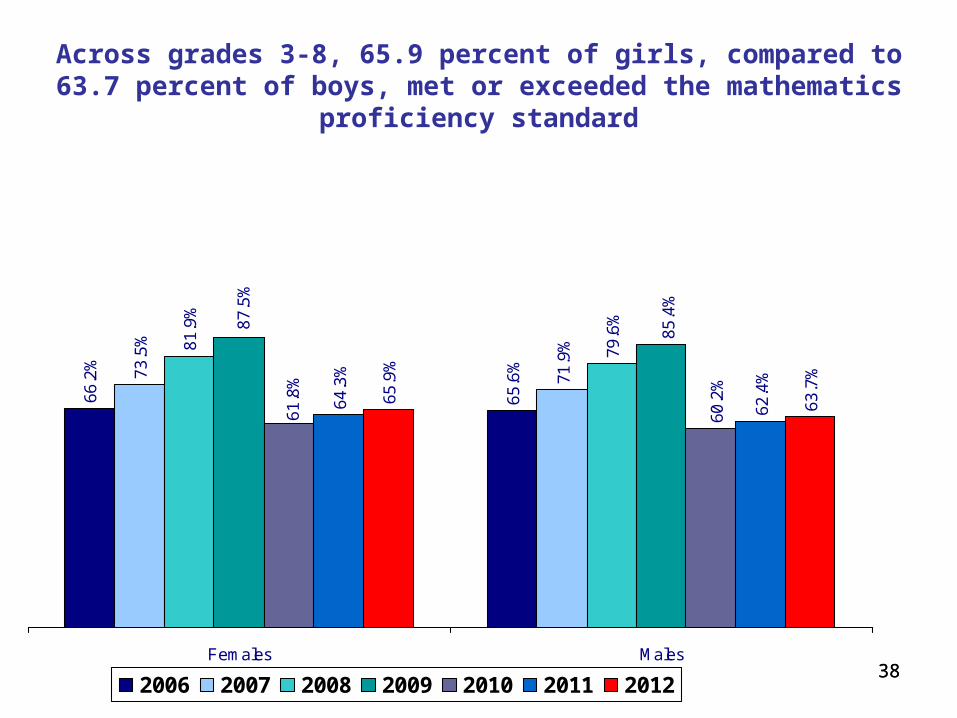
Across grades 3-8, 65.9 percent of girls, compared to 63.7 percent of boys, met or exceeded the mathematics proficiency standard
66
.2%
65
.6%73
.5%
71
.9%8
1.9
%
79
.6%
64
.3%
62
.4%
65
.9%
63
.7%
87
.5%
85
.4%
61
.8%
60
.2%
Females Males
2006 2007 2008 2009 2010 2011 2012
3939
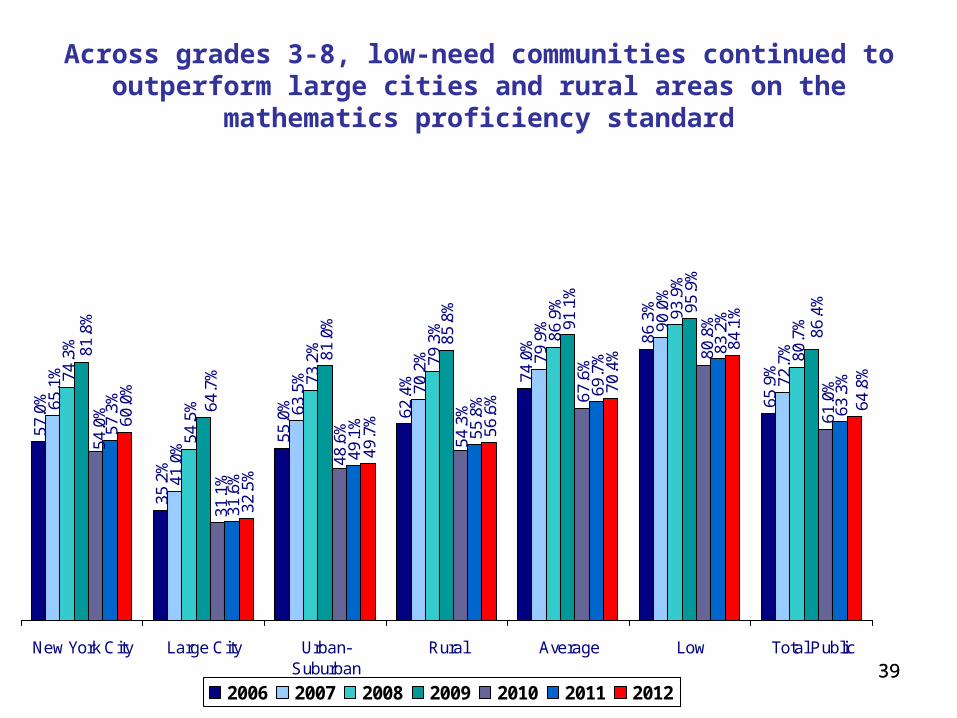
Across grades 3-8, low-need communities continued to outperform large cities and rural areas on the mathematics proficiency
standard
57.0
%
35.2
%
55.0
% 62.4
% 74.0
% 86.3
%
65.9
%
65.1
%
41.0
%
63.5
%
70.2
% 79.9
% 90.0
%
72.7
%
74.3
%
54.5
%
73.2
%
79.3
% 86.9
%
93.9
%
80.7
%
57.3
%
31.6
%
55.8
%
69.7
%
63.3
%
60.0
%
32.5
%
49.7
%
56.6
%
70.4
%
84.1
%
81.8
%
64.7
%
81.0
%
85.8
%
91.1
%
95.9
%
86.4
%
54.0
%
31.1
%
48.6
%
54.3
%
67.6
%
80.8
%
61.0
%
49.1
%
83.2
%
64.8
%
New York City Large City Urban-Suburban
Rural Average Low Total Public
2006 2007 2008 2009 2010 2011 2012
4040
57
.0%
28
.6%
33
.2%
30
.2%
53
.1% 65
.9%
65
.1%
35
.9%
39
.2%
39
.4% 52
.3% 7
2.7
%
74
.3%
50
.0%
54
.6%
49
.8% 65
.1%8
1.8
%
63
.3%
63
.4%
58
.2% 73
.8%
54
.0%
29
.8%
28
.0%
25
.7% 41
.5% 6
1.0
%
57
.3%
31
.0%
29
.4%
25
.3% 40
.4%
63
.3%
60
.0%
29
.9%
27
.3%
26
.9% 4
6.8
% 64
.8%80
.7%
86
.4%
New York City Buffalo Rochester Syracuse Yonkers Total Public
2006 2007 2008 2009 2010 2011 2012
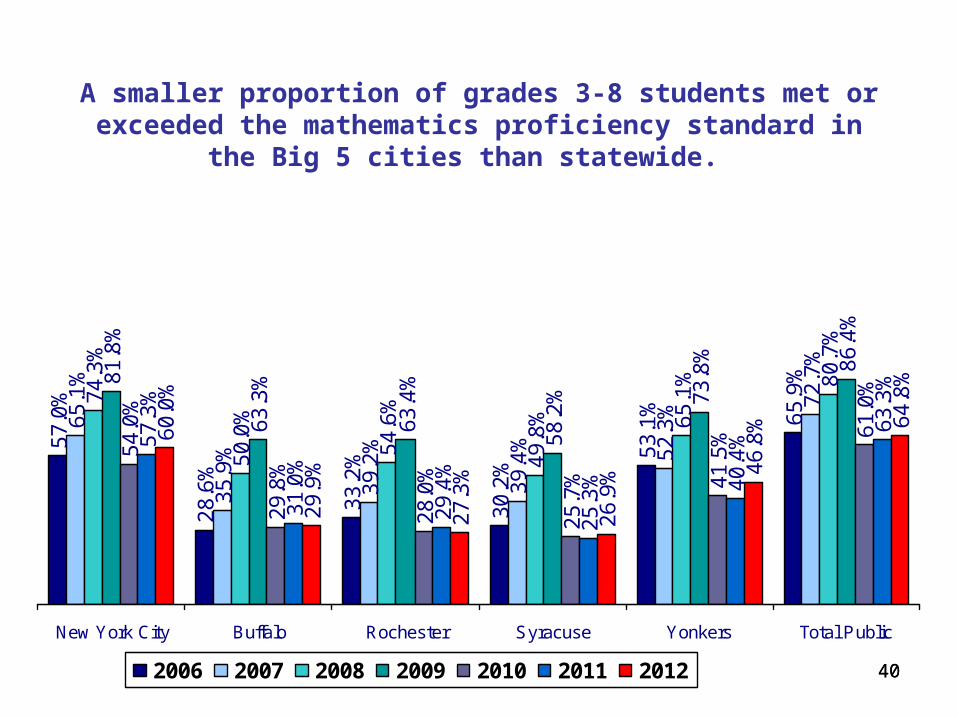
A smaller proportion of grades 3-8 students met or exceeded the mathematics proficiency standard in the Big 5 cities than
statewide.

4141
38.9
%
17.0
%
20.0
%
20.4
% 30.9
%
53.9
%
45.6
%
25.8
%
17.9
%
20.1
% 32.2
%
58.8
%
59.6
%
33.8
%
32.9
%
28.9
% 41.8
%
57.8
%
46.3
%
25.8
%
14.5
%
13.4
%
27.9
%
54.8
%
52.5
%
27.6
%
19.5
%
15.3
% 27.3
%
59.8
%
55.2
%
23.5
%
19.5
%
20.6
%
34.8
%
61.3
%
69.8
%
42.9
% 53.9
%
35.0
%
71.3
% 80.2
%
New York City Buffalo Rochester Syracuse Yonkers Total Public
2006 2007 2008 2009 2010 2011 2012
A smaller proportion of Grade 8 students met or exceeded the mathematics proficiency standard in the Big 5 cities than
statewide. Grade 8 math performance varied by grade level.
4242
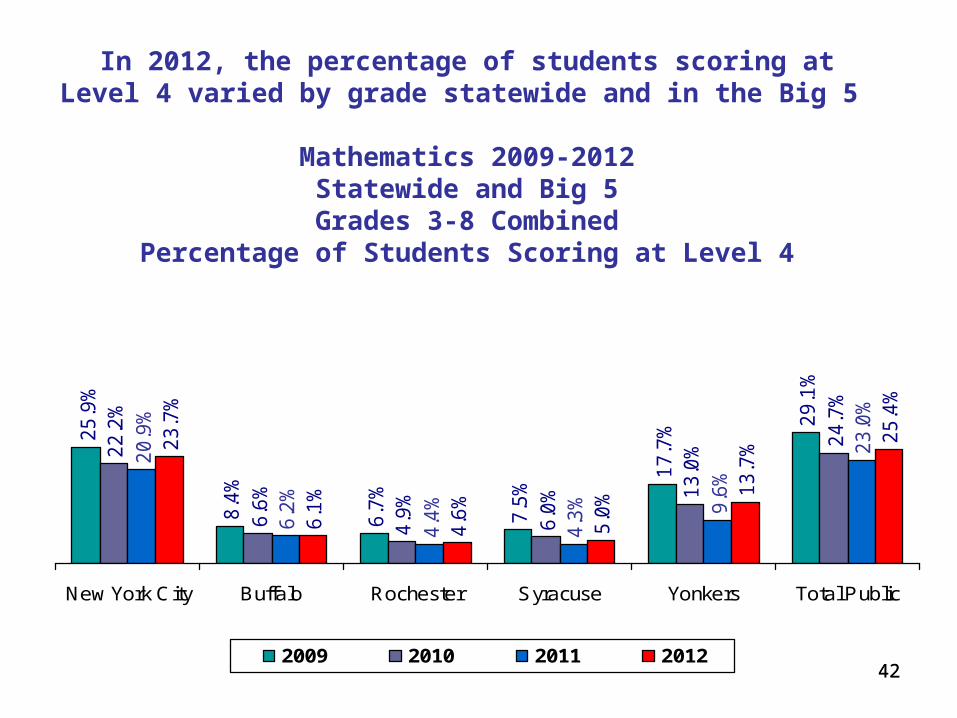
25
.9%
8.4
%
6.7
%
7.5
%
17
.7%
29
.1%
22
.2%
6.6
%
4.9
%
6.0
% 13
.0%
24
.7%
20
.9%
6.2
%
4.4
%
4.3
% 9.6
%
23
.0%
23
.7%
6.1
%
4.6
%
5.0
% 13
.7%
25
.4%
New York City Buffalo Rochester Syracuse Yonkers Total Public
2009 2010 2011 2012
In 2012, the percentage of students scoring at Level 4 varied by grade statewide and in the Big 5
Mathematics 2009-2012Statewide and Big 5
Grades 3-8 CombinedPercentage of Students Scoring at Level 4
4343
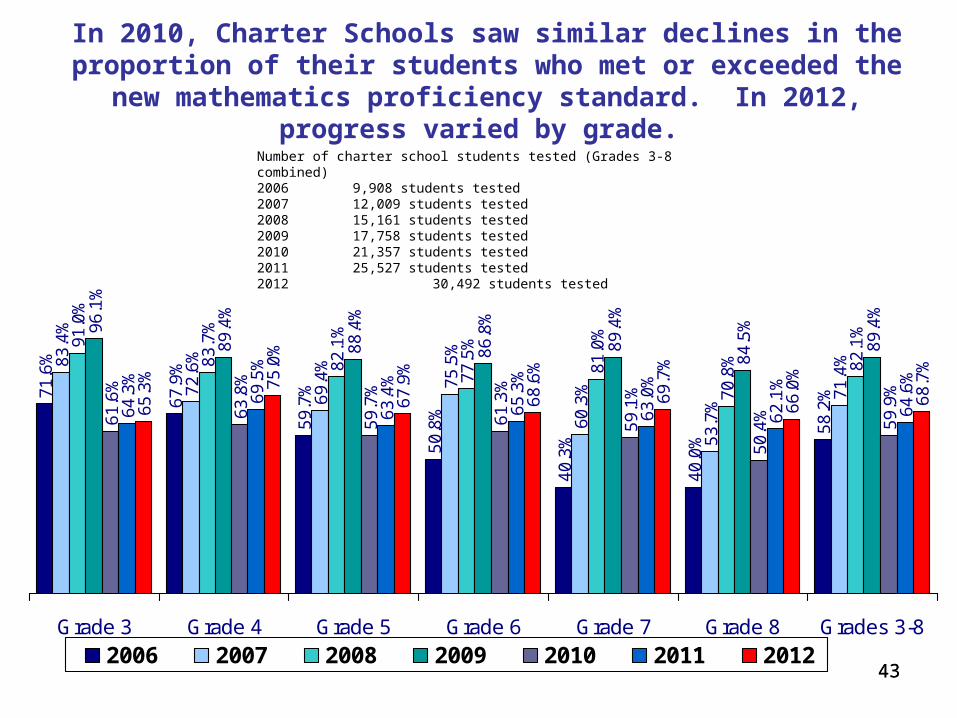
In 2010, Charter Schools saw similar declines in the proportion of their students who met or exceeded the new mathematics proficiency
standard. In 2012, progress varied by grade.
71
.6%
67
.9%
59
.7%
50
.8%
40
.3%
40
.0%
58
.2%
83
.4%
72
.6%
69
.4%
75
.5%
60
.3%
53
.7%
71
.4%
91
.0%
83
.7%
82
.1%
77
.5%
81
.0%
70
.8% 82
.1%9
6.1
%
89
.4%
88
.4%
86
.8%
89
.4%
84
.5%
89
.4%
61
.6%
63
.8%
59
.7%
61
.3%
59
.1%
50
.4% 59
.9%
64
.3%
69
.5%
63
.4%
65
.3%
63
.0%
62
.1%
64
.6%
65
.3% 75
.0%
67
.9%
68
.6%
69
.7%
66
.0%
68
.7%
Grade 3 Grade 4 Grade 5 Grade 6 Grade 7 Grade 8 Grades 3-8
2006 2007 2008 2009 2010 2011 2012
Number of charter school students tested (Grades 3-8 combined)2006 9,908 students tested2007 12,009 students tested2008 15,161 students tested 2009 17,758 students tested 2010 21,357 students tested2011 25,527 students tested2012 30,492 students tested
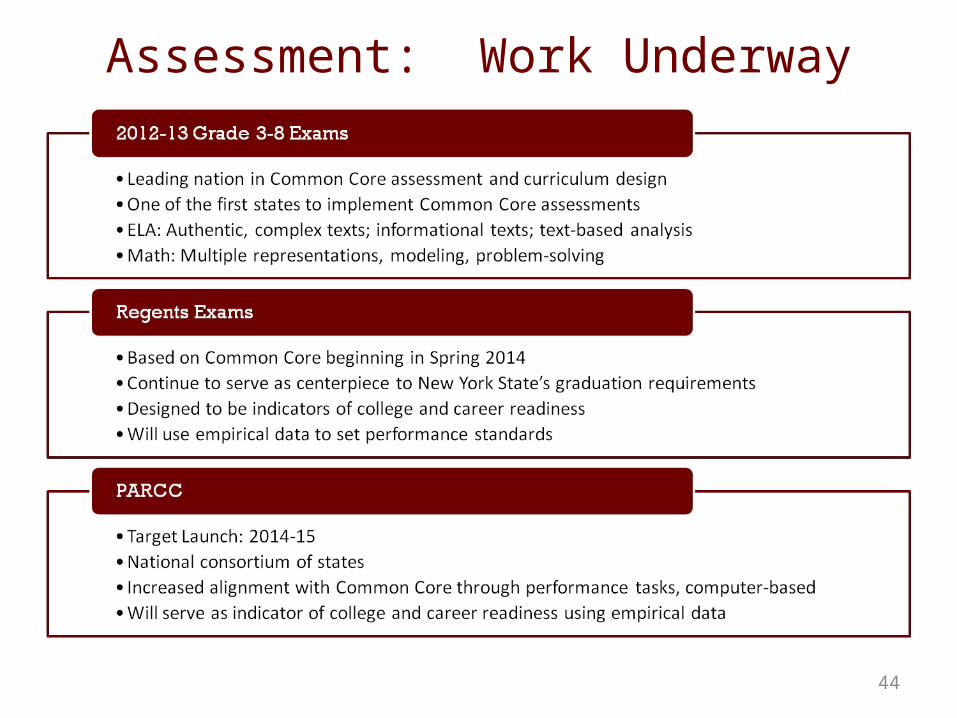
Assessment: Work Underway
44
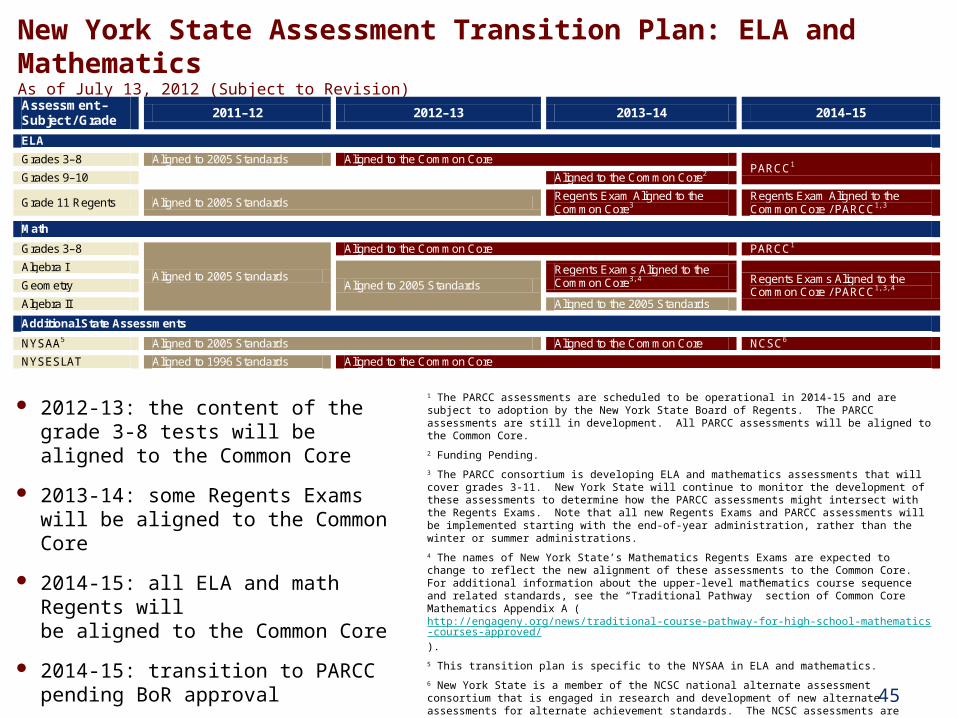
New York State Assessment Transition Plan: ELA and MathematicsAs of July 13, 2012 (Subject to Revision)
45
2012-13: the content of the grade 3-8 tests will be aligned to the Common Core
2013-14: some Regents Exams will be aligned to the Common Core
2014-15: all ELA and math Regents will be aligned to the Common Core
2014-15: transition to PARCC pending BoR approval
1 The PARCC assessments are scheduled to be operational in 2014-15 and are subject to adoption by the New York State Board of Regents. The PARCC assessments are still in development. All PARCC assessments will be aligned to the Common Core.
2 Funding Pending.
3 The PARCC consortium is developing ELA and mathematics assessments that will cover grades 3-11. New York State will continue to monitor the development of these assessments to determine how the PARCC assessments might intersect with the Regents Exams. Note that all new Regents Exams and PARCC assessments will be implemented starting with the end-of-year administration, rather than the winter or summer administrations.
4 The names of New York State’s Mathematics Regents Exams are expected to change to reflect the new alignment of these assessments to the Common Core. For additional information about the upper-level mathematics course sequence and related standards, see the “Traditional Pathway” section of Common Core Mathematics Appendix A (http://engageny.org/news/traditional-course-pathway-for-high-school-mathematics-courses-approved/).
5 This transition plan is specific to the NYSAA in ELA and mathematics.
6 New York State is a member of the NCSC national alternate assessment consortium that is engaged in research and development of new alternate assessments for alternate achievement standards. The NCSC assessments are scheduled to be operational in 2014-15 and are subject to adoption by the New York State Board of Regents.
Assessment – Subject / Grade
2011–12 2012–13 2013–14 2014–15
ELA
Grades 3–8 Aligned to 2005 Standards Aligned to the Common Core PARCC1
Grades 9–10 Aligned to the Common Core2
Grade 11 Regents Aligned to 2005 Standards Regents Exam Aligned to the Common Core3
Regents Exam Aligned to the Common Core / PARCC1, 3
Math
Grades 3–8
Aligned to 2005 Standards
Aligned to the Common Core PARCC1
Algebra I
Aligned to 2005 Standards Regents Exams Aligned to the Common Core3, 4 Regents Exams Aligned to the
Common Core / PARCC1, 3, 4 Geometry
Algebra II Aligned to the 2005 Standards
Additional State Assessments
NYSAA5 Aligned to 2005 Standards Aligned to the Common Core NCSC6
NYSESLAT Aligned to 1996 Standards Aligned to the Common Core
46
Assessing College & Career Readiness
• In 2010, the elementary- and middle-level ELA and math proficiency standard was re-set to be aligned with college- and career-ready performance in high school and post-secondary education.
• In 2011 and 2012, this proficiency standard was maintained through the annual equating process, which ensures that cut scores are equivalent from year to year.
• In 2013, performance standards for the new NYS Common Core 3-8 assessments will use a similar approach as was used in 2010 to set cut scores aligned with college and career readiness.
• In 2014-15, PARCC will follow NY’s lead and use similar college and career ready data to set performance standards for the PARCC assessments.
47
Partnership for the Assessment of Readiness for College and Career (PARCC)
• A consortium of states working together to develop a common set of K-12 assessments in English and math anchored in what it takes to be ready for college and careers.
• New K-12 assessments will build a pathway to college and career readiness by the end of high school, mark students’ progress toward this goal from 3rd grade up, and provide teachers with timely information to inform instruction and provide student support.
48
The PARCC Assessment System
Target Launch in 2014-2015
The PARCC assessment system will:
• Better reflect the sophisticated knowledge and skills found in the English and math Common Core State Standards
• Include a mix of item types (e.g., short answer, richer multiple choice, longer open response, performance-based)
• Make significant use of technology and will be computer-based
• Include testing at key points throughout the year to give teachers, parents and students better information about whether students are on track or need additional support in particular areas