10.2 atlantic salmon from the northe ast atlantic reports/advice/2015... · 2015-09-23 · ices...
TRANSCRIPT
ICES Advice on fishing opportunities, catch, and effort Northeast Atlantic Published 5 May 2015
10.2 Atlantic salmon from the Northeast Atlantic Advice for fishing seasons 2015/2016 to 2017/2018 ICES advises that when the MSY approach is applied, fishing should only take place on salmon from rivers where stocks have been shown to be at full reproductive capacity. Furthermore, because of the different status of individual stocks within stock complexes, mixed-stock fisheries present particular threats. The management of a fishery should ideally be based on the individual status of all stocks exploited in the fishery. In the absence of any fisheries in the fishing seasons 2015/2016 to 2017/2018, there is a less than 95% probability of meeting the conservation limits (CLs) for the two age groups (potential 1-sea-winter (1SW) and multi-sea-winter (MSW) spawners) of the Southern NEAC stock complex. Therefore, in the absence of specific management objectives, ICES advises that there are no mixed-stock fisheries options on the NEAC complexes at the Faroes in the fishing seasons 2015/2016 to 2017/2018. In the absence of any fisheries in these seasons, the probabilities of individual countries meeting their CLs range from 32% to 99% for maturing 1SW salmon and 11% to 100% for salmon maturing as MSW. A Framework of Indicators (FWI) has previously been developed in support of the multi-year catch advice and the potential approval of multi-year regulatory measures for the Faroes. The FWI has been updated and can be applied at the beginning of 2016, with the returns or return rate data for 2015, to evaluate the appropriateness of the advice for 2016/2017, and again at the beginning of 2017, with the returns or return rate data for 2016, to evaluate the appropriateness of the advice for 2017/2018. Stock status
ICES Advice 2015, Book 10 1
Published 5 May 2015 Advice on fishing opportunities, catch, and effort
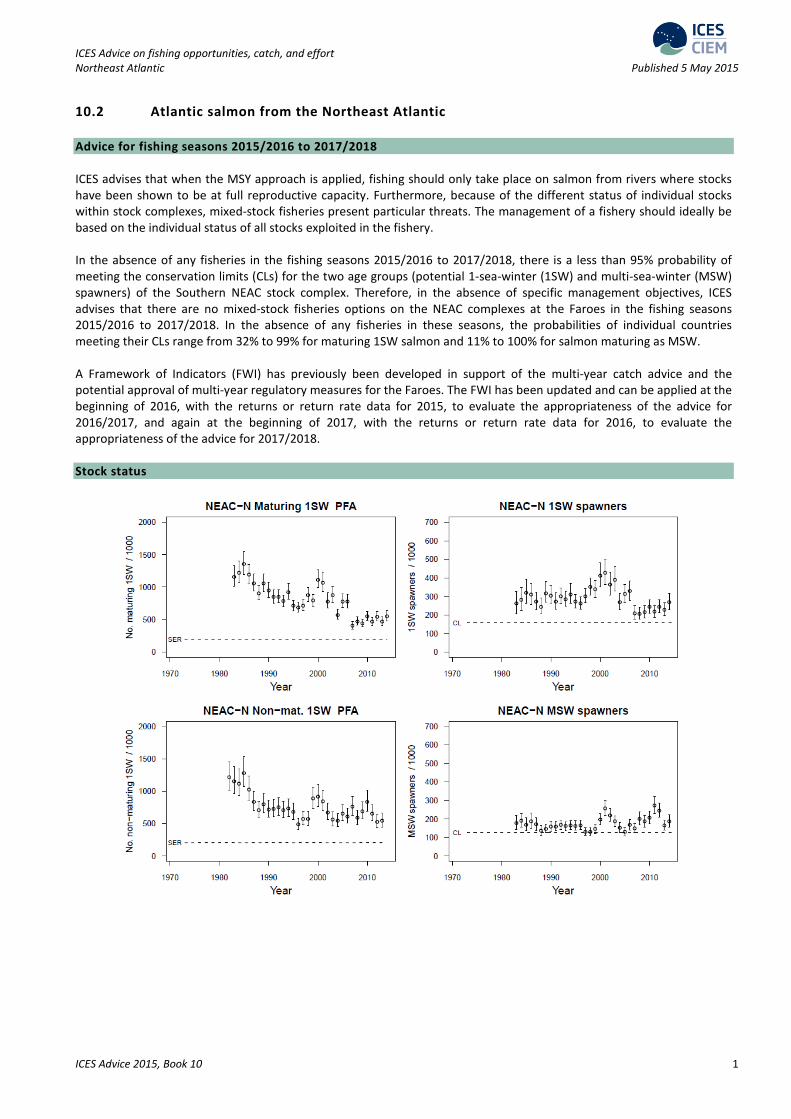
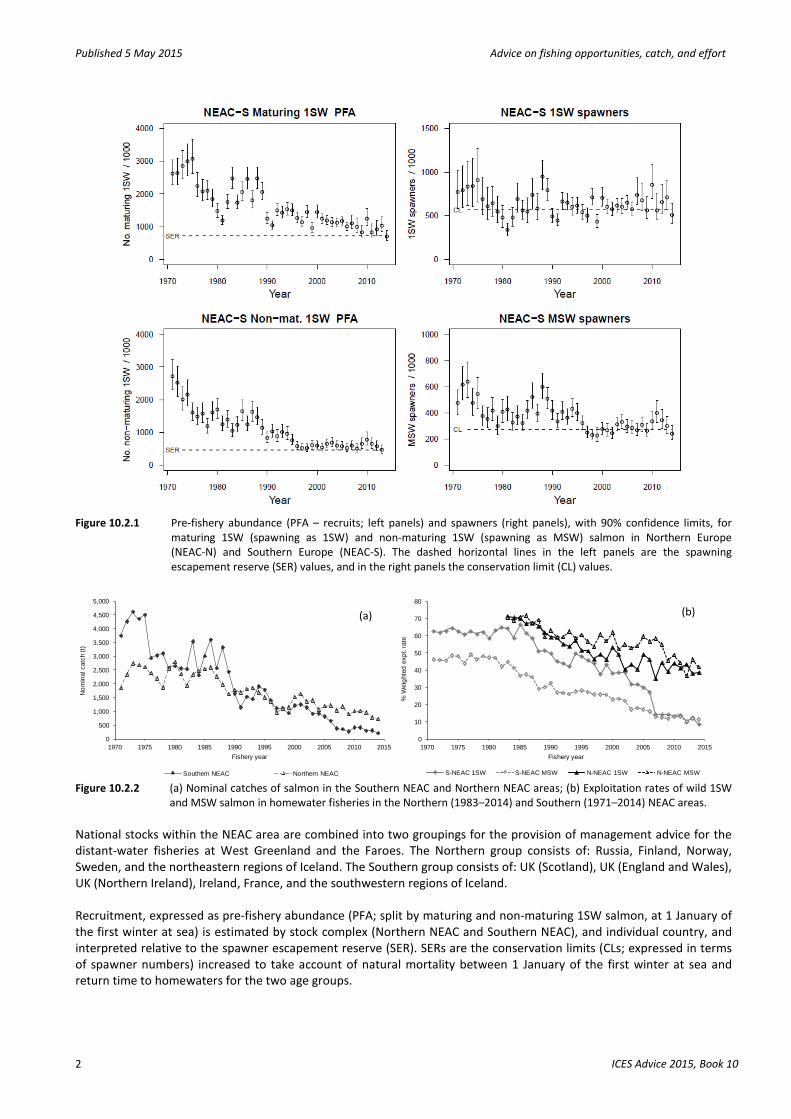
Figure 10.2.1 Pre-fishery abundance (PFA – recruits; left panels) and spawners (right panels), with 90% confidence limits, for
maturing 1SW (spawning as 1SW) and non-maturing 1SW (spawning as MSW) salmon in Northern Europe (NEAC-N) and Southern Europe (NEAC-S). The dashed horizontal lines in the left panels are the spawning escapement reserve (SER) values, and in the right panels the conservation limit (CL) values.
0
500
1,000
1,500
2,000
2,500
3,000
3,500
4,000
4,500
5,000
1970 1975 1980 1985 1990 1995 2000 2005 2010 2015
Nom
inal
cat
ch (t
)
Fishery year
Southern NEAC Northern NEAC
0
10
20
30
40
50
60
70
80
1970 1975 1980 1985 1990 1995 2000 2005 2010 2015
% W
eigh
ted
expl
. rat
e
Fishery year
S-NEAC 1SW S-NEAC MSW N-NEAC 1SW N-NEAC MSW Figure 10.2.2 (a) Nominal catches of salmon in the Southern NEAC and Northern NEAC areas; (b) Exploitation rates of wild 1SW
and MSW salmon in homewater fisheries in the Northern (1983–2014) and Southern (1971–2014) NEAC areas. National stocks within the NEAC area are combined into two groupings for the provision of management advice for the distant-water fisheries at West Greenland and the Faroes. The Northern group consists of: Russia, Finland, Norway, Sweden, and the northeastern regions of Iceland. The Southern group consists of: UK (Scotland), UK (England and Wales), UK (Northern Ireland), Ireland, France, and the southwestern regions of Iceland. Recruitment, expressed as pre-fishery abundance (PFA; split by maturing and non-maturing 1SW salmon, at 1 January of the first winter at sea) is estimated by stock complex (Northern NEAC and Southern NEAC), and individual country, and interpreted relative to the spawner escapement reserve (SER). SERs are the conservation limits (CLs; expressed in terms of spawner numbers) increased to take account of natural mortality between 1 January of the first winter at sea and return time to homewaters for the two age groups.
(a) (b)
2 ICES Advice 2015, Book 10
ICES Advice on fishing opportunities, catch, and effort Published 5 May 2015
PFAs of both maturing 1SW and non-maturing 1SW salmon for Northern NEAC show a general decline over the time period (since 1983), with the decline being more marked in the maturing 1SW stock (Figure 10.2.1). Both stock complexes have, however, been at full reproductive capacity prior to the commencement of distant-water fisheries (i.e. meeting the SER with at least 95% probability) throughout the time-series. PFA of maturing 1SW and of non-maturing 1SW salmon for Southern NEAC demonstrate broadly similar declining trends over the time period (since 1971). Both stock complexes were at full reproductive capacity prior to the commencement of distant-water fisheries throughout the early part of the time-series. However, in approximately 50% of the years since the mid-1990s, the non-maturing 1SW stock has been at risk of suffering reduced reproductive capacity before any fisheries took place. The maturing 1SW stock, on the other hand, was first assessed as being at risk of suffering reduced reproductive capacity in 2009, and has been at risk of suffering reduced reproductive capacity or suffering reduced reproductive capacity in around half of the years since then. 1SW spawners in the Northern NEAC stock complex have been at full reproductive capacity (i.e. meeting the CL with at least 95% probability) throughout the time-series, albeit at reduced levels since 2007 (Figure 10.2.1). MSW spawners, on the other hand, while generally remaining at full reproductive capacity, have spent limited periods at risk of suffering reduced reproductive capacity, most recently in 2007. Since 2000, MSW spawners have generally been above values in the early part of the time-series. Both 1SW and MSW stock complexes were at full reproductive capacity in 2014. Declines in spawner numbers are evident for both 1SW and MSW salmon in the Southern NEAC stock complex. The 1SW spawning stock has been at risk of suffering reduced reproductive capacity or suffering reduced reproductive capacity for most of the time-series. In contrast, the MSW stock was at full reproductive capacity for most of the time-series until 1996. After this point, however, the MSW stock has been either at risk of suffering reduced reproductive capacity or suffering reduced reproductive capacity in almost every year. Both 1SW and MSW stock complexes were suffering reduced reproductive capacity in 2014. Nominal catches (Figure 10.2.2(a)) and estimated exploitation rates (Figure 10.2.2(b)) have been decreasing over the time period in Northern and Southern NEAC areas. Despite management measures aimed at reducing exploitation in recent years, there has been little improvement in the status of stocks over time. This is mainly a consequence of continuing poor survival in the marine environment. Management plans The North Atlantic Salmon Conservation Organization (NASCO) has adopted an Action Plan for Application of the Precautionary Approach which stipulates that management measures should be aimed at maintaining all stocks above their conservation limits (CLs) by the use of management targets. CLs for North Atlantic salmon stock complexes have been defined by ICES as the level of stock (number of spawners) that will achieve long-term average maximum sustainable yield (MSY). NASCO has adopted the region-specific CLs as limit reference points (Slim); having populations fall below these limits should be avoided with high probability. Advice for the Faroes fishery (which takes both 1SW and MSW salmon) is currently based upon all NEAC area stocks, although NASCO has asked ICES to advise on options for taking account of recent genetic analyses which suggest there was a significant contribution of North American stocks to historical mixed-stock fisheries in Faroese waters (see Section 10.1.10). The advice for the West Greenland fishery (Section 10.4) is based upon the Southern NEAC non-maturing 1SW stock and the non-maturing 1SW salmon from North America. A 75% risk level (probability) of achieving the management objectives simultaneously in the six North American regions and Southern NEAC has been agreed by NASCO for the provision of catch advice at West Greenland. No specific risk level has so far been agreed by NASCO for the provision of catch advice for the Faroes fishery; in the absence of this, ICES uses a 95% probability of meeting individual conservation limits, which can be applied at the level of the European stock complexes (two areas and two age classes) and the NEAC countries (ten countries and two age classes). A framework of indicators (Table 10.2.5) has been developed in support of the multi-annual catch options. Biology Atlantic salmon (Salmo salar) is an anadromous species found in rivers of countries bordering the North Atlantic. In the Northeast Atlantic area, their current distribution extends from northern Portugal to the Pechora River in Northwest Russia and Iceland. Juveniles emigrate to the ocean at ages of one to eight years (dependent on latitude) and generally return after one or two years at sea. Long-distance migrations to ocean feeding grounds are known to take place, with adult salmon from the Northeast Atlantic stocks being exploited at both West Greenland and the Faroes.
ICES Advice 2015, Book 10 3
Published 5 May 2015 Advice on fishing opportunities, catch, and effort
Environmental influence on the stock Environmental conditions in both freshwater and marine environments have a marked effect on the status of salmon stocks. Across the North Atlantic, a range of problems in the freshwater environment play a significant role in explaining the poor status of stocks. In many cases, river damming and habitat deterioration have had a devastating effect on freshwater environmental conditions. In the marine environment, return rates of adult salmon have declined through the 1980s and are now at the lowest levels in the time-series for some stocks, even after closure of marine fisheries. Climatic factors modifying ecosystem conditions and the impact of predators of salmon at sea are considered to be the main contributory factors to lower productivity, which is expressed almost entirely in terms of lower marine survival. The fisheries No fishery for salmon has been prosecuted at the Faroes since 2000. No significant changes in gear type used were reported in the NEAC area in 2014. The NEAC area has seen a general reduction in catches since the 1980s (Figure 10.2.2a; Table 10.2.6). This reflects the decline in fishing effort as a consequence of management measures, as well as a reduction in the size of stocks. The nominal catch for 2014 was the lowest in the time-series in both areas. The catch in Southern NEAC, which constituted around two-thirds of the total NEAC catch in the early 1970s, has been lower than that in Northern NEAC since 1999 (Figure 10.2.2a).
2014 nominal
catch
Southern NEAC reported
Northern NEAC reported Faroes Total reported
catch Unreported
catch 211 t 727 t 0 t 938 t 256 t
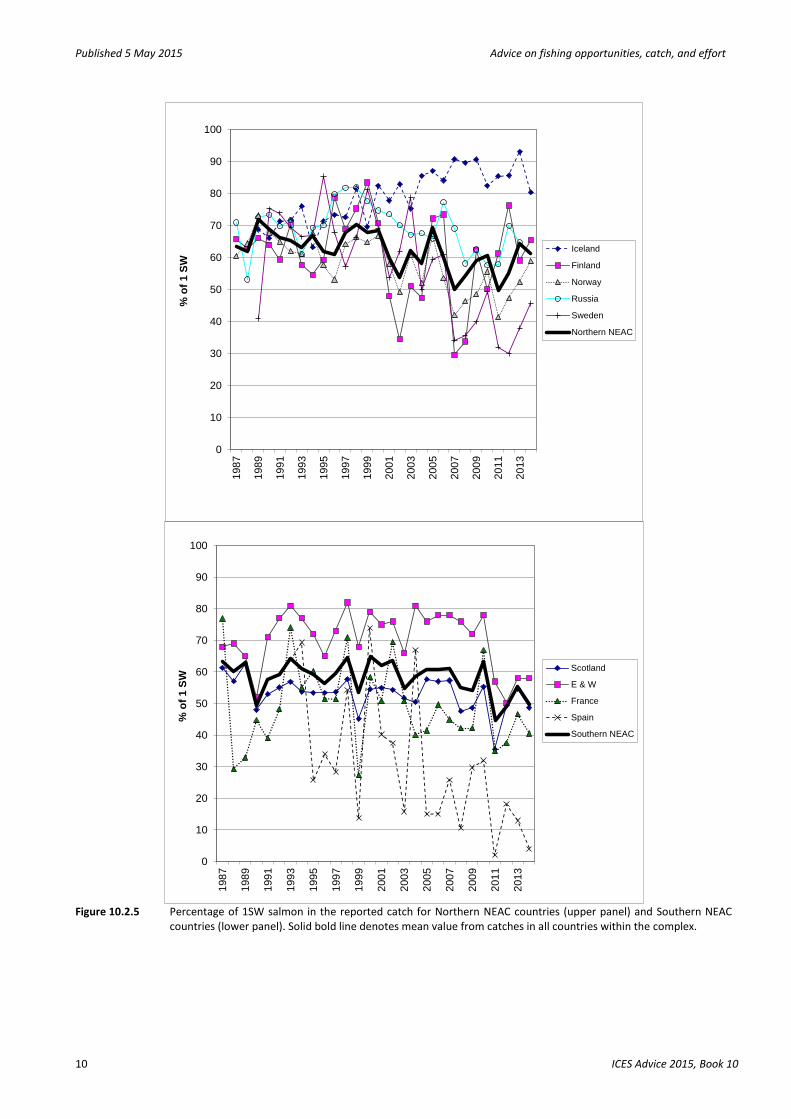
1SW salmon constituted 61% of the total catch in Northern NEAC in 2014 (Figure 10.2.5). For the Southern NEAC countries, the overall percentage of 1SW fish in the catch in 2014 was estimated at 50%. In both areas, 1SW fish have generally constituted a smaller proportion of the catch in the last decade than earlier in the time-series. There is considerable variability among individual countries (Figure 10.2.5). The contribution of escaped farmed salmon to national catches in the NEAC area in 2014 was again generally low in most countries, with the exception of Norway, Iceland, and Sweden, and is similar to the values that have been reported in previous years. Estimates of farmed fish in Norwegian angling catches were in the lower range of observed values in the time-series (5%), while the proportion estimated in Norwegian rivers in the autumn was the lowest in the time-series (provisionally estimated at 10%). Effects of the fisheries on the ecosystem Salmon fisheries have no, or only minor, influence on the marine ecosystem. The exploitation of salmon in freshwater may affect the riverine ecosystem through changes in species composition. There is limited knowledge of the magnitude of these effects. Quality considerations Uncertainties in input variables to the stock status and stock forecast models are incorporated in the assessment. Provisional catch data for 2013 were updated, where appropriate, and the assessment extended to include data for 2014. Further development of the Faroes risk framework would benefit from new data on the biological characteristics and origin of the catch; this is discussed further in Section 10.1.11.
4 ICES Advice 2015, Book 10
ICES Advice on fishing opportunities, catch, and effort Published 5 May 2015
Scientific basis
Assessment type Run-reconstruction models and Bayesian forecasts, taking into account uncertainties in data and process error. Results presented in a risk analysis framework.
Input data
Nominal catches (by sea-age class) for commercial and recreational fisheries. Estimates of unreported/illegal catches. Estimates of exploitation rates. Natural mortalities (from earlier assessments).
Discards and bycatch Discards included in risk-based framework for the Faroes fishery. Not relevant for other NEAC assessments.
Indicators Framework of Indicators (FWI) is used to indicate if a significant change has occurred in the status of stocks in intermediate years where multi-annual management advice applies.
Other information Advice subject to annual review. Stock annex developed in 2014 and updated in 2015. Working group Working Group on North Atlantic Salmon (WGNAS) (ICES, 2015).
Reference points National run-reconstruction models have been used to derive national CLs for all countries that do not have river-specific CLs (i.e. all countries except France, Ireland, UK (England & Wales), Norway, and UK (Northern Ireland)). River-specific CLs were applied for the first time in 2014 in UK (Northern Ireland). To provide catch options to NASCO, CLs are required for stock complexes. These have been derived either by summing individual river CLs to national level, or by taking overall national CLs as provided by the national model, and then summing to the level of the four NEAC stock complexes. The CLs have also been used to estimate the spawner escapement reserves (SERs), which are the CLs increased to take account of natural mortality (M = 0.03 per month) between 1 January of the first winter at sea and return time to homewaters for each of the maturing (6–9 months) and non-maturing (16–21 months) 1SW salmon components from the Northern NEAC and Southern NEAC stock complexes.
Complex Age group CL (number) SER (number) Northern NEAC 1SW 157 617 199 279 MSW 127 745 219 540 Southern NEAC 1SW 568 995 723 008 MSW 273 360 465 646
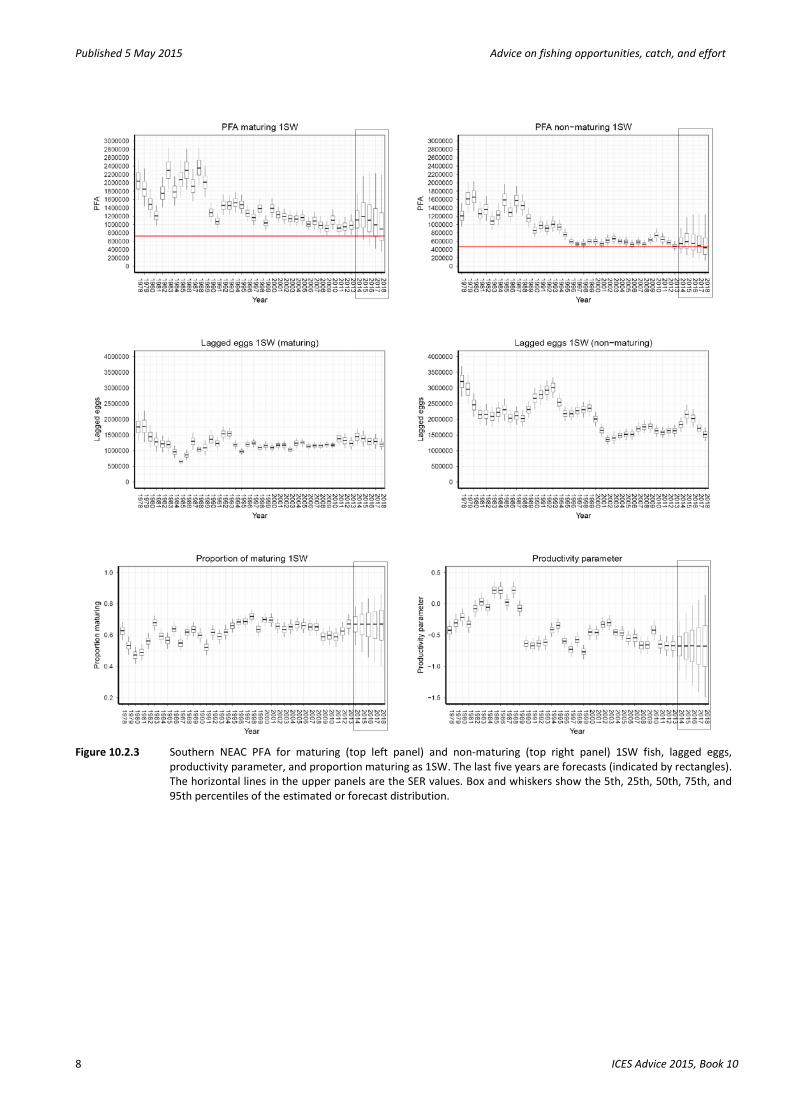
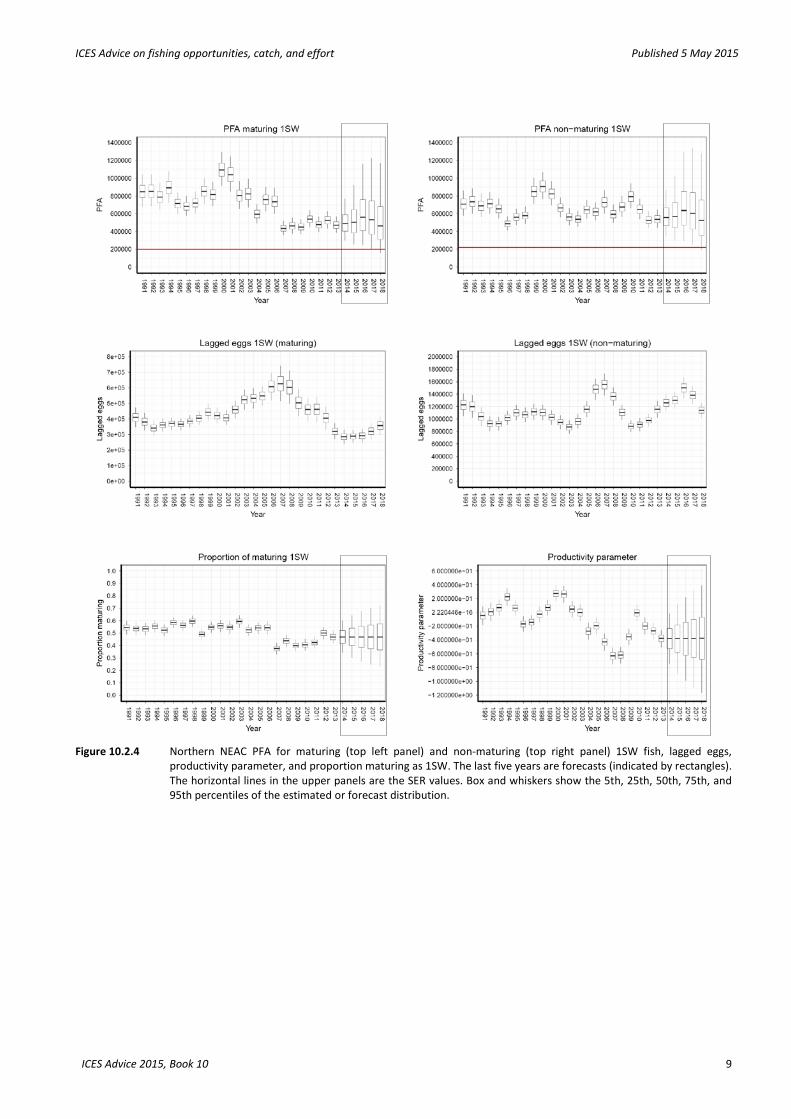
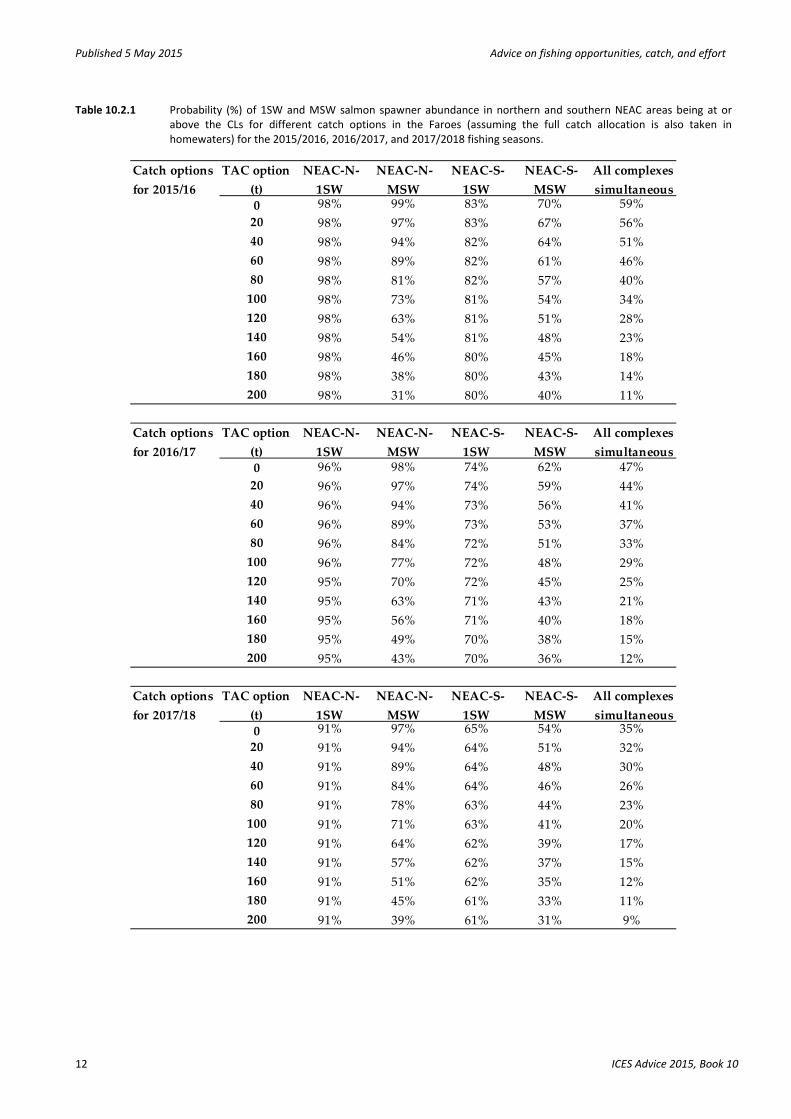
Outlook for 2015/2016 to 2017/2018 PFA forecasts until 2018 for the Southern and Northern NEAC complexes were developed within a Bayesian model framework (Figures 10.2.3–10.2.4). The probabilities of meeting CLs under different catch scenarios in the Faroes in seasons 2015/2016 to 2017/2018, assuming the full catch allocation is also taken in homewaters, are provided in Table 10.2.1 for the stock complexes. The corresponding forecast exploitation rates, for fish taken at the Faroes, are presented in Table 10.2.2. The probabilities of meeting CLs in the individual NEAC countries are presented in Tables 10.2.3–10.2.4. Probabilities of meeting CLs are higher in the Northern than in the Southern complex and are generally higher for Northern countries than Southern countries. MSY approach ICES considers that to be consistent with the MSY and the precautionary approach, fisheries should only take place on salmon from stocks that can be shown to be at full reproductive capacity. Due to the different status of individual stocks, mixed-stock fisheries present particular threats. In the absence of any fisheries in 2015/2016 to 2017/2018, there is less than 95% probability of meeting the CLs for the two Southern NEAC complexes (potential 1SW and MSW spawners; Table 10.2.1). There is also less than a 95% probability of many individual countries meeting their CLs for 1SW or MSW fish in the absence of any fisheries (Tables
ICES Advice 2015, Book 10 5
Published 5 May 2015 Advice on fishing opportunities, catch, and effort
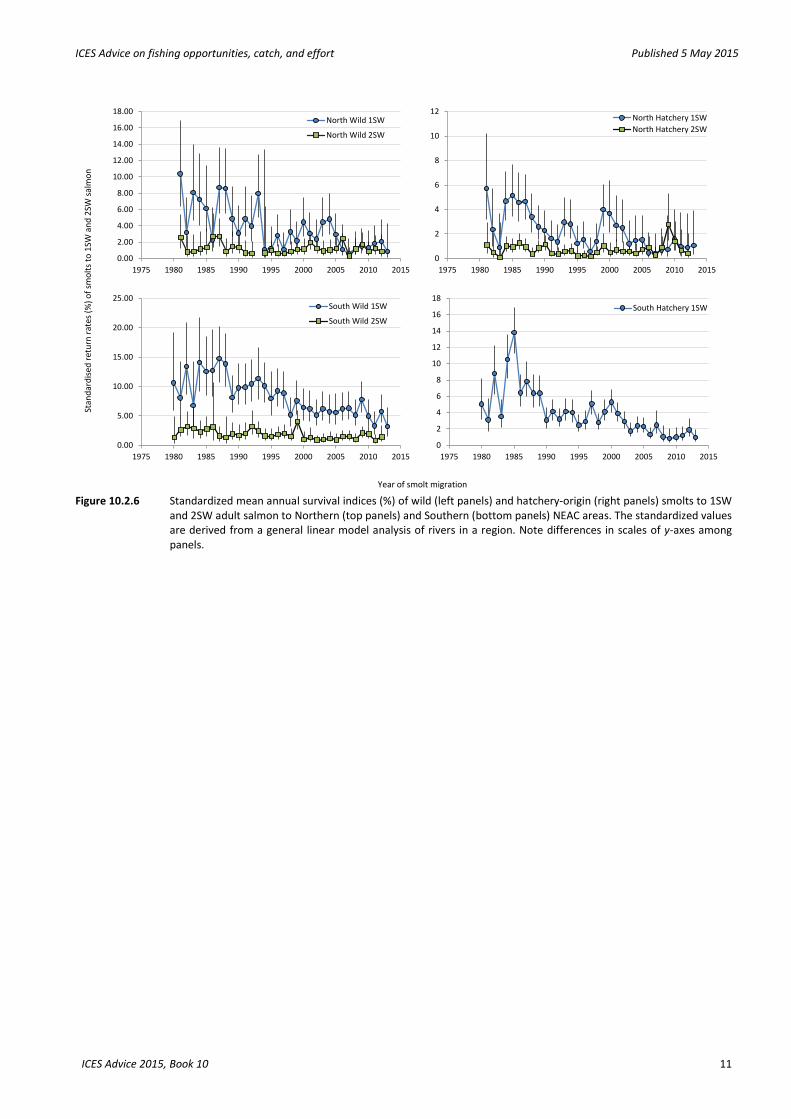
10.2.3–10.2.4). Therefore, in the absence of specific management objectives, ICES advises that there are no mixed-stock fisheries options on the NEAC complexes/countries at the Faroes in 2015/2016 to 2017/2018. Additional considerations ICES emphasizes that the national stock CLs discussed above are not appropriate for the management of homewater fisheries, particularly where these exploit separate river stocks. This is because of the relative imprecision of the national CLs and because they will not take account of differences in the status of different river stocks or sub-river populations. Management at finer scales should take account of individual river stock status. Nevertheless, the combined CLs for the main stock groups (national stocks) exploited by the distant-water fisheries can be used to provide general management advice to the distant-water fisheries. Fisheries on mixed stocks pose particular difficulties for management, when they cannot target only stocks that are at full reproductive capacity. The management of a fishery should ideally be based on the status of all stocks exploited in the fishery. Conservation would be best achieved if fisheries target stocks that have been shown to be at full reproductive capacity. Fisheries in estuaries and, especially, rivers are more likely to meet this requirement. The probabilities of meeting CLs for the 1SW salmon is hardly affected by the catch options at the Faroes, within the range considered in Table 10.2.1, principally because the exploitation rates on the 1SW stock components in the fishery are very low (Table 10.2.2). There has been an overall declining trend since 1980 in the return rates (marine survival) of both wild and hatchery-origin smolts to 1SW returns for both Northern and Southern NEAC areas (Figure 10.2.6). Results from these analyses are consistent with the information on estimated returns and spawners as derived from the PFA model, and suggest that returns are strongly influenced by factors in the marine environment. The declining trend is not evident for the 2SW wild components in either area, or for hatchery-origin smolts to 2SW in Northern NEAC (no data are available for hatchery-origin 2SW return rates for Southern NEAC). Data and methods Input data to estimate the historical PFAs are the catch in numbers of 1SW and MSW salmon in each country, unreported catch levels, and exploitation rates. Uncertainties are accounted for using minimum and maximum ranges for unreported catches and exploitation rates. A natural mortality value of 0.03 (range 0.02 to 0.04) per month is applied during the second year at sea. Data beginning in 1971 are available for most countries. In addition, catches at the Faroes and catches of NEAC-origin salmon at West Greenland are incorporated. Estimated PFA values are presented in Tables 10.2.7 and 10.2.8. The Bayesian inference and forecast models for the Southern NEAC and Northern NEAC complexes have the same structure and are run independently in “R”. For both Southern and Northern NEAC complexes, PFA forecasts were derived based on lagged spawners and productivity. PFA was forecast from 2015 to 2018 for maturing 1SW salmon and from 2014 to 2018 for non-maturing 1SW salmon (Figures 10.2.3–10.2.4). The risk framework was used to evaluate catch options for the Faroes fishery in the 2015/2016, 2016/2017, and 2017/2018 fishing seasons, based on the Northern and Southern NEAC stock complexes of maturing and non-maturing 1SW salmon and also on an individual country basis for the two sea-age groups. The catch options examined assumed that homewater fisheries would also take the total catch allocation based on a share of the total catch at the Faroes (Section 10.1.10.3). The risk analysis calculates the probability of stocks achieving the management objective for each of the age groups of the NEAC stock complexes/countries. Further work is required to improve the input data and the quality of the assessment (see Section 10.1.11). The large uncertainty in the PFA forecasts (Figures 10.2.3 and 10.2.4) results in increased risk of not achieving the CLs in the forecasts. As a result, the advice is more cautious regarding fishing opportunities. Comparison with previous assessment and catch options
6 ICES Advice 2015, Book 10
ICES Advice on fishing opportunities, catch, and effort Published 5 May 2015
The most recent catch advice in 2013 concluded that there were no catch options at the Faroes for 2013/14 to 2015/2016 (ICES, 2013). The current assessment and forecast confirms that advice. The advice this year is based on the risk assessment framework, as in 2013. This directly evaluates the risk (probability) of meeting CLs in the 1SW and MSW Southern and Northern NEAC complexes, and at country level, under different catch scenarios. Managers can choose the risk level which they consider appropriate. ICES considers, however, that to be consistent with the MSY and the precautionary approach, and given that the CLs are considered to be limit reference points to be avoided with high probability, managers should choose a risk level that results in a low chance of failing to meet the CLs. ICES recommends that management decisions be based principally on a 95% probability of attainment of CLs in each stock complex or country individually (ICES, 2013). Assessment and management area National stocks are combined into Southern NEAC and Northern NEAC groups. The groups fulfilled an agreed set of criteria for defining stock groups for the provision of management advice (ICES, 2005). At that time, consideration of the level of exploitation of national stocks resulted in the advice for the Faroes fishery (both 1SW and MSW) being based on all NEAC area stocks, and the advice for the West Greenland fishery being based on the Southern NEAC non-maturing 1SW stock only. ICES (2010, 2011, 2012) previously emphasized the problem of basing a risk assessment and catch advice for the Faroes fishery on management units comprising large numbers of river stocks. In providing catch advice at the age and stock complex or country levels for Northern and Southern NEAC areas, consideration needs to be given to the recent performance of the stocks within individual countries. At present, insufficient data are available to assess performance of individual stocks in all countries in the NEAC area. In some instances river-specific CLs are in the process of being developed. Sources of information ICES. 2005. Report of the Working Group on North Atlantic Salmon (WGNAS), 4–14 April 2005, Nuuk, Greenland. ICES CM 2005/ACFM:17. 290 pp.
ICES. 2010. Report of the Working Group on North Atlantic Salmon (WGNAS), 22–31 March 2010, ICES Headquarters, Copenhagen. ICES CM 2010/ACOM:09. 302 pp.
ICES. 2011. Report of the Working Group on North Atlantic Salmon (WGNAS), 22–31 March 2011, ICES Headquarters, Copenhagen. ICES CM 2011/ACOM:06. 283 pp.
ICES. 2012. Report of the Working Group on North Atlantic Salmon (WGNAS), 26 March–4 April 2012, ICES Headquarters, Copenhagen. ICES CM 2012/ACOM:09. 337 pp.
ICES. 2013. Report of the Working Group on North Atlantic Salmon (WGNAS), 3–12 April 2013, ICES Headquarters, Copenhagen. ICES CM 2013/ACOM:09. 378 pp.
ICES. 2015. Report of the Working Group on North Atlantic Salmon (WGNAS), 17–26 March, Moncton, Canada. ICES CM 2015/ACOM:09. 332 pp.
ICES Advice 2015, Book 10 7
Published 5 May 2015 Advice on fishing opportunities, catch, and effort
Figure 10.2.3 Southern NEAC PFA for maturing (top left panel) and non-maturing (top right panel) 1SW fish, lagged eggs,
productivity parameter, and proportion maturing as 1SW. The last five years are forecasts (indicated by rectangles). The horizontal lines in the upper panels are the SER values. Box and whiskers show the 5th, 25th, 50th, 75th, and 95th percentiles of the estimated or forecast distribution.
8 ICES Advice 2015, Book 10
ICES Advice on fishing opportunities, catch, and effort Published 5 May 2015
Figure 10.2.4 Northern NEAC PFA for maturing (top left panel) and non-maturing (top right panel) 1SW fish, lagged eggs,
productivity parameter, and proportion maturing as 1SW. The last five years are forecasts (indicated by rectangles). The horizontal lines in the upper panels are the SER values. Box and whiskers show the 5th, 25th, 50th, 75th, and 95th percentiles of the estimated or forecast distribution.
ICES Advice 2015, Book 10 9
Published 5 May 2015 Advice on fishing opportunities, catch, and effort
0
10
20
30
40
50
60
70
80
90
100
1987
1989
1991
1993
1995
1997
1999
2001
2003
2005
2007
2009
2011
2013
% o
f 1 S
W
Iceland
Finland
Norway
Russia
Sweden
Northern NEAC
0
10
20
30
40
50
60
70
80
90
100
1987
1989
1991
1993
1995
1997
1999
2001
2003
2005
2007
2009
2011
2013
% o
f 1 S
W
Scotland
E & W
France
Spain
Southern NEAC
Figure 10.2.5 Percentage of 1SW salmon in the reported catch for Northern NEAC countries (upper panel) and Southern NEAC
countries (lower panel). Solid bold line denotes mean value from catches in all countries within the complex.
10 ICES Advice 2015, Book 10
ICES Advice on fishing opportunities, catch, and effort Published 5 May 2015
0
2
4
6
8
10
12
1975 1980 1985 1990 1995 2000 2005 2010 2015
North Hatchery 1SWNorth Hatchery 2SW
0.00
2.00
4.00
6.00
8.00
10.00
12.00
14.00
16.00
18.00
1975 1980 1985 1990 1995 2000 2005 2010 2015
North Wild 1SW
North Wild 2SW
0.00
5.00
10.00
15.00
20.00
25.00
1975 1980 1985 1990 1995 2000 2005 2010 2015
South Wild 1SW
South Wild 2SW
0
2
4
6
8
10
12
14
16
18
1975 1980 1985 1990 1995 2000 2005 2010 2015
South Hatchery 1SW
Stan
dard
ised
retu
rn ra
tes (
%) o
f sm
olts
to 1
SW a
nd 2
SW sa
lmon
Year of smolt migration Figure 10.2.6 Standardized mean annual survival indices (%) of wild (left panels) and hatchery-origin (right panels) smolts to 1SW
and 2SW adult salmon to Northern (top panels) and Southern (bottom panels) NEAC areas. The standardized values are derived from a general linear model analysis of rivers in a region. Note differences in scales of y-axes among panels.
ICES Advice 2015, Book 10 11
Published 5 May 2015 Advice on fishing opportunities, catch, and effort
Table 10.2.1 Probability (%) of 1SW and MSW salmon spawner abundance in northern and southern NEAC areas being at or above the CLs for different catch options in the Faroes (assuming the full catch allocation is also taken in homewaters) for the 2015/2016, 2016/2017, and 2017/2018 fishing seasons.
Catch options for 2015/16
TAC option (t)
NEAC-N-1SW
NEAC-N-MSW
NEAC-S-1SW
NEAC-S-MSW
All complexes simultaneous
0 98% 99% 83% 70% 59%20 98% 97% 83% 67% 56%40 98% 94% 82% 64% 51%60 98% 89% 82% 61% 46%80 98% 81% 82% 57% 40%
100 98% 73% 81% 54% 34%120 98% 63% 81% 51% 28%140 98% 54% 81% 48% 23%160 98% 46% 80% 45% 18%180 98% 38% 80% 43% 14%200 98% 31% 80% 40% 11%
Catch options for 2016/17
TAC option (t)
NEAC-N-1SW
NEAC-N-MSW
NEAC-S-1SW
NEAC-S-MSW
All complexes simultaneous
0 96% 98% 74% 62% 47%20 96% 97% 74% 59% 44%40 96% 94% 73% 56% 41%60 96% 89% 73% 53% 37%80 96% 84% 72% 51% 33%
100 96% 77% 72% 48% 29%120 95% 70% 72% 45% 25%140 95% 63% 71% 43% 21%160 95% 56% 71% 40% 18%180 95% 49% 70% 38% 15%200 95% 43% 70% 36% 12%
Catch options for 2017/18
TAC option (t)
NEAC-N-1SW
NEAC-N-MSW
NEAC-S-1SW
NEAC-S-MSW
All complexes simultaneous
0 91% 97% 65% 54% 35%20 91% 94% 64% 51% 32%40 91% 89% 64% 48% 30%60 91% 84% 64% 46% 26%80 91% 78% 63% 44% 23%
100 91% 71% 63% 41% 20%120 91% 64% 62% 39% 17%140 91% 57% 62% 37% 15%160 91% 51% 62% 35% 12%180 91% 45% 61% 33% 11%200 91% 39% 61% 31% 9%
12 ICES Advice 2015, Book 10

ICES Advice on fishing opportunities, catch, and effort Published 5 May 2015
Table 10.2.2 Forecast exploitation rates in the Faroes fishery for 1SW and MSW salmon from Northern and Southern NEAC areas in all fisheries (assuming full catch allocations are taken) for different TAC options in the Faroes fishery in the 2015/2016, 2016/2017, and 2017/2018 fishing seasons.
TAC option (t)
NEAC-N-1SW
NEAC-N-MSW
NEAC-S-1SW
NEAC-S-MSW
0 0.0% 0.0% 0.0% 0.0%20 0.0% 0.7% 0.0% 0.3%40 0.0% 1.4% 0.1% 0.5%60 0.0% 2.1% 0.1% 0.8%80 0.0% 2.8% 0.1% 1.1%
100 0.0% 3.4% 0.2% 1.4%120 0.1% 4.1% 0.2% 1.6%140 0.1% 4.8% 0.2% 1.9%160 0.1% 5.5% 0.2% 2.2%180 0.1% 6.2% 0.3% 2.4%200 0.1% 6.9% 0.3% 2.7%
TAC option (t)
NEAC-N-1SW
NEAC-N-MSW
NEAC-S-1SW
NEAC-S-MSW
0 0.0% 0.0% 0.0% 0.0%20 0.0% 0.6% 0.0% 0.3%40 0.0% 1.2% 0.1% 0.6%60 0.0% 1.8% 0.1% 0.9%80 0.0% 2.5% 0.1% 1.2%
100 0.0% 3.1% 0.2% 1.5%120 0.1% 3.7% 0.2% 1.7%140 0.1% 4.3% 0.2% 2.0%160 0.1% 4.9% 0.3% 2.3%180 0.1% 5.5% 0.3% 2.6%200 0.1% 6.2% 0.3% 2.9%
TAC option (t)
NEAC-N-1SW
NEAC-N-MSW
NEAC-S-1SW
NEAC-S-MSW
0 0.0% 0.0% 0.0% 0.0%20 0.0% 0.7% 0.0% 0.3%40 0.0% 1.3% 0.1% 0.6%60 0.0% 2.0% 0.1% 1.0%80 0.0% 2.6% 0.2% 1.3%
100 0.1% 3.3% 0.2% 1.6%120 0.1% 3.9% 0.2% 1.9%140 0.1% 4.6% 0.3% 2.3%160 0.1% 5.2% 0.3% 2.6%180 0.1% 5.9% 0.3% 2.9%200 0.1% 6.5% 0.4% 3.2%
Catch options for 2015/16 season:
Catch options for 2016/17 season:
Catch options for 2017/18 season:
ICES Advice 2015, Book 10 13
Published 5 May 2015 Advice on fishing opportunities, catch, and effort
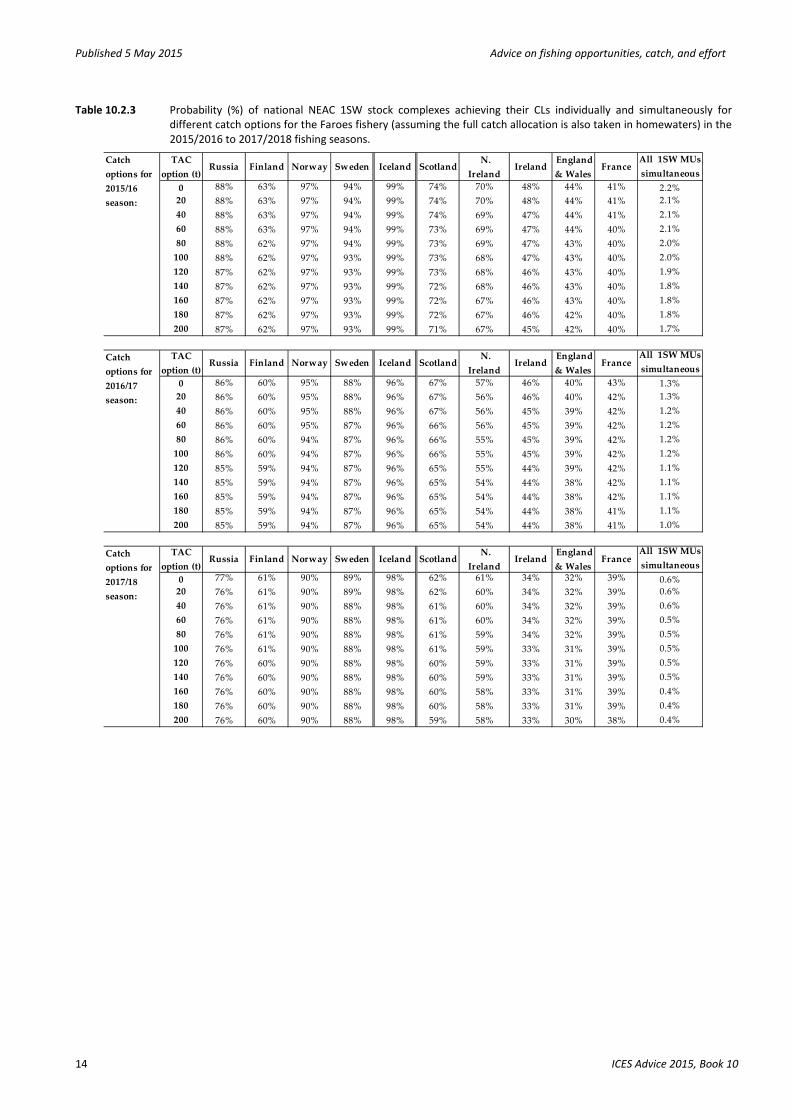
Table 10.2.3 Probability (%) of national NEAC 1SW stock complexes achieving their CLs individually and simultaneously for different catch options for the Faroes fishery (assuming the full catch allocation is also taken in homewaters) in the 2015/2016 to 2017/2018 fishing seasons.
TAC option (t)
Russia Finland Norway Sweden Iceland Scotland N.
Ireland Ireland
England & Wales
FranceAll 1SW MUs simultaneous
0 88% 63% 97% 94% 99% 74% 70% 48% 44% 41% 2.2%20 88% 63% 97% 94% 99% 74% 70% 48% 44% 41% 2.1%40 88% 63% 97% 94% 99% 74% 69% 47% 44% 41% 2.1%60 88% 63% 97% 94% 99% 73% 69% 47% 44% 40% 2.1%80 88% 62% 97% 94% 99% 73% 69% 47% 43% 40% 2.0%
100 88% 62% 97% 93% 99% 73% 68% 47% 43% 40% 2.0%120 87% 62% 97% 93% 99% 73% 68% 46% 43% 40% 1.9%140 87% 62% 97% 93% 99% 72% 68% 46% 43% 40% 1.8%160 87% 62% 97% 93% 99% 72% 67% 46% 43% 40% 1.8%180 87% 62% 97% 93% 99% 72% 67% 46% 42% 40% 1.8%200 87% 62% 97% 93% 99% 71% 67% 45% 42% 40% 1.7%
TAC option (t)
Russia Finland Norway Sweden Iceland Scotland N.
Ireland Ireland
England & Wales
FranceAll 1SW MUs simultaneous
0 86% 60% 95% 88% 96% 67% 57% 46% 40% 43% 1.3%20 86% 60% 95% 88% 96% 67% 56% 46% 40% 42% 1.3%40 86% 60% 95% 88% 96% 67% 56% 45% 39% 42% 1.2%60 86% 60% 95% 87% 96% 66% 56% 45% 39% 42% 1.2%80 86% 60% 94% 87% 96% 66% 55% 45% 39% 42% 1.2%
100 86% 60% 94% 87% 96% 66% 55% 45% 39% 42% 1.2%120 85% 59% 94% 87% 96% 65% 55% 44% 39% 42% 1.1%140 85% 59% 94% 87% 96% 65% 54% 44% 38% 42% 1.1%160 85% 59% 94% 87% 96% 65% 54% 44% 38% 42% 1.1%180 85% 59% 94% 87% 96% 65% 54% 44% 38% 41% 1.1%200 85% 59% 94% 87% 96% 65% 54% 44% 38% 41% 1.0%
TAC option (t)
Russia Finland Norway Sweden Iceland Scotland N.
Ireland Ireland
England & Wales
FranceAll 1SW MUs simultaneous
0 77% 61% 90% 89% 98% 62% 61% 34% 32% 39% 0.6%20 76% 61% 90% 89% 98% 62% 60% 34% 32% 39% 0.6%40 76% 61% 90% 88% 98% 61% 60% 34% 32% 39% 0.6%60 76% 61% 90% 88% 98% 61% 60% 34% 32% 39% 0.5%80 76% 61% 90% 88% 98% 61% 59% 34% 32% 39% 0.5%
100 76% 61% 90% 88% 98% 61% 59% 33% 31% 39% 0.5%120 76% 60% 90% 88% 98% 60% 59% 33% 31% 39% 0.5%140 76% 60% 90% 88% 98% 60% 59% 33% 31% 39% 0.5%160 76% 60% 90% 88% 98% 60% 58% 33% 31% 39% 0.4%180 76% 60% 90% 88% 98% 60% 58% 33% 31% 39% 0.4%200 76% 60% 90% 88% 98% 59% 58% 33% 30% 38% 0.4%
Catch options for 2017/18 season:
Catch options for 2015/16 season:
Catch options for 2016/17 season:
14 ICES Advice 2015, Book 10
ICES Advice on fishing opportunities, catch, and effort Published 5 May 2015
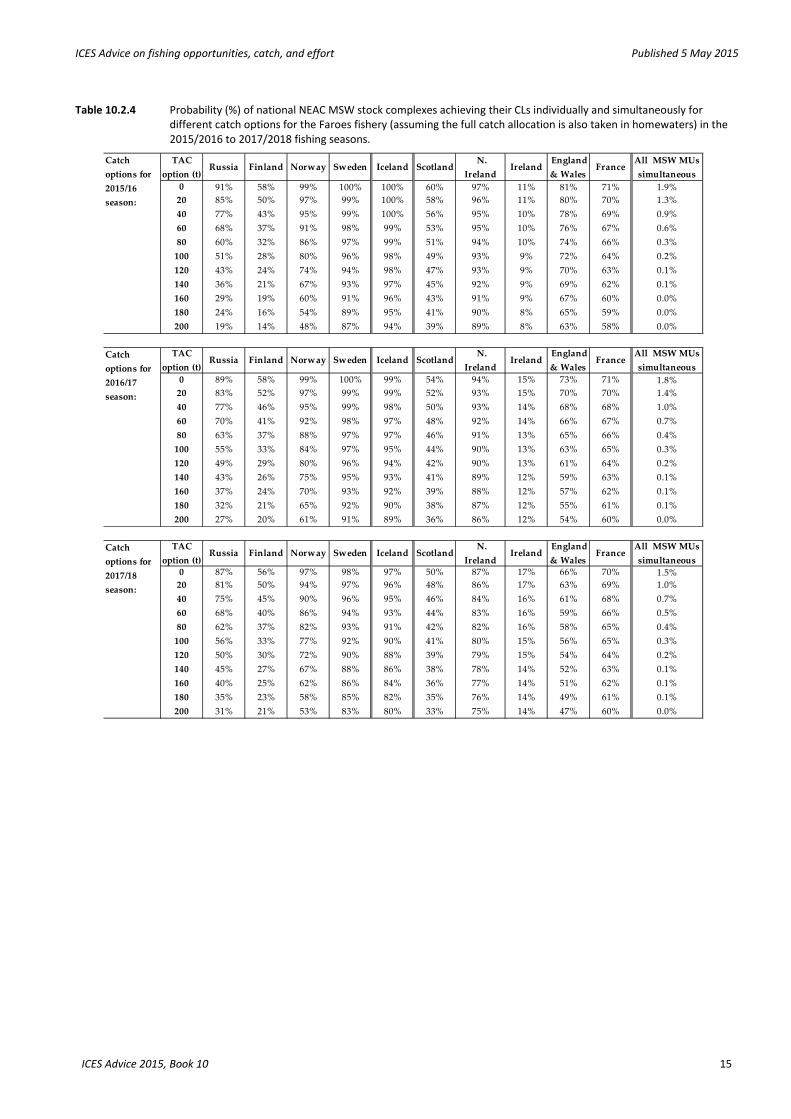
Table 10.2.4 Probability (%) of national NEAC MSW stock complexes achieving their CLs individually and simultaneously for different catch options for the Faroes fishery (assuming the full catch allocation is also taken in homewaters) in the 2015/2016 to 2017/2018 fishing seasons.
TAC option (t)
Russia Finland Norway Sweden Iceland Scotland N.
Ireland Ireland
England & Wales
FranceAll MSW MUs simultaneous
0 91% 58% 99% 100% 100% 60% 97% 11% 81% 71% 1.9%20 85% 50% 97% 99% 100% 58% 96% 11% 80% 70% 1.3%40 77% 43% 95% 99% 100% 56% 95% 10% 78% 69% 0.9%60 68% 37% 91% 98% 99% 53% 95% 10% 76% 67% 0.6%80 60% 32% 86% 97% 99% 51% 94% 10% 74% 66% 0.3%
100 51% 28% 80% 96% 98% 49% 93% 9% 72% 64% 0.2%120 43% 24% 74% 94% 98% 47% 93% 9% 70% 63% 0.1%140 36% 21% 67% 93% 97% 45% 92% 9% 69% 62% 0.1%160 29% 19% 60% 91% 96% 43% 91% 9% 67% 60% 0.0%180 24% 16% 54% 89% 95% 41% 90% 8% 65% 59% 0.0%200 19% 14% 48% 87% 94% 39% 89% 8% 63% 58% 0.0%
TAC option (t)
Russia Finland Norway Sweden Iceland Scotland N.
Ireland Ireland
England & Wales
FranceAll MSW MUs simultaneous
0 89% 58% 99% 100% 99% 54% 94% 15% 73% 71% 1.8%20 83% 52% 97% 99% 99% 52% 93% 15% 70% 70% 1.4%40 77% 46% 95% 99% 98% 50% 93% 14% 68% 68% 1.0%60 70% 41% 92% 98% 97% 48% 92% 14% 66% 67% 0.7%80 63% 37% 88% 97% 97% 46% 91% 13% 65% 66% 0.4%
100 55% 33% 84% 97% 95% 44% 90% 13% 63% 65% 0.3%120 49% 29% 80% 96% 94% 42% 90% 13% 61% 64% 0.2%140 43% 26% 75% 95% 93% 41% 89% 12% 59% 63% 0.1%160 37% 24% 70% 93% 92% 39% 88% 12% 57% 62% 0.1%180 32% 21% 65% 92% 90% 38% 87% 12% 55% 61% 0.1%200 27% 20% 61% 91% 89% 36% 86% 12% 54% 60% 0.0%
TAC option (t)
Russia Finland Norway Sweden Iceland Scotland N.
Ireland Ireland
England & Wales
FranceAll MSW MUs simultaneous
0 87% 56% 97% 98% 97% 50% 87% 17% 66% 70% 1.5%20 81% 50% 94% 97% 96% 48% 86% 17% 63% 69% 1.0%40 75% 45% 90% 96% 95% 46% 84% 16% 61% 68% 0.7%60 68% 40% 86% 94% 93% 44% 83% 16% 59% 66% 0.5%80 62% 37% 82% 93% 91% 42% 82% 16% 58% 65% 0.4%
100 56% 33% 77% 92% 90% 41% 80% 15% 56% 65% 0.3%120 50% 30% 72% 90% 88% 39% 79% 15% 54% 64% 0.2%140 45% 27% 67% 88% 86% 38% 78% 14% 52% 63% 0.1%160 40% 25% 62% 86% 84% 36% 77% 14% 51% 62% 0.1%180 35% 23% 58% 85% 82% 35% 76% 14% 49% 61% 0.1%200 31% 21% 53% 83% 80% 33% 75% 14% 47% 60% 0.0%
Catch options for 2015/16 season:
Catch options for 2017/18 season:
Catch options for 2016/17 season:
ICES Advice 2015, Book 10 15
Published 5 May 2015 Advice on fishing opportunities, catch, and effort
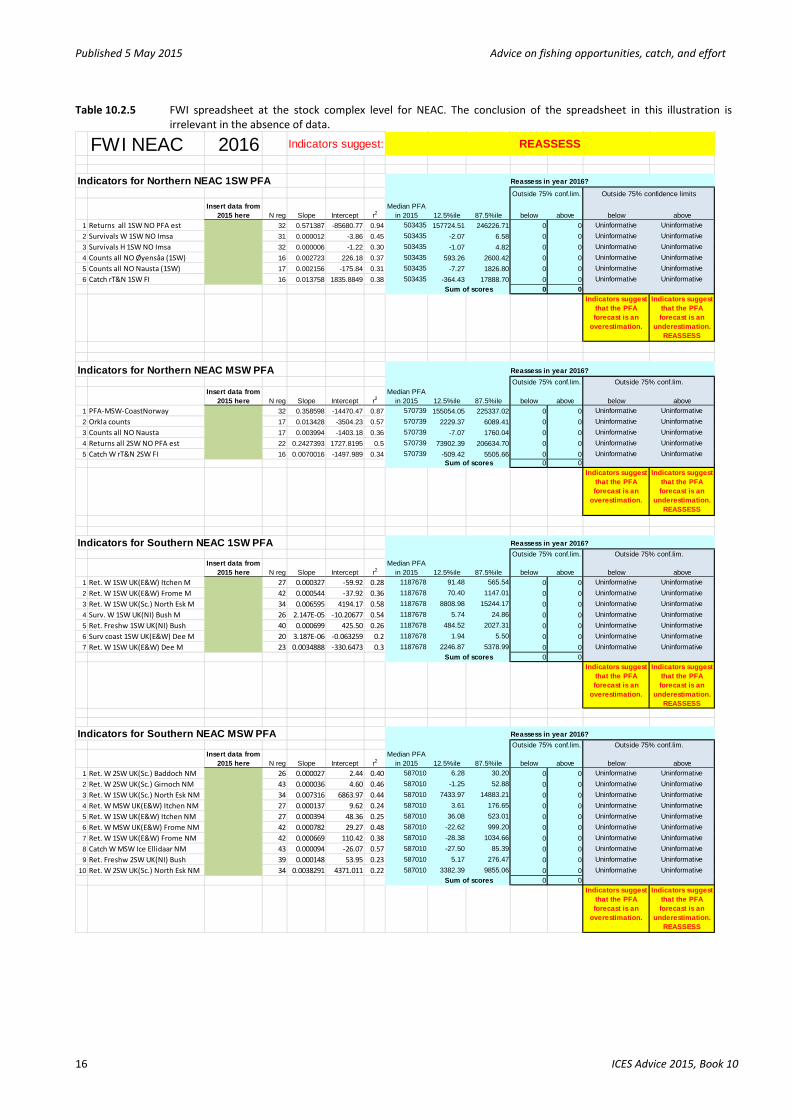
Table 10.2.5 FWI spreadsheet at the stock complex level for NEAC. The conclusion of the spreadsheet in this illustration is irrelevant in the absence of data.
FWI NEAC 2016
Indicators for Northern NEAC 1SW PFA
Insert data from 2015 here N reg Slope Intercept r2
Median PFA in 2015 12.5%ile 87.5%ile below above below above
1 Returns all 1SW NO PFA est 32 0.571387 -85680.77 0.94 503435 157724.51 246226.71 0 0 Uninformative Uninformative2 Survivals W 1SW NO Imsa 31 0.000012 -3.86 0.45 503435 -2.07 6.58 0 0 Uninformative Uninformative3 Survivals H 1SW NO Imsa 32 0.000006 -1.22 0.30 503435 -1.07 4.82 0 0 Uninformative Uninformative4 Counts all NO Øyensåa (1SW) 16 0.002723 226.18 0.37 503435 593.26 2600.42 0 0 Uninformative Uninformative5 Counts all NO Nausta (1SW) 17 0.002156 -175.84 0.31 503435 -7.27 1826.80 0 0 Uninformative Uninformative6 Catch rT&N 1SW FI 16 0.013758 1835.8849 0.38 503435 -364.43 17888.70 0 0 Uninformative Uninformative
0 0Indicators suggest
that the PFA forecast is an
overestimation.
Indicators suggest that the PFA forecast is an
underestimation. REASSESS
Indicators for Northern NEAC MSW PFA
Insert data from 2015 here N reg Slope Intercept r2
Median PFA in 2015 12.5%ile 87.5%ile below above below above
1 PFA-MSW-CoastNorway 32 0.358598 -14470.47 0.87 570739 155054.05 225337.02 0 0 Uninformative Uninformative2 Orkla counts 17 0.013428 -3504.23 0.57 570739 2229.37 6089.41 0 0 Uninformative Uninformative3 Counts all NO Nausta 17 0.003994 -1403.18 0.36 570739 -7.07 1760.04 0 0 Uninformative Uninformative4 Returns all 2SW NO PFA est 22 0.2427393 1727.8195 0.5 570739 73902.39 206634.70 0 0 Uninformative Uninformative5 Catch W rT&N 2SW FI 16 0.0070016 -1497.989 0.34 570739 -509.42 5505.66 0 0 Uninformative Uninformative
0 0Indicators suggest
that the PFA forecast is an
overestimation.
Indicators suggest that the PFA forecast is an
underestimation. REASSESS
Indicators for Southern NEAC 1SW PFA
Insert data from 2015 here N reg Slope Intercept r2
Median PFA in 2015 12.5%ile 87.5%ile below above below above
1 Ret. W 1SW UK(E&W) Itchen M 27 0.000327 -59.92 0.28 1187678 91.48 565.54 0 0 Uninformative Uninformative2 Ret. W 1SW UK(E&W) Frome M 42 0.000544 -37.92 0.36 1187678 70.40 1147.01 0 0 Uninformative Uninformative3 Ret. W 1SW UK(Sc.) North Esk M 34 0.006595 4194.17 0.58 1187678 8808.98 15244.17 0 0 Uninformative Uninformative4 Surv. W 1SW UK(NI) Bush M 26 2.147E-05 -10.20677 0.54 1187678 5.74 24.86 0 0 Uninformative Uninformative5 Ret. Freshw 1SW UK(NI) Bush 40 0.000699 425.50 0.26 1187678 484.52 2027.31 0 0 Uninformative Uninformative6 Surv coast 1SW UK(E&W) Dee M 20 3.187E-06 -0.063259 0.2 1187678 1.94 5.50 0 0 Uninformative Uninformative7 Ret. W 1SW UK(E&W) Dee M 23 0.0034888 -330.6473 0.3 1187678 2246.87 5378.99 0 0 Uninformative Uninformative
0 0Indicators suggest
that the PFA forecast is an
overestimation.
Indicators suggest that the PFA forecast is an
underestimation. REASSESS
Indicators for Southern NEAC MSW PFA
Insert data from 2015 here N reg Slope Intercept r2
Median PFA in 2015 12.5%ile 87.5%ile below above below above
1 Ret. W 2SW UK(Sc.) Baddoch NM 26 0.000027 2.44 0.40 587010 6.28 30.20 0 0 Uninformative Uninformative2 Ret. W 2SW UK(Sc.) Girnoch NM 43 0.000036 4.60 0.46 587010 -1.25 52.88 0 0 Uninformative Uninformative3 Ret. W 1SW UK(Sc.) North Esk NM 34 0.007316 6863.97 0.44 587010 7433.97 14883.21 0 0 Uninformative Uninformative4 Ret. W MSW UK(E&W) Itchen NM 27 0.000137 9.62 0.24 587010 3.61 176.65 0 0 Uninformative Uninformative5 Ret. W 1SW UK(E&W) Itchen NM 27 0.000394 48.36 0.25 587010 36.08 523.01 0 0 Uninformative Uninformative6 Ret. W MSW UK(E&W) Frome NM 42 0.000782 29.27 0.48 587010 -22.62 999.20 0 0 Uninformative Uninformative7 Ret. W 1SW UK(E&W) Frome NM 42 0.000669 110.42 0.38 587010 -28.38 1034.66 0 0 Uninformative Uninformative8 Catch W MSW Ice Ellidaar NM 43 0.000094 -26.07 0.57 587010 -27.50 85.39 0 0 Uninformative Uninformative9 Ret. Freshw 2SW UK(NI) Bush 39 0.000148 53.95 0.23 587010 5.17 276.47 0 0 Uninformative Uninformative
10 Ret. W 2SW UK(Sc.) North Esk NM 34 0.0038291 4371.011 0.22 587010 3382.39 9855.06 0 0 Uninformative Uninformative0 0
Indicators suggest that the PFA forecast is an
overestimation.
Indicators suggest that the PFA forecast is an
underestimation. REASSESS
REASSESSIndicators suggest:
Sum of scores
Outside 75% conf.lim.
Outside 75% confidence limits
Outside 75% conf.lim.
Outside 75% conf.lim.
Sum of scores
Reassess in year 2016?
Reassess in year 2016?
Reassess in year 2016?
Reassess in year 2016?
Sum of scores
Outside 75% conf.lim. Outside 75% conf.lim.
Sum of scores
Outside 75% conf.lim. Outside 75% conf.lim.
16 ICES Advice 2015, Book 10
ICES Advice on fishing opportunities, catch, and effort Published 5 May 2015
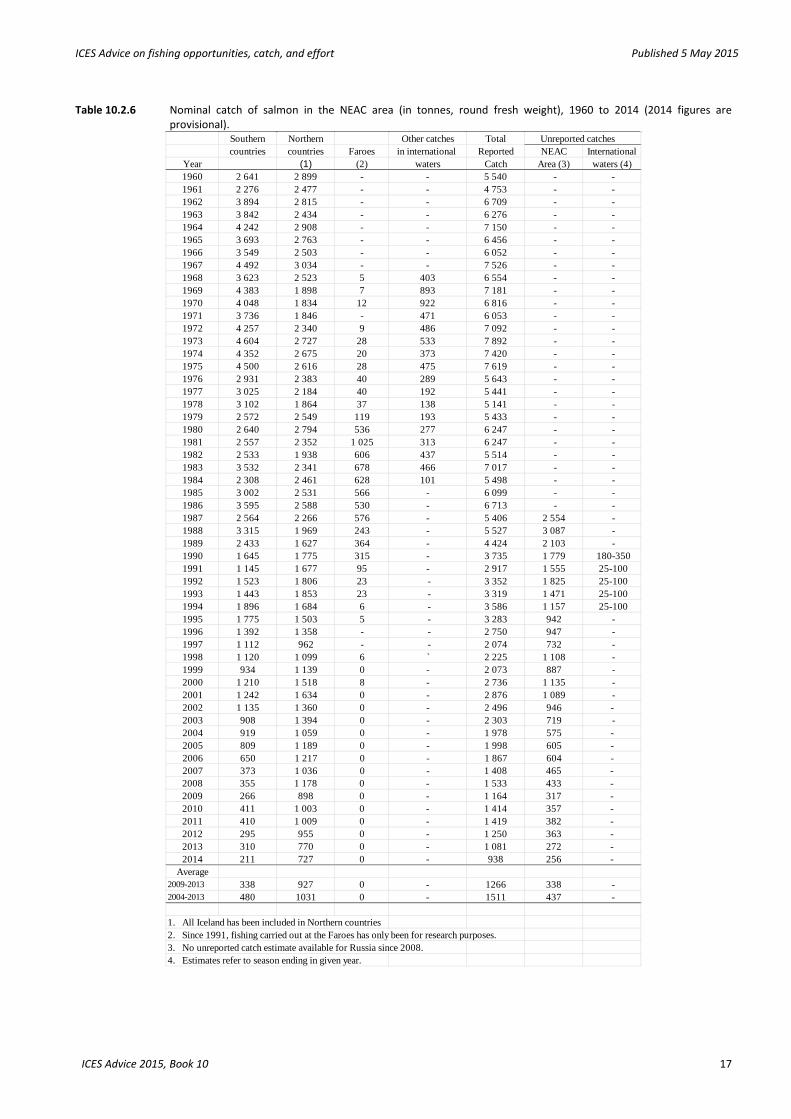
Table 10.2.6 Nominal catch of salmon in the NEAC area (in tonnes, round fresh weight), 1960 to 2014 (2014 figures are provisional).
Southern Northern Other catches Total Unreported catchescountries countries Faroes in international Reported NEAC International
Year (1) (2) waters Catch Area (3) waters (4)1960 2 641 2 899 - - 5 540 - -1961 2 276 2 477 - - 4 753 - -1962 3 894 2 815 - - 6 709 - -1963 3 842 2 434 - - 6 276 - -1964 4 242 2 908 - - 7 150 - -1965 3 693 2 763 - - 6 456 - -1966 3 549 2 503 - - 6 052 - -1967 4 492 3 034 - - 7 526 - -1968 3 623 2 523 5 403 6 554 - -1969 4 383 1 898 7 893 7 181 - -1970 4 048 1 834 12 922 6 816 - -1971 3 736 1 846 - 471 6 053 - -1972 4 257 2 340 9 486 7 092 - -1973 4 604 2 727 28 533 7 892 - -1974 4 352 2 675 20 373 7 420 - -1975 4 500 2 616 28 475 7 619 - -1976 2 931 2 383 40 289 5 643 - -1977 3 025 2 184 40 192 5 441 - -1978 3 102 1 864 37 138 5 141 - -1979 2 572 2 549 119 193 5 433 - -1980 2 640 2 794 536 277 6 247 - -1981 2 557 2 352 1 025 313 6 247 - -1982 2 533 1 938 606 437 5 514 - -1983 3 532 2 341 678 466 7 017 - -1984 2 308 2 461 628 101 5 498 - -1985 3 002 2 531 566 - 6 099 - -1986 3 595 2 588 530 - 6 713 - -1987 2 564 2 266 576 - 5 406 2 554 -1988 3 315 1 969 243 - 5 527 3 087 -1989 2 433 1 627 364 - 4 424 2 103 -1990 1 645 1 775 315 - 3 735 1 779 180-3501991 1 145 1 677 95 - 2 917 1 555 25-1001992 1 523 1 806 23 - 3 352 1 825 25-1001993 1 443 1 853 23 - 3 319 1 471 25-1001994 1 896 1 684 6 - 3 586 1 157 25-1001995 1 775 1 503 5 - 3 283 942 -1996 1 392 1 358 - - 2 750 947 -1997 1 112 962 - - 2 074 732 -1998 1 120 1 099 6 ` 2 225 1 108 -1999 934 1 139 0 - 2 073 887 -2000 1 210 1 518 8 - 2 736 1 135 -2001 1 242 1 634 0 - 2 876 1 089 -2002 1 135 1 360 0 - 2 496 946 -2003 908 1 394 0 - 2 303 719 -2004 919 1 059 0 - 1 978 575 -2005 809 1 189 0 - 1 998 605 -2006 650 1 217 0 - 1 867 604 -2007 373 1 036 0 - 1 408 465 -2008 355 1 178 0 - 1 533 433 -2009 266 898 0 - 1 164 317 -2010 411 1 003 0 - 1 414 357 -2011 410 1 009 0 - 1 419 382 -2012 295 955 0 - 1 250 363 -2013 310 770 0 - 1 081 272 -2014 211 727 0 - 938 256 -
Average2009-2013 338 927 0 - 1266 338 -2004-2013 480 1031 0 - 1511 437 -
1. All Iceland has been included in Northern countries2. Since 1991, fishing carried out at the Faroes has only been for research purposes.3. No unreported catch estimate available for Russia since 2008.4. Estimates refer to season ending in given year.
ICES Advice 2015, Book 10 17
Published 5 May 2015 Advice on fishing opportunities, catch, and effort
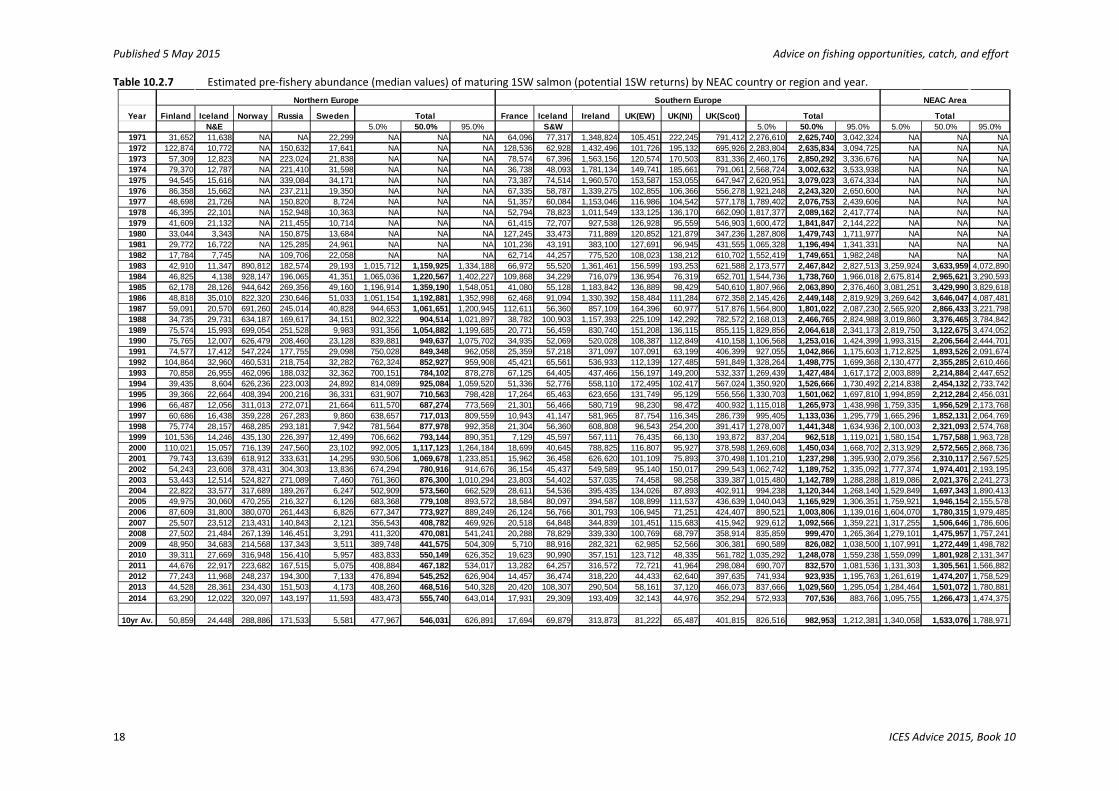
Table 10.2.7 Estimated pre-fishery abundance (median values) of maturing 1SW salmon (potential 1SW returns) by NEAC country or region and year.
Year Finland Iceland Norway Russia Sweden France Iceland Ireland UK(EW) UK(NI) UK(Scot)N&E 5.0% 50.0% 95.0% S&W 5.0% 50.0% 95.0% 5.0% 50.0% 95.0%
1971 31,652 11,638 NA NA 22,299 NA NA NA 64,096 77,317 1,348,824 105,451 222,245 791,412 2,276,610 2,625,740 3,042,324 NA NA NA1972 122,874 10,772 NA 150,632 17,641 NA NA NA 128,536 62,928 1,432,496 101,726 195,132 695,926 2,283,804 2,635,834 3,094,725 NA NA NA1973 57,309 12,823 NA 223,024 21,838 NA NA NA 78,574 67,396 1,563,156 120,574 170,503 831,336 2,460,176 2,850,292 3,336,676 NA NA NA1974 79,370 12,787 NA 221,410 31,598 NA NA NA 36,738 48,093 1,781,134 149,741 185,661 791,061 2,568,724 3,002,632 3,533,938 NA NA NA1975 94,545 15,616 NA 339,084 34,171 NA NA NA 73,387 74,514 1,960,570 153,587 153,055 647,947 2,620,951 3,079,023 3,674,334 NA NA NA1976 86,358 15,662 NA 237,211 19,350 NA NA NA 67,335 58,787 1,339,275 102,855 106,366 556,278 1,921,248 2,243,320 2,650,600 NA NA NA1977 48,698 21,726 NA 150,820 8,724 NA NA NA 51,357 60,084 1,153,046 116,986 104,542 577,178 1,789,402 2,076,753 2,439,606 NA NA NA1978 46,395 22,101 NA 152,948 10,363 NA NA NA 52,794 78,823 1,011,549 133,125 136,170 662,090 1,817,377 2,089,162 2,417,774 NA NA NA1979 41,609 21,132 NA 211,455 10,714 NA NA NA 61,415 72,707 927,538 126,928 95,559 546,903 1,600,472 1,841,847 2,144,222 NA NA NA1980 33,044 3,343 NA 150,875 13,684 NA NA NA 127,245 33,473 711,889 120,852 121,879 347,236 1,287,808 1,479,743 1,711,977 NA NA NA1981 29,772 16,722 NA 125,285 24,961 NA NA NA 101,236 43,191 383,100 127,691 96,945 431,555 1,065,328 1,196,494 1,341,331 NA NA NA1982 17,784 7,745 NA 109,706 22,058 NA NA NA 62,714 44,257 775,520 108,023 138,212 610,702 1,552,419 1,749,651 1,982,248 NA NA NA1983 42,910 11,347 890,812 182,574 29,193 1,015,712 1,159,925 1,334,188 66,972 55,520 1,361,461 156,599 193,253 621,588 2,173,577 2,467,842 2,827,513 3,259,924 3,633,959 4,072,8901984 46,825 4,138 928,147 196,065 41,351 1,065,036 1,220,567 1,402,227 109,868 34,229 716,079 136,954 76,319 652,701 1,544,736 1,738,760 1,966,018 2,675,814 2,965,621 3,290,5931985 62,178 28,126 944,642 269,356 49,160 1,196,914 1,359,190 1,548,051 41,080 55,128 1,183,842 136,889 98,429 540,610 1,807,966 2,063,890 2,376,460 3,081,251 3,429,990 3,829,6181986 48,818 35,010 822,320 230,646 51,033 1,051,154 1,192,881 1,352,998 62,468 91,094 1,330,392 158,484 111,284 672,358 2,145,426 2,449,148 2,819,929 3,269,642 3,646,047 4,087,4811987 59,091 20,570 691,260 245,014 40,828 944,653 1,061,651 1,200,945 112,611 56,360 857,109 164,396 60,977 517,876 1,564,800 1,801,022 2,087,230 2,565,920 2,866,433 3,221,7981988 34,735 29,731 634,187 169,617 34,151 802,322 904,514 1,021,897 38,782 100,903 1,157,393 225,109 142,292 782,572 2,168,013 2,466,765 2,824,988 3,019,860 3,376,465 3,784,8421989 75,574 15,993 699,054 251,528 9,983 931,356 1,054,882 1,199,685 20,771 56,459 830,740 151,208 136,115 855,115 1,829,856 2,064,618 2,341,173 2,819,750 3,122,675 3,474,0521990 75,765 12,007 626,479 208,460 23,128 839,881 949,637 1,075,702 34,935 52,069 520,028 108,387 112,849 410,158 1,106,568 1,253,016 1,424,399 1,993,315 2,206,564 2,444,7011991 74,577 17,412 547,224 177,755 29,098 750,028 849,348 962,058 25,359 57,218 371,097 107,091 63,199 406,399 927,055 1,042,866 1,175,603 1,712,825 1,893,526 2,091,6741992 104,864 32,960 460,531 218,754 32,282 762,324 852,927 959,908 45,421 65,561 536,933 112,139 127,485 591,849 1,328,264 1,498,775 1,699,368 2,130,477 2,355,285 2,610,4661993 70,858 26,955 462,096 188,032 32,362 700,151 784,102 878,278 67,125 64,405 437,466 156,197 149,200 532,337 1,269,439 1,427,484 1,617,172 2,003,889 2,214,884 2,447,6521994 39,435 8,604 626,236 223,003 24,892 814,089 925,084 1,059,520 51,336 52,776 558,110 172,495 102,417 567,024 1,350,920 1,526,666 1,730,492 2,214,838 2,454,132 2,733,7421995 39,366 22,664 408,394 200,216 36,331 631,907 710,563 798,428 17,264 65,463 623,656 131,749 95,129 556,556 1,330,703 1,501,062 1,697,810 1,994,859 2,212,284 2,456,0311996 66,487 12,056 311,013 272,071 21,664 611,570 687,274 773,569 21,301 56,466 580,719 98,230 98,472 400,932 1,115,018 1,265,973 1,438,998 1,759,335 1,956,529 2,173,7681997 60,686 16,438 359,228 267,283 9,860 638,657 717,013 809,559 10,943 41,147 581,965 87,754 116,345 286,739 995,405 1,133,036 1,295,779 1,665,296 1,852,131 2,064,7691998 75,774 28,157 468,285 293,181 7,942 781,564 877,978 992,358 21,304 56,360 608,808 96,543 254,200 391,417 1,278,007 1,441,348 1,634,936 2,100,003 2,321,093 2,574,7681999 101,536 14,246 435,130 226,397 12,499 706,662 793,144 890,351 7,129 45,597 567,111 76,435 66,130 193,872 837,204 962,518 1,119,021 1,580,154 1,757,588 1,963,7282000 110,021 15,057 716,139 247,560 23,102 992,005 1,117,123 1,264,184 18,699 40,645 788,825 116,807 95,927 378,598 1,269,608 1,450,034 1,668,702 2,313,929 2,572,565 2,868,7362001 79,743 13,639 618,912 333,631 14,295 930,506 1,069,678 1,233,851 15,962 36,458 626,620 101,109 75,893 370,498 1,101,210 1,237,298 1,395,930 2,079,356 2,310,117 2,567,5252002 54,243 23,608 378,431 304,303 13,836 674,294 780,916 914,676 36,154 45,437 549,589 95,140 150,017 299,543 1,062,742 1,189,752 1,335,092 1,777,374 1,974,401 2,193,1952003 53,443 12,514 524,827 271,089 7,460 761,360 876,300 1,010,294 23,803 54,402 537,035 74,458 98,258 339,387 1,015,480 1,142,789 1,288,288 1,819,086 2,021,376 2,241,2732004 22,822 33,577 317,689 189,267 6,247 502,909 573,560 662,529 28,611 54,536 395,435 134,026 87,893 402,911 994,238 1,120,344 1,268,140 1,529,849 1,697,343 1,890,4132005 49,975 30,060 470,255 216,327 6,126 683,368 779,108 893,572 18,584 80,097 394,587 108,899 111,537 436,639 1,040,043 1,165,929 1,306,351 1,759,921 1,946,154 2,155,5782006 87,609 31,800 380,070 261,443 6,826 677,347 773,927 889,249 26,124 56,766 301,793 106,945 71,251 424,407 890,521 1,003,806 1,139,016 1,604,070 1,780,315 1,979,4852007 25,507 23,512 213,431 140,843 2,121 356,543 408,782 469,926 20,518 64,848 344,839 101,451 115,683 415,942 929,612 1,092,566 1,359,221 1,317,255 1,506,646 1,786,6062008 27,502 21,484 267,139 146,451 3,291 411,320 470,081 541,241 20,288 78,829 339,330 100,769 68,797 358,914 835,859 999,470 1,265,364 1,279,101 1,475,957 1,757,2412009 48,950 34,683 214,568 137,343 3,511 389,748 441,575 504,309 5,710 88,916 282,321 62,985 52,566 306,381 690,589 826,082 1,038,500 1,107,991 1,272,449 1,498,7822010 39,311 27,669 316,948 156,410 5,957 483,833 550,149 626,352 19,623 90,990 357,151 123,712 48,335 561,782 1,035,292 1,248,078 1,559,238 1,559,099 1,801,928 2,131,3472011 44,676 22,917 223,682 167,515 5,075 408,884 467,182 534,017 13,282 64,257 316,572 72,721 41,964 298,084 690,707 832,570 1,081,536 1,131,303 1,305,561 1,566,8822012 77,243 11,968 248,237 194,300 7,133 476,894 545,252 626,904 14,457 36,474 318,220 44,433 62,640 397,635 741,934 923,935 1,195,763 1,261,619 1,474,207 1,758,5292013 44,528 28,361 234,430 151,503 4,173 408,260 468,516 540,328 20,420 108,307 290,504 58,161 37,120 466,073 837,666 1,029,560 1,295,054 1,284,464 1,501,072 1,780,8812014 63,290 12,022 320,097 143,197 11,593 483,473 555,740 643,014 17,931 29,309 193,409 32,143 44,976 352,294 572,933 707,536 883,766 1,095,755 1,266,473 1,474,375
10yr Av. 50,859 24,448 288,886 171,533 5,581 477,967 546,031 626,891 17,694 69,879 313,873 81,222 65,487 401,815 826,516 982,953 1,212,381 1,340,058 1,533,076 1,788,971
NEAC Area
Total Total Total
Northern Europe Southern Europe
18 ICES Advice 2015, Book 10
ICES Advice on fishing opportunities, catch, and effort Published 5 May 2015
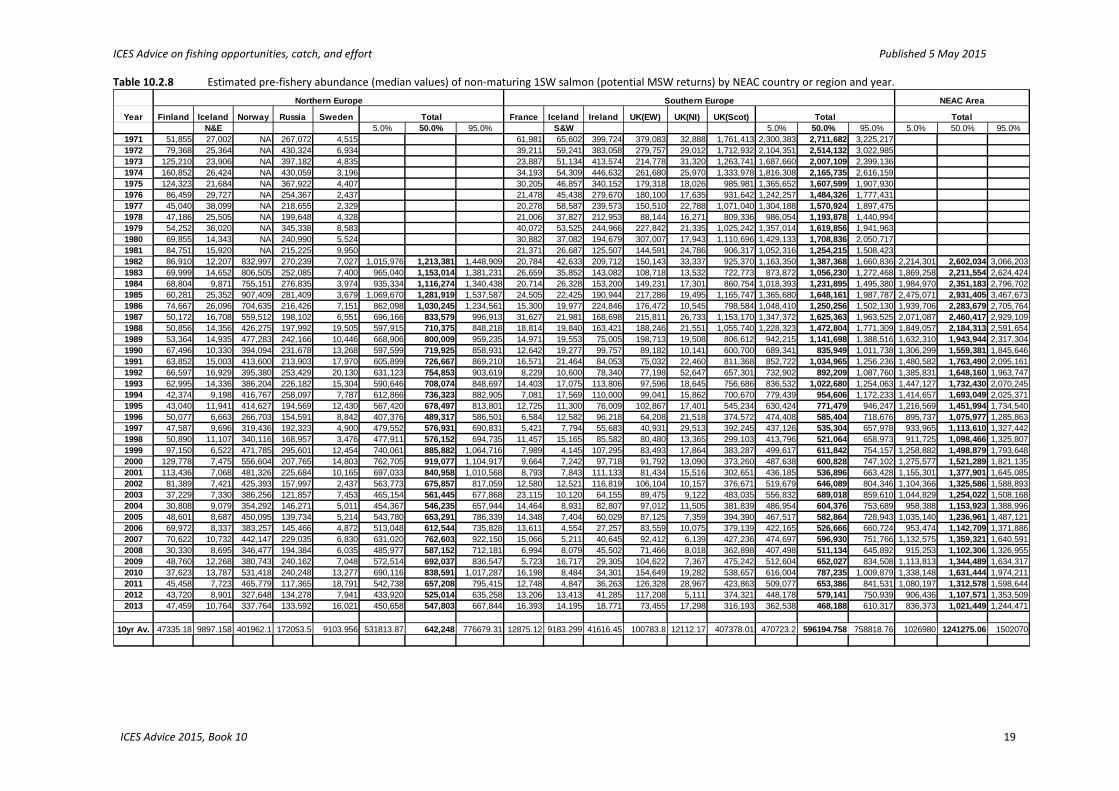
Table 10.2.8 Estimated pre-fishery abundance (median values) of non-maturing 1SW salmon (potential MSW returns) by NEAC country or region and year.
Year Finland Iceland Norway Russia Sweden France Iceland Ireland UK(EW) UK(NI) UK(Scot)N&E 5.0% 50.0% 95.0% S&W 5.0% 50.0% 95.0% 5.0% 50.0% 95.0%
1971 51,855 27,002 NA 267,072 4,515 61,981 65,602 399,724 379,083 32,888 1,761,413 2,300,383 2,711,682 3,225,2171972 79,368 25,364 NA 430,324 6,934 39,211 59,241 383,058 279,757 29,012 1,712,932 2,104,351 2,514,132 3,022,9851973 125,210 23,906 NA 397,182 4,835 23,887 51,134 413,574 214,778 31,320 1,263,741 1,687,660 2,007,109 2,399,1361974 160,852 26,424 NA 430,059 3,196 34,193 54,309 446,632 261,680 25,970 1,333,978 1,816,308 2,165,735 2,616,1591975 124,323 21,684 NA 367,922 4,407 30,205 46,857 340,152 179,318 18,026 985,981 1,365,652 1,607,599 1,907,9301976 86,459 29,727 NA 254,367 2,437 21,478 45,438 279,670 180,100 17,635 931,642 1,242,257 1,484,326 1,777,4311977 45,040 38,099 NA 218,655 2,329 20,278 58,587 239,573 150,510 22,788 1,071,040 1,304,188 1,570,924 1,897,4751978 47,186 25,505 NA 199,648 4,328 21,006 37,827 212,953 88,144 16,271 809,336 986,054 1,193,878 1,440,9941979 54,252 36,020 NA 345,338 8,583 40,072 53,525 244,966 227,842 21,335 1,025,242 1,357,014 1,619,856 1,941,9631980 69,855 14,343 NA 240,990 5,524 30,882 37,082 194,679 307,007 17,943 1,110,696 1,429,133 1,708,836 2,050,7171981 84,751 15,920 NA 215,225 9,950 21,371 26,687 125,507 144,591 24,786 906,317 1,052,316 1,254,215 1,508,4231982 86,910 12,207 832,997 270,239 7,027 1,015,976 1,213,381 1,448,909 20,784 42,633 209,712 150,143 33,337 925,370 1,163,350 1,387,368 1,660,836 2,214,301 2,602,034 3,066,2031983 69,999 14,652 806,505 252,085 7,400 965,040 1,153,014 1,381,231 26,659 35,852 143,082 108,718 13,532 722,773 873,872 1,056,230 1,272,468 1,869,258 2,211,554 2,624,4241984 68,804 9,871 755,151 276,835 3,974 935,334 1,116,274 1,340,438 20,714 26,328 153,200 149,231 17,301 860,754 1,018,393 1,231,895 1,495,380 1,984,970 2,351,183 2,796,7021985 60,281 25,352 907,409 281,409 3,679 1,069,670 1,281,919 1,537,587 24,505 22,425 190,944 217,286 19,495 1,165,747 1,365,680 1,648,161 1,987,787 2,475,071 2,931,405 3,467,6731986 74,667 26,096 704,635 216,426 7,151 862,098 1,030,245 1,234,561 15,300 19,977 224,846 176,472 10,545 798,584 1,048,410 1,250,256 1,502,130 1,939,706 2,283,679 2,705,7641987 50,172 16,708 559,512 198,102 6,551 696,166 833,579 996,913 31,627 21,981 168,698 215,811 26,733 1,153,170 1,347,372 1,625,363 1,963,525 2,071,087 2,460,417 2,929,1091988 50,856 14,356 426,275 197,992 19,505 597,915 710,375 848,218 18,814 19,840 163,421 188,246 21,551 1,055,740 1,228,323 1,472,804 1,771,309 1,849,057 2,184,313 2,591,6541989 53,364 14,935 477,283 242,166 10,446 668,906 800,009 959,235 14,971 19,553 75,005 198,713 19,508 806,612 942,215 1,141,698 1,388,516 1,632,310 1,943,944 2,317,3041990 67,496 10,330 394,094 231,678 13,268 597,599 719,925 858,931 12,642 19,277 99,757 89,182 10,141 600,700 689,341 835,949 1,011,738 1,306,299 1,559,381 1,845,6461991 63,852 15,003 413,600 213,903 17,970 605,899 726,667 869,210 16,571 21,464 84,053 75,032 22,460 811,368 852,722 1,034,965 1,256,236 1,480,582 1,763,490 2,095,1611992 66,597 16,929 395,380 253,429 20,130 631,123 754,853 903,619 8,229 10,600 78,340 77,198 52,647 657,301 732,902 892,209 1,087,760 1,385,831 1,648,160 1,963,7471993 62,995 14,336 386,204 226,182 15,304 590,646 708,074 848,697 14,403 17,075 113,806 97,596 18,645 756,686 836,532 1,022,680 1,254,063 1,447,127 1,732,430 2,070,2451994 42,374 9,198 416,767 258,097 7,787 612,866 736,323 882,905 7,081 17,569 110,000 99,041 15,862 700,670 779,439 954,606 1,172,233 1,414,657 1,693,049 2,025,3711995 43,040 11,941 414,627 194,569 12,430 567,420 678,497 813,801 12,725 11,300 76,009 102,867 17,401 545,234 630,424 771,479 946,247 1,216,569 1,451,994 1,734,5401996 50,077 6,663 266,703 154,591 8,842 407,376 489,317 586,501 6,584 12,582 96,218 64,208 21,518 374,572 474,408 585,404 718,676 895,737 1,075,977 1,285,8631997 47,587 9,696 319,436 192,323 4,900 479,552 576,931 690,831 5,421 7,794 55,683 40,931 29,513 392,245 437,126 535,304 657,978 933,965 1,113,610 1,327,4421998 50,890 11,107 340,116 168,957 3,476 477,911 576,152 694,735 11,457 15,165 85,582 80,480 13,365 299,103 413,796 521,064 658,973 911,725 1,098,466 1,325,8071999 97,150 6,522 471,785 295,601 12,454 740,061 885,882 1,064,716 7,989 4,145 107,295 83,493 17,864 383,287 499,617 611,842 754,157 1,258,882 1,498,879 1,793,6482000 129,778 7,475 556,604 207,765 14,803 762,705 919,077 1,104,917 9,664 7,242 97,718 91,792 13,090 373,260 487,638 600,828 747,102 1,275,577 1,521,289 1,821,1352001 113,436 7,068 481,326 225,684 10,165 697,033 840,958 1,010,568 8,793 7,843 111,133 81,434 15,516 302,651 436,185 536,896 663,428 1,155,301 1,377,901 1,645,0852002 81,389 7,421 425,393 157,997 2,437 563,773 675,857 817,059 12,580 12,521 116,819 106,104 10,157 376,671 519,679 646,089 804,346 1,104,366 1,325,586 1,588,8932003 37,229 7,330 386,256 121,857 7,453 465,154 561,445 677,868 23,115 10,120 64,155 89,475 9,122 483,035 556,832 689,018 859,610 1,044,829 1,254,022 1,508,1682004 30,808 9,079 354,292 146,271 5,011 454,367 546,235 657,944 14,464 8,931 82,807 97,012 11,505 381,839 486,954 604,376 753,689 958,388 1,153,923 1,388,9962005 48,601 8,687 450,095 139,734 5,214 543,780 653,291 786,339 14,348 7,404 60,029 87,125 7,359 394,390 467,517 582,864 728,943 1,035,140 1,236,961 1,487,1212006 69,972 8,337 383,257 145,466 4,872 513,048 612,544 735,828 13,611 4,554 27,257 83,559 10,075 379,139 422,165 526,666 660,724 953,474 1,142,709 1,371,8862007 70,622 10,732 442,147 229,035 6,830 631,020 762,603 922,150 15,066 5,211 40,645 92,412 6,139 427,236 474,697 596,930 751,766 1,132,575 1,359,321 1,640,5912008 30,330 8,695 346,477 194,384 6,035 485,977 587,152 712,181 6,994 8,079 45,502 71,466 8,018 362,898 407,498 511,134 645,892 915,253 1,102,306 1,326,9552009 48,760 12,268 380,743 240,162 7,048 572,514 692,037 836,547 5,723 16,717 29,305 104,622 7,367 475,242 512,604 652,027 834,508 1,113,813 1,344,489 1,634,3172010 37,623 13,787 531,418 240,248 13,277 690,116 838,591 1,017,287 16,198 8,484 34,301 154,649 19,282 538,657 616,004 787,235 1,009,879 1,338,148 1,631,444 1,974,2112011 45,458 7,723 465,779 117,365 18,791 542,738 657,208 795,415 12,748 4,847 36,263 126,328 28,967 423,863 509,077 653,386 841,531 1,080,197 1,312,578 1,598,6442012 43,720 8,901 327,648 134,278 7,941 433,920 525,014 635,258 13,206 13,413 41,285 117,208 5,111 374,321 448,178 579,141 750,939 906,436 1,107,571 1,353,5092013 47,459 10,764 337,764 133,592 16,021 450,658 547,803 667,844 16,393 14,195 18,771 73,455 17,298 316,193 362,538 468,188 610,317 836,373 1,021,449 1,244,471
10yr Av. 47335.18 9897.158 401962.1 172053.5 9103.956 531813.87 642,248 776679.31 12875.12 9183.299 41616.45 100783.8 12112.17 407378.01 470723.2 596194.758 758818.76 1026980 1241275.06 1502070
NEAC Area
Total Total Total
Northern Europe Southern Europe
ICES Advice 2015, Book 10 19