1 year-end report january –december 2004 leif Östling president and ceo
TRANSCRIPT
1
Year-end ReportYear-end ReportJanuary –December 2004January –December 2004
Leif ÖstlingLeif ÖstlingPresident and CEOPresident and CEO
2
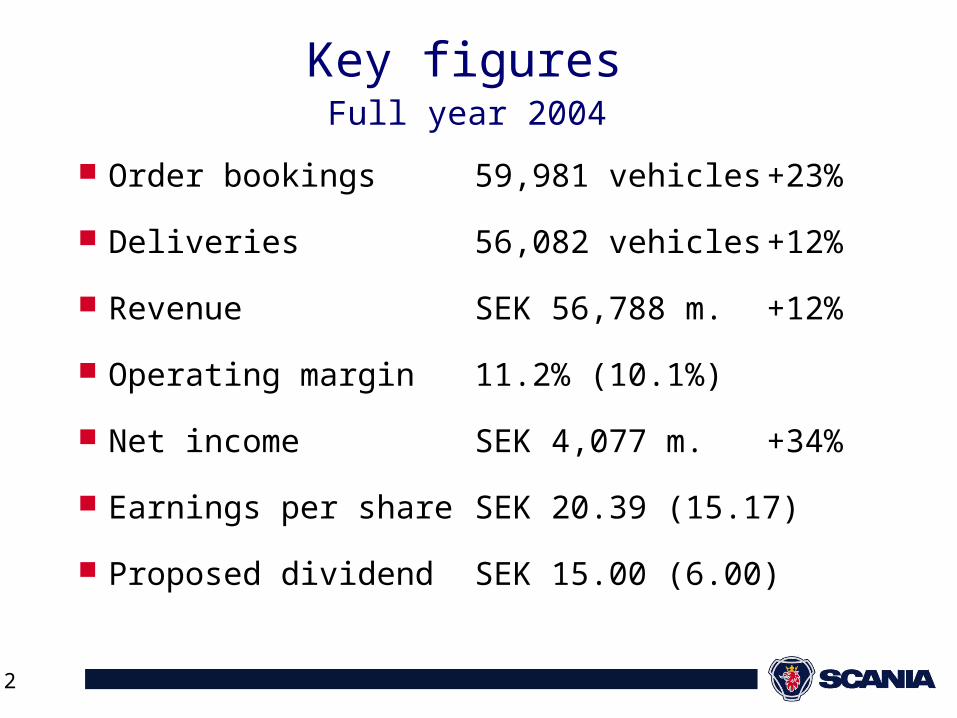
Key figures Full year 2004
Order bookings 59,981 vehicles +23%
Deliveries 56,082 vehicles +12%
Revenue SEK 56,788 m. +12%
Operating margin 11.2% (10.1%)
Net income SEK 4,077 m. +34%
Earnings per share SEK 20.39 (15.17)
Proposed dividend SEK 15.00 (6.00)
3
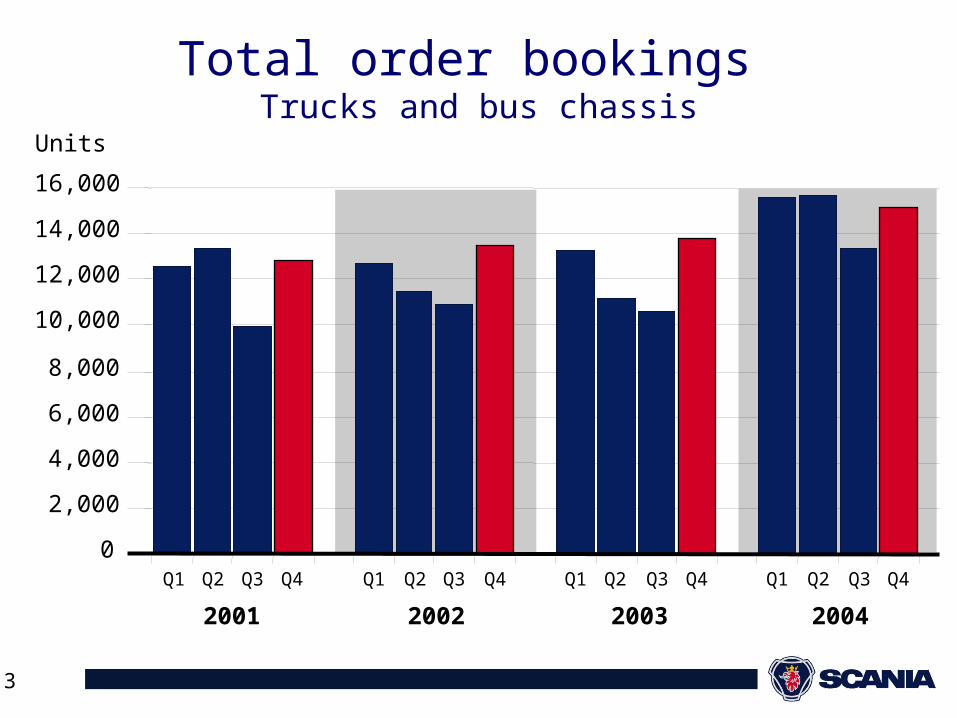
Total order bookings Trucks and bus chassis
2001 2002 2003 2004
Units
0
2,000
4,000
6,000
8,000
10,000
12,000
14,000
16,000
Q1 Q2 Q3 Q4 Q1 Q2 Q3 Q4 Q1 Q2 Q3 Q4 Q1 Q2 Q3 Q4
4
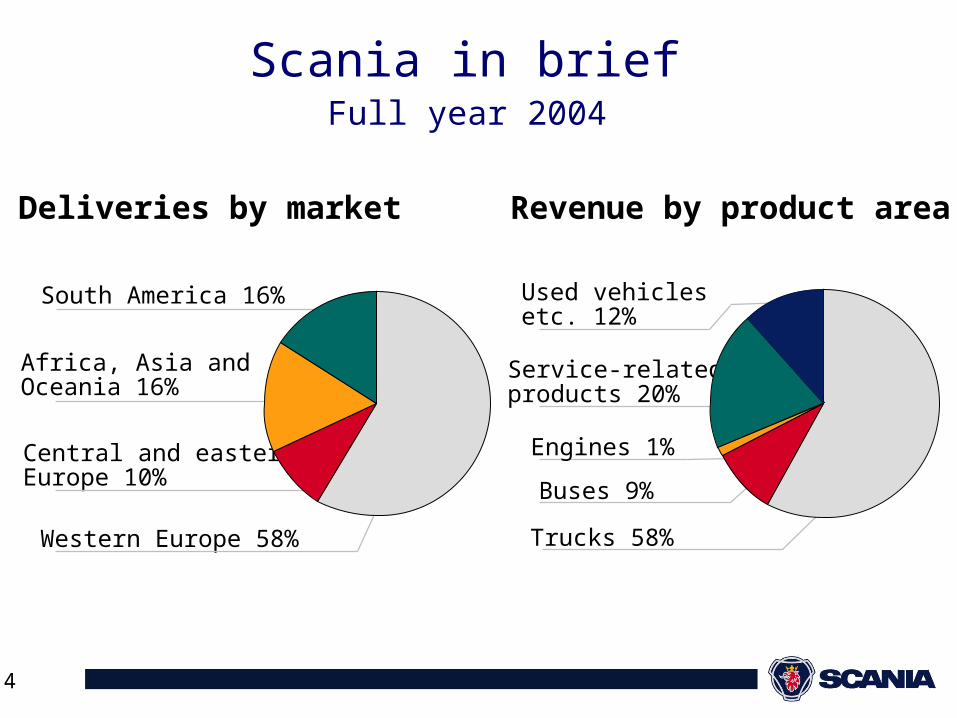
Scania in brief Full year 2004
Used vehiclesetc. 12%
Buses 9%
Trucks 58%
Revenue by product areaDeliveries by market
Africa, Asia and Oceania 16%
Central and easternEurope 10%
South America 16%
Western Europe 58%
Engines 1%
Service-related products 20%
5
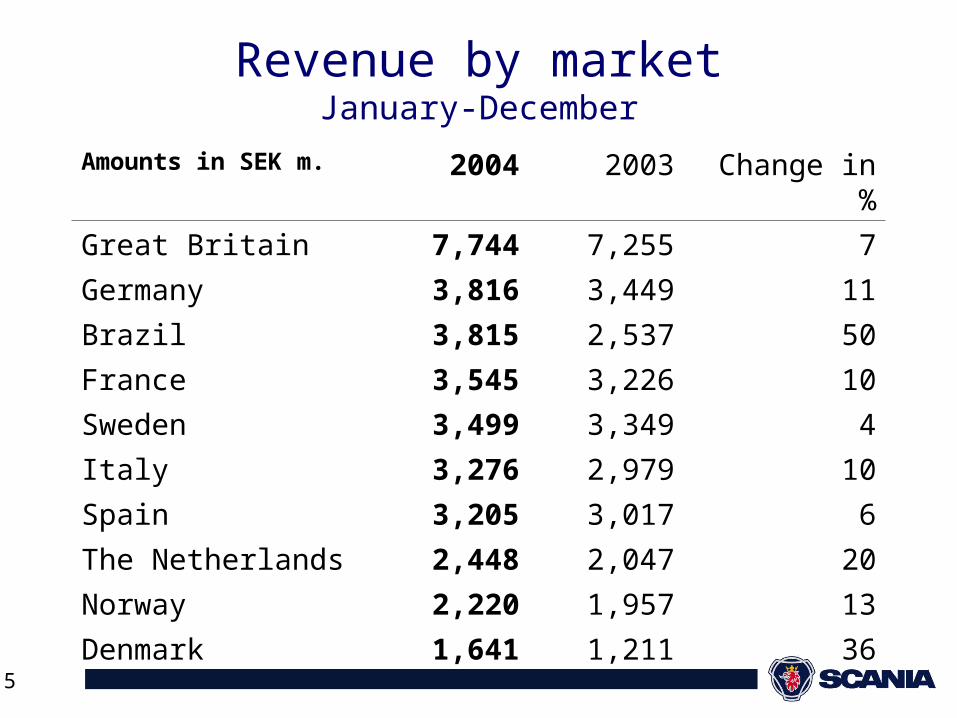
Revenue by marketJanuary-December
Amounts in SEK m. 2004 2003 Change in %
Great Britain 7,744 7,255 7
Germany 3,816 3,449 11
Brazil 3,815 2,537 50
France 3,545 3,226 10
Sweden 3,499 3,349 4
Italy 3,276 2,979 10
Spain 3,205 3,017 6
The Netherlands 2,448 2,047 20
Norway 2,220 1,957 13
Denmark 1,641 1,211 36
6
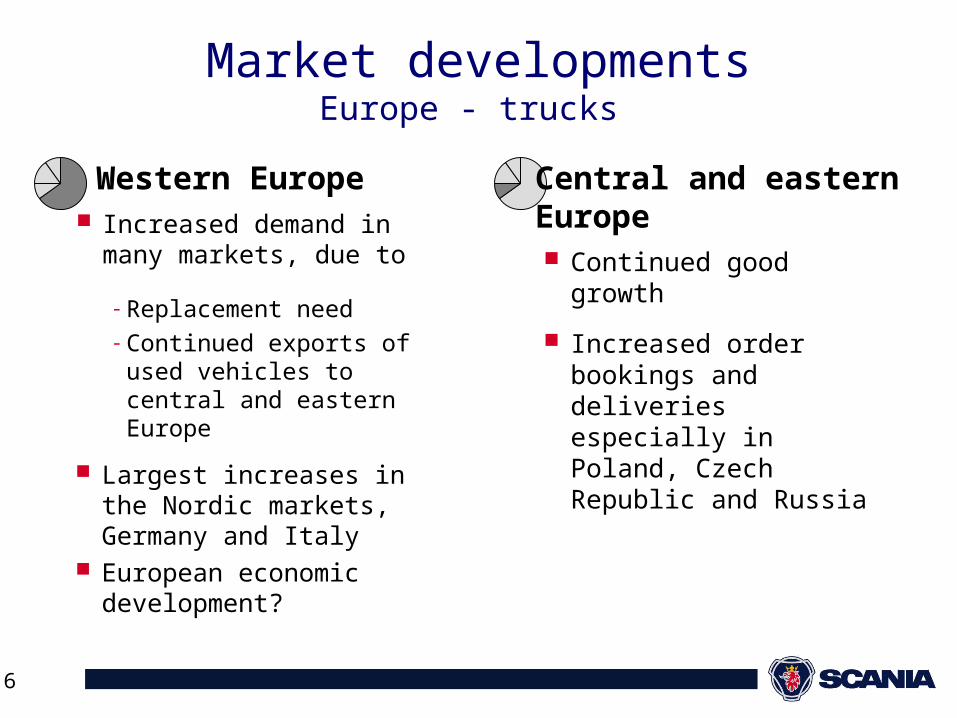
Market developmentsEurope - trucks
Increased demand in many markets, due to
Western Europe Central and eastern Europe
Continued good growth
Increased order bookings and deliveries especially in Poland, Czech Republic and Russia
- Replacement need- Continued exports of
used vehicles to central and eastern Europe
Largest increases in the Nordic markets, Germany and Italy
European economic development?
7
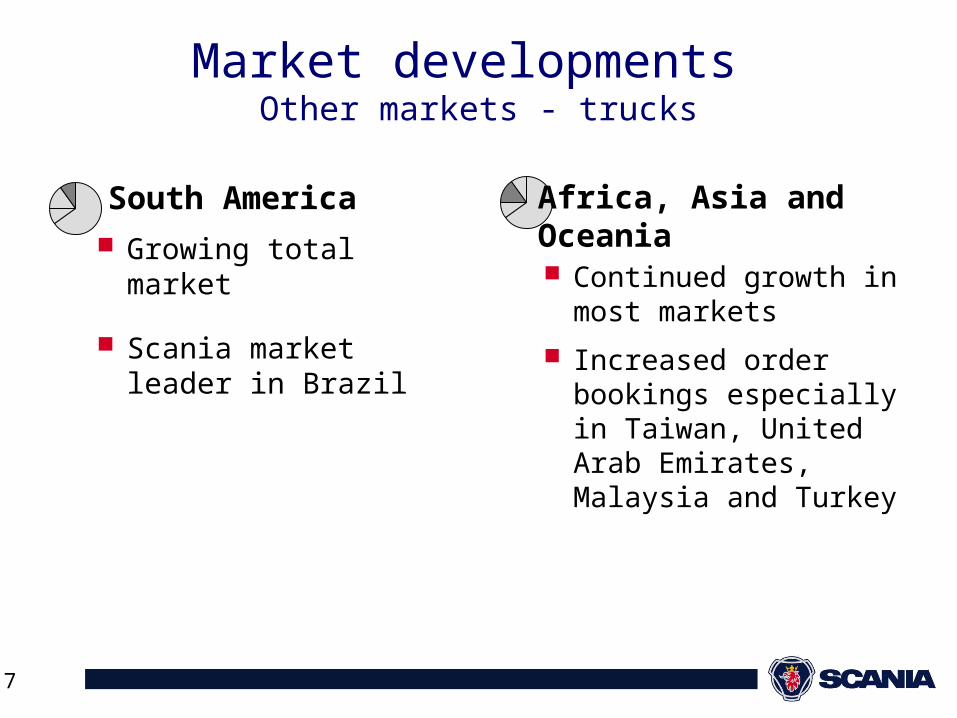
Market developments Other markets - trucks
South America Growing total market
Scania market leader in Brazil
Africa, Asia and Oceania
Continued growth in most markets
Increased order bookings especially in Taiwan, United Arab Emirates, Malaysia and Turkey
8
Deliveries reached highest level in Scania history
Order bookings rose by 34%
Buses and coaches
Industrial and Marine engines
All time high in volumes
Order bookings rose by 59%
9
Year-end ReportYear-end ReportJanuary – December 2004January – December 2004
Jan GuranderJan GuranderGroup Vice President and CFOGroup Vice President and CFO
10
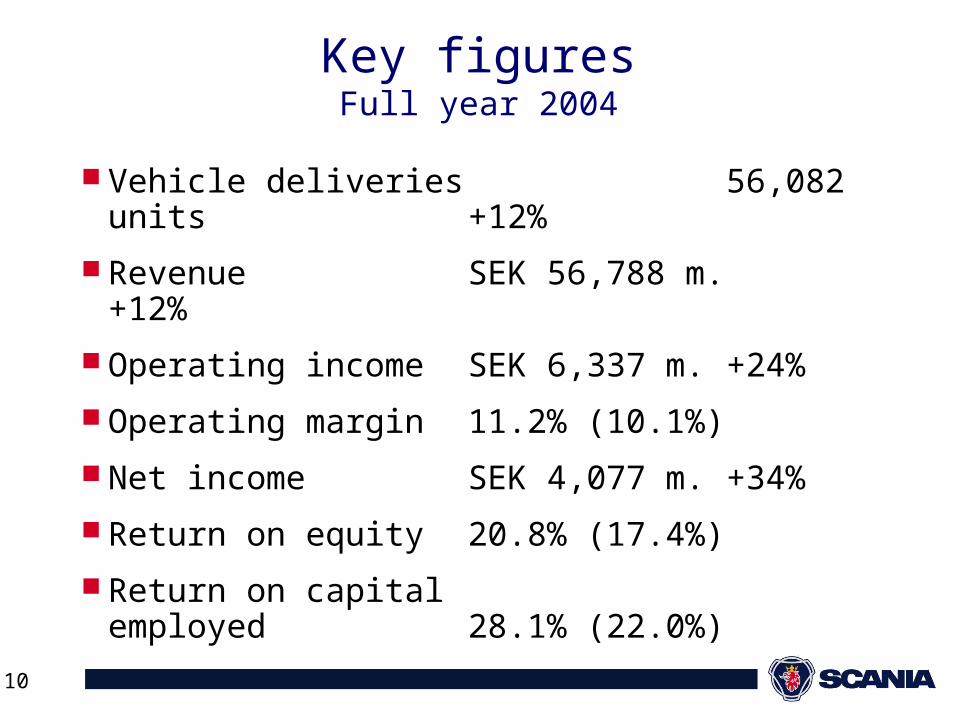
Key figuresFull year 2004
Vehicle deliveries 56,082 units +12%
Revenue SEK 56,788 m. +12%
Operating income SEK 6,337 m. +24%
Operating margin 11.2% (10.1%)
Net income SEK 4,077 m. +34%
Return on equity 20.8% (17.4%)
Return on capital employed 28.1% (22.0%)
11
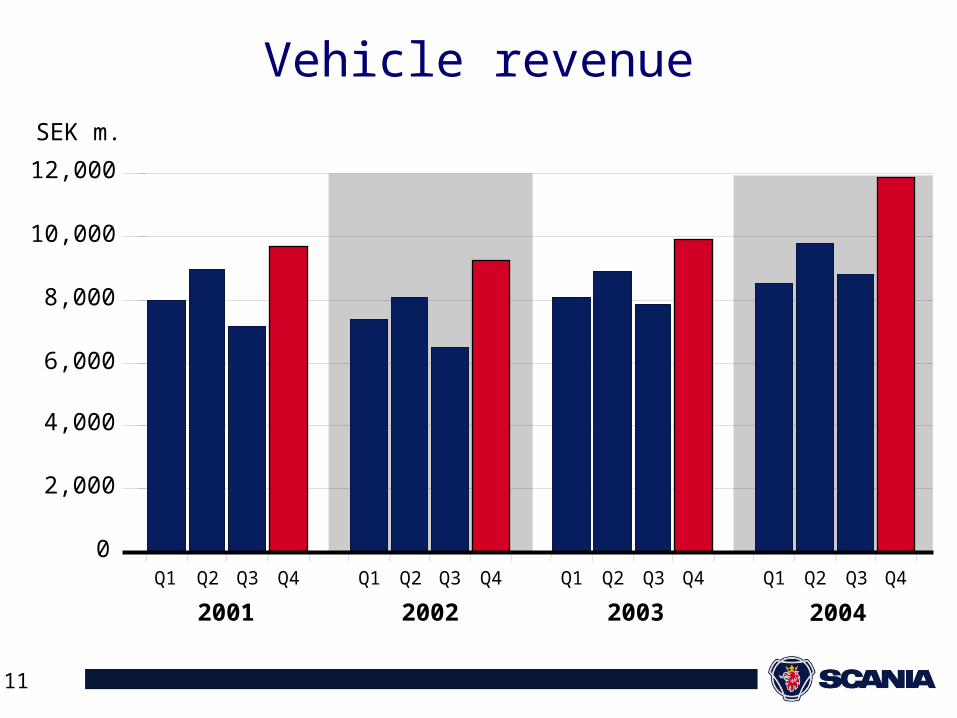
Vehicle revenueSEK m.
2001 2002 2003 2004
0
2,000
4,000
6,000
8,000
10,000
12,000
Q1 Q2 Q3 Q4 Q1 Q2 Q3 Q4 Q1 Q2 Q3 Q4 Q1 Q2 Q3 Q4
12
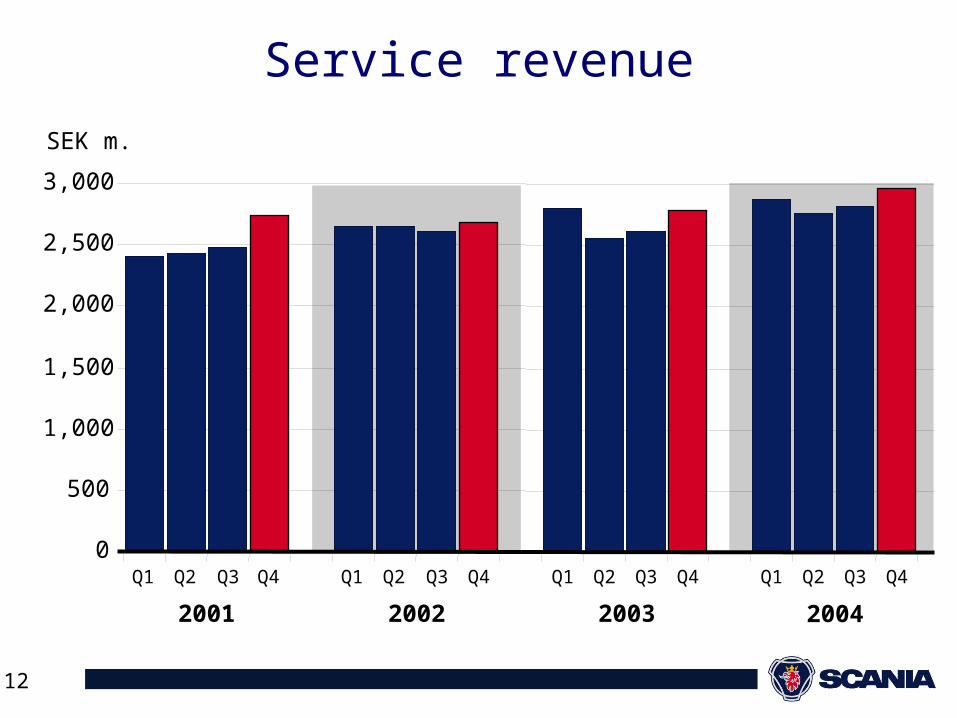
Service revenue
SEK m.
2001 2002 2003 2004
0
500
1,000
1,500
2,000
2,500
3,000
Q1 Q2 Q3 Q4 Q1 Q2 Q3 Q4 Q1 Q2 Q3 Q4 Q1 Q2 Q3 Q4
13
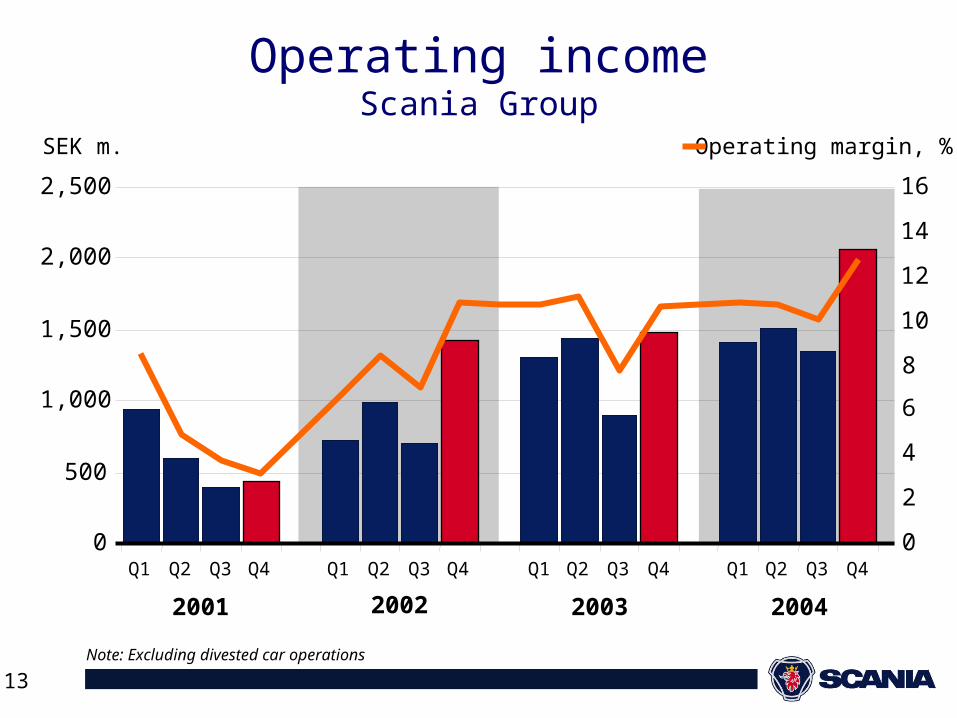
Operating incomeScania Group
2001 2002 2003 2004
SEK m. Operating margin, %
Note: Excluding divested car operations
0
500
1,000
1,500
2,000
2,500
Q1 Q2 Q3 Q4 Q1 Q2 Q3 Q4 Q1 Q2 Q3 Q4 Q1 Q2 Q3 Q40
2
4
6
8
10
12
14
16
14
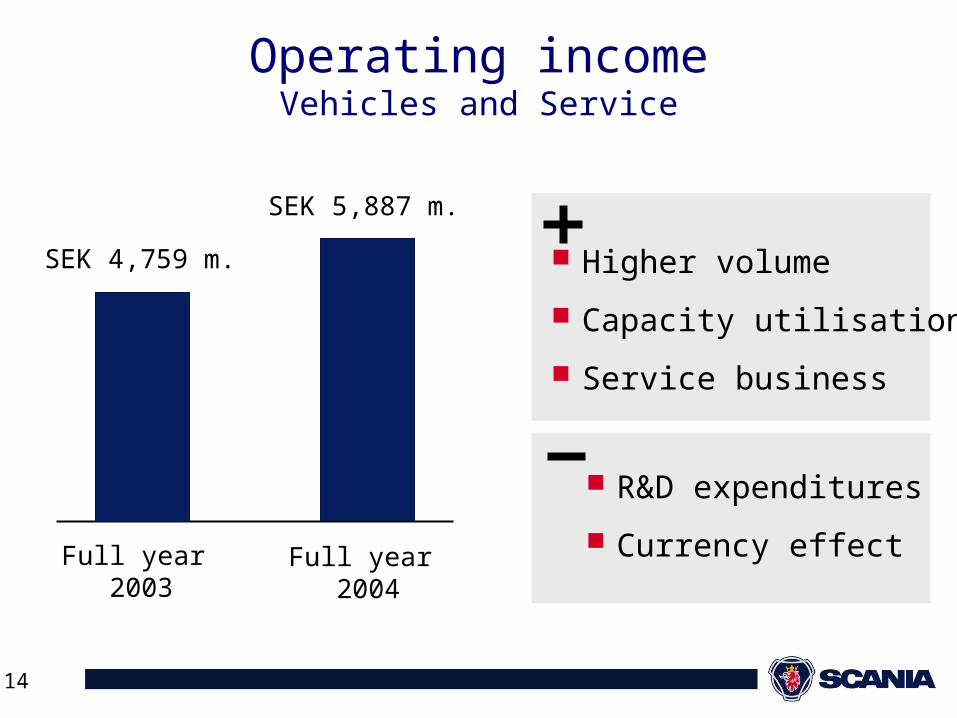
Operating incomeVehicles and Service
SEK 5,887 m.
SEK 4,759 m.
Full year 2004
Full year 2003
Higher volume
Capacity utilisation
Service business
R&D expenditures
Currency effect
15
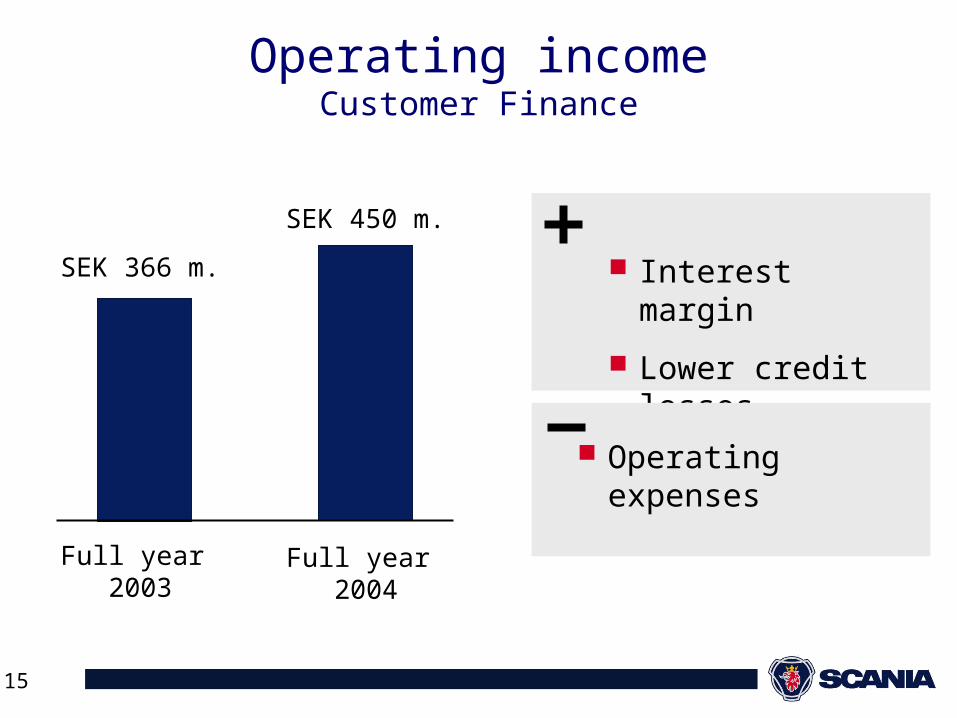
Operating incomeCustomer Finance
SEK 450 m.
SEK 366 m.
Full year 2004
Full year 2003
Interest margin
Lower credit losses
Operating expenses
16
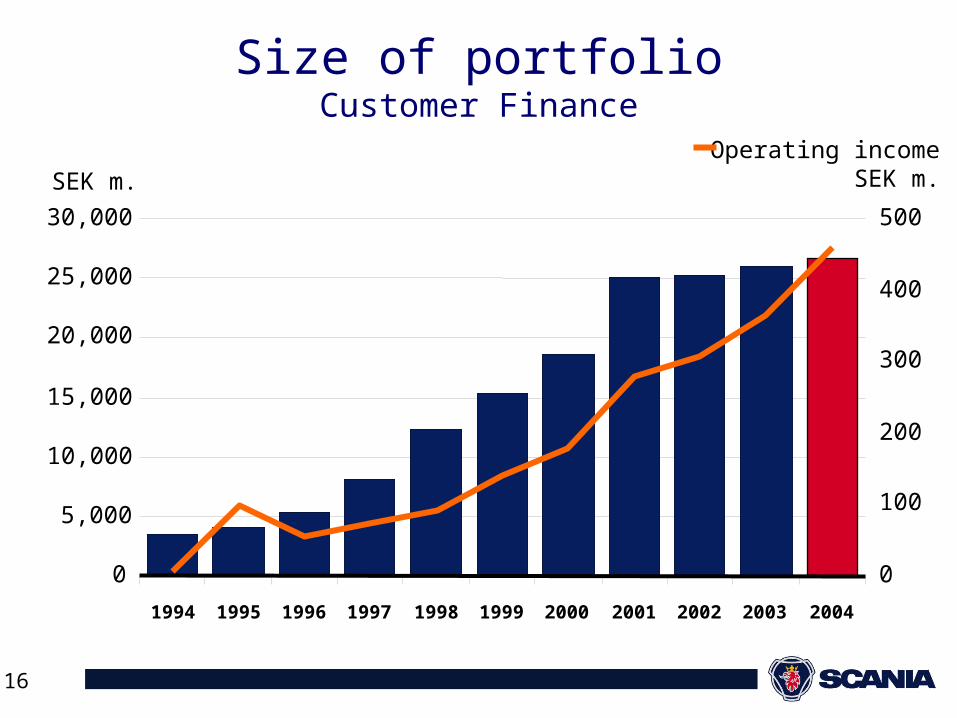
Size of portfolioCustomer Finance
SEK m.
0
5,000
10,000
15,000
20,000
25,000
30,000
1994 1995 1996 1997 1998 1999 2000 2001 2002 2003 2004
0
100
200
300
400
500
Operating incomeSEK m.
17
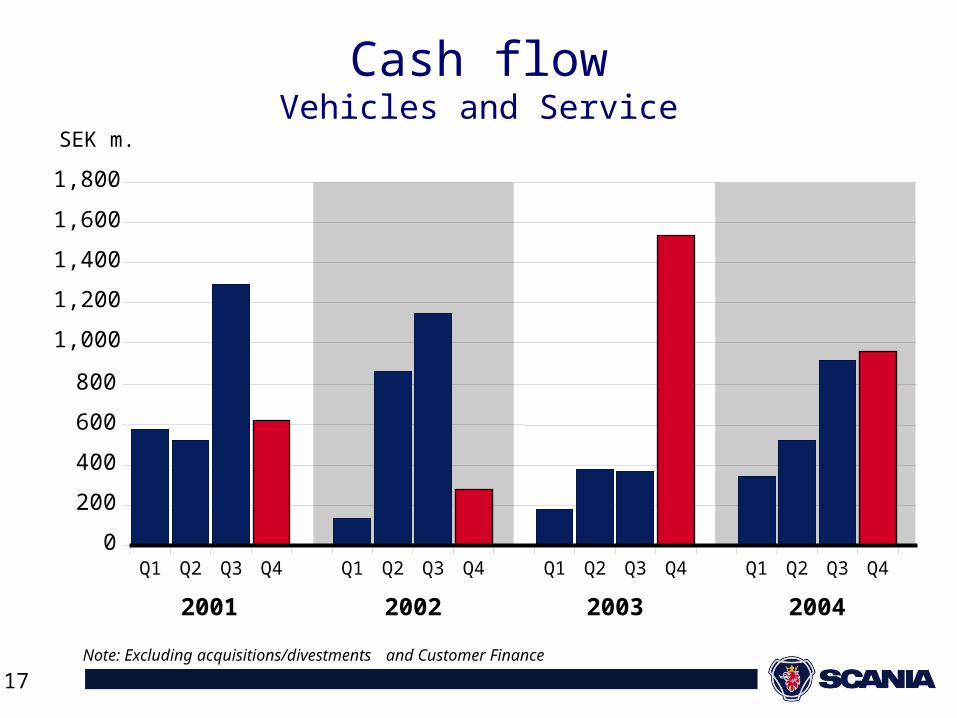
Cash flowVehicles and Service
2001 2002 2003 2004
SEK m.
Note: Excluding acquisitions/divestments and Customer Finance
0
200
400
600
800
1,000
1,200
1,400
1,600
1,800
Q1 Q2 Q3 Q4 Q1 Q2 Q3 Q4 Q1 Q2 Q3 Q4 Q1 Q2 Q3 Q4
18
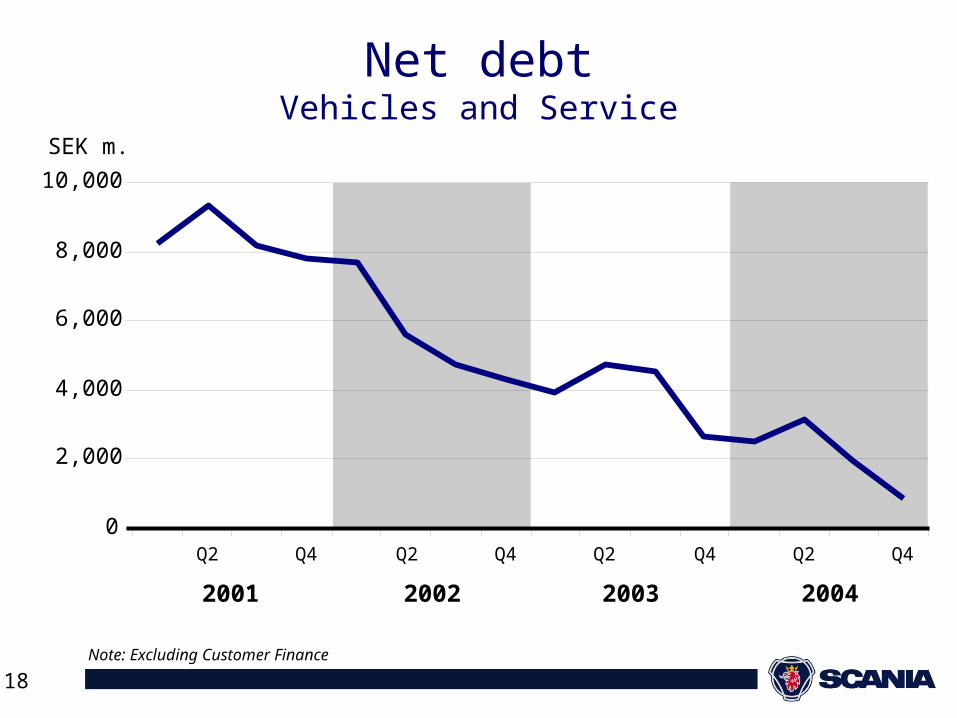
Net debtVehicles and Service
Note: Excluding Customer Finance
SEK m.
2001 2002 2003 2004
0
2,000
4,000
6,000
8,000
10,000
Q2 Q4 Q2 Q4 Q2 Q4 Q2 Q4
19
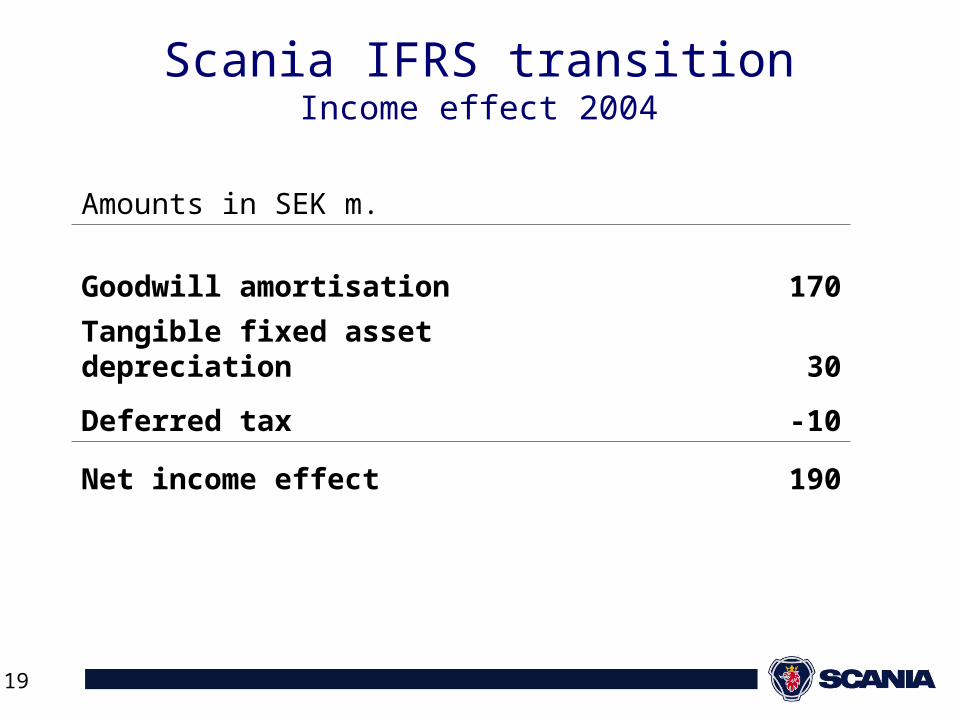
Scania IFRS transitionIncome effect 2004
Amounts in SEK m.
Goodwill amortisation 170
Tangible fixed asset depreciation 30
Deferred tax -10
Net income effect 190
20
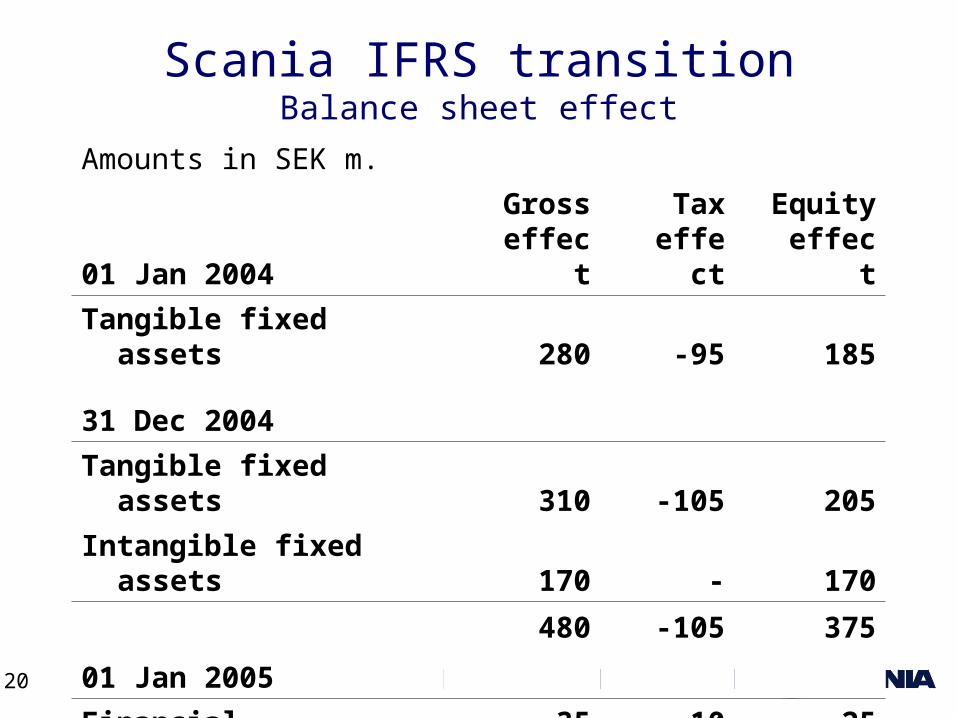
Scania IFRS transitionBalance sheet effect
Amounts in SEK m.
01 Jan 2004Gross effect
Tax effect
Equity effect
Tangible fixed assets 280 -95 185
31 Dec 2004
Tangible fixed assets 310 -105 205
Intangible fixed assets 170 - 170
480 -105 375
01 Jan 2005
Financial instruments 35 -10 25
21
Conclusions
Scania had a successful year in 2004
Truck deliveries were high
Sales of buses as well as industrial and marine engines reached record levels
Service revenues showed continued good growth
Customer finance showed good development
Changeover without disruptions
22