1. - usaid|nigeria expanded trade and transport (nextt) · pdf file · 2017-09-075...
TRANSCRIPT
2
1. INTRODUCTION
1.1 The objectives of the study are as follows:- (a) To prepare a Turnkey Model business plan / Feasibility Study for Cassava Processing to Starch
(Food & Industry Grade).
(b) To enable NEXTT partner with value chain associations and technical teams to produce high level business plans that could enable best practices and attract investors.
(c) To spur investments to improve economic environment of Nigeria and ensure sustainability of
investments. (d) To align with and ensure achievement of objectives of NEXTT.
1.2 On the basis of the foregoing, Agroec Consultants would prepare a Turnkey Feasibility Report
/Business Plan for USAID. Special attention was given to:-
i. The market potential for Starch (Industry and Food Grade) ii. Profitability or otherwise of operations
iii. Technical operations iv. Organization and personnel requirements.
The subsequent pages of this report contains the observations, findings and recommendations of the Consultants.
2. OVERALL ECONOMIC & INDUSTRY SURVEY
2.1 Overall Economic Environment 2.1.1 Nigeria became independent in 1960 and from then the political and economical leadership and
management of the country was transferred to Nigerians.
Since independence, the country has had 15 Governments, 4 Development Plans and several other rolling Plans (the first 1962 – 1968 to the fourth 1975 – 1981 which are all geared towards bringing about a general improvement in the living standard of the population. Despite various
government policies and well articulated development and rolling plans, Nigerians are yet to experience any appreciable improvement in their living condition. while billions of Naira have been budgeted and spent over various Development Plans, the country is yet to find answers to
its basic social and economic problems, which include amongst others:-
A dilapidated and scanty infrastructure; An agricultural system that can neither feed the growing population nor supply the essential
inputs to her industries;
An exogenous demand profile that far outstrips our production capacity;
Declining industrial output and productivity; Massive unemployment and under – employment;
Soaring prices and inflation; A dysfunctional bureaucracy which is allegedly corrupt and inept and yet exercises supreme
control over the economy;
Inadequate and unreliable data for national planning;
High leadership turnover; and A high level of external dependence
2.1.2 In the early days of Nigeria’s independence, agriculture accounted for nearly 60% of Gross
Domestic Product (GDP) and 80% of export earnings (Shaib, Aliyu, Bakshi 1997). Today, agriculture accounts for a third of GDP and less than 1% of export earnings, oil and gas accounting for the rest.
A desirable outcome for the Nigerian population and current government is a strong diversified economy able to:- i. Generate employment
ii. Sustain incomes for its citizens iii. Increase the productivity of agriculture iv. Increase utilization of industrial capacity
3
v. Improve export earnings
2.1.3 The Government has just launched the Economic Recovering and Growth Plan Policy (2017). The highlight of the policy designed to achieve above are as follows:-
i. Review ban on 41 items, free forex market ii. Sell National Assets:- Selected public enterprises/assets will be privatized to optimize their
efficiency and reduce fiscal burden on the government. iii. Create 15 Million Jobs by 2020:- One major strategy is to accelerate implementation of
the National Industrial Revolution Plan (NIRP) through Special Economic Zones (SEZs). The focus will be on priority sectors to generate jobs, promote exports, boost growth and upgrade skills.
iv. Don’t Import a Drop of Petrol by 2020:- Boost local refining for self-sufficiency. Reduce petroleum product imports by 60 per cent by 2018, become a net exporter by 2020, save foreign exchange and prevent reversion to the fuel subsidy regime.
v. Hit 10,000 Megawatts by 2020 – But no selling TCN:- With regards to the power value chain, efforts will be concentrated on overcoming the current challenges which relate to governance, funding, legal, regulatory, an pricing issues across the three main power
segments of generation, transmission and distribution, and ensuring stricter contract and regulatory compliance. “The Plan also aims to increase power generation by optimizing operational capacity to improve the energy mix including through greater use of renewable
energy, encouraging small-scale projects, and building more capacity over the long term. Government will also invest in transmission infrastructure”.
vi. Raise VAT to 15% - Only on Luxury Items:- The plan is to increase the tax base by
raising the VAT rate for luxury items from 5 to 15 per cent from 2018, while improving CIT and VAT compliance to raise 350 billion annually.
vii. Raise Oil Production to 2.5MBPD
viii. Take Inflation Back to Single Digit:- The recovery plan seeks to cut inflation from 15.7 percent in 2017, and down to 9.9 percent by 2020, based on sound macro-economic policies.
ix. Achieve Tomato, Rice, Wheat Self-sufficiency:- Nigeria is projected to become a net
exporter of key agricultural products, such as rice, cashew nuts, groundnuts, cassava and vegetable oil. The government also plan to “open up a minimum of 100,000 hectares of irrigable land through the 12 River Basin Development Authorities by 2020”, and “expand the
use of dams for commercial farming and aquaculture”. x. Provide Two Million Houses by 2020:- Improve access to finance for the construction
industry, e.g. by fast-tracking implementation of the proposed Family Homes Fund, to build
2 million housing units by 2020. “Reposition of the Federal Mortgage Bank of Nigeria by recapitalizing it from N2.5 billion to N5000 billion to meet the housing needs across Nigeria.
The Cassava value chain represents a unique opportunity for the diversification of the Economy
for employment Generation and value added activities.
3. BACKGROUND INFORMATION Cassava – Farm Production, Processing Trends (Global & Nigeria), Opportunities and
Economic Potentials
3.1 Production – Commodity Context
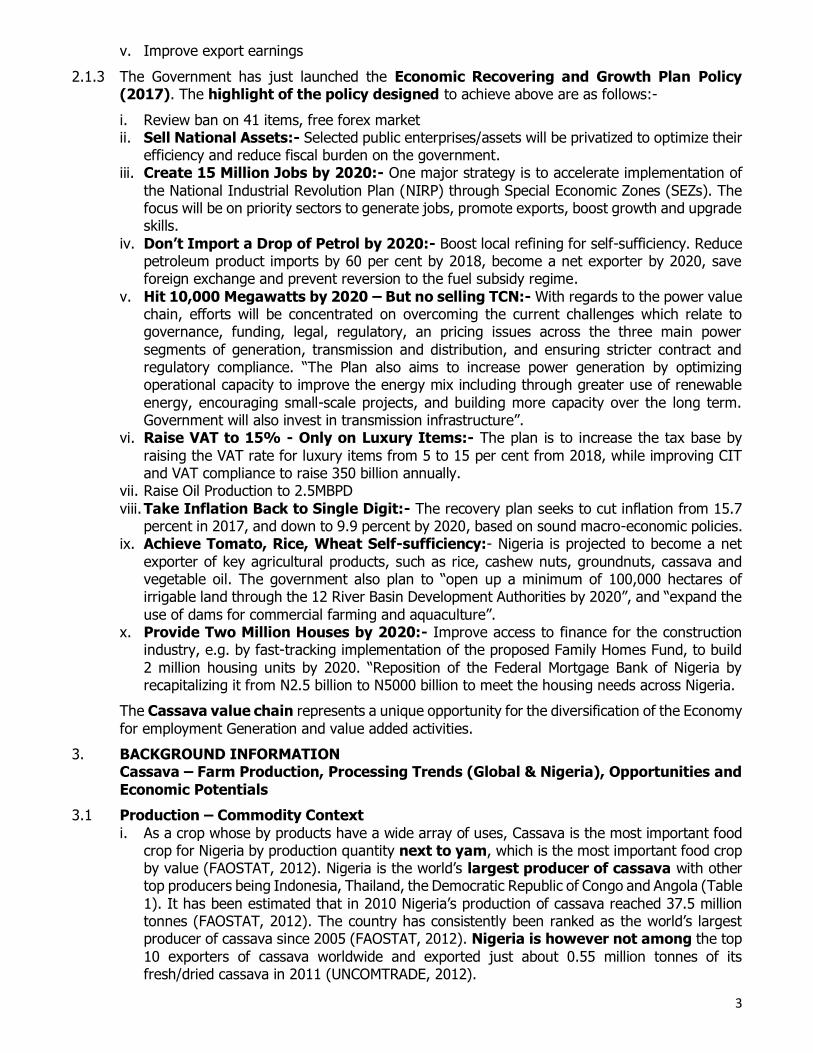
i. As a crop whose by products have a wide array of uses, Cassava is the most important food crop for Nigeria by production quantity next to yam, which is the most important food crop by value (FAOSTAT, 2012). Nigeria is the world’s largest producer of cassava with other top producers being Indonesia, Thailand, the Democratic Republic of Congo and Angola (Table
1). It has been estimated that in 2010 Nigeria’s production of cassava reached 37.5 million tonnes (FAOSTAT, 2012). The country has consistently been ranked as the world’s largest producer of cassava since 2005 (FAOSTAT, 2012). Nigeria is however not among the top
10 exporters of cassava worldwide and exported just about 0.55 million tonnes of its fresh/dried cassava in 2011 (UNCOMTRADE, 2012).
4
Source: FAOSTAT 2012 Table I – Top ten cassava producing countries in 2010 (USD, tonne)
Cassava is also seen to have a high poverty-reduction potential for Nigeria due to its
low production cost (Nweke 2004, FAO 2005). Egesi et al (2006), argue that cassava has been transformed from a reserve commodity for support in times of famine into a rural staple, and subsequently a cash crop. A prior study conducted by Nweke et al (1997) shows that
cassava accounts for 21 percent of the income of cassava producing households.
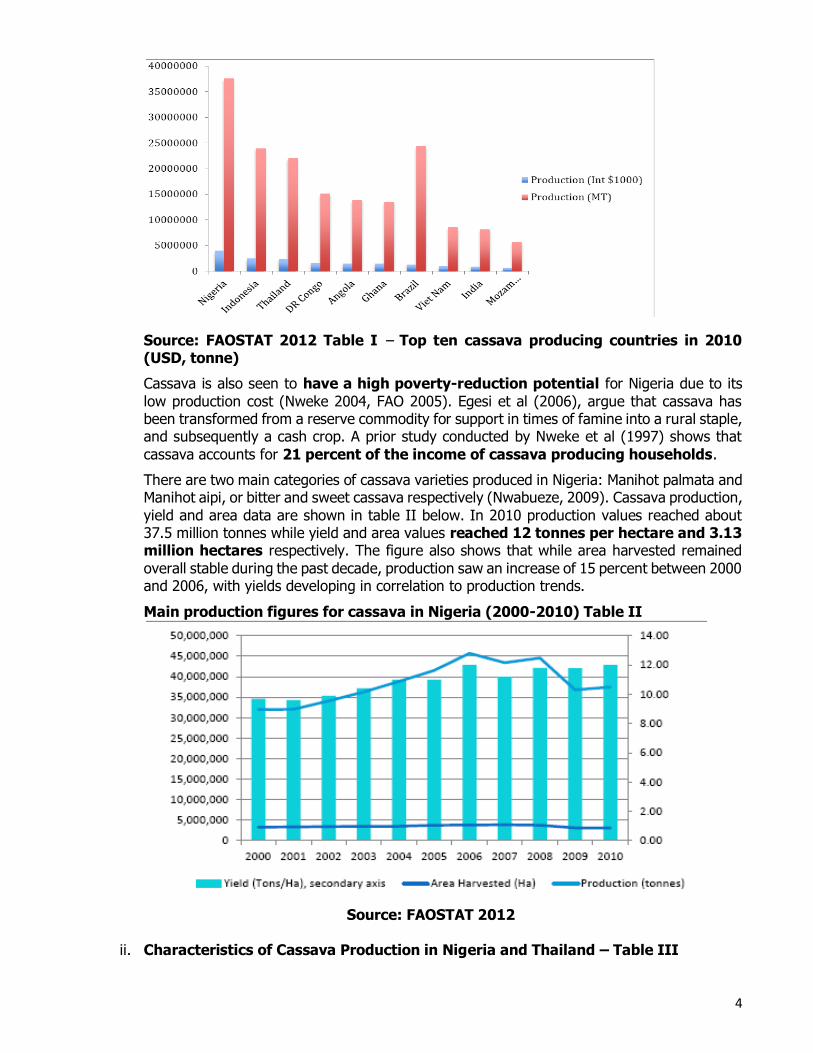
There are two main categories of cassava varieties produced in Nigeria: Manihot palmata and Manihot aipi, or bitter and sweet cassava respectively (Nwabueze, 2009). Cassava production,
yield and area data are shown in table II below. In 2010 production values reached about 37.5 million tonnes while yield and area values reached 12 tonnes per hectare and 3.13 million hectares respectively. The figure also shows that while area harvested remained
overall stable during the past decade, production saw an increase of 15 percent between 2000 and 2006, with yields developing in correlation to production trends.
Main production figures for cassava in Nigeria (2000-2010) Table II
Source: FAOSTAT 2012
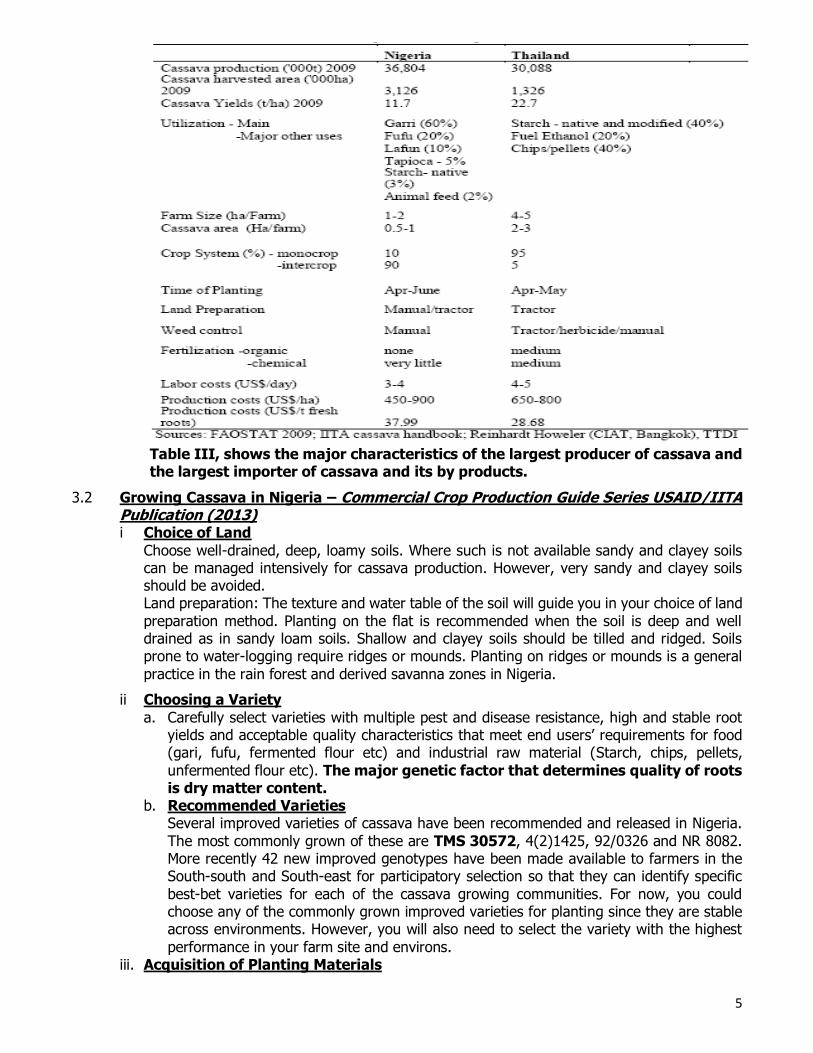
ii. Characteristics of Cassava Production in Nigeria and Thailand – Table III
5
Table III, shows the major characteristics of the largest producer of cassava and the largest importer of cassava and its by products.
3.2 Growing Cassava in Nigeria – Commercial Crop Production Guide Series USAID/IITA Publication (2013) i Choice of Land
Choose well-drained, deep, loamy soils. Where such is not available sandy and clayey soils can be managed intensively for cassava production. However, very sandy and clayey soils should be avoided. Land preparation: The texture and water table of the soil will guide you in your choice of land
preparation method. Planting on the flat is recommended when the soil is deep and well drained as in sandy loam soils. Shallow and clayey soils should be tilled and ridged. Soils prone to water-logging require ridges or mounds. Planting on ridges or mounds is a general
practice in the rain forest and derived savanna zones in Nigeria.
ii Choosing a Variety
a. Carefully select varieties with multiple pest and disease resistance, high and stable root yields and acceptable quality characteristics that meet end users’ requirements for food (gari, fufu, fermented flour etc) and industrial raw material (Starch, chips, pellets,
unfermented flour etc). The major genetic factor that determines quality of roots is dry matter content.
b. Recommended Varieties Several improved varieties of cassava have been recommended and released in Nigeria.
The most commonly grown of these are TMS 30572, 4(2)1425, 92/0326 and NR 8082. More recently 42 new improved genotypes have been made available to farmers in the South-south and South-east for participatory selection so that they can identify specific
best-bet varieties for each of the cassava growing communities. For now, you could choose any of the commonly grown improved varieties for planting since they are stable across environments. However, you will also need to select the variety with the highest
performance in your farm site and environs. iii. Acquisition of Planting Materials
6
Stems of improved varieties can be obtained from National Seed Service (NSS), state offices
of Agricultural Development Programs (ADP), the Cassava Growers Association (CGA) and several out-growers who produce quality stems for sale. Stems are usually tied in bundles each having 50 stems that are 1metre long. Fifty of such bundles are needed to plant 1
hectare of land.
Keep bundles of stems stacked vertically on the soil under a shade. The distal end of the stem should touch the soil. Moisten the soil regularly and keep the
surrounding weed free. This way you can store your stems for more than 3 months. Under low relative humidity and heat stress store your stems in pits under shade.
(a) Stem Quality
Cassava stakes (cuttings) for planting should be taken from plants 8 – 18 months old. Stakes taken from older plants are lignified and they perform poorly due to delayed sprouting and rooting. A mature cassava stem has 3 sections – hardwood, semi-hardwood
and shoot-tip. The hard and semi-hardwood sections are the best for planting. Shoot tips are very fragile and have high mortality rate especially if they are subjected to moisture stress during the first month after planting. If you must source planting materials from an
old field (over 18 months) the semi-hardwood section gives the best quality.
Use sharp tools preferably a secateurs or cutlass to cut stems into stakes for planting. Avoid bruising the stems. Smooth cuts enhance root yields through rapid and uniform root
development from the cut surface. The recommended length of stakes is 20-25 cm with 5 or more nodes. Mini-stakes (10cm) are required for multiplication while micro-stakes (3-5 cm) are used for rapid multiplication.
(b) Handling of Stakes Stakes should be planted soon after they are cut otherwise they get dehydrated and perform poorly. If stakes must be stored for a few days (3-5 days) before planting put
them into transparent polyethylene bags. You can also gather the stakes together under shade and cover with a plastic bag. The high relative humidity and temperature within the bag usually induce rapid sprouting and rooting of stakes. Plant vigour, survival rate and
yields are better if stakes are pre-sprouted before planting.
iv. Plant Population
The optimum plant population for high root yield is 10,000 plants per hectare obtainable when plants are spaced at 1 x 1 m. This population is seldom achieved at harvest due to losses caused by genetic and environmental factors. In other to harvest a plant population near the optimum an initial plant population/ha of 12300 at 0.9 x 0.9m is recommended. Plant spacing
and population will vary depending on if cassava is planted sole or in association with other crops.
Cassava is compatible with many crops when intercropped. The best intercrops of cassava in Nigeria include maize, melon, groundnut, cowpea and vegetables. Other less important intercrops particularly in the South-south and Southeastern Nigeria include yam,
cocoyam, sweet potato, plantain and banana. Non or high branching varieties of cassava are best for intercropping. Profuse and low branching varieties will shade light off the intercrops. In medium and large-scale farms maize is the best intercrop.
a. Weed Control This is one of the major limiting factors to production accounting for more than 25% of the total cost and time of production. Integrated weed control (cultural, mechanical and
chemical) is recommended. The ideal combination will depend on the agro ecology, weed spectrum and level of infestation, soil type and cropping system.
Cassava should be planted early before weeds emerge after land preparation. Adopt
improved fallow practices using live mulch to suppress weeds. Under monocropping, plant varieties with potentials for early canopy closure to reduce weed infestation. Such varieties
7
should be vigorous and resistant to major pests and diseases in addition to having multiple
branching at a medium height. b. Mechanical
Do double or triple harrowing before planting. Weed with hoes or adapted cutlasses 3 or
more times depending on agro ecology and type of weed. More weeding times are required in the forest than in the savanna. Weeds with stolon, rhizome, tubers or deep taproot require more frequent weeding. On a large scale you will require tractor-operated
weeders. c. Chemical
Several pre and post emergence herbicides exist but only few of them are available in Nigeria for controlling weeds in a cassava farm. In the forest zone, apply pre-emergence
herbicides like premextra or dual while in the savanna zone you can apply primextra, dual or cotoran multi immediately after planting to keep your farm weed free for periods ranging from 4-8 weeks. Apply post-emergence herbicides (paraquat or
gramozone) as soon as weeds begin to emerge after the pre-emergence herbicide treatment. They are basically non-selective, localized contact herbicides and should be sprayed with a guard to ensure that only the weeds receive the chemical. If
your field is infested with difficult-to-control weeds like Spear grass (Imperata cylindrica) carefully apply systemic herbicides like Glyphosate, Fusilade or Sarosate. Weather conditions affect herbicide performance. Do not apply herbicides soon after a heavy
rainfall or when it is likely to rain to avoid diluting the chemical and reducing its effectiveness. For best results gramozone should be sprayed only when you are sure of having at least 3 hours of sunshine after spraying. For cost effectiveness and results use
skilled staff for chemical weeds control. Organic herbicides are available. These include Weed Pharm (20% acetic acid), C-Cide (5% citric acid), GreenMatch (55% d-limonene), Matratec (50% clove oil), WeedZap (45% clove oil + 45%
cinnamon oil) and GreenMatch EX (50% lemongrass oil).
v. Fertilizer rate and time of application Ideally, fertilizer recommendations should be based on soil analysis but when this is not
done then use the land history and vegetation as a guide. Lands naturally inundated with Chromolaena odorata (Akintola taku) as weed can support a good cassava crop without fertilizer while the presence of Spear grass or poorly established
vegetation is a signal for fertilization. Under continuous cultivation in the forest zone apply a first dose of 200kg (4 bags) of N: P: K 15:15:15 per hectare or a full small matchbox per plant at 4-6 weeks after planting (June-July). A second dose of 100kg of muriate of potash or a half-
full small matchbox per plant at 14-16 weeks after planting (September) should also be applied. In the savanna zone, apply 200kg (4 bags) of N: P: K 15:15:15 per hectare or a full small matchbox per plant at 4-6 weeks after planting and a second dose of 50kg of muriate of potash
per hectare. Apply fertilizer in holes 5 cm deep and 10 cm radius from the plant. Do not apply fertilizer if the soil is dry.
3.3 Trends – Global and Nigeria
3.3.1 Cassava is one of the world’s most important food crops, with annual global production at approximately 276 million metric tons (MT) in 2013. The Top producing countries globally in 2013 were: Nigeria (accounting for ~19% of the total), Thailand (~11%), Indonesia (~9%), Brazil
(~8%) and Democratic Republic of Congo (~6%).
Global demand for the commodity has been growing significantly between 2004 and
2013 because of its appeal as a food security crop for growing populations in emerging markets, and the growing demand for industrially processed cassava products. Africa accounts for less than 1% of total exports and the cassava production space is dominated by smallholder farmers (25% women). The root crop is a source of livelihood for at least 300 million
people. Virtually all cassava (90%) produced in Africa is used as a staple food for human
8
consumption, providing calories for ~500 million people and constituting ~37% of the
population’s dietary energy requirements.
However, in several African countries, cassava is perceived, not only as a food security crop, but also as a raw material for various types of industries. In some countries, there
are concerted efforts being initiated, sometimes with strong political support at the highest level to make cassava an engine of economic growth. The Global Cassava Development Strategy study commissioned by IFAD and FAO and the Vision 2020 study on Root and Tuber crops stressed the
great potential of cassava to spur rural industrial development, raise rural incomes, and contribute to food security.
3.3.2 The New Partnership for African Development (NEPAD) has also recognized Cassava as a
powerful poverty fighter in Africa and recommended a Pan-African Cassava Initiative based on a transformation strategy which emphasizes better markets, better organization of producers for collective action, and better participation by the private sector.
3.3.3 However, for cassava to be a contributor to development, the demand must grow more rapidly. This can only be made possible by the introduction and promotion of new uses for cassava.
Despite widespread subsistence cultivation of cassava, especially in Africa, the crop’s derivatives have enormous potential for use in industrial processing.
In terms of national policy objectives for the Cassava sector, both the National Investment Plan
(NAIP) and the Presidential Agricultural Transformation Agenda (ATA) include cassava within their main focus crops. The NAIP (2011-2014), provides for increased input supply and distribution, by monitoring the quality standard of fertilizers in the country. The use of organic fertilizers is
encouraged as a complement to inorganic fertilizers.
The NAIP also promotes the export of cassava products by adopting measures including the US African Growth and Opportunity Act (AGOA) and the adoption of appropriate Sanitary and
Phytosanitary Standards, in compliance with the Technical Barriers to Trade agreements of the World Trade Organization.
The country’s Presidential Agricultural Transformation Agenda (2011-15), intends to create 3.5 million jobs along key agricultural product value chains. Furthermore, the Agenda provides for improved mechanisms for the supply of quality inputs, such as subsidized fertilizers and seeds to farmers, as well as guaranteed farm-gate minimum prices for many crops. The Presidential
council, which is in charge of implementing the Agenda, also intends to increase Cassava production up to 50 million tonnes by 2015, while supporting its export.
3.3.4 Lessons can be drawn from success stories of agricultural transformation in other countries such as Thailand and Vietnam. The Federal Government of Nigeria launched the Agricultural Transformation Agenda (ATA) in 2012, as a private sector-driven, agri-business
based, development of commodity value chains to create wealth, attain industrialization and sustain livelihood. This program which was built on commodity value chains drove Nigeria’s cassava production to 54 million tons in 2015. Based on the impressive
food production, Nigeria met the Millennium Development Goal of halving the number of hungry people (MDG 1 - poverty reduction) in 2013, two years ahead of 2015 target.
3.4. Opportunities (By Products)
3.4.1 The huge and untapped market opportunities of cassava in Africa can be effectively exploited for transforming Africa’s agriculture. The challenge today is to increase productivity, marketing opportunities and profitability through effective and efficient cassava value chain development.
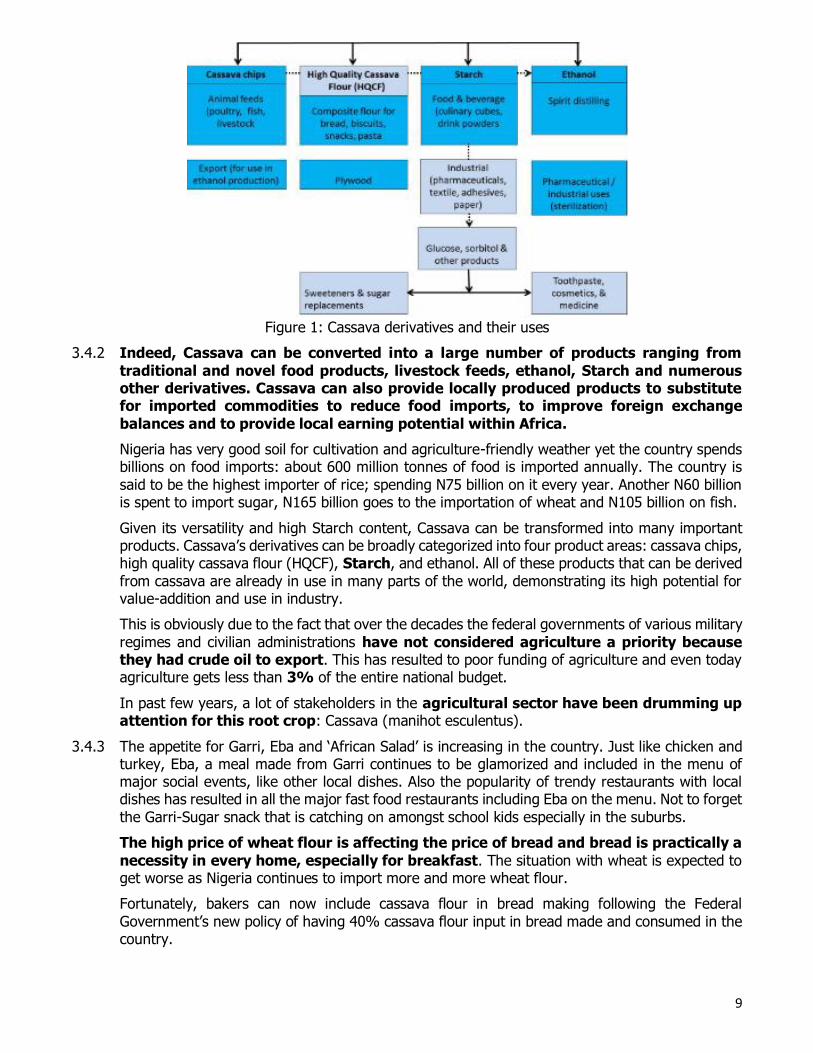
Cassava has diverse end-uses (Figure 1) despite its widespread subsistence cultivation in Africa for mainly food. Given its versatility and high Starch content, it can be transformed into many important products/derivatives (cassava chips, high quality cassava flour (HQCF), Starch, and
ethanol).
9
Figure 1: Cassava derivatives and their uses
3.4.2 Indeed, Cassava can be converted into a large number of products ranging from
traditional and novel food products, livestock feeds, ethanol, Starch and numerous other derivatives. Cassava can also provide locally produced products to substitute for imported commodities to reduce food imports, to improve foreign exchange
balances and to provide local earning potential within Africa.
Nigeria has very good soil for cultivation and agriculture-friendly weather yet the country spends billions on food imports: about 600 million tonnes of food is imported annually. The country is
said to be the highest importer of rice; spending N75 billion on it every year. Another N60 billion is spent to import sugar, N165 billion goes to the importation of wheat and N105 billion on fish.
Given its versatility and high Starch content, Cassava can be transformed into many important products. Cassava’s derivatives can be broadly categorized into four product areas: cassava chips, high quality cassava flour (HQCF), Starch, and ethanol. All of these products that can be derived
from cassava are already in use in many parts of the world, demonstrating its high potential for value-addition and use in industry.
This is obviously due to the fact that over the decades the federal governments of various military
regimes and civilian administrations have not considered agriculture a priority because they had crude oil to export. This has resulted to poor funding of agriculture and even today agriculture gets less than 3% of the entire national budget.
In past few years, a lot of stakeholders in the agricultural sector have been drumming up attention for this root crop: Cassava (manihot esculentus).
3.4.3 The appetite for Garri, Eba and ‘African Salad’ is increasing in the country. Just like chicken and turkey, Eba, a meal made from Garri continues to be glamorized and included in the menu of major social events, like other local dishes. Also the popularity of trendy restaurants with local dishes has resulted in all the major fast food restaurants including Eba on the menu. Not to forget
the Garri-Sugar snack that is catching on amongst school kids especially in the suburbs.
The high price of wheat flour is affecting the price of bread and bread is practically a
necessity in every home, especially for breakfast. The situation with wheat is expected to get worse as Nigeria continues to import more and more wheat flour.
Fortunately, bakers can now include cassava flour in bread making following the Federal
Government’s new policy of having 40% cassava flour input in bread made and consumed in the country.
10
The new policy, expected to come into operation on July 1, 2012, proposes that bread made in
the country will comprise 60% wheat and 40% processed cassava flour. Brazil is usually cited as the country where cassava content in bread is highest at 30%.
In the meantime, while stakeholders in the bakery and confectionery sector have expressed
doubts as regards the success of the policy because of the plethora of logistic and operational challenges that are yet to be solved, some say 100% cassava bread stands a chance of becoming a delicacy someday, just like corn bread. Also some noodle makers are quietly using cassava to
supplement wheat flour that is more expensive. The chances are that bread consumers may not even know their bakeries have switched to cassava flour. But there is more to Cassava than all of this.
Over 800 million people worldwide depend on cassava for food. The consumption in West Africa is more than 120kg per annum/per capita while that of Central Africa Republic is more than 300kg per annum/per capita.
3.5 Challenges, Risks and Contribution to addressing challenges 3.5.1 The major challenges to the development of the cassava subsector in Africa include the following:-
(i) Low yields: The yields of African cassava producers are 37 - 64% below the global value. In 2013, Nigeria reached 14.1 tons/ha, similar to Brazil but ~37% less than Indonesia (22.5 tons/ha) and Thailand (21.8 tons/ha) (FAOSTATS accessed 2015). The yields of the other top African producers are also low. Cameroon’s cassava yield in 2013 was at 14.7 MT/Ha, while
Angola achieved yields similar to those of Nigeria at 14.1 tons/ha. DRC’s 2013 yield was 8.0 tons/ha, less than 60% of Nigeria’s yield. Yields are low by global standards, mainly due to the prevalence of traditional subsistence farming techniques with little or no use of inputs.
(ii) Variety improvement: Improved crop varieties remain the engine of agriculture. Successful value-added chains of cassava in Thailand and Brazil take advantage of the increased productivity, and profits for actors along the chain, that improved varieties of
cassava brings. Under the cassava transformation emphasis will be placed on the development of new varieties that respond well to inputs, the use of biotechnology approaches to accelerate breeding, expanding the genetic base with novel traits, and capacity
building of a new generation of cassava breeders. (iii) Identification of cassava varieties that respond to increased use of inputs
especially fertilizer: Cassava breeding in Nigeria test materials across agro-ecologies under
zero input conditions typical of how farmers have always grown cassava. But the emphasis is now to grow cassava under best production practices; there is a need to improve cassava for these conditions. In the first instance, 60 advanced breeding lines in the IITA and NRCRI
breeding programs will be tested across the cassava belt of Nigeria under optimum production conditions. This activity is expected to result in the identification of genetically improved cultivars that respond to fertilizer best suited in each agro-ecological zone. In addition, an
emphasis will be placed traits important to the value-added chains, especially high Starch yields.
To ensure quick adoption by farmers and processors, lines already at an advanced stage in
the breeding pipeline will be evaluated for performance and quality traits in collaboration with farmers and processors involved in the five value-added chains to determine those that best meet commercial quality requirements. It is important that farmers include seed producers
in the respective SCPZ clusters. They can contribute to quick dissemination of new selected materials.
(iv) Fragmented, Smaller-Holder Farms: In Africa, cassava production is carried out in
predominantly smaller-holder and fragmented farms with rudimentary technologies, low use of inputs limited economy of scale. Six million small-scale farmers account for 90% of the production in Nigeria.
(v) Limited Adoption of Improved Seeds: Small-scale farmers rarely use improved planting materials (clean, healthy seeds), and the sub-sector is dominated by disease-prone local
11
varieties with long maturation periods and low yield potential. IITA and African NARS (National
Agricultural Research System) have played leading roles in the development of improved cassava varieties that are multiple disease and pest resistant, early maturing, and high yielding. These varieties have the potential to raise productivity by up to 30-40 tons/ha.
Thirty-two African countries have released an estimated 384 high yielding varieties between 1970 and 2014. These varieties are high yielding with good levels of multiple disease and pest resistance as well as of acceptable quality for food, feed and industrial uses in Africa. While
the combination of these new varieties and better agronomic practices could increase yields per unit area by at least 40%, the rate of adoption by smallholder farmers has been low.
The dissemination of these varieties has often suffered from the lack of a reliable planting
material distribution system from National Agricultural Research Systems (NARS) because of weak extension systems, insufficient quantities of planting material, and delays in distributing the approved planting materials.
This compels farmers to continue to grow local, low yielding, varieties. This is exacerbated by inadequate location specific knowledge on fertilizer use, and other cultural practices such as
weed and pest and disease management for cassava systems and late planting specifically in southern Africa region where maize comes first. Private companies are also not involved in distribution because cassava is propagated vegetatively, and it takes one year to produce cassava stems material compared to three to five months for grain seeds.
(vi) Low use of Herbicides: Low use of herbicides and pesticides presents another obstacle. In the case of south-eastern Nigeria, only 3% of farmers use herbicides because they do not
know about them, lack the technical skills to use them, are not able to afford them or are under pressure from local NGOs to avoid them. When they do use them, most use insufficient amounts of herbicides to save cost. Instead increasing herbicide use would reduce the need
for weeding and free up labor for other activities.
(vii) Limited use of Fertilizers and Irrigation: Fertilizers are used infrequently, and even when used, the amounts are below the recommended levels because of the high cost. Use
of irrigation techniques is also a constraint in almost all cassava farms in Africa as the system of cultivation is predominantly rain-fed.
(viii) High labor use: Cassava farming is highly labor-intensive and related costs can account
for up to 90% of total production costs. For example, the cost of developing and preparing land is quite high. In Oyo and Benue states of Nigeria, 98% of the average cassava production cost of USD 700 per hectare is labor (ridging, planting, weeding, etc.) and 2%
is inputs (fertilizers, seeds).
(ix) Low use of mechanization: A low level of mechanization characterizes small-scale
cultivation. For example, tractors are used in just 10% of Nigeria’s cassava cultivation. Harvesting is done manually and is therefore time-consuming and expensive. In both small-scale and commercial farming, 8-12% of cassava roots are lost due to sub-
optimal harvesting methods. A survey conducted by the African Agricultural Technology Foundation (AATF) during the 2004 Triennial Symposium of the International Society for Tropical Root Crops – Africa Branch revealed a consensus among African cassava experts that the most important intervention to increase the competitiveness of the cassava industry
was the adoption of mechanization in cassava production. Such mechanization will enable a reduction of labor costs, thus bringing down the cost of cassava as a raw material and stimulating reliance on local cassava as a competitive raw material for various industries.
(x) High Prices of Cassava Roots: Cassava prices vary greatly from country to country as there is no global commodity market and production costs differ vastly due to varying levels
of input use. For example, in 2012, the average price for cassava was USD 161/ton in Nigeria (10% mechanized), and USD 67/ton in Thailand (highly mechanized).
12
Cassava derived products must be price-competitive with their substitute products like corn
Starch and ethanol made from other sources.
(xi) Limited access to finance: Both commercial and smallholder farmers have limited access to finance. In Nigeria the agricultural sector accounts for 42% of GDP but has 2% of all
formal credit flows. Reasons for this include:- - Conditions to access a bank loan are stringent; - Interest rates are high (17-25%);
- And commercial banks do not offer conducive payment terms for agro- based activities (e.g., fixed repayment periods that may not match annual cropping, especially when loan release is not coordinated with growing cycles). As a result, commercial farmers
may produce lower volumes.
(xii) Trade and Transport: Smallholder cassava producers have weak and limited access to markets. The high transportation costs and the need to process cassava within 48 hours of
harvesting because of its perish ability, makes small producers to sell most of their product at local markets. The high fragmentation (scattered farms) and poor infrastructure make it difficult to develop commercial-scale aggregation. Poor roads and inadequate storage
facilities drive up prices and increase postharvest losses.
(xiii) Weak Access to Markets: Agricultural markets world-wide are characterized by market structures, both quantitative – aggregation, storage, and processing facilities, and
qualitative – quality standards, information services, logistics for distribution of agricultural products. Many of these structures do not exist in many African countries for cassava distribution.
(xiv) 3 year Cassava Burst Cycle: Nigerian cassava farmers produce for an inelastic food market. This leads to wide swings of prices every other harvest, in the absence of a
minimum price guarantee schemes by government. For example, the price of a ton of cassava in 2007 was N5,000-N6,000 in central Nigeria due to overproduction, partly in response to an appeal to farmers by the last Presidential cassava initiative to increase
cassava production for new markets of high quality cassava flour, Starch, and chips, markets that were only partly achieved. Because of the depressed prices, many farmers switched to other crops and production output fell. By March and August 2009 cassava sold at farm
gate in most of central Nigeria for N12,000 – N15,000 per metric ton; given the good prices many farmers went back to cassava production, leading to an overproduction. In 2011 cassava roots are selling for between N5,000 – N8,000 a ton; and N16,000 in 2016: essentially completing the burst-boom cycle of cassava that occurs every three years;
cassava in Nigeria is a 15-18 months harvest and two crop cycles is 3 years.
3.5.2 Contributions Towards Addressing the Challenges:-
i. IITA has pioneered since the 1970s and will continue to propel the Cassava research improvement in Africa to increase and sustain cassava production and utilization in sub-Saharan Africa. The Institute, working with national partners, has been actively involved in
the development of Value chains of the cassava subsector in Africa since the 2000s.
Examples include the Rural Sector Enhancement Program, Pre-emptive management of Cassava Mosaic disease in Nigeria, and the Cassava Transformation Agenda all in Nigeria.
Under the Nigeria Cassava Presidential Initiative on Cassava (1999 – 2007), IITA research efforts increased cassava production by 10 million tons, making Nigeria global top producer. Similar efforts in Cameroon also helped the country to double cassava production. Other
projects such as the Support for Agricultural Research for Development of Strategic Crops which is funded by the Africa Development Bank, and the Cassava Enterprise Development Project are also driving the production and productivity of Cassava. In 2004, the New
Partnership for Africa’s Development (NEPAD) launched the NEPAD Pan African Cassava Initiative (NPACI) as a means to tap on the enormous potential of cassava in Africa for food security and income generation.
13
The project made significant contributions towards cassava production, commercialization and
social marketing in Southern Africa with specific emphasis in Malawi, Zimbabwe and Mozambique. These efforts have contributed to food security and incomes in those countries. Other projects such as Great Lakes Cassava Initiative and Cassava Weed Management Project
are also having an impact.
ii. What should be done in the short-term, medium term: To address the challenges currently constraining the full realization of cassava subsector for the agricultural
transformation of African economies, there are number of recommendations that stakeholders across the cassava value chain should act upon:- Develop a market-oriented strategy with emphasis on value-addition and productivity
enhancement along the whole value-chain. Launch a roadmap for the cassava sub-sector reform setting out clear implementation
plans focusing on the integration of food production, storage, food processing and
industrial manufacturing by value chains (‘farm to fork’) where countries have comparative advantages to resolve the challenges of the subsector, and setting the path for its improvement in the short (1-5 years) and medium (5-10 years) terms. This should be a
deliberate, strategic, sustained set of actions for a private-sector-led agricultural transformation as there are no “quick fixes” for sustained economic growth and poverty alleviation (Short term).
Deploy integrated pest/pathogen management (IPM) programs backed with clean seed production, and effective surveillance to prevent geographic expansion of cassava brown streak disease (CBSD) and also to control endemic diseases like cassava mosaic and
cassava bacterial blight, and control emerging insect pests on cassava, such as spiralling whitefly and papaya mealy bug (short to medium term).
Change mindset of small and medium farmers to treat agriculture as a business and create
incentives and efficient input delivery systems including private-sector enabled Agricultural Equipment and Mechanization: Leasing Services to make cassava production financially attractive to end-users (Short term).
Increase awareness of potential to produce and use cassava substitutes through targeted and frequent advocacy efforts for cassava value chains (short term).
Develop infrastructure to reduce the costs of aggregation and transport that currently
make many locally made products non-competitive (Medium term). Continue funding R & D on: (i) using advance breeding technologies to rapidly produce
varieties more suited for production and processing, and pilot efforts to demonstrate
feasibility of substituting cassava products for imported goods; (ii) climate-smart agriculture that promote sustainable agricultural management systems, and (iii) Research and development that enhance efficiency of production along the value chain as well as strengthening of the national agricultural systems. (Short to medium term).
Build strong farmer groups and linkages with appropriate financing that level the playing field so that they are able to effectively access inputs and markets and receive fairer product and input prices, and promote backward integration into commercial farming to
buttress supply (short term). Provide access to expertise and know-how through Technical Assistance to increase
productivity and competitiveness of the commercial cassava farming sector (Short to
medium term). Create output markets links for farmers, primary and secondary processors, aggregators,
farmer cooperatives, small and large traders by improving regional and global market links
for increased value chain efficiency and to access to regional and global agricultural trade (short to medium term).
Facilitate public-private partnerships (PPPs) to encourage cross-sector collaboration and
knowledge sharing especially in research and development, and initiatives along the
14
agricultural value chain to develop infrastructure and/or build stronger farmer linkages,
e.g. Agricultural Enterprise Processing Zones (medium term). Develop new policies, institutions and financing structures to drive sector growth (Short
to medium term): Deregulation of seed and fertilizer sectors; marketing reforms to
structure markets; innovative financing for agriculture for farmers inputs and credit guarantees and low interest rate, long-term debt products for construction of new processing facilities; new agricultural investment framework.
Improve the legal framework in land acquisition and transfer to ensure ownership and right of use, and facilitate development of a system for making available unutilized government and communal lands for agricultural use in order to facilitate contiguous farming for farmers’ groups/organizations and industries (Short to medium term).
Develop sustainable market information, e.g. private-led; develop warehousing system (Bonded system for easy access to finance); develop bulking system for primary product, e.g. fresh tubers; and upgrading of informal markets, especially for primary commodities
(short term). Capacity building for all actors of the value chain including farmer education and
commercialization through public and private extension (short to medium term).
Create specific women and youth in cassava agribusiness programs (short term)
3.5.3 Vision for Sustainability:-
i. African cassava industrialization will create wealth, jobs and promote sector-wide efficiency and productivity growth. It will enhance and meet the demand of emerging industrial needs, traditional products and global demand by reducing production costs and increasing the output of high quality industrial products to strengthen the continent’s position in the global
context for competition.
Five major cassava value chains are proposed for industrialization based on the demand and
supply side targets for various African countries and elsewhere as estimated from the FAOSTATS database:- High Quality Cassava Flour (HQCF),
Starch, Chips, High Fructose Cassava Syrup (HFCS) and
Ethanol
These value chains offer tremendous potential to fuel the economic growth in the continent as this will create jobs for women and youth, improve food security and
generate wealth. Production should be expanded to:- Meet domestic, industrial demand and export markets through promotion of industrial
applications of key value chains (HQCF, livestock feed, Starch, ethanol, etc.);
Encourage the involvement of large scale farming as a driving force for industrialization; and encourage private sector investment and engagement. Each country can develop its industry according to its available resources and market opportunities within a globally
competitive framework.
ii. Estimated Costs – Sustainability Issues The proposal is for individual African governments of the top 20 producing countries to commit
at least US$625 million over 5 years and US$625 million for outscaling in the subsequent 5 years to fully implement the specified value chains. This can be done through PPP arrangements.
Table IV:- Estimated Costs
Value Chain Indicative funding (million US$)
2016-2020 2020-2024
High Quality Cassava Flour (HQCF)
- Personnel (10%) 10 10
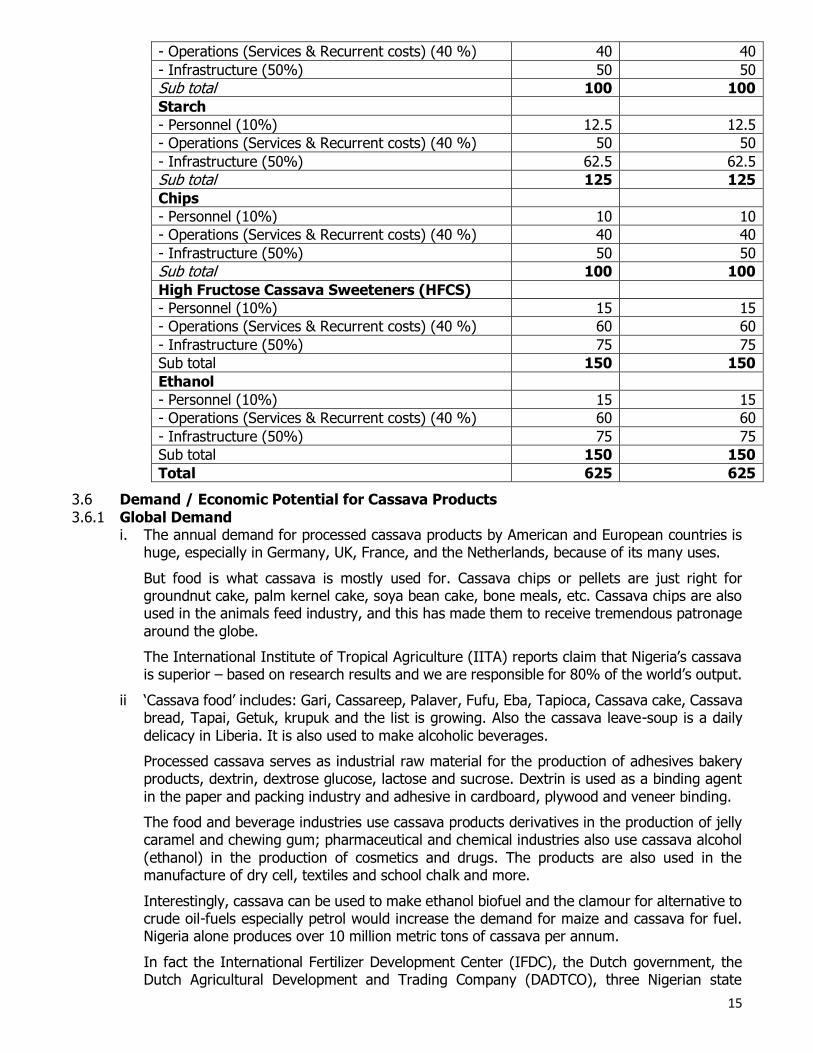
15
- Operations (Services & Recurrent costs) (40 %) 40 40
- Infrastructure (50%) 50 50
Sub total 100 100
Starch
- Personnel (10%) 12.5 12.5
- Operations (Services & Recurrent costs) (40 %) 50 50
- Infrastructure (50%) 62.5 62.5
Sub total 125 125
Chips
- Personnel (10%) 10 10
- Operations (Services & Recurrent costs) (40 %) 40 40
- Infrastructure (50%) 50 50
Sub total 100 100
High Fructose Cassava Sweeteners (HFCS)
- Personnel (10%) 15 15
- Operations (Services & Recurrent costs) (40 %) 60 60
- Infrastructure (50%) 75 75
Sub total 150 150
Ethanol
- Personnel (10%) 15 15
- Operations (Services & Recurrent costs) (40 %) 60 60
- Infrastructure (50%) 75 75
Sub total 150 150
Total 625 625
3.6 Demand / Economic Potential for Cassava Products
3.6.1 Global Demand i. The annual demand for processed cassava products by American and European countries is
huge, especially in Germany, UK, France, and the Netherlands, because of its many uses.
But food is what cassava is mostly used for. Cassava chips or pellets are just right for groundnut cake, palm kernel cake, soya bean cake, bone meals, etc. Cassava chips are also used in the animals feed industry, and this has made them to receive tremendous patronage
around the globe.
The International Institute of Tropical Agriculture (IITA) reports claim that Nigeria’s cassava is superior – based on research results and we are responsible for 80% of the world’s output.
ii ‘Cassava food’ includes: Gari, Cassareep, Palaver, Fufu, Eba, Tapioca, Cassava cake, Cassava bread, Tapai, Getuk, krupuk and the list is growing. Also the cassava leave-soup is a daily
delicacy in Liberia. It is also used to make alcoholic beverages.
Processed cassava serves as industrial raw material for the production of adhesives bakery products, dextrin, dextrose glucose, lactose and sucrose. Dextrin is used as a binding agent
in the paper and packing industry and adhesive in cardboard, plywood and veneer binding.
The food and beverage industries use cassava products derivatives in the production of jelly caramel and chewing gum; pharmaceutical and chemical industries also use cassava alcohol
(ethanol) in the production of cosmetics and drugs. The products are also used in the manufacture of dry cell, textiles and school chalk and more.
Interestingly, cassava can be used to make ethanol biofuel and the clamour for alternative to crude oil-fuels especially petrol would increase the demand for maize and cassava for fuel. Nigeria alone produces over 10 million metric tons of cassava per annum.
In fact the International Fertilizer Development Center (IFDC), the Dutch government, the Dutch Agricultural Development and Trading Company (DADTCO), three Nigerian state
16
governments: Rivers, Taraba and Osun, and a non-governmental organization,
Communicating For Change (CFC) have begun the ‘Cassava Revolution’.
iii. More companies are going into the processing of Garri. Local makers predominantly produced it back in the day. Things have changed now and farmers are very delighted to sell off
hundreds of tons of the cassava roots in one transaction to a company.
In April 2005 Nigeria began exporting cassava chips to the People's Republic of China under the Presidential Initiative on cassava. The first export was 40 metric tonnes of cassava chips
in two batches of 20 metric tonnes.
iv. HarvestPlus (2015) is at this point striving to achieve its goal of having more than 150,000
Nigerian households eating vitamin A fortified yellow cassava by the year 2014. HarvestPlus, an international agricultural organisation, is partnering with the IITA which is leading a global effort to breed and disseminate micro-nutrient-rich staple food crops to reduce hunger in
malnourished populations. This means that more of the Garri consumed in the country would be processed by cassava processing companies.
In June 2011 Roberts Ungwaga Orya, Managing Director/Chief Executive Officer of the Nigeria
Export-Import Bank said that the bank had “provided funding windows of N500 million” for the export of cassava and provided about N1.1 billion to five companies for value added processing of cassava to flour, chips and glucose syrup.
3.6.2 Regional Market There are export opportunities for Nigerian cassava products (e.g. gari) from and to countries in the West African sub-region (such as Niger and Mali). In these cases, Nigerian cassava products
will compete with cassava products from neighboring countries. (Ghana and Benin). Coastal West African (Cote d’Ivoire, Ghana, Togo, Benin) countries are both competitors and the potential markets for Nigerian products. The determining factor is the price of the raw material.
There are some indications that prices in Ghana are similar to those in Nigeria, while the prices of cassava products in the Republic of Benin are generally lower. The latter observation explains the periodic presence of Benin gari on the Lagos, Nigeria market. Gari prices fluctuate in all West
African coastal countries, and not necessarily at the same time. Recent market surveys by the West Africa Trade Network (www.wa-agritrade.net) and MISTOWA (www.mistowa.org) confirm that Nigeria cassava products do not yet enjoy a significant price advantage over those in
competing West Africa countries. Nevertheless, a cross-border trade study (Ezedinma et al, 2005d) in Northern Nigeria showed a substantial cassava export to Niger (mostly gari, but also chips), especially during the “hungry season” (February through April) when the new grain crops
in Niger are not yet harvested (see: www.cassavabiz.org).
3.6.3 Economic Potentials / Domestic Demand i. As the main food staple for urban and rural people in the south and the central States of the
country, Cassava already makes a major contribution to the Nigerian economy. Additionally,
the market for industrially processed cassava is growing - Estimates indicate the potential short-term demand for industrial cassava at about 8.8 million MT of fresh cassava annually. This domestic shortfall in demand provides Nigerian cassava farmers an increase in
demand of more than 20%. Assuming a well-managed cassava farm that yields 20 MT/hectare, this untapped domestic demand implies an increase in acreage of over 440,000 hectares.
Sector
Current Domestic Demand
Substitution
Potentials
(MT/Product)
Fresh Root
Starch 230,000 MT 50 % 115,000 MT 1,150,000 MT
Flour 330,000 MT 10 % 330,000 MT 1,320,000 MT
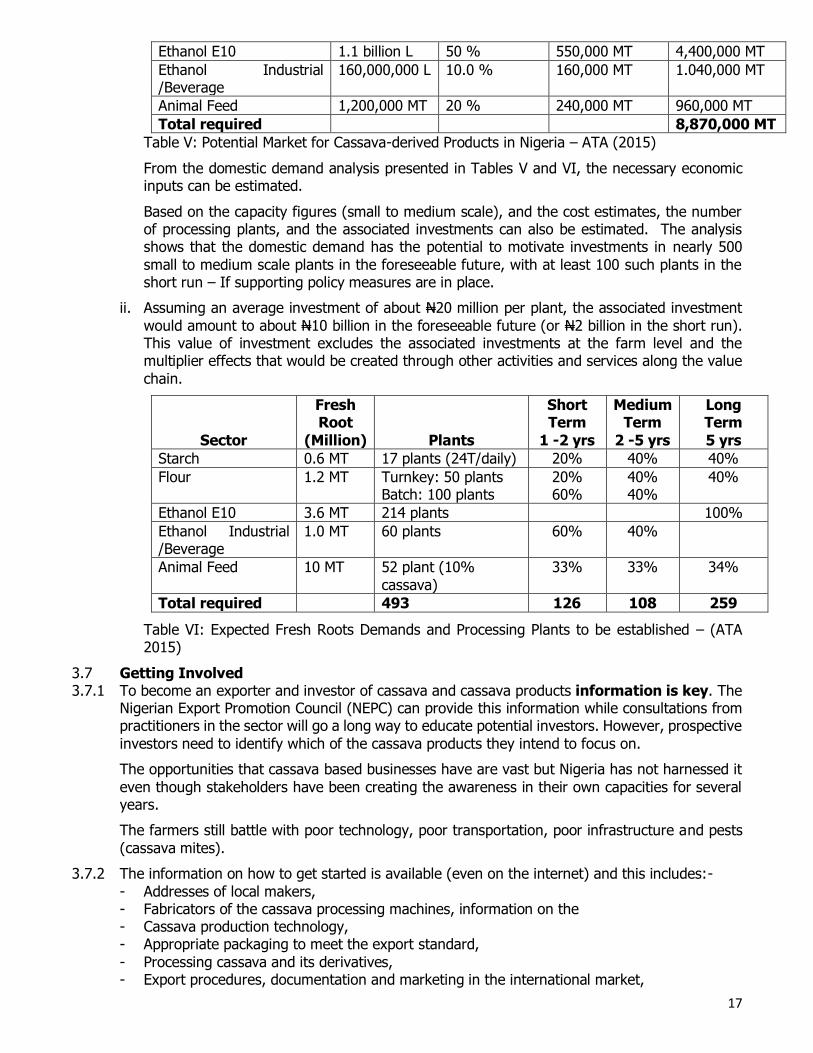
17
Ethanol E10 1.1 billion L 50 % 550,000 MT 4,400,000 MT
Ethanol Industrial /Beverage
160,000,000 L 10.0 % 160,000 MT 1.040,000 MT
Animal Feed 1,200,000 MT 20 % 240,000 MT 960,000 MT
Total required 8,870,000 MT
Table V: Potential Market for Cassava-derived Products in Nigeria – ATA (2015)
From the domestic demand analysis presented in Tables V and VI, the necessary economic inputs can be estimated.
Based on the capacity figures (small to medium scale), and the cost estimates, the number of processing plants, and the associated investments can also be estimated. The analysis shows that the domestic demand has the potential to motivate investments in nearly 500
small to medium scale plants in the foreseeable future, with at least 100 such plants in the short run – If supporting policy measures are in place.
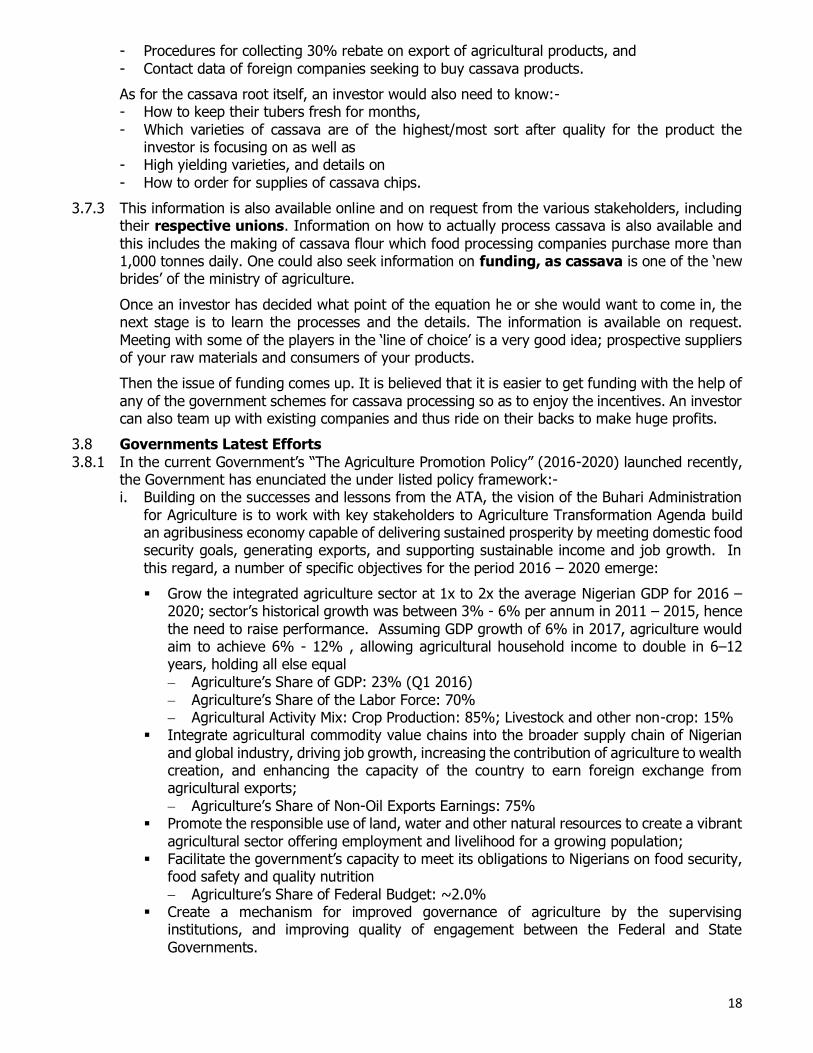
ii. Assuming an average investment of about N20 million per plant, the associated investment
would amount to about N10 billion in the foreseeable future (or N2 billion in the short run). This value of investment excludes the associated investments at the farm level and the multiplier effects that would be created through other activities and services along the value
chain.
Sector
Fresh Root
(Million)
Plants
Short Term
1 -2 yrs
Medium Term
2 -5 yrs
Long Term
5 yrs
Starch 0.6 MT 17 plants (24T/daily) 20% 40% 40%
Flour 1.2 MT Turnkey: 50 plants Batch: 100 plants
20% 60%
40% 40%
40%
Ethanol E10 3.6 MT 214 plants 100%
Ethanol Industrial /Beverage
1.0 MT 60 plants 60% 40%
Animal Feed 10 MT 52 plant (10%
cassava)
33% 33% 34%
Total required 493 126 108 259
Table VI: Expected Fresh Roots Demands and Processing Plants to be established – (ATA 2015)
3.7 Getting Involved 3.7.1 To become an exporter and investor of cassava and cassava products information is key. The
Nigerian Export Promotion Council (NEPC) can provide this information while consultations from practitioners in the sector will go a long way to educate potential investors. However, prospective
investors need to identify which of the cassava products they intend to focus on.
The opportunities that cassava based businesses have are vast but Nigeria has not harnessed it
even though stakeholders have been creating the awareness in their own capacities for several years.
The farmers still battle with poor technology, poor transportation, poor infrastructure and pests
(cassava mites).
3.7.2 The information on how to get started is available (even on the internet) and this includes:-
- Addresses of local makers, - Fabricators of the cassava processing machines, information on the - Cassava production technology, - Appropriate packaging to meet the export standard,
- Processing cassava and its derivatives, - Export procedures, documentation and marketing in the international market,
18
- Procedures for collecting 30% rebate on export of agricultural products, and
- Contact data of foreign companies seeking to buy cassava products.
As for the cassava root itself, an investor would also need to know:- - How to keep their tubers fresh for months,
- Which varieties of cassava are of the highest/most sort after quality for the product the investor is focusing on as well as
- High yielding varieties, and details on
- How to order for supplies of cassava chips.
3.7.3 This information is also available online and on request from the various stakeholders, including their respective unions. Information on how to actually process cassava is also available and
this includes the making of cassava flour which food processing companies purchase more than 1,000 tonnes daily. One could also seek information on funding, as cassava is one of the ‘new brides’ of the ministry of agriculture.
Once an investor has decided what point of the equation he or she would want to come in, the next stage is to learn the processes and the details. The information is available on request.
Meeting with some of the players in the ‘line of choice’ is a very good idea; prospective suppliers of your raw materials and consumers of your products.
Then the issue of funding comes up. It is believed that it is easier to get funding with the help of
any of the government schemes for cassava processing so as to enjoy the incentives. An investor can also team up with existing companies and thus ride on their backs to make huge profits.
3.8 Governments Latest Efforts
3.8.1 In the current Government’s “The Agriculture Promotion Policy” (2016-2020) launched recently, the Government has enunciated the under listed policy framework:- i. Building on the successes and lessons from the ATA, the vision of the Buhari Administration
for Agriculture is to work with key stakeholders to Agriculture Transformation Agenda build an agribusiness economy capable of delivering sustained prosperity by meeting domestic food security goals, generating exports, and supporting sustainable income and job growth. In
this regard, a number of specific objectives for the period 2016 – 2020 emerge:
Grow the integrated agriculture sector at 1x to 2x the average Nigerian GDP for 2016 – 2020; sector’s historical growth was between 3% - 6% per annum in 2011 – 2015, hence
the need to raise performance. Assuming GDP growth of 6% in 2017, agriculture would aim to achieve 6% - 12% , allowing agricultural household income to double in 6–12 years, holding all else equal
Agriculture’s Share of GDP: 23% (Q1 2016)
Agriculture’s Share of the Labor Force: 70% Agricultural Activity Mix: Crop Production: 85%; Livestock and other non-crop: 15%
Integrate agricultural commodity value chains into the broader supply chain of Nigerian
and global industry, driving job growth, increasing the contribution of agriculture to wealth creation, and enhancing the capacity of the country to earn foreign exchange from agricultural exports;
Agriculture’s Share of Non-Oil Exports Earnings: 75% Promote the responsible use of land, water and other natural resources to create a vibrant
agricultural sector offering employment and livelihood for a growing population; Facilitate the government’s capacity to meet its obligations to Nigerians on food security,
food safety and quality nutrition
Agriculture’s Share of Federal Budget: ~2.0% Create a mechanism for improved governance of agriculture by the supervising
institutions, and improving quality of engagement between the Federal and State
Governments.
19
ii. Unlocking Nigeria’s full agricultural potential requires that Nigeria solve the underlying
challenges in its agricultural system, which includes the following:- Policy Framework: Nigeria suffers from policy instability driven by high rate of turnover of
programmes and personnel, which in turn has made the application of policy instruments
unstable. The outcome is an uneven development pathway for agriculture; lack of policy accountability, transparency and due process of law, relating to willful violation of the constitution and subsidiary legislations governing the agriculture sector. That in turn has
made the business environment unpredictable and discourages investors. To address this challenge, Nigeria needs to create a policy structure that matches evidence-driven coordination among decision-making authorities with common and public goals for an agricultural transformation of the country. Building that evidence base requires that
Nigeria adopt a consistent fact base to drive decision making, as well as build on prior successes e.g. the Jonathan Administration’s pioneering Agricultural Transformation Agenda (ATA).
Political Commitment: This pertains to the non-implementation of international protocols or conventions agreed to with other members of the comity of nations. For example, Nigeria has failed to achieve the targets in the Maputo Declaration that prescribes a
minimum of 10% budgetary allocation to the agricultural sector. Political commitment at both the Federal and State levels will be required to enforce reforms.
Agricultural Technology: Persistent shortcomings of the National Agricultural Research
System (NARS) to generate and commercialize new agricultural technologies that meet local market needs. NARS’s challenges have been relatively severe particularly around improved varieties of seed or other planting materials and breeds of livestock and aquatic
species. The failure to also deliver already proven technologies available on the shelf to farmers’ fields where they are needed is a challenge. Addressing these will require better coordination among extension delivery system, the national agricultural research system,
as well as public and private sector suppliers of agricultural inputs. Infrastructure Deficit: Nigeria’s agricultural sector suffers from an infrastructure challenge.
Infrastructure such as motor roads, railroads or irrigation dams are either insufficient, or
when available, not cost competitive. They are thus unable to operate to support scale-driven agriculture. That imposes an added cost (up to 50% - 100%) on the delivered price of agricultural produce in Nigeria, making it uncompetitive compared to global peers.
In order to boost farm productivity, raise the level of marketable surplus and expand value chain participants’ access to low cost infrastructure, Nigeria will need to rethink the business and operating model for agricultural infrastructure.
Finance and Risk Management: Nigeria’s agriculture sector continues to have poor access to financial services that enable farmers and other agricultural producers to adopt new technologies, improve market linkages, and increase their resilience to economic shocks. Poor access to financial services that enable input suppliers, processors, traders and
others in agribusiness to address liquidity and encourage targeted private sector engagement in agriculture remains a challenge. Lending rates still routinely range from 10% to 30% subject to whether the borrower is considered prime, has access to low cost,
government-provided financing (BoA, CBN, BOI), or is offered a NIRSAL Plc. -financed interest rate subsidy and credit guarantee. To improve financing options and de-risk value chains further, Nigeria will need to intensify innovation in financing ecosystems.
Institutional Reform and Realignment: Today, many federal and state agricultural institutions only exist on paper. In fact, the system even ignores local government areas which is actually where a majority of activity takes place. There is a need to streamline,
clarify mandates and ensure continued accountability for results. Unless these issues are tackled, Nigeria will continue to struggle with the capacity of its agricultural institutions to deliver on their public mandates. A turnaround will mean, for example, adding more
resources such as adding up to 15,000 extension workers, setting up more operational
20
coordination mechanisms between the Federal Government and States in between the
National Council of Agriculture, and linking rewards to performance.
iii. In addressing these constraints, the government will apply prudent, market based policy measures to grow the sector, with a clear recognition that widespread poverty
reduction through the transformation of the agriculture sector is integral to the country’s long run economic growth trajectory and prosperity. Accordingly, this policy statement is anchored on three main pillars in line with the constitutional provision for
the role of Federal Government in agricultural development:- Promotion of agricultural investment; Financing agricultural development programmes and
Research for agricultural innovation and productivity.
One of the most important by products of Cassava – Starch – Industry & Food Grade is the object of this study.

21
CASSAVA STARCH INDUSTRY
Problems and Prospects
22
4. CASSAVA STARCH INDUSTRY – Problems & Prospects
4.1 The Product Starch is a soft, white, tasteless powder that is insoluble in cold water, alcohol or other solvents. Starch can be cassava based but also cereal based Starch. Over 90% of Starch produced in
Nigeria have a production capacity of less than 10tons per day.
Starch uses are varied and are diversifying further with continued global economic development. Starch is produced from local production of grain or root crop. Starches from different raw
materials i.e. maize or cassava can be substitutable in end-use.
4.2 Types of Starches 4.2.1 Starch can be classified into two types: native and modified. Native Starches are produced
through the separation of naturally occurring Starch from either grain or root crops, such as cassava, maize, and sweet potato, and can be used directly in producing certain foods, such as noodles. The raw Starches produced still retain the original structure and characteristics and are
called “native Starches”. Native Starch is the basic Starch product that is marketed in the dry powder form under different grades for food, and as pharmaceutical, human, and industrial raw material. Native Starch has different functional properties depending on the crop source, and
specific types of Starch are preferred for certain applications. Native Starch can be considered a primary resource that can be processed into a range of Starch products.
Native Starches have limited usage, mainly in the food industry, because they lack certain desired
functional properties. The native Starch granules hydrate easily when heated in water, they swell and gelatinize; the viscosity increases to a peak value, followed by a rapid decrease, yielding weak-boiled, stringy, and cohesive pastes of poor stability and poor tolerance to acidity, with low
resistance to shear pressure, as commonly employed in modern food processing. However, food, metallurgic, mining, fermentation, construction, cosmetics, pharmaceutical, paper and cardboard, and textiles industries among others use native Starch in its traditional form.
4.2.2 Modified Starches For those characteristics, which are unattainable with native Starch, modified Starch can be used
for other industrial applications through a series of techniques, chemical, physical, and enzymatic modification. Thus, modified Starch is native Starch that has been changed in its physical and/or chemical properties.
Modifications may involve altering the form of the granule or changing the shape and composition of the constituent amylose and amylopectin molecules. Modifications are therefore carried out on
the native Starch to confer it with properties needed for specific uses. Some of these modified Starches, their methods of modification and desirable properties are shown in Table 6. When a Starch is modified chemically or physically, the properties of the native Starch is altered. Various
modifications give the Starch properties that make it useful in many industries such as food, pharmaceutical, textile, petroleum, and paper pulp industries.
The different ways of modifying native Starch consist in altering one or more of the following
properties: paste temperature, solids/viscosity ratio, Starch paste resistance to reduction of viscosity by acids, heat and or mechanical agitation (shear), retro gradation tendencies, ionic and hydrophilic nature.
Modifying Starch is important to provide the following properties: thickening, gelatinization, adhesiveness and/or film-formation, to improve water retention, enhance palatability and sheen and to remove or add opacity.
The reasons why native Starch is modified are: To modify cooking characteristics (gelatinization).
To reduce retro gradation. To reduce paste’s tendency to gelatinize. To increase paste’s stability when cooled or frozen. To increase transparency of pastes and gels.
23
To improve texture of pastes and gels.
To improve adhesiveness between different surfaces, such as in paper applications.
4.2.3 Advantages of Cassava Starch Cassava has many advantages for Starch production.
High level of purity. Excellent thickening characteristics. A neutral (bland) taste.
Desirable textural characteristics. A relatively cheap source of raw material containing a high concentration of Starch (dry-
matter basis) that can equal or surpass the properties offered by other Starches
(maize, wheat, sweet-potato, and rice).
Cassava Starch:-
Is easy to extract using a simple process (when compared to other Starches) that can be
carried out on a small-scale with limited capital. Is often preferred in adhesive production as the adhesives are more viscous, work more
smoothly, and provide stable glues of neutral pH has clear paste.
The development of both the food and non-food uses of cassava Starch has made much progress and continues to have a bright future. Both old and important new
products, such as modified Starches, Starch sugars, Starch-based plastics and fuel alcohol, are reviewed briefly.
4.2.4 Cassava Starch is an important domestic and industrial raw material used in the manufacture of
various products including food, adhesives, thickening agents, paper, and pharmaceuticals. It has many remarkable characteristics including high paste viscosity, high paste clarity and high freeze-thaw stability, which are advantageous to many industries.
4.3 Cassava Starch – Global and Nigeria Trends 4.3.1 The world Starch production is about 60 million tonnes and its consumption trend is expected to
be 70 million tonnes by 2012 (Vilpoux, 2005). The largest producer is United States with 25.2
million tonnes, the Asian countries at 19.8 million tonnes, Europe with 12.2 million tonnes, Latin America with 1.8 million and Brazil with 1.0 million tonnes respectively. The major raw materials used in Starch production are corn, 75%, sweet potato, 13% and lastly,
cassava at 12%.
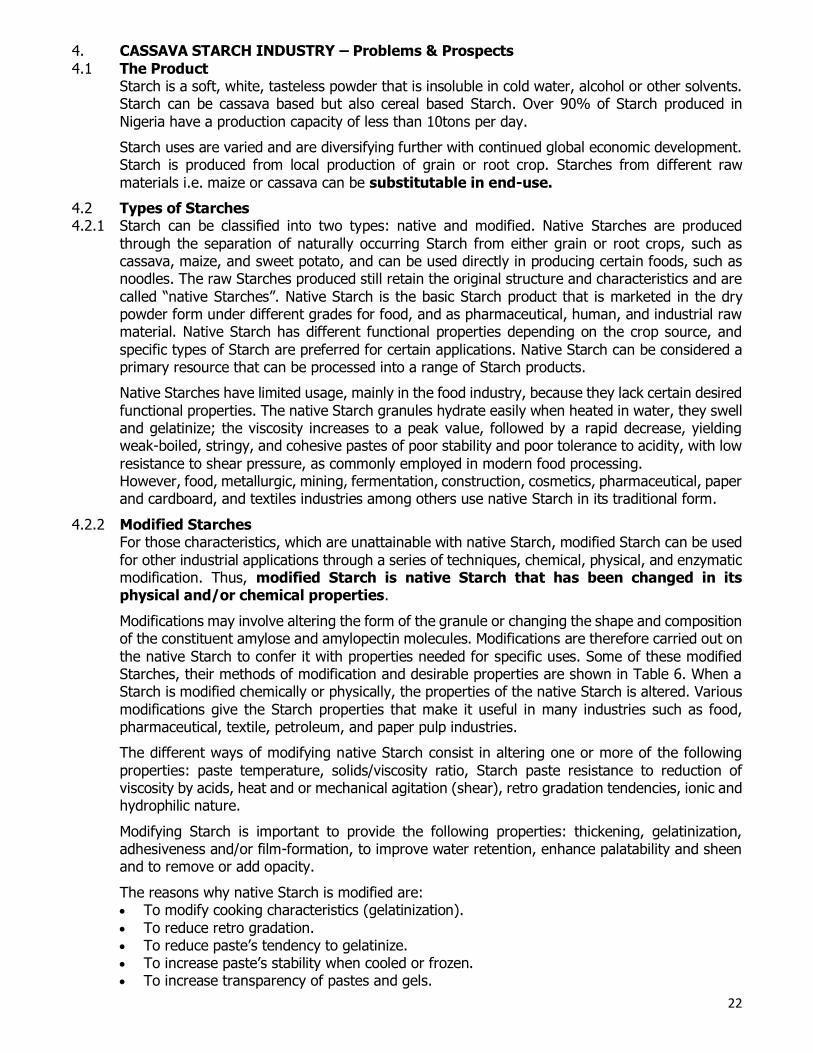
Figure 2- Relationship between Corn Prices and Starch Imports
The current statistics show that maize is still supplying as much as 75% of the global Starch
market, with cassava Starch contributing about 12%.
24
4.3.2 On the international market, Cassava Starch is able to compete against corn, wheat and potatoes
Starches. Cassava Starch is especially competitive outside the two main markets, US and EU (i.e. in South East Asia). The overall world demand for all Starch products grows at an annual rate of 4%. It is expected that this significant growth in demand will continue in the
next decade.
4.3.3 A high level of protection characterizes the Starch market, as many users protect their local Starch industries. Tariffs on Cassava Starch in the main importer countries range from 0%
in Canada, Malaysia, Indonesia and the United States to 480% in the Republic of Korea. In the main markets, Starch is imported under preferential access conditions. Japan for instance, has established an overall 200,000 tonnes tariff quota on native Starch from maize, potato and
cassava, beginning with a 25% duty and reducing it to 15% in 2000.
4.4 Cassava Starch Industry in Nigeria 4.4.1 In a paper presented by Chief Executive Officer (CEO) of Union Dicon Salt (UDS) Plc Mr. Chuka
Mordi in August 2016, he said inter alia:-
Nigeria’s Cassava Starch industry generates over $240 million about N76.9 billion yearly, 90
per cent of which is from importation. But the industry has the potential to grow as population and income per capita increase.
According to Mordi, Nigeria currently has four major functional Starch processing plants with a
combined capacity of 27,000 tons. He said the Nation’s Annual Starch demand of over 250,000 tons with a market size of $240m is met by importation of corn Starch, and this provides an opportunity for import substitution, which is in line with UDS’s strategy.
UDS Plc is a company operating in the Nigerian consumer goods sector. It has been diversifying into the agro industrial sector, with an initial concentration on Cassava and Starch processing. The firm has already finalized agreement with GEA Westphalia of Germany to build the largest
Industrial Starch processing facility in Nigeria.
Mordi said the potential for Nigeria’s Starch market is huge, as Nigeria is the largest cassava
growing country in the world, with an estimated annual output of 45m tons, which continues to grow annually.
He, however, said over $600m worth of cassava products (flour, Starch, glucose and animal feed)
are imported, largely as a result of uncoordinated harvest and transport of high grade cassava in commercial quantities.
Cassava Starch, a food grade product refined from cassava roots, the major component of the
cassava plant. It has thickening and binding qualities and is used as binder and thickener in convenience foods. But Mordi said Nigeria processes very little of its current output Starch compared with other countries.
According to him, all the major Starch processing factories in Nigeria operate at less than 20 per cent of their installed capacity, producing about 27,000 tons of Starch per annum. The 20 per cent domestic production capacity, he said, fall short of the nation’s current demand for
Starch, put in excess of 250,000 tons per annum.
To meet local supply, the CEO said Starch end-users resort to importation of Starch, which
presents a clear opportunity for investment in Starch processing for import substitution. He said the company’s investment in Cassava processing involved the installation of a 10,000 Metric Tons Per Annum (MT PA) Starch processing plant for the conversion of cassava to Starch.
4.5 Characteristics of the Starch Industry 4.5.1 First, the share of the cassava crop going to Starch is very little (2%) but has been growing over
time. The number of participants involved in Starch production has increased, including both rural
households and large firms. Field survey results show that at least 5% of total cassava production is now used for Starch.
25
4.5.2 Second, many Starch processors cannot buy enough cassava to run at full capacity. In particular,
there is a sizable gap between potential and utilized capacities, a gap that grows with firm size. Capacity utilization for micro firms is 66%, for small firms it is 41%, for medium firms 36%, and for large firms 25%.
The Starch value-chain is characterized by difficulty in securing sufficient fresh roots to run the large mill at full capacity; both NSM and MATNA run at 40 and 60% capacity respectively. Currently, the MATNA mill works a single shift and sources cassava from 1,200 hectares of small
holder farms located 650km from the mill. The plan going forward is to improve this supply by clustering 2,500-3,000 hectares of farms within 300km of the mill for a two shift operation. In the long term, the mill will operate three shifts using fresh roots from 4500-5000 hectares of
cassava of which at least 2/3 is from within 300km. NSM on the other hand has a nucleus farm of 500Ha that meets roughly 20% of its raw material needs. The rest of its raw material comes from white Zimbabwean out grower farmers, some 700 km away in Shonga, Kwara state.
Sourcing cassava from such a long distance adds N7,000 to each ton of fresh cassava roots.
A study of USAID MARKETS revealed commercial Starch processors of Cassava need consistent volumes to be profitable. Solutions include The Cassava Supply Management System
(CSMS), a database for managing supplier relationship, it includes: a system for planning harvest; a record of deliveries for accounting; manages complex supplier network; efficient allocation of transport fleet; Standard Operating Procedures Developed: Harvest, Transport and
Delivery.
4.5.3 Third, high Cassava Root costs contribute to lowering the competitiveness of the industry, particularly of the larger firms. Survey results show that large firms pay the highest prices
for raw materials procured from farmers, where as the smallest firms pay the lowest prices. Moreover, small and medium firms travel shorter distances to procure cassava than do large processors. High costs are also related to the low productivity of cassava farming. Current yields
only average 15tons/ha in Nigeria, where as in China and Thailand yields are nearly double that.
4.5.4 Fourth, most of the Starch firms are micro or small. Micro firms (with a production capacity of
less than one ton per day) comprise almost 50%, with small firms (between 1and 5tons per day) making up about 26%, medium firms (between 5 and 10tons per day) about 24%, and large firms (over 10tons per day) only 10%. The largest enterprise, MSN, has a capacity of 10,000ton/yr
(ATA 2015).
Small firms also have poorer quality equipment. Most small processors manufacture Starch with a bare minimum of equipment, using only graters and pumps in their operations. By contrast,
large firms have access to sedimentation tanks, dryers, and complete Starch systems. The majority of participants (both small and large) in the Starch industry use locally manufactured equipment, which is often of low quality and in appropriate for producing high
quality Starch.
Field Survey indicates small firms-and even some large firms-face credit constraints that make it quite difficult for them to increase the quantity and quality of their equipment. The
survey revealed a higher incidence of borrowing by medium and large processors (68% and 76%, respectively) than micro and small processors (44% and 22%, respectively). While large firms have better access to bank credit, the survey reports a larger gap between obtained credit and
credit requirements for these firms. Problems with securing sufficient collateral and difficulties with banks were stated by firms in the survey as the main reasons for not being able to obtain additional credit.
4.5.5 Fifth, as firm size increases, the capital/labor ratio increases. Nearly all of the firms in the survey are labor-intensive, with capital use increasing only after an enterprise has reached a scale of at least three tons per day. Survey results show that the average value of equipment for micro,
small, and large firms was respectively N1m, N12m, N240m (using the 2017 exchange rate of U.S.$1 to N305.6)
26
4.5.6 Sixth, there is a correlation between firm size and the type of Starch produced and market
targeted. Micro, small, and medium firms produce about 87% of the wet Starch, but only produce 13% of the dry Starch. Smaller firms specialize in wet Starch production, and large firms specialize in dry Starch production. This is to be expected, since dry Starch is more capital intensive than
the production of wet Starch. Moreover, smaller, household Starch firms mainly produce Starch for the noodle industry, while only the most advanced household processors produce Starch for Industry.
By contrast, larger firms target their Starch production toward a broader range of food and non food uses, including the paper industry, MSG, pharmaceuticals, and textiles interestingly. Small firms have maintained their network of sales despite competition from large firms in traditional
wet Starch markets (i.e., noodles, maltose). This is partly because small firms target local markets that are relatively protected from large firms in urban areas because of high transaction costs, poor infrastructure, Impediments in moving raw materials, and the difficulty of entering marketing
channels established by small firms.
4.6 Cassava Starch factories 4.6.1 The profitability of any cassava factory depends primarily on the following conditions:
(a) year-round availability of cassava roots of the desired quality in sufficient quantity; (b) presence of abundant water with the needed qualities; (c) reliable power supply;
(d) transportation facilities both for the roots and the end products; (e) availability of capital and labour.
Small and medium-size factories are more frequently found in rural regions with a rather dense
agrarian population, numerous streams, and at least one highway to and not too distant from commercial centre.
4.7 Requirements for Success in the Industry 4.7.1 Field investigation revealed that the requirements for success within the industry include amongst
others:-
i. The maintenance of a clean and healthy environment as provided for by the Factories Act of 2004.
ii. Effective Distribution Channels with a good Commission System
iii. Production efficiency with regular and steady supply of materials iv. Promotional activities aimed at cultivating first time buyers v. Good management practices and controls
vi. Good quality products that would meet international standards vii. Effective competitive strategy and branding to win over consumers with a good market share

27
TECHNICAL STUDY
28
5 TECHNICAL OPERATIONS
The technical operations involved in the manufacture of cassava Starch were thoroughly investigated. The following areas of activities were examined:- i. Raw Materials Supplies
ii. Sources & Types of Machinery and Equipment Needed for Production iii. Process of Manufacture/Labour Requirements iv. Warehousing & Storage
v. Utilities – Water, Energy etc vi. Wastes Disposal vii. Quality Control/Good Manufacturing Practice (GMP)
5.1 Raw Material, Supplies and Utilities 5.1.1 Fresh cassava root is the only raw material for production of Cassava Starch. Cassava is grown
in almost all the states in Nigeria and Nigeria has been rated the highest producer of cassava in
the world. The other major items of supplies are:- i. The packaging materials, ii. Factory wears (overall, hand gloves, factory shoe, nose mask),
iii. Cleansing agents, disinfectants, iv. Electricity, diesel (for generator and project truck), v. Low Pore Fuel Oil (LPFO) for firing the flash dryer, and
vi. Water is the major utilities requirement.
5.2 The Product 5.2.1 The main product of the study is Starch and its derivatives. Cassava Starch is produced
primarily by the wet milling of fresh cassava roots but in some countries such as Thailand, it is produced from dry cassava chips.
Starch is the main constituent of cassava. About 25% Starch may be obtained from mature, good
quality tubers. About 60 % Starch may be obtained from dry cassava chips and about 10% dry pulp may be obtained per 100 kg of cassava roots.
Fresh tubers are processed during season and dry chips during the off-season in some countries. Extraction of Starch from fresh cassava roots (Figure 3) can be divided into five main stages: preparation (peeling and washing), rasping/pulping/grating, purification (Starch washing),
dewatering and drying, and finishing (milling and packaging).
5.2.2 Cassava Starch is used in the manufacture of sweeteners, sizing of paper and textile and is in particular an excellent food Starch used as a thickener and stabilizer. The pulp is used as cattle
feed. Juice and spent process water are valuable fertilizers disposed of by land spreading. Being a pure renewable natural polymer Starch has a multitude of applications.
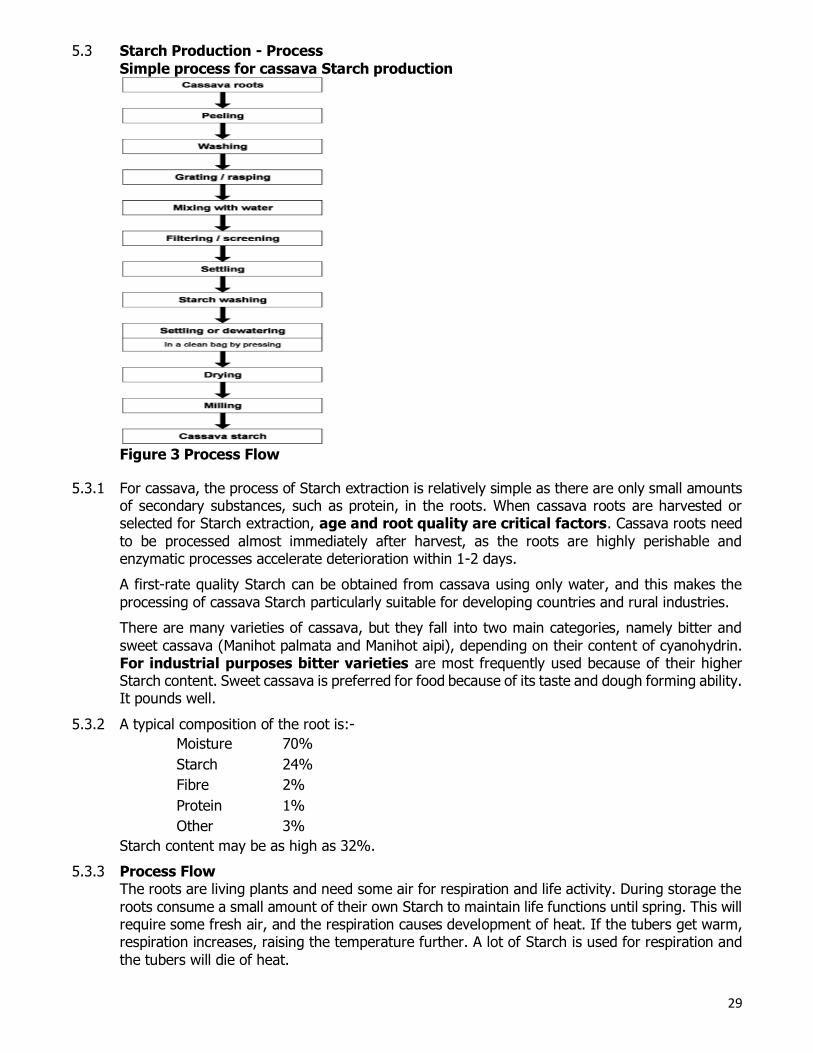
29
5.3 Starch Production - Process
Simple process for cassava Starch production
Figure 3 Process Flow
5.3.1 For cassava, the process of Starch extraction is relatively simple as there are only small amounts of secondary substances, such as protein, in the roots. When cassava roots are harvested or selected for Starch extraction, age and root quality are critical factors. Cassava roots need
to be processed almost immediately after harvest, as the roots are highly perishable and enzymatic processes accelerate deterioration within 1-2 days.
A first-rate quality Starch can be obtained from cassava using only water, and this makes the
processing of cassava Starch particularly suitable for developing countries and rural industries.
There are many varieties of cassava, but they fall into two main categories, namely bitter and
sweet cassava (Manihot palmata and Manihot aipi), depending on their content of cyanohydrin. For industrial purposes bitter varieties are most frequently used because of their higher Starch content. Sweet cassava is preferred for food because of its taste and dough forming ability. It pounds well.
5.3.2 A typical composition of the root is:-
Moisture 70%
Starch 24%
Fibre 2%
Protein 1%
Other 3%
Starch content may be as high as 32%.
5.3.3 Process Flow The roots are living plants and need some air for respiration and life activity. During storage the
roots consume a small amount of their own Starch to maintain life functions until spring. This will require some fresh air, and the respiration causes development of heat. If the tubers get warm, respiration increases, raising the temperature further. A lot of Starch is used for respiration and
the tubers will die of heat.
30
Unfavourable storage conditions cause Starch losses and, in the worst case, dead and smashed
raw materials, which are disruptive for the process. Therefore roots are processed in the order they are delivered to the factory, and the roots must be processed within 24 hours of harvest. Supplies of bad raw materials have to be rejected.
i. Root Reception First point of reception is weighing of the lorry on a platform scale. Second point is sampling. A sample of roots is washed on a laboratory washer. The difference of sample weight before and
after washing indicates the proportion of dirt in the delivery. The next step is the determination of the Starch content. Both figures are used to settle the account with the farmer and encourage the delivery of high quality tubers rich in Starch.
The roots are stored in the reception yard on a concrete floor. The yard may be divided in several bunkers alongside a main yard conveyor to accomplish the processing of the oldest tubers first. At this point the tubers are still bulky with an average weight of 600 - 650 kg per m3.
The main yard conveyor may be a long horizontal band positioned 10 - 20 cm below floor level. In large reception yards more bands may be used to feed the main conveyor. A Bobcat may find
use as well or instead of a yard conveyor.
ii. Raw Material Handling First of all, any stalks must be removed. This is most easily done during harvest. Stalks will
interfere with the peeling, blunt the rasps, and increase the fibre mass with adverse effect on the process.
Loose dirt, sand, and gravel are removed in different ways. Preferably a rotating bar screen is
used for a dry cleaning of the roots prior to the washing step.
From a buffer bin the tubers are fed into the bar screen. From the bar screen the roots enter the
washing station. Paddle washers are still in use, but rotary washers have proved their efficiency as they have in the potato industry.
Thorough dirt removal will lessen the problems with stones and sand later. The soil also contains
considerable quantities of nutrients, which will dissolve in the washing water and contribute to the environmental burden created by the effluent.
iii. Efficient Washing Makes Refining Easier
Soil and dirt not removed in the washing station yield problems later. The washing is therefore very important.
High quality washing improves refining, because many impurities resemble Starch in specific weight and size, so washing is the only way to get rid of them. The rubbing in the washing machine is a most important quality factor.
The quantity of impurities adhering to the surface upon delivery depends to a great extent on weather conditions and the soil where the tubers are cultivated.
The paddle wash takes place in two compartments - one with a water level and one without. The
rotary wash machine combines flushing with a low water level and continuous removal of dirt and peel. The wash water may be recycled after filtering off peelings on a rotary screen and settling of sand in basins. Process water from the refining station and crude water replace the loss of
wash water.
The washed tubers are conveyed on an inspection belt to the pre-cutter. In order to feed the
rasps properly, the roots are chopped into pieces.
iv. Rasping or Grating Rasping is the first step in the Starch extraction process. The goal is to open all the tuber cells,
so that all the Starch granules are released. The slurry obtained can be considered as a mixture of pulp (cell walls), fruit juice, and Starch. With modern high-speed raspers, rasping is a one-pass
31
operation only. An even feed of the rasps is essential for a steady flow throughout the rest of the
plant.
After rasping, the hydrogen cyanide and cyanohydrin are released and go with the juice and process water. The effluent may be disposed of by land spreading.
v. Use of Sulphur The cell juice is rich in sugar and protein. When opening the cells, the juice is instantly exposed to air and reacts with the oxygen, forming coloured components, which may adhere to the Starch.
Food grade sulphur dioxide gas or sodium-bisulphite-solution therefore has to be added. The great reduction potential of the sulphur compounds prevents discoloration. Sufficient sulphur has
to be added to turn the juice and pulp light yellow.
vii. Extraction Powerful flushing is needed to release the Starch granules from the cells - the cells are torn apart
in the rasper and form a filtering mat trying to retain the Starch. Water has previously been used for the extraction, but today the extraction takes place in closed systems, allowing the use of the juice itself or process water from the refining step.
The Starch that is flushed out leaves the extraction sieves along with the fruit juice. The cell walls (pulp) can be concentrated further on pulp dewatering sieves. In this case the pulp leaves the dewatering sieves wet, but drip-dries to 10 - 15 % dry matter.
The extraction takes place on rotating conical sieves. The high efficiency makes it feasible to utilise high quality sieve plates made of stainless steel, which will withstand abrasion and CIP-
chemicals. The sieve plates have long perforations that are only 125 microns across.
The extraction is a counter current process. It is followed by a fine fibre washing on conical sieves also. The washed fibres are combined with the pulp and may be used as cattle feed.
viii. Concentrating the Crude Starch Slurry As much juice as possible is excreted on a couple of hydrocyclone batteries or on a nozzle centrifuge. The Starch leaves the concentrator as pumpable slurry of approx. 21 oBe.
The juice leaves the factory as a by-product. The best way to dispose of the fruit water is to utilise it as a fertilizer on nearby agricultural land.
viii. Refining It now remains to purify the crude Starch slurry (suspension) and remove residual fruit juice and impurities. The way it is done is more or less based on the same principles used when removing
soapy water from the laundry - you wring and soak in clean water repeatedly. Everyone doing laundry realizes how often it is necessary to wring before the rinsing water is all clear, and that the harder you wring the fewer rinsing steps are required.
In the same way the Starch slurry is diluted and concentrated again and again. With hydrocyclones it is feasible to reduce fibre and juice to low levels with a minimum of fresh water. To save rinsing water the wash is done counter currently - i.e. the incoming fresh water is used
on the very last step and the overflow is reused for dilution on the previous step, and so on.
Increasing the number of hydrocyclone refining steps may accomplish considerable savings of
fresh water. This is one of the advantages of using hydrocyclones. Dual refining lines represent the ultimate design.
In the strong gravitational fields of a hydrocyclone and a centrifuge, the Starch settles quickly,
while fibres (pulp residuals) just float in the water. Fibres with adhering air bubbles are lighter than water and seek towards the overflow. Fibres with Starch granules enclosed are heavier and sink towards the underflow and mix with the Starch. The juice is directly diluted in the water and
goes with the water phase. Refining is based on the differences in weight density between water, fibres, and Starch:
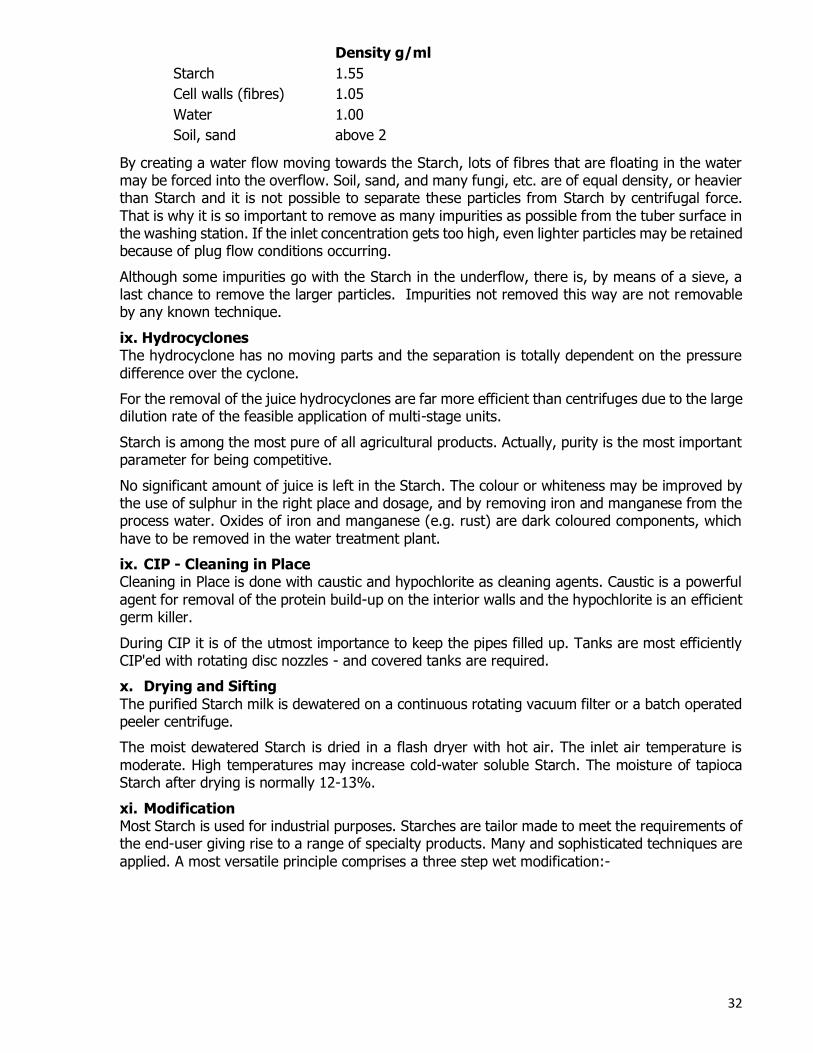
32
Density g/ml
Starch 1.55
Cell walls (fibres) 1.05
Water 1.00
Soil, sand above 2
By creating a water flow moving towards the Starch, lots of fibres that are floating in the water may be forced into the overflow. Soil, sand, and many fungi, etc. are of equal density, or heavier than Starch and it is not possible to separate these particles from Starch by centrifugal force.
That is why it is so important to remove as many impurities as possible from the tuber surface in the washing station. If the inlet concentration gets too high, even lighter particles may be retained because of plug flow conditions occurring.
Although some impurities go with the Starch in the underflow, there is, by means of a sieve, a last chance to remove the larger particles. Impurities not removed this way are not removable by any known technique.
ix. Hydrocyclones The hydrocyclone has no moving parts and the separation is totally dependent on the pressure
difference over the cyclone.
For the removal of the juice hydrocyclones are far more efficient than centrifuges due to the large dilution rate of the feasible application of multi-stage units.
Starch is among the most pure of all agricultural products. Actually, purity is the most important parameter for being competitive.
No significant amount of juice is left in the Starch. The colour or whiteness may be improved by the use of sulphur in the right place and dosage, and by removing iron and manganese from the process water. Oxides of iron and manganese (e.g. rust) are dark coloured components, which
have to be removed in the water treatment plant.
ix. CIP - Cleaning in Place Cleaning in Place is done with caustic and hypochlorite as cleaning agents. Caustic is a powerful
agent for removal of the protein build-up on the interior walls and the hypochlorite is an efficient germ killer.
During CIP it is of the utmost importance to keep the pipes filled up. Tanks are most efficiently CIP'ed with rotating disc nozzles - and covered tanks are required.
x. Drying and Sifting
The purified Starch milk is dewatered on a continuous rotating vacuum filter or a batch operated peeler centrifuge.
The moist dewatered Starch is dried in a flash dryer with hot air. The inlet air temperature is
moderate. High temperatures may increase cold-water soluble Starch. The moisture of tapioca Starch after drying is normally 12-13%.
xi. Modification Most Starch is used for industrial purposes. Starches are tailor made to meet the requirements of the end-user giving rise to a range of specialty products. Many and sophisticated techniques are
applied. A most versatile principle comprises a three step wet modification:-
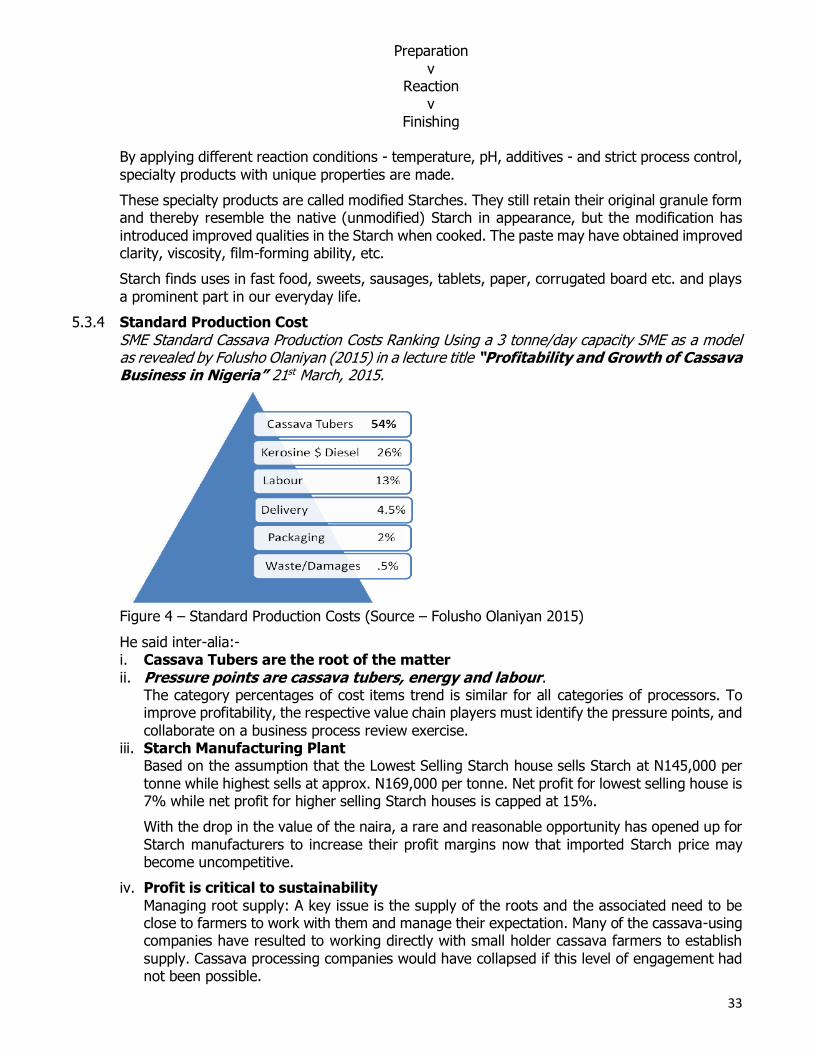
33
Preparation
v Reaction
v
Finishing By applying different reaction conditions - temperature, pH, additives - and strict process control,
specialty products with unique properties are made.
These specialty products are called modified Starches. They still retain their original granule form and thereby resemble the native (unmodified) Starch in appearance, but the modification has
introduced improved qualities in the Starch when cooked. The paste may have obtained improved clarity, viscosity, film-forming ability, etc.
Starch finds uses in fast food, sweets, sausages, tablets, paper, corrugated board etc. and plays
a prominent part in our everyday life.
5.3.4 Standard Production Cost
SME Standard Cassava Production Costs Ranking Using a 3 tonne/day capacity SME as a model as revealed by Folusho Olaniyan (2015) in a lecture title “Profitability and Growth of Cassava Business in Nigeria” 21st March, 2015.
Figure 4 – Standard Production Costs (Source – Folusho Olaniyan 2015)
He said inter-alia:- i. Cassava Tubers are the root of the matter ii. Pressure points are cassava tubers, energy and labour.
The category percentages of cost items trend is similar for all categories of processors. To improve profitability, the respective value chain players must identify the pressure points, and
collaborate on a business process review exercise. iii. Starch Manufacturing Plant
Based on the assumption that the Lowest Selling Starch house sells Starch at N145,000 per
tonne while highest sells at approx. N169,000 per tonne. Net profit for lowest selling house is 7% while net profit for higher selling Starch houses is capped at 15%.
With the drop in the value of the naira, a rare and reasonable opportunity has opened up for
Starch manufacturers to increase their profit margins now that imported Starch price may become uncompetitive.
iv. Profit is critical to sustainability
Managing root supply: A key issue is the supply of the roots and the associated need to be close to farmers to work with them and manage their expectation. Many of the cassava-using companies have resulted to working directly with small holder cassava farmers to establish
supply. Cassava processing companies would have collapsed if this level of engagement had not been possible.
34
5.4 Machinery and Equipment
5.4.1 The major equipment for production of Cassava Starch are:- i. Hammer Mill Grater, ii. Starch Extractor,
iii. Sedimentation Tank, iv. Hydraulic Press, v. Granulator,
vi. Flash Dryer, vii. Packaging Machine and viii. Weighing Machine. These can be fabricated at FIIRO. The cost of the equipment with capacity of 4 tonnes of Cassava
Starch per day is N12, 036,060.
5.4.2 Layout of a Small Factory
In such mills the work is performed entirely with simple hand-driven tools. These factories, as a rule, do not produce more than 200 kg wet Starch if run by a family, the daily production is generally not more than 100-120 kg.
A small factory with a daily output of about 200 kg of dry wet Starch functions as follows. Water is drawn off from a brook, dammed up for the purpose, by the channel leading to a waterwheel. The rotation of the wheel is transmitted via the flywheel and a belt to the rasper which is mounted
in the rasping table with seating bench. The roots are peeled and dumped into the basin, where they are washed with clean water from a feed pipe, after which they are transferred to the rasper. The pulp obtained by rasping is transferred to the washing basins, where it is washed thoroughly
with spring water or purified river water. The Starch runs into the settling tanks.
After settling, this is let off through a drain, joining the wash water from the roots and the water from the channel on its way to the river. The moist Starch is conveniently dried near the factory
on racks in the open, and the packing of the crude Starch and other related work are performed in a small shed. The waste pulp is worked up in factories. It is dried in the sun and sold to a bolting factory together with the crude Starch.
5.4.3 Layout of a Medium-Size Factory In these factories the installation of an electromotor or diesel engine of about 20 hp raises the
production capacity to a level of about 5 tons a day, principally on account of more efficient grating or rasping. The other operations also change somewhat in character as compared with the small-mill methods, but they are the same in principle and little skilled labour is needed. The power supply mentioned above is sufficient to drive one mechanical rasper. In many instances,
however, the factory includes a bolting installation, which, in general, is driven alternately with the rasper, and the factory produces an assortment of finished Starch: in this case a somewhat larger power supply (at least 25 hp) is necessary. Factories of this kind are very suitable for rural
areas where unskilled labour is comparatively cheap but technical equipment and skills are difficult to procure.
Both small mills and medium-size factories in general, have to buy their roots from landowners in their neighbourhood. On account of many economic and social factors the supply often lacks stability and continuity. Consequently, the possibility of production
planning is slight, and this is perhaps the most important factor limiting the size and output of such factories. In areas where farmers or farmer organizations have more advanced ideas, where they are commercially minded and combine in rural industrial enterprises to process their own agricultural product, the supply of roots can be organized to the great economic benefit
of all concerned.
Figures 5 shows the main elements of a typical medium-size factory with a capacity of 2-5 tons
of Starch per day. The arrangement and dimensions, given in centimetres, are those recommended by an expert with long practical experience. Figure 5 shows vertical sections of the arrangement through the axis of the rotating screen (above) and perpendicular to this axis
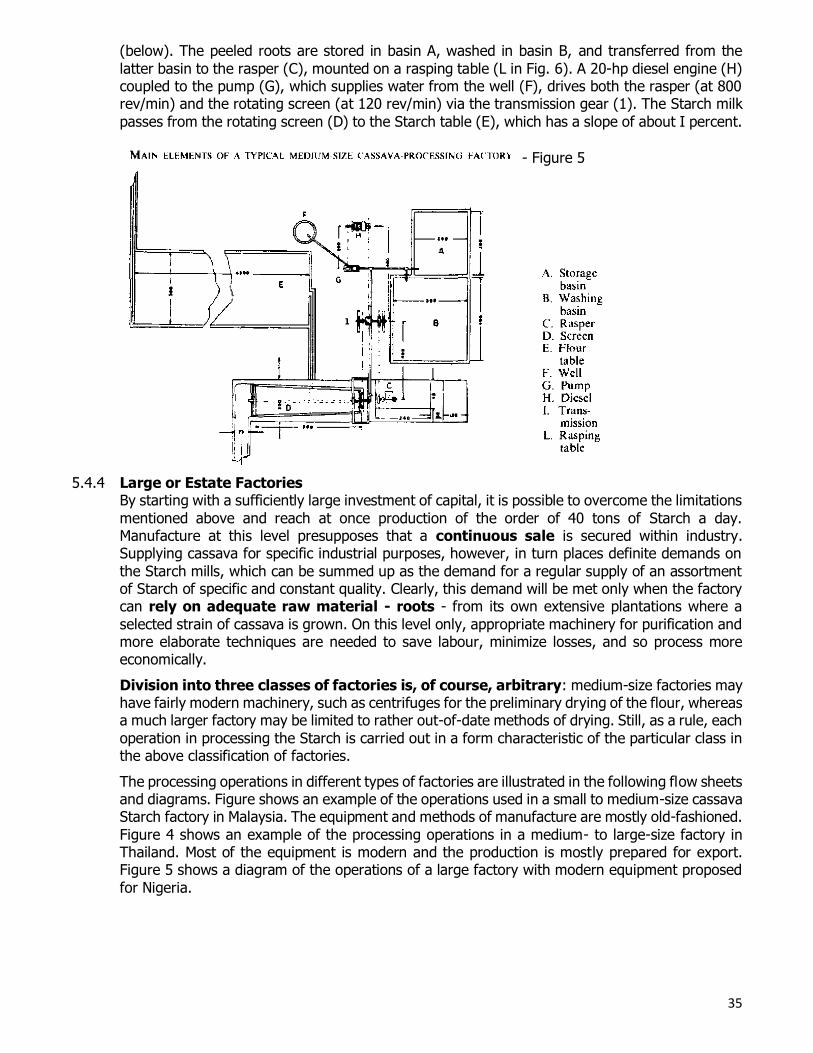
35
(below). The peeled roots are stored in basin A, washed in basin B, and transferred from the
latter basin to the rasper (C), mounted on a rasping table (L in Fig. 6). A 20-hp diesel engine (H) coupled to the pump (G), which supplies water from the well (F), drives both the rasper (at 800 rev/min) and the rotating screen (at 120 rev/min) via the transmission gear (1). The Starch milk
passes from the rotating screen (D) to the Starch table (E), which has a slope of about I percent.
5.4.4 Large or Estate Factories By starting with a sufficiently large investment of capital, it is possible to overcome the limitations
mentioned above and reach at once production of the order of 40 tons of Starch a day. Manufacture at this level presupposes that a continuous sale is secured within industry. Supplying cassava for specific industrial purposes, however, in turn places definite demands on
the Starch mills, which can be summed up as the demand for a regular supply of an assortment of Starch of specific and constant quality. Clearly, this demand will be met only when the factory can rely on adequate raw material - roots - from its own extensive plantations where a
selected strain of cassava is grown. On this level only, appropriate machinery for purification and more elaborate techniques are needed to save labour, minimize losses, and so process more economically.
Division into three classes of factories is, of course, arbitrary: medium-size factories may have fairly modern machinery, such as centrifuges for the preliminary drying of the flour, whereas a much larger factory may be limited to rather out-of-date methods of drying. Still, as a rule, each
operation in processing the Starch is carried out in a form characteristic of the particular class in the above classification of factories.
The processing operations in different types of factories are illustrated in the following flow sheets and diagrams. Figure shows an example of the operations used in a small to medium-size cassava Starch factory in Malaysia. The equipment and methods of manufacture are mostly old-fashioned.
Figure 4 shows an example of the processing operations in a medium- to large-size factory in Thailand. Most of the equipment is modern and the production is mostly prepared for export. Figure 5 shows a diagram of the operations of a large factory with modern equipment proposed
for Nigeria.
- Figure 5
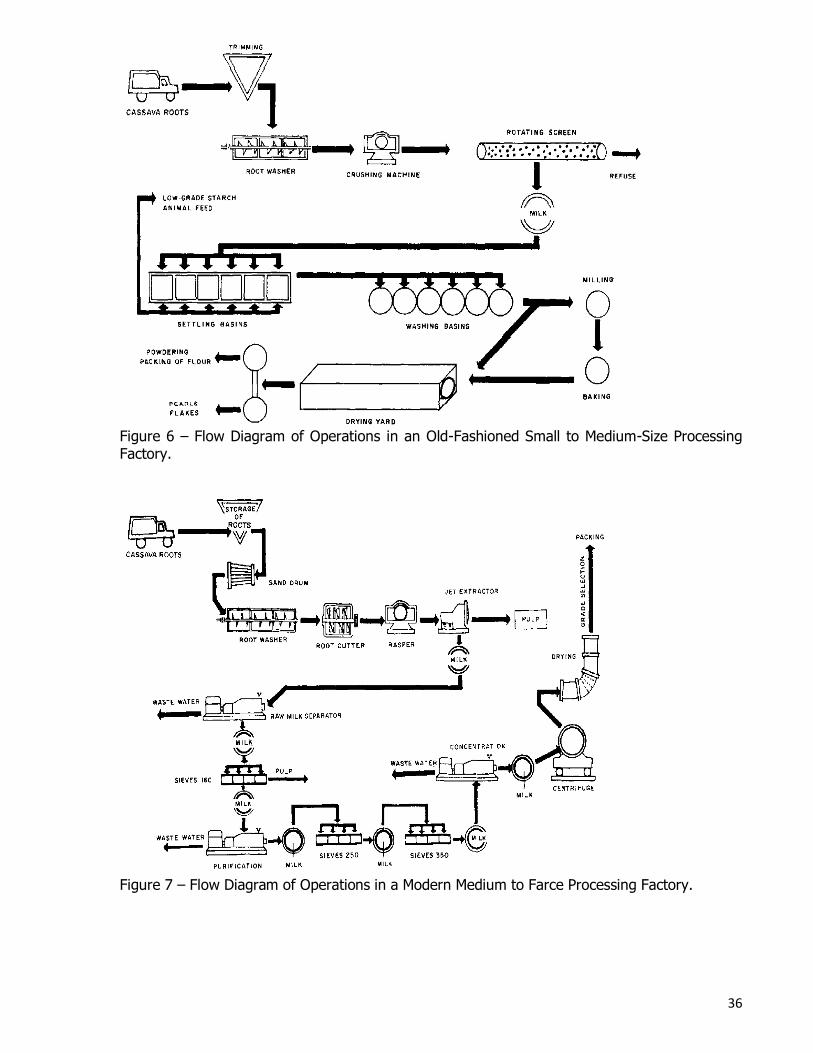
36
Figure 6 – Flow Diagram of Operations in an Old-Fashioned Small to Medium-Size Processing Factory.
Figure 7 – Flow Diagram of Operations in a Modern Medium to Farce Processing Factory.
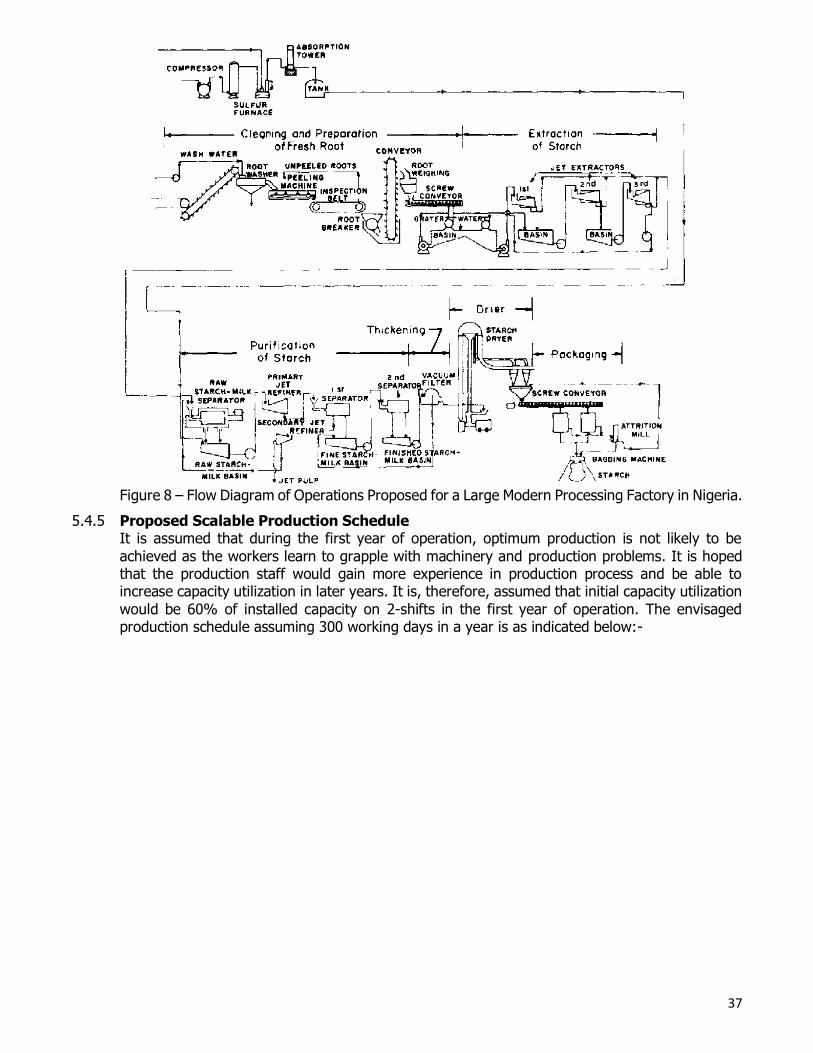
37
Figure 8 – Flow Diagram of Operations Proposed for a Large Modern Processing Factory in Nigeria.
5.4.5 Proposed Scalable Production Schedule It is assumed that during the first year of operation, optimum production is not likely to be
achieved as the workers learn to grapple with machinery and production problems. It is hoped that the production staff would gain more experience in production process and be able to increase capacity utilization in later years. It is, therefore, assumed that initial capacity utilization
would be 60% of installed capacity on 2-shifts in the first year of operation. The envisaged production schedule assuming 300 working days in a year is as indicated below:-
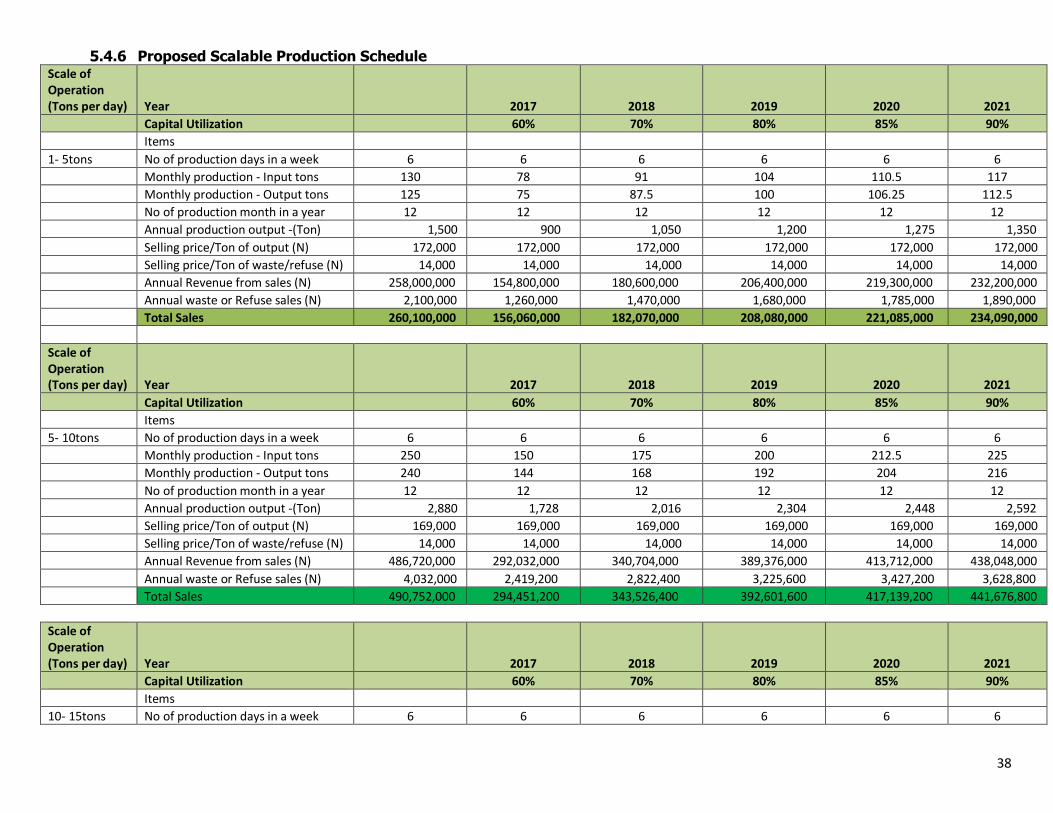
38
5.4.6 Proposed Scalable Production Schedule Scale of Operation (Tons per day) Year 2017 2018 2019 2020 2021
Capital Utilization 60% 70% 80% 85% 90%
Items
1- 5tons No of production days in a week 6 6 6 6 6 6
Monthly production - Input tons 130 78 91 104 110.5 117
Monthly production - Output tons 125 75 87.5 100 106.25 112.5
No of production month in a year 12 12 12 12 12 12
Annual production output -(Ton) 1,500 900 1,050 1,200 1,275 1,350
Selling price/Ton of output (N) 172,000 172,000 172,000 172,000 172,000 172,000
Selling price/Ton of waste/refuse (N) 14,000 14,000 14,000 14,000 14,000 14,000
Annual Revenue from sales (N) 258,000,000 154,800,000 180,600,000 206,400,000 219,300,000 232,200,000
Annual waste or Refuse sales (N) 2,100,000 1,260,000 1,470,000 1,680,000 1,785,000 1,890,000
Total Sales 260,100,000 156,060,000 182,070,000 208,080,000 221,085,000 234,090,000
Scale of Operation (Tons per day) Year 2017 2018 2019 2020 2021
Capital Utilization 60% 70% 80% 85% 90%
Items
5- 10tons No of production days in a week 6 6 6 6 6 6
Monthly production - Input tons 250 150 175 200 212.5 225
Monthly production - Output tons 240 144 168 192 204 216
No of production month in a year 12 12 12 12 12 12
Annual production output -(Ton) 2,880 1,728 2,016 2,304 2,448 2,592
Selling price/Ton of output (N) 169,000 169,000 169,000 169,000 169,000 169,000
Selling price/Ton of waste/refuse (N) 14,000 14,000 14,000 14,000 14,000 14,000
Annual Revenue from sales (N) 486,720,000 292,032,000 340,704,000 389,376,000 413,712,000 438,048,000
Annual waste or Refuse sales (N) 4,032,000 2,419,200 2,822,400 3,225,600 3,427,200 3,628,800
Total Sales 490,752,000 294,451,200 343,526,400 392,601,600 417,139,200 441,676,800
Scale of Operation (Tons per day) Year 2017 2018 2019 2020 2021
Capital Utilization 60% 70% 80% 85% 90%
Items
10- 15tons No of production days in a week 6 6 6 6 6 6
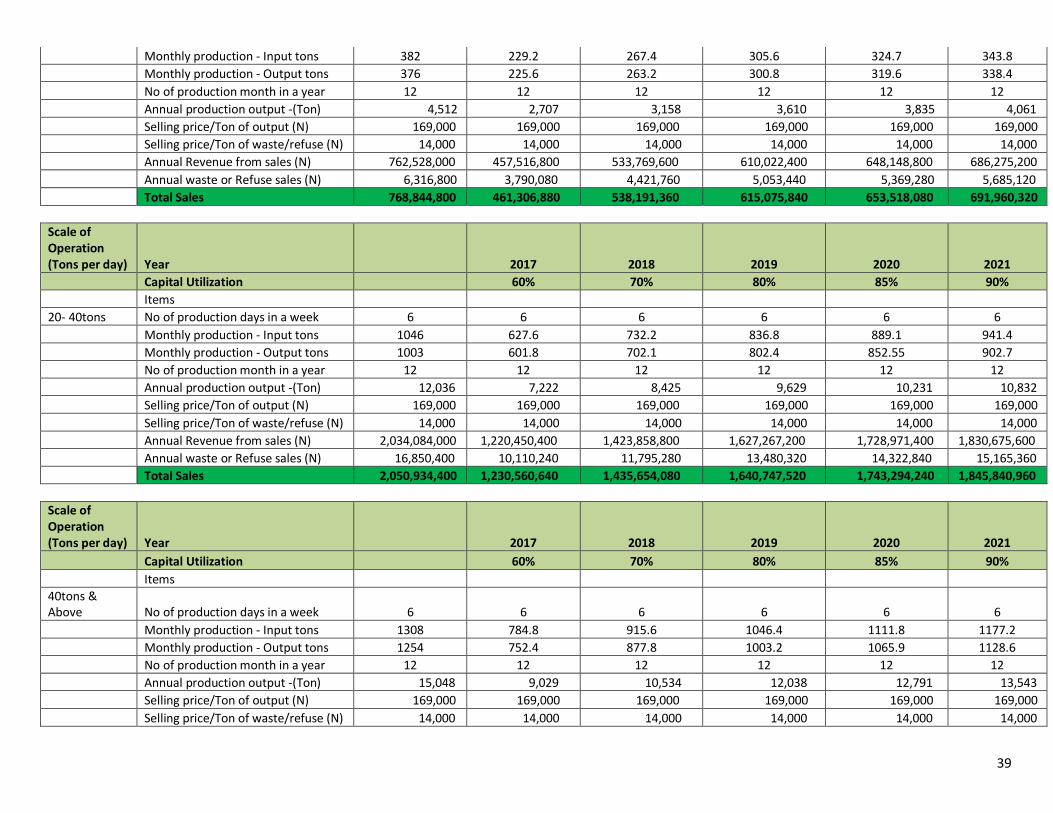
39
Monthly production - Input tons 382 229.2 267.4 305.6 324.7 343.8
Monthly production - Output tons 376 225.6 263.2 300.8 319.6 338.4
No of production month in a year 12 12 12 12 12 12
Annual production output -(Ton) 4,512 2,707 3,158 3,610 3,835 4,061
Selling price/Ton of output (N) 169,000 169,000 169,000 169,000 169,000 169,000
Selling price/Ton of waste/refuse (N) 14,000 14,000 14,000 14,000 14,000 14,000
Annual Revenue from sales (N) 762,528,000 457,516,800 533,769,600 610,022,400 648,148,800 686,275,200
Annual waste or Refuse sales (N) 6,316,800 3,790,080 4,421,760 5,053,440 5,369,280 5,685,120
Total Sales 768,844,800 461,306,880 538,191,360 615,075,840 653,518,080 691,960,320
Scale of Operation (Tons per day) Year 2017 2018 2019 2020 2021
Capital Utilization 60% 70% 80% 85% 90%
Items
20- 40tons No of production days in a week 6 6 6 6 6 6
Monthly production - Input tons 1046 627.6 732.2 836.8 889.1 941.4
Monthly production - Output tons 1003 601.8 702.1 802.4 852.55 902.7
No of production month in a year 12 12 12 12 12 12
Annual production output -(Ton) 12,036 7,222 8,425 9,629 10,231 10,832
Selling price/Ton of output (N) 169,000 169,000 169,000 169,000 169,000 169,000
Selling price/Ton of waste/refuse (N) 14,000 14,000 14,000 14,000 14,000 14,000
Annual Revenue from sales (N) 2,034,084,000 1,220,450,400 1,423,858,800 1,627,267,200 1,728,971,400 1,830,675,600
Annual waste or Refuse sales (N) 16,850,400 10,110,240 11,795,280 13,480,320 14,322,840 15,165,360
Total Sales 2,050,934,400 1,230,560,640 1,435,654,080 1,640,747,520 1,743,294,240 1,845,840,960
Scale of Operation (Tons per day) Year 2017 2018 2019 2020 2021
Capital Utilization 60% 70% 80% 85% 90%
Items
40tons & Above No of production days in a week 6 6 6 6 6 6
Monthly production - Input tons 1308 784.8 915.6 1046.4 1111.8 1177.2
Monthly production - Output tons 1254 752.4 877.8 1003.2 1065.9 1128.6
No of production month in a year 12 12 12 12 12 12
Annual production output -(Ton) 15,048 9,029 10,534 12,038 12,791 13,543
Selling price/Ton of output (N) 169,000 169,000 169,000 169,000 169,000 169,000
Selling price/Ton of waste/refuse (N) 14,000 14,000 14,000 14,000 14,000 14,000
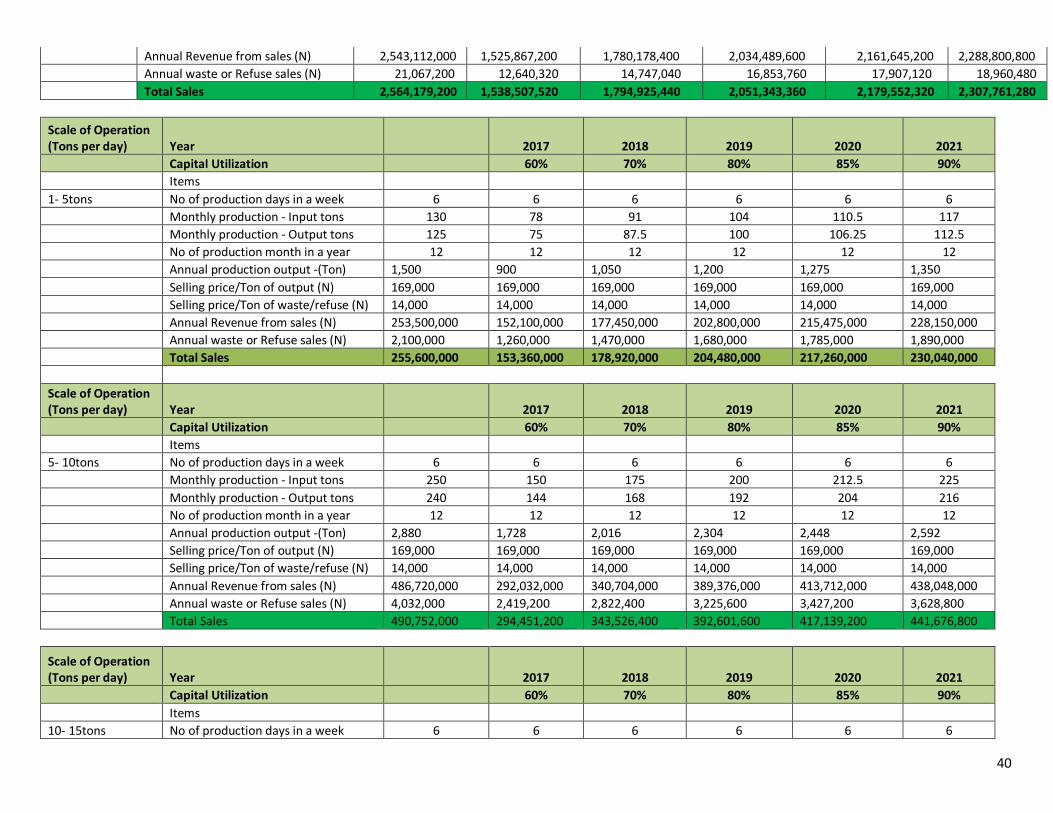
40
Annual Revenue from sales (N) 2,543,112,000 1,525,867,200 1,780,178,400 2,034,489,600 2,161,645,200 2,288,800,800
Annual waste or Refuse sales (N) 21,067,200 12,640,320 14,747,040 16,853,760 17,907,120 18,960,480
Total Sales 2,564,179,200 1,538,507,520 1,794,925,440 2,051,343,360 2,179,552,320 2,307,761,280
Scale of Operation (Tons per day) Year 2017 2018 2019 2020 2021
Capital Utilization 60% 70% 80% 85% 90%
Items
1- 5tons No of production days in a week 6 6 6 6 6 6
Monthly production - Input tons 130 78 91 104 110.5 117
Monthly production - Output tons 125 75 87.5 100 106.25 112.5
No of production month in a year 12 12 12 12 12 12
Annual production output -(Ton) 1,500 900 1,050 1,200 1,275 1,350
Selling price/Ton of output (N) 169,000 169,000 169,000 169,000 169,000 169,000
Selling price/Ton of waste/refuse (N) 14,000 14,000 14,000 14,000 14,000 14,000
Annual Revenue from sales (N) 253,500,000 152,100,000 177,450,000 202,800,000 215,475,000 228,150,000
Annual waste or Refuse sales (N) 2,100,000 1,260,000 1,470,000 1,680,000 1,785,000 1,890,000
Total Sales 255,600,000 153,360,000 178,920,000 204,480,000 217,260,000 230,040,000
Scale of Operation (Tons per day) Year 2017 2018 2019 2020 2021
Capital Utilization 60% 70% 80% 85% 90%
Items
5- 10tons No of production days in a week 6 6 6 6 6 6
Monthly production - Input tons 250 150 175 200 212.5 225
Monthly production - Output tons 240 144 168 192 204 216
No of production month in a year 12 12 12 12 12 12
Annual production output -(Ton) 2,880 1,728 2,016 2,304 2,448 2,592
Selling price/Ton of output (N) 169,000 169,000 169,000 169,000 169,000 169,000
Selling price/Ton of waste/refuse (N) 14,000 14,000 14,000 14,000 14,000 14,000
Annual Revenue from sales (N) 486,720,000 292,032,000 340,704,000 389,376,000 413,712,000 438,048,000
Annual waste or Refuse sales (N) 4,032,000 2,419,200 2,822,400 3,225,600 3,427,200 3,628,800
Total Sales 490,752,000 294,451,200 343,526,400 392,601,600 417,139,200 441,676,800
Scale of Operation (Tons per day) Year 2017 2018 2019 2020 2021
Capital Utilization 60% 70% 80% 85% 90%
Items
10- 15tons No of production days in a week 6 6 6 6 6 6
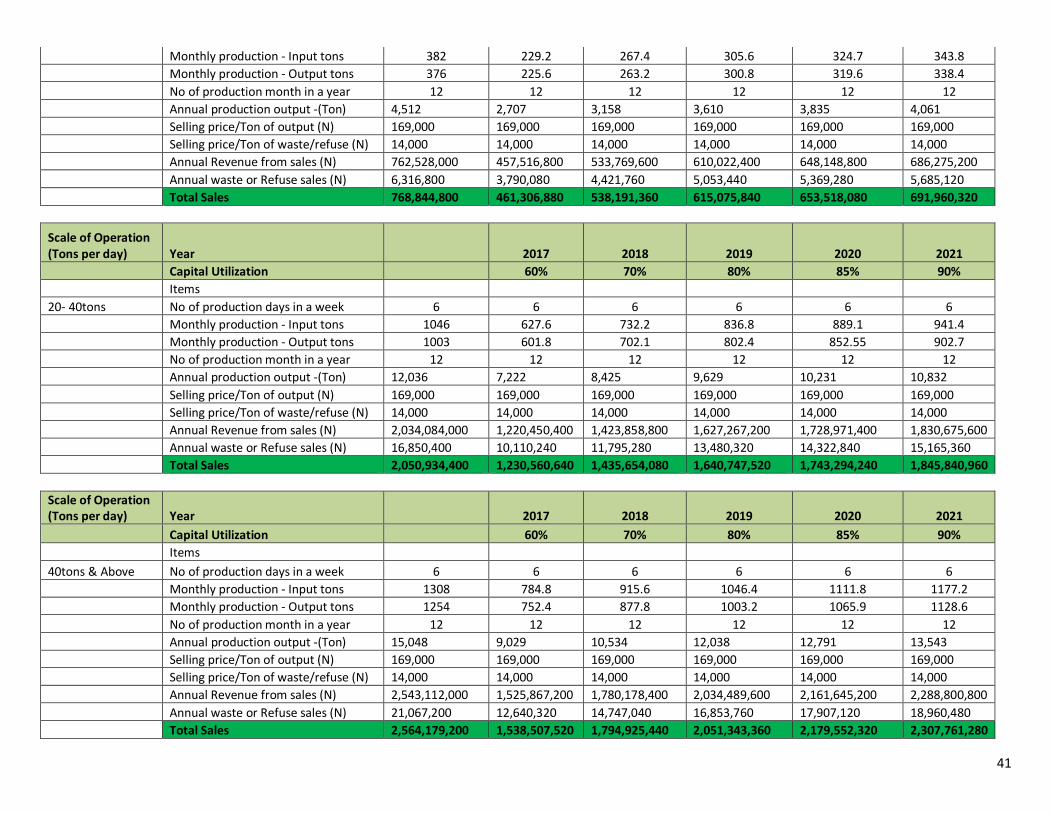
41
Monthly production - Input tons 382 229.2 267.4 305.6 324.7 343.8
Monthly production - Output tons 376 225.6 263.2 300.8 319.6 338.4
No of production month in a year 12 12 12 12 12 12
Annual production output -(Ton) 4,512 2,707 3,158 3,610 3,835 4,061
Selling price/Ton of output (N) 169,000 169,000 169,000 169,000 169,000 169,000
Selling price/Ton of waste/refuse (N) 14,000 14,000 14,000 14,000 14,000 14,000
Annual Revenue from sales (N) 762,528,000 457,516,800 533,769,600 610,022,400 648,148,800 686,275,200
Annual waste or Refuse sales (N) 6,316,800 3,790,080 4,421,760 5,053,440 5,369,280 5,685,120
Total Sales 768,844,800 461,306,880 538,191,360 615,075,840 653,518,080 691,960,320
Scale of Operation (Tons per day) Year 2017 2018 2019 2020 2021
Capital Utilization 60% 70% 80% 85% 90%
Items
20- 40tons No of production days in a week 6 6 6 6 6 6
Monthly production - Input tons 1046 627.6 732.2 836.8 889.1 941.4
Monthly production - Output tons 1003 601.8 702.1 802.4 852.55 902.7
No of production month in a year 12 12 12 12 12 12
Annual production output -(Ton) 12,036 7,222 8,425 9,629 10,231 10,832
Selling price/Ton of output (N) 169,000 169,000 169,000 169,000 169,000 169,000
Selling price/Ton of waste/refuse (N) 14,000 14,000 14,000 14,000 14,000 14,000
Annual Revenue from sales (N) 2,034,084,000 1,220,450,400 1,423,858,800 1,627,267,200 1,728,971,400 1,830,675,600
Annual waste or Refuse sales (N) 16,850,400 10,110,240 11,795,280 13,480,320 14,322,840 15,165,360
Total Sales 2,050,934,400 1,230,560,640 1,435,654,080 1,640,747,520 1,743,294,240 1,845,840,960
Scale of Operation (Tons per day) Year 2017 2018 2019 2020 2021
Capital Utilization 60% 70% 80% 85% 90%
Items
40tons & Above No of production days in a week 6 6 6 6 6 6
Monthly production - Input tons 1308 784.8 915.6 1046.4 1111.8 1177.2
Monthly production - Output tons 1254 752.4 877.8 1003.2 1065.9 1128.6
No of production month in a year 12 12 12 12 12 12
Annual production output -(Ton) 15,048 9,029 10,534 12,038 12,791 13,543
Selling price/Ton of output (N) 169,000 169,000 169,000 169,000 169,000 169,000
Selling price/Ton of waste/refuse (N) 14,000 14,000 14,000 14,000 14,000 14,000
Annual Revenue from sales (N) 2,543,112,000 1,525,867,200 1,780,178,400 2,034,489,600 2,161,645,200 2,288,800,800
Annual waste or Refuse sales (N) 21,067,200 12,640,320 14,747,040 16,853,760 17,907,120 18,960,480
Total Sales 2,564,179,200 1,538,507,520 1,794,925,440 2,051,343,360 2,179,552,320 2,307,761,280
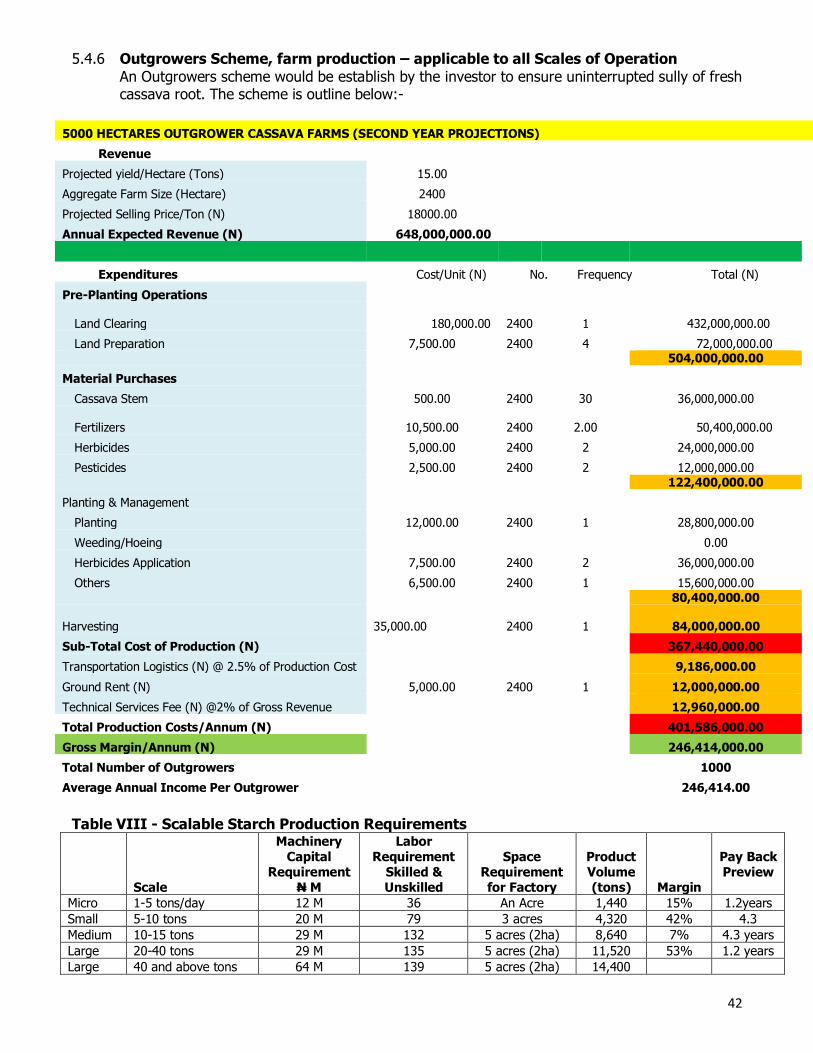
42
5.4.6 Outgrowers Scheme, farm production – applicable to all Scales of Operation
An Outgrowers scheme would be establish by the investor to ensure uninterrupted sully of fresh cassava root. The scheme is outline below:-
5000 HECTARES OUTGROWER CASSAVA FARMS (SECOND YEAR PROJECTIONS)
Revenue
Projected yield/Hectare (Tons) 15.00
Aggregate Farm Size (Hectare) 2400
Projected Selling Price/Ton (N) 18000.00
Annual Expected Revenue (N) 648,000,000.00
Expenditures Cost/Unit (N) No. Frequency Total (N)
Pre-Planting Operations
Land Clearing
180,000.00 2400 1 432,000,000.00
Land Preparation 7,500.00 2400 4 72,000,000.00 504,000,000.00
Material Purchases
Cassava Stem 500.00 2400 30 36,000,000.00
Fertilizers
10,500.00 2400
2.00 50,400,000.00
Herbicides 5,000.00 2400 2 24,000,000.00
Pesticides 2,500.00 2400 2 12,000,000.00 122,400,000.00
Planting & Management
Planting 12,000.00 2400 1 28,800,000.00
Weeding/Hoeing 0.00
Herbicides Application 7,500.00 2400 2 36,000,000.00
Others 6,500.00 2400 1 15,600,000.00 80,400,000.00
Harvesting 35,000.00 2400 1 84,000,000.00
Sub-Total Cost of Production (N) 367,440,000.00
Transportation Logistics (N) @ 2.5% of Production Cost 9,186,000.00
Ground Rent (N) 5,000.00 2400 1 12,000,000.00
Technical Services Fee (N) @2% of Gross Revenue 12,960,000.00
Total Production Costs/Annum (N) 401,586,000.00
Gross Margin/Annum (N) 246,414,000.00
Total Number of Outgrowers 1000
Average Annual Income Per Outgrower 246,414.00
Table VIII - Scalable Starch Production Requirements
Scale
Machinery Capital
Requirement N M
Labor Requirement
Skilled & Unskilled
Space
Requirement for Factory
Product Volume (tons)
Margin
Pay Back Preview
Micro 1-5 tons/day 12 M 36 An Acre 1,440 15% 1.2years
Small 5-10 tons 20 M 79 3 acres 4,320 42% 4.3
Medium 10-15 tons 29 M 132 5 acres (2ha) 8,640 7% 4.3 years
Large 20-40 tons 29 M 135 5 acres (2ha) 11,520 53% 1.2 years
Large 40 and above tons 64 M 139 5 acres (2ha) 14,400
43
5.5 Quality Control/Good Manufacturing Practices
5.5.1 Quality is the fitness of a product for use by consumers. The nutritional, sensory, safety, convenience, aesthetic and health values of Starch must be maintained for all customers - industrial as well as individual users.
Evolution of quality management The management of quality has gone through distinct phases – from being a purely inspection-based control system through assurance to Total quality management. The observed
inefficiencies at each phase led to the evolvement of the next phase. The identifiable phases of the evolution process are:- Quality Inspection
Quality Control Quality Assurance Total Quality Management
Under quality inspection, inspection of goods and services—to make sure that what’s being produced is meeting all expectations—takes place at the end of the operations or process. Under such a system, one or more characteristics of a product are examined, measured or tested and
compared with specified requirements to assess its conformity. Products which do not conform to specification may be scrapped, reworked or sold as lower quality items. The limitation of this system is that it fails to address root causes because it is an after-the-fact screening process with
virtually no prevention content. In quality inspection the problem is addressed after it has occurred.
5.5.2 This limitation led to the emergence of the second phase of quality management which is quality
control. Under a system of quality control, product testing and documentation control became ways to ensure greater process control and increased conformity. Typical characteristics of such systems were performance data collection, feedback to earlier stages in the process and self-
inspection. Quality assurance came with a shift from product quality to system quality. Here an organization sets up a system for controlling what is being done and the system is audited to ensure it is adequate both in design and use. A major part of this shift is the use of both second
party and third party audits to assess the efficiency of the system. The major characteristics are the use of quality manuals, procedures, work instructions, quality planning, audits etc. The fundamental difference is that quality assurance is prevention-based while quality control is
inspection-based.
Total quality management is the highest level of quality management. In addition to all aspects of quality assurance, it involves the application of quality management principles to all aspects of
the business. Total quality management requires that principles of quality management be applied in every branch and at every level in an organization. Typical of an organization going through a total quality process there would be a clear unambiguous vision, reduced
interdepartmental barriers, more time spent on training, excellent supply system and customer relations, and realization that quality is not just product quality but also the quality of the whole organization, including sales, finance, personnel and other non-
manufacturing functions (Zhang, 1997).
5.5.3 Hazard/Quality analysis critical control point (HACCP/QACCP) system
The Hazard analysis critical control point (HACCP) system is concerned and deals primarily with controlling and ensuring the safety of food products. It is a scientific and systematic approach to identifying hazards and providing measures for their control to guarantee food safety. It involves monitoring and controlling of materials, and processes that could lead to a compromise in the
safety of the final food products. However, from the standpoints of food manufacturers and consumers, the quality of food is as important as the safety. In spite of the fact that food quality systems are often complicated and expensive to implement, food manufacturers implement them
as a matter of priority to produce products that meet the minimum quality standards and in compliance with the food and drug regulations of the countries where the products are to be
44
consumed. Quality Analysis and Critical Control Point (QACCP) system which employs simple but
well planned techniques was developed to address both the quality as well as the safety of food products during processing. The HACCP/QACCP system therefore falls under Quality Assurance as well and can be applied during production of Starch.
The application of QACCP system to Starch production thus ensures control of input materials and processing procedures to produce high quality cassava flour that meets the predefined quality characteristics. This control may, very well include for example, control of cassava cultivar to
indirectly ensure chemical safety through low cyanide content of the final product.
To ensure effectiveness of the quality systems, it is often important to implement some prerequisite quality programs in Starch production before HACCP/QACCP. Two of such
prerequisite programs are Good Manufacturing Practice (GMP) and general principles of Food Hygiene or Good Hygiene Practice (GHP). Even though HACCP/QACCP can be simplified to a level where it can be easily implemented by SMEs using techniques such as measurement of pH with
pH paper, timing of operations, physical observation and inspections, etc, it often still involves extensive documentation and laboratory analysis of samples for verification.
5.5.4 HACCP-like system To simplify the system further for ease of implementation by SMEs, the HACCP/QACCP systems for producing high quality cassava Starch may be implemented without the 6th and 7th principles of HACCP, i.e. with no rigorous record-keeping nor verification schemes. However, emphasis
should be placed on identifying hazards and their critical control points, establishing critical limits for preventive measures and a monitoring procedure (Forsythe and Hayes, 1998).
5.5.5 HACCP/QACCP team Every SME involved in the production of Starch should have a HACCP/QACCP team in place to carry out the HACCP/QACCP implementation and monitoring as well as taking corrective actions
when necessary. The team should have the appropriate knowledge of Starch production and expertise. It should normally consist of:-
An external technical and independent advisor on HACCP/QACCP
Operations or Production Manager Quality Assurance Manager An Agronomist
Engineer, Equipment or Machinery Technician Marketing/Distribution Manager Supporting Junior Staff
This multidisciplinary team should be given strong support by top management and should have very firm commitment to the application and funding of the HACCP/QACCP application. The team should meet regularly (possibly once every month) to review performance of the quality mandate
and maintain the consciousness of the entire workforce to quality and safety.
5.5.6 Walls, floors, windows and roofs
Brooms and brushes must be used to scrub and clean walls and floor, and dirt hosed away down drains. High-pressure jets must be used for relatively inaccessible spots covered with tenacious soil which cannot be dealt with by a brush. This type of cleaning should be done often for wet processing areas of cassava such as the peeling, grating, and de-watering or pressing areas.
Smooth floors may be dried using rubber squeegees. Rubber strips of squeegees must be pressed in close contact with floor by pressure on the handle and pushed along floor. Walls and floors must be mechanically scrubbed with detergent solution, rinsed and dried.
For warehouse and storage room floors however, vacuum cleaning of floor must be done to remove dust or spilled dried materials. Appropriate vacuum cleaning attachments (or other
alternative means) must be used to clean roof girders and collect dust. Roof girders must be cleaned before floors. Order of cleaning must be planned so that dirt is washed down onto a surface to be cleaned and not one that has already been cleaned. The floor should be the last to
45
be cleaned. Scrubbing and mopping of floors, cleaning of window and window screens must be
done using clean water or vacuum cleaning.
5.5.7 Don’ts of Sanitation Management Programme Do not clean any machine (chippers, grater, press, mechanical dryer, mill, sifter or screen)
when it is in operation, unless if required as part of cleaning procedure Do to allow water to enter electrical parts of machines. Do not clean machines until the electrical switches are in ‘off’ position.
Remember to apply grease or the appropriate lubricants immediately after greasy areas are cleaned.
5.5.8 Water Supply and Water Quality Management
Water supply management The following water supply sources are recommended in decreasing order of preference for processing:-
Potable pipe-borne water Water from a bore hole Water from a dug-out well, and
Harvested rain water
Potable pipe-borne water should be the first choice of water for processing cassava into Starch. In the absence of pipe-borne water, water from a bore-hole should be the next choice.
Water from a running river source may be used in the absence of all the above options but must be handled with great caution and subjected to very rigorous treatment before use. With the
exception of pipe-borne water, water from all other sources should preferably be subjected to chlorination and filtration before use especially if there is suspicion of some form of contamination. Other recommended treatments (if affordable) include:-
Deodorization by passage through a carbon column Sterilization by passage through a U-V sterilizer
Water from a running river source should be subjected to all the above treatments before use.
When it becomes necessary to treat the water before use expert advice must be sought before the recommended treatments are carried out.
Adequate systems should be installed to ensure that water supplied for processing is clean and
safe. A regular inspection (preferably weekly) of the water supply system should be carried out to ensure water availability in quantities required for all processing, cleaning, washing and sanitation activities scheduled for each week.
5.5.9 Water Quality Management Water quality is determined by assessing the microbiological, chemical and physical
characteristics. Biological characteristics refer to the number and types of microorganisms present. Chemical characteristics include pH, alkalinity, hardness, nitrates, nitrites, ammonia, phosphates, dissolved oxygen, biochemical oxygen demand, conductivity and density. Physical
characteristics include the odor, color, presence of particulate matter and taste.
For the purposes of processing cassava into Starch, the biological quality of water is very important. The parameters of utmost importance and which should be assessed include presence
of pathogens, coliforms, total plate count, yeast and mould counts. In addition, selected parameters like odor, pH, conductivity and density from the physical and chemical attributes could give useful indications of the physical presence of pollutants in the water and should be assessed.
Selected water quality specifications that should guide the quality control manager in ensuring that the quality of water provided for processing is acceptable and safe. Samples of water should be taken at source and at delivery points and assessed:-
Daily for the physical and chemical attributes, and Weekly (or upon strong suspicion of contamination or pollution) for microbiological attributes.
46
5.5.10 Management and Control of Rodents, Insects (Fruit Flies, Cockroaches, Bees, House
Flies etc.), Birds, Reptiles, And Domestic Animals. Rodents A member of staff must be responsible for monitoring the processing plant for rodents and the
assignment should include baiting and recommendations on repairs that are necessary to keep out rodents. Access to food by rodents must be completely avoided. Small cracks may allow rodents to enter. Therefore, cracks and holes once observed must be sealed or filled
appropriately. Containers for storing food must be rodent proof. Traps with baits must be placed along rodent pathways. Anticoagulant rodenticides may be used to kill rodents.
Insects (fruit flies, cockroaches, house flies, etc.)
Regular spraying of environment with insecticides and the use of screen netting must be ensured to eliminate insects. Insecticides must not be used on production floor during production and must not be sprayed directly over food contact surfaces and equipment surfaces in direct contact
with food. Dark cabinets and drawers must be regularly checked for eggs of cockroaches, thoroughly cleaned and sprayed with insecticides.
It has been found that bees are attracted to cassava grits and chips during sun drying.
Therefore special consideration needs to be given to preventing bees from contaminating the materials during sun drying on open platforms or on concrete surfaces. Beehives close to drying areas should be identified and carefully removed.
Birds, reptiles and domestic animals These must be continuously monitored and eliminated by appropriate means to avoid product contamination especially during drying of pulverized cake in the open.
5.5.11 Environmental Impact Although no hazardous chemical is used during Starch production, the peels of fresh cassava and
effluent from washing and pressing operations; noise and soot from cassava graters, chippers, electricity generators, mechanical dryers, mills and sifters constitute nuisance to the processing environment. In addition, some types of sifters, screeners and milling machines, particularly those
without or with ineffective cyclone separators cause air pollution due to escape of cassava dust during processing.
Of all these, the accumulation of effluent and peels normally containing the cyanogen’s -
linamarin, cyanohydrins and hydrogen cyanide, removed from cassava roots during processing is the most serious in terms of its negative impact on the environment, the health of the processors and rural people, particularly Women and children. Run-off from cassava processing plants if not
adequately treated can cause pollution and damages to the ecosystems along its path, nearby streams, rivers and underground water. The cumulative effect of these may include accumulation of cyanogens in community drinking water and loss of aquatic lives,
which may further expose the community to cyanide toxicity through drinking of underground water or eating of fish and other foods from nearby rivers.
It is important for all cassava processors to device adequate measures to minimize or eliminate
the dangers posed by the pollutants and toxins released during processing of cassava. Adequate monitoring scheme such as regular environmental impact assessment by qualified personnel or institution in addition to regular hospital surveillance reports should be implemented to ensure
that the measures put in place are working.
5.6 Waste Disposal 5.6.1 Wastes are typically generated during the processing of agricultural feedstocks to products.
Cassava processing to Starch generates liquid effluents (whey), solids (mostly peelings and sieviates) and gaseous emissions. Cassava processing to Starch is dominated by the smallholders, which are also referred to as micro, small and medium scale enterprises (MSME). Knipscheer et
al. (2007) estimated that the smallholders produce and process over 80% of Nigerian cassava.
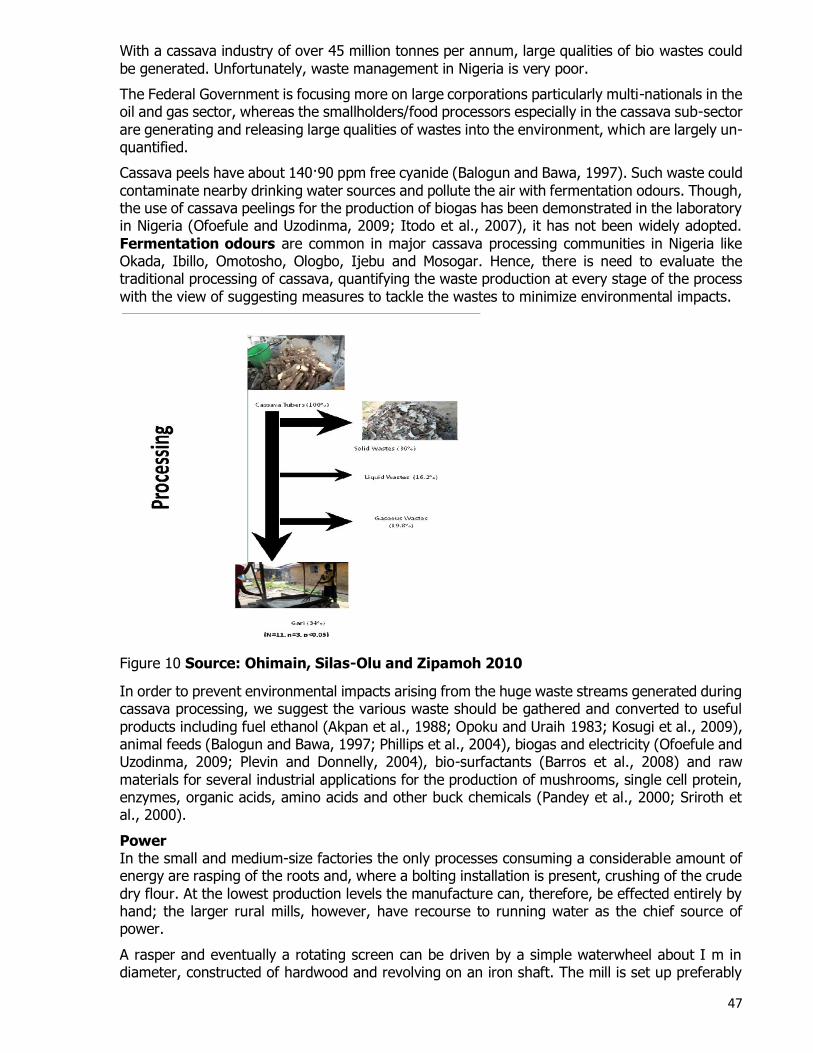
47
With a cassava industry of over 45 million tonnes per annum, large qualities of bio wastes could
be generated. Unfortunately, waste management in Nigeria is very poor.
The Federal Government is focusing more on large corporations particularly multi-nationals in the oil and gas sector, whereas the smallholders/food processors especially in the cassava sub-sector
are generating and releasing large qualities of wastes into the environment, which are largely un-quantified.
Cassava peels have about 140·90 ppm free cyanide (Balogun and Bawa, 1997). Such waste could
contaminate nearby drinking water sources and pollute the air with fermentation odours. Though, the use of cassava peelings for the production of biogas has been demonstrated in the laboratory in Nigeria (Ofoefule and Uzodinma, 2009; Itodo et al., 2007), it has not been widely adopted.
Fermentation odours are common in major cassava processing communities in Nigeria like Okada, Ibillo, Omotosho, Ologbo, Ijebu and Mosogar. Hence, there is need to evaluate the traditional processing of cassava, quantifying the waste production at every stage of the process
with the view of suggesting measures to tackle the wastes to minimize environmental impacts.
Figure 10 Source: Ohimain, Silas-Olu and Zipamoh 2010
In order to prevent environmental impacts arising from the huge waste streams generated during cassava processing, we suggest the various waste should be gathered and converted to useful
products including fuel ethanol (Akpan et al., 1988; Opoku and Uraih 1983; Kosugi et al., 2009), animal feeds (Balogun and Bawa, 1997; Phillips et al., 2004), biogas and electricity (Ofoefule and Uzodinma, 2009; Plevin and Donnelly, 2004), bio-surfactants (Barros et al., 2008) and raw
materials for several industrial applications for the production of mushrooms, single cell protein, enzymes, organic acids, amino acids and other buck chemicals (Pandey et al., 2000; Sriroth et al., 2000).
Power In the small and medium-size factories the only processes consuming a considerable amount of energy are rasping of the roots and, where a bolting installation is present, crushing of the crude
dry flour. At the lowest production levels the manufacture can, therefore, be effected entirely by hand; the larger rural mills, however, have recourse to running water as the chief source of power.
A rasper and eventually a rotating screen can be driven by a simple waterwheel about I m in diameter, constructed of hardwood and revolving on an iron shaft. The mill is set up preferably

48
near a riverside or brook. At some point upstream, water is led off into a channel of suitable size.
The amount of water running in the channel before reaching the waterwheel is regulated by the operation of lock gates.
Above a certain production level, depending on various factors, the energy consumed by the
rasper, rotating screen, disintegrators (in bolting installations) and accessory equipment (such as pumps) is such that it is more advantageous to employ a diesel engine or an electric motor. In modern factories located near cities, power for industrial purposes can usually be purchased from
the local power station at reduced rates. In medium factories, a small stand-by engine generator is recommended for use in the event of power failure and large industrial generators in large scale factories.
49
MARKET STUDY
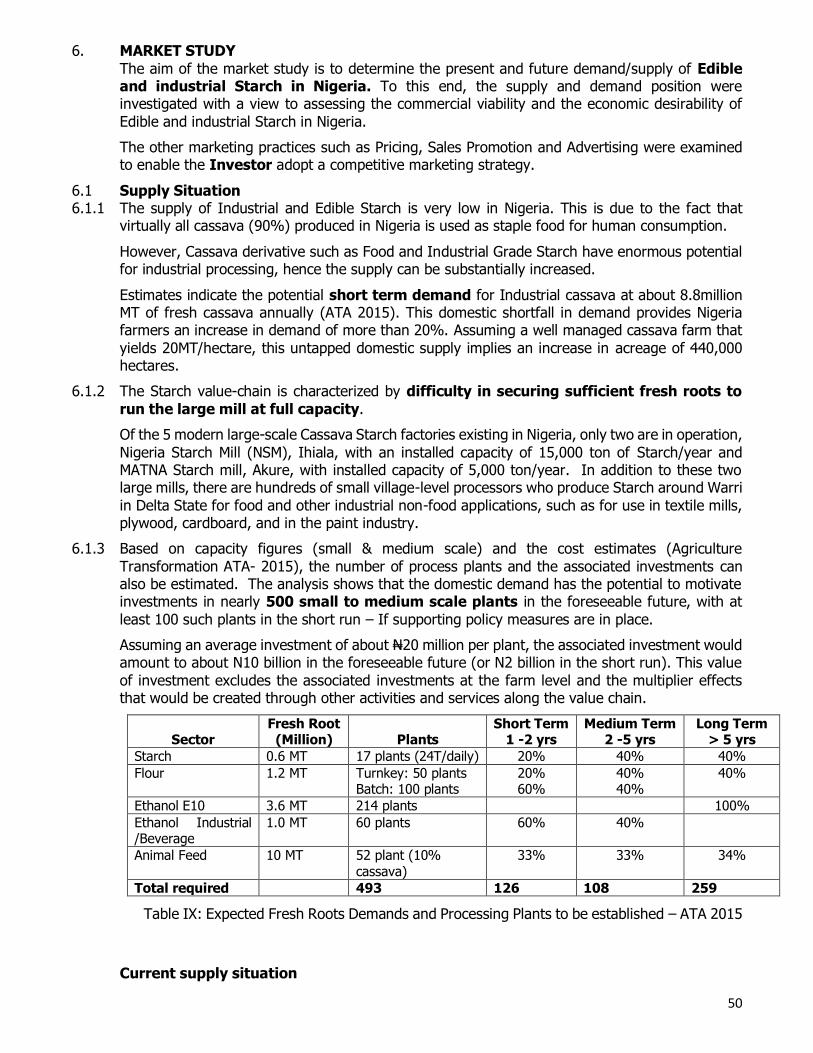
50
6. MARKET STUDY
The aim of the market study is to determine the present and future demand/supply of Edible and industrial Starch in Nigeria. To this end, the supply and demand position were investigated with a view to assessing the commercial viability and the economic desirability of
Edible and industrial Starch in Nigeria.
The other marketing practices such as Pricing, Sales Promotion and Advertising were examined to enable the Investor adopt a competitive marketing strategy.
6.1 Supply Situation 6.1.1 The supply of Industrial and Edible Starch is very low in Nigeria. This is due to the fact that
virtually all cassava (90%) produced in Nigeria is used as staple food for human consumption.
However, Cassava derivative such as Food and Industrial Grade Starch have enormous potential for industrial processing, hence the supply can be substantially increased.
Estimates indicate the potential short term demand for Industrial cassava at about 8.8million MT of fresh cassava annually (ATA 2015). This domestic shortfall in demand provides Nigeria farmers an increase in demand of more than 20%. Assuming a well managed cassava farm that
yields 20MT/hectare, this untapped domestic supply implies an increase in acreage of 440,000 hectares.
6.1.2 The Starch value-chain is characterized by difficulty in securing sufficient fresh roots to
run the large mill at full capacity.
Of the 5 modern large-scale Cassava Starch factories existing in Nigeria, only two are in operation,
Nigeria Starch Mill (NSM), Ihiala, with an installed capacity of 15,000 ton of Starch/year and MATNA Starch mill, Akure, with installed capacity of 5,000 ton/year. In addition to these two large mills, there are hundreds of small village-level processors who produce Starch around Warri
in Delta State for food and other industrial non-food applications, such as for use in textile mills, plywood, cardboard, and in the paint industry.
6.1.3 Based on capacity figures (small & medium scale) and the cost estimates (Agriculture
Transformation ATA- 2015), the number of process plants and the associated investments can also be estimated. The analysis shows that the domestic demand has the potential to motivate investments in nearly 500 small to medium scale plants in the foreseeable future, with at
least 100 such plants in the short run – If supporting policy measures are in place.
Assuming an average investment of about N20 million per plant, the associated investment would amount to about N10 billion in the foreseeable future (or N2 billion in the short run). This value
of investment excludes the associated investments at the farm level and the multiplier effects that would be created through other activities and services along the value chain.
Sector
Fresh Root (Million)
Plants
Short Term 1 -2 yrs
Medium Term 2 -5 yrs
Long Term > 5 yrs
Starch 0.6 MT 17 plants (24T/daily) 20% 40% 40%
Flour 1.2 MT Turnkey: 50 plants Batch: 100 plants
20% 60%
40% 40%
40%
Ethanol E10 3.6 MT 214 plants 100%
Ethanol Industrial /Beverage
1.0 MT 60 plants 60% 40%
Animal Feed 10 MT 52 plant (10% cassava)
33% 33% 34%
Total required 493 126 108 259
Table IX: Expected Fresh Roots Demands and Processing Plants to be established – ATA 2015
Current supply situation
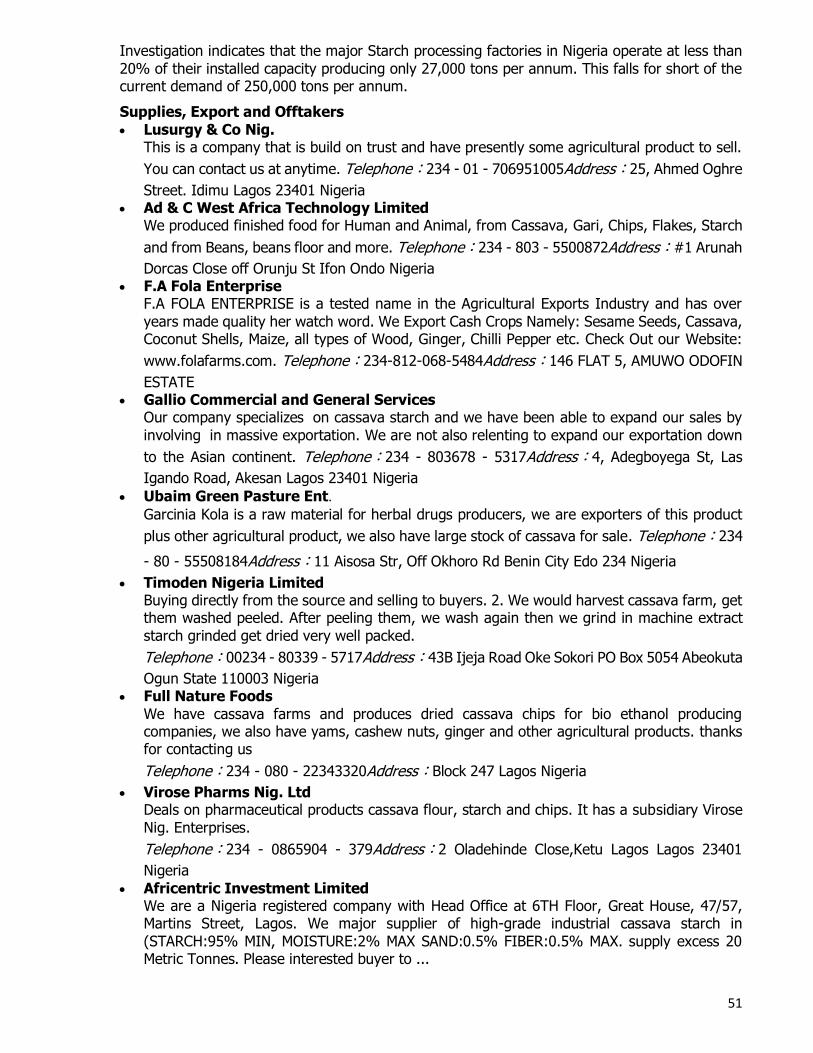
51
Investigation indicates that the major Starch processing factories in Nigeria operate at less than
20% of their installed capacity producing only 27,000 tons per annum. This falls for short of the current demand of 250,000 tons per annum.
Supplies, Export and Offtakers
Lusurgy & Co Nig. This is a company that is build on trust and have presently some agricultural product to sell.
You can contact us at anytime. Telephone:234 - 01 - 706951005Address:25, Ahmed Oghre
Street. Idimu Lagos 23401 Nigeria Ad & C West Africa Technology Limited
We produced finished food for Human and Animal, from Cassava, Gari, Chips, Flakes, Starch
and from Beans, beans floor and more. Telephone:234 - 803 - 5500872Address:#1 Arunah
Dorcas Close off Orunju St Ifon Ondo Nigeria F.A Fola Enterprise
F.A FOLA ENTERPRISE is a tested name in the Agricultural Exports Industry and has over
years made quality her watch word. We Export Cash Crops Namely: Sesame Seeds, Cassava, Coconut Shells, Maize, all types of Wood, Ginger, Chilli Pepper etc. Check Out our Website:
www.folafarms.com. Telephone:234-812-068-5484Address:146 FLAT 5, AMUWO ODOFIN
ESTATE Gallio Commercial and General Services
Our company specializes on cassava starch and we have been able to expand our sales by
involving in massive exportation. We are not also relenting to expand our exportation down
to the Asian continent. Telephone:234 - 803678 - 5317Address:4, Adegboyega St, Las
Igando Road, Akesan Lagos 23401 Nigeria
Ubaim Green Pasture Ent. Garcinia Kola is a raw material for herbal drugs producers, we are exporters of this product
plus other agricultural product, we also have large stock of cassava for sale. Telephone:234
- 80 - 55508184Address:11 Aisosa Str, Off Okhoro Rd Benin City Edo 234 Nigeria
Timoden Nigeria Limited Buying directly from the source and selling to buyers. 2. We would harvest cassava farm, get them washed peeled. After peeling them, we wash again then we grind in machine extract
starch grinded get dried very well packed.
Telephone:00234 - 80339 - 5717Address:43B Ijeja Road Oke Sokori PO Box 5054 Abeokuta
Ogun State 110003 Nigeria Full Nature Foods
We have cassava farms and produces dried cassava chips for bio ethanol producing companies, we also have yams, cashew nuts, ginger and other agricultural products. thanks for contacting us
Telephone:234 - 080 - 22343320Address:Block 247 Lagos Nigeria
Virose Pharms Nig. Ltd Deals on pharmaceutical products cassava flour, starch and chips. It has a subsidiary Virose
Nig. Enterprises.
Telephone:234 - 0865904 - 379Address:2 Oladehinde Close,Ketu Lagos Lagos 23401
Nigeria
Africentric Investment Limited We are a Nigeria registered company with Head Office at 6TH Floor, Great House, 47/57, Martins Street, Lagos. We major supplier of high-grade industrial cassava starch in
(STARCH:95% MIN, MOISTURE:2% MAX SAND:0.5% FIBER:0.5% MAX. supply excess 20 Metric Tonnes. Please interested buyer to ...

52
Telephone:234 - 802 - 3178184Address:c/o Giljohn Investment Ltd, 6th Floor, Great
Nigeria House, 47/57, Martins Street, Lagos. Nigeria Lagos Lagos/Nigeria Nigeria Mikon Farm Industries Ltd
Planting tapioca root/cassava 40 hacters land at eastern part Nigeria under project farmers association and supervision northern agriculture state ministries. Capacities volume minimum
10,000 M/ton a month. First delivery beginning 3 - 4 months from now. We ...
Telephone:234-803-7654720Address:22 Asa Road
Ad Industrial Skorba Jabuka Ltd A.D. Industrial Skorba Jabuka, registered and started operations in Nigeria 2013, established 1894 Serbia changing its owners going through a series of development phases. We have our
farmland in 5 states of the South East region to boost productions. Our goal is produce the best quality
Telephone:234-8035-712492Address:28 Peace Crescent Drive, Woji Road
Aus Founders Nig. Limited We are a Nigeria company that deal on wood, timer, cashew, Cola nut, palm kernel, Palm kernel shell, cassava (tapioca) chips, starch, Ginger. Our address: No 36 Erhunmwunse str. Uzebu Quarter. Benin City Edo State. You can reach US through our email: Phone no: +
2348025537154 Marius Osatin
Telephone:234- 80- 25531754Address:No 36 Erhunmwunse St. Uzebu Qts
Festival Nigeria Ltd We are a cassava manufacturing company in Nigeria, we produce cassava in large quantities for international buyers. Currently, we are looking for buyers from china and all other Asian
countries. Telephone234-02-2414706Address2 Floor Aliviana Building, Queen Cinema, Dugbe Area, Ibadan, Oyo,
Psaltry International Limited – Starch Factory PIL established its 20-ton/day starch factory in 2012 and an additional Production Line of 30
tons/day capacity in 2015 to meet more Customer demands and satisfaction. With 400 hectares of Company Cassava farmland located at Alayide-Wasimi Village, Ado-Awaye, Oyo State, a farming community of about 10,000 hectares of farmland.
The company’s asset base as at December 2015 was about $5million comprising its factory, farm land and equipment and generated up to $3.5million as revenue in 2015 and has saved the nation the more than $7million in forex in the past two years. The company has provided
employment for over 300 people including 200 permanent staff and 100 temporary staff.
PIL have a backup farm peradventure there is scarcity of supply. The company has about 2000hectares and about 25% of it in use. PIL have farm hands that work on contract for a
year on the farm in 2 different major villages. PIL could have up to 30tons per hectare as yield.
Export Offtakers
COMPANY / COUNTRY PRODUCT
China Foshan HM Trading Company China Cassava Starch
AL DOLLAR FZE United Arab Emirates Cassava Starch
Gadot Biochemical Industries Ltd Israel Cassava Chips
Peyman Group Co. Iran Cassava Starch
SJD Trade Ltd. Estonia Cassava Starch
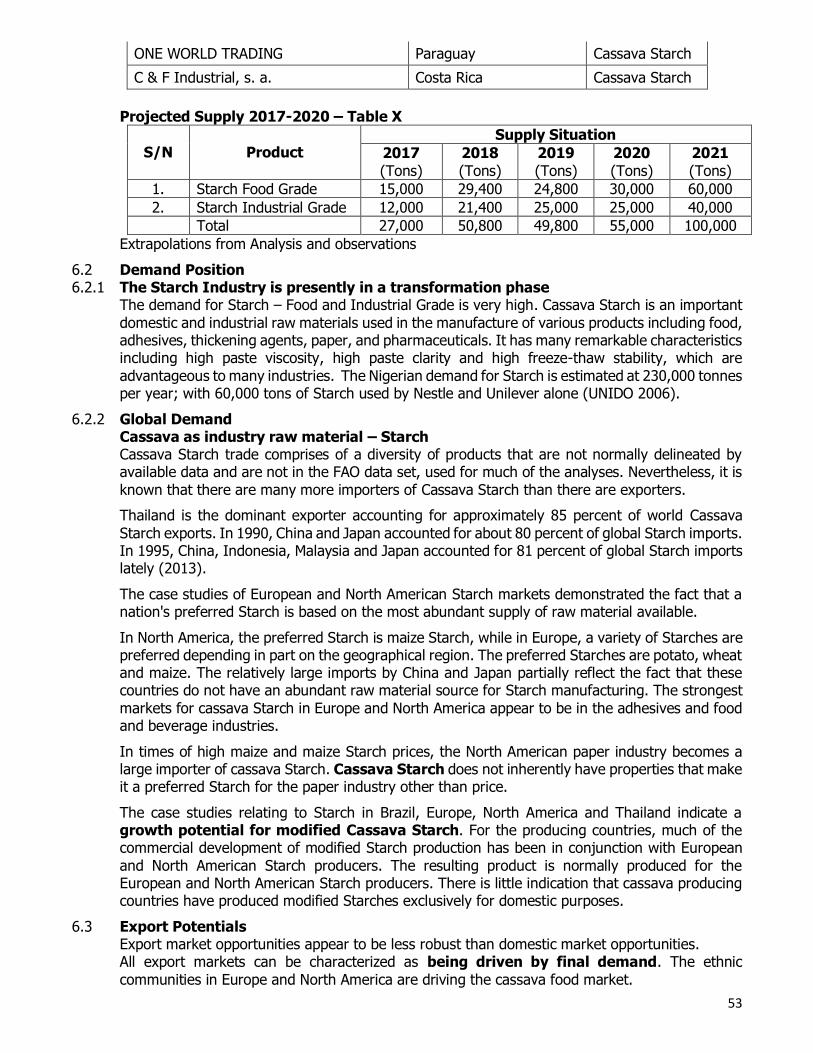
53
ONE WORLD TRADING Paraguay Cassava Starch
C & F Industrial, s. a. Costa Rica Cassava Starch
Projected Supply 2017-2020 – Table X
S/N
Product
Supply Situation
2017
(Tons)
2018
(Tons)
2019
(Tons)
2020
(Tons)
2021
(Tons)
1. Starch Food Grade 15,000 29,400 24,800 30,000 60,000
2. Starch Industrial Grade 12,000 21,400 25,000 25,000 40,000
Total 27,000 50,800 49,800 55,000 100,000
Extrapolations from Analysis and observations
6.2 Demand Position 6.2.1 The Starch Industry is presently in a transformation phase
The demand for Starch – Food and Industrial Grade is very high. Cassava Starch is an important
domestic and industrial raw materials used in the manufacture of various products including food, adhesives, thickening agents, paper, and pharmaceuticals. It has many remarkable characteristics including high paste viscosity, high paste clarity and high freeze-thaw stability, which are
advantageous to many industries. The Nigerian demand for Starch is estimated at 230,000 tonnes per year; with 60,000 tons of Starch used by Nestle and Unilever alone (UNIDO 2006).
6.2.2 Global Demand Cassava as industry raw material – Starch Cassava Starch trade comprises of a diversity of products that are not normally delineated by available data and are not in the FAO data set, used for much of the analyses. Nevertheless, it is
known that there are many more importers of Cassava Starch than there are exporters.
Thailand is the dominant exporter accounting for approximately 85 percent of world Cassava
Starch exports. In 1990, China and Japan accounted for about 80 percent of global Starch imports. In 1995, China, Indonesia, Malaysia and Japan accounted for 81 percent of global Starch imports lately (2013).
The case studies of European and North American Starch markets demonstrated the fact that a nation's preferred Starch is based on the most abundant supply of raw material available.
In North America, the preferred Starch is maize Starch, while in Europe, a variety of Starches are preferred depending in part on the geographical region. The preferred Starches are potato, wheat and maize. The relatively large imports by China and Japan partially reflect the fact that these countries do not have an abundant raw material source for Starch manufacturing. The strongest
markets for cassava Starch in Europe and North America appear to be in the adhesives and food and beverage industries.
In times of high maize and maize Starch prices, the North American paper industry becomes a large importer of cassava Starch. Cassava Starch does not inherently have properties that make it a preferred Starch for the paper industry other than price.
The case studies relating to Starch in Brazil, Europe, North America and Thailand indicate a growth potential for modified Cassava Starch. For the producing countries, much of the commercial development of modified Starch production has been in conjunction with European
and North American Starch producers. The resulting product is normally produced for the European and North American Starch producers. There is little indication that cassava producing countries have produced modified Starches exclusively for domestic purposes.
6.3 Export Potentials Export market opportunities appear to be less robust than domestic market opportunities. All export markets can be characterized as being driven by final demand. The ethnic
communities in Europe and North America are driving the cassava food market.
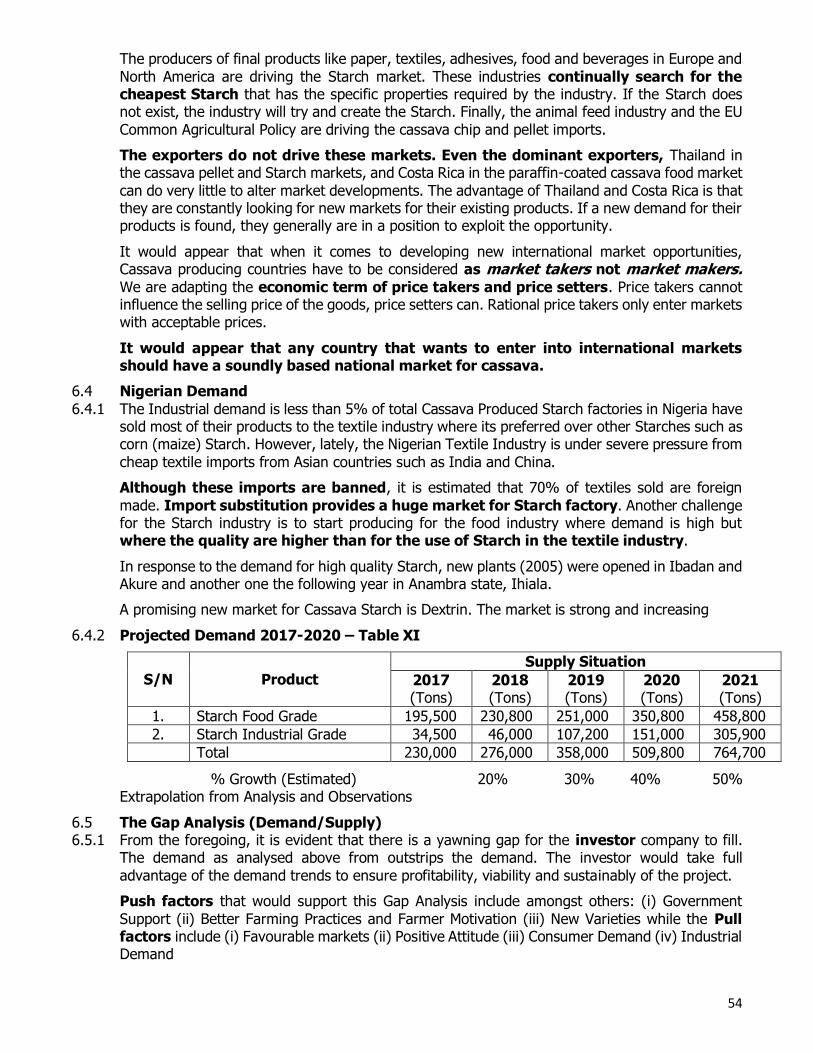
54
The producers of final products like paper, textiles, adhesives, food and beverages in Europe and
North America are driving the Starch market. These industries continually search for the cheapest Starch that has the specific properties required by the industry. If the Starch does not exist, the industry will try and create the Starch. Finally, the animal feed industry and the EU
Common Agricultural Policy are driving the cassava chip and pellet imports.
The exporters do not drive these markets. Even the dominant exporters, Thailand in the cassava pellet and Starch markets, and Costa Rica in the paraffin-coated cassava food market
can do very little to alter market developments. The advantage of Thailand and Costa Rica is that they are constantly looking for new markets for their existing products. If a new demand for their products is found, they generally are in a position to exploit the opportunity.
It would appear that when it comes to developing new international market opportunities, Cassava producing countries have to be considered as market takers not market makers. We are adapting the economic term of price takers and price setters. Price takers cannot influence the selling price of the goods, price setters can. Rational price takers only enter markets with acceptable prices.
It would appear that any country that wants to enter into international markets should have a soundly based national market for cassava.
6.4 Nigerian Demand
6.4.1 The Industrial demand is less than 5% of total Cassava Produced Starch factories in Nigeria have sold most of their products to the textile industry where its preferred over other Starches such as corn (maize) Starch. However, lately, the Nigerian Textile Industry is under severe pressure from
cheap textile imports from Asian countries such as India and China.
Although these imports are banned, it is estimated that 70% of textiles sold are foreign
made. Import substitution provides a huge market for Starch factory. Another challenge for the Starch industry is to start producing for the food industry where demand is high but where the quality are higher than for the use of Starch in the textile industry.
In response to the demand for high quality Starch, new plants (2005) were opened in Ibadan and Akure and another one the following year in Anambra state, Ihiala.
A promising new market for Cassava Starch is Dextrin. The market is strong and increasing
6.4.2 Projected Demand 2017-2020 – Table XI
S/N
Product
Supply Situation
2017 (Tons)
2018 (Tons)
2019 (Tons)
2020 (Tons)
2021 (Tons)
1. Starch Food Grade 195,500 230,800 251,000 350,800 458,800
2. Starch Industrial Grade 34,500 46,000 107,200 151,000 305,900
Total 230,000 276,000 358,000 509,800 764,700
% Growth (Estimated) 20% 30% 40% 50% Extrapolation from Analysis and Observations
6.5 The Gap Analysis (Demand/Supply) 6.5.1 From the foregoing, it is evident that there is a yawning gap for the investor company to fill.
The demand as analysed above from outstrips the demand. The investor would take full
advantage of the demand trends to ensure profitability, viability and sustainably of the project.
Push factors that would support this Gap Analysis include amongst others: (i) Government
Support (ii) Better Farming Practices and Farmer Motivation (iii) New Varieties while the Pull factors include (i) Favourable markets (ii) Positive Attitude (iii) Consumer Demand (iv) Industrial Demand
55
6.5.2 To achieve the viability of operations and marketability of products, the company shall embark
on Strategic Marketing Programmes
i. Pricing The price of Cassava Starch varies from market to market. Currently, Starch sells for between
N145,000 – N169,000 per ton. ii. Packaging of Products
The product would be packaged in different sizes – 10kg, 1kg, 500gm, 50kg depending on
consumer needs. iii. Branding
Most of these products have no standard and no brand names. Due to the fact that the
products are not standardized, many dealers in the urban areas travel to the rural areas to purchase in bulk and resell to the urban consumers.
iv. Target Markets
The target markets for the products are as follows:- Homes – all classes of households (i) Paper and Textile Industries
(ii) Food and Beverage Industries (iii) Pharmaceutical Industries
Sales Promotion Strategy
The investor is out to fill the gap in the market and give value added services to its target audience. Meeting customers’ various need would create a strong customer relationship. The segmentation strategy is to target corporate, commercial and individual customers in order to
have a strong market share. The strategies to capture target audience are briefly discussed below:-
i. Timely delivery of products: Products are to be made available on a timely basis in order
to satisfy our clients’ needs. ii. Quality/Superior products: Quality shall be our unique selling proposition, be it for
industrial, commercial or home uses. The investor will make sure it provides quality cassava
based products; we will make sure we continually offer products that are in line with best international practices.
iii. Advertisement/Promos: In order to have a strong market share, the investor will
advertise its products through flyers, local news, radio jingles etc. It will also offer special promos on regular basis so as to attract customers to its self.
iv. Visibility: The products should be well packaged and well arranged in supermarkets and
other sales points to ensure visibility. v. Accessibility: Products should be placed in accessible outlets to ensure accessibility to
customer.
vi. Appearance: Sales staff and understanding personnel should be neatly dressed, well trained and courteous.
vii. Planned Merchandising: Road shows market displays should be undertaken to promote
and create awareness for the products to engender loyalty and sales. viii. Stock Control: Stock analysis and stock taking should be constantly undertaken to ensure
stock availability.
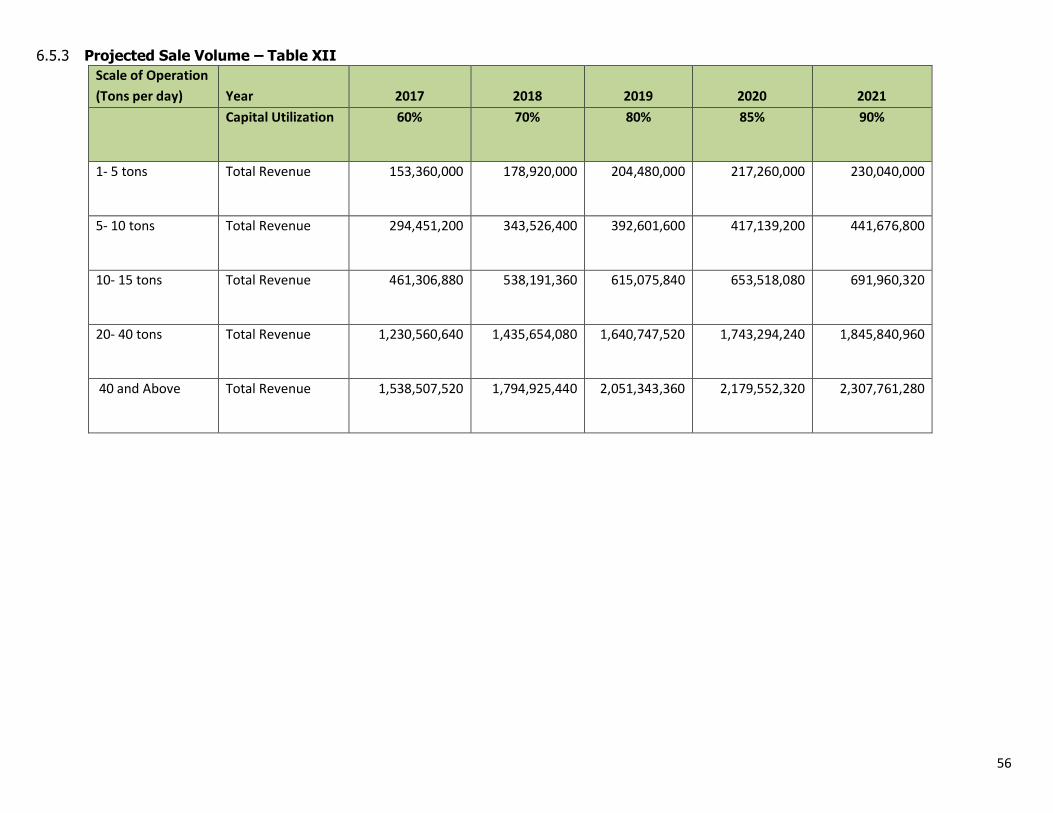
56
6.5.3 Projected Sale Volume – Table XII
Scale of Operation
(Tons per day) Year 2017 2018 2019 2020 2021
Capital Utilization 60% 70% 80% 85% 90%
1- 5 tons Total Revenue 153,360,000 178,920,000 204,480,000 217,260,000 230,040,000
5- 10 tons Total Revenue 294,451,200 343,526,400 392,601,600 417,139,200 441,676,800
10- 15 tons Total Revenue 461,306,880 538,191,360 615,075,840 653,518,080 691,960,320
20- 40 tons Total Revenue 1,230,560,640 1,435,654,080 1,640,747,520 1,743,294,240 1,845,840,960
40 and Above Total Revenue 1,538,507,520 1,794,925,440 2,051,343,360 2,179,552,320 2,307,761,280

57
FINANCIAL
ANALYSIS
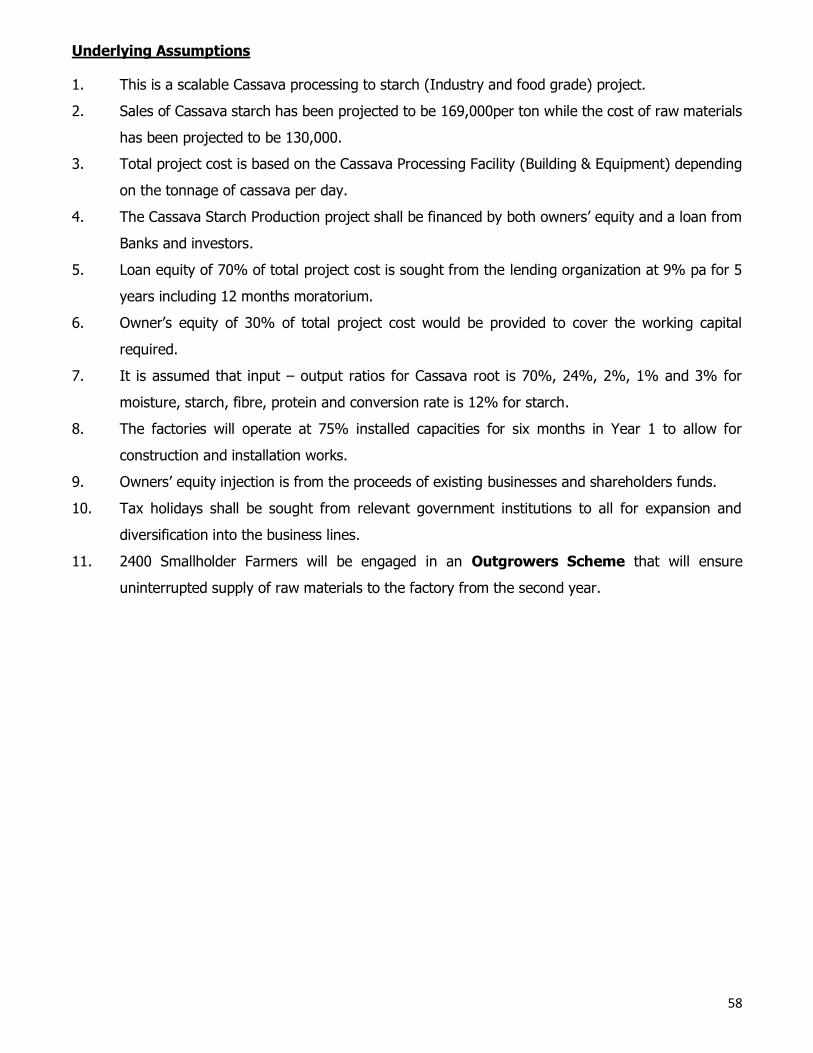
58
Underlying Assumptions
1. This is a scalable Cassava processing to starch (Industry and food grade) project.
2. Sales of Cassava starch has been projected to be 169,000per ton while the cost of raw materials
has been projected to be 130,000.
3. Total project cost is based on the Cassava Processing Facility (Building & Equipment) depending
on the tonnage of cassava per day.
4. The Cassava Starch Production project shall be financed by both owners’ equity and a loan from
Banks and investors.
5. Loan equity of 70% of total project cost is sought from the lending organization at 9% pa for 5
years including 12 months moratorium.
6. Owner’s equity of 30% of total project cost would be provided to cover the working capital
required.
7. It is assumed that input – output ratios for Cassava root is 70%, 24%, 2%, 1% and 3% for
moisture, starch, fibre, protein and conversion rate is 12% for starch.
8. The factories will operate at 75% installed capacities for six months in Year 1 to allow for
construction and installation works.
9. Owners’ equity injection is from the proceeds of existing businesses and shareholders funds.
10. Tax holidays shall be sought from relevant government institutions to all for expansion and
diversification into the business lines.
11. 2400 Smallholder Farmers will be engaged in an Outgrowers Scheme that will ensure
uninterrupted supply of raw materials to the factory from the second year.
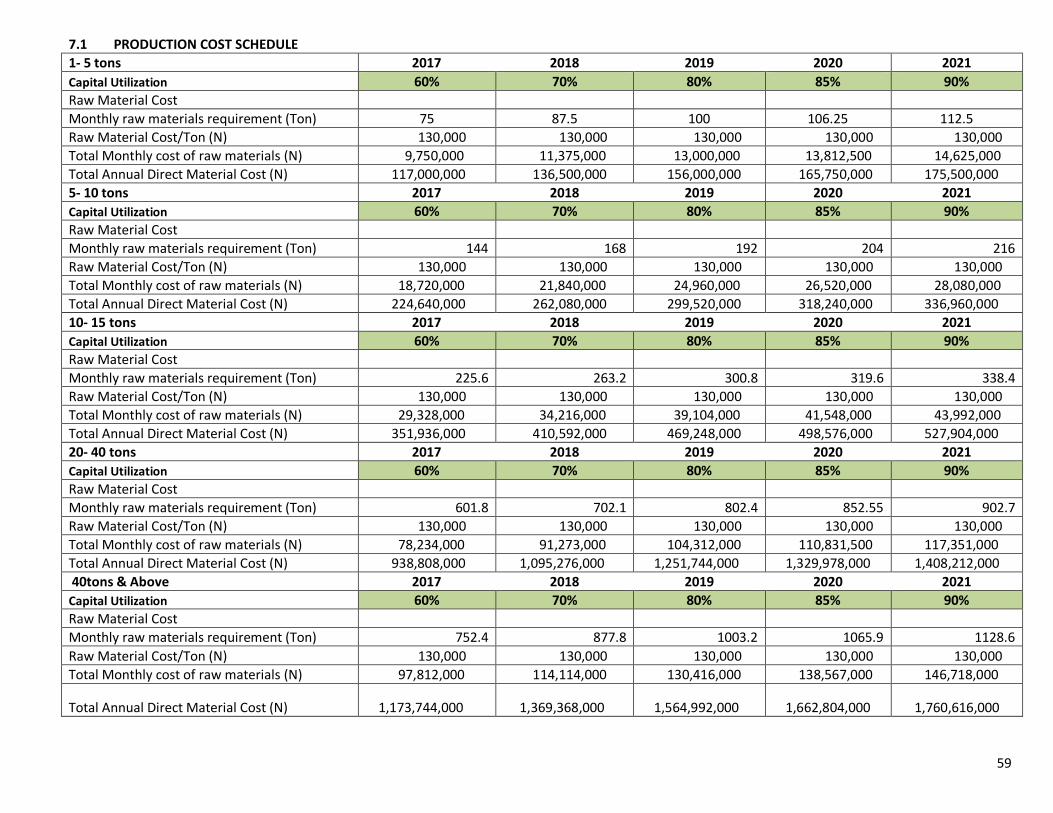
59
7.1 PRODUCTION COST SCHEDULE 1- 5 tons 2017 2018 2019 2020 2021
Capital Utilization 60% 70% 80% 85% 90%
Raw Material Cost Monthly raw materials requirement (Ton) 75 87.5 100 106.25 112.5
Raw Material Cost/Ton (N) 130,000 130,000 130,000 130,000 130,000
Total Monthly cost of raw materials (N) 9,750,000 11,375,000 13,000,000 13,812,500 14,625,000
Total Annual Direct Material Cost (N) 117,000,000 136,500,000 156,000,000 165,750,000 175,500,000
5- 10 tons 2017 2018 2019 2020 2021
Capital Utilization 60% 70% 80% 85% 90%
Raw Material Cost Monthly raw materials requirement (Ton) 144 168 192 204 216
Raw Material Cost/Ton (N) 130,000 130,000 130,000 130,000 130,000
Total Monthly cost of raw materials (N) 18,720,000 21,840,000 24,960,000 26,520,000 28,080,000
Total Annual Direct Material Cost (N) 224,640,000 262,080,000 299,520,000 318,240,000 336,960,000
10- 15 tons 2017 2018 2019 2020 2021
Capital Utilization 60% 70% 80% 85% 90%
Raw Material Cost Monthly raw materials requirement (Ton) 225.6 263.2 300.8 319.6 338.4
Raw Material Cost/Ton (N) 130,000 130,000 130,000 130,000 130,000
Total Monthly cost of raw materials (N) 29,328,000 34,216,000 39,104,000 41,548,000 43,992,000
Total Annual Direct Material Cost (N) 351,936,000 410,592,000 469,248,000 498,576,000 527,904,000
20- 40 tons 2017 2018 2019 2020 2021
Capital Utilization 60% 70% 80% 85% 90%
Raw Material Cost Monthly raw materials requirement (Ton) 601.8 702.1 802.4 852.55 902.7
Raw Material Cost/Ton (N) 130,000 130,000 130,000 130,000 130,000
Total Monthly cost of raw materials (N) 78,234,000 91,273,000 104,312,000 110,831,500 117,351,000
Total Annual Direct Material Cost (N) 938,808,000 1,095,276,000 1,251,744,000 1,329,978,000 1,408,212,000
40tons & Above 2017 2018 2019 2020 2021
Capital Utilization 60% 70% 80% 85% 90%
Raw Material Cost Monthly raw materials requirement (Ton) 752.4 877.8 1003.2 1065.9 1128.6
Raw Material Cost/Ton (N) 130,000 130,000 130,000 130,000 130,000
Total Monthly cost of raw materials (N) 97,812,000 114,114,000 130,416,000 138,567,000 146,718,000
Total Annual Direct Material Cost (N) 1,173,744,000 1,369,368,000 1,564,992,000 1,662,804,000 1,760,616,000
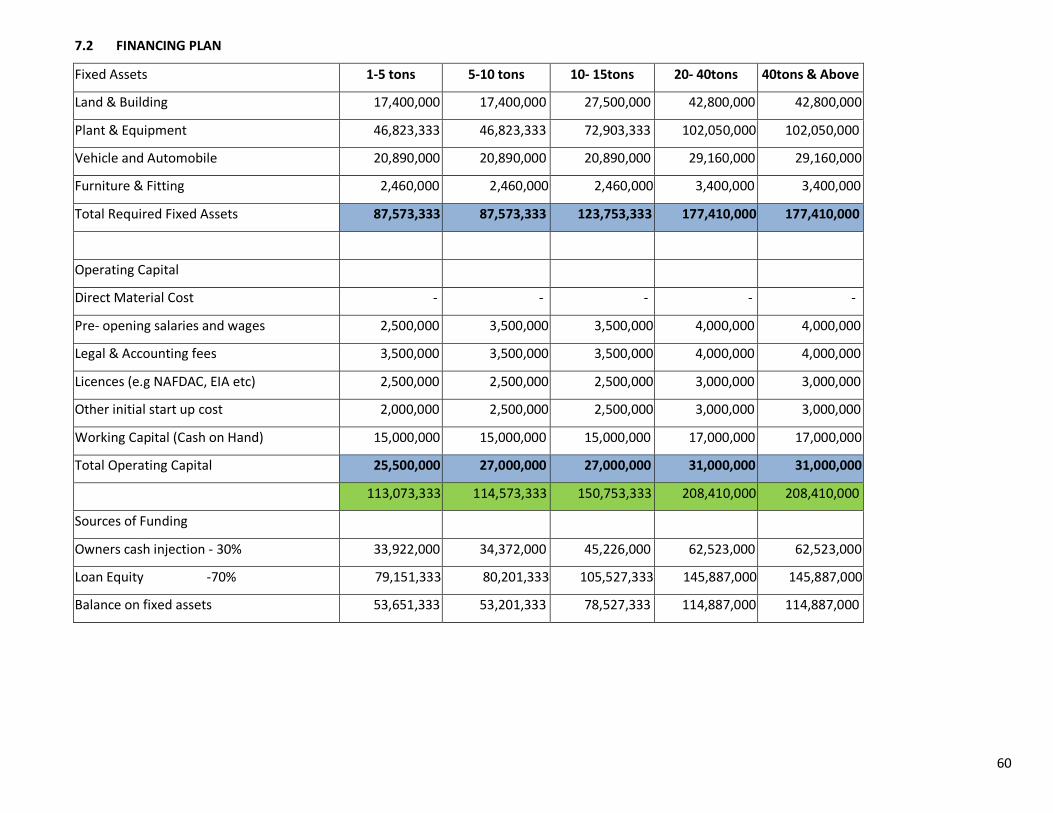
60
7.2 FINANCING PLAN
Fixed Assets 1-5 tons 5-10 tons 10- 15tons 20- 40tons 40tons & Above
Land & Building 17,400,000 17,400,000 27,500,000 42,800,000 42,800,000
Plant & Equipment 46,823,333 46,823,333 72,903,333 102,050,000 102,050,000
Vehicle and Automobile 20,890,000 20,890,000 20,890,000 29,160,000 29,160,000
Furniture & Fitting 2,460,000 2,460,000 2,460,000 3,400,000 3,400,000
Total Required Fixed Assets 87,573,333 87,573,333 123,753,333 177,410,000 177,410,000
Operating Capital
Direct Material Cost - - - - -
Pre- opening salaries and wages 2,500,000 3,500,000 3,500,000 4,000,000 4,000,000
Legal & Accounting fees 3,500,000 3,500,000 3,500,000 4,000,000 4,000,000
Licences (e.g NAFDAC, EIA etc) 2,500,000 2,500,000 2,500,000 3,000,000 3,000,000
Other initial start up cost 2,000,000 2,500,000 2,500,000 3,000,000 3,000,000
Working Capital (Cash on Hand) 15,000,000 15,000,000 15,000,000 17,000,000 17,000,000
Total Operating Capital 25,500,000 27,000,000 27,000,000 31,000,000 31,000,000
113,073,333 114,573,333 150,753,333 208,410,000 208,410,000
Sources of Funding
Owners cash injection - 30% 33,922,000 34,372,000 45,226,000 62,523,000 62,523,000
Loan Equity -70% 79,151,333 80,201,333 105,527,333 145,887,000 145,887,000
Balance on fixed assets 53,651,333 53,201,333 78,527,333 114,887,000 114,887,000
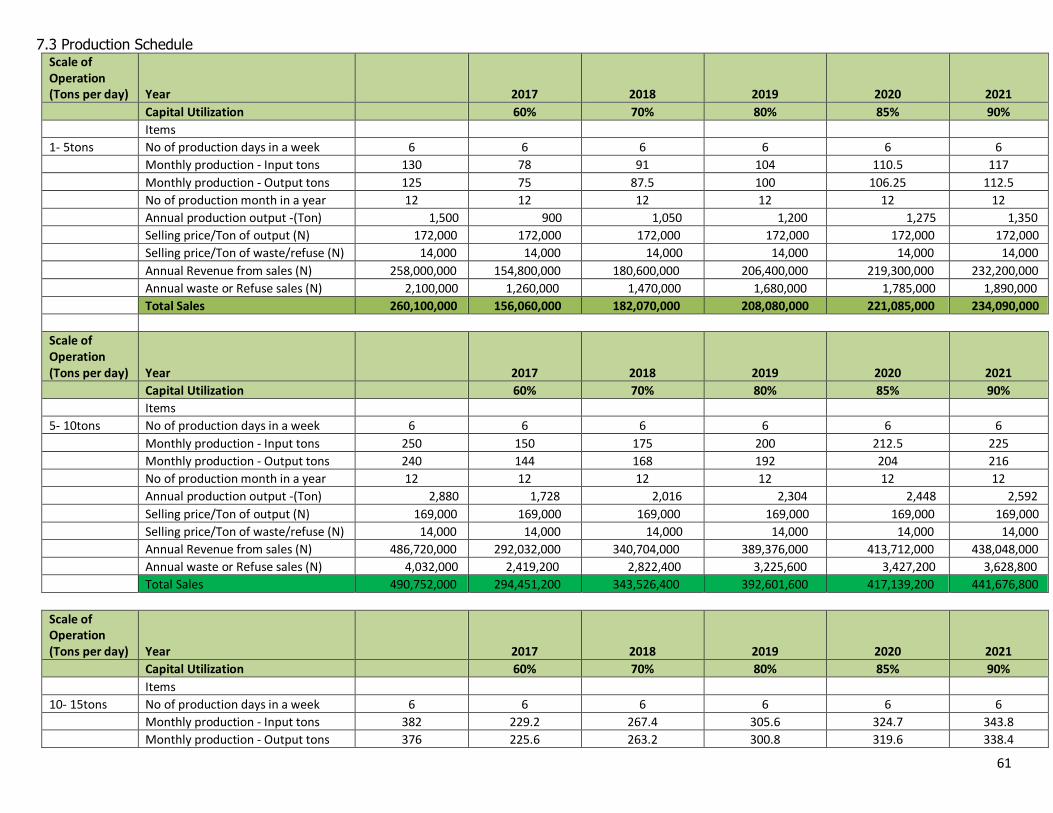
61
7.3 Production Schedule Scale of Operation (Tons per day) Year 2017 2018 2019 2020 2021
Capital Utilization 60% 70% 80% 85% 90%
Items
1- 5tons No of production days in a week 6 6 6 6 6 6
Monthly production - Input tons 130 78 91 104 110.5 117
Monthly production - Output tons 125 75 87.5 100 106.25 112.5
No of production month in a year 12 12 12 12 12 12
Annual production output -(Ton) 1,500 900 1,050 1,200 1,275 1,350
Selling price/Ton of output (N) 172,000 172,000 172,000 172,000 172,000 172,000
Selling price/Ton of waste/refuse (N) 14,000 14,000 14,000 14,000 14,000 14,000
Annual Revenue from sales (N) 258,000,000 154,800,000 180,600,000 206,400,000 219,300,000 232,200,000
Annual waste or Refuse sales (N) 2,100,000 1,260,000 1,470,000 1,680,000 1,785,000 1,890,000
Total Sales 260,100,000 156,060,000 182,070,000 208,080,000 221,085,000 234,090,000
Scale of Operation (Tons per day) Year 2017 2018 2019 2020 2021
Capital Utilization 60% 70% 80% 85% 90%
Items
5- 10tons No of production days in a week 6 6 6 6 6 6
Monthly production - Input tons 250 150 175 200 212.5 225
Monthly production - Output tons 240 144 168 192 204 216
No of production month in a year 12 12 12 12 12 12
Annual production output -(Ton) 2,880 1,728 2,016 2,304 2,448 2,592
Selling price/Ton of output (N) 169,000 169,000 169,000 169,000 169,000 169,000
Selling price/Ton of waste/refuse (N) 14,000 14,000 14,000 14,000 14,000 14,000
Annual Revenue from sales (N) 486,720,000 292,032,000 340,704,000 389,376,000 413,712,000 438,048,000
Annual waste or Refuse sales (N) 4,032,000 2,419,200 2,822,400 3,225,600 3,427,200 3,628,800
Total Sales 490,752,000 294,451,200 343,526,400 392,601,600 417,139,200 441,676,800
Scale of Operation (Tons per day) Year 2017 2018 2019 2020 2021
Capital Utilization 60% 70% 80% 85% 90%
Items
10- 15tons No of production days in a week 6 6 6 6 6 6
Monthly production - Input tons 382 229.2 267.4 305.6 324.7 343.8
Monthly production - Output tons 376 225.6 263.2 300.8 319.6 338.4
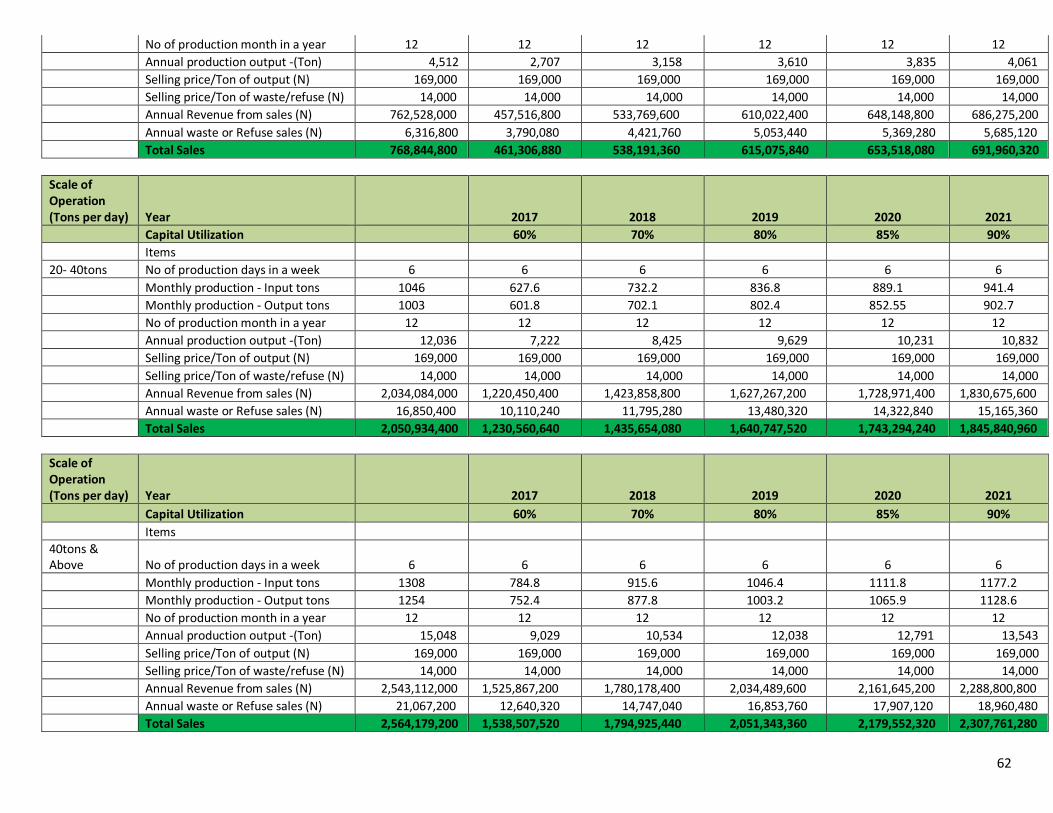
62
No of production month in a year 12 12 12 12 12 12
Annual production output -(Ton) 4,512 2,707 3,158 3,610 3,835 4,061
Selling price/Ton of output (N) 169,000 169,000 169,000 169,000 169,000 169,000
Selling price/Ton of waste/refuse (N) 14,000 14,000 14,000 14,000 14,000 14,000
Annual Revenue from sales (N) 762,528,000 457,516,800 533,769,600 610,022,400 648,148,800 686,275,200
Annual waste or Refuse sales (N) 6,316,800 3,790,080 4,421,760 5,053,440 5,369,280 5,685,120
Total Sales 768,844,800 461,306,880 538,191,360 615,075,840 653,518,080 691,960,320
Scale of Operation (Tons per day) Year 2017 2018 2019 2020 2021
Capital Utilization 60% 70% 80% 85% 90%
Items
20- 40tons No of production days in a week 6 6 6 6 6 6
Monthly production - Input tons 1046 627.6 732.2 836.8 889.1 941.4
Monthly production - Output tons 1003 601.8 702.1 802.4 852.55 902.7
No of production month in a year 12 12 12 12 12 12
Annual production output -(Ton) 12,036 7,222 8,425 9,629 10,231 10,832
Selling price/Ton of output (N) 169,000 169,000 169,000 169,000 169,000 169,000
Selling price/Ton of waste/refuse (N) 14,000 14,000 14,000 14,000 14,000 14,000
Annual Revenue from sales (N) 2,034,084,000 1,220,450,400 1,423,858,800 1,627,267,200 1,728,971,400 1,830,675,600
Annual waste or Refuse sales (N) 16,850,400 10,110,240 11,795,280 13,480,320 14,322,840 15,165,360
Total Sales 2,050,934,400 1,230,560,640 1,435,654,080 1,640,747,520 1,743,294,240 1,845,840,960
Scale of Operation (Tons per day) Year 2017 2018 2019 2020 2021
Capital Utilization 60% 70% 80% 85% 90%
Items
40tons & Above No of production days in a week 6 6 6 6 6 6
Monthly production - Input tons 1308 784.8 915.6 1046.4 1111.8 1177.2
Monthly production - Output tons 1254 752.4 877.8 1003.2 1065.9 1128.6
No of production month in a year 12 12 12 12 12 12
Annual production output -(Ton) 15,048 9,029 10,534 12,038 12,791 13,543
Selling price/Ton of output (N) 169,000 169,000 169,000 169,000 169,000 169,000
Selling price/Ton of waste/refuse (N) 14,000 14,000 14,000 14,000 14,000 14,000
Annual Revenue from sales (N) 2,543,112,000 1,525,867,200 1,780,178,400 2,034,489,600 2,161,645,200 2,288,800,800
Annual waste or Refuse sales (N) 21,067,200 12,640,320 14,747,040 16,853,760 17,907,120 18,960,480
Total Sales 2,564,179,200 1,538,507,520 1,794,925,440 2,051,343,360 2,179,552,320 2,307,761,280
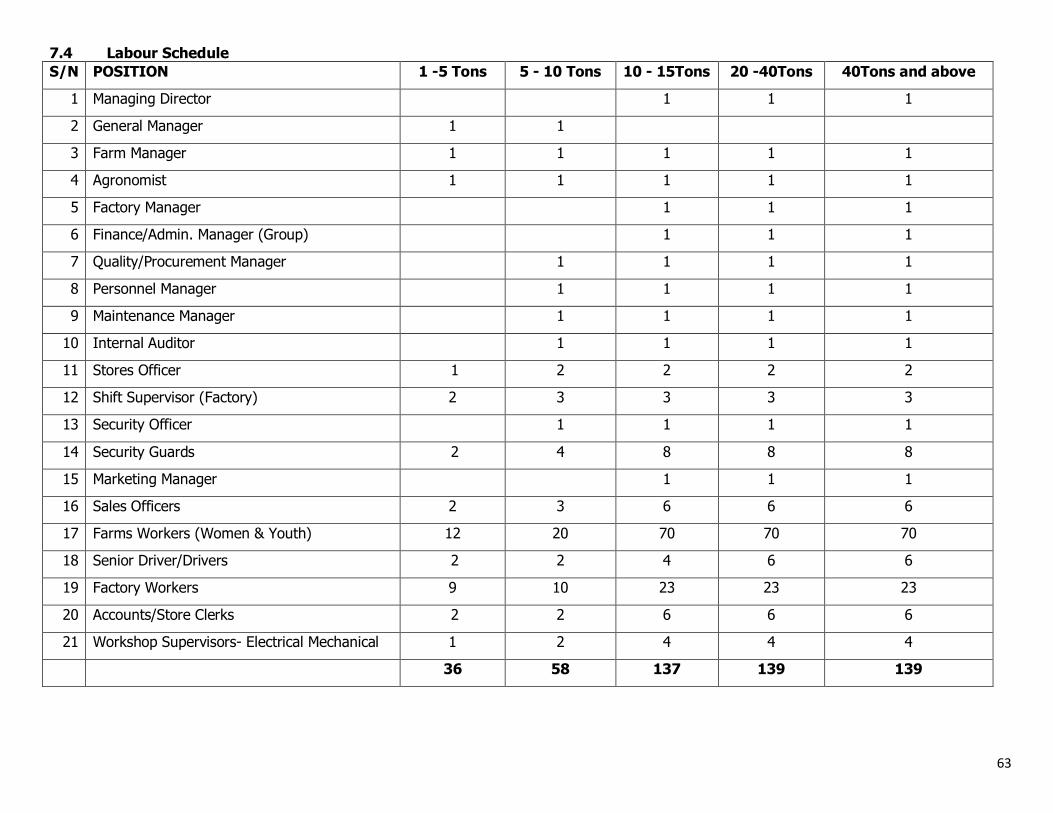
63
7.4 Labour Schedule
S/N POSITION 1 -5 Tons 5 - 10 Tons 10 - 15Tons 20 -40Tons 40Tons and above
1 Managing Director
1 1 1
2 General Manager 1 1
3 Farm Manager 1 1 1 1 1
4 Agronomist 1 1 1 1 1
5 Factory Manager
1 1 1
6 Finance/Admin. Manager (Group)
1 1 1
7 Quality/Procurement Manager 1 1 1 1
8 Personnel Manager 1 1 1 1
9 Maintenance Manager 1 1 1 1
10 Internal Auditor 1 1 1 1
11 Stores Officer 1 2 2 2 2
12 Shift Supervisor (Factory) 2 3 3 3 3
13 Security Officer 1 1 1 1
14 Security Guards 2 4 8 8 8
15 Marketing Manager
1 1 1
16 Sales Officers 2 3 6 6 6
17 Farms Workers (Women & Youth) 12 20 70 70 70
18 Senior Driver/Drivers 2 2 4 6 6
19 Factory Workers 9 10 23 23 23
20 Accounts/Store Clerks 2 2 6 6 6
21 Workshop Supervisors- Electrical Mechanical 1 2 4 4 4
36 58 137 139 139
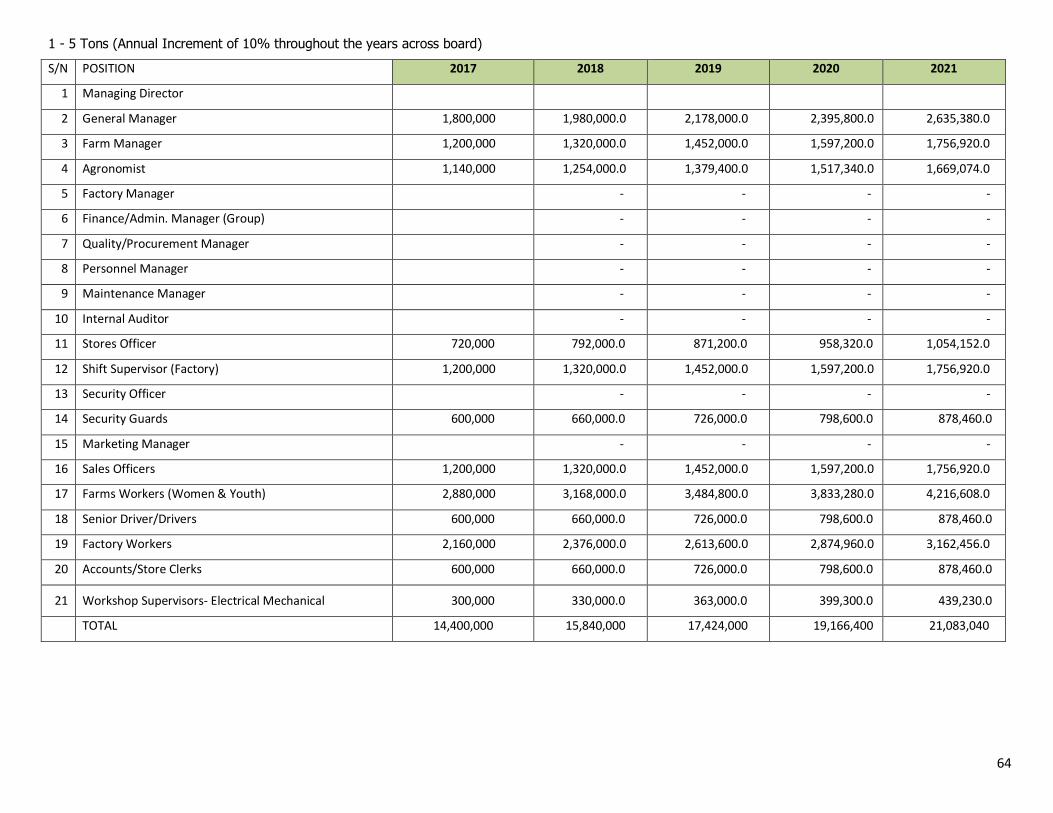
64
1 - 5 Tons (Annual Increment of 10% throughout the years across board)
S/N POSITION 2017 2018 2019 2020 2021
1 Managing Director
2 General Manager 1,800,000 1,980,000.0 2,178,000.0 2,395,800.0 2,635,380.0
3 Farm Manager 1,200,000 1,320,000.0 1,452,000.0 1,597,200.0 1,756,920.0
4 Agronomist 1,140,000 1,254,000.0 1,379,400.0 1,517,340.0 1,669,074.0
5 Factory Manager - - - -
6 Finance/Admin. Manager (Group) - - - -
7 Quality/Procurement Manager - - - -
8 Personnel Manager - - - -
9 Maintenance Manager - - - -
10 Internal Auditor - - - -
11 Stores Officer 720,000 792,000.0 871,200.0 958,320.0 1,054,152.0
12 Shift Supervisor (Factory) 1,200,000 1,320,000.0 1,452,000.0 1,597,200.0 1,756,920.0
13 Security Officer - - - -
14 Security Guards 600,000 660,000.0 726,000.0 798,600.0 878,460.0
15 Marketing Manager - - - -
16 Sales Officers 1,200,000 1,320,000.0 1,452,000.0 1,597,200.0 1,756,920.0
17 Farms Workers (Women & Youth) 2,880,000 3,168,000.0 3,484,800.0 3,833,280.0 4,216,608.0
18 Senior Driver/Drivers 600,000 660,000.0 726,000.0 798,600.0 878,460.0
19 Factory Workers 2,160,000 2,376,000.0 2,613,600.0 2,874,960.0 3,162,456.0
20 Accounts/Store Clerks 600,000 660,000.0 726,000.0 798,600.0 878,460.0
21 Workshop Supervisors- Electrical Mechanical 300,000 330,000.0 363,000.0 399,300.0 439,230.0
TOTAL 14,400,000 15,840,000 17,424,000 19,166,400 21,083,040
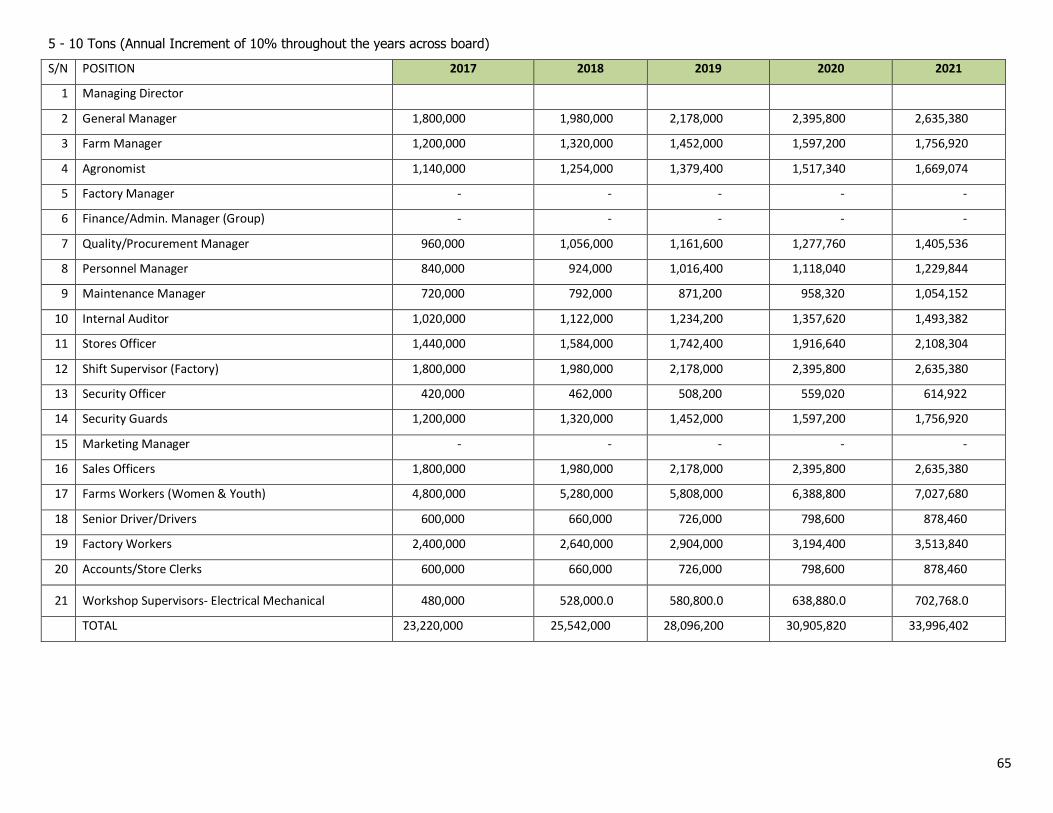
65
5 - 10 Tons (Annual Increment of 10% throughout the years across board)
S/N POSITION 2017 2018 2019 2020 2021
1 Managing Director
2 General Manager 1,800,000 1,980,000 2,178,000 2,395,800 2,635,380
3 Farm Manager 1,200,000 1,320,000 1,452,000 1,597,200 1,756,920
4 Agronomist 1,140,000 1,254,000 1,379,400 1,517,340 1,669,074
5 Factory Manager - - - - -
6 Finance/Admin. Manager (Group) - - - - -
7 Quality/Procurement Manager 960,000 1,056,000 1,161,600 1,277,760 1,405,536
8 Personnel Manager 840,000 924,000 1,016,400 1,118,040 1,229,844
9 Maintenance Manager 720,000 792,000 871,200 958,320 1,054,152
10 Internal Auditor 1,020,000 1,122,000 1,234,200 1,357,620 1,493,382
11 Stores Officer 1,440,000 1,584,000 1,742,400 1,916,640 2,108,304
12 Shift Supervisor (Factory) 1,800,000 1,980,000 2,178,000 2,395,800 2,635,380
13 Security Officer 420,000 462,000 508,200 559,020 614,922
14 Security Guards 1,200,000 1,320,000 1,452,000 1,597,200 1,756,920
15 Marketing Manager - - - - -
16 Sales Officers 1,800,000 1,980,000 2,178,000 2,395,800 2,635,380
17 Farms Workers (Women & Youth) 4,800,000 5,280,000 5,808,000 6,388,800 7,027,680
18 Senior Driver/Drivers 600,000 660,000 726,000 798,600 878,460
19 Factory Workers 2,400,000 2,640,000 2,904,000 3,194,400 3,513,840
20 Accounts/Store Clerks 600,000 660,000 726,000 798,600 878,460
21 Workshop Supervisors- Electrical Mechanical 480,000 528,000.0 580,800.0 638,880.0 702,768.0
TOTAL 23,220,000 25,542,000 28,096,200 30,905,820 33,996,402
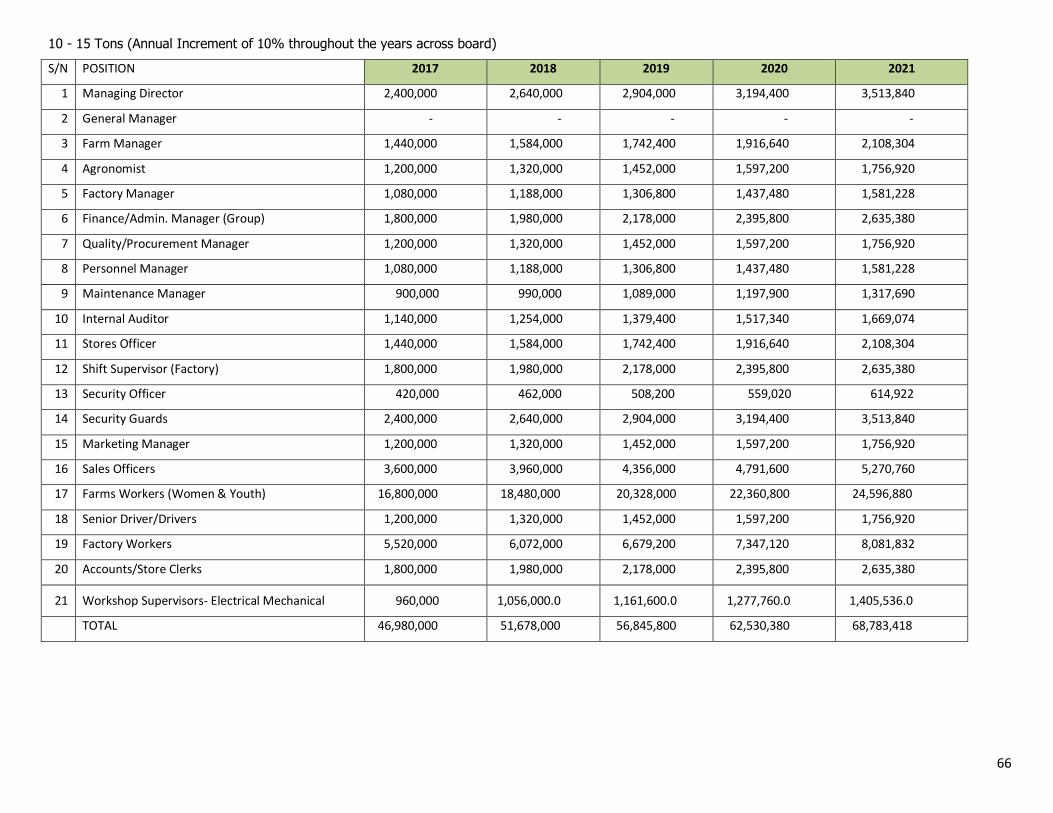
66
10 - 15 Tons (Annual Increment of 10% throughout the years across board)
S/N POSITION 2017 2018 2019 2020 2021
1 Managing Director 2,400,000 2,640,000 2,904,000 3,194,400 3,513,840
2 General Manager - - - - -
3 Farm Manager 1,440,000 1,584,000 1,742,400 1,916,640 2,108,304
4 Agronomist 1,200,000 1,320,000 1,452,000 1,597,200 1,756,920
5 Factory Manager 1,080,000 1,188,000 1,306,800 1,437,480 1,581,228
6 Finance/Admin. Manager (Group) 1,800,000 1,980,000 2,178,000 2,395,800 2,635,380
7 Quality/Procurement Manager 1,200,000 1,320,000 1,452,000 1,597,200 1,756,920
8 Personnel Manager 1,080,000 1,188,000 1,306,800 1,437,480 1,581,228
9 Maintenance Manager 900,000 990,000 1,089,000 1,197,900 1,317,690
10 Internal Auditor 1,140,000 1,254,000 1,379,400 1,517,340 1,669,074
11 Stores Officer 1,440,000 1,584,000 1,742,400 1,916,640 2,108,304
12 Shift Supervisor (Factory) 1,800,000 1,980,000 2,178,000 2,395,800 2,635,380
13 Security Officer 420,000 462,000 508,200 559,020 614,922
14 Security Guards 2,400,000 2,640,000 2,904,000 3,194,400 3,513,840
15 Marketing Manager 1,200,000 1,320,000 1,452,000 1,597,200 1,756,920
16 Sales Officers 3,600,000 3,960,000 4,356,000 4,791,600 5,270,760
17 Farms Workers (Women & Youth) 16,800,000 18,480,000 20,328,000 22,360,800 24,596,880
18 Senior Driver/Drivers 1,200,000 1,320,000 1,452,000 1,597,200 1,756,920
19 Factory Workers 5,520,000 6,072,000 6,679,200 7,347,120 8,081,832
20 Accounts/Store Clerks 1,800,000 1,980,000 2,178,000 2,395,800 2,635,380
21 Workshop Supervisors- Electrical Mechanical 960,000 1,056,000.0 1,161,600.0 1,277,760.0 1,405,536.0
TOTAL 46,980,000 51,678,000 56,845,800 62,530,380 68,783,418
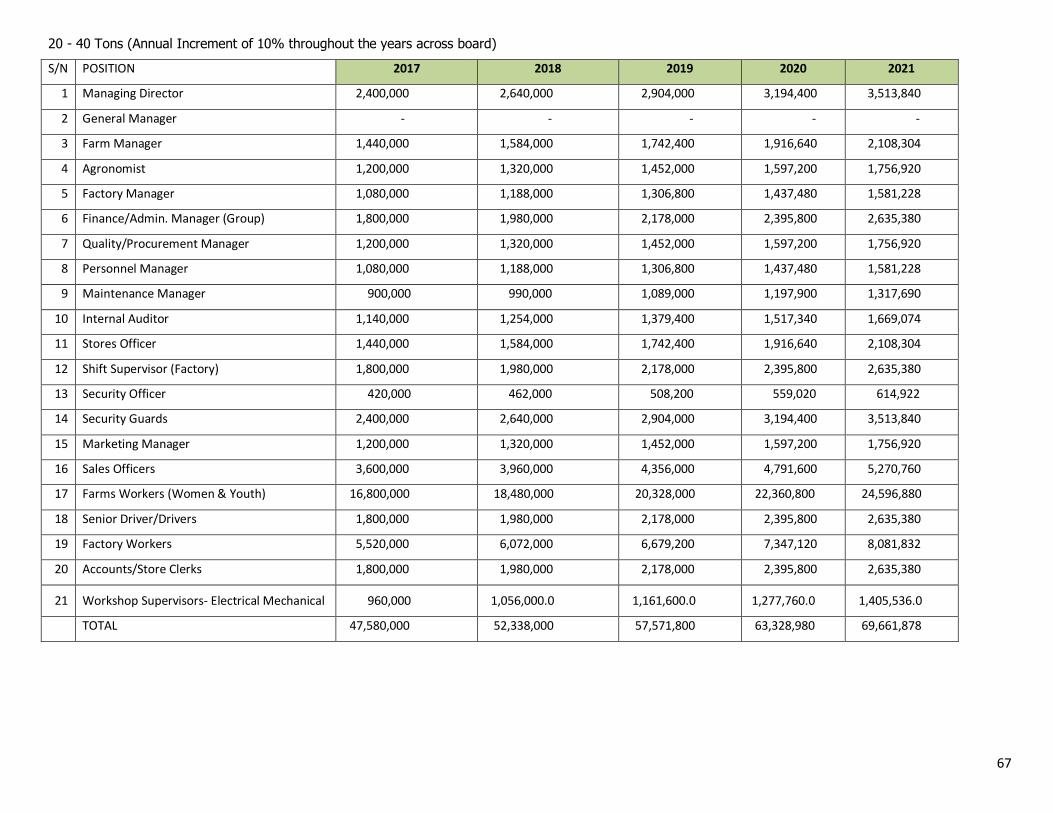
67
20 - 40 Tons (Annual Increment of 10% throughout the years across board)
S/N POSITION 2017 2018 2019 2020 2021
1 Managing Director 2,400,000 2,640,000 2,904,000 3,194,400 3,513,840
2 General Manager - - - - -
3 Farm Manager 1,440,000 1,584,000 1,742,400 1,916,640 2,108,304
4 Agronomist 1,200,000 1,320,000 1,452,000 1,597,200 1,756,920
5 Factory Manager 1,080,000 1,188,000 1,306,800 1,437,480 1,581,228
6 Finance/Admin. Manager (Group) 1,800,000 1,980,000 2,178,000 2,395,800 2,635,380
7 Quality/Procurement Manager 1,200,000 1,320,000 1,452,000 1,597,200 1,756,920
8 Personnel Manager 1,080,000 1,188,000 1,306,800 1,437,480 1,581,228
9 Maintenance Manager 900,000 990,000 1,089,000 1,197,900 1,317,690
10 Internal Auditor 1,140,000 1,254,000 1,379,400 1,517,340 1,669,074
11 Stores Officer 1,440,000 1,584,000 1,742,400 1,916,640 2,108,304
12 Shift Supervisor (Factory) 1,800,000 1,980,000 2,178,000 2,395,800 2,635,380
13 Security Officer 420,000 462,000 508,200 559,020 614,922
14 Security Guards 2,400,000 2,640,000 2,904,000 3,194,400 3,513,840
15 Marketing Manager 1,200,000 1,320,000 1,452,000 1,597,200 1,756,920
16 Sales Officers 3,600,000 3,960,000 4,356,000 4,791,600 5,270,760
17 Farms Workers (Women & Youth) 16,800,000 18,480,000 20,328,000 22,360,800 24,596,880
18 Senior Driver/Drivers 1,800,000 1,980,000 2,178,000 2,395,800 2,635,380
19 Factory Workers 5,520,000 6,072,000 6,679,200 7,347,120 8,081,832
20 Accounts/Store Clerks 1,800,000 1,980,000 2,178,000 2,395,800 2,635,380
21 Workshop Supervisors- Electrical Mechanical 960,000 1,056,000.0 1,161,600.0 1,277,760.0 1,405,536.0
TOTAL 47,580,000 52,338,000 57,571,800 63,328,980 69,661,878
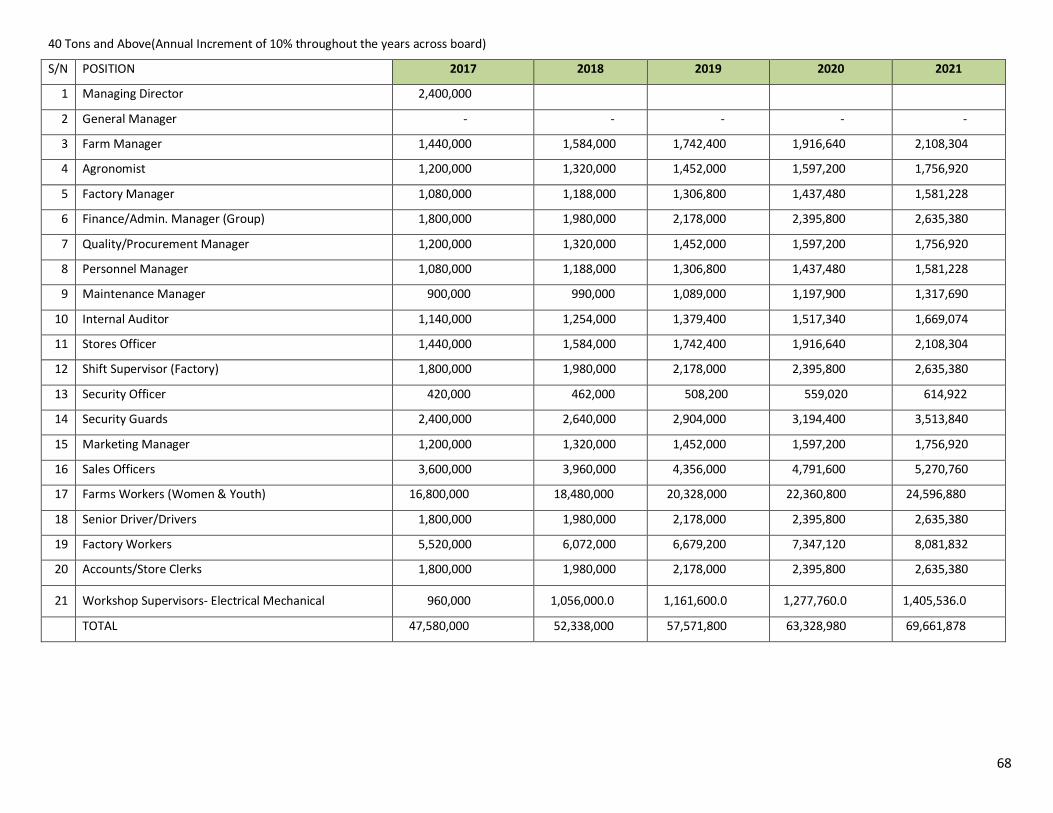
68
40 Tons and Above(Annual Increment of 10% throughout the years across board)
S/N POSITION 2017 2018 2019 2020 2021
1 Managing Director 2,400,000
2 General Manager - - - - -
3 Farm Manager 1,440,000 1,584,000 1,742,400 1,916,640 2,108,304
4 Agronomist 1,200,000 1,320,000 1,452,000 1,597,200 1,756,920
5 Factory Manager 1,080,000 1,188,000 1,306,800 1,437,480 1,581,228
6 Finance/Admin. Manager (Group) 1,800,000 1,980,000 2,178,000 2,395,800 2,635,380
7 Quality/Procurement Manager 1,200,000 1,320,000 1,452,000 1,597,200 1,756,920
8 Personnel Manager 1,080,000 1,188,000 1,306,800 1,437,480 1,581,228
9 Maintenance Manager 900,000 990,000 1,089,000 1,197,900 1,317,690
10 Internal Auditor 1,140,000 1,254,000 1,379,400 1,517,340 1,669,074
11 Stores Officer 1,440,000 1,584,000 1,742,400 1,916,640 2,108,304
12 Shift Supervisor (Factory) 1,800,000 1,980,000 2,178,000 2,395,800 2,635,380
13 Security Officer 420,000 462,000 508,200 559,020 614,922
14 Security Guards 2,400,000 2,640,000 2,904,000 3,194,400 3,513,840
15 Marketing Manager 1,200,000 1,320,000 1,452,000 1,597,200 1,756,920
16 Sales Officers 3,600,000 3,960,000 4,356,000 4,791,600 5,270,760
17 Farms Workers (Women & Youth) 16,800,000 18,480,000 20,328,000 22,360,800 24,596,880
18 Senior Driver/Drivers 1,800,000 1,980,000 2,178,000 2,395,800 2,635,380
19 Factory Workers 5,520,000 6,072,000 6,679,200 7,347,120 8,081,832
20 Accounts/Store Clerks 1,800,000 1,980,000 2,178,000 2,395,800 2,635,380
21 Workshop Supervisors- Electrical Mechanical 960,000 1,056,000.0 1,161,600.0 1,277,760.0 1,405,536.0
TOTAL 47,580,000 52,338,000 57,571,800 63,328,980 69,661,878
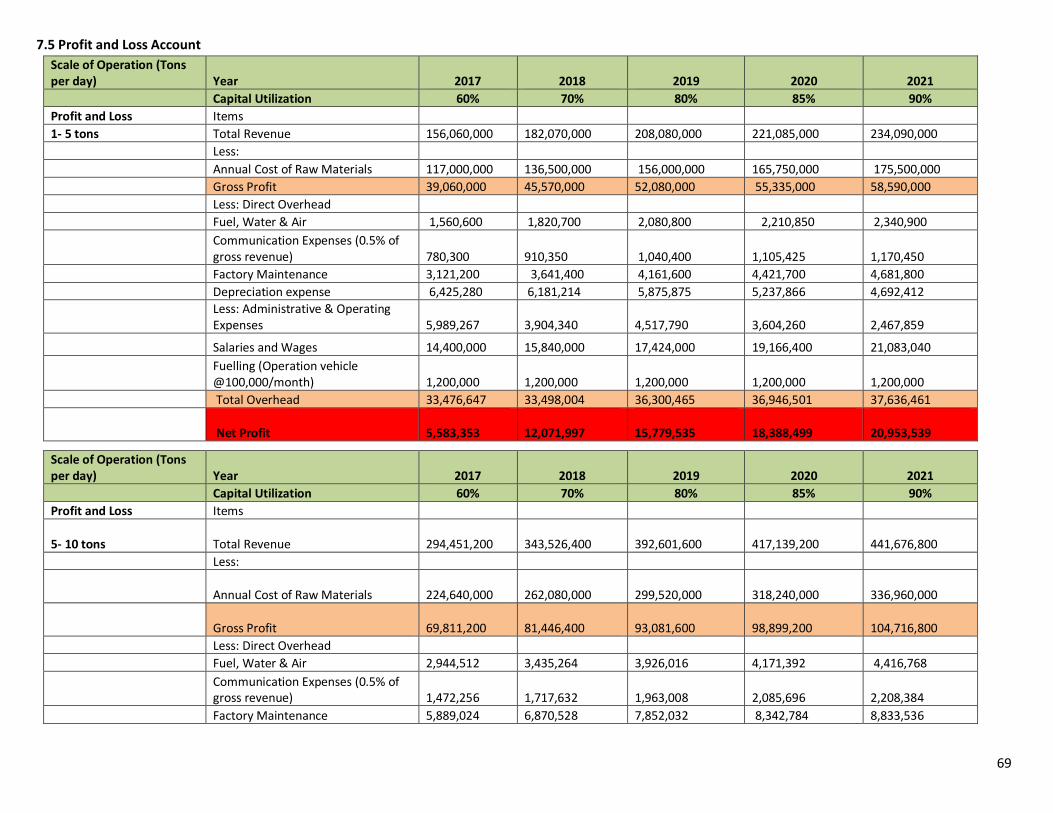
69
7.5 Profit and Loss Account
Scale of Operation (Tons per day) Year 2017 2018 2019 2020 2021
Capital Utilization 60% 70% 80% 85% 90%
Profit and Loss Items
1- 5 tons Total Revenue 156,060,000 182,070,000 208,080,000 221,085,000 234,090,000
Less:
Annual Cost of Raw Materials 117,000,000 136,500,000 156,000,000 165,750,000 175,500,000
Gross Profit 39,060,000 45,570,000 52,080,000 55,335,000 58,590,000
Less: Direct Overhead
Fuel, Water & Air 1,560,600 1,820,700 2,080,800 2,210,850 2,340,900
Communication Expenses (0.5% of gross revenue)
780,300
910,350 1,040,400 1,105,425 1,170,450
Factory Maintenance 3,121,200 3,641,400 4,161,600 4,421,700 4,681,800
Depreciation expense 6,425,280 6,181,214 5,875,875 5,237,866 4,692,412
Less: Administrative & Operating Expenses
5,989,267
3,904,340
4,517,790
3,604,260
2,467,859
Salaries and Wages 14,400,000 15,840,000 17,424,000 19,166,400 21,083,040
Fuelling (Operation vehicle @100,000/month)
1,200,000
1,200,000
1,200,000
1,200,000
1,200,000
Total Overhead 33,476,647 33,498,004 36,300,465 36,946,501 37,636,461
Net Profit 5,583,353
12,071,997
15,779,535
18,388,499
20,953,539
Scale of Operation (Tons per day) Year 2017 2018 2019 2020 2021
Capital Utilization 60% 70% 80% 85% 90%
Profit and Loss Items
5- 10 tons Total Revenue 294,451,200
343,526,400
392,601,600
417,139,200
441,676,800
Less:
Annual Cost of Raw Materials 224,640,000
262,080,000
299,520,000
318,240,000
336,960,000
Gross Profit 69,811,200
81,446,400
93,081,600
98,899,200
104,716,800
Less: Direct Overhead
Fuel, Water & Air 2,944,512 3,435,264 3,926,016 4,171,392 4,416,768
Communication Expenses (0.5% of gross revenue) 1,472,256 1,717,632 1,963,008 2,085,696 2,208,384
Factory Maintenance 5,889,024 6,870,528 7,852,032 8,342,784 8,833,536
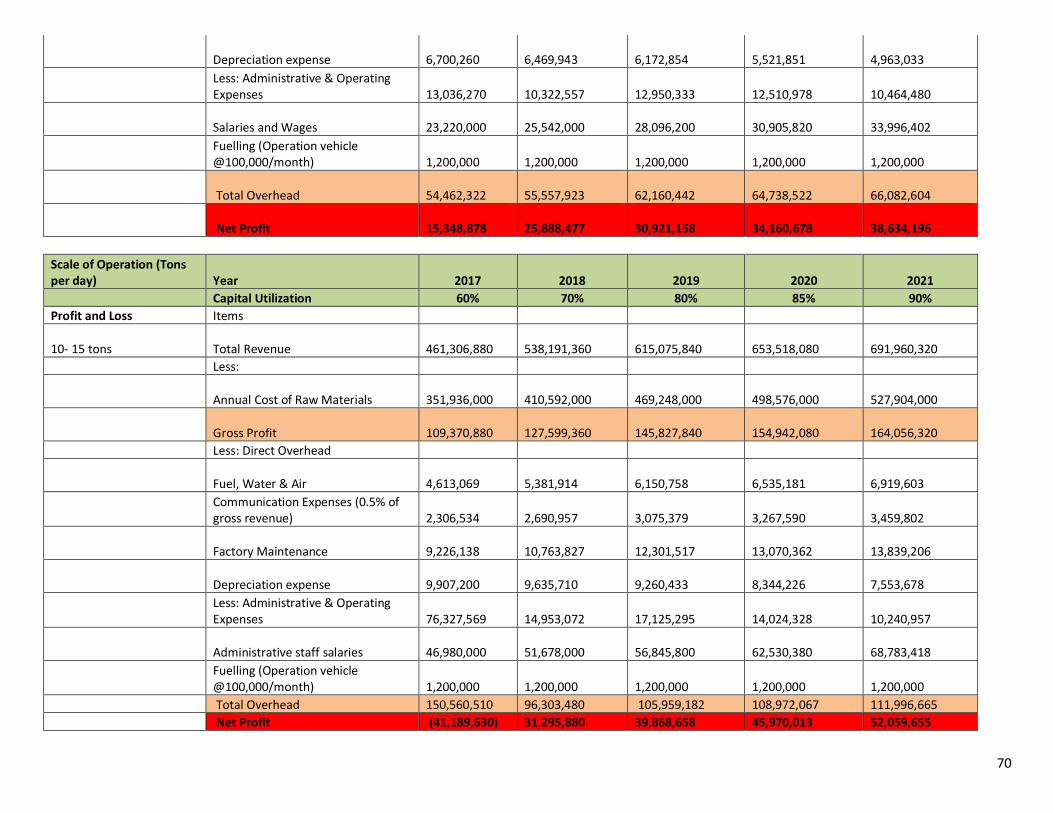
70
Depreciation expense 6,700,260
6,469,943
6,172,854
5,521,851
4,963,033
Less: Administrative & Operating Expenses
13,036,270
10,322,557
12,950,333
12,510,978
10,464,480
Salaries and Wages 23,220,000
25,542,000
28,096,200
30,905,820
33,996,402
Fuelling (Operation vehicle @100,000/month)
1,200,000
1,200,000
1,200,000
1,200,000
1,200,000
Total Overhead 54,462,322
55,557,923
62,160,442
64,738,522
66,082,604
Net Profit 15,348,878
25,888,477
30,921,158
34,160,678
38,634,196
Scale of Operation (Tons per day) Year 2017 2018 2019 2020 2021
Capital Utilization 60% 70% 80% 85% 90%
Profit and Loss Items
10- 15 tons Total Revenue 461,306,880
538,191,360
615,075,840
653,518,080
691,960,320
Less:
Annual Cost of Raw Materials 351,936,000
410,592,000
469,248,000
498,576,000
527,904,000
Gross Profit 109,370,880
127,599,360
145,827,840
154,942,080
164,056,320
Less: Direct Overhead
Fuel, Water & Air 4,613,069
5,381,914
6,150,758
6,535,181
6,919,603
Communication Expenses (0.5% of gross revenue)
2,306,534
2,690,957
3,075,379
3,267,590
3,459,802
Factory Maintenance 9,226,138
10,763,827
12,301,517
13,070,362
13,839,206
Depreciation expense 9,907,200
9,635,710
9,260,433
8,344,226
7,553,678
Less: Administrative & Operating Expenses
76,327,569
14,953,072
17,125,295
14,024,328
10,240,957
Administrative staff salaries 46,980,000
51,678,000
56,845,800
62,530,380
68,783,418
Fuelling (Operation vehicle @100,000/month)
1,200,000
1,200,000
1,200,000
1,200,000
1,200,000
Total Overhead 150,560,510 96,303,480 105,959,182 108,972,067 111,996,665
Net Profit (41,189,630) 31,295,880 39,868,658 45,970,013 52,059,655
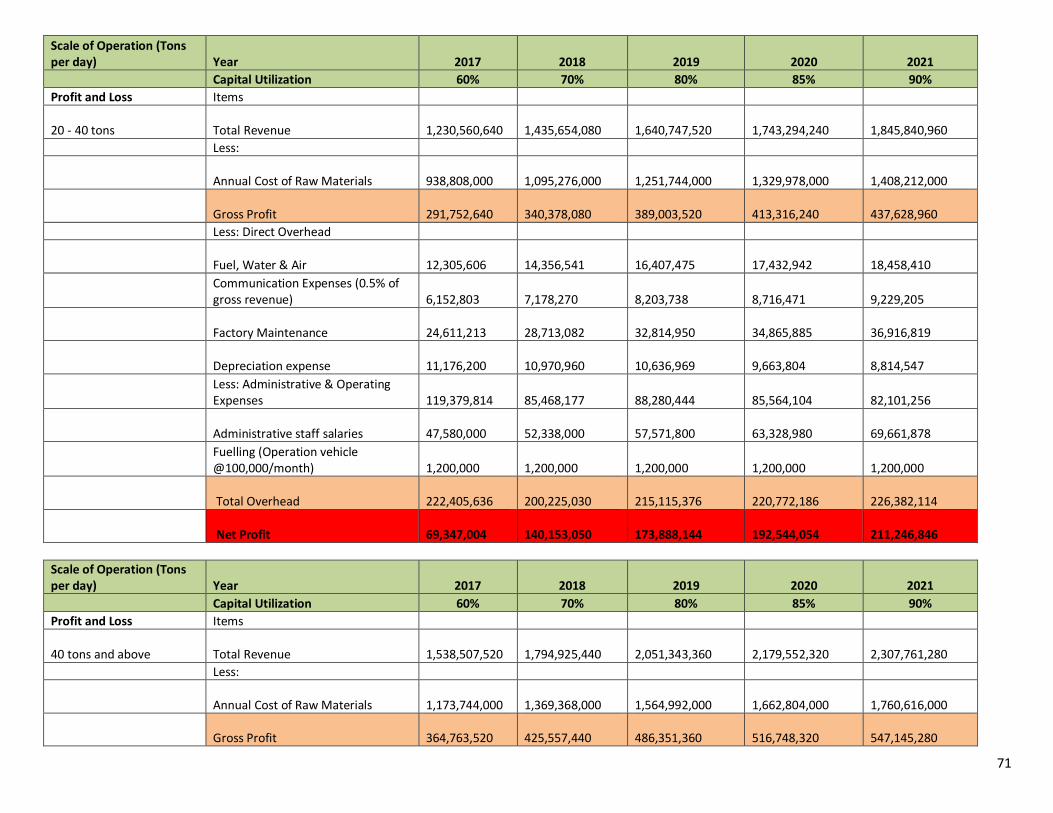
71
Scale of Operation (Tons per day) Year 2017 2018 2019 2020 2021
Capital Utilization 60% 70% 80% 85% 90%
Profit and Loss Items
20 - 40 tons Total Revenue 1,230,560,640
1,435,654,080
1,640,747,520
1,743,294,240
1,845,840,960
Less:
Annual Cost of Raw Materials 938,808,000
1,095,276,000
1,251,744,000
1,329,978,000
1,408,212,000
Gross Profit 291,752,640
340,378,080
389,003,520
413,316,240
437,628,960
Less: Direct Overhead
Fuel, Water & Air 12,305,606
14,356,541
16,407,475
17,432,942
18,458,410
Communication Expenses (0.5% of gross revenue)
6,152,803
7,178,270
8,203,738
8,716,471
9,229,205
Factory Maintenance 24,611,213
28,713,082
32,814,950
34,865,885
36,916,819
Depreciation expense 11,176,200
10,970,960
10,636,969
9,663,804
8,814,547
Less: Administrative & Operating Expenses
119,379,814
85,468,177
88,280,444
85,564,104
82,101,256
Administrative staff salaries 47,580,000
52,338,000
57,571,800
63,328,980
69,661,878
Fuelling (Operation vehicle @100,000/month)
1,200,000
1,200,000
1,200,000
1,200,000
1,200,000
Total Overhead 222,405,636
200,225,030
215,115,376
220,772,186
226,382,114
Net Profit 69,347,004
140,153,050
173,888,144
192,544,054
211,246,846
Scale of Operation (Tons per day) Year 2017 2018 2019 2020 2021
Capital Utilization 60% 70% 80% 85% 90%
Profit and Loss Items
40 tons and above Total Revenue 1,538,507,520
1,794,925,440
2,051,343,360
2,179,552,320
2,307,761,280
Less:
Annual Cost of Raw Materials 1,173,744,000
1,369,368,000
1,564,992,000
1,662,804,000
1,760,616,000
Gross Profit 364,763,520
425,557,440
486,351,360
516,748,320
547,145,280
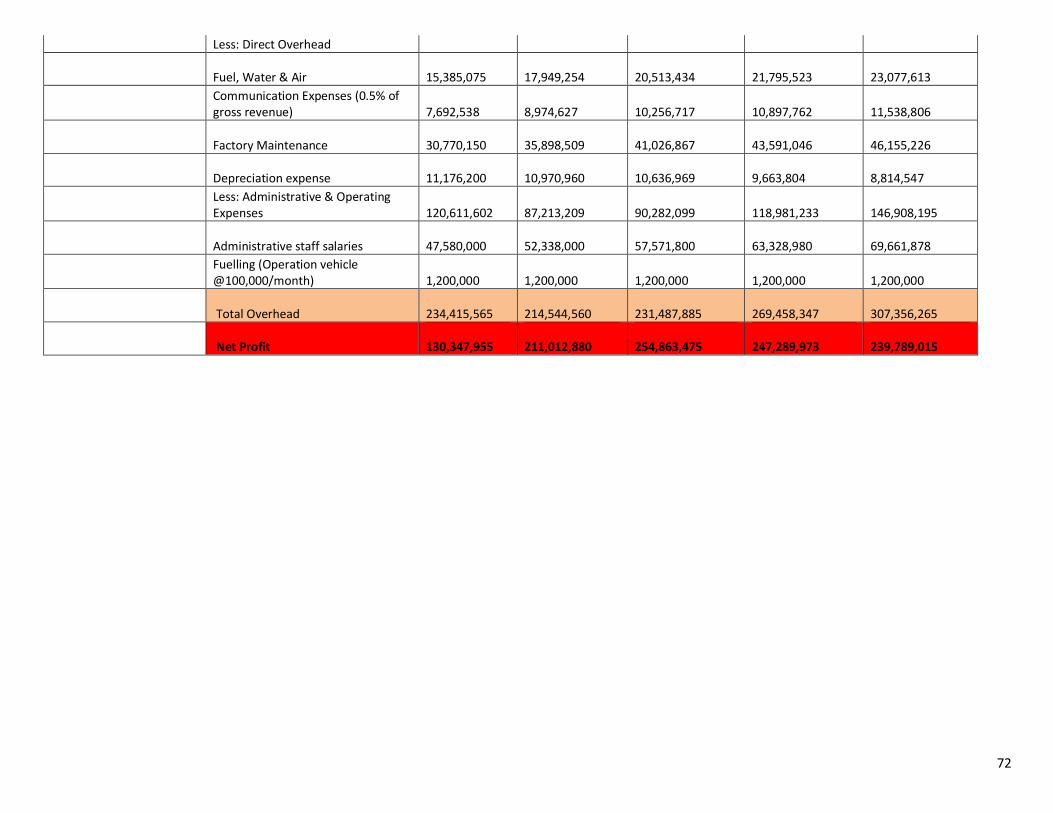
72
Less: Direct Overhead
Fuel, Water & Air 15,385,075
17,949,254
20,513,434
21,795,523
23,077,613
Communication Expenses (0.5% of gross revenue)
7,692,538
8,974,627
10,256,717
10,897,762
11,538,806
Factory Maintenance 30,770,150
35,898,509
41,026,867
43,591,046
46,155,226
Depreciation expense 11,176,200
10,970,960
10,636,969
9,663,804
8,814,547
Less: Administrative & Operating Expenses
120,611,602
87,213,209
90,282,099
118,981,233
146,908,195
Administrative staff salaries 47,580,000
52,338,000
57,571,800
63,328,980
69,661,878
Fuelling (Operation vehicle @100,000/month)
1,200,000
1,200,000
1,200,000
1,200,000
1,200,000
Total Overhead 234,415,565
214,544,560
231,487,885
269,458,347
307,356,265
Net Profit 130,347,955
211,012,880
254,863,475
247,289,973
239,789,015
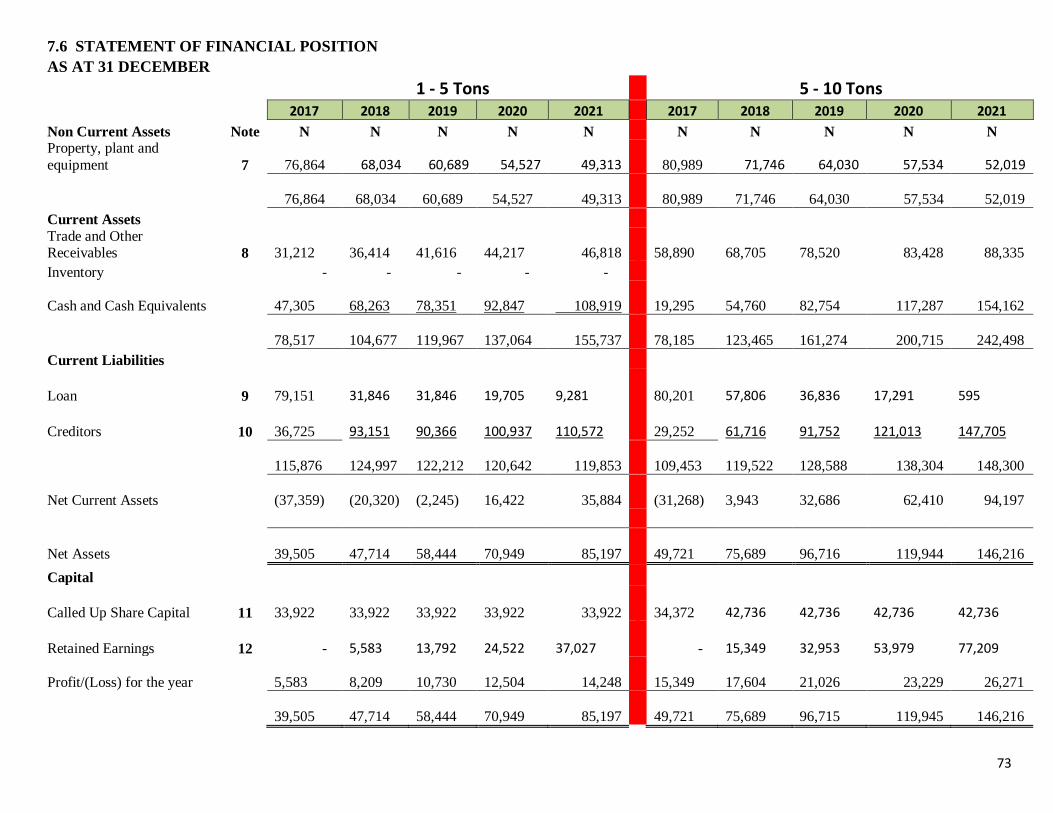
73
7.6 STATEMENT OF FINANCIAL POSITION AS AT 31 DECEMBER
1 - 5 Tons 5 - 10 Tons
2017 2018 2019 2020 2021 2017 2018 2019 2020 2021
Non Current Assets Note N N N N N N N N N N Property, plant and
equipment 7
76,864 68,034 60,689 54,527 49,313
80,989 71,746 64,030 57,534 52,019
76,864
68,034
60,689
54,527 49,313
80,989
71,746
64,030 57,534 52,019
Current Assets Trade and Other Receivables 8
31,212
36,414
41,616
44,217 46,818
58,890
68,705
78,520 83,428 88,335
Inventory - - - - -
Cash and Cash Equivalents
47,305
68,263
78,351
92,847 108,919
19,295
54,760
82,754 117,287 154,162
78,517
104,677
119,967
137,064 155,737
78,185
123,465
161,274 200,715 242,498
Current Liabilities
Loan 9
79,151
31,846
31,846
19,705
9,281
80,201
57,806
36,836
17,291
595
Creditors 10
36,725
93,151
90,366
100,937
110,572
29,252
61,716
91,752
121,013
147,705
115,876
124,997
122,212
120,642 119,853
109,453
119,522
128,588 138,304 148,300
Net Current Assets
(37,359)
(20,320)
(2,245)
16,422 35,884
(31,268)
3,943
32,686 62,410 94,197
Net Assets
39,505
47,714
58,444
70,949 85,197
49,721
75,689
96,716 119,944 146,216
Capital
Called Up Share Capital 11
33,922
33,922
33,922
33,922 33,922
34,372
42,736
42,736
42,736
42,736
Retained Earnings 12 -
5,583
13,792
24,522
37,027 -
15,349
32,953
53,979
77,209
Profit/(Loss) for the year
5,583
8,209
10,730
12,504 14,248
15,349
17,604
21,026 23,229 26,271
39,505
47,714
58,444
70,949 85,197
49,721
75,689
96,715 119,945 146,216
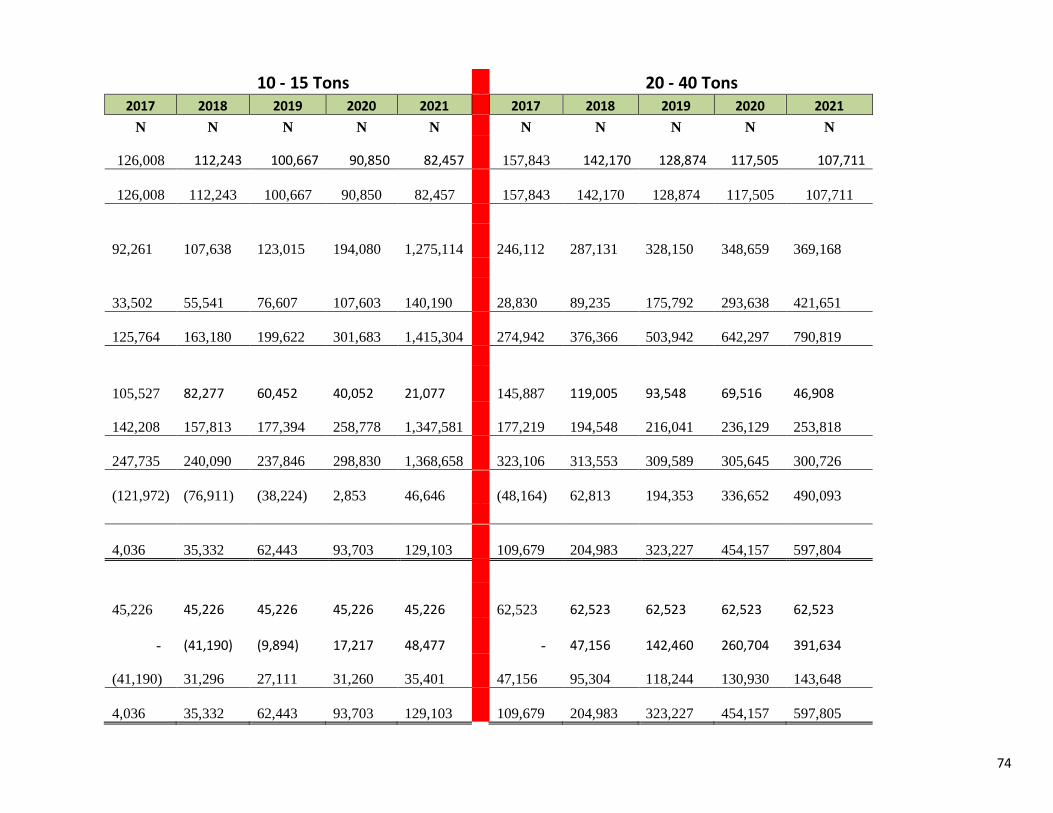
74
10 - 15 Tons 20 - 40 Tons 2017 2018 2019 2020 2021 2017 2018 2019 2020 2021
N N N N N N N N N N
126,008 112,243 100,667 90,850 82,457
157,843 142,170 128,874 117,505 107,711
126,008
112,243
100,667
90,850
82,457
157,843
142,170
128,874
117,505
107,711
92,261
107,638
123,015
194,080
1,275,114
246,112
287,131
328,150
348,659
369,168
33,502
55,541
76,607
107,603
140,190
28,830
89,235
175,792
293,638
421,651
125,764
163,180
199,622
301,683
1,415,304
274,942
376,366
503,942
642,297
790,819
105,527
82,277
60,452
40,052
21,077
145,887
119,005
93,548
69,516
46,908
142,208
157,813
177,394
258,778
1,347,581
177,219
194,548
216,041
236,129
253,818
247,735
240,090
237,846
298,830
1,368,658
323,106
313,553
309,589
305,645
300,726
(121,972)
(76,911)
(38,224)
2,853
46,646
(48,164)
62,813
194,353
336,652
490,093
4,036
35,332
62,443
93,703
129,103
109,679
204,983
323,227
454,157
597,804
45,226
45,226
45,226
45,226
45,226
62,523
62,523
62,523
62,523
62,523
-
(41,190)
(9,894)
17,217
48,477 -
47,156
142,460
260,704
391,634
(41,190)
31,296
27,111
31,260
35,401
47,156
95,304
118,244
130,930
143,648
4,036
35,332
62,443
93,703
129,103
109,679
204,983
323,227
454,157
597,805
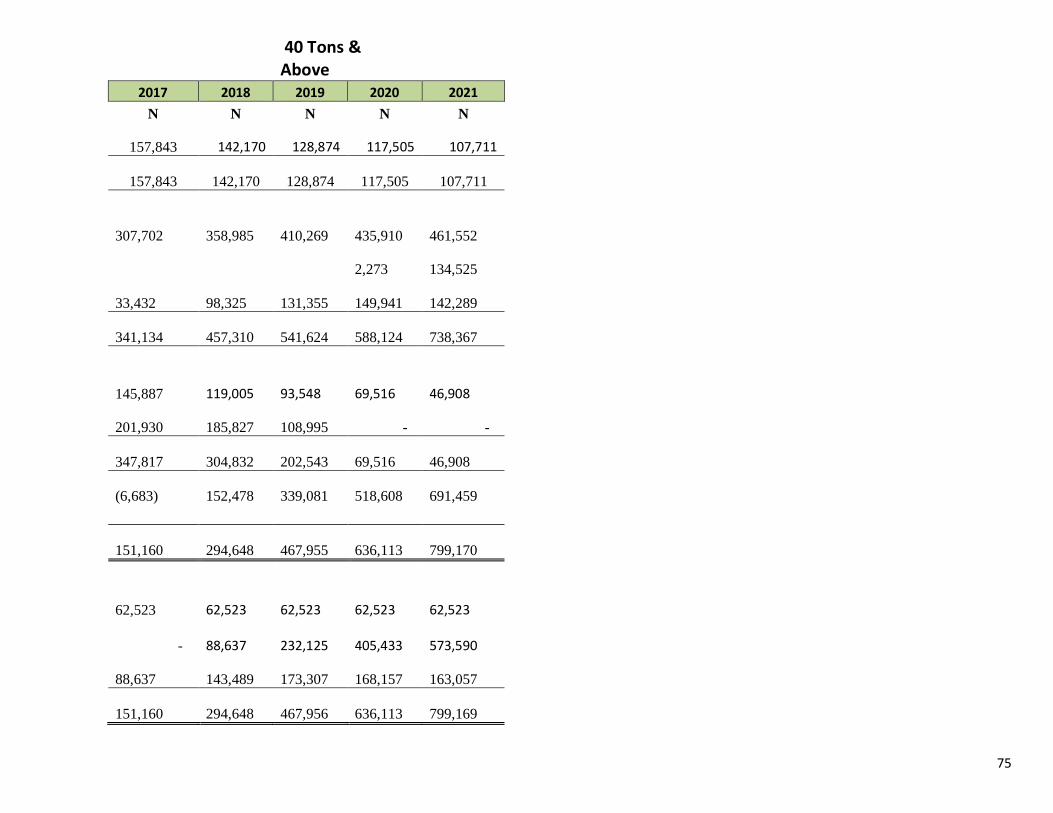
75
40 Tons & Above
2017 2018 2019 2020 2021
N N N N N
157,843 142,170 128,874 117,505 107,711
157,843
142,170
128,874
117,505
107,711
307,702
358,985
410,269
435,910
461,552
2,273
134,525
33,432
98,325
131,355
149,941
142,289
341,134
457,310
541,624
588,124
738,367
145,887
119,005
93,548
69,516
46,908
201,930
185,827
108,995 - -
347,817
304,832
202,543
69,516
46,908
(6,683)
152,478
339,081
518,608
691,459
151,160
294,648
467,955
636,113
799,170
62,523
62,523
62,523
62,523
62,523
-
88,637
232,125
405,433
573,590
88,637
143,489
173,307
168,157
163,057
151,160
294,648
467,956
636,113
799,169
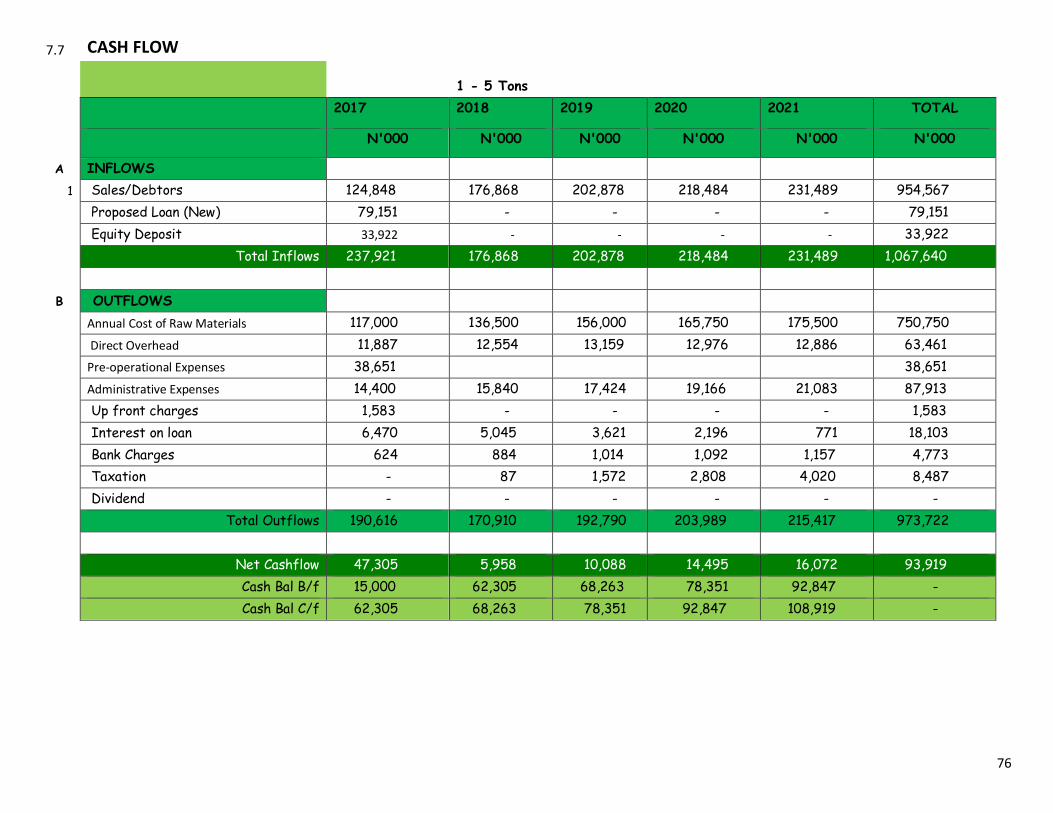
76
7.7 CASH FLOW
1 - 5 Tons
2017 2018 2019 2020 2021 TOTAL
N'000 N'000 N'000 N'000 N'000 N'000
A INFLOWS
1 Sales/Debtors 124,848 176,868 202,878 218,484 231,489 954,567
Proposed Loan (New) 79,151 - - - - 79,151
Equity Deposit 33,922 - - - - 33,922
Total Inflows 237,921 176,868 202,878 218,484 231,489 1,067,640
B OUTFLOWS
Annual Cost of Raw Materials 117,000 136,500 156,000 165,750 175,500 750,750
Direct Overhead 11,887 12,554 13,159 12,976 12,886 63,461
Pre-operational Expenses 38,651 38,651
Administrative Expenses 14,400 15,840 17,424 19,166 21,083 87,913
Up front charges 1,583 - - - - 1,583
Interest on loan 6,470 5,045 3,621 2,196 771 18,103
Bank Charges 624 884 1,014 1,092 1,157 4,773
Taxation - 87 1,572 2,808 4,020 8,487
Dividend - - - - - -
Total Outflows 190,616 170,910 192,790 203,989 215,417 973,722
Net Cashflow 47,305 5,958 10,088 14,495 16,072 93,919
Cash Bal B/f 15,000 62,305 68,263 78,351 92,847 -
Cash Bal C/f 62,305 68,263 78,351 92,847 108,919 -
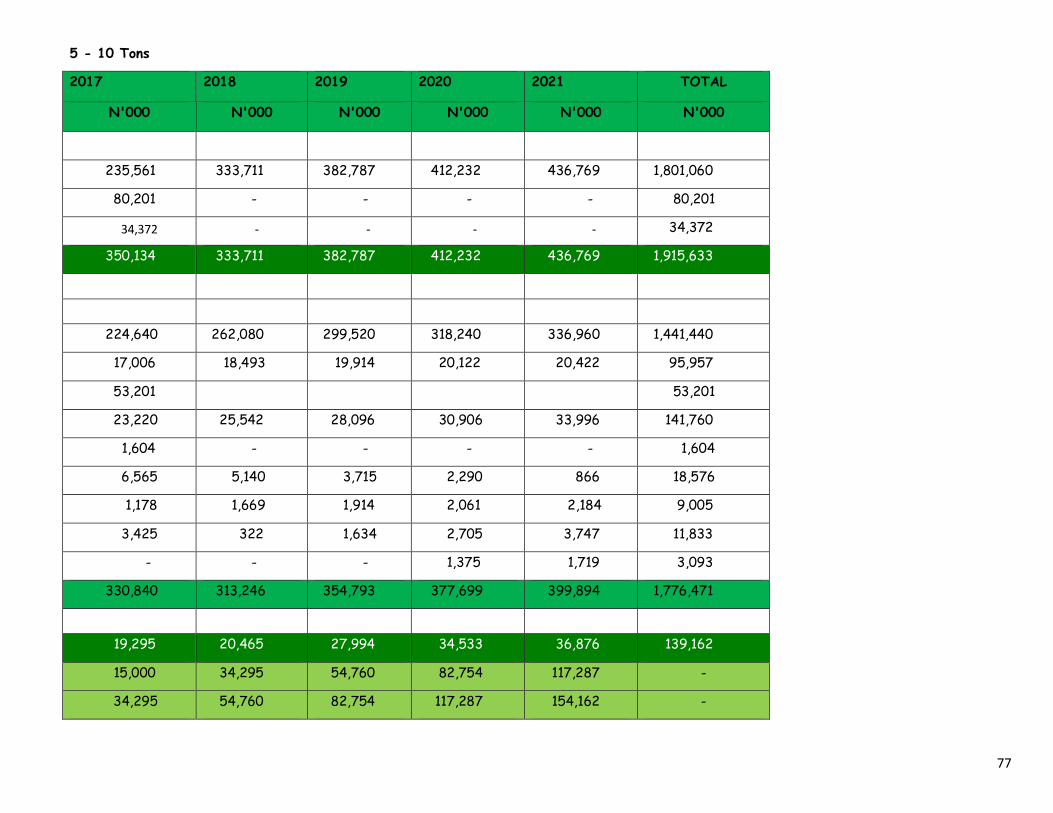
77
5 - 10 Tons
2017 2018 2019 2020 2021 TOTAL
N'000 N'000 N'000 N'000 N'000 N'000
235,561 333,711 382,787 412,232 436,769 1,801,060
80,201 - - - - 80,201
34,372 - - - - 34,372
350,134 333,711 382,787 412,232 436,769 1,915,633
224,640 262,080 299,520 318,240 336,960 1,441,440
17,006 18,493 19,914 20,122 20,422 95,957
53,201 53,201
23,220 25,542 28,096 30,906 33,996 141,760
1,604 - - - - 1,604
6,565 5,140 3,715 2,290 866 18,576
1,178 1,669 1,914 2,061 2,184 9,005
3,425 322 1,634 2,705 3,747 11,833
- - - 1,375 1,719 3,093
330,840 313,246 354,793 377,699 399,894 1,776,471
19,295 20,465 27,994 34,533 36,876 139,162
15,000 34,295 54,760 82,754 117,287 -
34,295 54,760 82,754 117,287 154,162 -
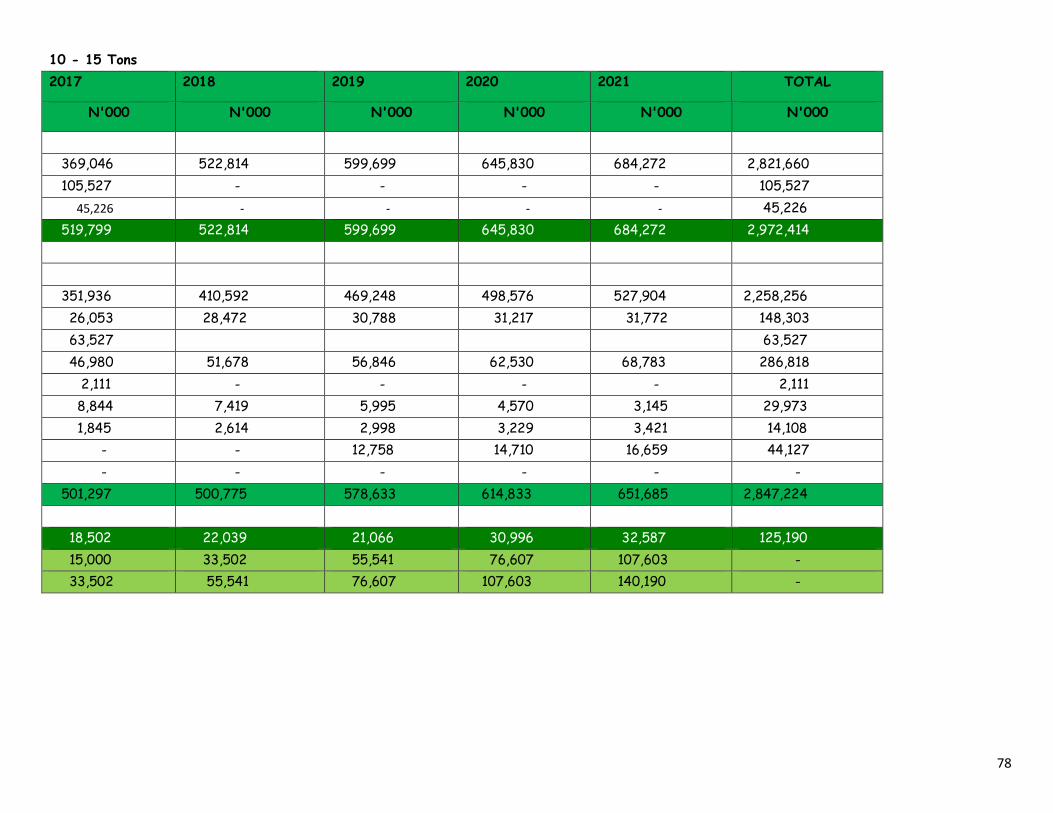
78
10 - 15 Tons 2017 2018 2019 2020 2021 TOTAL
N'000 N'000 N'000 N'000 N'000 N'000
369,046 522,814 599,699 645,830 684,272 2,821,660
105,527 - - - - 105,527
45,226 - - - - 45,226
519,799 522,814 599,699 645,830 684,272 2,972,414
351,936 410,592 469,248 498,576 527,904 2,258,256
26,053 28,472 30,788 31,217 31,772 148,303
63,527 63,527
46,980 51,678 56,846 62,530 68,783 286,818
2,111 - - - - 2,111
8,844 7,419 5,995 4,570 3,145 29,973
1,845 2,614 2,998 3,229 3,421 14,108
- - 12,758 14,710 16,659 44,127
- - - - - -
501,297 500,775 578,633 614,833 651,685 2,847,224
18,502 22,039 21,066 30,996 32,587 125,190
15,000 33,502 55,541 76,607 107,603 -
33,502 55,541 76,607 107,603 140,190 -
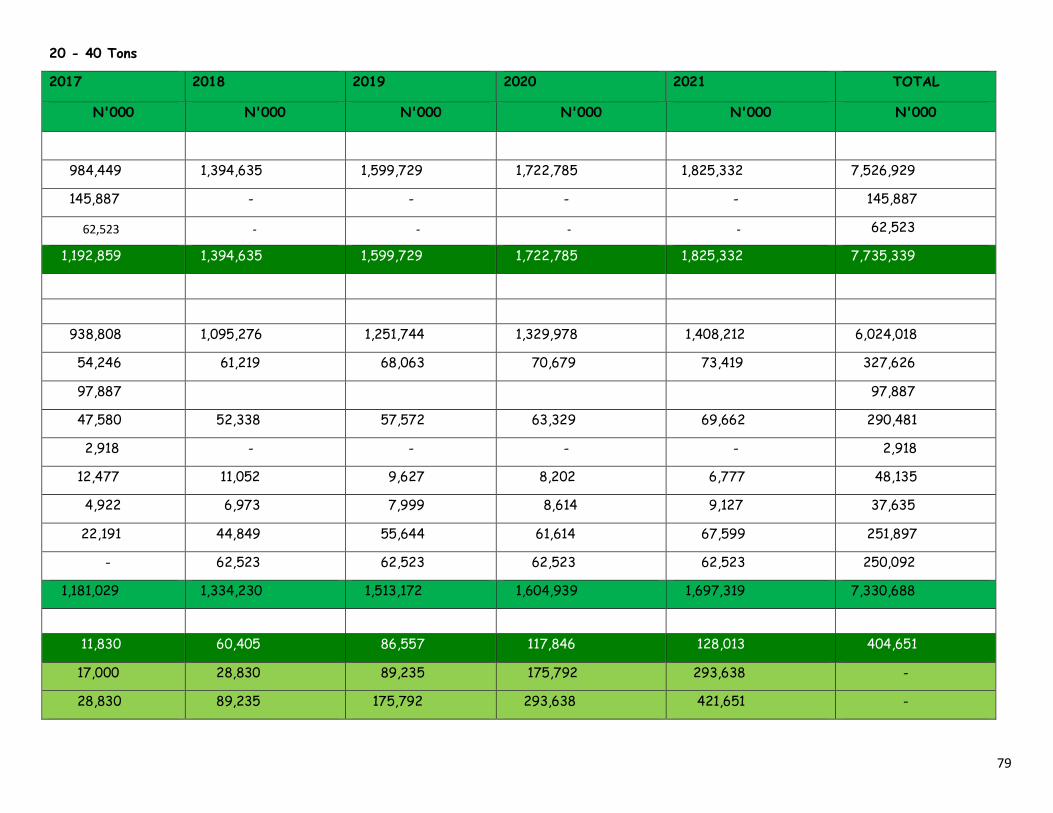
79
20 - 40 Tons
2017 2018 2019 2020 2021 TOTAL
N'000 N'000 N'000 N'000 N'000 N'000
984,449 1,394,635 1,599,729 1,722,785 1,825,332 7,526,929
145,887 - - - - 145,887
62,523 - - - - 62,523
1,192,859 1,394,635 1,599,729 1,722,785 1,825,332 7,735,339
938,808 1,095,276 1,251,744 1,329,978 1,408,212 6,024,018
54,246 61,219 68,063 70,679 73,419 327,626
97,887 97,887
47,580 52,338 57,572 63,329 69,662 290,481
2,918 - - - - 2,918
12,477 11,052 9,627 8,202 6,777 48,135
4,922 6,973 7,999 8,614 9,127 37,635
22,191 44,849 55,644 61,614 67,599 251,897
- 62,523 62,523 62,523 62,523 250,092
1,181,029 1,334,230 1,513,172 1,604,939 1,697,319 7,330,688
11,830 60,405 86,557 117,846 128,013 404,651
17,000 28,830 89,235 175,792 293,638 -
28,830 89,235 175,792 293,638 421,651 -
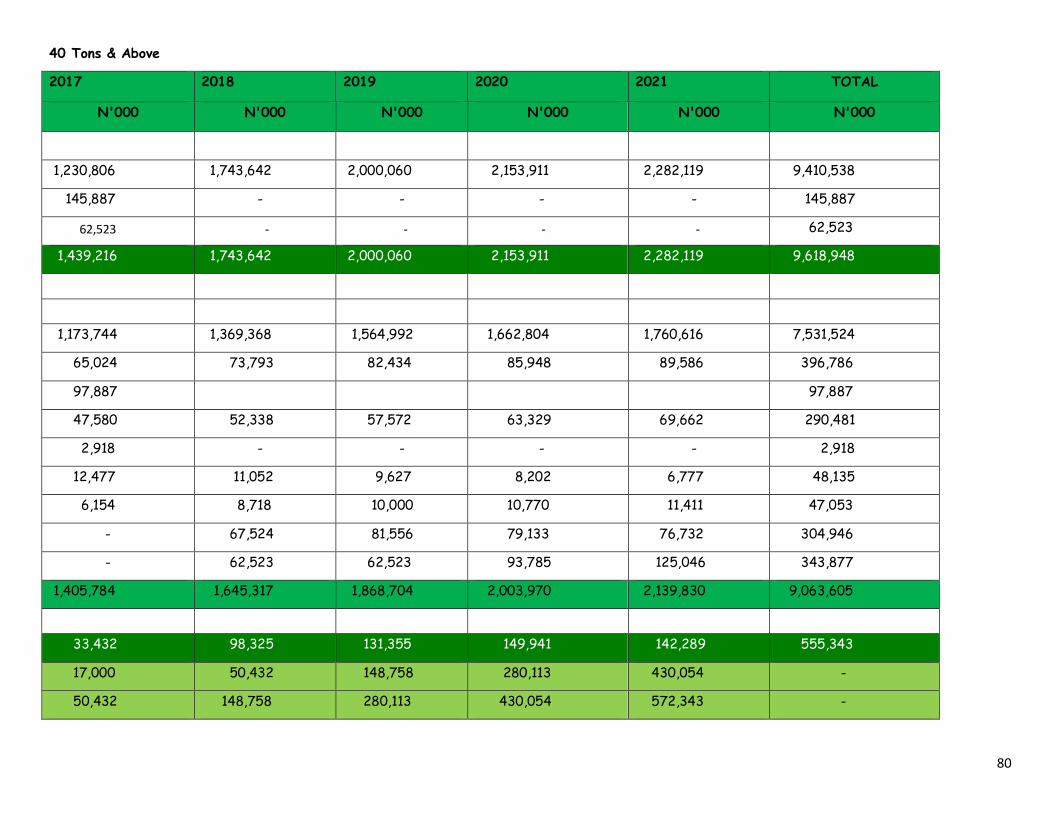
80
40 Tons & Above
2017 2018 2019 2020 2021 TOTAL
N'000 N'000 N'000 N'000 N'000 N'000
1,230,806 1,743,642 2,000,060 2,153,911 2,282,119 9,410,538
145,887 - - - - 145,887
62,523 - - - - 62,523
1,439,216 1,743,642 2,000,060 2,153,911 2,282,119 9,618,948
1,173,744 1,369,368 1,564,992 1,662,804 1,760,616 7,531,524
65,024 73,793 82,434 85,948 89,586 396,786
97,887 97,887
47,580 52,338 57,572 63,329 69,662 290,481
2,918 - - - - 2,918
12,477 11,052 9,627 8,202 6,777 48,135
6,154 8,718 10,000 10,770 11,411 47,053
- 67,524 81,556 79,133 76,732 304,946
- 62,523 62,523 93,785 125,046 343,877
1,405,784 1,645,317 1,868,704 2,003,970 2,139,830 9,063,605
33,432 98,325 131,355 149,941 142,289 555,343
17,000 50,432 148,758 280,113 430,054 -
50,432 148,758 280,113 430,054 572,343 -
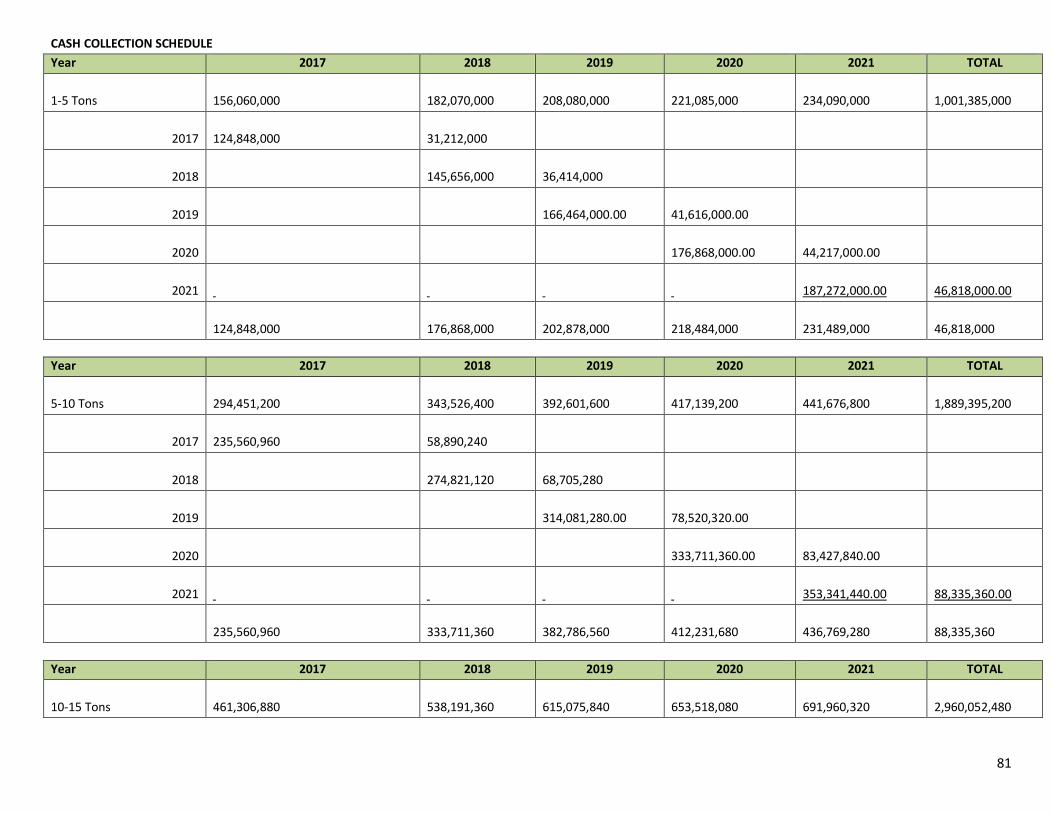
81
CASH COLLECTION SCHEDULE Year 2017 2018 2019 2020 2021 TOTAL
1-5 Tons
156,060,000
182,070,000
208,080,000
221,085,000
234,090,000
1,001,385,000
2017
124,848,000
31,212,000
2018
145,656,000
36,414,000
2019
166,464,000.00
41,616,000.00
2020
176,868,000.00
44,217,000.00
2021
187,272,000.00
46,818,000.00
124,848,000
176,868,000
202,878,000
218,484,000
231,489,000
46,818,000
Year 2017 2018 2019 2020 2021 TOTAL
5-10 Tons
294,451,200
343,526,400
392,601,600
417,139,200
441,676,800
1,889,395,200
2017
235,560,960
58,890,240
2018
274,821,120
68,705,280
2019
314,081,280.00
78,520,320.00
2020
333,711,360.00
83,427,840.00
2021
353,341,440.00
88,335,360.00
235,560,960
333,711,360
382,786,560
412,231,680
436,769,280
88,335,360
Year 2017 2018 2019 2020 2021 TOTAL
10-15 Tons
461,306,880
538,191,360
615,075,840
653,518,080
691,960,320
2,960,052,480
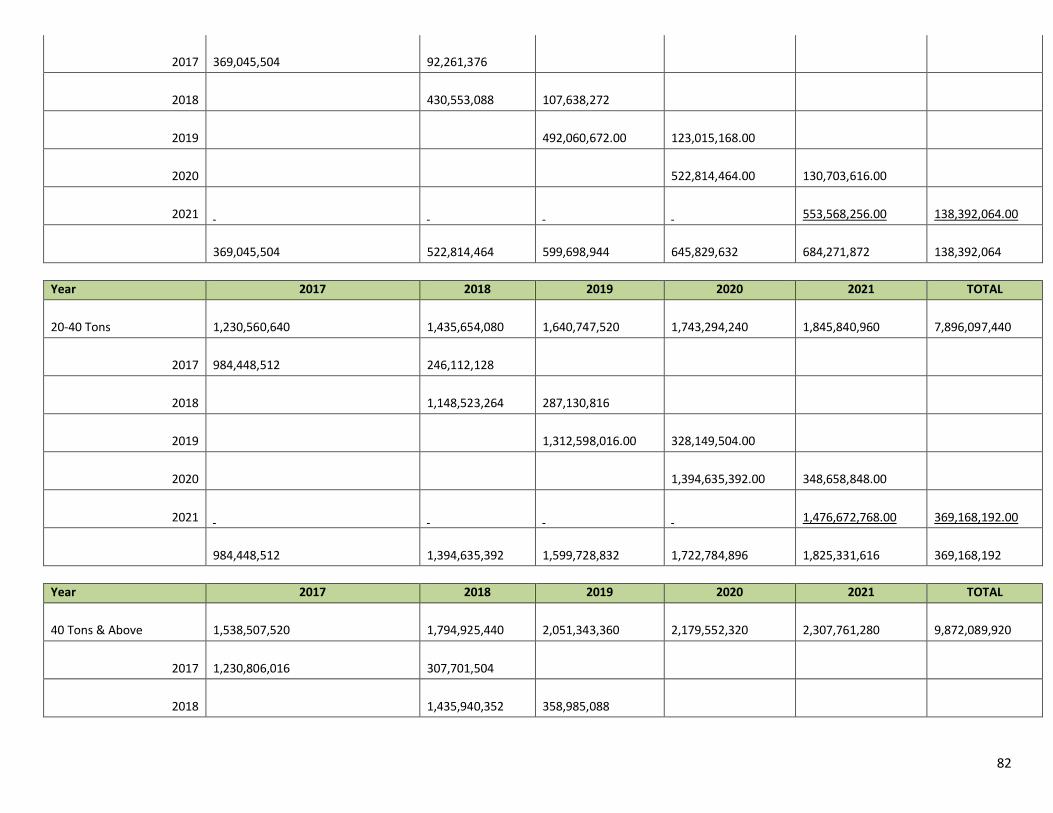
82
2017
369,045,504
92,261,376
2018
430,553,088
107,638,272
2019
492,060,672.00
123,015,168.00
2020
522,814,464.00
130,703,616.00
2021
553,568,256.00
138,392,064.00
369,045,504
522,814,464
599,698,944
645,829,632
684,271,872
138,392,064
Year 2017 2018 2019 2020 2021 TOTAL
20-40 Tons
1,230,560,640
1,435,654,080
1,640,747,520
1,743,294,240
1,845,840,960
7,896,097,440
2017
984,448,512
246,112,128
2018
1,148,523,264
287,130,816
2019
1,312,598,016.00
328,149,504.00
2020
1,394,635,392.00
348,658,848.00
2021
1,476,672,768.00
369,168,192.00
984,448,512
1,394,635,392
1,599,728,832
1,722,784,896
1,825,331,616
369,168,192
Year 2017 2018 2019 2020 2021 TOTAL
40 Tons & Above
1,538,507,520
1,794,925,440
2,051,343,360
2,179,552,320
2,307,761,280
9,872,089,920
2017
1,230,806,016
307,701,504
2018
1,435,940,352
358,985,088
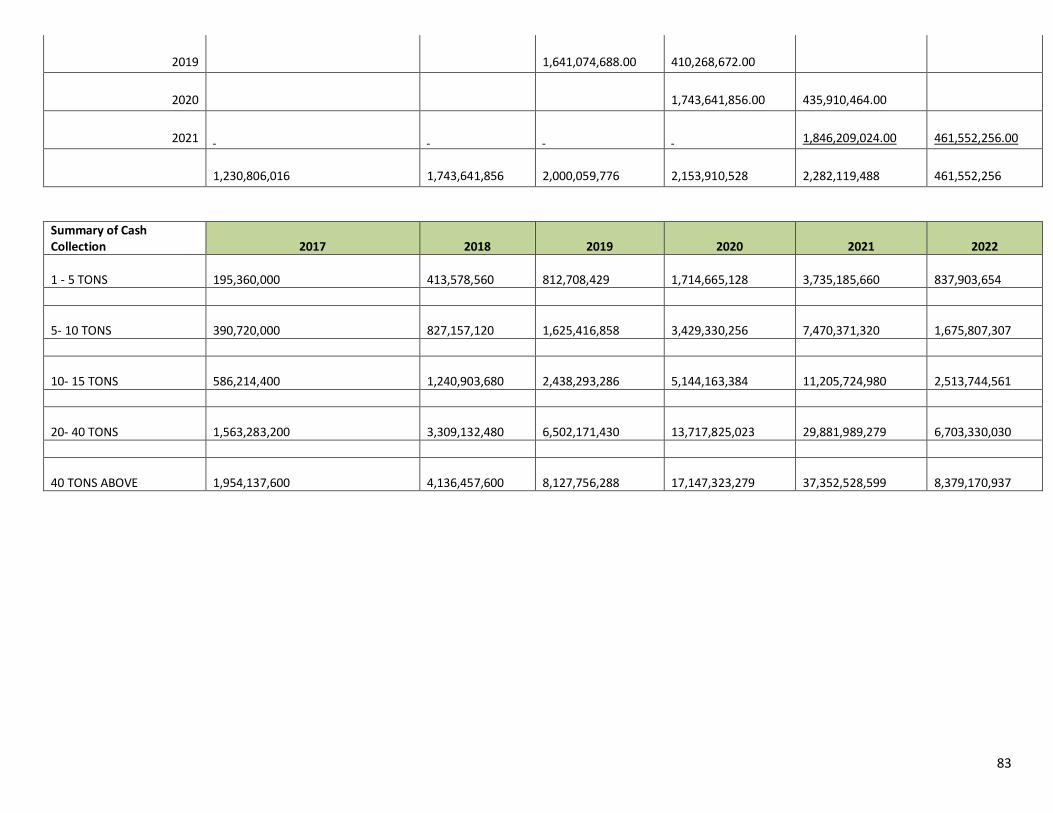
83
2019
1,641,074,688.00
410,268,672.00
2020
1,743,641,856.00
435,910,464.00
2021
1,846,209,024.00
461,552,256.00
1,230,806,016
1,743,641,856
2,000,059,776
2,153,910,528
2,282,119,488
461,552,256
Summary of Cash Collection 2017 2018 2019 2020 2021 2022
1 - 5 TONS 195,360,000
413,578,560
812,708,429
1,714,665,128
3,735,185,660
837,903,654
5- 10 TONS 390,720,000
827,157,120
1,625,416,858
3,429,330,256
7,470,371,320
1,675,807,307
10- 15 TONS 586,214,400
1,240,903,680
2,438,293,286
5,144,163,384
11,205,724,980
2,513,744,561
20- 40 TONS 1,563,283,200
3,309,132,480
6,502,171,430
13,717,825,023
29,881,989,279
6,703,330,030
40 TONS ABOVE 1,954,137,600
4,136,457,600
8,127,756,288
17,147,323,279
37,352,528,599
8,379,170,937
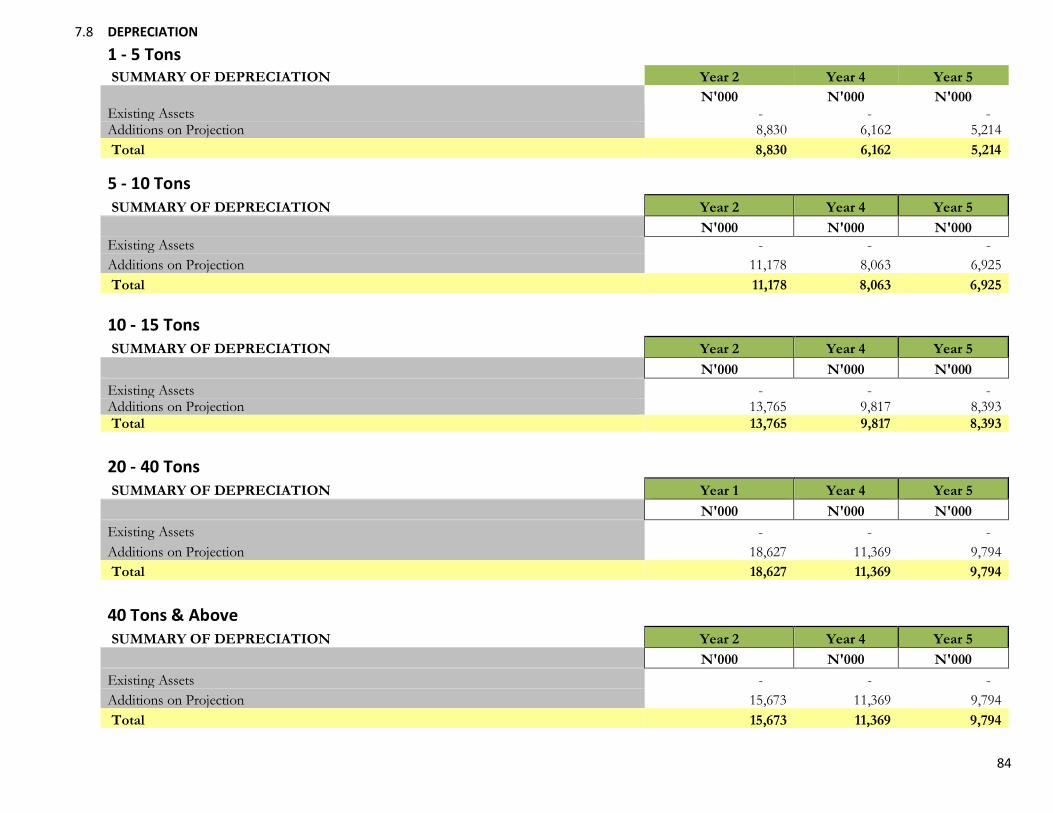
84
7.8 DEPRECIATION
1 - 5 Tons
SUMMARY OF DEPRECIATION Year 2 Year 4 Year 5
N'000 N'000 N'000
Existing Assets - - -
Additions on Projection 8,830 6,162 5,214
Total 8,830 6,162 5,214
5 - 10 Tons
SUMMARY OF DEPRECIATION Year 2 Year 4 Year 5
N'000 N'000 N'000
Existing Assets - - -
Additions on Projection 11,178 8,063 6,925
Total 11,178 8,063 6,925
10 - 15 Tons
SUMMARY OF DEPRECIATION Year 2 Year 4 Year 5
N'000 N'000 N'000
Existing Assets - - -
Additions on Projection 13,765 9,817 8,393
Total 13,765 9,817 8,393
20 - 40 Tons
SUMMARY OF DEPRECIATION Year 1 Year 4 Year 5
N'000 N'000 N'000
Existing Assets - - -
Additions on Projection 18,627 11,369 9,794
Total 18,627 11,369 9,794
40 Tons & Above
SUMMARY OF DEPRECIATION Year 2 Year 4 Year 5
N'000 N'000 N'000
Existing Assets - - -
Additions on Projection 15,673 11,369 9,794
Total 15,673 11,369 9,794
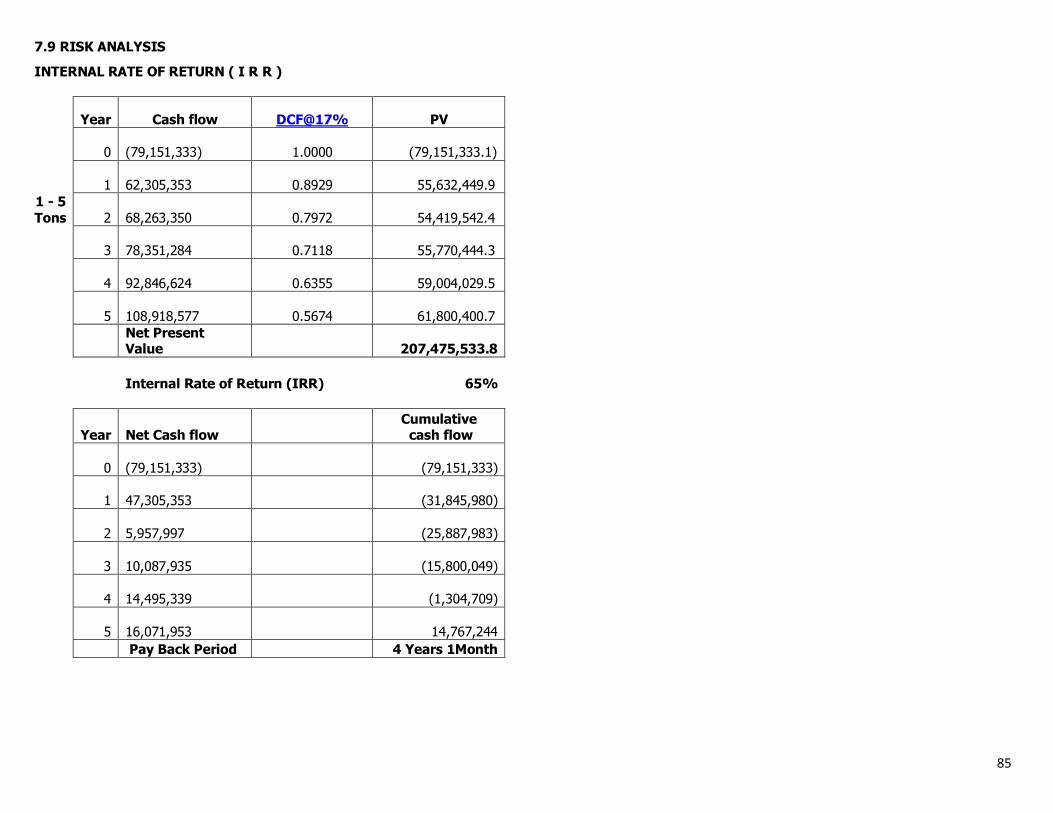
85
7.9 RISK ANALYSIS
INTERNAL RATE OF RETURN ( I R R )
Year Cash flow DCF@17% PV
0 (79,151,333) 1.0000 (79,151,333.1)
1 62,305,353 0.8929 55,632,449.9
1 - 5 Tons 2
68,263,350 0.7972 54,419,542.4
3 78,351,284 0.7118 55,770,444.3
4 92,846,624 0.6355 59,004,029.5
5 108,918,577 0.5674 61,800,400.7
Net Present Value
207,475,533.8
Internal Rate of Return (IRR) 65%
Year Net Cash flow Cumulative cash flow
0 (79,151,333)
(79,151,333)
1 47,305,353
(31,845,980)
2 5,957,997
(25,887,983)
3 10,087,935
(15,800,049)
4 14,495,339
(1,304,709)
5 16,071,953 14,767,244
Pay Back Period 4 Years 1Month
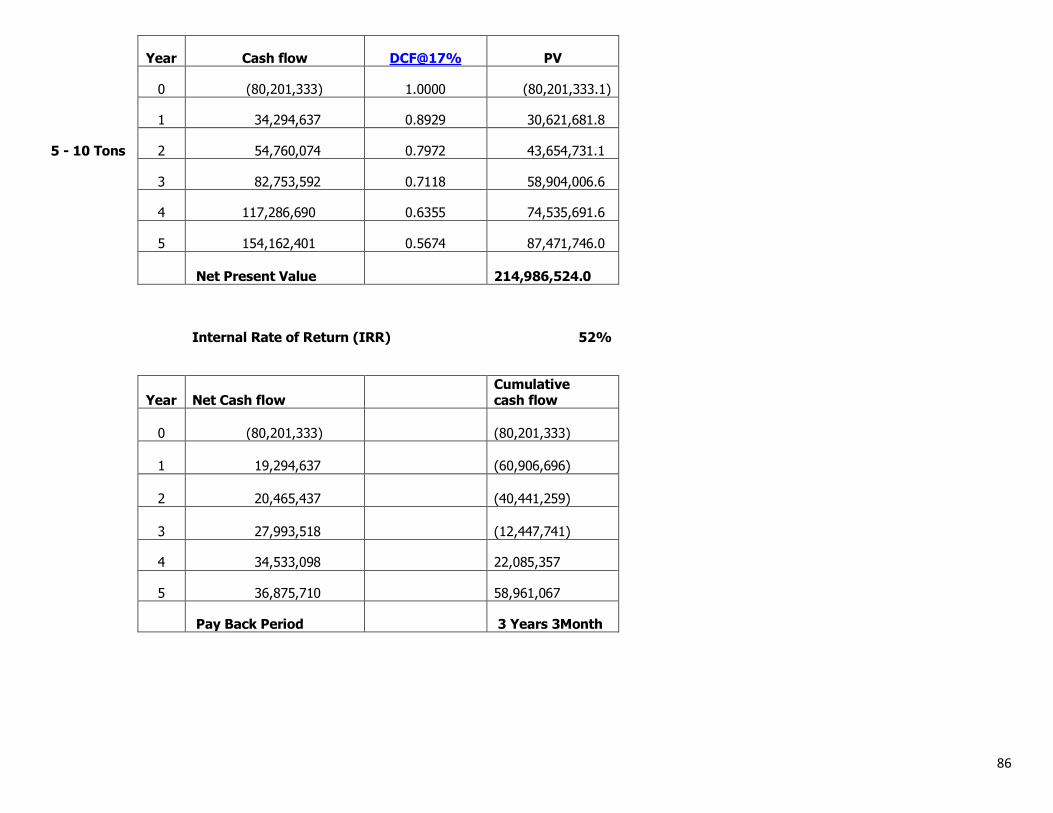
86
Year Cash flow DCF@17% PV
0 (80,201,333) 1.0000 (80,201,333.1)
1 34,294,637 0.8929 30,621,681.8
5 - 10 Tons 2 54,760,074 0.7972 43,654,731.1
3 82,753,592 0.7118 58,904,006.6
4 117,286,690 0.6355 74,535,691.6
5 154,162,401 0.5674 87,471,746.0
Net Present Value 214,986,524.0
Internal Rate of Return (IRR) 52%
Year Net Cash flow Cumulative cash flow
0 (80,201,333) (80,201,333)
1 19,294,637 (60,906,696)
2 20,465,437 (40,441,259)
3 27,993,518
(12,447,741)
4 34,533,098 22,085,357
5 36,875,710 58,961,067
Pay Back Period 3 Years 3Month
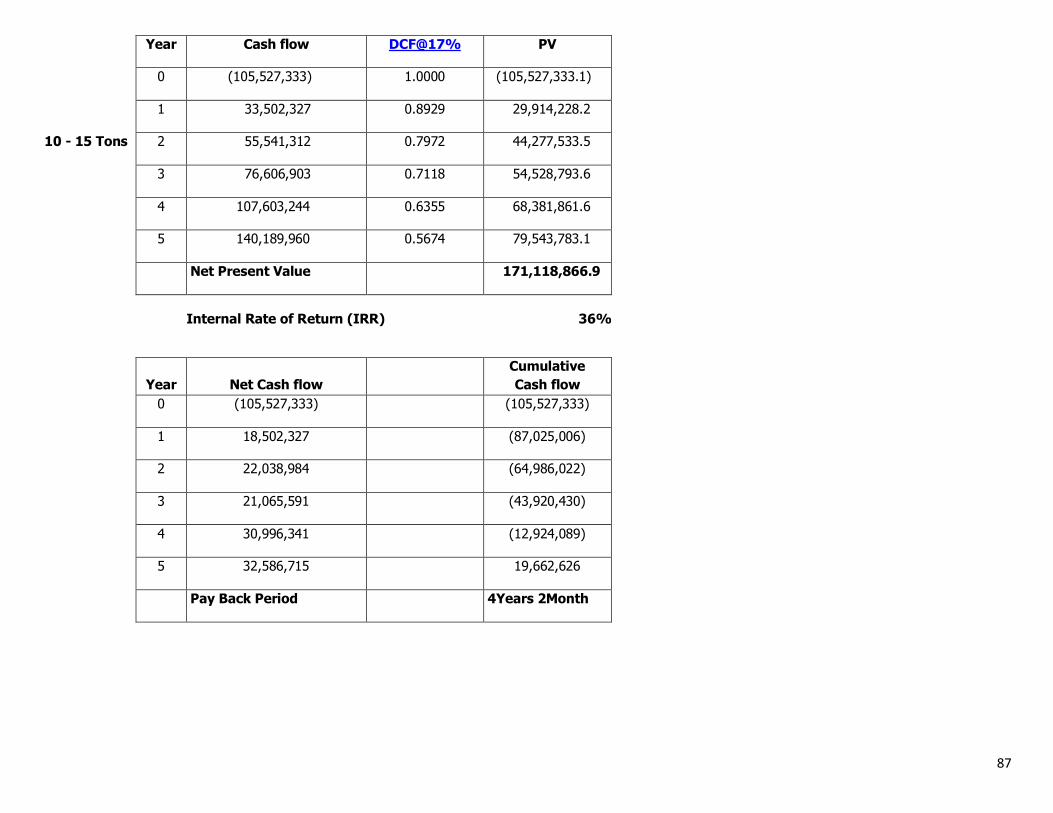
87
Year Cash flow DCF@17% PV
0 (105,527,333) 1.0000 (105,527,333.1)
1 33,502,327 0.8929 29,914,228.2
10 - 15 Tons 2 55,541,312 0.7972 44,277,533.5
3 76,606,903 0.7118 54,528,793.6
4 107,603,244 0.6355 68,381,861.6
5 140,189,960 0.5674 79,543,783.1
Net Present Value 171,118,866.9
Internal Rate of Return (IRR) 36%
Year Net Cash flow
Cumulative
Cash flow
0 (105,527,333)
(105,527,333)
1 18,502,327
(87,025,006)
2 22,038,984
(64,986,022)
3 21,065,591
(43,920,430)
4 30,996,341
(12,924,089)
5 32,586,715
19,662,626
Pay Back Period 4Years 2Month
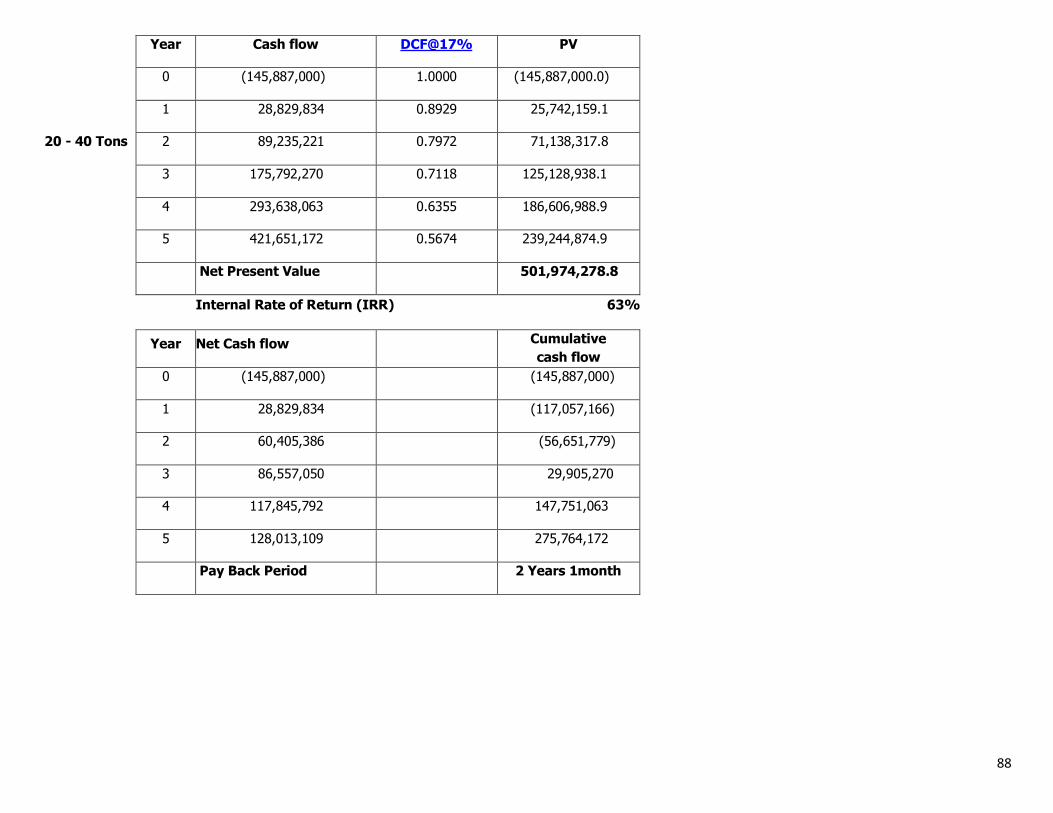
88
Year Cash flow DCF@17% PV
0 (145,887,000) 1.0000 (145,887,000.0)
1 28,829,834 0.8929 25,742,159.1
20 - 40 Tons 2 89,235,221 0.7972 71,138,317.8
3 175,792,270 0.7118 125,128,938.1
4 293,638,063 0.6355 186,606,988.9
5 421,651,172 0.5674 239,244,874.9
Net Present Value 501,974,278.8
Internal Rate of Return (IRR) 63%
Year Net Cash flow Cumulative
cash flow
0 (145,887,000) (145,887,000)
1 28,829,834 (117,057,166)
2 60,405,386 (56,651,779)
3 86,557,050 29,905,270
4 117,845,792 147,751,063
5 128,013,109 275,764,172
Pay Back Period 2 Years 1month
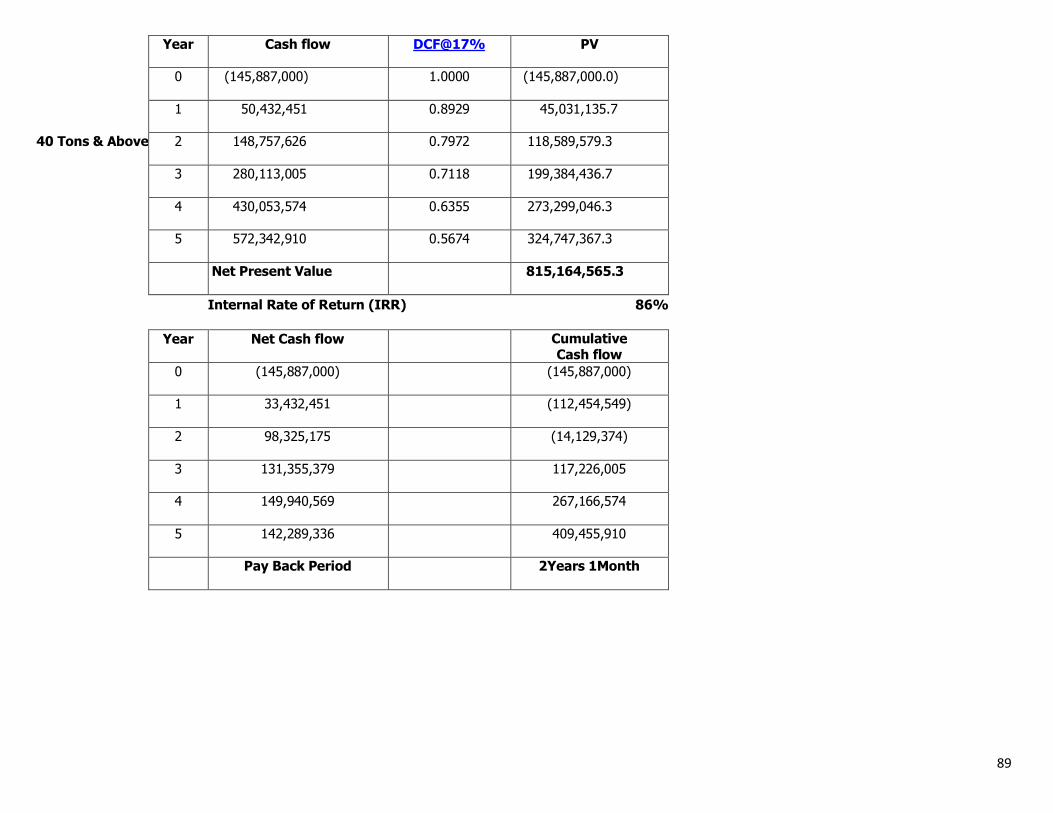
89
Year Cash flow DCF@17% PV
0 (145,887,000) 1.0000 (145,887,000.0)
1 50,432,451 0.8929 45,031,135.7
40 Tons & Above 2 148,757,626 0.7972 118,589,579.3
3 280,113,005 0.7118 199,384,436.7
4 430,053,574 0.6355 273,299,046.3
5 572,342,910 0.5674 324,747,367.3
Net Present Value 815,164,565.3
Internal Rate of Return (IRR) 86%
Year Net Cash flow
Cumulative Cash flow
0 (145,887,000)
(145,887,000)
1 33,432,451
(112,454,549)
2 98,325,175
(14,129,374)
3 131,355,379
117,226,005
4 149,940,569
267,166,574
5 142,289,336
409,455,910
Pay Back Period
2Years 1Month
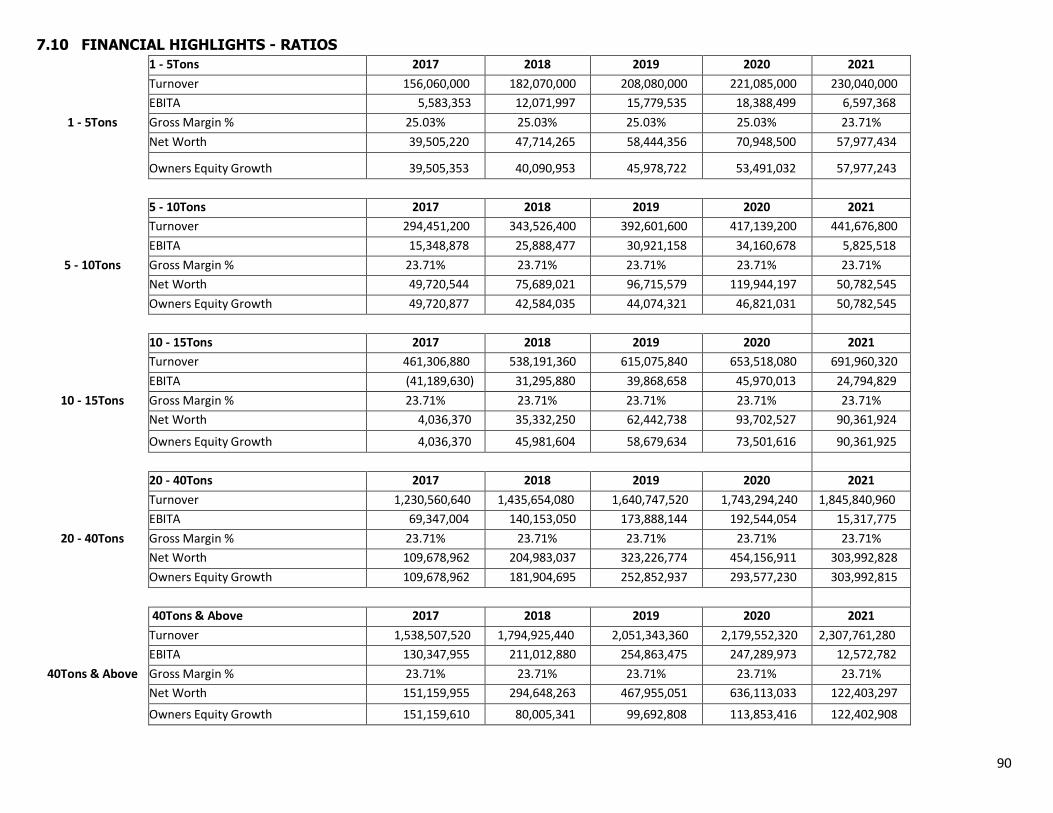
90
7.10 FINANCIAL HIGHLIGHTS - RATIOS
1 - 5Tons 2017 2018 2019 2020 2021
Turnover 156,060,000 182,070,000 208,080,000 221,085,000 230,040,000
EBITA 5,583,353 12,071,997 15,779,535 18,388,499 6,597,368
1 - 5Tons Gross Margin % 25.03% 25.03% 25.03% 25.03% 23.71%
Net Worth 39,505,220 47,714,265 58,444,356 70,948,500 57,977,434
Owners Equity Growth 39,505,353 40,090,953 45,978,722 53,491,032 57,977,243
5 - 10Tons 2017 2018 2019 2020 2021
Turnover 294,451,200 343,526,400 392,601,600 417,139,200 441,676,800
EBITA 15,348,878 25,888,477 30,921,158 34,160,678 5,825,518
5 - 10Tons Gross Margin % 23.71% 23.71% 23.71% 23.71% 23.71%
Net Worth 49,720,544 75,689,021 96,715,579 119,944,197 50,782,545
Owners Equity Growth 49,720,877 42,584,035 44,074,321 46,821,031 50,782,545
10 - 15Tons 2017 2018 2019 2020 2021
Turnover 461,306,880 538,191,360 615,075,840 653,518,080 691,960,320
EBITA (41,189,630) 31,295,880 39,868,658 45,970,013 24,794,829
10 - 15Tons Gross Margin % 23.71% 23.71% 23.71% 23.71% 23.71%
Net Worth 4,036,370 35,332,250 62,442,738 93,702,527 90,361,924
Owners Equity Growth 4,036,370 45,981,604 58,679,634 73,501,616 90,361,925
20 - 40Tons 2017 2018 2019 2020 2021
Turnover 1,230,560,640 1,435,654,080 1,640,747,520 1,743,294,240 1,845,840,960
EBITA 69,347,004 140,153,050 173,888,144 192,544,054 15,317,775
20 - 40Tons Gross Margin % 23.71% 23.71% 23.71% 23.71% 23.71%
Net Worth 109,678,962 204,983,037 323,226,774 454,156,911 303,992,828
Owners Equity Growth 109,678,962 181,904,695 252,852,937 293,577,230 303,992,815
40Tons & Above 2017 2018 2019 2020 2021
Turnover 1,538,507,520 1,794,925,440 2,051,343,360 2,179,552,320 2,307,761,280
EBITA 130,347,955 211,012,880 254,863,475 247,289,973 12,572,782
40Tons & Above Gross Margin % 23.71% 23.71% 23.71% 23.71% 23.71%
Net Worth 151,159,955 294,648,263 467,955,051 636,113,033 122,403,297
Owners Equity Growth 151,159,610 80,005,341 99,692,808 113,853,416 122,402,908
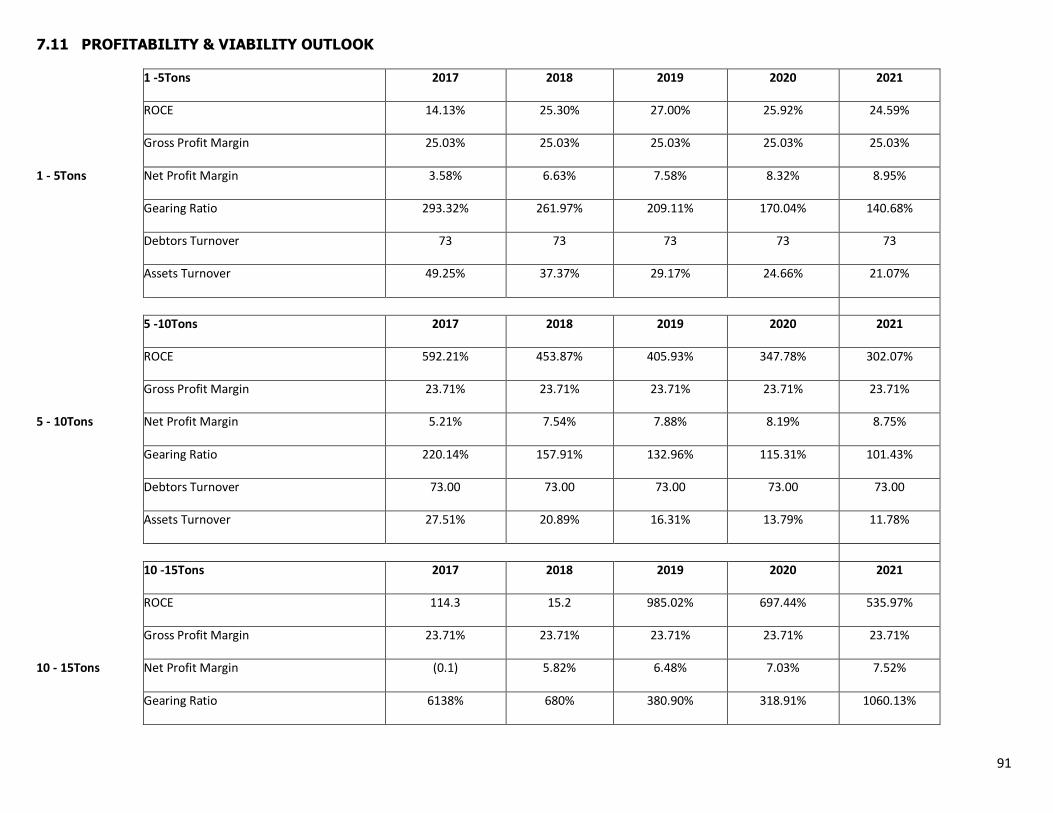
91
7.11 PROFITABILITY & VIABILITY OUTLOOK
1 -5Tons 2017 2018 2019 2020 2021
ROCE 14.13% 25.30% 27.00% 25.92% 24.59%
Gross Profit Margin 25.03% 25.03% 25.03% 25.03% 25.03%
1 - 5Tons Net Profit Margin 3.58% 6.63% 7.58% 8.32% 8.95%
Gearing Ratio 293.32% 261.97% 209.11% 170.04% 140.68%
Debtors Turnover 73 73 73 73 73
Assets Turnover 49.25% 37.37% 29.17% 24.66% 21.07%
5 -10Tons 2017 2018 2019 2020 2021
ROCE 592.21% 453.87% 405.93% 347.78% 302.07%
Gross Profit Margin 23.71% 23.71% 23.71% 23.71% 23.71%
5 - 10Tons Net Profit Margin 5.21% 7.54% 7.88% 8.19% 8.75%
Gearing Ratio 220.14% 157.91% 132.96% 115.31% 101.43%
Debtors Turnover 73.00 73.00 73.00 73.00 73.00
Assets Turnover 27.51% 20.89% 16.31% 13.79% 11.78%
10 -15Tons 2017 2018 2019 2020 2021
ROCE 114.3 15.2 985.02% 697.44% 535.97%
Gross Profit Margin 23.71% 23.71% 23.71% 23.71% 23.71%
10 - 15Tons Net Profit Margin (0.1) 5.82% 6.48% 7.03% 7.52%
Gearing Ratio 6138% 680% 380.90% 318.91% 1060.13%
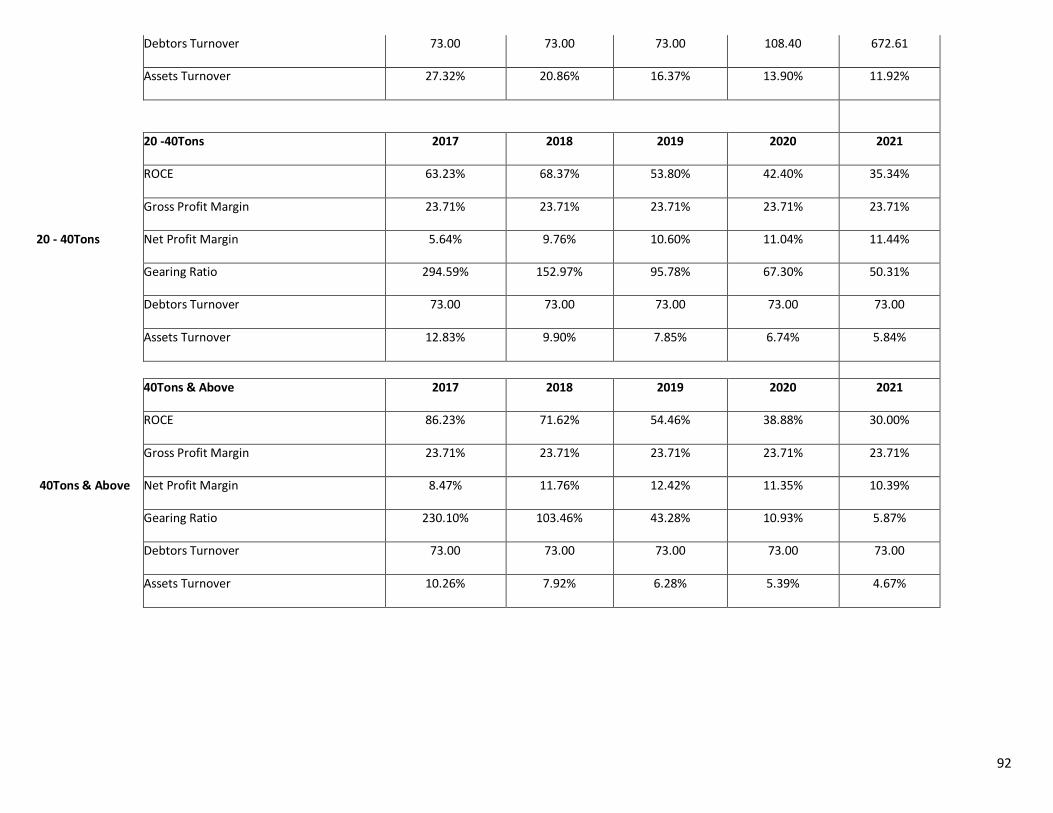
92
Debtors Turnover 73.00 73.00 73.00 108.40 672.61
Assets Turnover 27.32% 20.86% 16.37% 13.90% 11.92%
20 -40Tons 2017 2018 2019 2020 2021
ROCE 63.23% 68.37% 53.80% 42.40% 35.34%
Gross Profit Margin 23.71% 23.71% 23.71% 23.71% 23.71%
20 - 40Tons Net Profit Margin 5.64% 9.76% 10.60% 11.04% 11.44%
Gearing Ratio 294.59% 152.97% 95.78% 67.30% 50.31%
Debtors Turnover 73.00 73.00 73.00 73.00 73.00
Assets Turnover 12.83% 9.90% 7.85% 6.74% 5.84%
40Tons & Above 2017 2018 2019 2020 2021
ROCE 86.23% 71.62% 54.46% 38.88% 30.00%
Gross Profit Margin 23.71% 23.71% 23.71% 23.71% 23.71%
40Tons & Above Net Profit Margin 8.47% 11.76% 12.42% 11.35% 10.39%
Gearing Ratio 230.10% 103.46% 43.28% 10.93% 5.87%
Debtors Turnover 73.00 73.00 73.00 73.00 73.00
Assets Turnover 10.26% 7.92% 6.28% 5.39% 4.67%
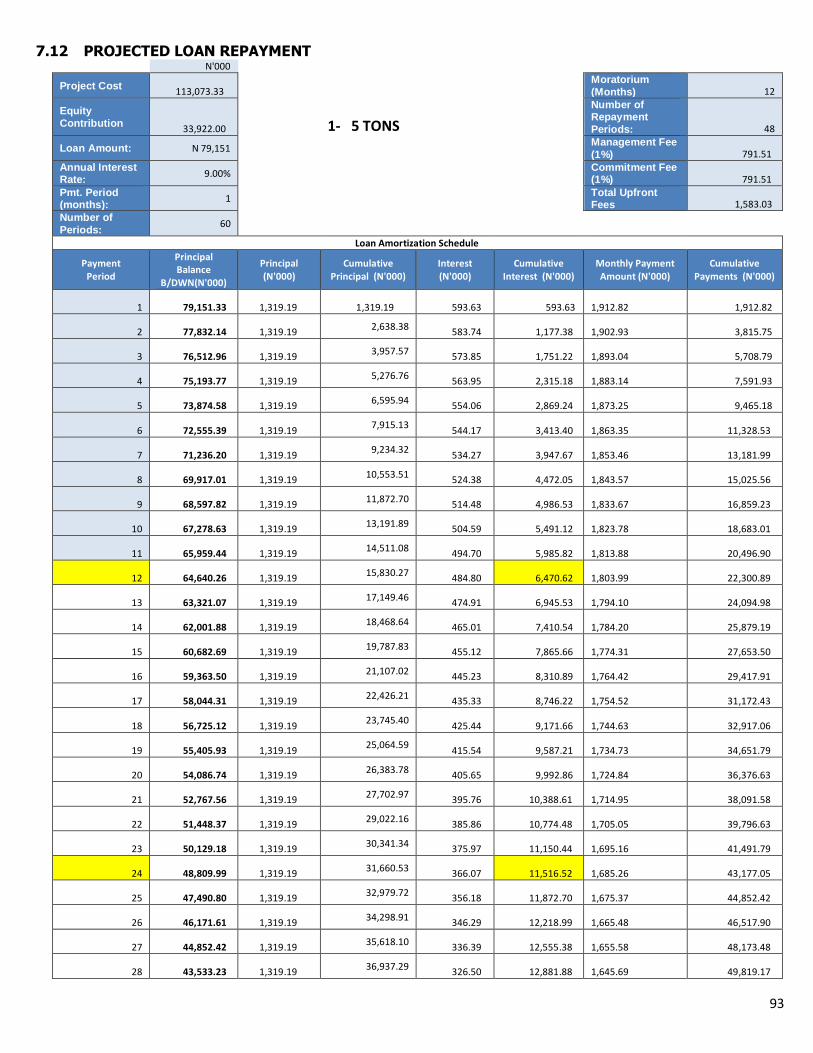
93
7.12 PROJECTED LOAN REPAYMENT N'000
Project Cost 113,073.33
Moratorium
(Months) 12
Equity
Contribution 33,922.00 1- 5 TONS
Number of Repayment
Periods: 48
Loan Amount: N 79,151
Management Fee
(1%) 791.51
Annual Interest Rate:
9.00%
Commitment Fee (1%) 791.51
Pmt. Period (months):
1
Total Upfront Fees 1,583.03
Number of
Periods: 60
Loan Amortization Schedule
Payment Period
Principal Balance
B/DWN(N'000)
Principal (N'000)
Cumulative Principal (N'000)
Interest (N'000)
Cumulative Interest (N'000)
Monthly Payment Amount (N'000)
Cumulative Payments (N'000)
1 79,151.33 1,319.19 1,319.19 593.63 593.63 1,912.82 1,912.82
2 77,832.14 1,319.19 2,638.38
583.74 1,177.38 1,902.93 3,815.75
3 76,512.96 1,319.19 3,957.57
573.85 1,751.22 1,893.04 5,708.79
4 75,193.77 1,319.19 5,276.76
563.95 2,315.18 1,883.14 7,591.93
5 73,874.58 1,319.19 6,595.94
554.06 2,869.24 1,873.25 9,465.18
6 72,555.39 1,319.19 7,915.13
544.17 3,413.40 1,863.35 11,328.53
7 71,236.20 1,319.19 9,234.32
534.27 3,947.67 1,853.46 13,181.99
8 69,917.01 1,319.19 10,553.51
524.38 4,472.05 1,843.57 15,025.56
9 68,597.82 1,319.19 11,872.70
514.48 4,986.53 1,833.67 16,859.23
10 67,278.63 1,319.19 13,191.89
504.59 5,491.12 1,823.78 18,683.01
11 65,959.44 1,319.19 14,511.08
494.70 5,985.82 1,813.88 20,496.90
12 64,640.26 1,319.19 15,830.27
484.80 6,470.62 1,803.99 22,300.89
13 63,321.07 1,319.19 17,149.46
474.91 6,945.53 1,794.10 24,094.98
14 62,001.88 1,319.19 18,468.64
465.01 7,410.54 1,784.20 25,879.19
15 60,682.69 1,319.19 19,787.83
455.12 7,865.66 1,774.31 27,653.50
16 59,363.50 1,319.19 21,107.02
445.23 8,310.89 1,764.42 29,417.91
17 58,044.31 1,319.19 22,426.21
435.33 8,746.22 1,754.52 31,172.43
18 56,725.12 1,319.19 23,745.40
425.44 9,171.66 1,744.63 32,917.06
19 55,405.93 1,319.19 25,064.59
415.54 9,587.21 1,734.73 34,651.79
20 54,086.74 1,319.19 26,383.78
405.65 9,992.86 1,724.84 36,376.63
21 52,767.56 1,319.19 27,702.97
395.76 10,388.61 1,714.95 38,091.58
22 51,448.37 1,319.19 29,022.16
385.86 10,774.48 1,705.05 39,796.63
23 50,129.18 1,319.19 30,341.34
375.97 11,150.44 1,695.16 41,491.79
24 48,809.99 1,319.19 31,660.53
366.07 11,516.52 1,685.26 43,177.05
25 47,490.80 1,319.19 32,979.72
356.18 11,872.70 1,675.37 44,852.42
26 46,171.61 1,319.19 34,298.91
346.29 12,218.99 1,665.48 46,517.90
27 44,852.42 1,319.19 35,618.10
336.39 12,555.38 1,655.58 48,173.48
28 43,533.23 1,319.19 36,937.29
326.50 12,881.88 1,645.69 49,819.17
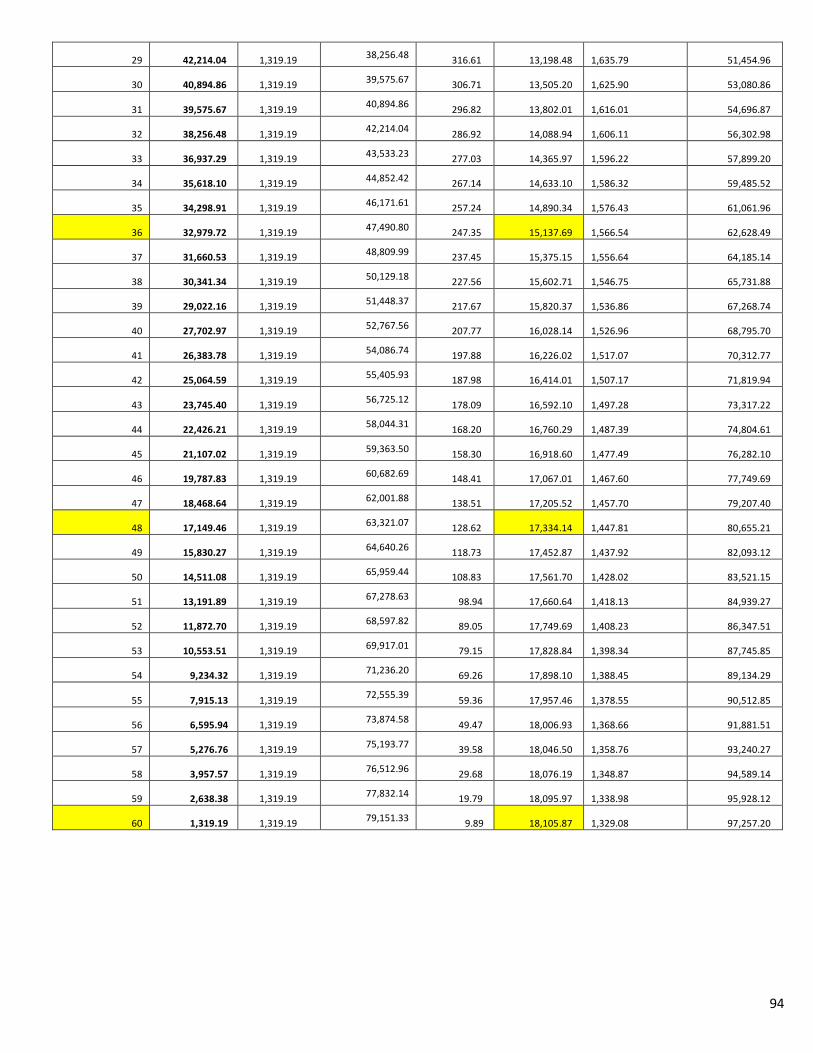
94
29 42,214.04 1,319.19 38,256.48
316.61 13,198.48 1,635.79 51,454.96
30 40,894.86 1,319.19 39,575.67
306.71 13,505.20 1,625.90 53,080.86
31 39,575.67 1,319.19 40,894.86
296.82 13,802.01 1,616.01 54,696.87
32 38,256.48 1,319.19 42,214.04
286.92 14,088.94 1,606.11 56,302.98
33 36,937.29 1,319.19 43,533.23
277.03 14,365.97 1,596.22 57,899.20
34 35,618.10 1,319.19 44,852.42
267.14 14,633.10 1,586.32 59,485.52
35 34,298.91 1,319.19 46,171.61
257.24 14,890.34 1,576.43 61,061.96
36 32,979.72 1,319.19 47,490.80
247.35 15,137.69 1,566.54 62,628.49
37 31,660.53 1,319.19 48,809.99
237.45 15,375.15 1,556.64 64,185.14
38 30,341.34 1,319.19 50,129.18
227.56 15,602.71 1,546.75 65,731.88
39 29,022.16 1,319.19 51,448.37
217.67 15,820.37 1,536.86 67,268.74
40 27,702.97 1,319.19 52,767.56
207.77 16,028.14 1,526.96 68,795.70
41 26,383.78 1,319.19 54,086.74
197.88 16,226.02 1,517.07 70,312.77
42 25,064.59 1,319.19 55,405.93
187.98 16,414.01 1,507.17 71,819.94
43 23,745.40 1,319.19 56,725.12
178.09 16,592.10 1,497.28 73,317.22
44 22,426.21 1,319.19 58,044.31
168.20 16,760.29 1,487.39 74,804.61
45 21,107.02 1,319.19 59,363.50
158.30 16,918.60 1,477.49 76,282.10
46 19,787.83 1,319.19 60,682.69
148.41 17,067.01 1,467.60 77,749.69
47 18,468.64 1,319.19 62,001.88
138.51 17,205.52 1,457.70 79,207.40
48 17,149.46 1,319.19 63,321.07
128.62 17,334.14 1,447.81 80,655.21
49 15,830.27 1,319.19 64,640.26
118.73 17,452.87 1,437.92 82,093.12
50 14,511.08 1,319.19 65,959.44
108.83 17,561.70 1,428.02 83,521.15
51 13,191.89 1,319.19 67,278.63
98.94 17,660.64 1,418.13 84,939.27
52 11,872.70 1,319.19 68,597.82
89.05 17,749.69 1,408.23 86,347.51
53 10,553.51 1,319.19 69,917.01
79.15 17,828.84 1,398.34 87,745.85
54 9,234.32 1,319.19 71,236.20
69.26 17,898.10 1,388.45 89,134.29
55 7,915.13 1,319.19 72,555.39
59.36 17,957.46 1,378.55 90,512.85
56 6,595.94 1,319.19 73,874.58
49.47 18,006.93 1,368.66 91,881.51
57 5,276.76 1,319.19 75,193.77
39.58 18,046.50 1,358.76 93,240.27
58 3,957.57 1,319.19 76,512.96
29.68 18,076.19 1,348.87 94,589.14
59 2,638.38 1,319.19 77,832.14
19.79 18,095.97 1,338.98 95,928.12
60 1,319.19 1,319.19 79,151.33
9.89 18,105.87 1,329.08 97,257.20
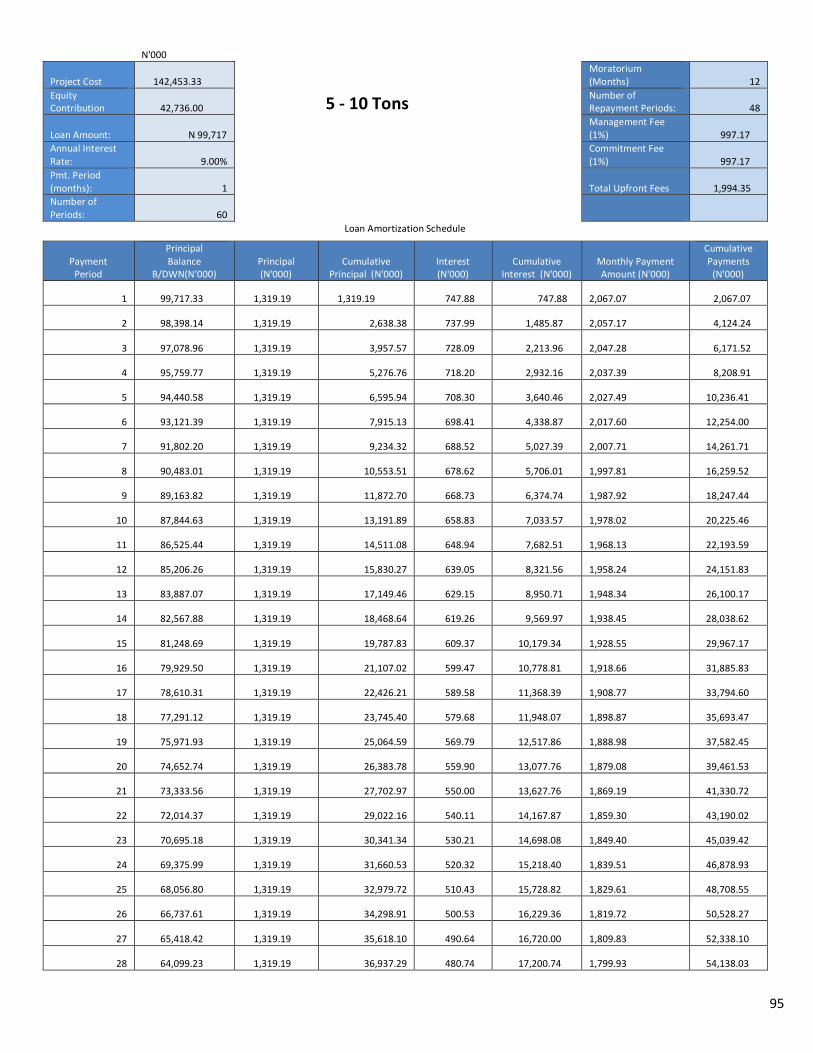
95
N'000
Project Cost 142,453.33
Moratorium (Months) 12
Equity Contribution 42,736.00 5 - 10 Tons
Number of Repayment Periods: 48
Loan Amount: N 99,717
Management Fee (1%) 997.17
Annual Interest Rate: 9.00%
Commitment Fee (1%) 997.17
Pmt. Period (months): 1 Total Upfront Fees 1,994.35
Number of Periods: 60
Loan Amortization Schedule
Payment Period
Principal Balance
B/DWN(N'000) Principal (N'000)
Cumulative Principal (N'000)
Interest (N'000)
Cumulative Interest (N'000)
Monthly Payment Amount (N'000)
Cumulative Payments
(N'000)
1 99,717.33 1,319.19 1,319.19 747.88 747.88 2,067.07 2,067.07
2 98,398.14 1,319.19 2,638.38 737.99 1,485.87 2,057.17 4,124.24
3 97,078.96 1,319.19 3,957.57 728.09 2,213.96 2,047.28 6,171.52
4 95,759.77 1,319.19 5,276.76 718.20 2,932.16 2,037.39 8,208.91
5 94,440.58 1,319.19 6,595.94 708.30 3,640.46 2,027.49 10,236.41
6 93,121.39 1,319.19 7,915.13 698.41 4,338.87 2,017.60 12,254.00
7 91,802.20 1,319.19 9,234.32 688.52 5,027.39 2,007.71 14,261.71
8 90,483.01 1,319.19 10,553.51 678.62 5,706.01 1,997.81 16,259.52
9 89,163.82 1,319.19 11,872.70 668.73 6,374.74 1,987.92 18,247.44
10 87,844.63 1,319.19 13,191.89 658.83 7,033.57 1,978.02 20,225.46
11 86,525.44 1,319.19 14,511.08 648.94 7,682.51 1,968.13 22,193.59
12 85,206.26 1,319.19 15,830.27 639.05 8,321.56 1,958.24 24,151.83
13 83,887.07 1,319.19 17,149.46 629.15 8,950.71 1,948.34 26,100.17
14 82,567.88 1,319.19 18,468.64 619.26 9,569.97 1,938.45 28,038.62
15 81,248.69 1,319.19 19,787.83 609.37 10,179.34 1,928.55 29,967.17
16 79,929.50 1,319.19 21,107.02 599.47 10,778.81 1,918.66 31,885.83
17 78,610.31 1,319.19 22,426.21 589.58 11,368.39 1,908.77 33,794.60
18 77,291.12 1,319.19 23,745.40 579.68 11,948.07 1,898.87 35,693.47
19 75,971.93 1,319.19 25,064.59 569.79 12,517.86 1,888.98 37,582.45
20 74,652.74 1,319.19 26,383.78 559.90 13,077.76 1,879.08 39,461.53
21 73,333.56 1,319.19 27,702.97 550.00 13,627.76 1,869.19 41,330.72
22 72,014.37 1,319.19 29,022.16 540.11 14,167.87 1,859.30 43,190.02
23 70,695.18 1,319.19 30,341.34 530.21 14,698.08 1,849.40 45,039.42
24 69,375.99 1,319.19 31,660.53 520.32 15,218.40 1,839.51 46,878.93
25 68,056.80 1,319.19 32,979.72 510.43 15,728.82 1,829.61 48,708.55
26 66,737.61 1,319.19 34,298.91 500.53 16,229.36 1,819.72 50,528.27
27 65,418.42 1,319.19 35,618.10 490.64 16,720.00 1,809.83 52,338.10
28 64,099.23 1,319.19 36,937.29 480.74 17,200.74 1,799.93 54,138.03
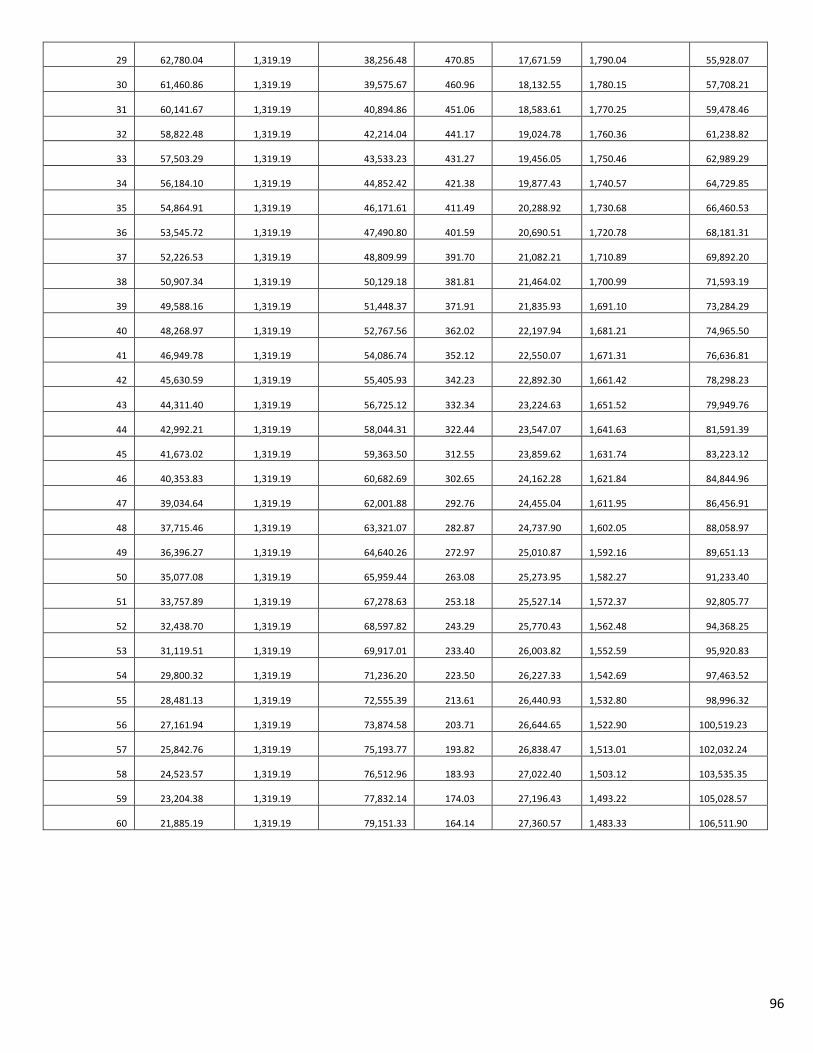
96
29 62,780.04 1,319.19 38,256.48 470.85 17,671.59 1,790.04 55,928.07
30 61,460.86 1,319.19 39,575.67 460.96 18,132.55 1,780.15 57,708.21
31 60,141.67 1,319.19 40,894.86 451.06 18,583.61 1,770.25 59,478.46
32 58,822.48 1,319.19 42,214.04 441.17 19,024.78 1,760.36 61,238.82
33 57,503.29 1,319.19 43,533.23 431.27 19,456.05 1,750.46 62,989.29
34 56,184.10 1,319.19 44,852.42 421.38 19,877.43 1,740.57 64,729.85
35 54,864.91 1,319.19 46,171.61 411.49 20,288.92 1,730.68 66,460.53
36 53,545.72 1,319.19 47,490.80 401.59 20,690.51 1,720.78 68,181.31
37 52,226.53 1,319.19 48,809.99 391.70 21,082.21 1,710.89 69,892.20
38 50,907.34 1,319.19 50,129.18 381.81 21,464.02 1,700.99 71,593.19
39 49,588.16 1,319.19 51,448.37 371.91 21,835.93 1,691.10 73,284.29
40 48,268.97 1,319.19 52,767.56 362.02 22,197.94 1,681.21 74,965.50
41 46,949.78 1,319.19 54,086.74 352.12 22,550.07 1,671.31 76,636.81
42 45,630.59 1,319.19 55,405.93 342.23 22,892.30 1,661.42 78,298.23
43 44,311.40 1,319.19 56,725.12 332.34 23,224.63 1,651.52 79,949.76
44 42,992.21 1,319.19 58,044.31 322.44 23,547.07 1,641.63 81,591.39
45 41,673.02 1,319.19 59,363.50 312.55 23,859.62 1,631.74 83,223.12
46 40,353.83 1,319.19 60,682.69 302.65 24,162.28 1,621.84 84,844.96
47 39,034.64 1,319.19 62,001.88 292.76 24,455.04 1,611.95 86,456.91
48 37,715.46 1,319.19 63,321.07 282.87 24,737.90 1,602.05 88,058.97
49 36,396.27 1,319.19 64,640.26 272.97 25,010.87 1,592.16 89,651.13
50 35,077.08 1,319.19 65,959.44 263.08 25,273.95 1,582.27 91,233.40
51 33,757.89 1,319.19 67,278.63 253.18 25,527.14 1,572.37 92,805.77
52 32,438.70 1,319.19 68,597.82 243.29 25,770.43 1,562.48 94,368.25
53 31,119.51 1,319.19 69,917.01 233.40 26,003.82 1,552.59 95,920.83
54 29,800.32 1,319.19 71,236.20 223.50 26,227.33 1,542.69 97,463.52
55 28,481.13 1,319.19 72,555.39 213.61 26,440.93 1,532.80 98,996.32
56 27,161.94 1,319.19 73,874.58 203.71 26,644.65 1,522.90 100,519.23
57 25,842.76 1,319.19 75,193.77 193.82 26,838.47 1,513.01 102,032.24
58 24,523.57 1,319.19 76,512.96 183.93 27,022.40 1,503.12 103,535.35
59 23,204.38 1,319.19 77,832.14 174.03 27,196.43 1,493.22 105,028.57
60 21,885.19 1,319.19 79,151.33 164.14 27,360.57 1,483.33 106,511.90
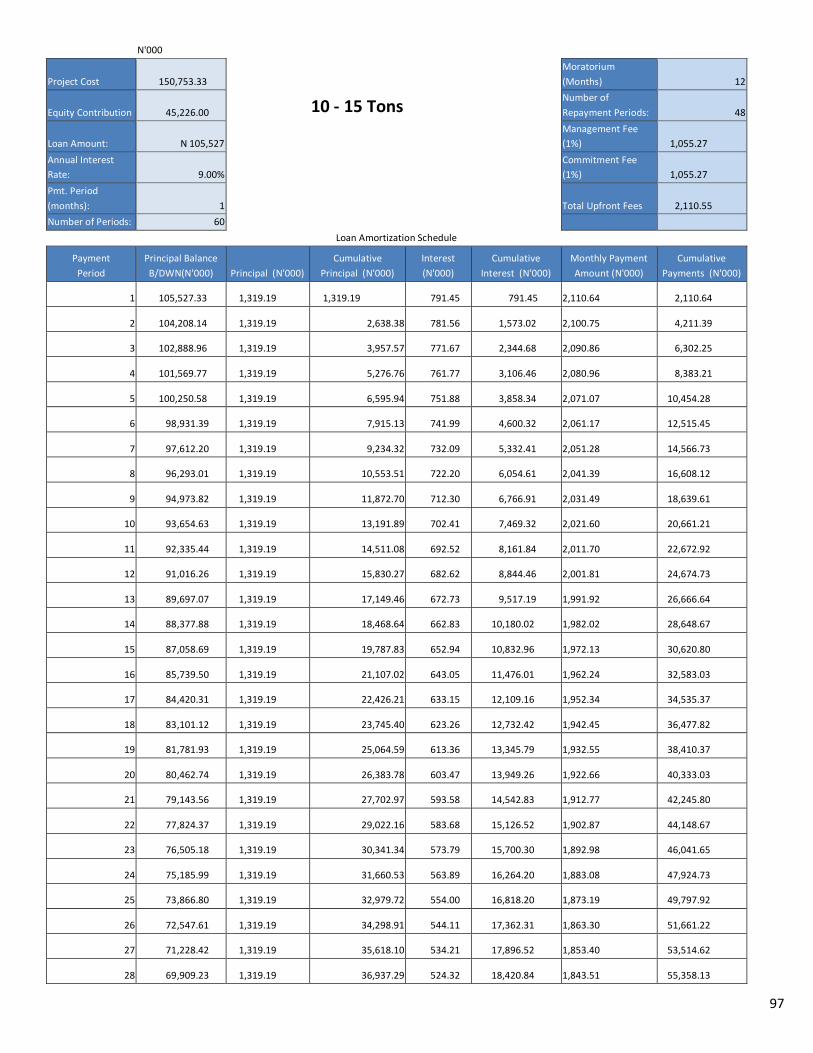
97
N'000
Project Cost 150,753.33
Moratorium
(Months) 12
Equity Contribution 45,226.00 10 - 15 Tons
Number of
Repayment Periods: 48
Loan Amount: N 105,527
Management Fee
(1%) 1,055.27
Annual Interest
Rate: 9.00%
Commitment Fee
(1%) 1,055.27
Pmt. Period
(months): 1 Total Upfront Fees 2,110.55
Number of Periods: 60
Loan Amortization Schedule
Payment
Period
Principal Balance
B/DWN(N'000) Principal (N'000)
Cumulative
Principal (N'000)
Interest
(N'000)
Cumulative
Interest (N'000)
Monthly Payment
Amount (N'000)
Cumulative
Payments (N'000)
1 105,527.33 1,319.19 1,319.19 791.45 791.45 2,110.64 2,110.64
2 104,208.14 1,319.19 2,638.38 781.56 1,573.02 2,100.75 4,211.39
3 102,888.96 1,319.19 3,957.57 771.67 2,344.68 2,090.86 6,302.25
4 101,569.77 1,319.19 5,276.76 761.77 3,106.46 2,080.96 8,383.21
5 100,250.58 1,319.19 6,595.94 751.88 3,858.34 2,071.07 10,454.28
6 98,931.39 1,319.19 7,915.13 741.99 4,600.32 2,061.17 12,515.45
7 97,612.20 1,319.19 9,234.32 732.09 5,332.41 2,051.28 14,566.73
8 96,293.01 1,319.19 10,553.51 722.20 6,054.61 2,041.39 16,608.12
9 94,973.82 1,319.19 11,872.70 712.30 6,766.91 2,031.49 18,639.61
10 93,654.63 1,319.19 13,191.89 702.41 7,469.32 2,021.60 20,661.21
11 92,335.44 1,319.19 14,511.08 692.52 8,161.84 2,011.70 22,672.92
12 91,016.26 1,319.19 15,830.27 682.62 8,844.46 2,001.81 24,674.73
13 89,697.07 1,319.19 17,149.46 672.73 9,517.19 1,991.92 26,666.64
14 88,377.88 1,319.19 18,468.64 662.83 10,180.02 1,982.02 28,648.67
15 87,058.69 1,319.19 19,787.83 652.94 10,832.96 1,972.13 30,620.80
16 85,739.50 1,319.19 21,107.02 643.05 11,476.01 1,962.24 32,583.03
17 84,420.31 1,319.19 22,426.21 633.15 12,109.16 1,952.34 34,535.37
18 83,101.12 1,319.19 23,745.40 623.26 12,732.42 1,942.45 36,477.82
19 81,781.93 1,319.19 25,064.59 613.36 13,345.79 1,932.55 38,410.37
20 80,462.74 1,319.19 26,383.78 603.47 13,949.26 1,922.66 40,333.03
21 79,143.56 1,319.19 27,702.97 593.58 14,542.83 1,912.77 42,245.80
22 77,824.37 1,319.19 29,022.16 583.68 15,126.52 1,902.87 44,148.67
23 76,505.18 1,319.19 30,341.34 573.79 15,700.30 1,892.98 46,041.65
24 75,185.99 1,319.19 31,660.53 563.89 16,264.20 1,883.08 47,924.73
25 73,866.80 1,319.19 32,979.72 554.00 16,818.20 1,873.19 49,797.92
26 72,547.61 1,319.19 34,298.91 544.11 17,362.31 1,863.30 51,661.22
27 71,228.42 1,319.19 35,618.10 534.21 17,896.52 1,853.40 53,514.62
28 69,909.23 1,319.19 36,937.29 524.32 18,420.84 1,843.51 55,358.13
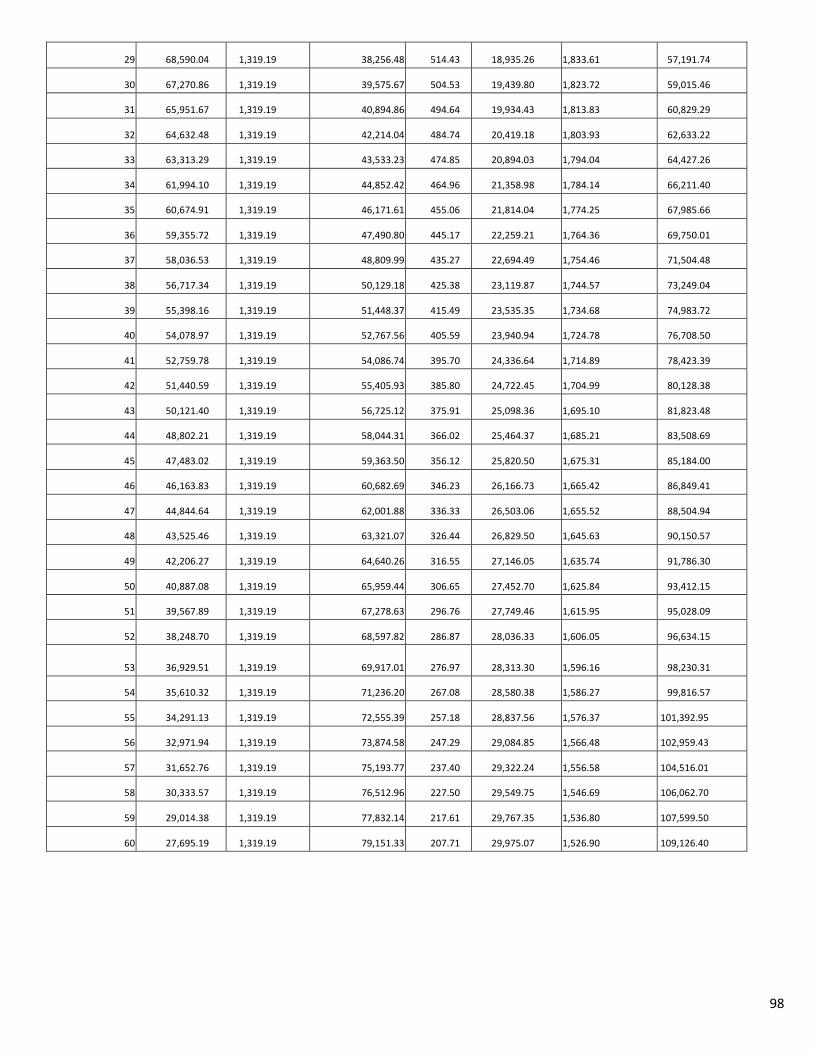
98
29 68,590.04 1,319.19 38,256.48 514.43 18,935.26 1,833.61 57,191.74
30 67,270.86 1,319.19 39,575.67 504.53 19,439.80 1,823.72 59,015.46
31 65,951.67 1,319.19 40,894.86 494.64 19,934.43 1,813.83 60,829.29
32 64,632.48 1,319.19 42,214.04 484.74 20,419.18 1,803.93 62,633.22
33 63,313.29 1,319.19 43,533.23 474.85 20,894.03 1,794.04 64,427.26
34 61,994.10 1,319.19 44,852.42 464.96 21,358.98 1,784.14 66,211.40
35 60,674.91 1,319.19 46,171.61 455.06 21,814.04 1,774.25 67,985.66
36 59,355.72 1,319.19 47,490.80 445.17 22,259.21 1,764.36 69,750.01
37 58,036.53 1,319.19 48,809.99 435.27 22,694.49 1,754.46 71,504.48
38 56,717.34 1,319.19 50,129.18 425.38 23,119.87 1,744.57 73,249.04
39 55,398.16 1,319.19 51,448.37 415.49 23,535.35 1,734.68 74,983.72
40 54,078.97 1,319.19 52,767.56 405.59 23,940.94 1,724.78 76,708.50
41 52,759.78 1,319.19 54,086.74 395.70 24,336.64 1,714.89 78,423.39
42 51,440.59 1,319.19 55,405.93 385.80 24,722.45 1,704.99 80,128.38
43 50,121.40 1,319.19 56,725.12 375.91 25,098.36 1,695.10 81,823.48
44 48,802.21 1,319.19 58,044.31 366.02 25,464.37 1,685.21 83,508.69
45 47,483.02 1,319.19 59,363.50 356.12 25,820.50 1,675.31 85,184.00
46 46,163.83 1,319.19 60,682.69 346.23 26,166.73 1,665.42 86,849.41
47 44,844.64 1,319.19 62,001.88 336.33 26,503.06 1,655.52 88,504.94
48 43,525.46 1,319.19 63,321.07 326.44 26,829.50 1,645.63 90,150.57
49 42,206.27 1,319.19 64,640.26 316.55 27,146.05 1,635.74 91,786.30
50 40,887.08 1,319.19 65,959.44 306.65 27,452.70 1,625.84 93,412.15
51 39,567.89 1,319.19 67,278.63 296.76 27,749.46 1,615.95 95,028.09
52 38,248.70 1,319.19 68,597.82 286.87 28,036.33 1,606.05 96,634.15
53 36,929.51 1,319.19 69,917.01 276.97 28,313.30
1,596.16 98,230.31
54 35,610.32 1,319.19 71,236.20 267.08 28,580.38 1,586.27 99,816.57
55 34,291.13 1,319.19 72,555.39 257.18 28,837.56 1,576.37 101,392.95
56 32,971.94 1,319.19 73,874.58 247.29 29,084.85 1,566.48 102,959.43
57 31,652.76 1,319.19 75,193.77 237.40 29,322.24 1,556.58 104,516.01
58 30,333.57 1,319.19 76,512.96 227.50 29,549.75 1,546.69 106,062.70
59 29,014.38 1,319.19 77,832.14 217.61 29,767.35 1,536.80 107,599.50
60 27,695.19 1,319.19 79,151.33 207.71 29,975.07 1,526.90 109,126.40
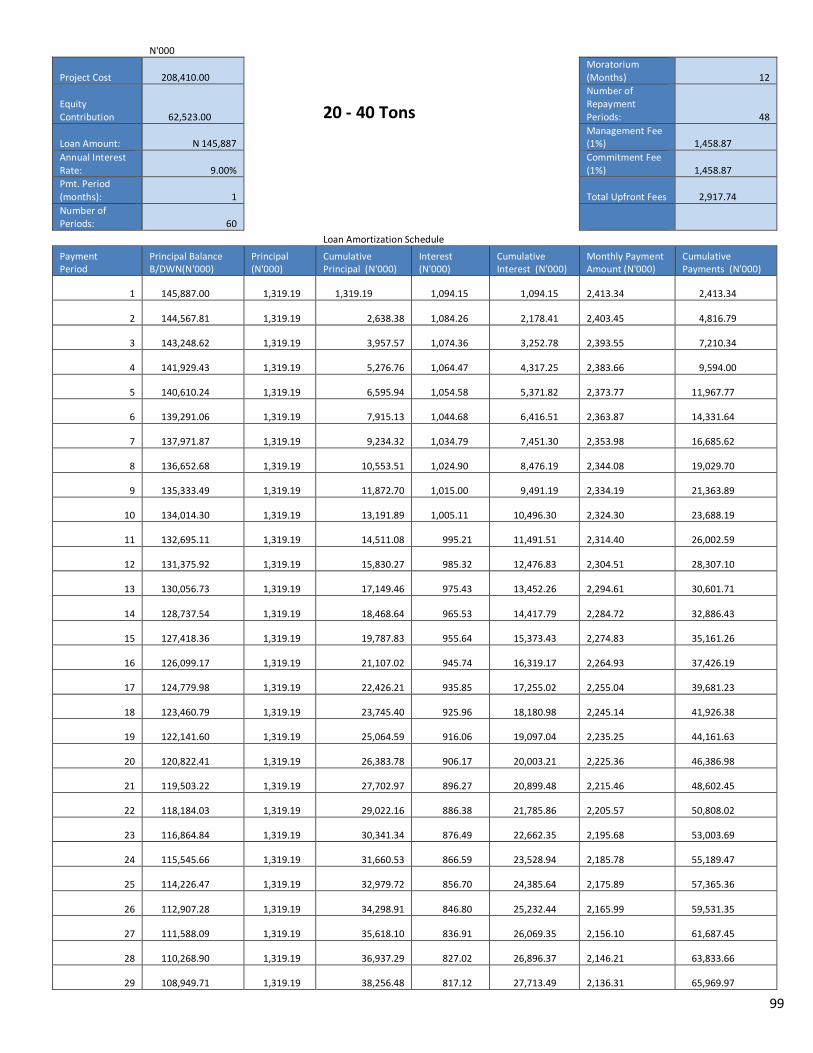
99
N'000
Project Cost 208,410.00
Moratorium (Months) 12
Equity Contribution 62,523.00 20 - 40 Tons
Number of Repayment Periods: 48
Loan Amount: N 145,887
Management Fee (1%) 1,458.87
Annual Interest Rate: 9.00%
Commitment Fee (1%) 1,458.87
Pmt. Period (months): 1 Total Upfront Fees 2,917.74
Number of Periods: 60
Loan Amortization Schedule
Payment Period
Principal Balance B/DWN(N'000)
Principal (N'000)
Cumulative Principal (N'000)
Interest (N'000)
Cumulative Interest (N'000)
Monthly Payment Amount (N'000)
Cumulative Payments (N'000)
1 145,887.00 1,319.19 1,319.19 1,094.15 1,094.15 2,413.34 2,413.34
2 144,567.81 1,319.19 2,638.38 1,084.26 2,178.41 2,403.45 4,816.79
3 143,248.62 1,319.19 3,957.57 1,074.36 3,252.78 2,393.55 7,210.34
4 141,929.43 1,319.19 5,276.76 1,064.47 4,317.25 2,383.66 9,594.00
5 140,610.24 1,319.19 6,595.94 1,054.58 5,371.82 2,373.77 11,967.77
6 139,291.06 1,319.19 7,915.13 1,044.68 6,416.51 2,363.87 14,331.64
7 137,971.87 1,319.19 9,234.32 1,034.79 7,451.30 2,353.98 16,685.62
8 136,652.68 1,319.19 10,553.51 1,024.90 8,476.19 2,344.08 19,029.70
9 135,333.49 1,319.19 11,872.70 1,015.00 9,491.19 2,334.19 21,363.89
10 134,014.30 1,319.19 13,191.89 1,005.11 10,496.30 2,324.30 23,688.19
11 132,695.11 1,319.19 14,511.08 995.21 11,491.51 2,314.40 26,002.59
12 131,375.92 1,319.19 15,830.27 985.32 12,476.83 2,304.51 28,307.10
13 130,056.73 1,319.19 17,149.46 975.43 13,452.26 2,294.61 30,601.71
14 128,737.54 1,319.19 18,468.64 965.53 14,417.79 2,284.72 32,886.43
15 127,418.36 1,319.19 19,787.83 955.64 15,373.43 2,274.83 35,161.26
16 126,099.17 1,319.19 21,107.02 945.74 16,319.17 2,264.93 37,426.19
17 124,779.98 1,319.19 22,426.21 935.85 17,255.02 2,255.04 39,681.23
18 123,460.79 1,319.19 23,745.40 925.96 18,180.98 2,245.14 41,926.38
19 122,141.60 1,319.19 25,064.59 916.06 19,097.04 2,235.25 44,161.63
20 120,822.41 1,319.19 26,383.78 906.17 20,003.21 2,225.36 46,386.98
21 119,503.22 1,319.19 27,702.97 896.27 20,899.48 2,215.46 48,602.45
22 118,184.03 1,319.19 29,022.16 886.38 21,785.86 2,205.57 50,808.02
23 116,864.84 1,319.19 30,341.34 876.49 22,662.35 2,195.68 53,003.69
24 115,545.66 1,319.19 31,660.53 866.59 23,528.94 2,185.78 55,189.47
25 114,226.47 1,319.19 32,979.72 856.70 24,385.64 2,175.89 57,365.36
26 112,907.28 1,319.19 34,298.91 846.80 25,232.44 2,165.99 59,531.35
27 111,588.09 1,319.19 35,618.10 836.91 26,069.35 2,156.10 61,687.45
28 110,268.90 1,319.19 36,937.29 827.02 26,896.37 2,146.21 63,833.66
29 108,949.71 1,319.19 38,256.48 817.12 27,713.49 2,136.31 65,969.97
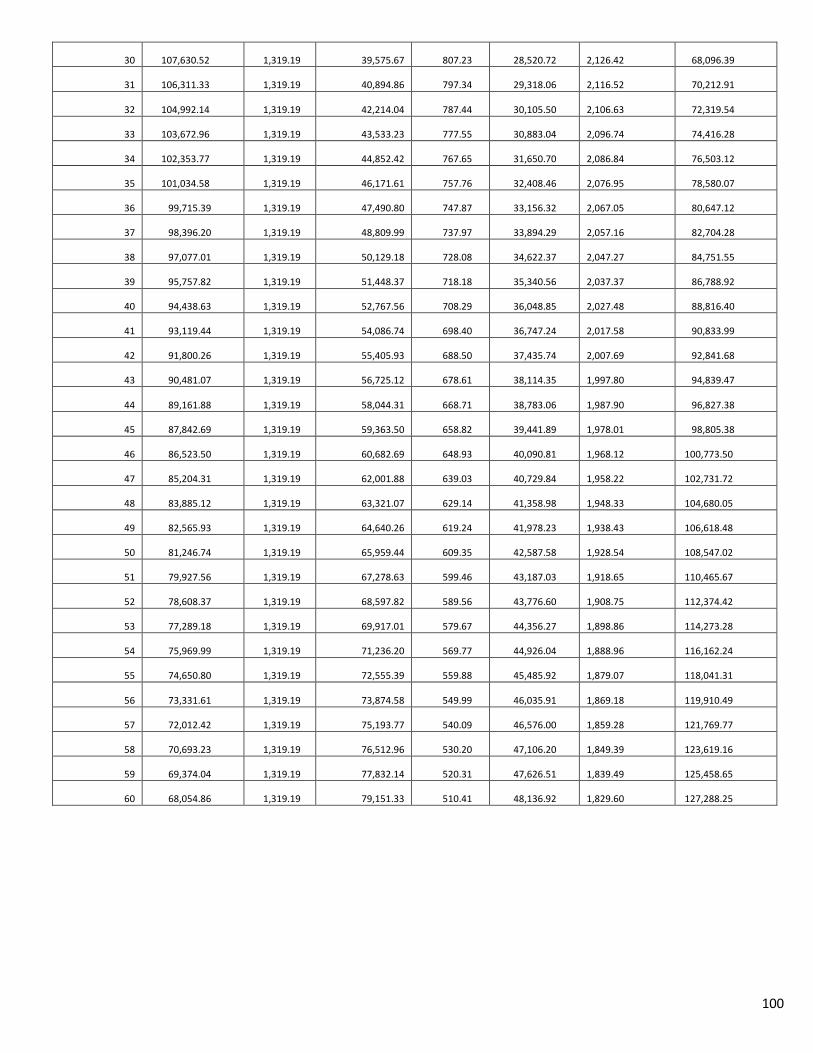
100
30 107,630.52 1,319.19 39,575.67 807.23 28,520.72 2,126.42 68,096.39
31 106,311.33 1,319.19 40,894.86 797.34 29,318.06 2,116.52 70,212.91
32 104,992.14 1,319.19 42,214.04 787.44 30,105.50 2,106.63 72,319.54
33 103,672.96 1,319.19 43,533.23 777.55 30,883.04 2,096.74 74,416.28
34 102,353.77 1,319.19 44,852.42 767.65 31,650.70 2,086.84 76,503.12
35 101,034.58 1,319.19 46,171.61 757.76 32,408.46 2,076.95 78,580.07
36 99,715.39 1,319.19 47,490.80 747.87 33,156.32 2,067.05 80,647.12
37 98,396.20 1,319.19 48,809.99 737.97 33,894.29 2,057.16 82,704.28
38 97,077.01 1,319.19 50,129.18 728.08 34,622.37 2,047.27 84,751.55
39 95,757.82 1,319.19 51,448.37 718.18 35,340.56 2,037.37 86,788.92
40 94,438.63 1,319.19 52,767.56 708.29 36,048.85 2,027.48 88,816.40
41 93,119.44 1,319.19 54,086.74 698.40 36,747.24 2,017.58 90,833.99
42 91,800.26 1,319.19 55,405.93 688.50 37,435.74 2,007.69 92,841.68
43 90,481.07 1,319.19 56,725.12 678.61 38,114.35 1,997.80 94,839.47
44 89,161.88 1,319.19 58,044.31 668.71 38,783.06 1,987.90 96,827.38
45 87,842.69 1,319.19 59,363.50 658.82 39,441.89 1,978.01 98,805.38
46 86,523.50 1,319.19 60,682.69 648.93 40,090.81 1,968.12 100,773.50
47 85,204.31 1,319.19 62,001.88 639.03 40,729.84 1,958.22 102,731.72
48 83,885.12 1,319.19 63,321.07 629.14 41,358.98 1,948.33 104,680.05
49 82,565.93 1,319.19 64,640.26 619.24 41,978.23 1,938.43 106,618.48
50 81,246.74 1,319.19 65,959.44 609.35 42,587.58 1,928.54 108,547.02
51 79,927.56 1,319.19 67,278.63 599.46 43,187.03 1,918.65 110,465.67
52 78,608.37 1,319.19 68,597.82 589.56 43,776.60 1,908.75 112,374.42
53 77,289.18 1,319.19 69,917.01 579.67 44,356.27 1,898.86 114,273.28
54 75,969.99 1,319.19 71,236.20 569.77 44,926.04 1,888.96 116,162.24
55 74,650.80 1,319.19 72,555.39 559.88 45,485.92 1,879.07 118,041.31
56 73,331.61 1,319.19 73,874.58 549.99 46,035.91 1,869.18 119,910.49
57 72,012.42 1,319.19 75,193.77 540.09 46,576.00 1,859.28 121,769.77
58 70,693.23 1,319.19 76,512.96 530.20 47,106.20 1,849.39 123,619.16
59 69,374.04 1,319.19 77,832.14 520.31 47,626.51 1,839.49 125,458.65
60 68,054.86 1,319.19 79,151.33 510.41 48,136.92 1,829.60 127,288.25
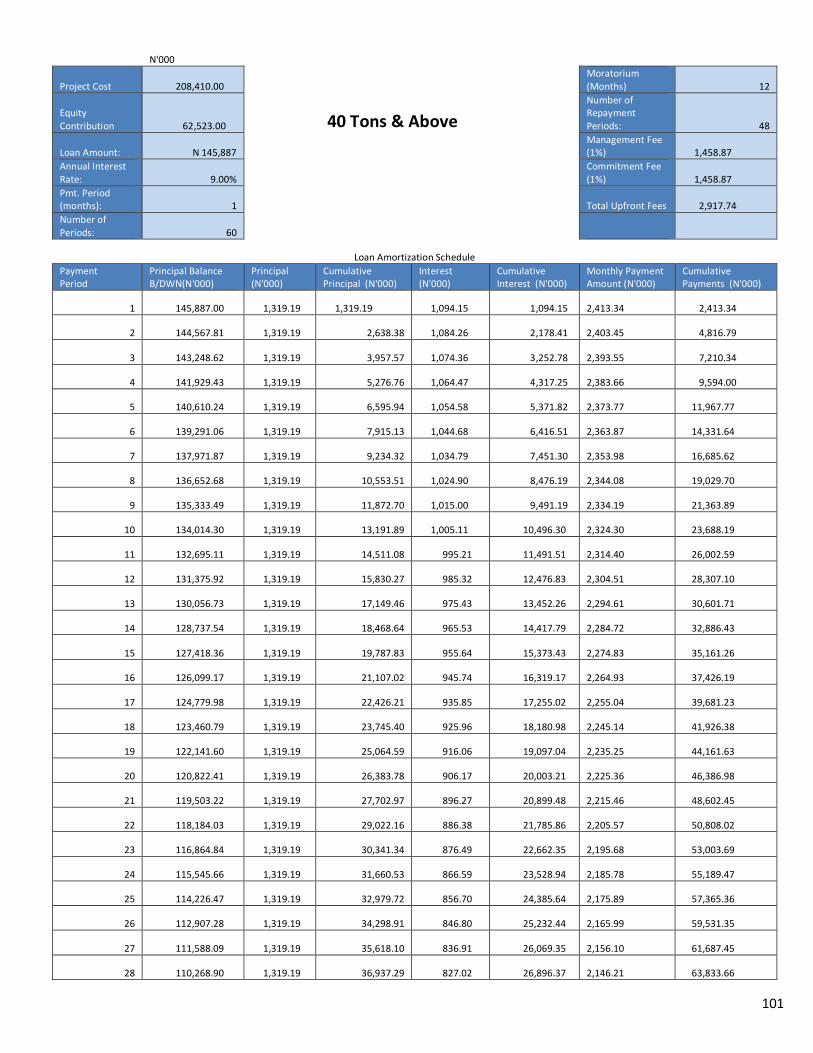
101
N'000
Project Cost 208,410.00
Moratorium (Months) 12
Equity Contribution 62,523.00 40 Tons & Above
Number of Repayment Periods: 48
Loan Amount: N 145,887
Management Fee (1%) 1,458.87
Annual Interest Rate: 9.00%
Commitment Fee (1%) 1,458.87
Pmt. Period (months): 1 Total Upfront Fees 2,917.74
Number of Periods: 60
Loan Amortization Schedule
Payment Period
Principal Balance B/DWN(N'000)
Principal (N'000)
Cumulative Principal (N'000)
Interest (N'000)
Cumulative Interest (N'000)
Monthly Payment Amount (N'000)
Cumulative Payments (N'000)
1 145,887.00 1,319.19 1,319.19 1,094.15 1,094.15 2,413.34 2,413.34
2 144,567.81 1,319.19 2,638.38 1,084.26 2,178.41 2,403.45 4,816.79
3 143,248.62 1,319.19 3,957.57 1,074.36 3,252.78 2,393.55 7,210.34
4 141,929.43 1,319.19 5,276.76 1,064.47 4,317.25 2,383.66 9,594.00
5 140,610.24 1,319.19 6,595.94 1,054.58 5,371.82 2,373.77 11,967.77
6 139,291.06 1,319.19 7,915.13 1,044.68 6,416.51 2,363.87 14,331.64
7 137,971.87 1,319.19 9,234.32 1,034.79 7,451.30 2,353.98 16,685.62
8 136,652.68 1,319.19 10,553.51 1,024.90 8,476.19 2,344.08 19,029.70
9 135,333.49 1,319.19 11,872.70 1,015.00 9,491.19 2,334.19 21,363.89
10 134,014.30 1,319.19 13,191.89 1,005.11 10,496.30 2,324.30 23,688.19
11 132,695.11 1,319.19 14,511.08 995.21 11,491.51 2,314.40 26,002.59
12 131,375.92 1,319.19 15,830.27 985.32 12,476.83 2,304.51 28,307.10
13 130,056.73 1,319.19 17,149.46 975.43 13,452.26 2,294.61 30,601.71
14 128,737.54 1,319.19 18,468.64 965.53 14,417.79 2,284.72 32,886.43
15 127,418.36 1,319.19 19,787.83 955.64 15,373.43 2,274.83 35,161.26
16 126,099.17 1,319.19 21,107.02 945.74 16,319.17 2,264.93 37,426.19
17 124,779.98 1,319.19 22,426.21 935.85 17,255.02 2,255.04 39,681.23
18 123,460.79 1,319.19 23,745.40 925.96 18,180.98 2,245.14 41,926.38
19 122,141.60 1,319.19 25,064.59 916.06 19,097.04 2,235.25 44,161.63
20 120,822.41 1,319.19 26,383.78 906.17 20,003.21 2,225.36 46,386.98
21 119,503.22 1,319.19 27,702.97 896.27 20,899.48 2,215.46 48,602.45
22 118,184.03 1,319.19 29,022.16 886.38 21,785.86 2,205.57 50,808.02
23 116,864.84 1,319.19 30,341.34 876.49 22,662.35 2,195.68 53,003.69
24 115,545.66 1,319.19 31,660.53 866.59 23,528.94 2,185.78 55,189.47
25 114,226.47 1,319.19 32,979.72 856.70 24,385.64 2,175.89 57,365.36
26 112,907.28 1,319.19 34,298.91 846.80 25,232.44 2,165.99 59,531.35
27 111,588.09 1,319.19 35,618.10 836.91 26,069.35 2,156.10 61,687.45
28 110,268.90 1,319.19 36,937.29 827.02 26,896.37 2,146.21 63,833.66
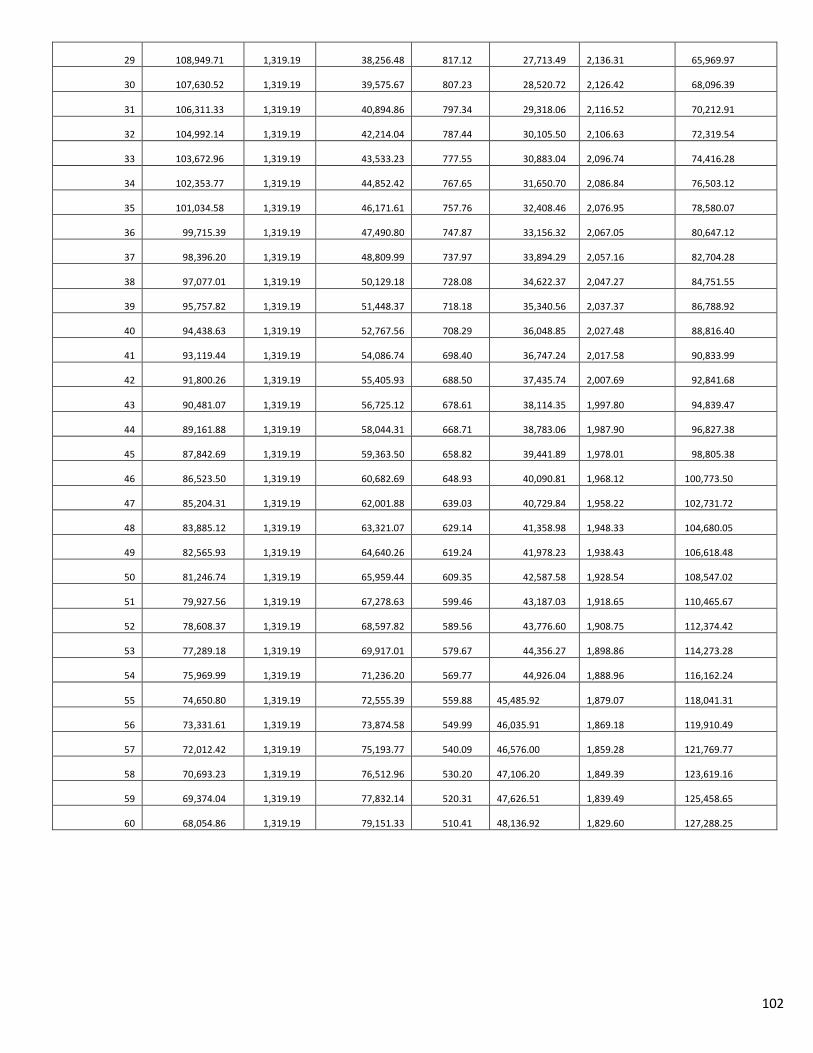
102
29 108,949.71 1,319.19 38,256.48 817.12 27,713.49 2,136.31 65,969.97
30 107,630.52 1,319.19 39,575.67 807.23 28,520.72 2,126.42 68,096.39
31 106,311.33 1,319.19 40,894.86 797.34 29,318.06 2,116.52 70,212.91
32 104,992.14 1,319.19 42,214.04 787.44 30,105.50 2,106.63 72,319.54
33 103,672.96 1,319.19 43,533.23 777.55 30,883.04 2,096.74 74,416.28
34 102,353.77 1,319.19 44,852.42 767.65 31,650.70 2,086.84 76,503.12
35 101,034.58 1,319.19 46,171.61 757.76 32,408.46 2,076.95 78,580.07
36 99,715.39 1,319.19 47,490.80 747.87 33,156.32 2,067.05 80,647.12
37 98,396.20 1,319.19 48,809.99 737.97 33,894.29 2,057.16 82,704.28
38 97,077.01 1,319.19 50,129.18 728.08 34,622.37 2,047.27 84,751.55
39 95,757.82 1,319.19 51,448.37 718.18 35,340.56 2,037.37 86,788.92
40 94,438.63 1,319.19 52,767.56 708.29 36,048.85 2,027.48 88,816.40
41 93,119.44 1,319.19 54,086.74 698.40 36,747.24 2,017.58 90,833.99
42 91,800.26 1,319.19 55,405.93 688.50 37,435.74 2,007.69 92,841.68
43 90,481.07 1,319.19 56,725.12 678.61 38,114.35 1,997.80 94,839.47
44 89,161.88 1,319.19 58,044.31 668.71 38,783.06 1,987.90 96,827.38
45 87,842.69 1,319.19 59,363.50 658.82 39,441.89 1,978.01 98,805.38
46 86,523.50 1,319.19 60,682.69 648.93 40,090.81 1,968.12 100,773.50
47 85,204.31 1,319.19 62,001.88 639.03 40,729.84 1,958.22 102,731.72
48 83,885.12 1,319.19 63,321.07 629.14 41,358.98 1,948.33 104,680.05
49 82,565.93 1,319.19 64,640.26 619.24 41,978.23 1,938.43 106,618.48
50 81,246.74 1,319.19 65,959.44 609.35 42,587.58 1,928.54 108,547.02
51 79,927.56 1,319.19 67,278.63 599.46 43,187.03 1,918.65 110,465.67
52 78,608.37 1,319.19 68,597.82 589.56 43,776.60 1,908.75 112,374.42
53 77,289.18 1,319.19 69,917.01 579.67 44,356.27 1,898.86 114,273.28
54 75,969.99 1,319.19 71,236.20 569.77 44,926.04 1,888.96 116,162.24
55 74,650.80 1,319.19 72,555.39 559.88 45,485.92 1,879.07 118,041.31
56 73,331.61 1,319.19 73,874.58 549.99 46,035.91 1,869.18 119,910.49
57 72,012.42 1,319.19 75,193.77 540.09 46,576.00 1,859.28 121,769.77
58 70,693.23 1,319.19 76,512.96 530.20 47,106.20 1,849.39 123,619.16
59 69,374.04 1,319.19 77,832.14 520.31 47,626.51 1,839.49 125,458.65
60 68,054.86 1,319.19 79,151.33 510.41 48,136.92 1,829.60 127,288.25

103
ORGANIZATION
AND
MANAGEMENT
104
8. ORGANIZATION AND MANAGEMENT
The success of an organization depends very much on its Management. It is the pivot on which organization effectiveness rests. For effective operations, a good and effective management is essential for the project. A Board of Director, Managing Director/Chairman, a General Manager and Departmental Managers should
manage the company. This could be increased as the company grows. The departments are:- i. Factory Operations or Production ii. Marketing / Sales
iii. Finance / Administration iv. Outgrowers Unit/Farm Operation
The recommended organization structure is in Chart I-IV. The charts shows the personnel that should be
employed.
8.1 The Board There should be a Board of Directors for the company to be chaired by the Investor. The Board would
responsible for formulating policies and objectives of the company. In particular, the Board would be responsible for:- i. Growth and profitability
ii. High level contact iii. Policy direction and control iv. Corporate development plans
v. Market share vi. Product development
8.2 The Management
The Managing Director would be responsible for the overall management and co-ordination of the activities of the above departments. He would implement board policies for the company. His duties and responsibilities include amongst others:-
i. Policy Implementation and Initiation ii. Raw Material Procurement iii. Product Development
iv. Budgets v. High Level Contact vi. Market share
vii. Corporate Planning
8.3 Production Department
The production department shall be headed by an experienced and skilled personnel. He would initiate training programmes to ensure that the workers are properly trained in the production process. He is to ensure effective machine utilization into less than 60%. He would be responsible for production scheduling and effective labour control. He would be expected to achieve results in the following key areas:-
i. Production volume ii. Quality control iii. Labour control
iv. Production planning v. Materials Availability and Control vi. Safety and Security
Production and Maintenance supervisors would assist him. A Preventive maintenance scheme should be instituted. Regular and effective maintenance policy should be pursued. Safety rules and regulations should
be developed and employees should be encouraged to adhere to them. Safety is a sine-qua-non for a production set-up.
8.4 Marketing/Sales Department
The Marketing department would execute the company’s marketing programme and co-ordinate field activities. It should engage in market research to determine from time to time the customer’s needs and ensure that production satisfies the identified needs. Advertising, promotion and packaging should be given
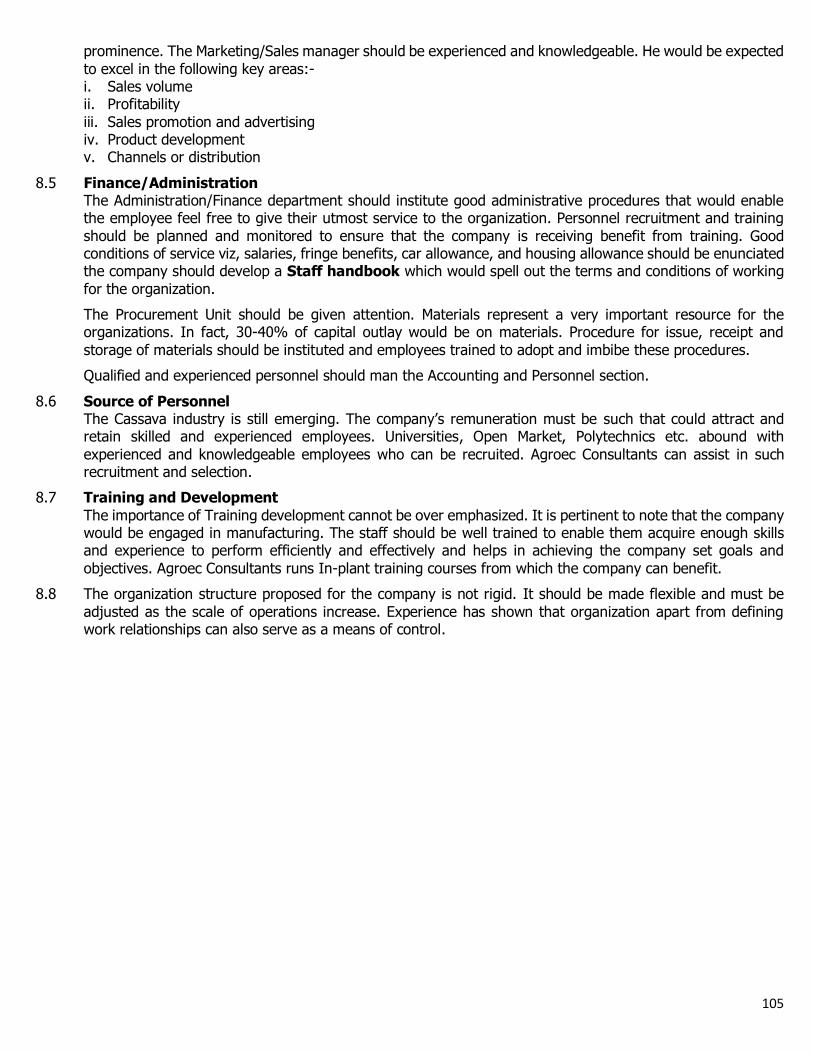
105
prominence. The Marketing/Sales manager should be experienced and knowledgeable. He would be expected
to excel in the following key areas:- i. Sales volume ii. Profitability
iii. Sales promotion and advertising iv. Product development v. Channels or distribution
8.5 Finance/Administration The Administration/Finance department should institute good administrative procedures that would enable
the employee feel free to give their utmost service to the organization. Personnel recruitment and training
should be planned and monitored to ensure that the company is receiving benefit from training. Good conditions of service viz, salaries, fringe benefits, car allowance, and housing allowance should be enunciated the company should develop a Staff handbook which would spell out the terms and conditions of working
for the organization.
The Procurement Unit should be given attention. Materials represent a very important resource for the organizations. In fact, 30-40% of capital outlay would be on materials. Procedure for issue, receipt and
storage of materials should be instituted and employees trained to adopt and imbibe these procedures.
Qualified and experienced personnel should man the Accounting and Personnel section.
8.6 Source of Personnel The Cassava industry is still emerging. The company’s remuneration must be such that could attract and
retain skilled and experienced employees. Universities, Open Market, Polytechnics etc. abound with
experienced and knowledgeable employees who can be recruited. Agroec Consultants can assist in such recruitment and selection.
8.7 Training and Development
The importance of Training development cannot be over emphasized. It is pertinent to note that the company would be engaged in manufacturing. The staff should be well trained to enable them acquire enough skills and experience to perform efficiently and effectively and helps in achieving the company set goals and
objectives. Agroec Consultants runs In-plant training courses from which the company can benefit.
8.8 The organization structure proposed for the company is not rigid. It should be made flexible and must be
adjusted as the scale of operations increase. Experience has shown that organization apart from defining work relationships can also serve as a means of control.
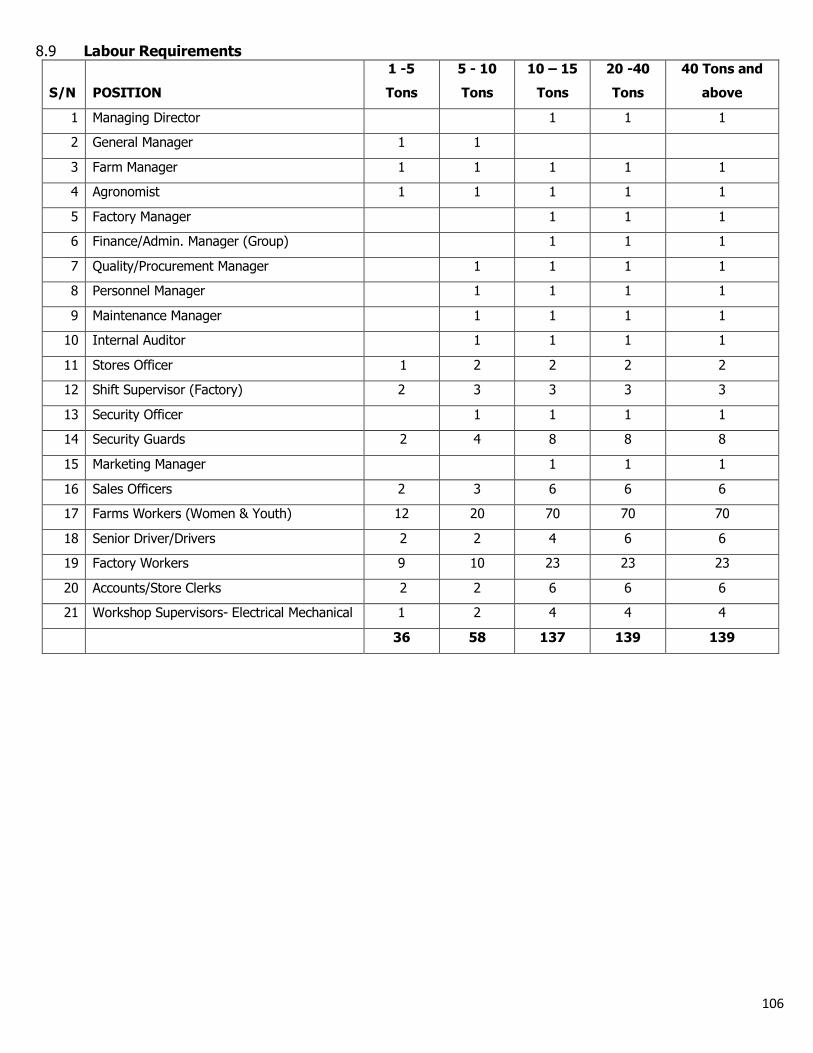
106
8.9 Labour Requirements
S/N POSITION
1 -5
Tons
5 - 10
Tons
10 – 15
Tons
20 -40
Tons
40 Tons and
above
1 Managing Director
1 1 1
2 General Manager 1 1
3 Farm Manager 1 1 1 1 1
4 Agronomist 1 1 1 1 1
5 Factory Manager
1 1 1
6 Finance/Admin. Manager (Group)
1 1 1
7 Quality/Procurement Manager 1 1 1 1
8 Personnel Manager 1 1 1 1
9 Maintenance Manager 1 1 1 1
10 Internal Auditor 1 1 1 1
11 Stores Officer 1 2 2 2 2
12 Shift Supervisor (Factory) 2 3 3 3 3
13 Security Officer 1 1 1 1
14 Security Guards 2 4 8 8 8
15 Marketing Manager
1 1 1
16 Sales Officers 2 3 6 6 6
17 Farms Workers (Women & Youth) 12 20 70 70 70
18 Senior Driver/Drivers 2 2 4 6 6
19 Factory Workers 9 10 23 23 23
20 Accounts/Store Clerks 2 2 6 6 6
21 Workshop Supervisors- Electrical Mechanical 1 2 4 4 4
36 58 137 139 139
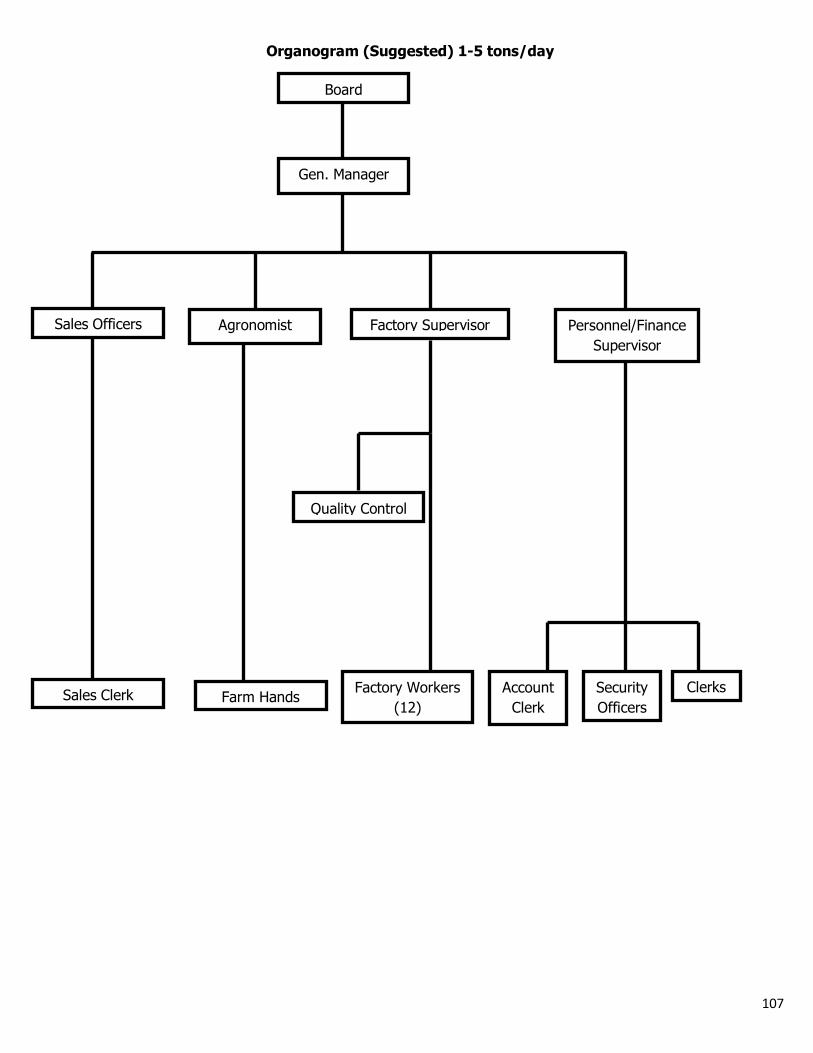
107
Organogram (Suggested) 1-5 tons/day
Board
Agronomist
Gen. Manager
Sales Officers Personnel/Finance
Supervisor
Factory Supervisor
Factory Workers
(12)
Quality Control
Account
Clerk
Security
Officers
Clerks Sales Clerk Farm Hands
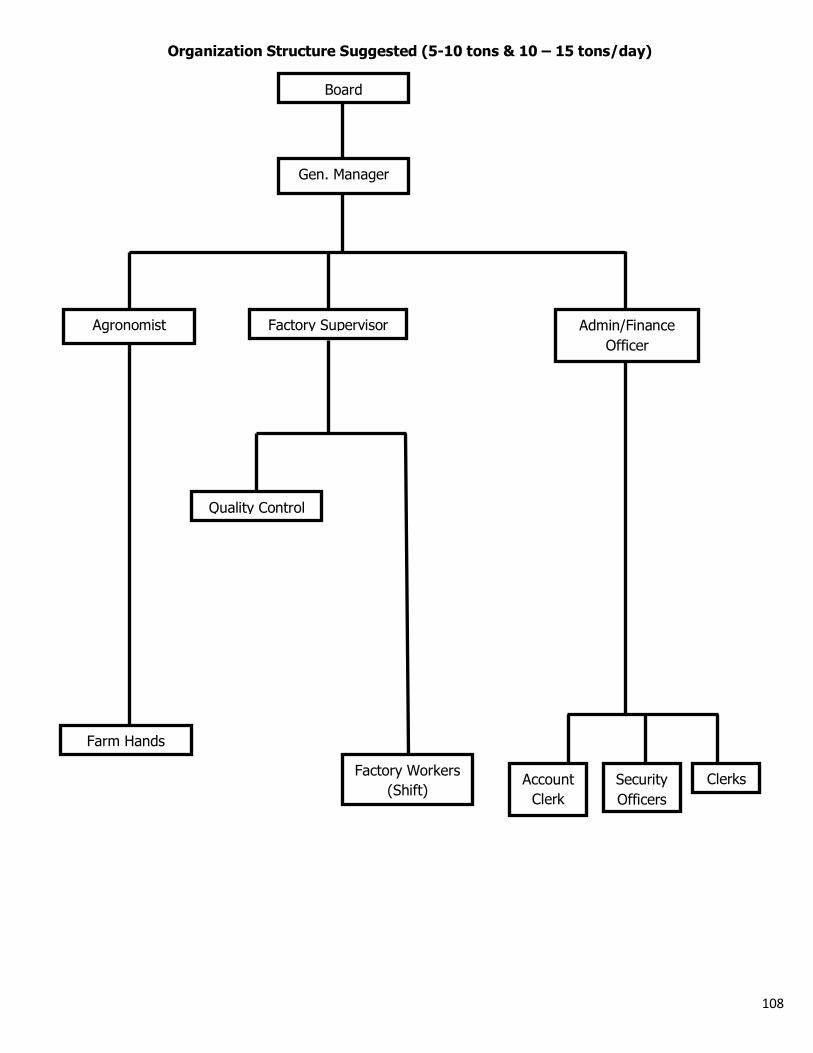
108
Organization Structure Suggested (5-10 tons & 10 – 15 tons/day)
Board
Agronomist
Gen. Manager
Admin/Finance
Officer
Factory Supervisor
Farm Hands
Factory Workers
(Shift)
Quality Control
Account
Clerk
Security
Officers
–
Clerks
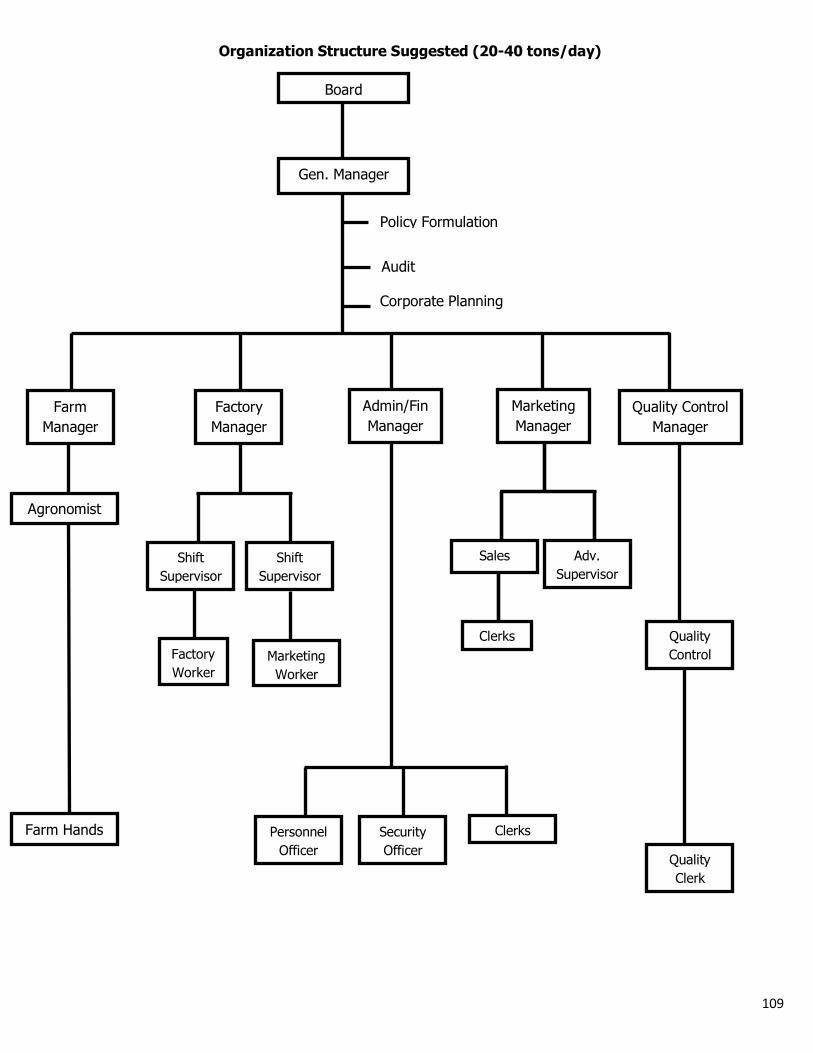
109
Organization Structure Suggested (20-40 tons/day)
Board
Gen. Manager
Shift
Supervisor
Policy Formulation
Audit
Corporate Planning
Farm
Manager
Factory
Manager
Admin/Fin
Manager
Marketing
Manager
Quality Control
Manager
Agronomist
Farm Hands
Factory
Worker
Shift
Supervisor
Marketing
Worker
Sales
Clerks
Adv.
Supervisor
Quality
Control
Quality
Clerk
Personnel
Officer
Security
Officer
Clerks
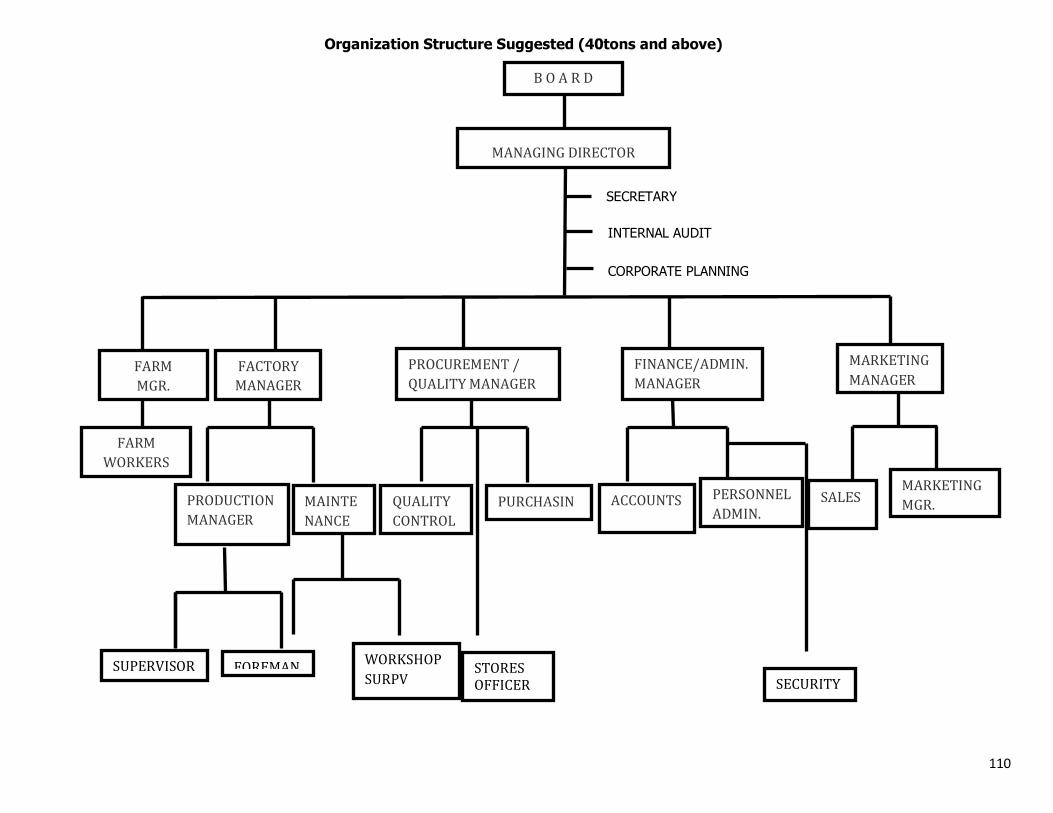
110
Organization Structure Suggested (40tons and above)
B O A R D
MANAGING DIRECTOR
FACTORY
MANAGER
PRODUCTION
MANAGER
PROCUREMENT /
QUALITY MANAGER
MAINTE
NANCE
QUALITY
CONTROL
PURCHASIN
G
FINANCE/ADMIN.
MANAGER
ACCOUNTS PERSONNEL
ADMIN.
MARKETING
MANAGER
SALES MARKETING
MGR.
FARM
MGR.
FOREMAN WORKSHOP
SURPV STORES OFFICER SECURITY
FARM
WORKERS
SUPERVISOR
INTERNAL AUDIT
SECRETARY
CORPORATE PLANNING

111
ECONOMIC FEASIBILITY
&
SOCIAL COSTS
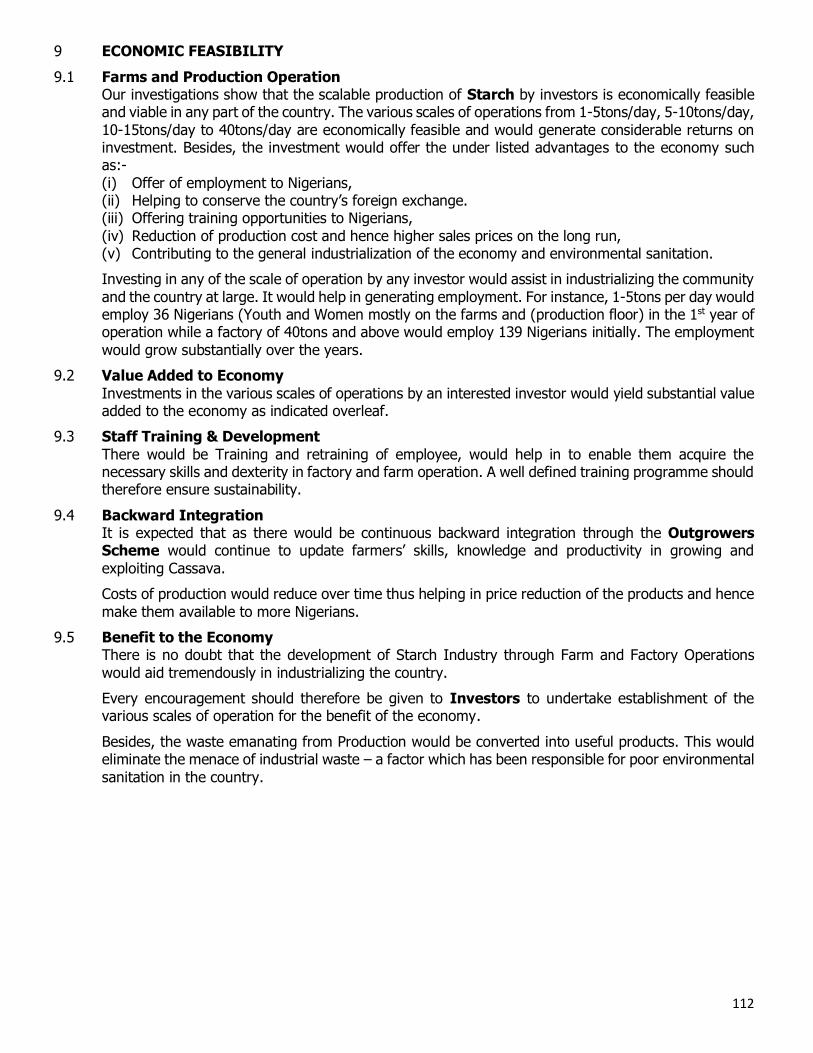
112
9 ECONOMIC FEASIBILITY
9.1 Farms and Production Operation Our investigations show that the scalable production of Starch by investors is economically feasible
and viable in any part of the country. The various scales of operations from 1-5tons/day, 5-10tons/day,
10-15tons/day to 40tons/day are economically feasible and would generate considerable returns on investment. Besides, the investment would offer the under listed advantages to the economy such as:-
(i) Offer of employment to Nigerians, (ii) Helping to conserve the country’s foreign exchange. (iii) Offering training opportunities to Nigerians,
(iv) Reduction of production cost and hence higher sales prices on the long run, (v) Contributing to the general industrialization of the economy and environmental sanitation.
Investing in any of the scale of operation by any investor would assist in industrializing the community
and the country at large. It would help in generating employment. For instance, 1-5tons per day would employ 36 Nigerians (Youth and Women mostly on the farms and (production floor) in the 1st year of operation while a factory of 40tons and above would employ 139 Nigerians initially. The employment
would grow substantially over the years.
9.2 Value Added to Economy
Investments in the various scales of operations by an interested investor would yield substantial value added to the economy as indicated overleaf.
9.3 Staff Training & Development
There would be Training and retraining of employee, would help in to enable them acquire the necessary skills and dexterity in factory and farm operation. A well defined training programme should therefore ensure sustainability.
9.4 Backward Integration It is expected that as there would be continuous backward integration through the Outgrowers Scheme would continue to update farmers’ skills, knowledge and productivity in growing and
exploiting Cassava.
Costs of production would reduce over time thus helping in price reduction of the products and hence
make them available to more Nigerians.
9.5 Benefit to the Economy There is no doubt that the development of Starch Industry through Farm and Factory Operations
would aid tremendously in industrializing the country.
Every encouragement should therefore be given to Investors to undertake establishment of the various scales of operation for the benefit of the economy.
Besides, the waste emanating from Production would be converted into useful products. This would eliminate the menace of industrial waste – a factor which has been responsible for poor environmental
sanitation in the country.
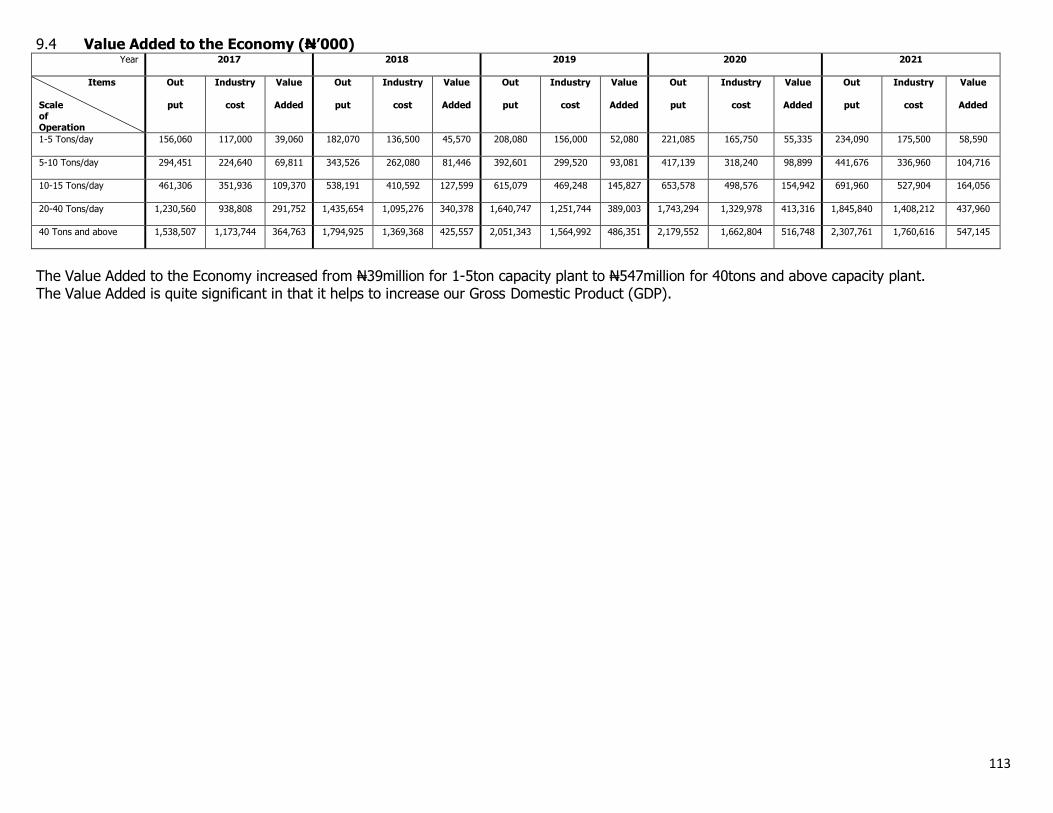
113
9.4 Value Added to the Economy (N’000) Year 2017 2018 2019 2020 2021
Items
Scale of Operation
Out
put
Industry
cost
Value
Added
Out
put
Industry
cost
Value
Added
Out
put
Industry
cost
Value
Added
Out
put
Industry
cost
Value
Added
Out
put
Industry
cost
Value
Added
1-5 Tons/day 156,060 117,000 39,060 182,070 136,500 45,570 208,080 156,000 52,080 221,085 165,750 55,335 234,090 175,500 58,590
5-10 Tons/day 294,451 224,640 69,811 343,526 262,080 81,446 392,601 299,520 93,081 417,139 318,240 98,899 441,676 336,960 104,716
10-15 Tons/day 461,306 351,936 109,370 538,191 410,592 127,599 615,079 469,248 145,827 653,578 498,576 154,942 691,960 527,904 164,056
20-40 Tons/day 1,230,560 938,808 291,752 1,435,654 1,095,276 340,378 1,640,747 1,251,744 389,003 1,743,294 1,329,978 413,316 1,845,840 1,408,212 437,960
40 Tons and above 1,538,507 1,173,744 364,763 1,794,925 1,369,368 425,557 2,051,343 1,564,992 486,351 2,179,552 1,662,804 516,748 2,307,761 1,760,616 547,145
The Value Added to the Economy increased from N39million for 1-5ton capacity plant to N547million for 40tons and above capacity plant. The Value Added is quite significant in that it helps to increase our Gross Domestic Product (GDP).

114
RECOMMENDATIONS &
CONCLUSIONS
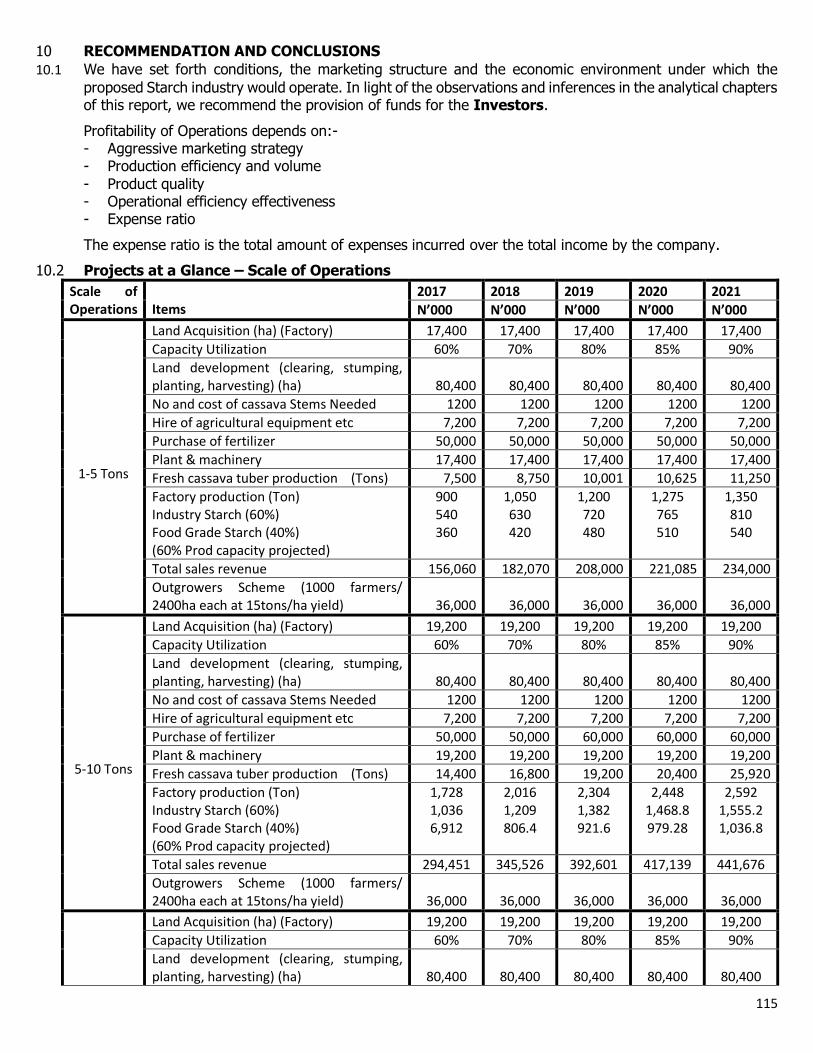
115
10 RECOMMENDATION AND CONCLUSIONS
10.1 We have set forth conditions, the marketing structure and the economic environment under which the
proposed Starch industry would operate. In light of the observations and inferences in the analytical chapters of this report, we recommend the provision of funds for the Investors.
Profitability of Operations depends on:- - Aggressive marketing strategy - Production efficiency and volume
- Product quality - Operational efficiency effectiveness - Expense ratio
The expense ratio is the total amount of expenses incurred over the total income by the company.
10.2 Projects at a Glance – Scale of Operations
Scale of Operations
Items
2017 2018 2019 2020 2021
N’000 N’000 N’000 N’000 N’000
1-5 Tons
Land Acquisition (ha) (Factory) 17,400 17,400 17,400 17,400 17,400
Capacity Utilization 60% 70% 80% 85% 90%
Land development (clearing, stumping, planting, harvesting) (ha)
80,400
80,400
80,400
80,400
80,400
No and cost of cassava Stems Needed 1200 1200 1200 1200 1200
Hire of agricultural equipment etc 7,200 7,200 7,200 7,200 7,200
Purchase of fertilizer 50,000 50,000 50,000 50,000 50,000
Plant & machinery 17,400 17,400 17,400 17,400 17,400
Fresh cassava tuber production (Tons) 7,500 8,750 10,001 10,625 11,250
Factory production (Ton) Industry Starch (60%) Food Grade Starch (40%) (60% Prod capacity projected)
900 540 360
1,050 630 420
1,200 720 480
1,275 765 510
1,350 810 540
Total sales revenue 156,060 182,070 208,000 221,085 234,000
Outgrowers Scheme (1000 farmers/ 2400ha each at 15tons/ha yield)
36,000
36,000
36,000
36,000
36,000
5-10 Tons
Land Acquisition (ha) (Factory) 19,200 19,200 19,200 19,200 19,200
Capacity Utilization 60% 70% 80% 85% 90%
Land development (clearing, stumping, planting, harvesting) (ha)
80,400
80,400
80,400
80,400
80,400
No and cost of cassava Stems Needed 1200 1200 1200 1200 1200
Hire of agricultural equipment etc 7,200 7,200 7,200 7,200 7,200
Purchase of fertilizer 50,000 50,000 60,000 60,000 60,000
Plant & machinery 19,200 19,200 19,200 19,200 19,200
Fresh cassava tuber production (Tons) 14,400 16,800 19,200 20,400 25,920
Factory production (Ton) Industry Starch (60%) Food Grade Starch (40%) (60% Prod capacity projected)
1,728 1,036 6,912
2,016 1,209 806.4
2,304 1,382 921.6
2,448 1,468.8 979.28
2,592 1,555.2 1,036.8
Total sales revenue 294,451 345,526 392,601 417,139 441,676
Outgrowers Scheme (1000 farmers/ 2400ha each at 15tons/ha yield)
36,000
36,000
36,000
36,000
36,000
Land Acquisition (ha) (Factory) 19,200 19,200 19,200 19,200 19,200
Capacity Utilization 60% 70% 80% 85% 90%
Land development (clearing, stumping, planting, harvesting) (ha)
80,400
80,400
80,400
80,400
80,400
116
10-15 Tons
No and cost of cassava Stems Needed 1200 1200 1200 1200 1200
Hire of agricultural equipment etc 7,200 7,200 7,200 7,200 7,200
Purchase of fertilizer 60,000 60,000 60,000 60,000 60,000
Plant & machinery 27,500 27,500 27,500 27,500 27,500
Fresh cassava tuber production (Tons) 22,558 26,316 30,083 31,958 33,842
Factory production (Ton) Industry Starch (60%) Food Grade Starch (40%)
2,707 1,624 1,082
3,158 1,894 1,263
3,610 2,166
994
3,835 2,310 1,534
4,061 2,436 3,817
Total sales revenue 461,306 538,191 615,075 653,518 691,960
Outgrowers Scheme (1000 farmers/ 2400ha each at 15tons/ha yield)
36,000
36,000
36,000
36,000
36,000
20-40 Tons
Land Acquisition (ha) (Factory) 42,800 42,800 42,800 42,800 42,800
Capacity Utilization 60% 70% 80% 85% 90%
Land development (clearing, stumping, planting, harvesting) (ha)
80,400
80,400
80,400
80,400
80,400
No and cost of cassava Stems Needed 1,200 1,200 1,200 1,200 1,200
Hire of agricultural equipment etc 7,200 7,200 7,200 7,200 7,200
Purchase of fertilizer 60,000 60,000 60,000 60,000 60,000
Plant & machinery 102,050 102,050 102,050 102,050 102,050
Fresh cassava tuber production (Tons) 60,183 70,208 80,241 85,258 90,266
Factory production (Ton) Industry Starch (60%) Food Grade Starch (40%)
7,222 4,333 3,611
8,425 5,055 3,370
9,629 5,777 3,851
10,231 6,139 5,107
10,832 6,499 4,332
Total sales revenue 1,220,450 1,423,858 1,627,267 1,728,971 1,830,675
Outgrowers Scheme (1000 farmers/ 2400ha each at 15tons/ha yield)
36,000
36,000
36,000
36,000
36,000
40 Tons and above
Land Acquisition (ha) (Factory) 42,800 42,800 42,800 42,800 42,800
Capacity Utilization 60% 70% 80% 85% 90%
Land development (clearing, stumping, planting, harvesting) (ha)
80,000
80,000
80,000
80,000
80,000
No and cost of cassava Stems Needed 1,200 1,200 1,200 1,200 1,200
Hire of agricultural equipment etc 7,200 7,200 7,200 7,200 7,200
Purchase of fertilizer
Plant & machinery 102,050 102,050 102,050 102,050 102,050
Fresh cassava tuber production (Tons) 75,241 87,783 100,361 106,591 112,858
Factory production (Ton) Industry Starch (60%) Food Grade Starch (40%)
9,029 5,417.4 3,611.6
10,534 6,320.4 4,213.6
12,038 7,222.8 4,815.2
12,791 7674.6
5,111.4
13,543 8,125.8 5,417.2
Total sales revenue 1,538,507 1,794,925 2,051,343 2,179,582 2,307,761
Outgrowers Scheme (1000 farmers/ 2400ha each at 15tons/ha yield)
36,000
36,000
36,000
36,000
36,000
10.3 Production/Factory Operations
Farm Operations The farm would adopt the best agronomic practices to ensure optimum yield from the farm. Such practices include:-
- Choice of the high yield varieties - Acquisition of quality planting materials - Ensuring adequate plant population per hectare (10,000/ha)
- Proper weed and pest control (Mechanical/Chemical) - Training of farm personnel on optimum operation - Fertilizer application would be based on soil analysis and/or land history /vegetation
117
10.4 Machinery/Plant
The plant/machinery recommended are capable of meeting the projected sales revenue. It is however of utmost important that a preventive maintenance be established to ensure the overall useful life span of the Plant/Machinery. Preventive maintenance scheme would ensure:-
i. An equipment record ii. Preventive maintenance inspection records iii. Work orders
iv. Maintenance time cards v. A storeroom withdrawal order vi. A monthly report of preventive maintenance inspections
vii. A mechanical down-time report
The major objective is to keep equipment in excellent conditions at all times, regardless of the number of shifts being operated. Maintenance also enables adequate knowledge of the condition of every piece of
equipment in the Petrol Station, to add forecast of its life and dependability. It is preventive maintenance more than breakdown maintenance that readily meets these objectives.
The effective operation of the plant/machinery is very essential to ensure high level of productivity and realize the expected sales revenue and attendant profit. The employees should be properly trained and educated in the operations of the plant/machinery.
10.5 Factory Operations Proper and consolidated arrangements must be made with financiers to ensure uninterrupted supply of fresh cassava root and have sustained sales revenue projected in the Performa Income statement. It is
recommended that the proposed scalable production should buy a month’s stock of materials as safety stock to prevent the consequences of frequent shortage of products. The materials should be properly stored and secured to prevent loss or misuse.
The shift supervisor should ensure effective labor control and discipline and prevent theft amongst all categories of staff. An Instructional Handbook should be complied to train employees in factory operational procedures to minimize constant breakdown of machinery. Records keeping and administration should be
given proper attention and log book opened to record event happenings at each shift.
10.6 Marketing
An aggressive marketing strategy aimed at market penetration should be developed in the area of promotion and marketing services. Effort should be geared towards effective advertising and sales promotion of the factory product.
Brand loyalty while no too important in the industry, the identity of the product could be established through efficient operations and marketing incentives that would endear the product to its customers.
It is essential that clear marketing objectives are set both on the medium and long term. The objectives
should give answer to the following:-
i. What sales volume (in units/naira) do we aim for? Will the market absorbs it all
ii. What is the target coverage level in terms of units/area iii. What staff do we need to ensure achievement of objective
In conclusion, marketing should be seen as major answer to most organization’s problems. Every
organization is served by at least 3 kinds of publics – those who consume their services, public whose goodwill is important to the organization and publics who supply the necessary resources. An organization should therefore use marketing to develop the right services for its customers, to attract the resources it
needs and to communicate and win goodwill.
10.7 Personnel Policy/Organization A sound personnel policy should be initiated to ensure continuous motivations and retention of staff.
Remunerative package already recommended should be adjusted and improved upon as situation dictate.
118
The investor should not operate under the impression that employees are unimportant in the operation.
Close attention should be given to policies that would enhance the productivity of the employee with its resultant effect on the organization.
Personnel policy should be set in the following areas:-
- Recruitment and selection - Indoctrination - Promotions and Transfer
- Work Schedule and Control - Industrial Relations - Employees Discipline and Reward
- Personnel Research
It is essential that the organization is effectively organized and capable staffed. The proposed investors should undertake the under listed activities:-
- Organizational Planning - Analyse Key Positions - Forecast Manpower Requirements
- Training - Establishing Plant Training Programmes - Train Supervisors
- Evaluate Training Programme - Employee Service - Medical Service
- Recreation - Safety - Protection/Security
10.8 Outgrowers Scheme The investor to ensure uninterrupted supply of fresh cassava root would establish an
Outgrowers Scheme. The scheme is outline below:-
5000 HECTARES OUTGROWER CASSAVA FARMS (SECOND YEAR PROJECTIONS)
Revenue
Projected yield/Hectare (Tons) 15.00
Aggregate Farm Size (Hectare) 2400
Projected Selling Price/Ton (N) 18000.00
Annual Expected Revenue (N) 648,000,000.00
Expenditures Cost/Unit (N) No. Frequency Total (N)
Pre-Planting Operations
Land Clearing
180,000.00 2400 1 432,000,000.00
Land Preparation 7,500.00 2400 4 72,000,000.00 504,000,000.00
Material Purchases
Cassava Stem 500.00 2400 30 36,000,000.00
Fertilizers
10,500.00 2400
2.00 50,400,000.00
Herbicides 5,000.00 2400 2 24,000,000.00
Pesticides 2,500.00 2400 2 12,000,000.00 122,400,000.00
Planting & Management
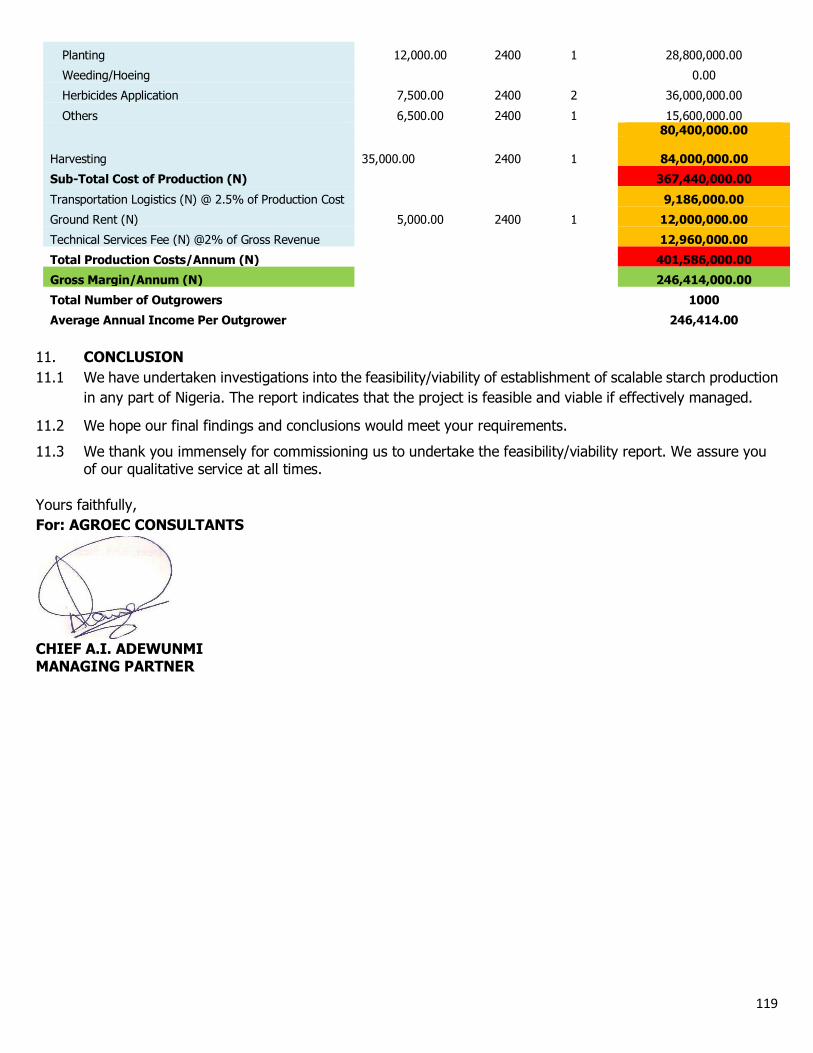
119
Planting 12,000.00 2400 1 28,800,000.00
Weeding/Hoeing 0.00
Herbicides Application 7,500.00 2400 2 36,000,000.00
Others 6,500.00 2400 1 15,600,000.00 80,400,000.00
Harvesting 35,000.00 2400 1 84,000,000.00
Sub-Total Cost of Production (N) 367,440,000.00
Transportation Logistics (N) @ 2.5% of Production Cost 9,186,000.00
Ground Rent (N) 5,000.00 2400 1 12,000,000.00
Technical Services Fee (N) @2% of Gross Revenue 12,960,000.00
Total Production Costs/Annum (N) 401,586,000.00
Gross Margin/Annum (N) 246,414,000.00
Total Number of Outgrowers 1000
Average Annual Income Per Outgrower 246,414.00
11. CONCLUSION
11.1 We have undertaken investigations into the feasibility/viability of establishment of scalable starch production
in any part of Nigeria. The report indicates that the project is feasible and viable if effectively managed.
11.2 We hope our final findings and conclusions would meet your requirements.
11.3 We thank you immensely for commissioning us to undertake the feasibility/viability report. We assure you of our qualitative service at all times.
Yours faithfully,
For: AGROEC CONSULTANTS
CHIEF A.I. ADEWUNMI MANAGING PARTNER
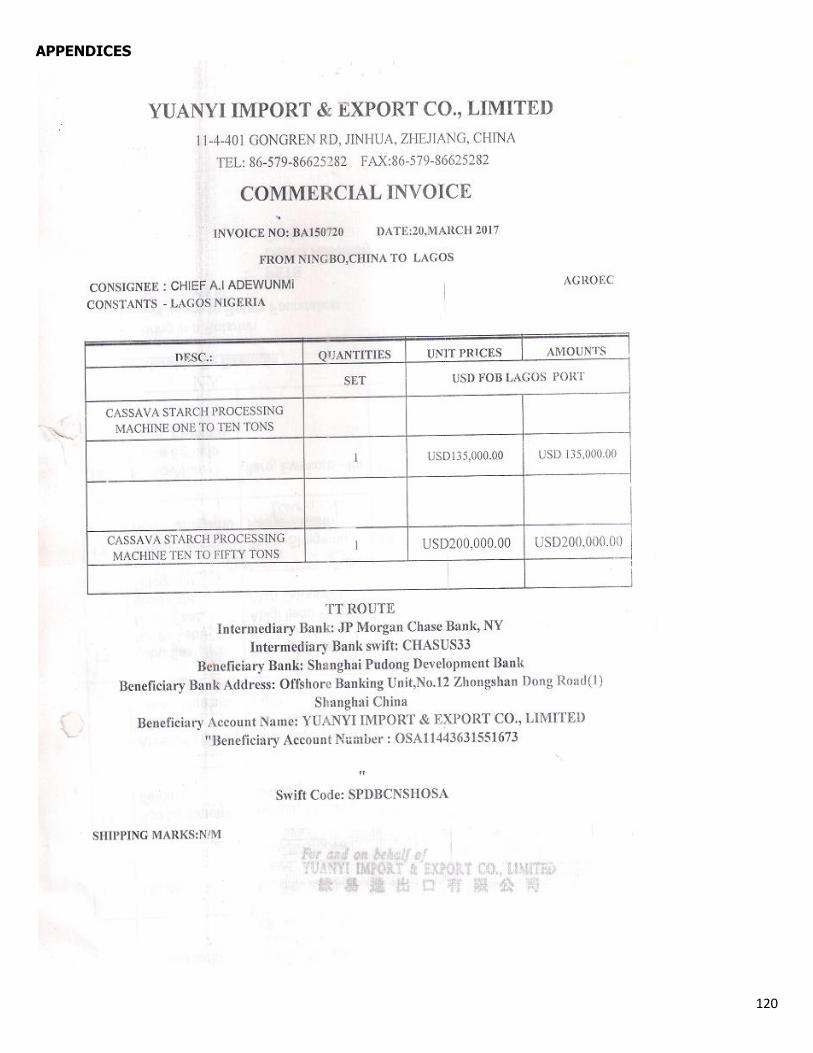
120
APPENDICES
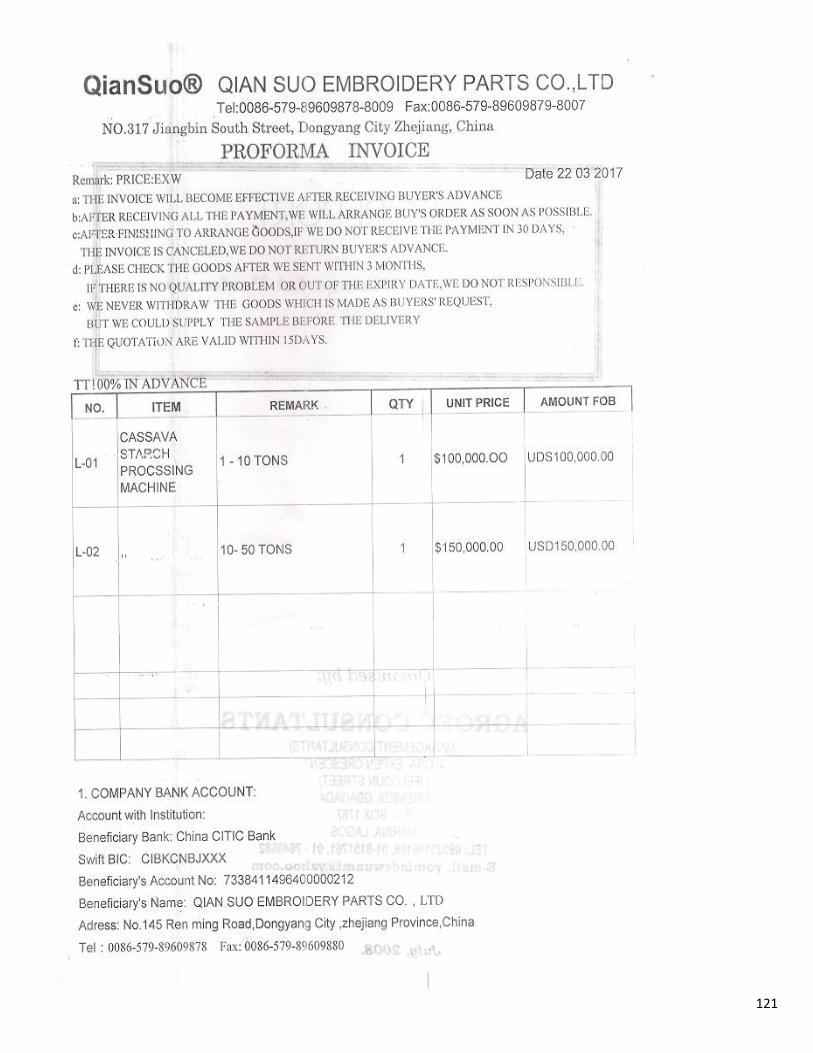
121
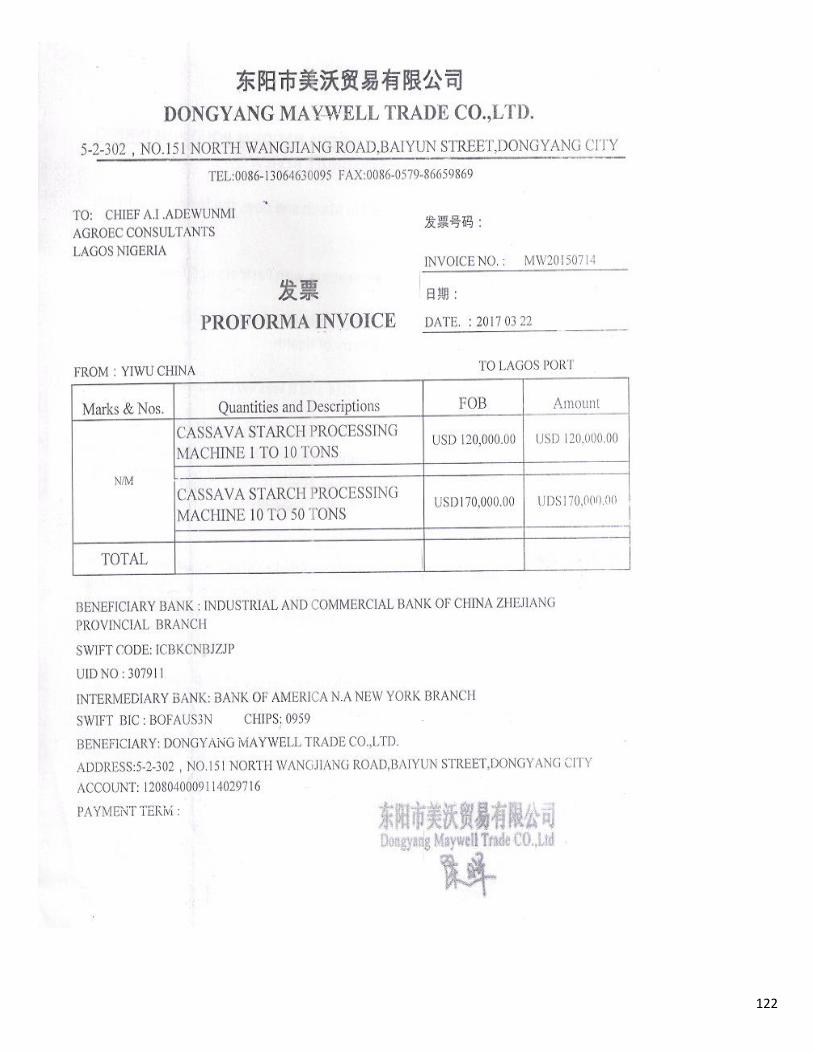
122
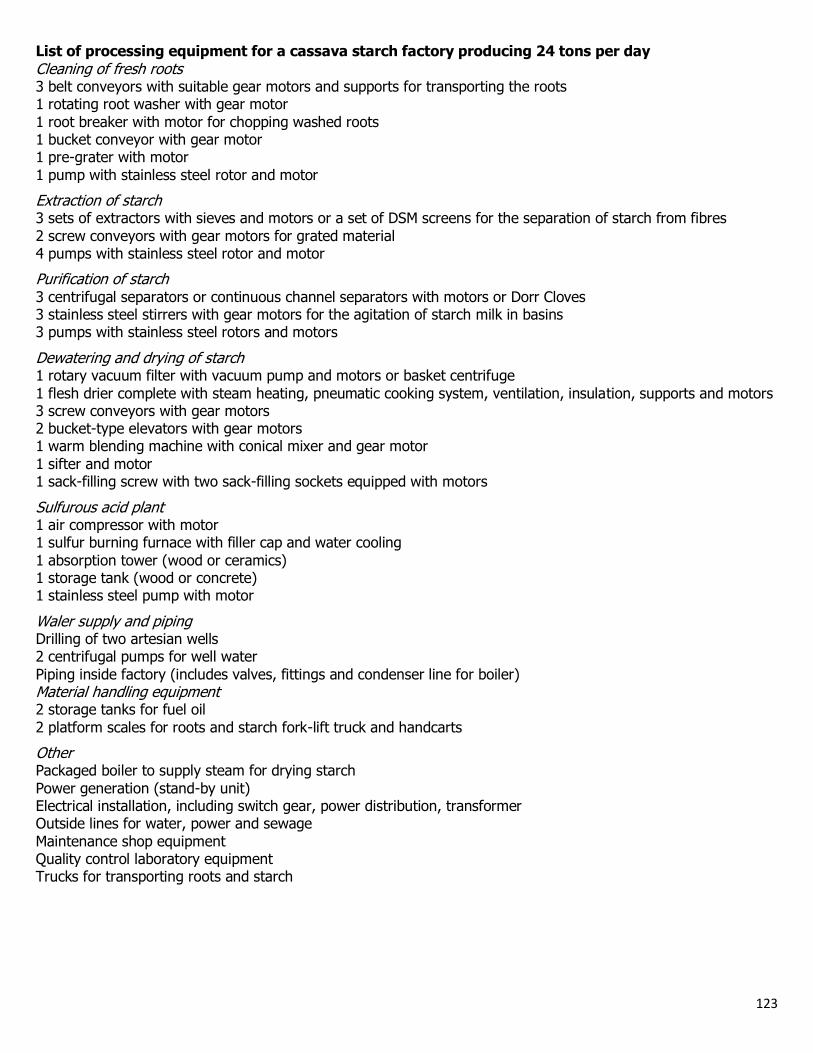
123
List of processing equipment for a cassava starch factory producing 24 tons per day
Cleaning of fresh roots 3 belt conveyors with suitable gear motors and supports for transporting the roots 1 rotating root washer with gear motor
1 root breaker with motor for chopping washed roots 1 bucket conveyor with gear motor 1 pre-grater with motor
1 pump with stainless steel rotor and motor
Extraction of starch 3 sets of extractors with sieves and motors or a set of DSM screens for the separation of starch from fibres
2 screw conveyors with gear motors for grated material 4 pumps with stainless steel rotor and motor
Purification of starch
3 centrifugal separators or continuous channel separators with motors or Dorr Cloves 3 stainless steel stirrers with gear motors for the agitation of starch milk in basins 3 pumps with stainless steel rotors and motors
Dewatering and drying of starch 1 rotary vacuum filter with vacuum pump and motors or basket centrifuge
1 flesh drier complete with steam heating, pneumatic cooking system, ventilation, insulation, supports and motors 3 screw conveyors with gear motors 2 bucket-type elevators with gear motors 1 warm blending machine with conical mixer and gear motor
1 sifter and motor 1 sack-filling screw with two sack-filling sockets equipped with motors
Sulfurous acid plant 1 air compressor with motor 1 sulfur burning furnace with filler cap and water cooling
1 absorption tower (wood or ceramics) 1 storage tank (wood or concrete) 1 stainless steel pump with motor
Waler supply and piping Drilling of two artesian wells 2 centrifugal pumps for well water
Piping inside factory (includes valves, fittings and condenser line for boiler) Material handling equipment 2 storage tanks for fuel oil
2 platform scales for roots and starch fork-lift truck and handcarts
Other Packaged boiler to supply steam for drying starch
Power generation (stand-by unit) Electrical installation, including switch gear, power distribution, transformer Outside lines for water, power and sewage
Maintenance shop equipment Quality control laboratory equipment Trucks for transporting roots and starch
124
FINAL REPORT
A MODEL TURNKEY FEASIBILITY/VIABILITY STUDY AND BUSINESS PLAN - An Operations Manual
ON
SCALABLE CASSAVA PROCESSING
INTO
STARCH – Industry and Food Grade An Industry Wide Study to Attract Investors and Spur Investments
For CARANA CORPORATION
20, Port Harcourt Crescent, Off Gimbiya Street, Garki II,
Abuja, Nigeria.
BY AGROEC CONSULTANTS 4, Ore Ekpen Crescent, Ifelodun Street,
Near Gbagada General Hospital, Oremeji, Gbagada, Lagos.
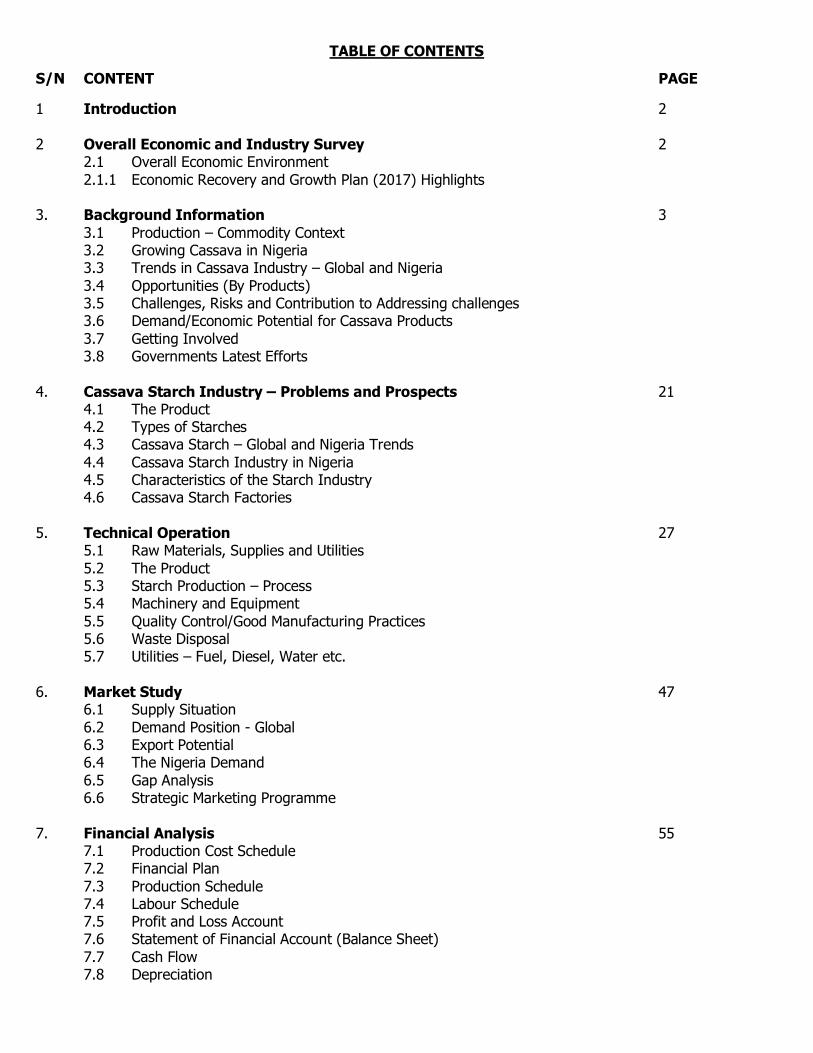
125
TABLE OF CONTENTS
S/N CONTENT PAGE
1 Introduction 2
2 Overall Economic and Industry Survey 2
2.1 Overall Economic Environment
2.1.1 Economic Recovery and Growth Plan (2017) Highlights
3. Background Information 3
3.1 Production – Commodity Context 3.2 Growing Cassava in Nigeria 3.3 Trends in Cassava Industry – Global and Nigeria
3.4 Opportunities (By Products) 3.5 Challenges, Risks and Contribution to Addressing challenges 3.6 Demand/Economic Potential for Cassava Products
3.7 Getting Involved 3.8 Governments Latest Efforts
4. Cassava Starch Industry – Problems and Prospects 21 4.1 The Product 4.2 Types of Starches 4.3 Cassava Starch – Global and Nigeria Trends
4.4 Cassava Starch Industry in Nigeria 4.5 Characteristics of the Starch Industry 4.6 Cassava Starch Factories
5. Technical Operation 27
5.1 Raw Materials, Supplies and Utilities
5.2 The Product 5.3 Starch Production – Process 5.4 Machinery and Equipment
5.5 Quality Control/Good Manufacturing Practices 5.6 Waste Disposal 5.7 Utilities – Fuel, Diesel, Water etc.
6. Market Study 47
6.1 Supply Situation
6.2 Demand Position - Global 6.3 Export Potential 6.4 The Nigeria Demand
6.5 Gap Analysis 6.6 Strategic Marketing Programme
7. Financial Analysis 55 7.1 Production Cost Schedule 7.2 Financial Plan
7.3 Production Schedule 7.4 Labour Schedule 7.5 Profit and Loss Account 7.6 Statement of Financial Account (Balance Sheet)
7.7 Cash Flow 7.8 Depreciation
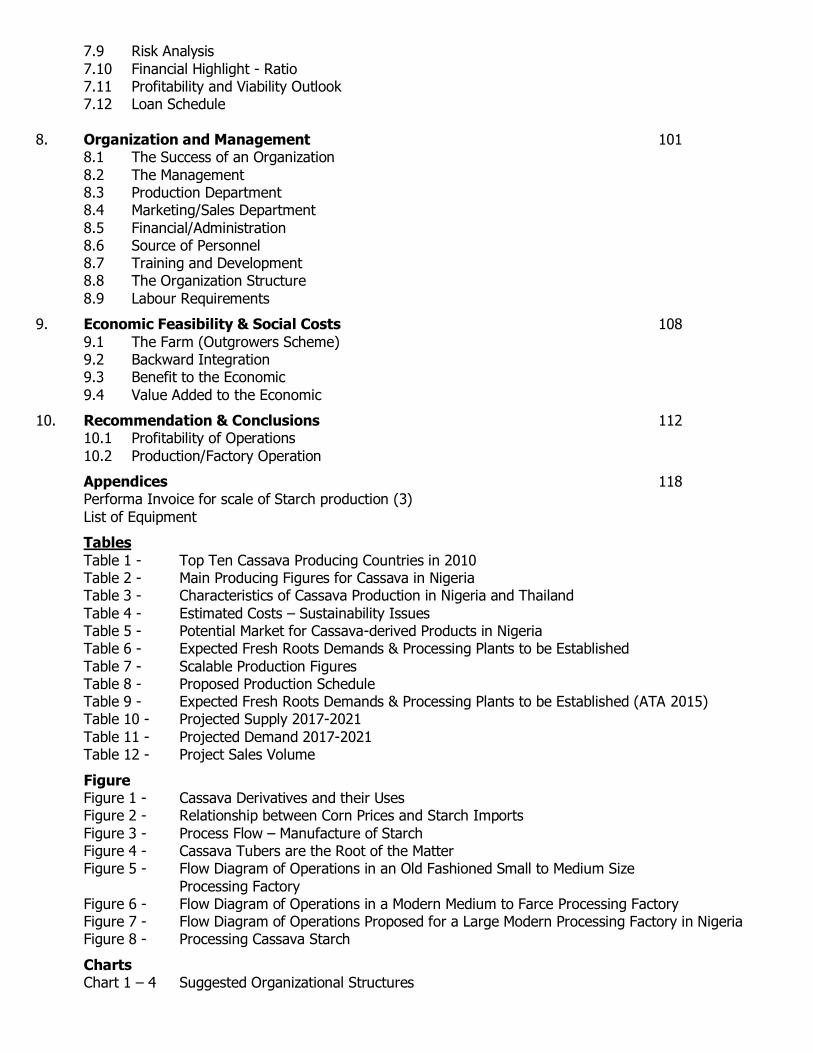
126
7.9 Risk Analysis
7.10 Financial Highlight - Ratio 7.11 Profitability and Viability Outlook 7.12 Loan Schedule
8. Organization and Management 101 8.1 The Success of an Organization
8.2 The Management 8.3 Production Department 8.4 Marketing/Sales Department
8.5 Financial/Administration 8.6 Source of Personnel 8.7 Training and Development 8.8 The Organization Structure
8.9 Labour Requirements
9. Economic Feasibility & Social Costs 108
9.1 The Farm (Outgrowers Scheme) 9.2 Backward Integration
9.3 Benefit to the Economic
9.4 Value Added to the Economic
10. Recommendation & Conclusions 112 10.1 Profitability of Operations
10.2 Production/Factory Operation
Appendices 118 Performa Invoice for scale of Starch production (3)
List of Equipment
Tables
Table 1 - Top Ten Cassava Producing Countries in 2010 Table 2 - Main Producing Figures for Cassava in Nigeria Table 3 - Characteristics of Cassava Production in Nigeria and Thailand
Table 4 - Estimated Costs – Sustainability Issues Table 5 - Potential Market for Cassava-derived Products in Nigeria Table 6 - Expected Fresh Roots Demands & Processing Plants to be Established
Table 7 - Scalable Production Figures Table 8 - Proposed Production Schedule Table 9 - Expected Fresh Roots Demands & Processing Plants to be Established (ATA 2015) Table 10 - Projected Supply 2017-2021
Table 11 - Projected Demand 2017-2021 Table 12 - Project Sales Volume
Figure Figure 1 - Cassava Derivatives and their Uses
Figure 2 - Relationship between Corn Prices and Starch Imports
Figure 3 - Process Flow – Manufacture of Starch Figure 4 - Cassava Tubers are the Root of the Matter Figure 5 - Flow Diagram of Operations in an Old Fashioned Small to Medium Size
Processing Factory Figure 6 - Flow Diagram of Operations in a Modern Medium to Farce Processing Factory Figure 7 - Flow Diagram of Operations Proposed for a Large Modern Processing Factory in Nigeria Figure 8 - Processing Cassava Starch
Charts Chart 1 – 4 Suggested Organizational Structures