1 understanding x-rays: the electromagnetic spectrum · 2020-01-03 · the x-ray spectrum continuum...
TRANSCRIPT

Understanding X-rays: The electromagnetic spectrum
SiK 1.74 keV 0.71 nm
UM 3.17 keV 0.39 nm
E = h h : Planck's constant = 6.626x10⁻³⁴ Joule.sec = 6.626x10⁻³⁴/1.6021x10-16 keV.sec
= h (c/) : frequency c : speed of light in vacuum = 2.99793x10¹⁷ nm/sec : wavelength
(nm) = hc/E = 1.2398/E (keV)
1
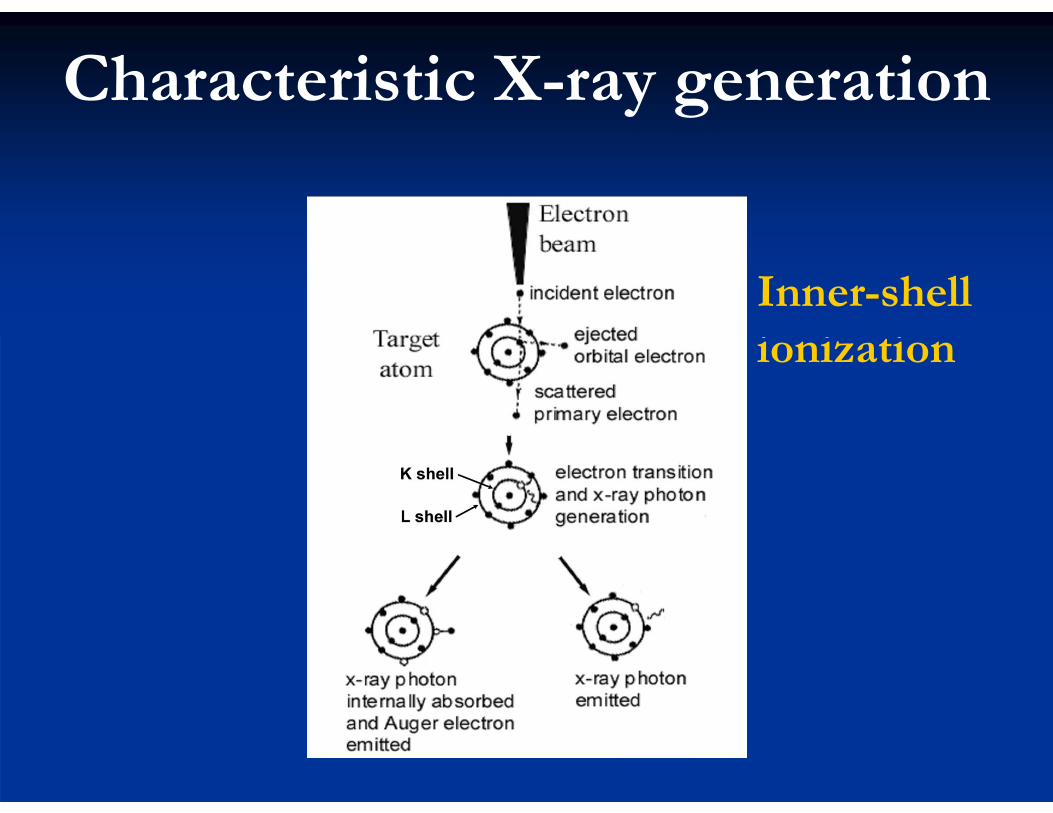
ionization
Characteristic X-ray generation
Inner-shell

X-ray nomenclature
X-ray electron transition
K L to K-shell K M to K-shell
L M to L-shell
M N to M-shell

X-ray energies
X-ray electron transition X-ray energy
K LII+III to KI EK = Ec(KI) - Ec(LII+III)
K MIII to KI EK = Ec(KI) - Ec(MIII)
L MIV+V to LIII EL = Ec(LIII) - Ec(MIV+V)
M NVII to MV EM = Ec(MV) - Ec(NVII)
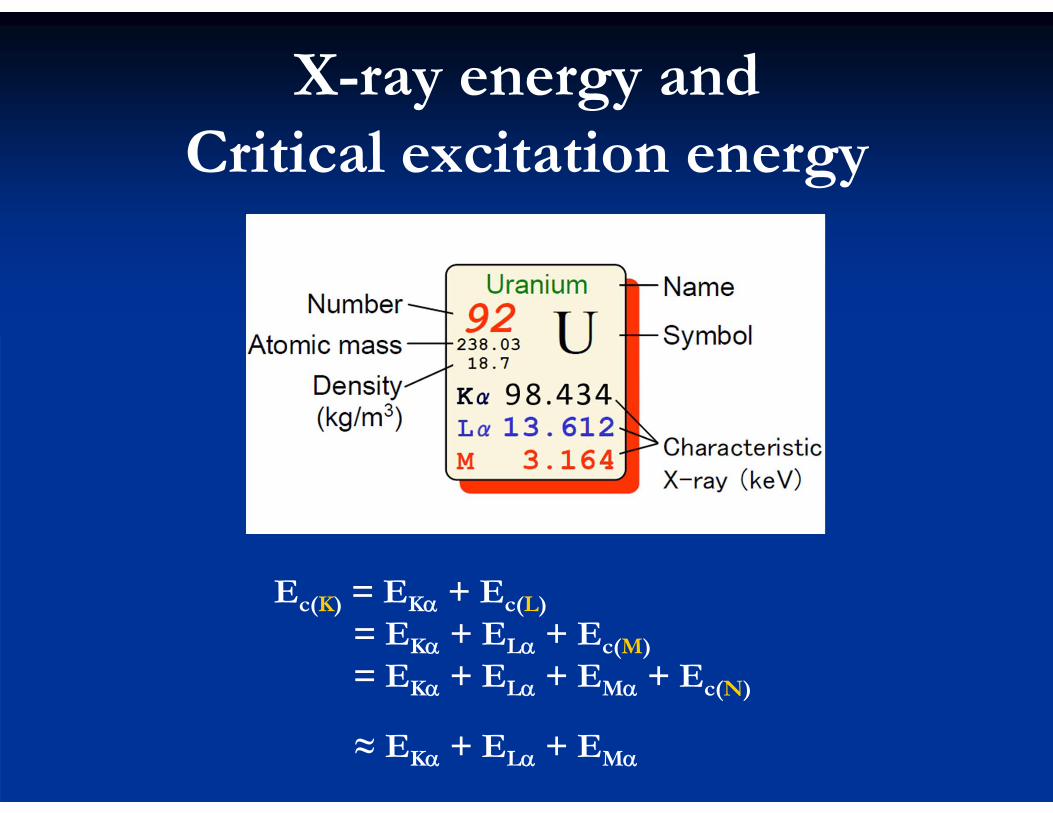
Ec(K) = EK + Ec(L)
= EK + EL + Ec(M)
= EK + EL + EM + Ec(N)
≈ EK + EL + EM
X-ray energy and Critical excitation energy

The X-ray spectrum
Continuum X-rays
Ti K
Fe K
Ti K Fe K
Continuum X-rays
Continuum X-rays are generated by deceleration of beam electrons in the Coulombic field of outer shells of target atoms. Maximum energy = electron beam energy
Characteristic X-rays
Continuum X-rays
Ti K
Fe K
Ti K Fe K
Continuum X-rays
Characteristic X-rays
Continuum X-rays
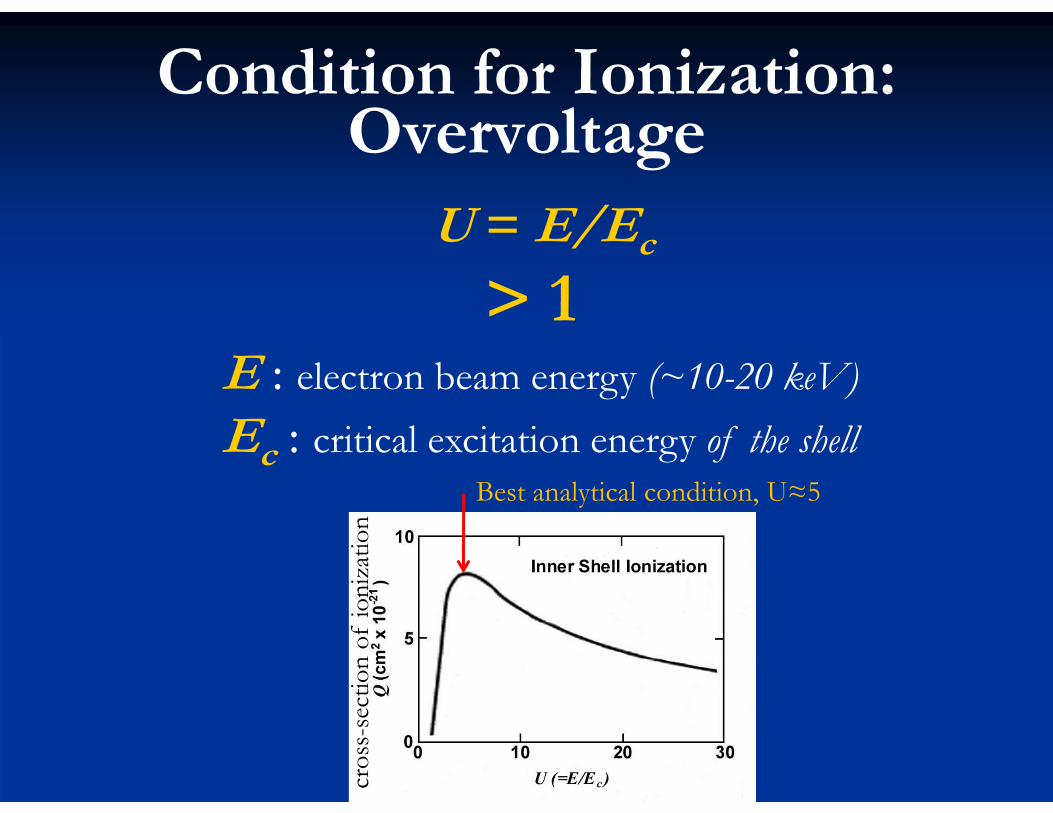
Condition for Ionization: Overvoltage
U = E/Ec
> 1 E : electron beam energy (~10-20 keV)
: critical excitation energy of the shell Best analytical condition, U≈5
cros
s-se
ctio
n of
ioni
zatio
n
Ec

Cross-section of ionization
Q = 6.51x10⁻²⁰ [(nsbs)/(UEc 2)] ln(csU )
ns : number of electrons in the shell
bs,cs : constants Al K-shell
Ec= 1.84 keV

X-ray production volume and maximum depth
(Anderson-Hasler range)
•Always smaller than electron range recall analogous expression for electron range:
•Depends on energy of ionized shell, Ec
•Increases with electron beam energy, E
1
)(064.0 68.168.1ray-X EER c
10.0276 67.1
889.0electron )( EZ AR

X-ray production volume: Castaing’s formula

X-ray depth-distribution: the (z) function
(z) = intensity from a freestanding layer of thickness ‘z’
(z) at depth z = intensity from depth ‘z’ divided by (z)
where, = density, and z = depth

crystal detector
Wavelength Dispersive Spectrometer (WDS)
crystal
detector
focusingcircle

Bragg’s Law
= path length ABC
= angle of diffraction
d = lattice spacing
n = 2d sin
= angle of diffraction
d = lattice spacing
n = order of reflection (any integer)

Diffraction angle
n = 2d sin1 n = 2d sin2
1 (Element 1)
1 2
2 (Element 2)
Diffraction angle changes with wavelength being diffracted (for the same order of reflection, n)
Different elements
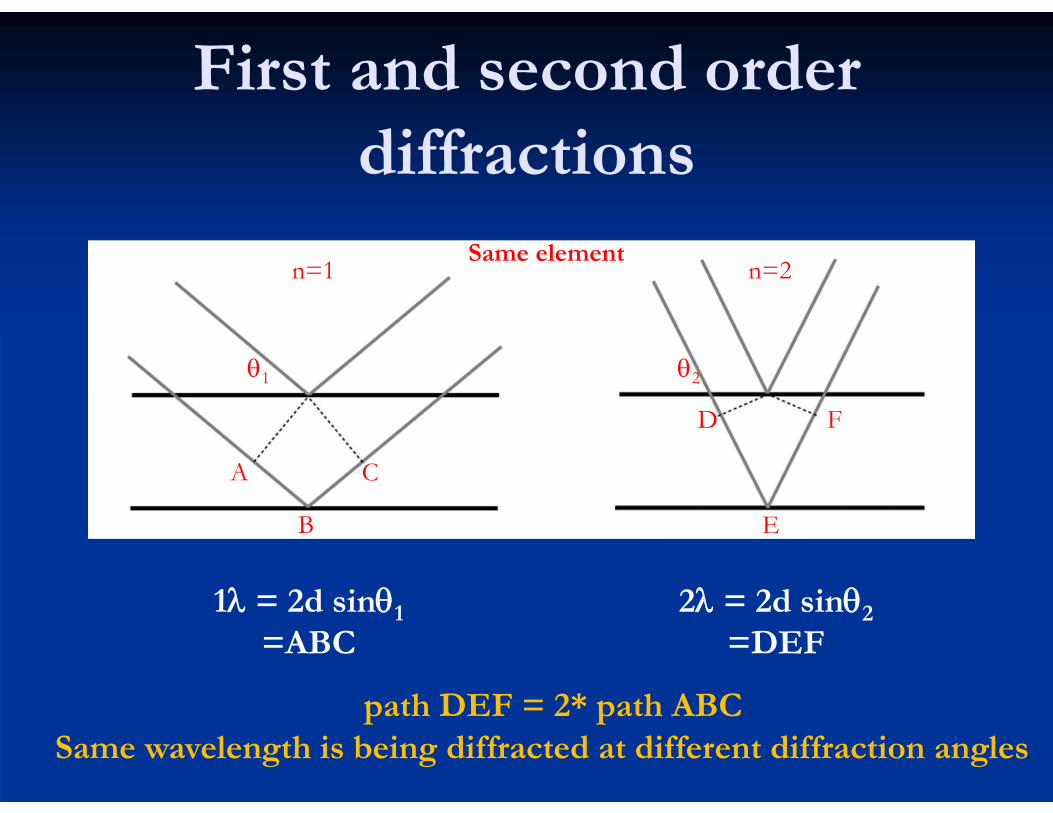
First and second order diffractions
1 = 2d sin1
=ABC 2 = 2d sin2
=DEF
A
B
C
E
D F
n=1 n=2
1 2
path DEF = 2* path ABC
Same element
Same wavelength is being diffracted at different diffraction angles

Analyzing crystals with different “d” spacings

WDS: Focusing geometry
L = n.R/d
take-off angle
angle of diffraction

Curved diffracting crystals
Johansson type bending curvature: 2R polished and ground to R
Johan type only bent to 2R, not ground
R
FWHM of fully focusing Johansson-type crystal ~10 eV
Some defocusing in Johan-type, but resolution is not compromised

Crystal orientations Vertical, horizontal and tilted spectrometers

Tungsten collection wire set at 1-3 kV bias
Flow counter: 90% Ar +10% CH4 (P-10); poly-propylene window
Sealed counter: Xe; Be window
WDS: X-ray detector (proportional counter)
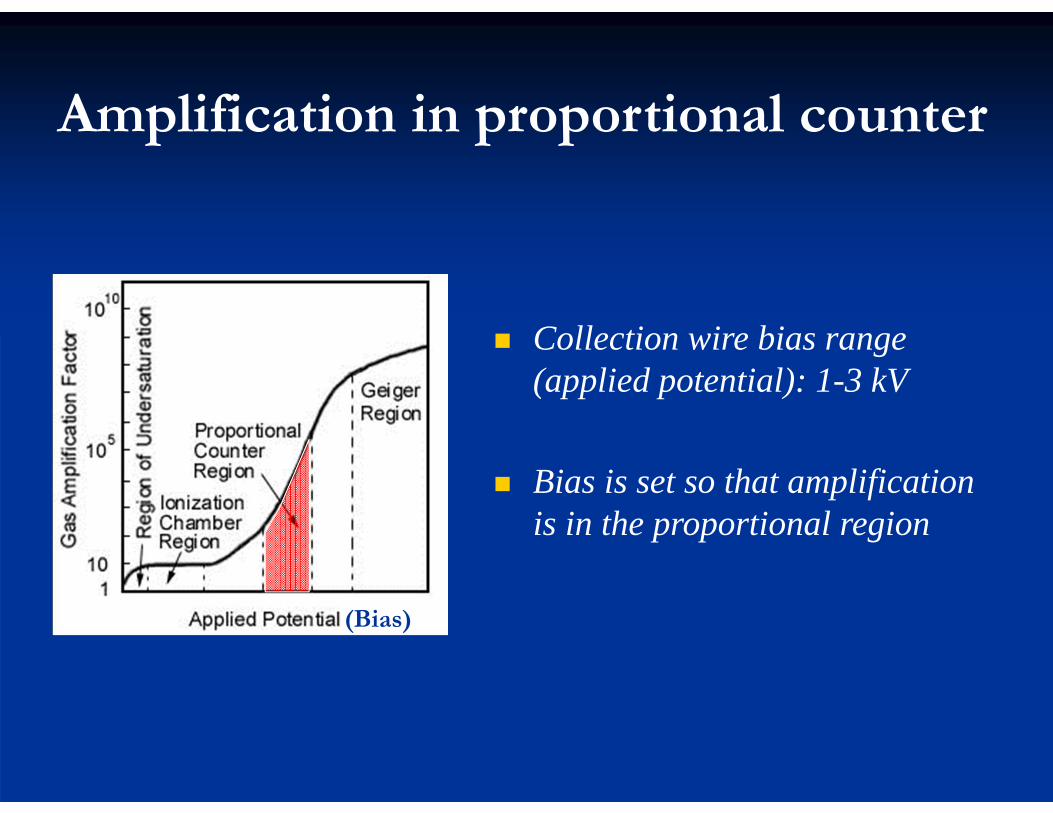
Collection wire bias range (applied potential): 1-3 kV
Bias is set so that amplification is in the proportional region
Amplification in proportional counter
(Bias)

Gas used for long wavelengths: 90% Ar +10% CH4 (P-10)
Gas used for short wavelengths: Xe
Counting efficiency of gas in proportional counter
Light elements
Heavy elements

WDS: changing the angle of diffraction
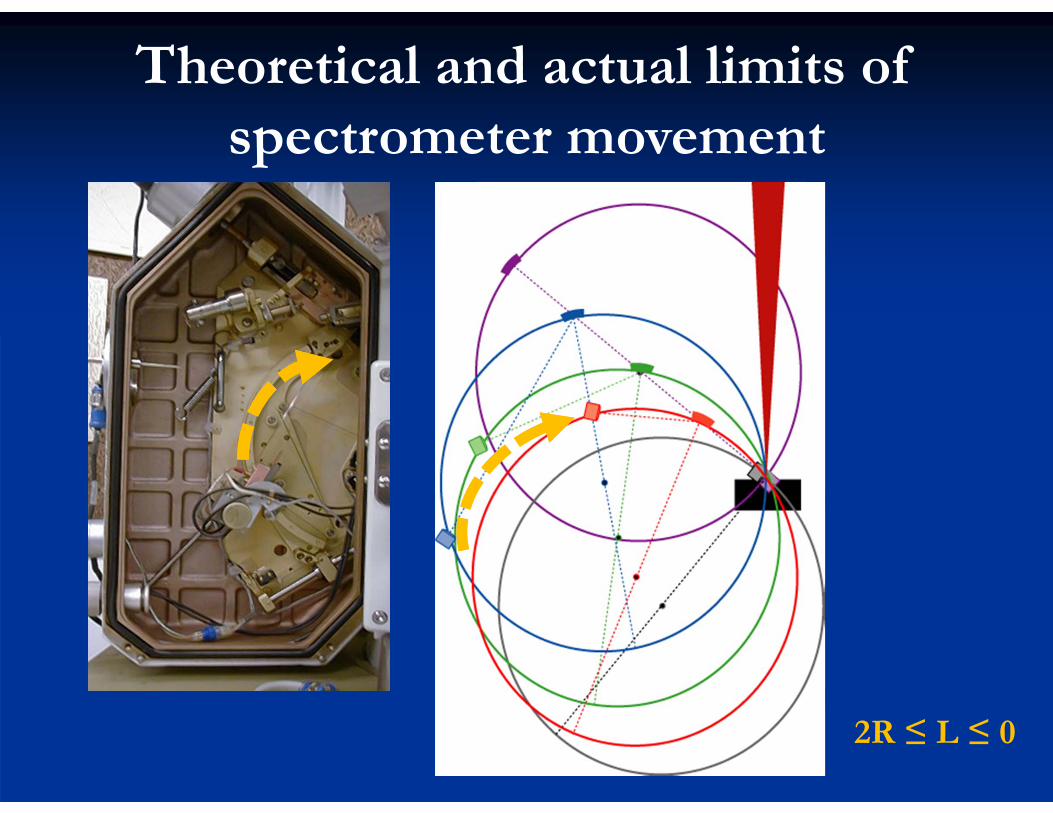
Theoretical and actual limits of spectrometer movement
2R ≤ L ≤ 0
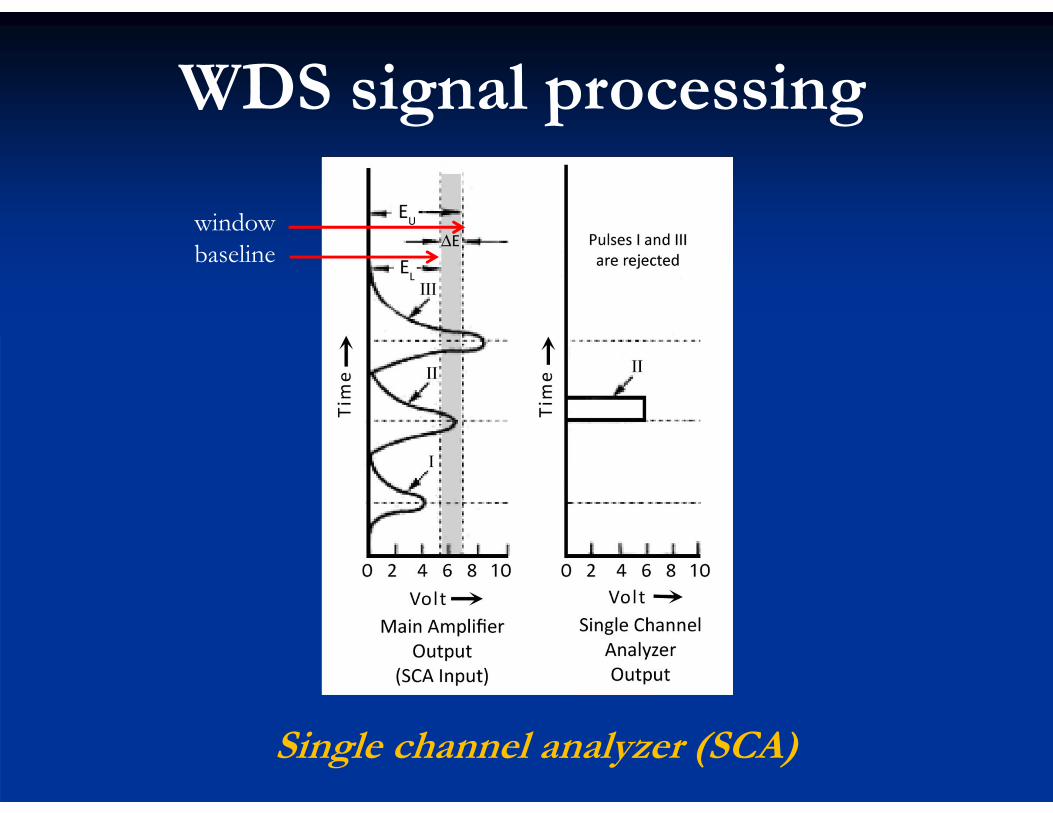
WDS signal pr ocessing
Single channel analyzer (SCA)
window baseline

Pulse Height Analysis (PHA)
Single Channel Analyzer (SCA) scan baseline window

Beam-rastered image: electron beam rasters over the area to be imaged
Stage-rastered image: electron beam is stationary, stage moves
Imaging with X-rays: compositional mapping
Mg Ca
Na Ti
Number of point measurements: image resolution
Signal: beam current and dwell time/point
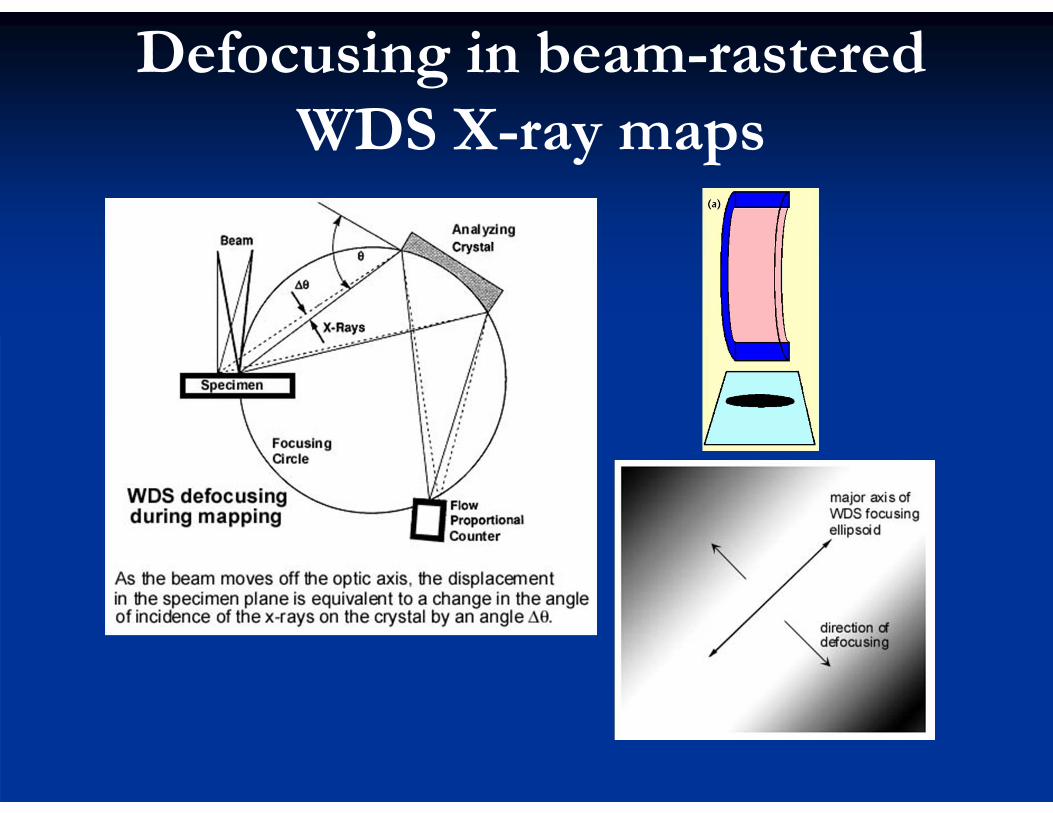
Defocusing in beam-rastered WDS X-ray maps

Zn-Sn composite
X-ray image artifact: background

Continuum X-rays: background artifact
Neither material contains Cr
But background counts for Cr :
in 1 in 2 Therefore, if a Cr X-ray map is acquired, material 2 will show higher Cr than material 1
A composite made of 2 materials is being mapped:
2
1
MIT OpenCourseWarehttp://ocw.mit.edu
12.141 Electron Microprobe AnalysisJanuary (IAP) 2012
For information about citing these materials or our Terms of Use, visit: http://ocw.mit.edu/terms.