1 the great recession and its lasting impacts mark a. berreth, regional economist, lmea sept. 28,...
Post on 19-Dec-2015
219 views
TRANSCRIPT

1
The Great Recession and its Lasting Impacts
Mark A. Berreth, Regional Economist, LMEA
Sept. 28, 2011

2
Washington nonagricultural employment
Seasonally adjusted
U.S. nonagricultural employment (in thousands)
1110090807060504030201
3,000,000
2,925,000
2,850,000
2,775,000
2,700,000
2,625,000
138,000
136,000
134,000
132,000
130,000
128,000
Source: Employment Security Department/LMEA, Bureau of Labor Statistics
Job growth

3
Employment growth for WA
Se
p-0
9O
ct-
09
No
v-0
9D
ec
-09
Ja
n-1
0F
eb
-10
Ma
r-1
0A
pr-
10
Ma
y-1
0J
un
-10
Ju
l-1
0A
ug
-10
Se
p-1
0O
ct-
10
No
v-1
0D
ec
-10
Ja
n-1
1F
eb
-11
Ma
r-1
1A
pr-
11
Ma
y-1
1J
un
-11
Ju
l-1
1A
ug
-11
-10,000
-5,000
0
5,000
10,000
Washington 3-month average
Ch
ang
e in
em
plo
ymen
t
Source: Employment Security Department/LMEA, Bureau of Labor Statistics

4
Employment growth by industry in WA
Month-over-month change by industrySeasonally adjusted
July 2011 to August 2011Total nonfarm 3,800Manufacturing 3,500 Aerospace product and parts manufacturing 600Education and health services 2,000Information 1,800Construction 1,400Retail trade 400Other services 400Professional and business services 100Mining and logging 0Transportation, warehousing and utilities -100Government -400Leisure and hospitality -1,300Wholesale trade -1,600Financial activities -2,400
Source: Employment Security Department/LMEA, Bureau of Labor Statistics

5
Industry employment in WA
Year-over-year change by industry Seasonally adjusted
August 2010 to August 2011Total nonfarm 46,600Professional and business services 13,400Manufacturing 12,200 Aerospace product and parts manufacturing 7,500Education and health services 7,500Retail trade 5,900Leisure and hospitality 4,700Transportation, warehousing and utilities 4,000Wholesale trade 2,800Information 2,100Other services 1,800Construction 900Mining and logging 100Financial activities -2,200Government -6,600
Source: Employment Security Department/LMEA, Bureau of Labor Statistics

6 Source: Employment Security Department/LMEA
Total covered agriculture employment 12-month moving average, Washington state
1009080706050403020100
104,000
100,000
96,000
92,000
88,000
84,000
104,000
100,000
96,000
92,000
88,000
84,000
Agricultural employment in WA

7 Source: Employment Security Department/LMEA, Bureau of Economic Analysis
Slow GDP growth
U.S. Gross Domestic ProductSeasonally adjusted, annual rate, $ in billions
1110090807060504030201009998
16,000
14,000
12,000
10,000
8,000
16,000
14,000
12,000
10,000
8,000
8 Source: Employment Security Department/LMEA, Bureau of Economic Analysis
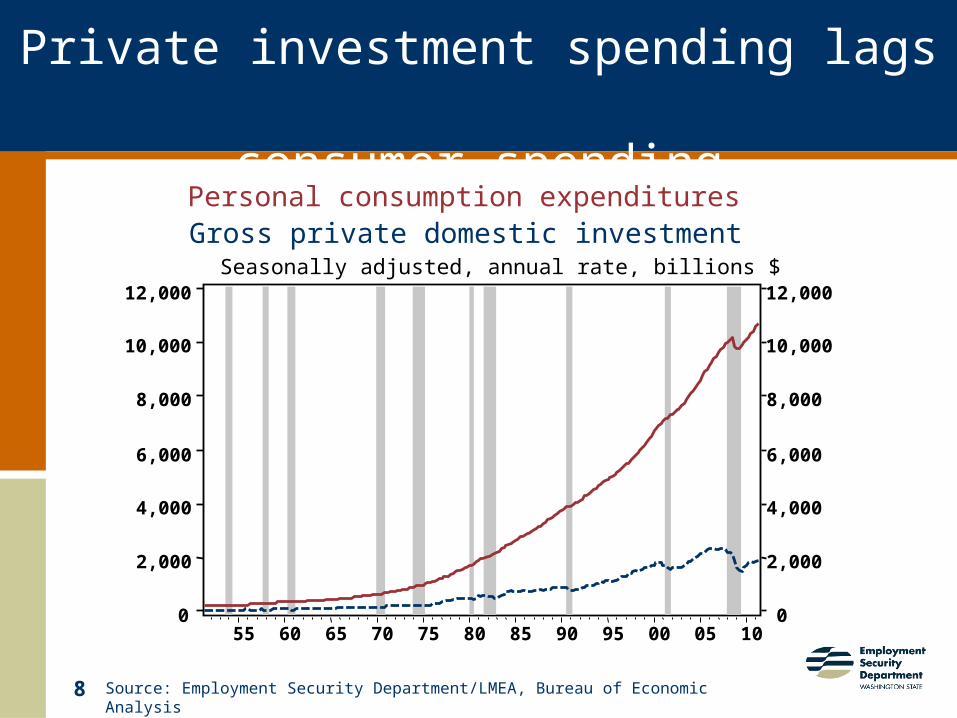
Personal consumption expendituresGross private domestic investment
Seasonally adjusted, annual rate, billions $
100500959085807570656055
12,000
10,000
8,000
6,000
4,000
2,000
0
12,000
10,000
8,000
6,000
4,000
2,000
0
Private investment spending lags consumer spending

9 Source: Employment Security Department/LMEA, The Conference Board
U.S. Consumer ConfidenceAug. 2011 = 44.5, seasonally adjusted, 1985=100
100500959085
150
125
100
75
50
25
150
125
100
75
50
25
Consumer confidence

10
Unemployment rate
Se
p-0
6
De
c-0
6
Ma
r-0
7
Ju
n-0
7
Se
p-0
7
De
c-0
7
Ma
r-0
8
Ju
n-0
8
Se
p-0
8
De
c-0
8
Ma
r-0
9
Ju
n-0
9
Se
p-0
9
De
c-0
9
Ma
r-1
0
Ju
n-1
0
Se
p-1
0
De
c-1
0
Ma
r-1
1
Ju
n-1
1
3.0
4.0
5.0
6.0
7.0
8.0
9.0
10.0
11.0
Washington
U.S.
Seattle
Un
em
plo
ym
en
t ra
te
Source: Employment Security Department/LMEA, Bureau of Labor Statistics

11
Top 10 states by lowest July 2011 unemployment rates, seasonally adjusted
Rank State Rate
1 North Dakota 3.3%
2 Nebraska 4.1%
3 South Dakota 4.7%
4 New Hampshire 5.2%
5 Oklahoma 5.5%
6 Vermont 5.7%
7 Wyoming 5.8%
8 Iowa 6.0%
9 Hawaii 6.1%
9 Virginia 6.1%
Source: Employment Security Department/LMEA, U.S. Census Bureau
12
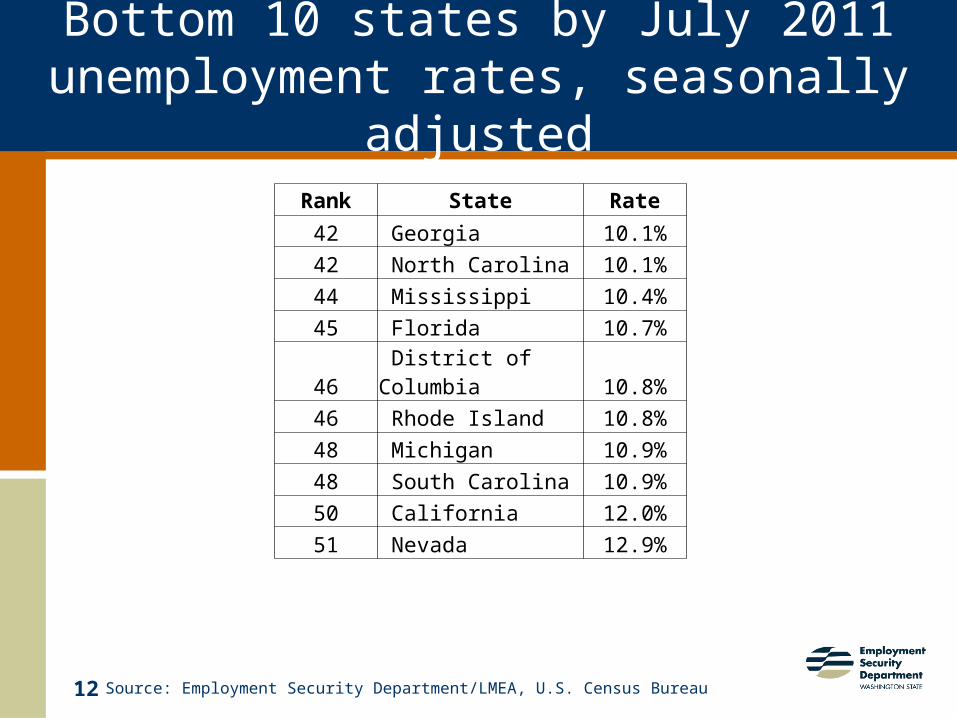
Bottom 10 states by July 2011 unemployment rates, seasonally adjusted
Rank State Rate
42 Georgia 10.1%
42 North Carolina 10.1%
44 Mississippi 10.4%
45 Florida 10.7%
46 District of Columbia 10.8%
46 Rhode Island 10.8%
48 Michigan 10.9%
48 South Carolina 10.9%
50 California 12.0%
51 Nevada 12.9%
Source: Employment Security Department/LMEA, U.S. Census Bureau

13
Third decile of states by unemployment rate
Rank State Rate
31 Ohio 9.0%
32 Connecticut 9.1%
33 Washington 9.3%
34 Arizona 9.4%
34 Idaho 9.4%
36 Illinois 9.5%
36 Kentucky 9.5%
36 New Jersey 9.5%
36 Oregon 9.5%
40 Tennessee 9.8%
Source: Employment Security Department/LMEA, Bureau of Labor Statistics

14 Source: Employment Security Department/LMEA, Bureau of Labor Statistics
College grads Less than bachelor's degreeHS diploma, no college Less than HS diploma
1110090807060504030201
16
12
8
4
0
16
12
8
4
0
Unemployment rates by education level, in U.S.
For ages 25 and up

15
Washington population educational attainment, 2009
Graduate or professional degree
Bachelors degree
Some college or associates degree
High school graduate
Less than high school diploma
0% 5% 10% 15% 20% 25% 30% 35% 40%
11.1%
19.9%
34.6%
24.0%
10.3%
Source: Employment Security Department/LMEA, U.S. Census Bureau

16 Source: Employment Security Department/LMEA, Bureau of Labor Statistics
All working-age men
1110092008
28%
24%
20%
16%
12%
8%
4%
28%
24%
20%
16%
12%
8%
4%
Youths: 16-19 years
All working-age women
Youth unemployment rates in U.S.
Men & women of all ages compared to youths aged 16-19 years

17 Source: Employment Security Department/LMEA, Bureau of Labor Statistics
111009082007
17.5%
15%
12.5%
10%
7.5%
5%
2.5%
Alternative measures of labor underutilization
Unemployed+marginally attached+part-time for economic reasons
Unemployed + marginally attachedUnemployed + discouraged workers
Unemployment rate: Age 16+
(Seasonally adjusted)

18 Source: Employment Security Department/LMEA, Bureau of Labor Statistics
Service-providing industryGoods-producing industry
111009080706050403022001
2,475,000
2,400,000
2,325,000
2,250,000
2,175,000
520,000
500,000
480,000
460,000
440,000
420,000
400,000
Jobs in goods-producing sectors in WA

19
Service-providing industryGoods-producing industry
111009080706050403022001
105%
100%
95%
90%
85%
80%
75%
Jobs in goods-producing sectors in WA
Source: Employment Security Department/LMEA
As a percent of December 2007 employment105%
100%
95%
90%
85%
80%
75%
Dec. 2007 = 100%

20 Source: Employment Security Department/LMEA, Bureau of Labor Statistics
Washington:Construction
Manufacturing
U.S.: Construction Manufacturing
111009080706050403022001
140%
120%
100%
80%
60%
140%
120%
100%
80%
60%
Employment over time
As a percent of December 2007 employmentDec. 2007 = 100%

21 Source: Employment Security Department/LMEA, Zillow
Zillow Housing Index
Washington Arizona Nevada California
111009080706050403022001
140%
120%
100%
80%
60%
40%
140%
120%
100%
80%
60%
40%
No recovery in home prices
Dec. 2007 = 100%

22
New hires for youths drop faster
1990 Q
uarter 4
1992 Q
uarter 4
1994 Q
uarter 4
1996 Q
uarter 4
1998 Q
uarter 4
2000 Q
uarter 4
2002 Q
uarter 4
2004 Q
uarter 4
2006 Q
uarter 4
2008 Q
uarter 4
2010 Q
uarter 4
50.00
70.00
90.00
110.00
130.00
Fourth-quarter new hires
Total Age 65+ Age 19-21Dec. 2007 = 100%
Source: Employment Security Department/LMEA, U.S. Census Bureau

23
Hiring takes place throughout the economy
Accom
modat
ion a
nd Food S
ervi
ces
Admin
istra
tive
and W
aste
Ser
vice
s
Agricultu
re, F
orest
ry, F
ishin
g & H
unting
Constru
ctio
n
Educatio
nal S
ervi
ces
Finan
ce a
nd Insu
rance
Health
Car
e an
d Soci
al A
ssis
tance
Info
rmat
ion
Man
ufact
uring
Oth
er S
ervi
ces,
Ex.
Public
Adm
in
Profe
ssio
nal a
nd Tec
hnical
Ser
vice
s
Public A
dmin
istra
tion
Retai
l Tra
de
Transp
ortatio
n and W
areh
ousing
Whole
sale
Tra
de0
100,000
200,000
300,000
400,000
0
20,000
40,000
60,000
80,000
New hires and beginning of fourth-quarter employment, selected industries,
2008, 2009, 2010
2008 Q4 beginning of qtr employment 2009 Q4 beginning of qtr employment
2010 Q4 beginning of qtr employment 2008 Q4 accessions
2009 Q4 accessions 2010 Q4 accessions
Source: Employment Security Department/LMEA, U.S. Census Bureau

24
Job creation and destruction in WA
Source: Employment Security Department/LMEA, Bureau of Labor Statistics

25 Source: Employment Security Department/LMEA, Bureau of Labor Statistics
U.S. labor force participation rateWashington state labor force participation rate
Seasonally adjusted, %
10050095908580757065
72.5
70.0
67.5
65.0
62.5
60.0
57.5
72.5
70.0
67.5
65.0
62.5
60.0
57.5
Labor force participation rate remains near 25 year low

26 Source: Employment Security Department/LMEA, Bureau of Labor Statistics
U.S. labor force participation rate: 55 years & overU.S. labor force participation rate: 25-54 years U.S. labor force participation rate: 16 - 24 years
1005009590858075
100
80
60
40
20
100
80
60
40
20
Older workers working longer, pushing up their labor force participation rate

27
U.S. employment-population ratio
Seasonally adjusted, %WA employment-population ratio
1110090807060504030201
66
64
62
60
58
66
64
62
60
58
Washington’s employment to population ratio mirrors the nation
Source: Employment Security Department/LMEA, Bureau of Labor Statistics

28 Source: Employment Security Department/LMEA, Bureau of Labor Statistics
Employment-population ratio: menEmployment-population ratio: women
Seasonally adjusted, %
10050095908580757065
80
70
60
50
40
30
80
70
60
50
40
30
Employment to population ratios have yet to recover

29
Top ten occupational groups by projected annual openings, 2014-2010
OFFIC
E AND A
DMIN
ISTRATIV
E SUPPO
RT
SALES A
ND RELA
TED
FOO
D PREPARATIO
N AND S
ERVING
RELA
TED
TRANSPORTATIO
N AND M
ATERIAL
MO
VING
HEALTHCARE P
RACTITIO
NERS AND T
ECHNICAL
EDUCATION T
RAININ
G A
ND LIB
RARY
CONSTRUCTIO
N AND E
XTRACTION
MANAG
EMENT
PERSONAL
CARE AND S
ERVICE
COM
PUTER AND M
ATHEMATIC
AL0
2000
4000
6000
8000
10000
12000
14000
16000
18000
$0.00
$10.00
$20.00
$30.00
$40.00
$50.00
$60.00
Source: Employment Security Department/LMEA,

30
Other occupational group by projected annual openings, 2014-2019
BUSINESS A
ND FIN
ANCIAL
OPERATIO
NS
PRODUCTIO
N
BUILDIN
G A
ND GRO
UNDS CLE
ANING
AND M
AINT.
INSTALL
ATION M
AINTENANCE A
ND REPAIR
ARCHITECTURE A
ND ENG
INEERIN
G
HEALTHCARE S
UPPORT
ARTS DESIG
N ENTERTAIN
MNT S
PORTS A
ND MEDIA
LIFE P
HYSICAL
AND SO
CIAL
SCIENCE
FARMIN
G F
ISHIN
G A
ND FO
RESTRY
PROTECTIV
E SERVIC
E
COM
MUNIT
Y AND S
OCIA
L SERVIC
ES
LEG
AL 0
1000
2000
3000
4000
5000
6000
7000
$0.00
$5.00
$10.00
$15.00
$20.00
$25.00
$30.00
$35.00
$40.00
$45.00
Source: Employment Security Department/LMEA,

31
Questions?