1 rna1: structure & quantitation (last week) integration with previous topics (hmm for rna...
Post on 20-Dec-2015
214 views
TRANSCRIPT
1
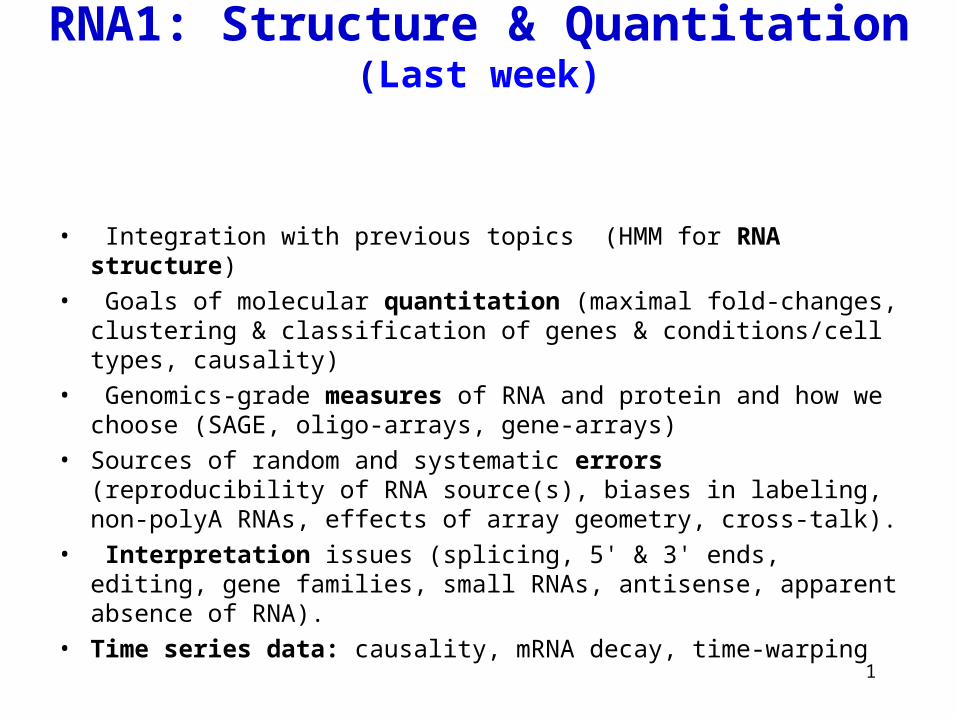
RNA1: Structure & Quantitation (Last week)
• Integration with previous topics (HMM for RNA structure)
• Goals of molecular quantitation (maximal fold-changes, clustering & classification of genes & conditions/cell types, causality)
• Genomics-grade measures of RNA and protein and how we choose (SAGE, oligo-arrays, gene-arrays)
• Sources of random and systematic errors (reproducibility of RNA source(s), biases in labeling, non-polyA RNAs, effects of array geometry, cross-talk).
• Interpretation issues (splicing, 5' & 3' ends, editing, gene families, small RNAs, antisense, apparent absence of RNA).
• Time series data: causality, mRNA decay, time-warping

2
RNA2: Clusters & Motifs
• Clustering by gene and/or condition
• Distance and similarity measures
• Clustering & classification
• Applications
• DNA & RNA motif discovery & search
3
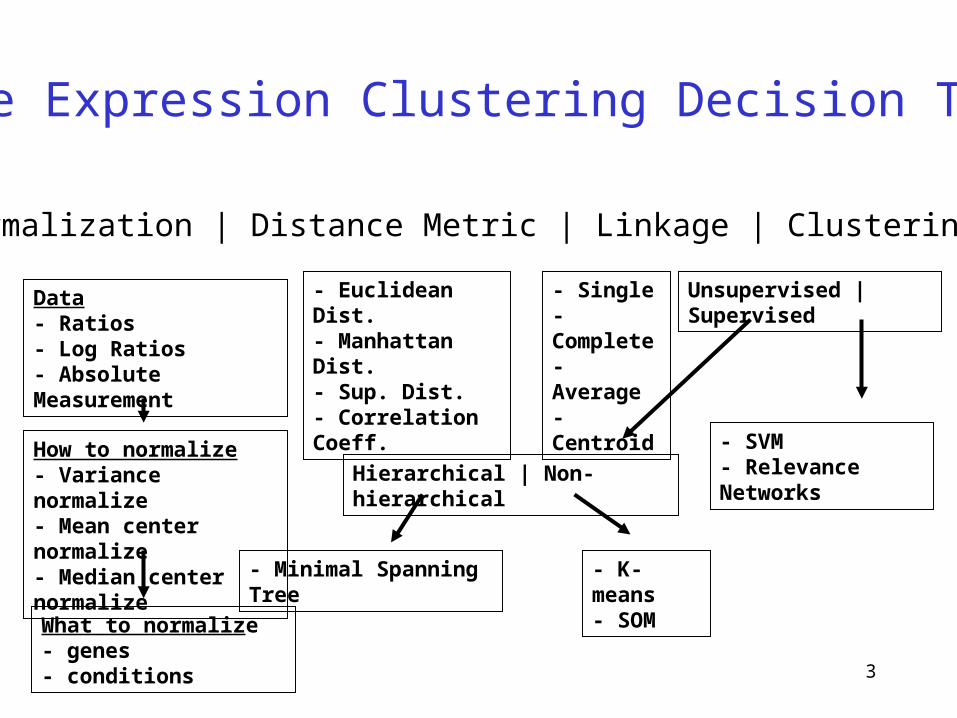
Data- Ratios- Log Ratios- Absolute Measurement
- Euclidean Dist.- Manhattan Dist.- Sup. Dist.- Correlation Coeff.
- Single- Complete- Average- Centroid
Unsupervised | Supervised
- SVM- Relevance NetworksHierarchical | Non-hierarchical
- Minimal Spanning Tree - K-means- SOM
Data Normalization | Distance Metric | Linkage | Clustering Method
Gene Expression Clustering Decision Tree
How to normalize- Variance normalize- Mean center normalize- Median center normalize
What to normalize- genes- conditions
4
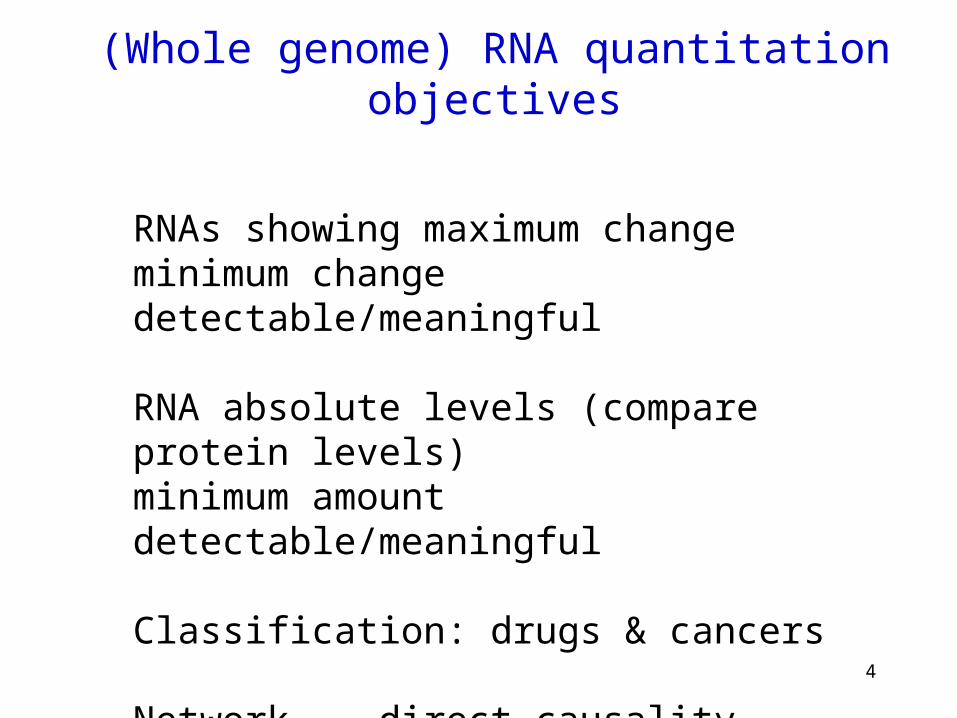
(Whole genome) RNA quantitation objectives
RNAs showing maximum changeminimum change detectable/meaningful
RNA absolute levels (compare protein levels)minimum amount detectable/meaningful
Classification: drugs & cancers
Network -- direct causality-- motifs
5
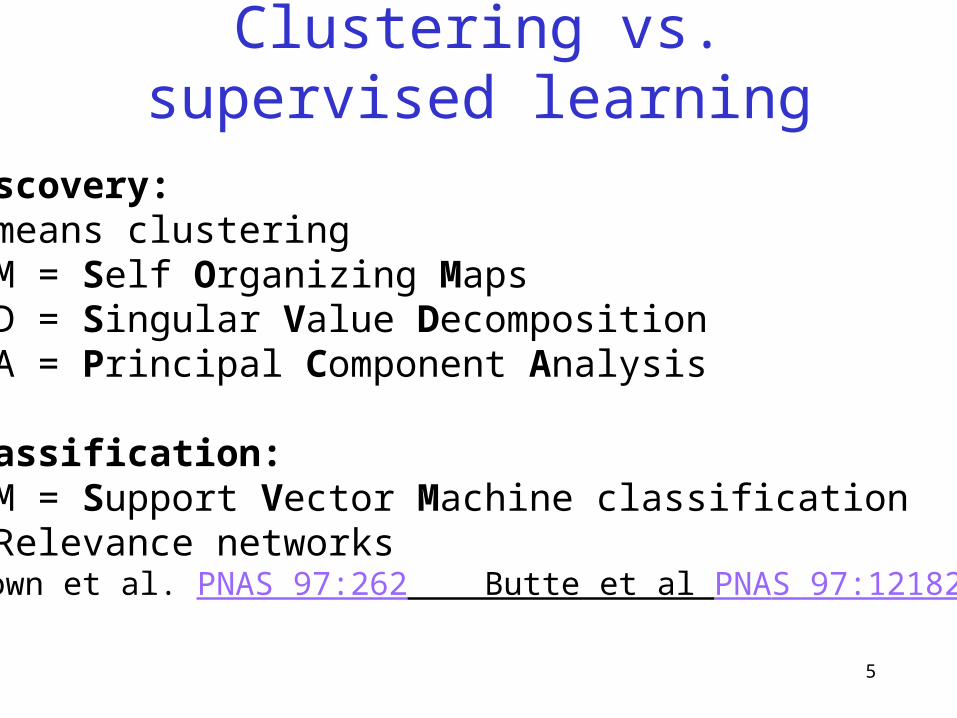
Clustering vs. supervised learning
Discovery:K-means clusteringSOM = Self Organizing MapsSVD = Singular Value DecompositionPCA = Principal Component Analysis
Classification:SVM = Support Vector Machine classification & Relevance networksBrown et al. PNAS 97:262 Butte et al PNAS 97:12182
6
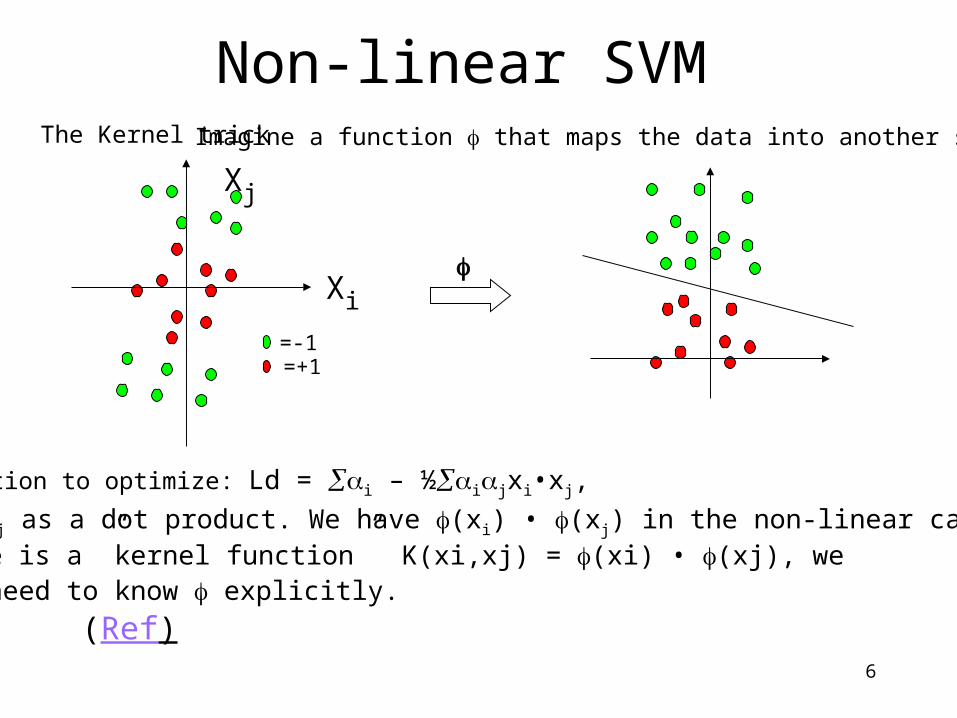
Non-linear SVM The Kernel trick
=-1=+1
Imagine a function that maps the data into another space:
=-1=+1
The function to optimize: Ld = i – ½ijxi•xj,
xi and xj as a dot product. We have (xi) • (xj) in the non-linear case. If there is a ”kernel function” K(xi,xj) = (xi) • (xj), wedo not need to know explicitly.
(Ref)
Xi
Xj
7
Cluster analysis of mRNA expression data
By gene (rat spinal cord development, yeast cell cycle):
Wen et al., 1998; Tavazoie et al., 1999; Eisen et al., 1998; Tamayo et al., 1999
By condition or cell-type or by gene&cell-type (human cancer): Golub, et al. 1999; Alon, et al. 1999; Perou, et al. 1999; Weinstein, et al 1997
Cheng, ISMB 2000.
.
Rana.lbl.gov/EisenSoftware.htm
8
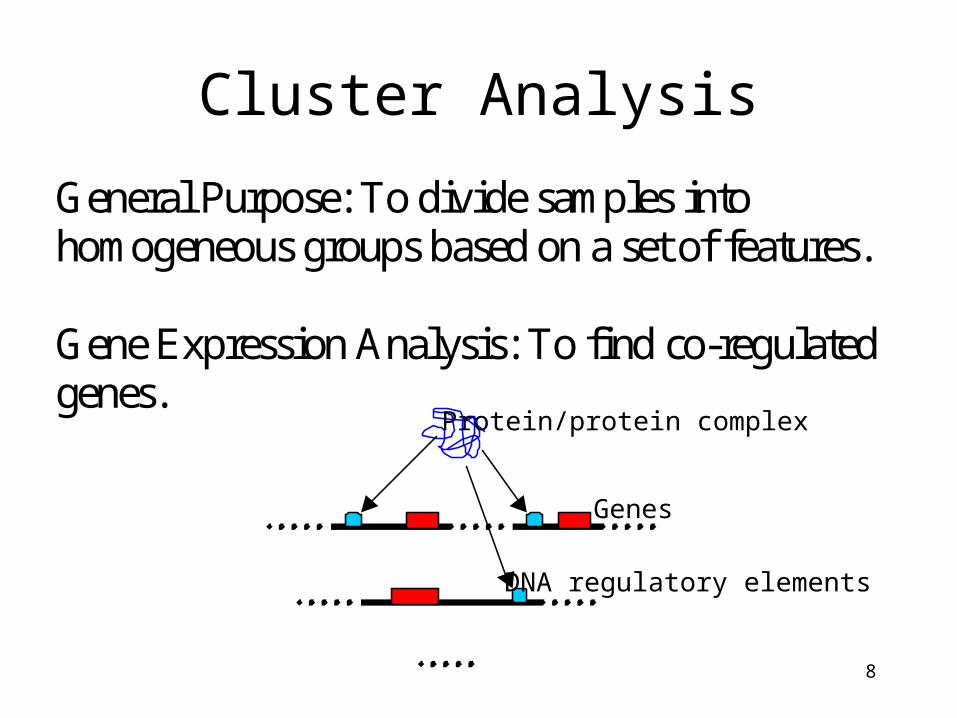
Cluster Analysis
General Purpose: To divide samples intohomogeneous groups based on a set of features.
Gene Expression Analysis: To find co-regulatedgenes.
Protein/protein complex
Genes
DNA regulatory elements
9
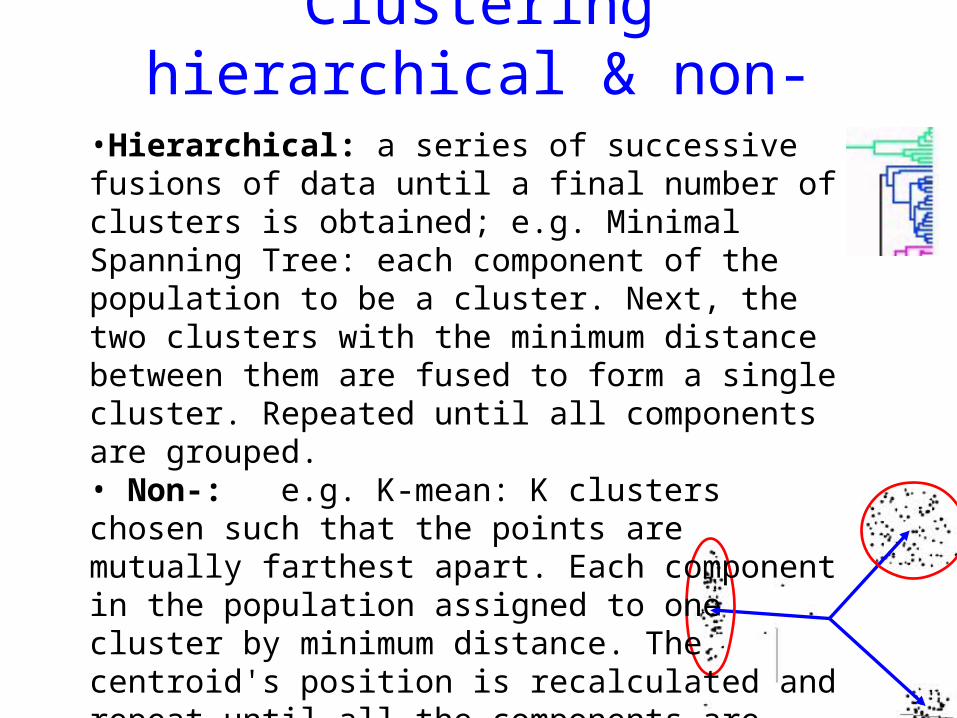
Clustering hierarchical & non-
•Hierarchical: a series of successive fusions of data until a final number of clusters is obtained; e.g. Minimal Spanning Tree: each component of the population to be a cluster. Next, the two clusters with the minimum distance between them are fused to form a single cluster. Repeated until all components are grouped.• Non-: e.g. K-mean: K clusters chosen such that the points are mutually farthest apart. Each component in the population assigned to one cluster by minimum distance. The centroid's position is recalculated and repeat until all the components are grouped. The criterion minimized, is the within-clusters sum of the variance.

10
Clusters of Two-Dimensional Data

11
Key Terms in Cluster Analysis
• Distance measures
• Similarity measures
• Hierarchical and non-hierarchical
• Single/complete/average linkage
• Dendrogram

12
Distance Measures: Minkowski Metric
r rp
iii
p
p
yxyxd
yyyy
xxxx
pyx
||),(
)(
)(
1
21
21
by defined is metric Minkowski The
:features have both and objects two Suppose
13
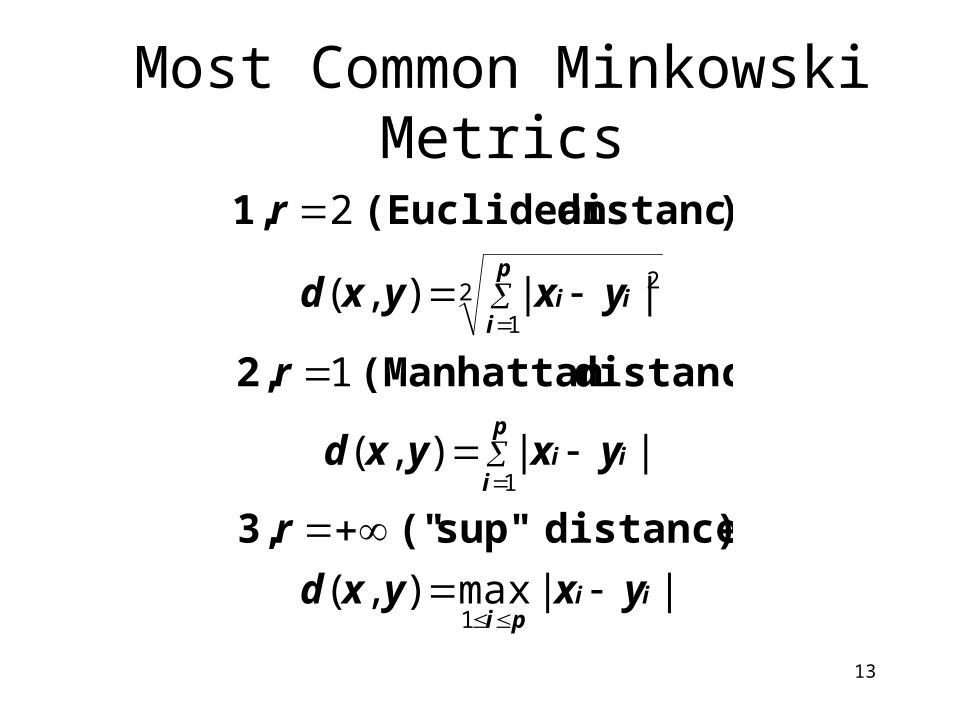
Most Common Minkowski Metrics
||max),(
||),(
1
||),(
2
1
1
2 2
1
iipi
p
iii
p
iii
yxyxd
r
yxyxd
r
yxyxd
r
) distance sup"(" 3,
distance) (Manhattan 2,
) distance (Euclidean 1,
14
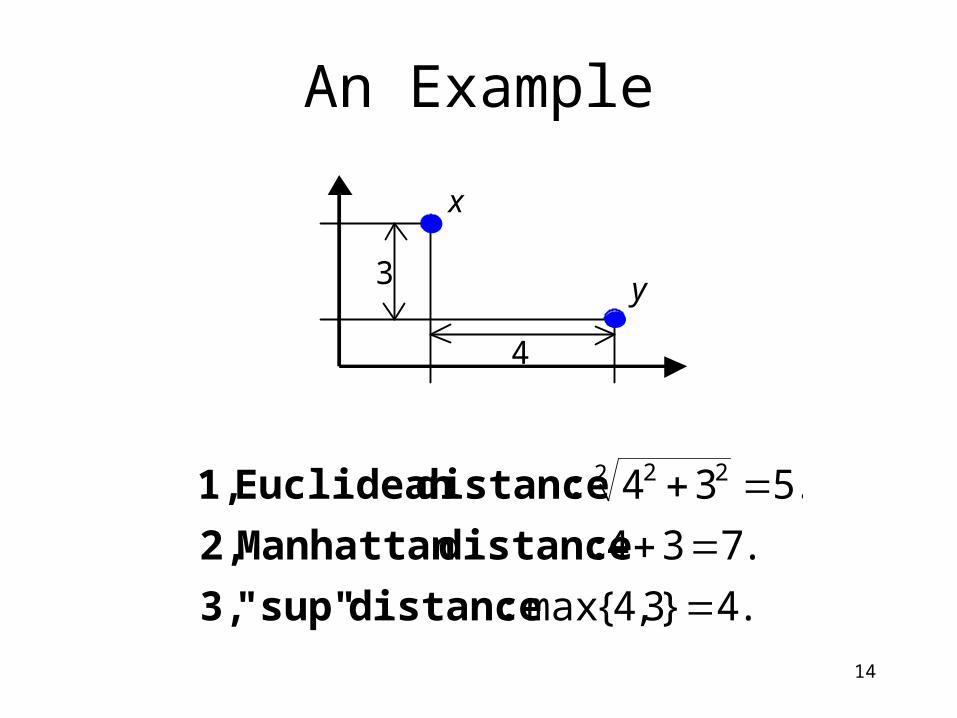
An Example
.4}3,4{max
.734
.5342 22
:distance sup"" 3,
:distance Manhattan 2,
:distance Euclidean 1,
4
3
x
y

15
Manhattan distance is called Hamming distance when all features are binary.
1101111110000111010011100100100110
1716151413121110987654321
GeneBGeneA
Gene Expression Levels Under 17 Conditions (1-High,0-Low)
. :Distance Hamming 5141001 )#()#(
16
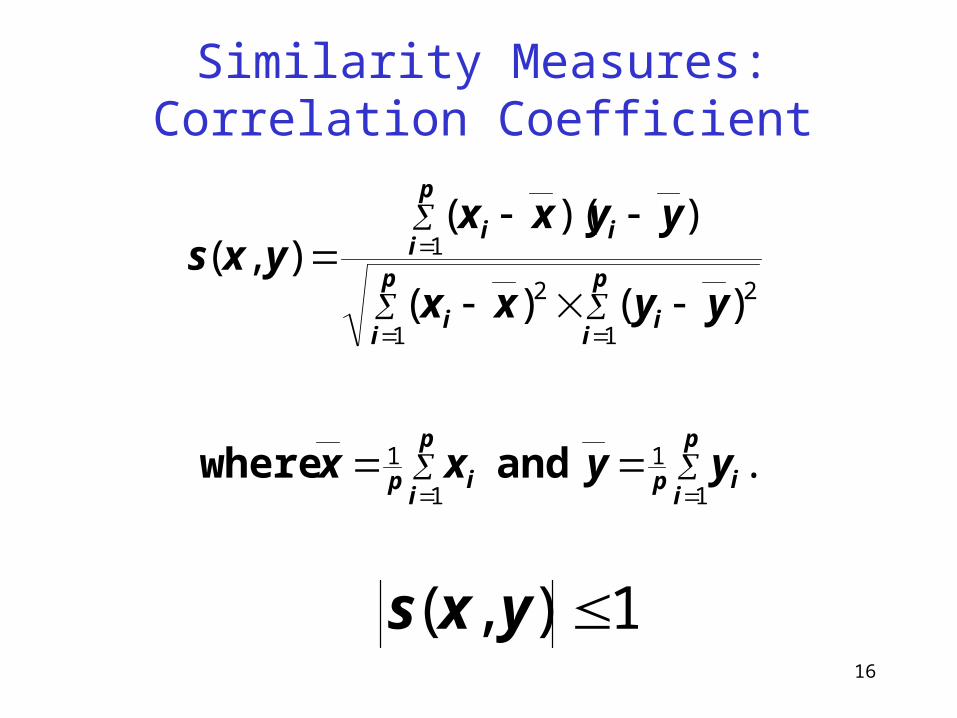
Similarity Measures: Correlation Coefficient
.
)()(
))((),(
1
1
1
1
1 1
22
1
p
iip
p
iip
p
i
p
iii
p
iii
yyxx
yyxx
yyxxyxs
and where
1),( yxs
17
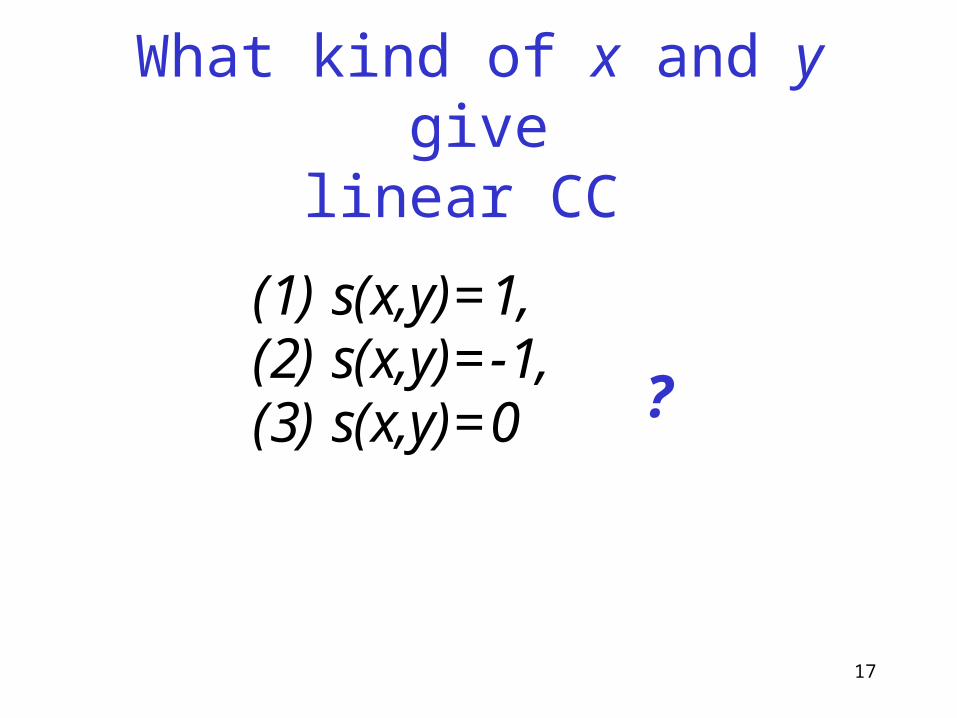
(1) s(x,y)=1, (2) s(x,y)=-1, (3) s(x,y)=0
What kind of x and y givelinear CC
?
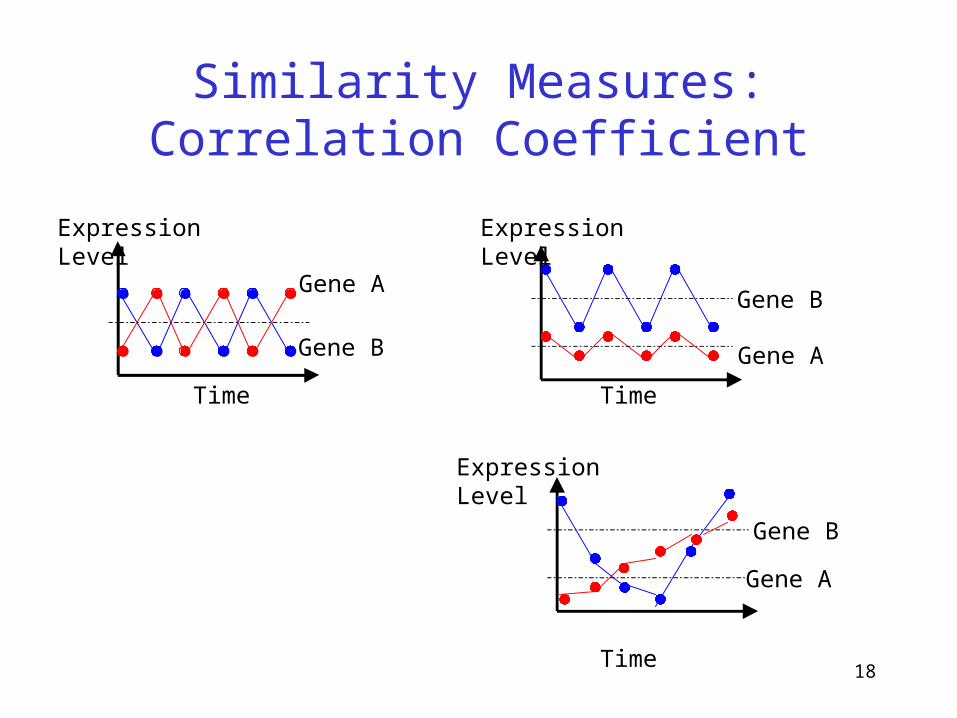
18
Similarity Measures: Correlation Coefficient
Time
Gene A
Gene B
Gene A
Time
Gene B
Expression LevelExpression Level
Expression Level
Time
Gene A
Gene B
19
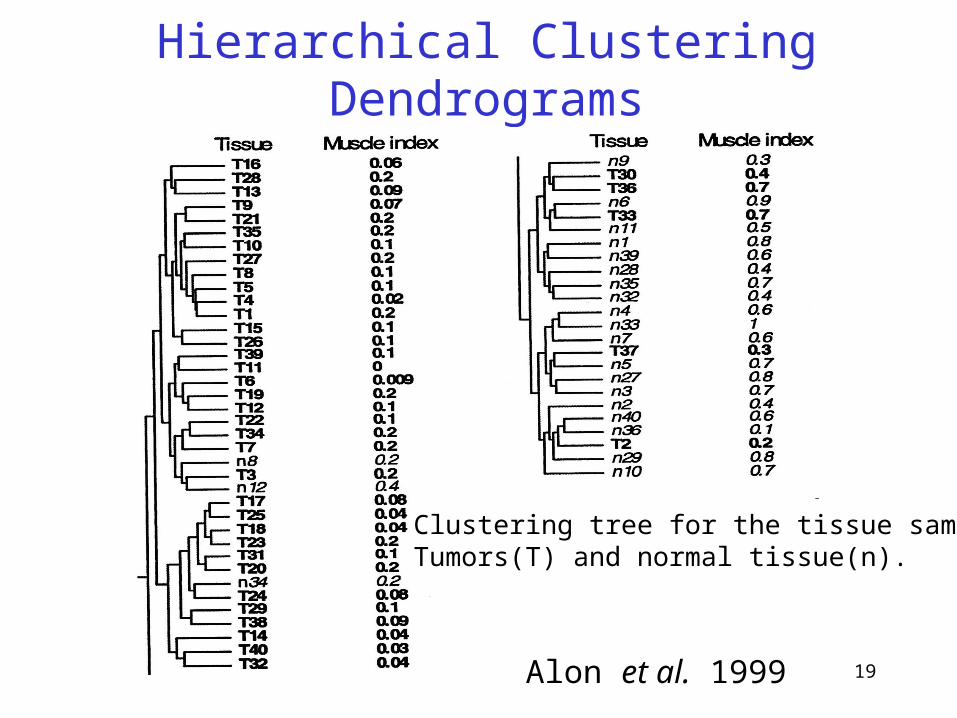
Hierarchical Clustering Dendrograms
Alon et al. 1999
Clustering tree for the tissue samplesTumors(T) and normal tissue(n).
20
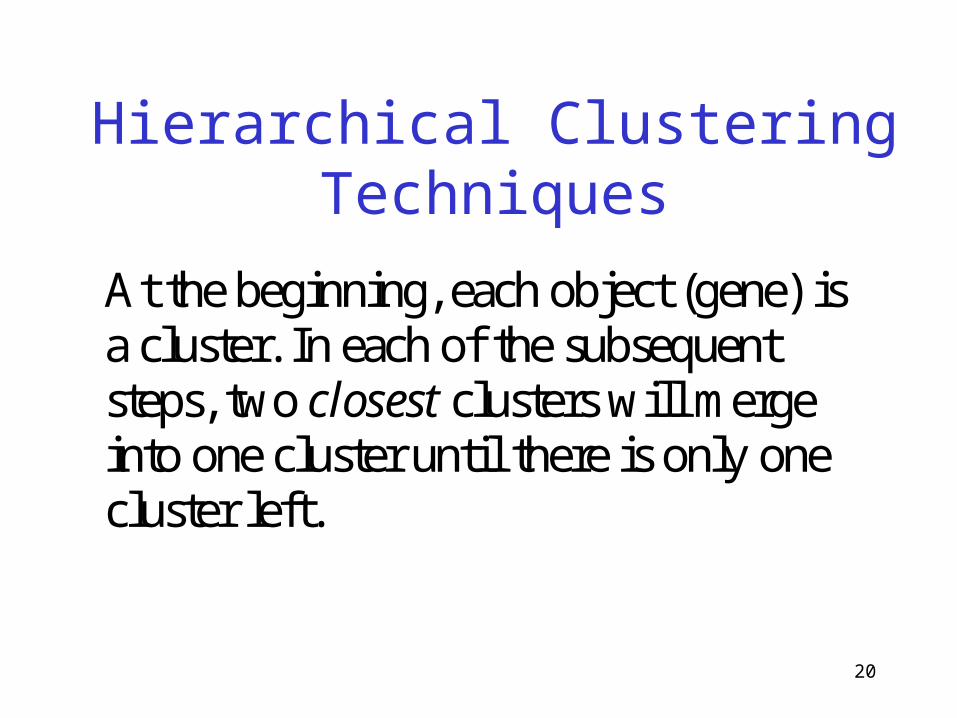
Hierarchical Clustering Techniques
At the beginning, each object (gene) is a cluster. In each of the subsequent steps, two closest clusters will merge into one cluster until there is only one cluster left.

21
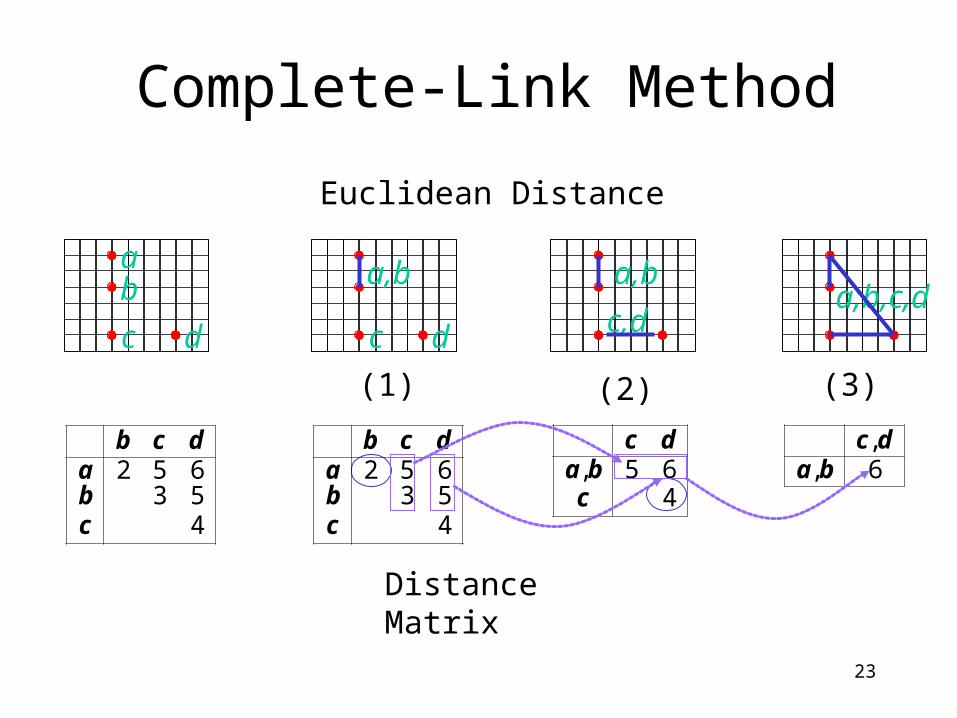
The distance between two clusters is defined as the distance between
• Single-Link Method / Nearest Neighbor: their closest members.
• Complete-Link Method / Furthest Neighbor: their furthest members.
• Centroid: their centroids.
• Average: average of all cross-cluster pairs.

22
Single-Link Method
ba
453652
cba
dcb
Distance Matrix
Euclidean Distance
453,
cba
dc
453652
cba
dcb4,, cbad
(1) (2) (3)
a,b,ccc d
a,b
d da,b,c,d
23
Complete-Link Method
ba
453652
cba
dcb
Distance Matrix
Euclidean Distance
465,
cba
dc
453652
cba
dcb6,,
badc
(1) (2) (3)
a,b
cc d
a,b
d c,da,b,c,d
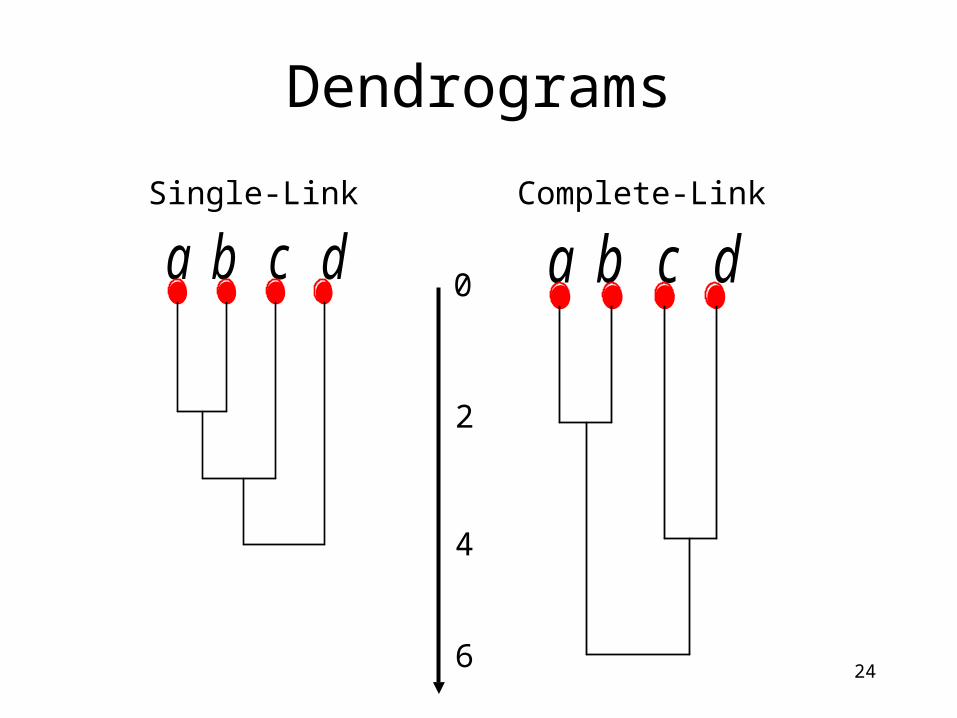
24
Dendrograms
a b c d a b c d
2
4
6
0
Single-Link Complete-Link
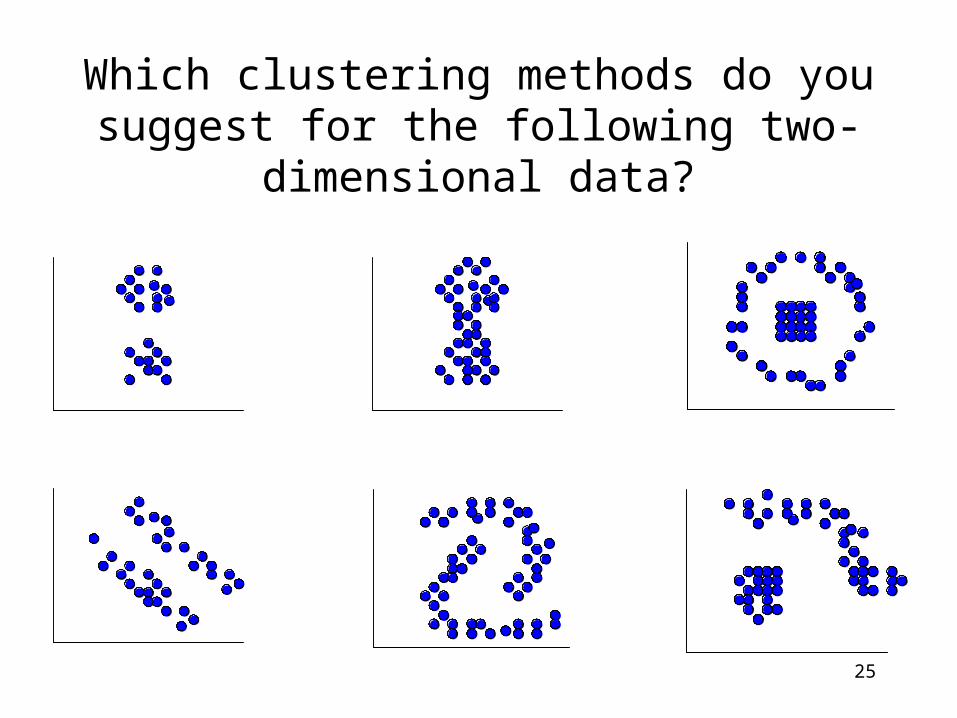
25
Which clustering methods do you suggest for the following two-dimensional data?
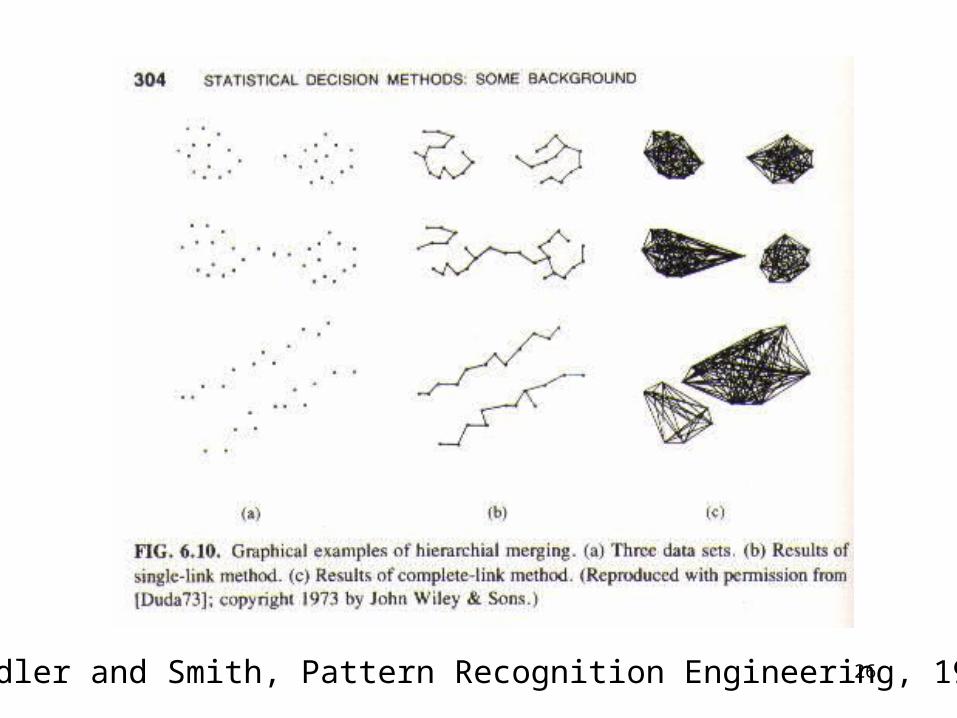
26Nadler and Smith, Pattern Recognition Engineering, 1993

27
Data- Ratios- Log Ratios- Absolute Measurement
- Euclidean Dist.- Manhattan Dist.- Sup. Dist.- Correlation Coeff.
- Single- Complete- Average- Centroid
Unsupervised | Supervised
- SVM- Relevance NetworksHierarchical | Non-hierarchical
- Minimal Spanning Tree - K-means- SOM
Data Normalization | Distance Metric | Linkage | Clustering Method
Gene Expression Clustering Decision Tree
How to normalize- Variance normalize- Mean center normalize- Median center normalize
What to normalize- genes- conditions
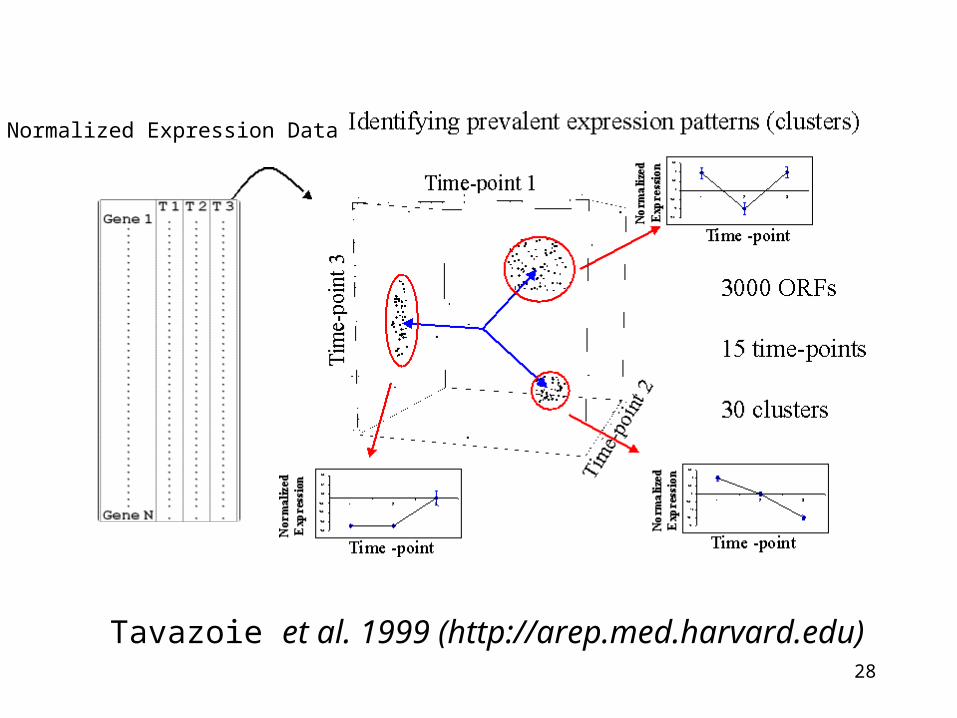
28
Normalized Expression Data
Tavazoie et al. 1999 (http://arep.med.harvard.edu)
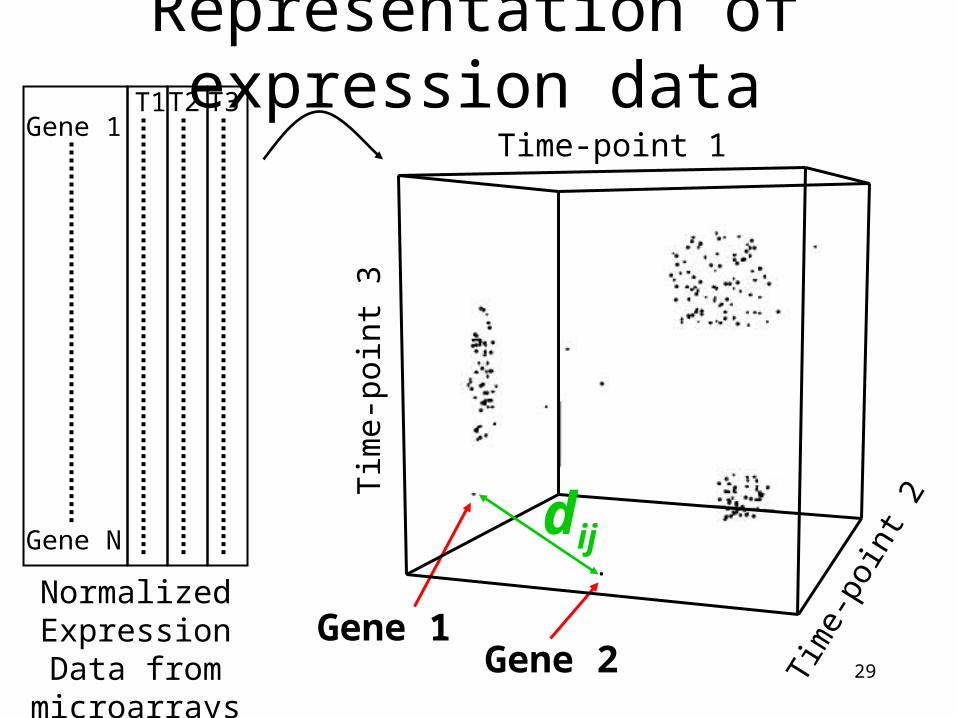
29
Time-point 1
Tim
e-po
int 3
Tim
e-po
int 2
Gene 1Gene 2
Normalized Expression Data from microarrays
T1 T2 T3Gene 1
Gene N.
Representation of expression data
dij
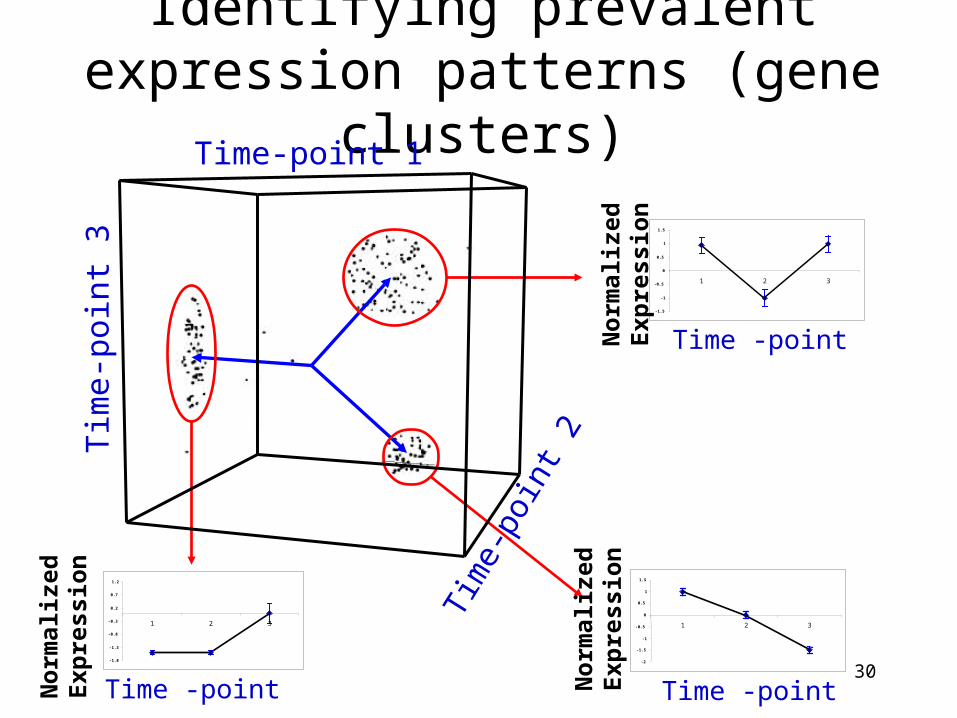
30
Identifying prevalent expression patterns (gene clusters)
Time-point 1
Tim
e-po
int 3
Tim
e-po
int 2
-1.8
-1.3
-0.8
-0.3
0.2
0.7
1.2
1 2 3
-2
-1.5
-1
-0.5
0
0.5
1
1.5
1 2 3
-1.5
-1
-0.5
0
0.5
1
1.5
1 2 3
Time -pointTime -point
Time -point
Nor
mal
ized
Exp
ress
ion
Nor
mal
ized
Exp
ress
ion
Nor
mal
ized
Exp
ress
ion
31
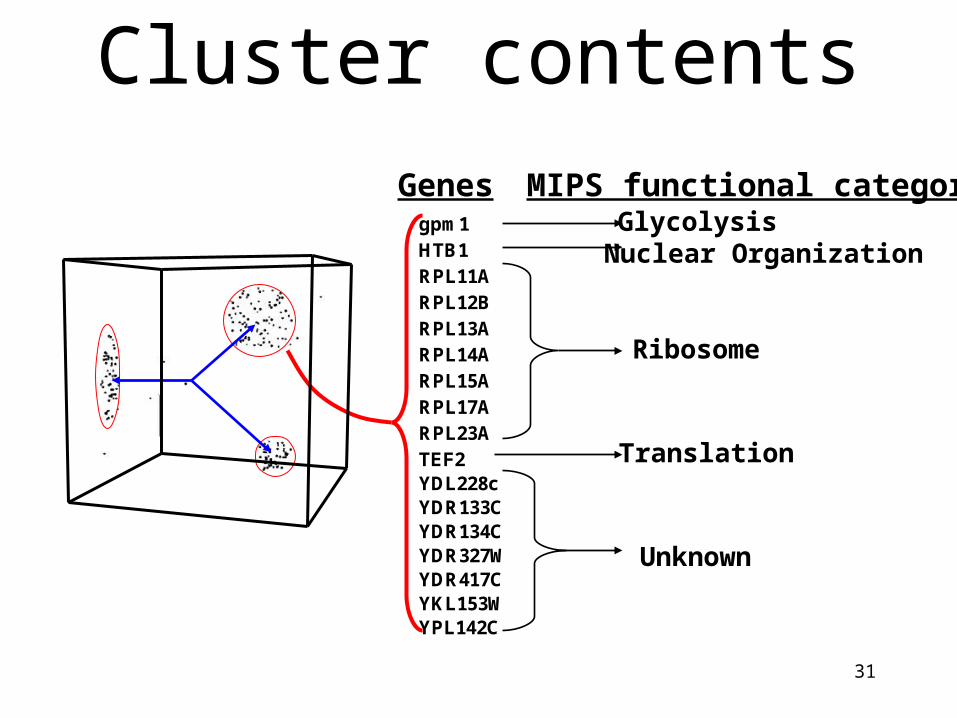
gpm1HTB1RPL11ARPL12BRPL13ARPL14ARPL15ARPL17ARPL23ATEF2YDL228cYDR133CYDR134CYDR327WYDR417CYKL153WYPL142C
GlycolysisNuclear Organization
Ribosome
Translation
Unknown
Genes MIPS functional category
Cluster contents
32
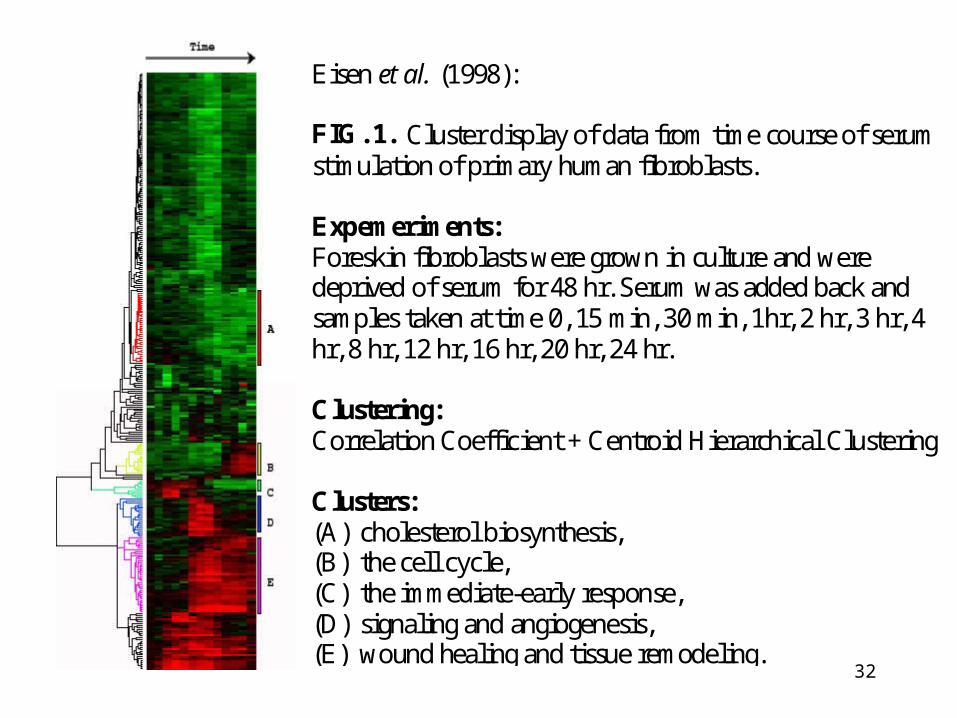
Eisen et al. (1998):
FIG. 1. Cluster display of data from time course of serumstimulation of primary human fibroblasts.
Expemeriments:Foreskin fibroblasts were grown in culture and weredeprived of serum for 48 hr. Serum was added back andsamples taken at time 0, 15 min, 30 min, 1hr, 2 hr, 3 hr, 4hr, 8 hr, 12 hr, 16 hr, 20 hr, 24 hr.
Clustering:Correlation Coefficient + Centroid Hierarchical Clustering
Clusters:(A) cholesterol biosynthesis,(B) the cell cycle,(C) the immediate-early response,(D) signaling and angiogenesis,(E) wound healing and tissue remodeling.
33
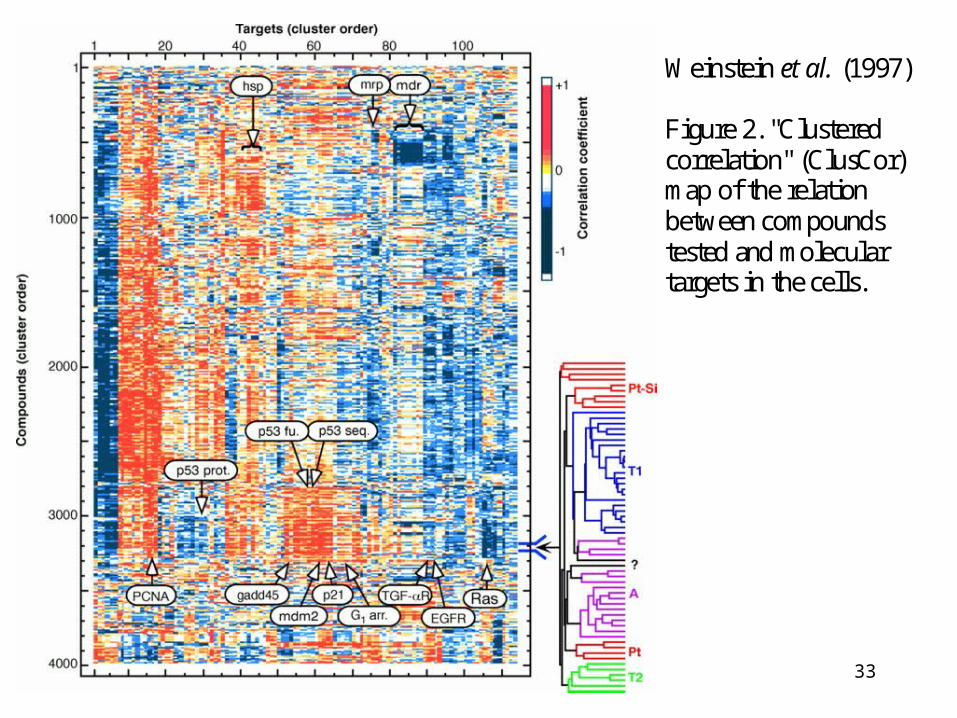
Weinstein et al. (1997)
Figure 2. "Clusteredcorrelation" (ClusCor)map of the relationbetween compoundstested and moleculartargets in the cells.
34
RNA2: Clusters & Motifs
• Clustering by gene and/or condition
• Distance and similarity measures
• Clustering & classification
• Applications
• DNA & RNA motif discovery & search
35
Motif-finding algorithms
• oligonucleotide frequencies
• Gibbs sampling (e.g. AlignACE)• MEME (Motif Expectation Maximum for motif Elicitation)
• ClustalW
• MACAW
36
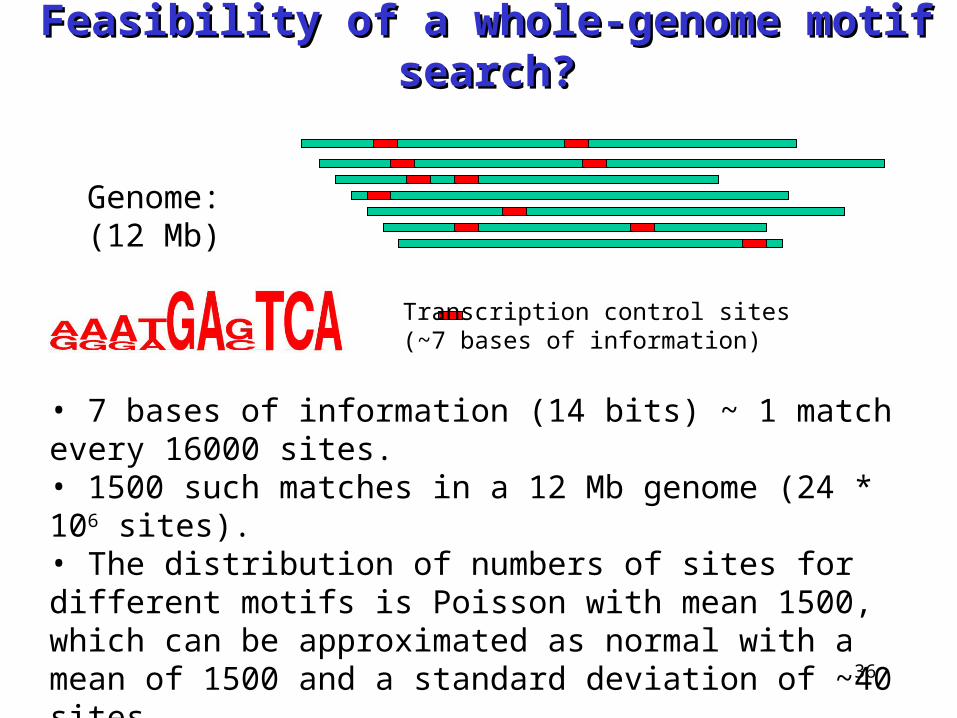
Transcription control sites(~7 bases of information)
Genome:(12 Mb)
• 7 bases of information (14 bits) ~ 1 match every 16000 sites.• 1500 such matches in a 12 Mb genome (24 * 106 sites).• The distribution of numbers of sites for different motifs is Poisson with mean 1500, which can be approximated as normal with a mean of 1500 and a standard deviation of ~40 sites.• Therefore, ~100 sites are needed to achieve a detectable signal above background.
Feasibility of a whole-genome motif search?Feasibility of a whole-genome motif search?
37
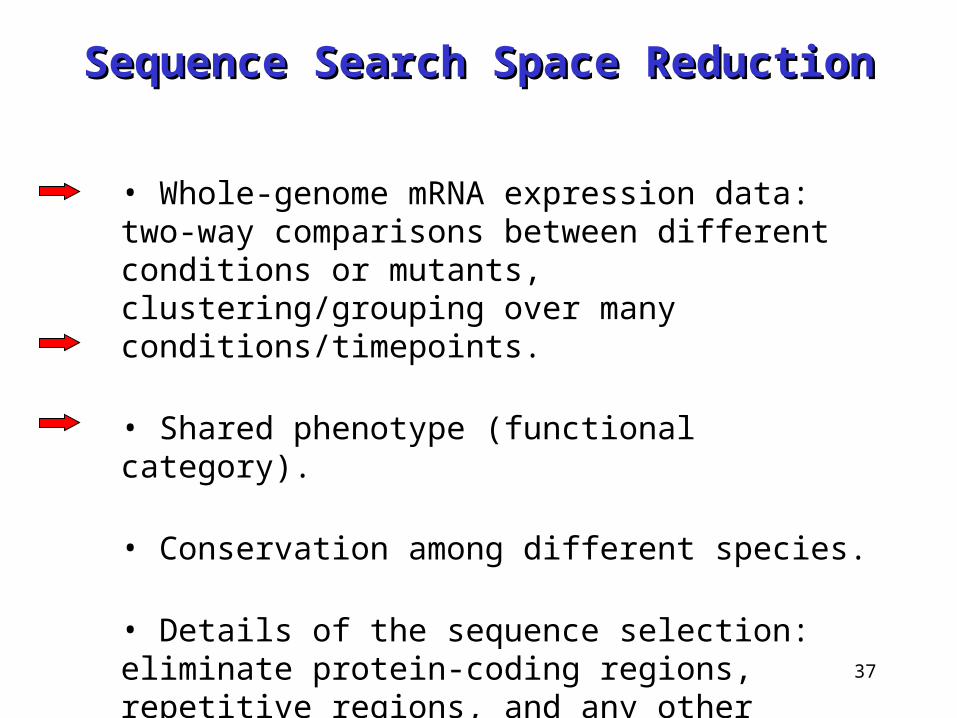
• Whole-genome mRNA expression data: two-way comparisons between different conditions or mutants, clustering/grouping over many conditions/timepoints.
• Shared phenotype (functional category).
• Conservation among different species.
• Details of the sequence selection: eliminate protein-coding regions, repetitive regions, and any other sequences not likely to contain control sites.
Sequence Search Space ReductionSequence Search Space Reduction
38
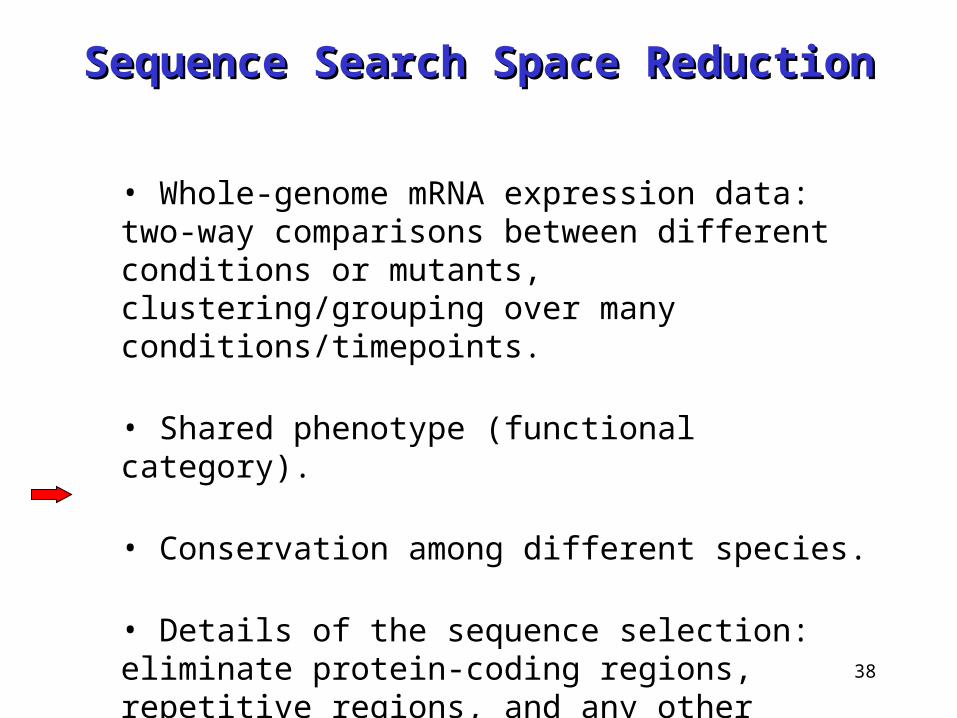
• Whole-genome mRNA expression data: two-way comparisons between different conditions or mutants, clustering/grouping over many conditions/timepoints.
• Shared phenotype (functional category).
• Conservation among different species.
• Details of the sequence selection: eliminate protein-coding regions, repetitive regions, and any other sequences not likely to contain control sites.
Sequence Search Space ReductionSequence Search Space Reduction
39
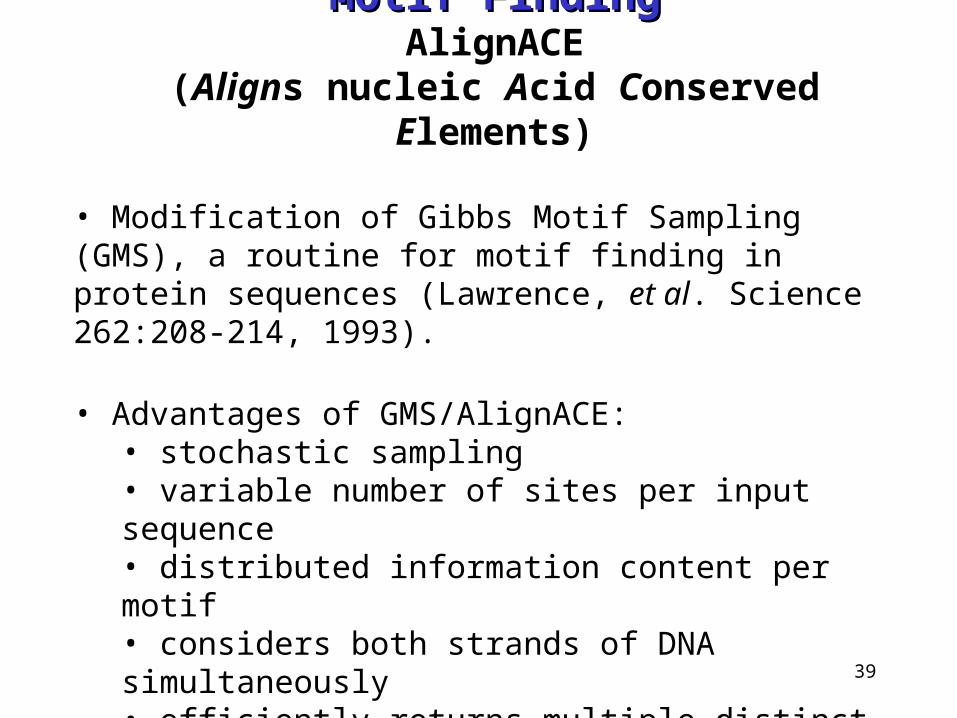
• Modification of Gibbs Motif Sampling (GMS), a routine for motif finding in protein sequences (Lawrence, et al. Science 262:208-214, 1993).
• Advantages of GMS/AlignACE: • stochastic sampling• variable number of sites per input sequence• distributed information content per motif• considers both strands of DNA simultaneously • efficiently returns multiple distinct motifs
Motif FindingMotif FindingAlignACE
(Aligns nucleic Acid Conserved Elements)

40
5’- TCTCTCTCCACGGCTAATTAGGTGATCATGAAAAAATGAAAAATTCATGAGAAAAGAGTCAGACATCGAAACATACAT
5’- ATGGCAGAATCACTTTAAAACGTGGCCCCACCCGCTGCACCCTGTGCATTTTGTACGTTACTGCGAAATGACTCAACG
5’- CACATCCAACGAATCACCTCACCGTTATCGTGACTCACTTTCTTTCGCATCGCCGAAGTGCCATAAAAAATATTTTTT
5’- TGCGAACAAAAGAGTCATTACAACGAGGAAATAGAAGAAAATGAAAAATTTTCGACAAAATGTATAGTCATTTCTATC
5’- ACAAAGGTACCTTCCTGGCCAATCTCACAGATTTAATATAGTAAATTGTCATGCATATGACTCATCCCGAACATGAAA
5’- ATTGATTGACTCATTTTCCTCTGACTACTACCAGTTCAAAATGTTAGAGAAAAATAGAAAAGCAGAAAAAATAAATAA
5’- GGCGCCACAGTCCGCGTTTGGTTATCCGGCTGACTCATTCTGACTCTTTTTTGGAAAGTGTGGCATGTGCTTCACACA
…HIS7
…ARO4
…ILV6
…THR4
…ARO1
…HOM2
…PRO3
300-600 bp of upstream sequence per gene are searched in
Saccharomyces cerevisiae.
AlignACE ExampleAlignACE ExampleInput Data SetInput Data Set
41
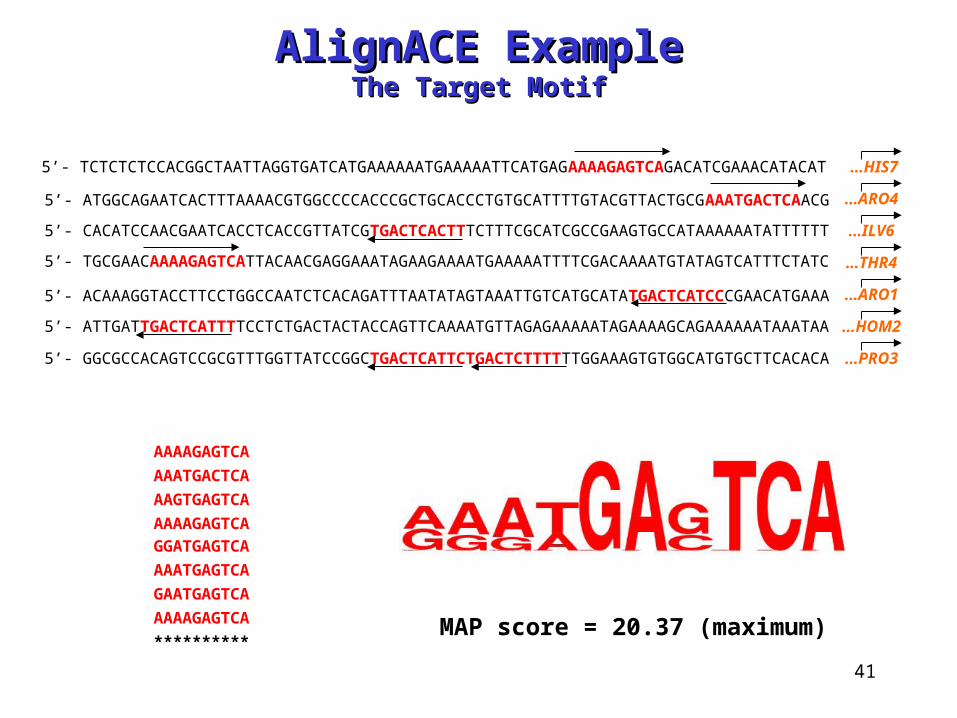
5’- TCTCTCTCCACGGCTAATTAGGTGATCATGAAAAAATGAAAAATTCATGAGAAAAGAGTCAGACATCGAAACATACAT
5’- ATGGCAGAATCACTTTAAAACGTGGCCCCACCCGCTGCACCCTGTGCATTTTGTACGTTACTGCGAAATGACTCAACG
5’- CACATCCAACGAATCACCTCACCGTTATCGTGACTCACTTTCTTTCGCATCGCCGAAGTGCCATAAAAAATATTTTTT
5’- TGCGAACAAAAGAGTCATTACAACGAGGAAATAGAAGAAAATGAAAAATTTTCGACAAAATGTATAGTCATTTCTATC
5’- ACAAAGGTACCTTCCTGGCCAATCTCACAGATTTAATATAGTAAATTGTCATGCATATGACTCATCCCGAACATGAAA
5’- ATTGATTGACTCATTTTCCTCTGACTACTACCAGTTCAAAATGTTAGAGAAAAATAGAAAAGCAGAAAAAATAAATAA
5’- GGCGCCACAGTCCGCGTTTGGTTATCCGGCTGACTCATTCTGACTCTTTTTTGGAAAGTGTGGCATGTGCTTCACACA
AAAAGAGTCA
AAATGACTCA
AAGTGAGTCA
AAAAGAGTCA
GGATGAGTCA
AAATGAGTCA
GAATGAGTCA
AAAAGAGTCA
**********MAP score = 20.37 (maximum)
…HIS7
…ARO4
…ILV6
…THR4
…ARO1
…HOM2
…PRO3
AlignACE ExampleAlignACE ExampleThe Target MotifThe Target Motif
42
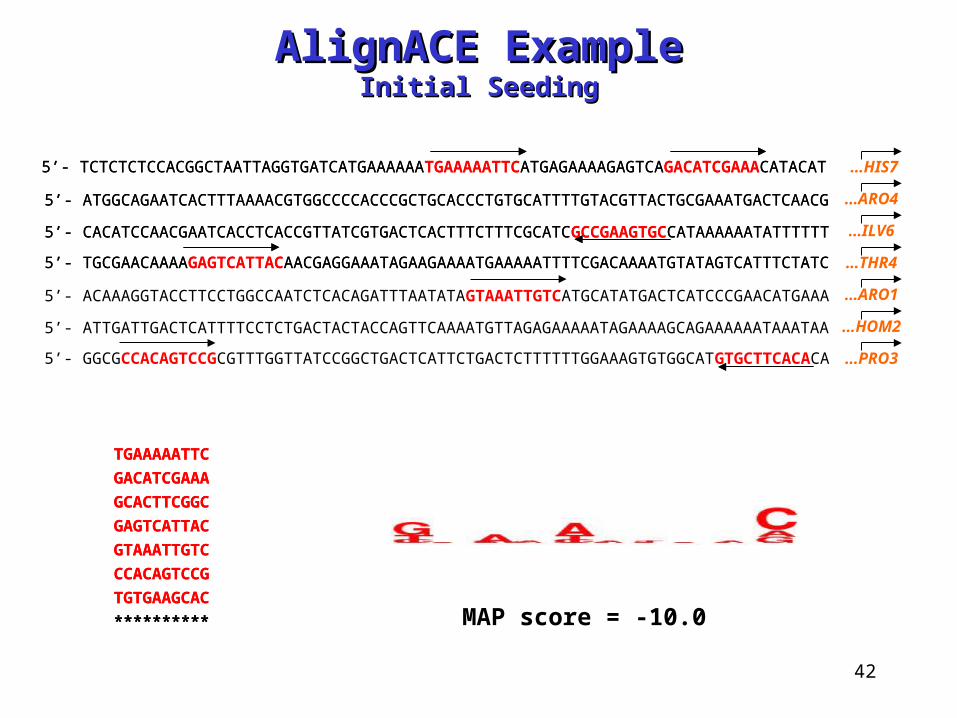
5’- TCTCTCTCCACGGCTAATTAGGTGATCATGAAAAAATGAAAAATTCATGAGAAAAGAGTCAGACATCGAAACATACAT
5’- ATGGCAGAATCACTTTAAAACGTGGCCCCACCCGCTGCACCCTGTGCATTTTGTACGTTACTGCGAAATGACTCAACG
5’- CACATCCAACGAATCACCTCACCGTTATCGTGACTCACTTTCTTTCGCATCGCCGAAGTGCCATAAAAAATATTTTTT
5’- TGCGAACAAAAGAGTCATTACAACGAGGAAATAGAAGAAAATGAAAAATTTTCGACAAAATGTATAGTCATTTCTATC
5’- ACAAAGGTACCTTCCTGGCCAATCTCACAGATTTAATATAGTAAATTGTCATGCATATGACTCATCCCGAACATGAAA
5’- ATTGATTGACTCATTTTCCTCTGACTACTACCAGTTCAAAATGTTAGAGAAAAATAGAAAAGCAGAAAAAATAAATAA
**********
TGAAAAATTC
GACATCGAAA
GCACTTCGGC
GAGTCATTAC
GTAAATTGTC
CCACAGTCCG
TGTGAAGCAC
5’- TCTCTCTCCACGGCTAATTAGGTGATCATGAAAAAATGAAAAATTCATGAGAAAAGAGTCAGACATCGAAACATACAT
5’- ATGGCAGAATCACTTTAAAACGTGGCCCCACCCGCTGCACCCTGTGCATTTTGTACGTTACTGCGAAATGACTCAACG
5’- CACATCCAACGAATCACCTCACCGTTATCGTGACTCACTTTCTTTCGCATCGCCGAAGTGCCATAAAAAATATTTTTT
5’- TGCGAACAAAAGAGTCATTACAACGAGGAAATAGAAGAAAATGAAAAATTTTCGACAAAATGTATAGTCATTTCTATC
5’- GGCGCCACAGTCCGCGTTTGGTTATCCGGCTGACTCATTCTGACTCTTTTTTGGAAAGTGTGGCATGTGCTTCACACA
**********
TGAAAAATTC
GACATCGAAA
GCACTTCGGC
GAGTCATTAC
GTAAATTGTC
CCACAGTCCG
TGTGAAGCACMAP score = -10.0
…HIS7
…ARO4
…ILV6
…THR4
…ARO1
…HOM2
…PRO3
AlignACE ExampleAlignACE ExampleInitial SeedingInitial Seeding
43
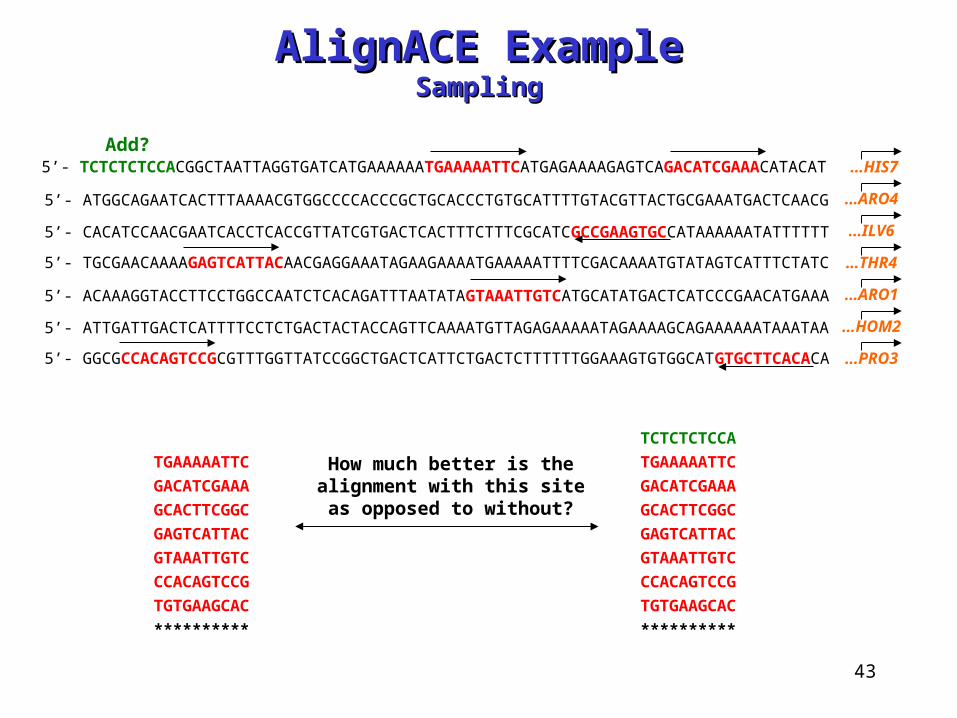
5’- TCTCTCTCCACGGCTAATTAGGTGATCATGAAAAAATGAAAAATTCATGAGAAAAGAGTCAGACATCGAAACATACAT
5’- ATGGCAGAATCACTTTAAAACGTGGCCCCACCCGCTGCACCCTGTGCATTTTGTACGTTACTGCGAAATGACTCAACG
5’- CACATCCAACGAATCACCTCACCGTTATCGTGACTCACTTTCTTTCGCATCGCCGAAGTGCCATAAAAAATATTTTTT
5’- TGCGAACAAAAGAGTCATTACAACGAGGAAATAGAAGAAAATGAAAAATTTTCGACAAAATGTATAGTCATTTCTATC
5’- ACAAAGGTACCTTCCTGGCCAATCTCACAGATTTAATATAGTAAATTGTCATGCATATGACTCATCCCGAACATGAAA
5’- ATTGATTGACTCATTTTCCTCTGACTACTACCAGTTCAAAATGTTAGAGAAAAATAGAAAAGCAGAAAAAATAAATAA
5’- GGCGCCACAGTCCGCGTTTGGTTATCCGGCTGACTCATTCTGACTCTTTTTTGGAAAGTGTGGCATGTGCTTCACACA
**********
TGAAAAATTC
GACATCGAAA
GCACTTCGGC
GAGTCATTAC
GTAAATTGTC
CCACAGTCCG
TGTGAAGCAC
Add?
**********
TGAAAAATTC
GACATCGAAA
GCACTTCGGC
GAGTCATTAC
GTAAATTGTC
CCACAGTCCG
TGTGAAGCAC
TCTCTCTCCA
How much better is the alignment with this site as opposed to without?
…HIS7
…ARO4
…ILV6
…THR4
…ARO1
…HOM2
…PRO3
AlignACE ExampleAlignACE ExampleSamplingSampling
44
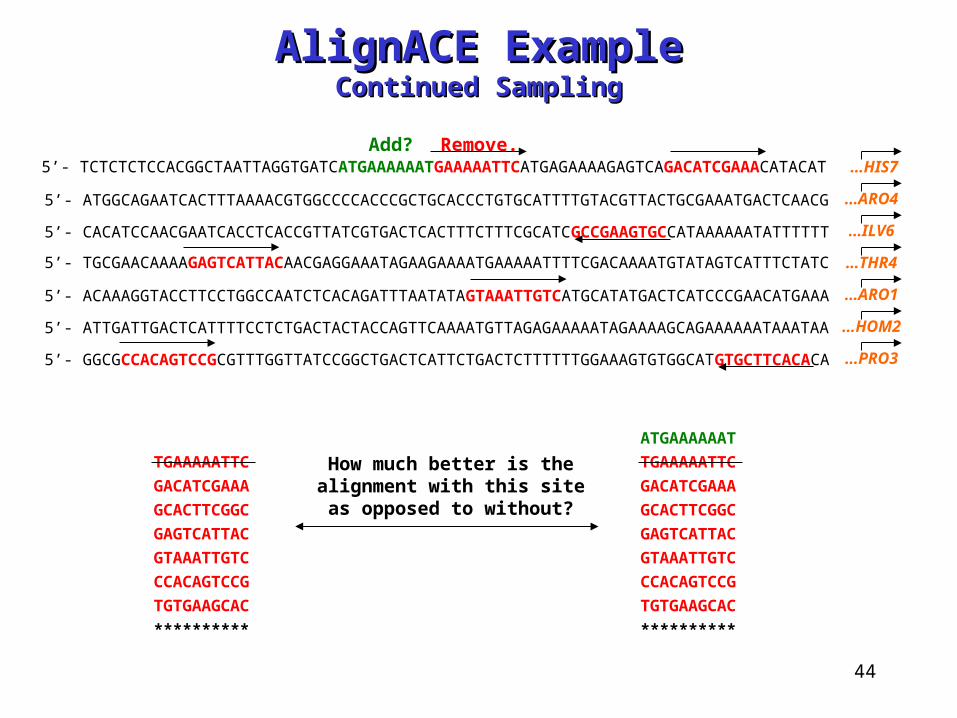
5’- TCTCTCTCCACGGCTAATTAGGTGATCATGAAAAAATGAAAAATTCATGAGAAAAGAGTCAGACATCGAAACATACAT
5’- ATGGCAGAATCACTTTAAAACGTGGCCCCACCCGCTGCACCCTGTGCATTTTGTACGTTACTGCGAAATGACTCAACG
5’- CACATCCAACGAATCACCTCACCGTTATCGTGACTCACTTTCTTTCGCATCGCCGAAGTGCCATAAAAAATATTTTTT
5’- TGCGAACAAAAGAGTCATTACAACGAGGAAATAGAAGAAAATGAAAAATTTTCGACAAAATGTATAGTCATTTCTATC
5’- ACAAAGGTACCTTCCTGGCCAATCTCACAGATTTAATATAGTAAATTGTCATGCATATGACTCATCCCGAACATGAAA
5’- ATTGATTGACTCATTTTCCTCTGACTACTACCAGTTCAAAATGTTAGAGAAAAATAGAAAAGCAGAAAAAATAAATAA
5’- GGCGCCACAGTCCGCGTTTGGTTATCCGGCTGACTCATTCTGACTCTTTTTTGGAAAGTGTGGCATGTGCTTCACACA
**********
TGAAAAATTC
GACATCGAAA
GCACTTCGGC
GAGTCATTAC
GTAAATTGTC
CCACAGTCCG
TGTGAAGCAC
Add?
**********
TGAAAAATTC
GACATCGAAA
GCACTTCGGC
GAGTCATTAC
GTAAATTGTC
CCACAGTCCG
TGTGAAGCAC
How much better is the alignment with this site as opposed to without?
Remove.
ATGAAAAAAT
…HIS7
…ARO4
…ILV6
…THR4
…ARO1
…HOM2
…PRO3
AlignACE ExampleAlignACE ExampleContinued SamplingContinued Sampling
45
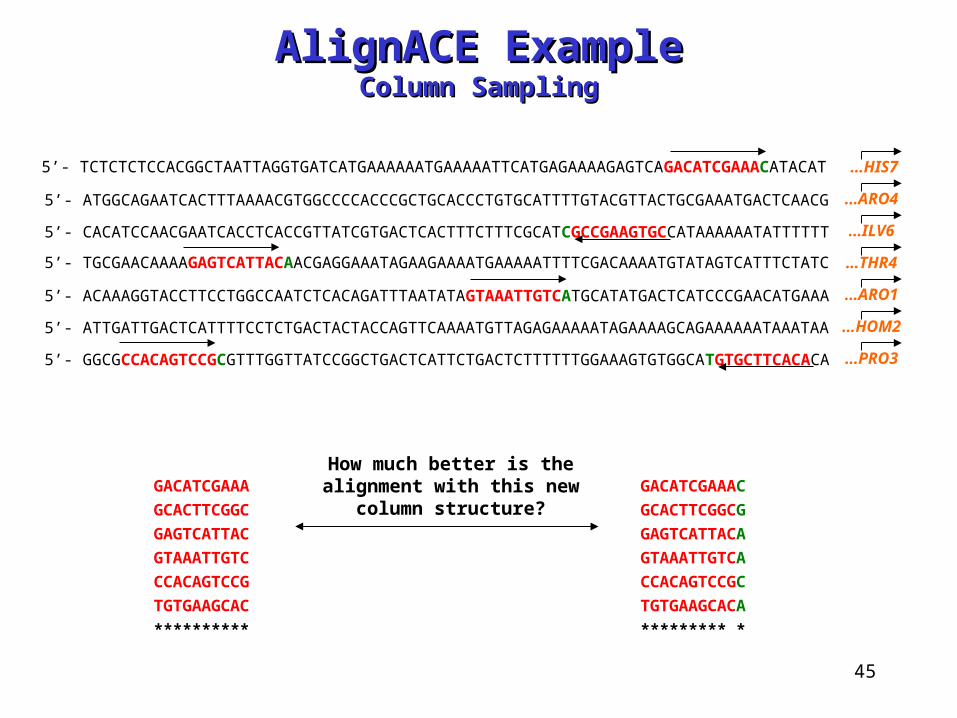
5’- TCTCTCTCCACGGCTAATTAGGTGATCATGAAAAAATGAAAAATTCATGAGAAAAGAGTCAGACATCGAAACATACAT
5’- ATGGCAGAATCACTTTAAAACGTGGCCCCACCCGCTGCACCCTGTGCATTTTGTACGTTACTGCGAAATGACTCAACG
5’- CACATCCAACGAATCACCTCACCGTTATCGTGACTCACTTTCTTTCGCATCGCCGAAGTGCCATAAAAAATATTTTTT
5’- TGCGAACAAAAGAGTCATTACAACGAGGAAATAGAAGAAAATGAAAAATTTTCGACAAAATGTATAGTCATTTCTATC
5’- ACAAAGGTACCTTCCTGGCCAATCTCACAGATTTAATATAGTAAATTGTCATGCATATGACTCATCCCGAACATGAAA
5’- ATTGATTGACTCATTTTCCTCTGACTACTACCAGTTCAAAATGTTAGAGAAAAATAGAAAAGCAGAAAAAATAAATAA
5’- GGCGCCACAGTCCGCGTTTGGTTATCCGGCTGACTCATTCTGACTCTTTTTTGGAAAGTGTGGCATGTGCTTCACACA
**********
GACATCGAAA
GCACTTCGGC
GAGTCATTAC
GTAAATTGTC
CCACAGTCCG
TGTGAAGCAC
********* *
GACATCGAAAC
GCACTTCGGCG
GAGTCATTACA
GTAAATTGTCA
CCACAGTCCGC
TGTGAAGCACA
How much better is the alignment with this new
column structure?
…HIS7
…ARO4
…ILV6
…THR4
…ARO1
…HOM2
…PRO3
AlignACE ExampleAlignACE ExampleColumn SamplingColumn Sampling
46
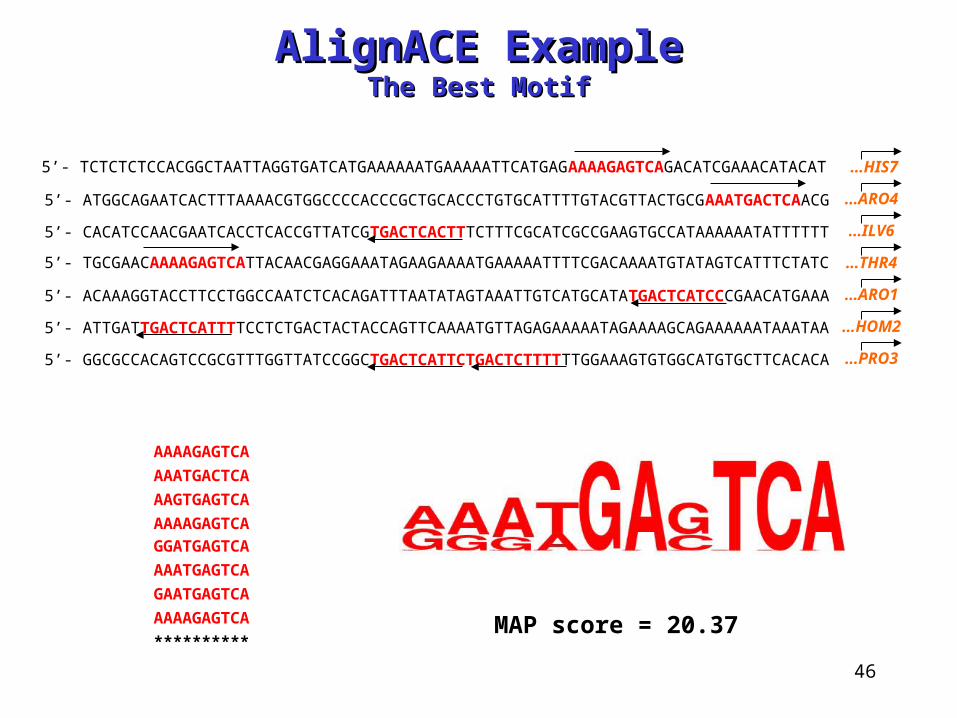
5’- TCTCTCTCCACGGCTAATTAGGTGATCATGAAAAAATGAAAAATTCATGAGAAAAGAGTCAGACATCGAAACATACAT
5’- ATGGCAGAATCACTTTAAAACGTGGCCCCACCCGCTGCACCCTGTGCATTTTGTACGTTACTGCGAAATGACTCAACG
5’- CACATCCAACGAATCACCTCACCGTTATCGTGACTCACTTTCTTTCGCATCGCCGAAGTGCCATAAAAAATATTTTTT
5’- TGCGAACAAAAGAGTCATTACAACGAGGAAATAGAAGAAAATGAAAAATTTTCGACAAAATGTATAGTCATTTCTATC
5’- ACAAAGGTACCTTCCTGGCCAATCTCACAGATTTAATATAGTAAATTGTCATGCATATGACTCATCCCGAACATGAAA
5’- ATTGATTGACTCATTTTCCTCTGACTACTACCAGTTCAAAATGTTAGAGAAAAATAGAAAAGCAGAAAAAATAAATAA
5’- GGCGCCACAGTCCGCGTTTGGTTATCCGGCTGACTCATTCTGACTCTTTTTTGGAAAGTGTGGCATGTGCTTCACACA
AAAAGAGTCA
AAATGACTCA
AAGTGAGTCA
AAAAGAGTCA
GGATGAGTCA
AAATGAGTCA
GAATGAGTCA
AAAAGAGTCA
**********MAP score = 20.37
…HIS7
…ARO4
…ILV6
…THR4
…ARO1
…HOM2
…PRO3
AlignACE ExampleAlignACE ExampleThe Best MotifThe Best Motif
47
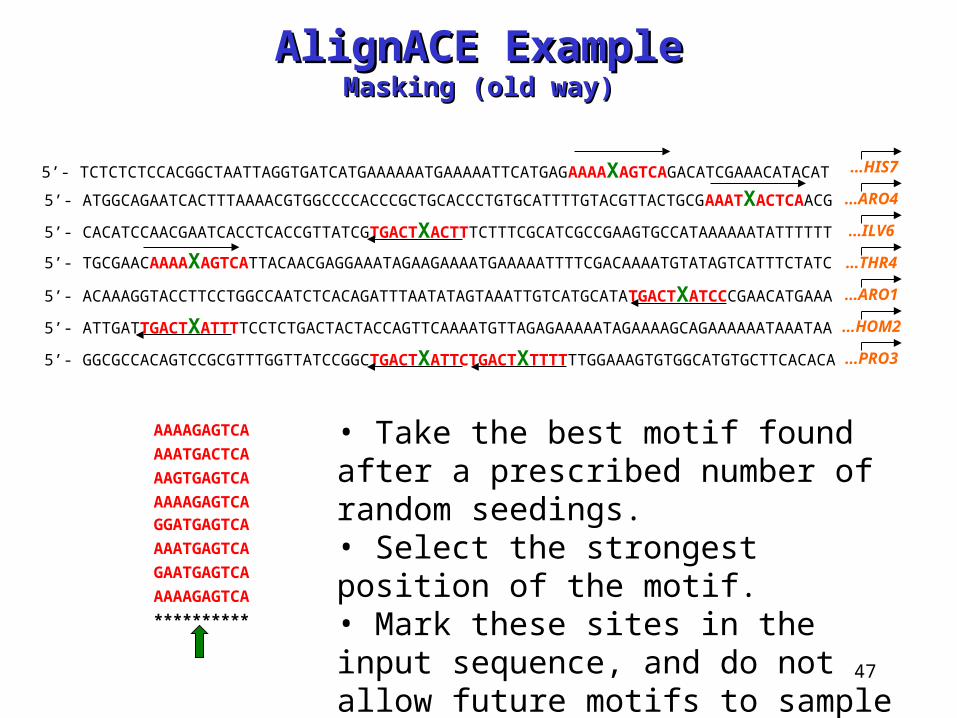
5’- TCTCTCTCCACGGCTAATTAGGTGATCATGAAAAAATGAAAAATTCATGAGAAAAXAGTCAGACATCGAAACATACAT5’- ATGGCAGAATCACTTTAAAACGTGGCCCCACCCGCTGCACCCTGTGCATTTTGTACGTTACTGCGAAATXACTCAACG
5’- CACATCCAACGAATCACCTCACCGTTATCGTGACTXACTTTCTTTCGCATCGCCGAAGTGCCATAAAAAATATTTTTT
5’- TGCGAACAAAAXAGTCATTACAACGAGGAAATAGAAGAAAATGAAAAATTTTCGACAAAATGTATAGTCATTTCTATC
5’- ACAAAGGTACCTTCCTGGCCAATCTCACAGATTTAATATAGTAAATTGTCATGCATATGACTXATCCCGAACATGAAA
5’- ATTGATTGACTXATTTTCCTCTGACTACTACCAGTTCAAAATGTTAGAGAAAAATAGAAAAGCAGAAAAAATAAATAA
5’- GGCGCCACAGTCCGCGTTTGGTTATCCGGCTGACTXATTCTGACTXTTTTTTGGAAAGTGTGGCATGTGCTTCACACA
AAAAGAGTCA
AAATGACTCA
AAGTGAGTCA
AAAAGAGTCA
GGATGAGTCA
AAATGAGTCA
GAATGAGTCA
AAAAGAGTCA
**********
…HIS7
…ARO4
…ILV6
…THR4
…ARO1
…HOM2
…PRO3
• Take the best motif found after a prescribed number of random seedings.• Select the strongest position of the motif.• Mark these sites in the input sequence, and do not allow future motifs to sample those sites.• Continue sampling.
AlignACE ExampleAlignACE ExampleMasking (old way)Masking (old way)

48
5’- TCTCTCTCCACGGCTAATTAGGTGATCATGAAAAAATGAAAAATTCATGAGAAAAGAGTCAGACATCGAAACATACAT
5’- ATGGCAGAATCACTTTAAAACGTGGCCCCACCCGCTGCACCCTGTGCATTTTGTACGTTACTGCGAAATGACTCAACG
5’- CACATCCAACGAATCACCTCACCGTTATCGTGACTCACTTTCTTTCGCATCGCCGAAGTGCCATAAAAAATATTTTTT
5’- TGCGAACAAAAGAGTCATTACAACGAGGAAATAGAAGAAAATGAAAAATTTTCGACAAAATGTATAGTCATTTCTATC
5’- ACAAAGGTACCTTCCTGGCCAATCTCACAGATTTAATATAGTAAATTGTCATGCATATGACTCATCCCGAACATGAAA
5’- ATTGATTGACTCATTTTCCTCTGACTACTACCAGTTCAAAATGTTAGAGAAAAATAGAAAAGCAGAAAAAATAAATAA
5’- GGCGCCACAGTCCGCGTTTGGTTATCCGGCTGACTCATTCTGACTCTTTTTTGGAAAGTGTGGCATGTGCTTCACACA
AAAAGAGTCA
AAATGACTCA
AAGTGAGTCA
AAAAGAGTCA
GGATGAGTCA
AAATGAGTCA
GAATGAGTCA
AAAAGAGTCA
**********
…HIS7
…ARO4
…ILV6
…THR4
…ARO1
…HOM2
…PRO3
• Maintain a list of all distinct motifs found.• Use CompareACE to compare subsequent motifs to those already found.• Quickly reject weaker, but similar motifs.
AlignACE ExampleAlignACE ExampleMasking (new way)Masking (new way)
49
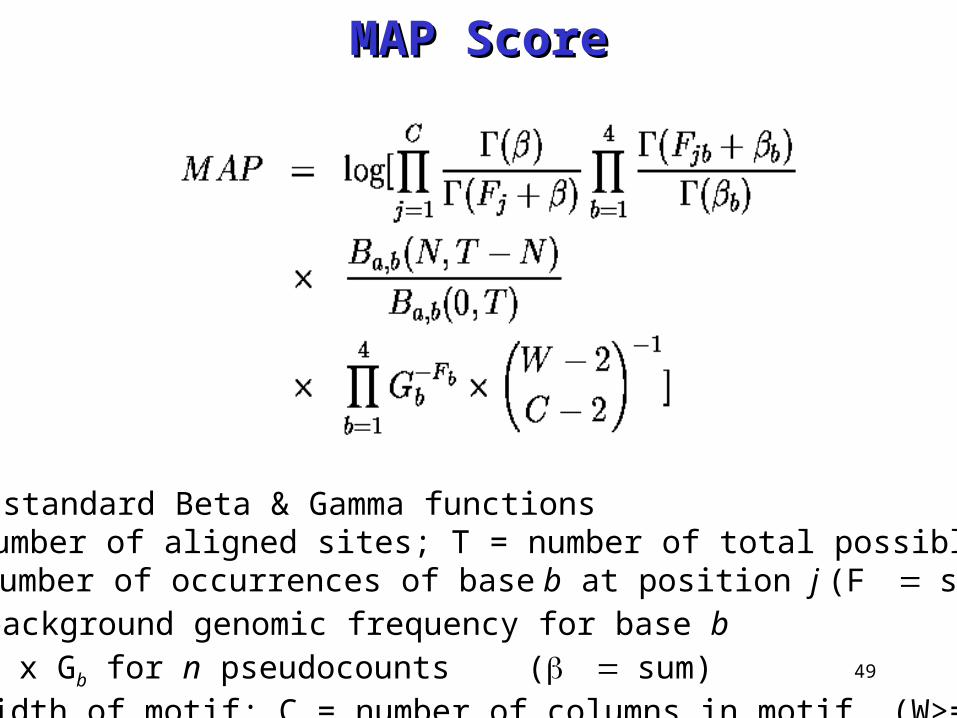
= standard Beta & Gamma functionsN = number of aligned sites; T = number of total possible sitesFjb = number of occurrences of base b at position j (Fsum)Gb = background genomic frequency for base bb = n x Gb for n pseudocounts (sum)W = width of motif; C = number of columns in motif (W>=C)
MAP ScoreMAP Score
50
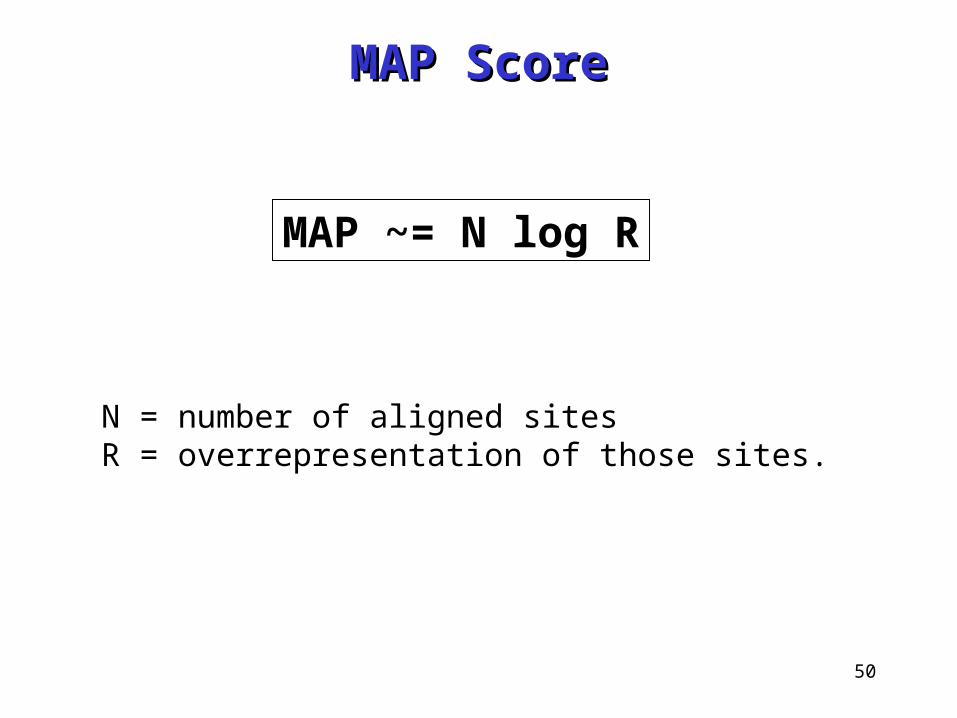
N = number of aligned sitesR = overrepresentation of those sites.
MAP ~= N log R
MAP ScoreMAP Score
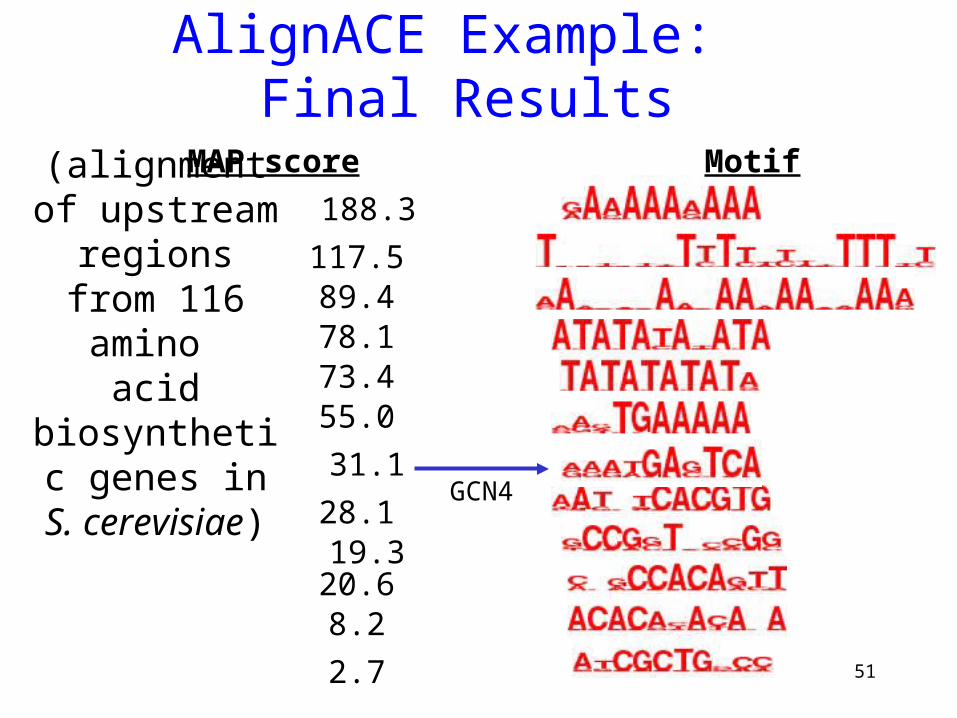
51
188.3
78.1
20.6
28.1
117.5
31.1
73.4
8.2
19.3
55.0
89.4
2.7
MAP score Motif
AlignACE Example: Final Results
(alignment of upstream regions from 116 amino acid biosynthetic
genes in S. cerevisiae)
GCN4
52
Indices used to evaluate motif significance
• Group specificity
• Functional enrichment
• Positional bias
• Palindromicity
• Known motifs (CompareACE)
53
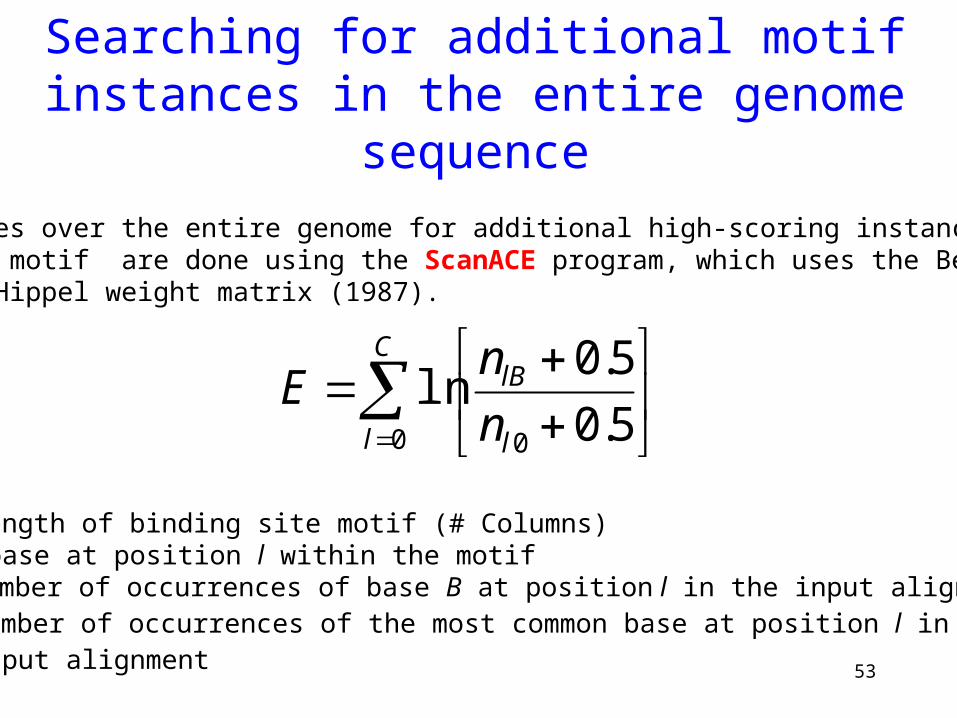
Searching for additional motif instances in the entire genome sequence
Searches over the entire genome for additional high-scoring instances of the motif are done using the ScanACE program, which uses the Berg & von Hippel weight matrix (1987).
C
l l
lB
n
nE
0 0 5.0
5.0ln
C = length of binding site motif (# Columns)B = base at position l within the motifnlB= number of occurrences of base B at position l in the input alignmentnlO= number of occurrences of the most common base at position l in the
input alignment
54
-1.5
-1
-0.5
0
0.5
1
1.5
2
2.5
3
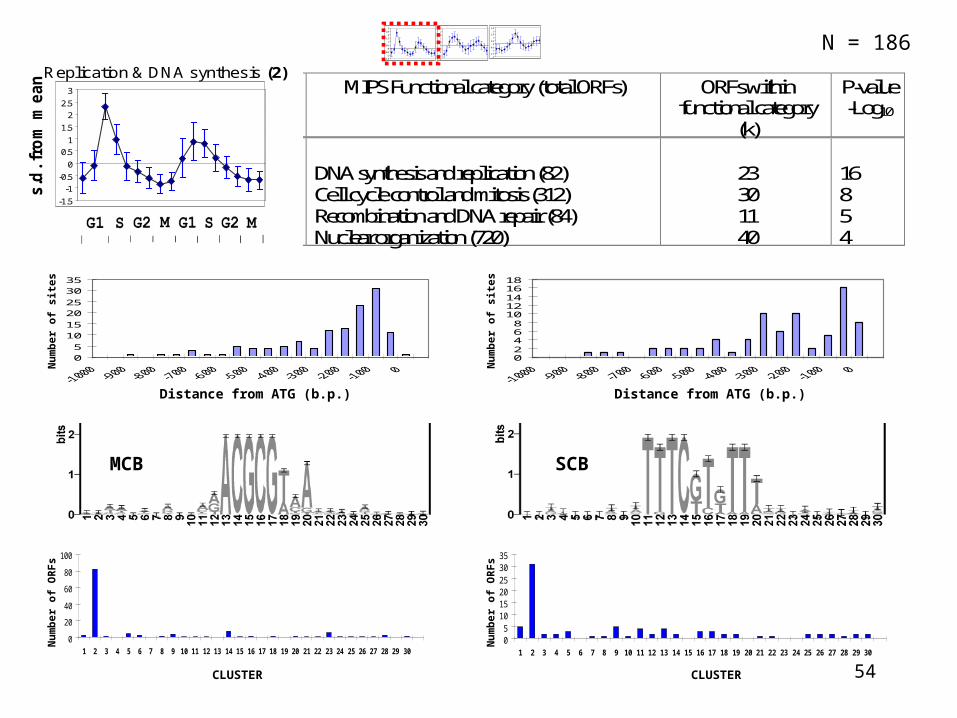
Replication & DNA synthesis (2)
s.d
. fr
om
mean
MCB SCB
0
20
40
60
80
100
1 2 3 4 5 6 7 8 9 10 11 12 13 14 15 16 17 18 19 20 21 22 23 24 25 26 27 28 29 3005
101520253035
1 2 3 4 5 6 7 8 9 10 11 12 13 14 15 16 17 18 19 20 21 22 23 24 25 26 27 28 29 30
CLUSTERCLUSTER
Nu
mb
er o
f O
RF
s
05
1015
2025
3035
Distance from ATG (b.p.)
Nu
mb
er o
f si
tes
02468
1012141618
Distance from ATG (b.p.)
Nu
mb
er o
f si
tes
Nu
mb
er o
f O
RF
s
-1.5
-1
-0.5
0
0.5
1
1.5
2
2.5
3
-2
-1.5
-1
-0.5
0
0.5
1
1.5
2
2.5
-2
-1.5
-1
-0.5
0
0.5
1
1.5
2
2.5
MIPS Functional category (total ORFs) ORFs withinfunctional category
(k)
P-value-Log10
DNA synthesis and replication (82)Cell cycle control and mitosis (312)Recombination and DNA repair (84)Nuclear organization (720)
23301140
16854
N = 186
55
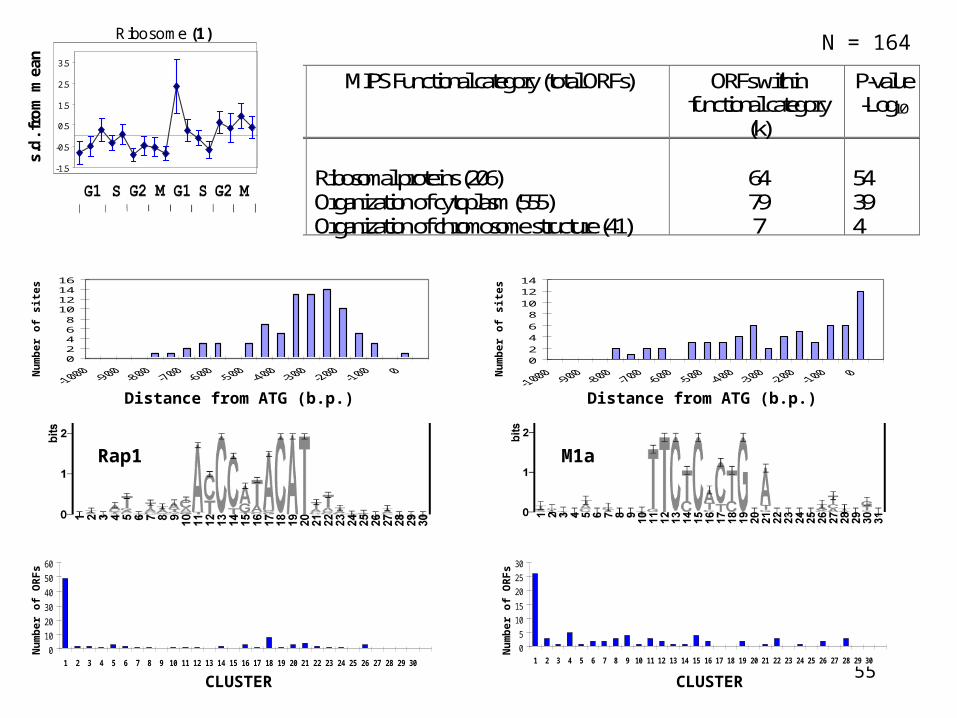
-1.5
-0.5
0.5
1.5
2.5
3.5
Ribosome (1)s.
d. f
rom
mea
n
Rap1
CLUSTER
Nu
mb
er o
f O
RF
s
0
10
20
30
40
50
60
1 2 3 4 5 6 7 8 9 10 11 12 13 14 15 16 17 18 19 20 21 22 23 24 25 26 27 28 29 30
0
5
10
15
20
25
30
1 2 3 4 5 6 7 8 9 10 11 12 13 14 15 16 17 18 19 20 21 22 23 24 25 26 27 28 29 30
M1a
CLUSTER
02468
10121416
Distance from ATG (b.p.)
Nu
mb
er o
f si
tes
02
46
810
1214
Distance from ATG (b.p.)
Nu
mb
er o
f si
tes
Nu
mb
er o
f O
RF
s
MIPS Functional category (total ORFs) ORFs withinfunctional category
(k)
P-value-Log10
Ribosomal proteins (206)Organization of cytoplasm (555)Organization of chromosome structure (41)
64797
54394
N = 164
56
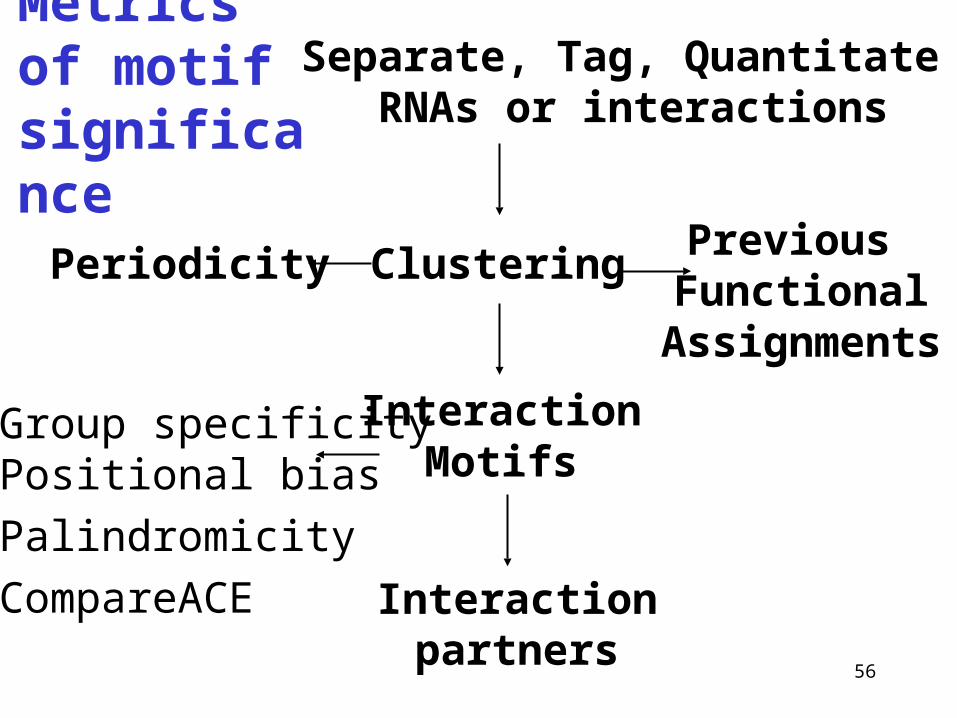
Separate, Tag, Quantitate RNAs or interactions
ClusteringPrevious
FunctionalAssignments
Periodicity
InteractionMotifs
Interactionpartners
•Group specificity•Positional bias
•Palindromicity
•CompareACE
Metrics of motif significance
57
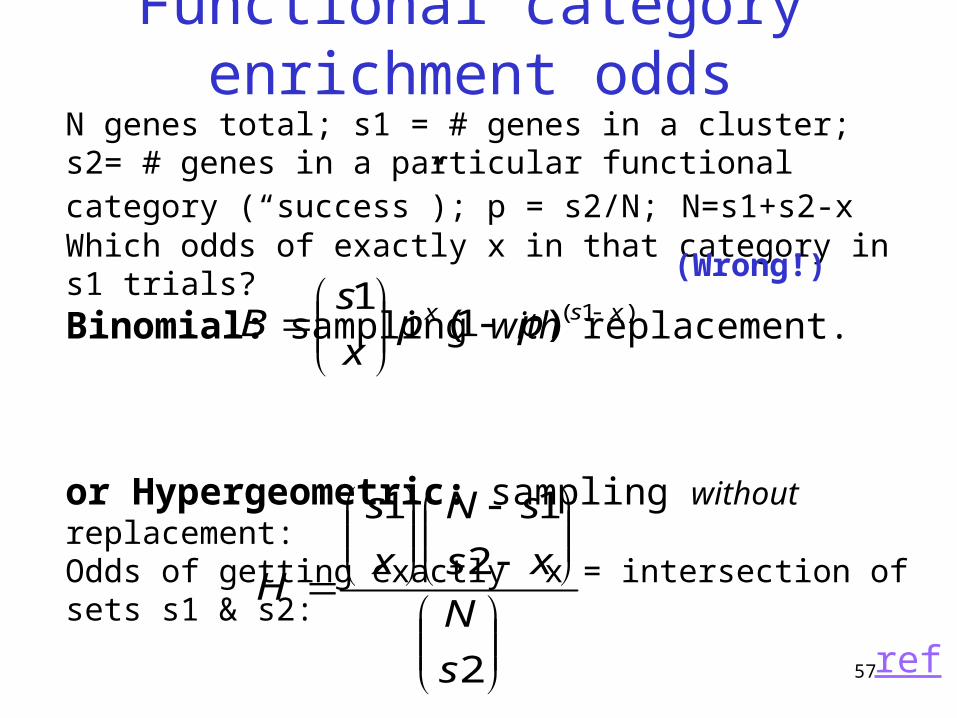
N genes total; s1 = # genes in a cluster; s2= # genes in a particular functional category (“success”); p = s2/N; N=s1+s2-xWhich odds of exactly x in that category in s1 trials?Binomial: sampling with replacement.
or Hypergeometric: sampling without replacement:Odds of getting exactly x = intersection of sets s1 & s2:
Functional category enrichment odds
2
2
11
s
N
xs
sN
x
s
H
ref
)1()1(1 xsx ppx
sB
(Wrong!)
58
)2,1min(
2
2
11ss
xis
N
is
sN
i
s
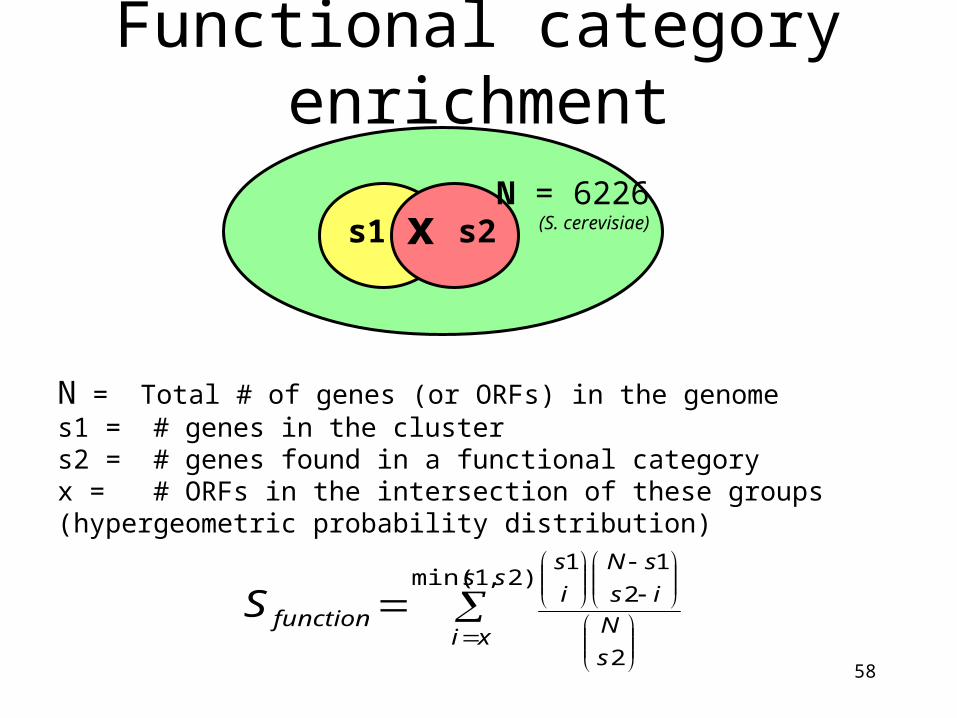
functionS
N = Total # of genes (or ORFs) in the genomes1 = # genes in the clusters2 = # genes found in a functional categoryx = # ORFs in the intersection of these groups(hypergeometric probability distribution)
x s2s1N = 6226
(S. cerevisiae)
Functional category enrichment
59
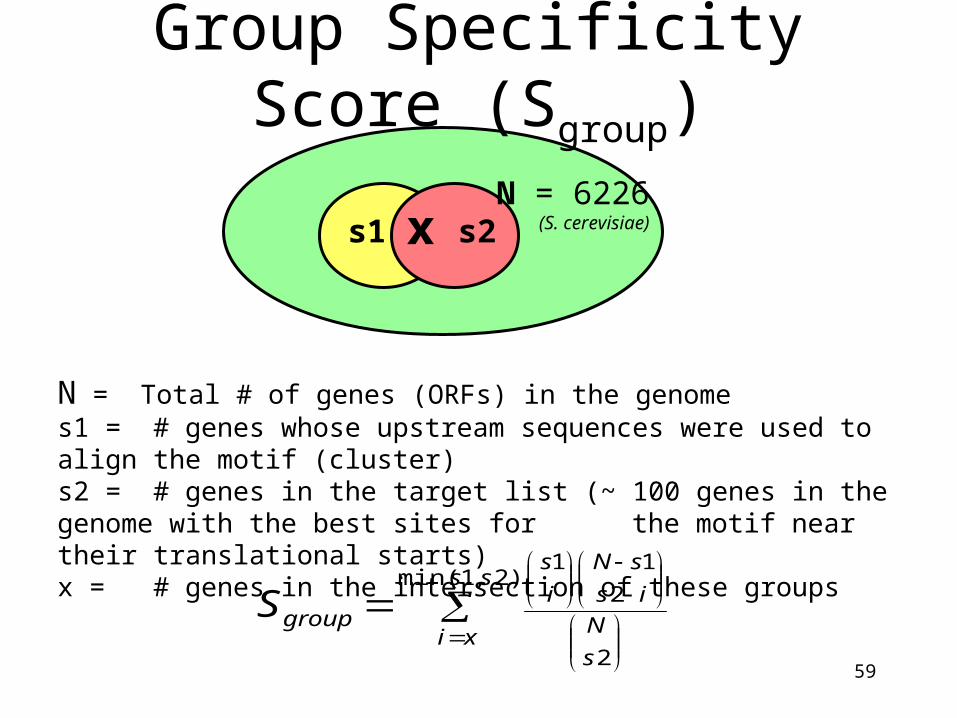
)2,1min(
2
2
11ss
xis
N
is
sN
i
s
groupS
N = Total # of genes (ORFs) in the genomes1 = # genes whose upstream sequences were used to align the motif (cluster)s2 = # genes in the target list (~ 100 genes in the genome with the best sites for
the motif near their translational starts)x = # genes in the intersection of these groups
x s2s1N = 6226
(S. cerevisiae)
Group Specificity Score (Sgroup)
60
t
mi
it
s
wi
s
w
i
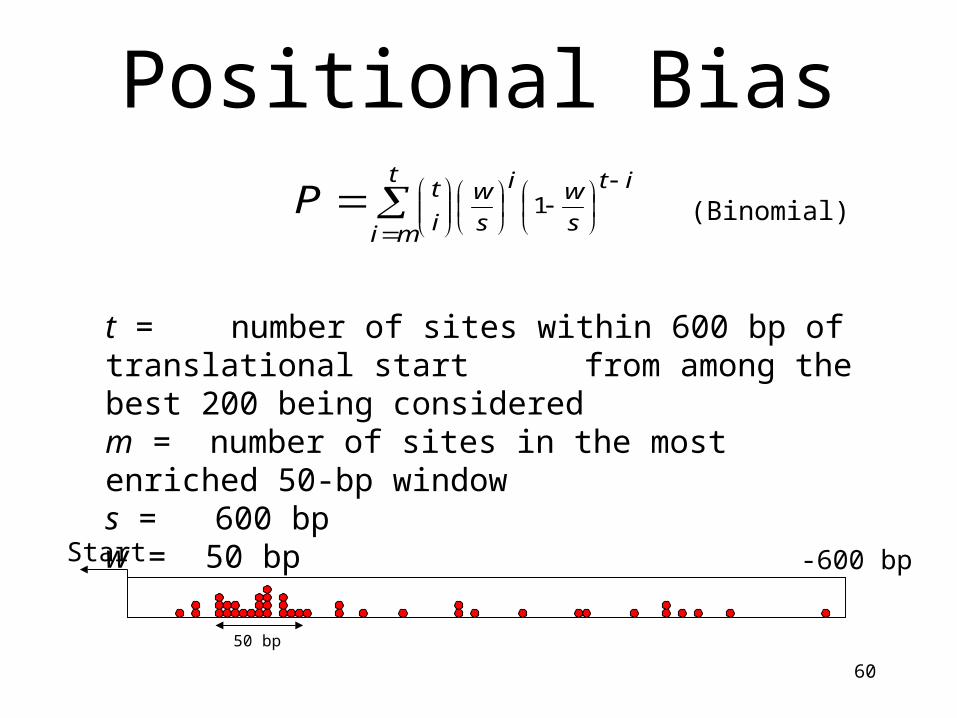
tP 1
t = number of sites within 600 bp of translational start from among the best 200 being considered
m = number of sites in the most enriched 50-bp windows = 600 bpw = 50 bp
Start -600 bp
50 bp
Positional Bias
(Binomial)
61
Comparisons of motifs
• The CompareACE program finds best alignment between two motifs and calculates the correlation between the two position-specific scoring matrices
• Similar motifs: CompareACE score > 0.7
62
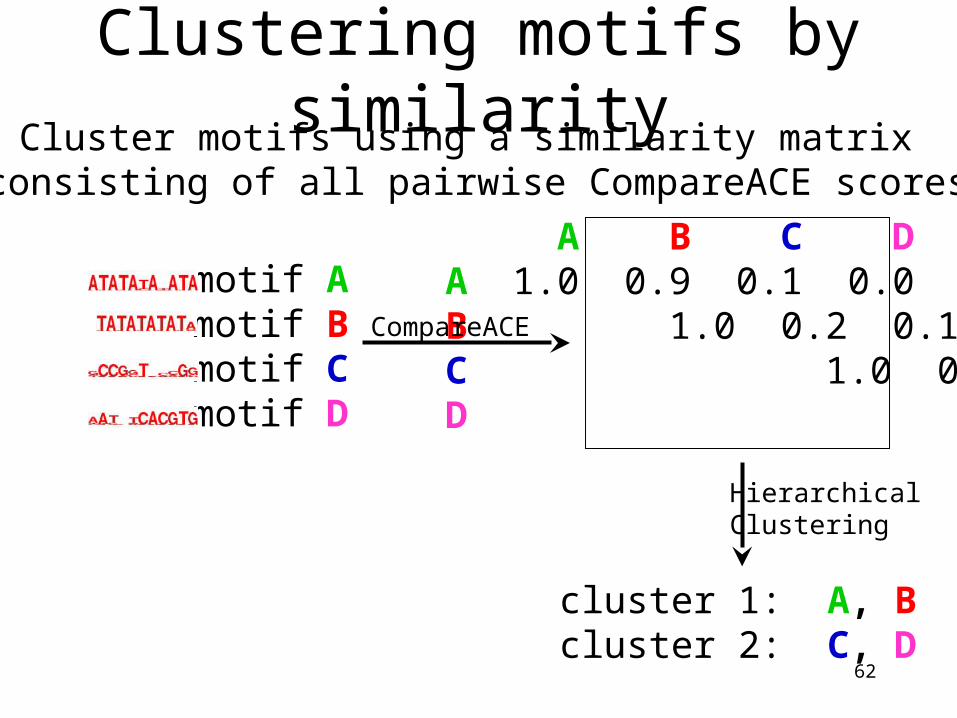
Clustering motifs by similarity
motif Amotif Bmotif Cmotif D
A B C DA 1.0 0.9 0.1 0.0 B 1.0 0.2 0.1C 1.0 0.4D 1.0
Cluster motifs using a similarity matrix consisting of all pairwise CompareACE scores
cluster 1: A, Bcluster 2: C, D
CompareACE
HierarchicalClustering
63
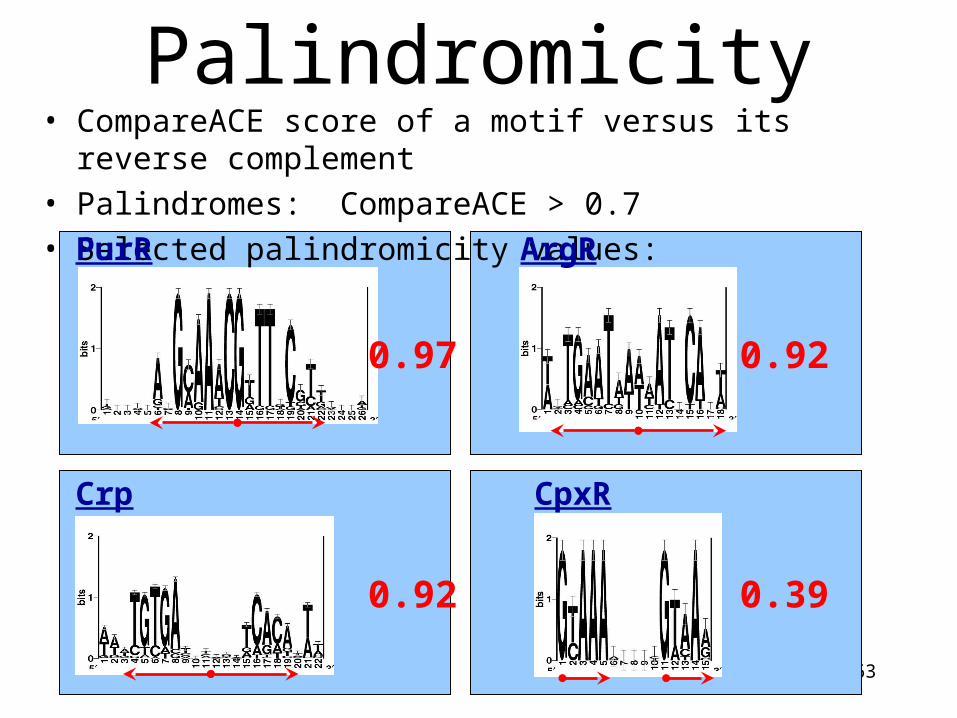
Palindromicity
0.97
0.92
0.92
0.39
• CompareACE score of a motif versus its reverse complement
• Palindromes: CompareACE > 0.7
• Selected palindromicity values:
Crp
PurR ArgR
CpxR
64
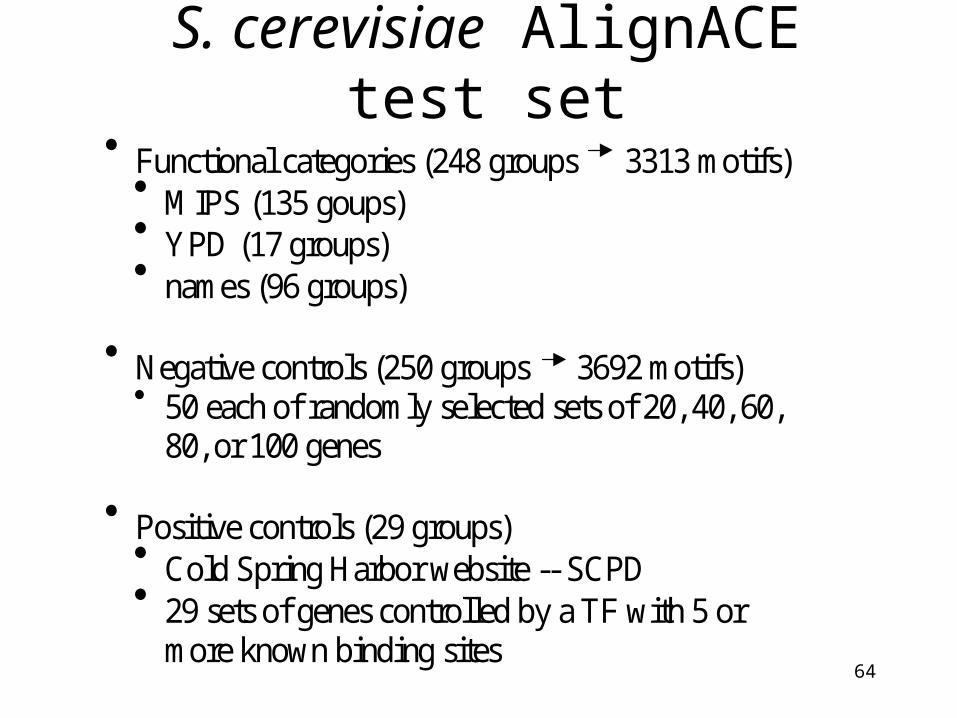
S. cerevisiae AlignACE Test Set Functional categories (248 groups 3313 motifs)
MIPS (135 goups) YPD (17 groups) names (96 groups)
Negative controls (250 groups 3692 motifs)
50 each of randomly selected sets of 20, 40, 60, 80, or 100 genes
Positive controls (29 groups)
Cold Spring Harbor website -- SCPD 29 sets of genes controlled by a TF with 5 or
more known binding sites
S. cerevisiae AlignACE test set
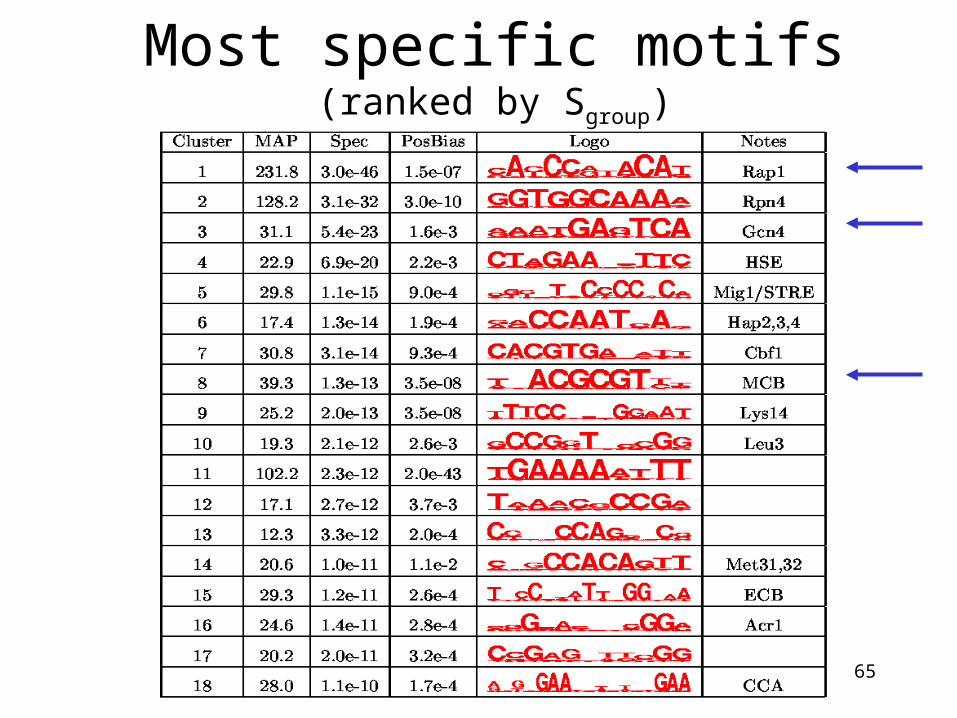
65
Most specific motifs(ranked by Sgroup)
66
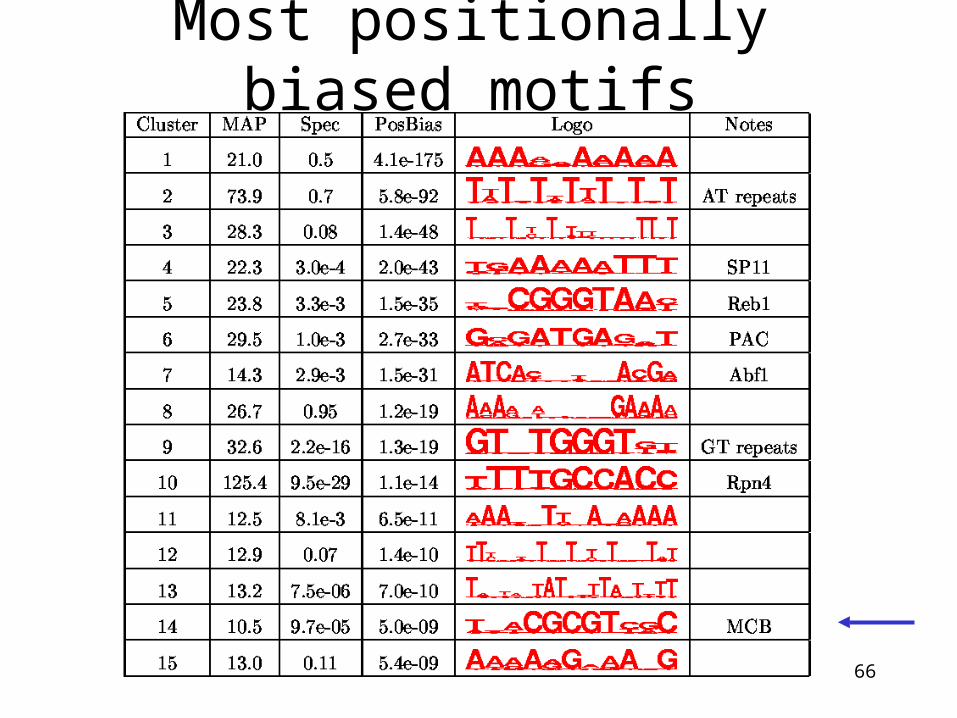
Most positionally biased motifs
67
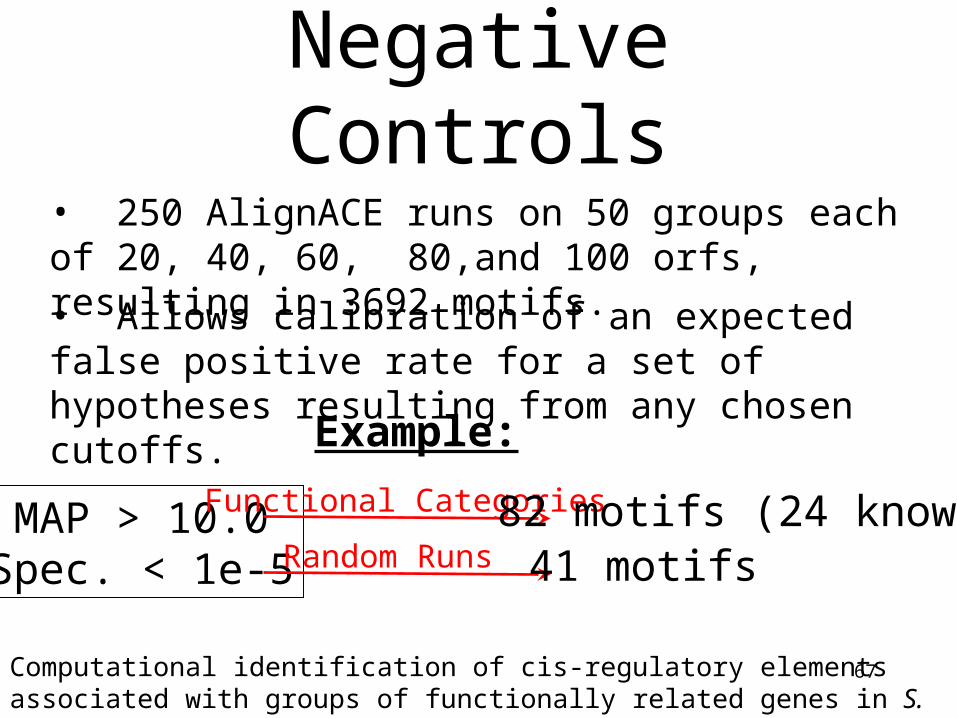
• 250 AlignACE runs on 50 groups each of 20, 40, 60, 80,and 100 orfs, resulting in 3692 motifs.
• Allows calibration of an expected false positive rate for a set of hypotheses resulting from any chosen cutoffs.
MAP > 10.0Spec. < 1e-5
Example:
Functional Categories
Random Runs82 motifs (24 known)41 motifs
Negative Controls
Computational identification of cis-regulatory elements associated with groups of functionally related genes in S. cerevisiae Hughes, et al JMB, 1999.
68
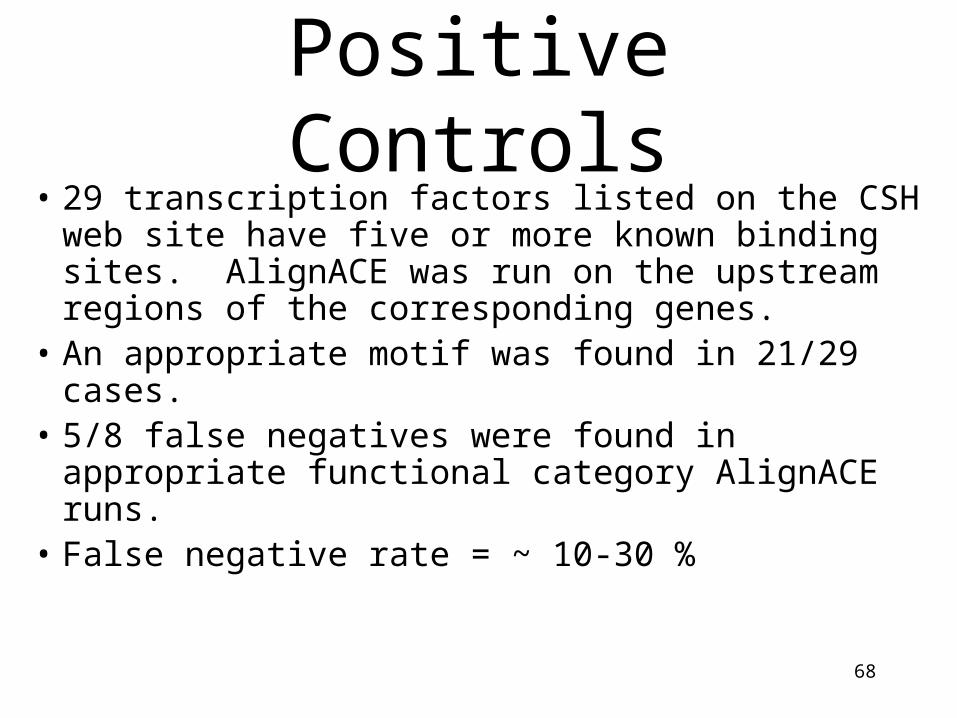
Positive Controls• 29 transcription factors listed on the CSH web
site have five or more known binding sites. AlignACE was run on the upstream regions of the corresponding genes.
• An appropriate motif was found in 21/29 cases.• 5/8 false negatives were found in appropriate
functional category AlignACE runs.• False negative rate = ~ 10-30 %
69
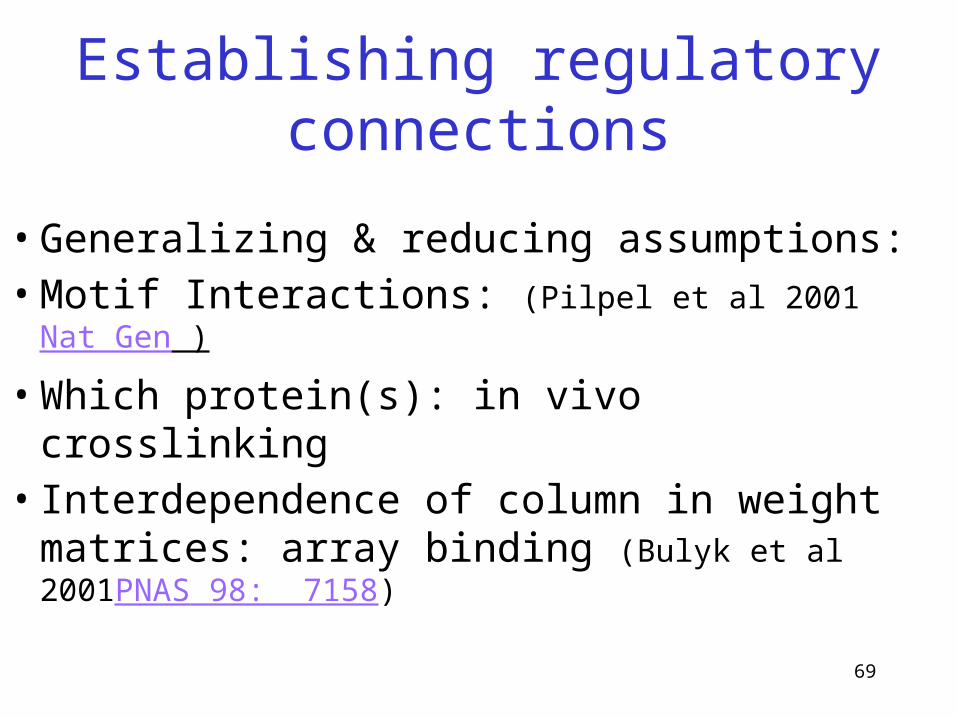
Establishing regulatory connections
• Generalizing & reducing assumptions:• Motif Interactions: (Pilpel et al 2001 Nat Gen )
• Which protein(s): in vivo crosslinking • Interdependence of column in weight
matrices: array binding (Bulyk et al 2001PNAS 98: 7158)
70
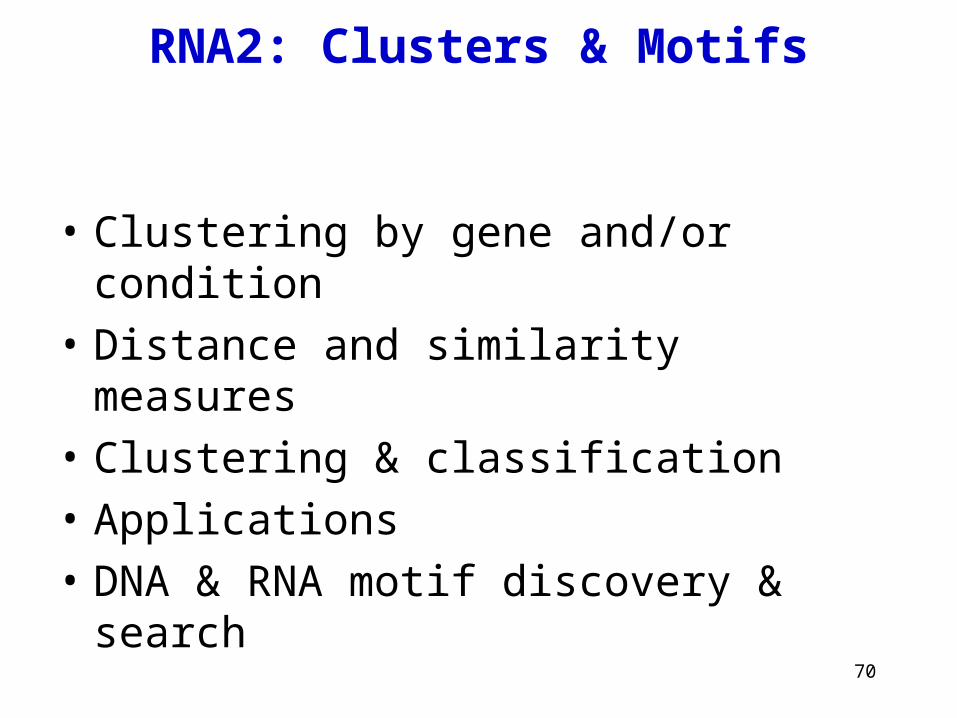
RNA2: Clusters & Motifs
• Clustering by gene and/or condition
• Distance and similarity measures
• Clustering & classification
• Applications
• DNA & RNA motif discovery & search