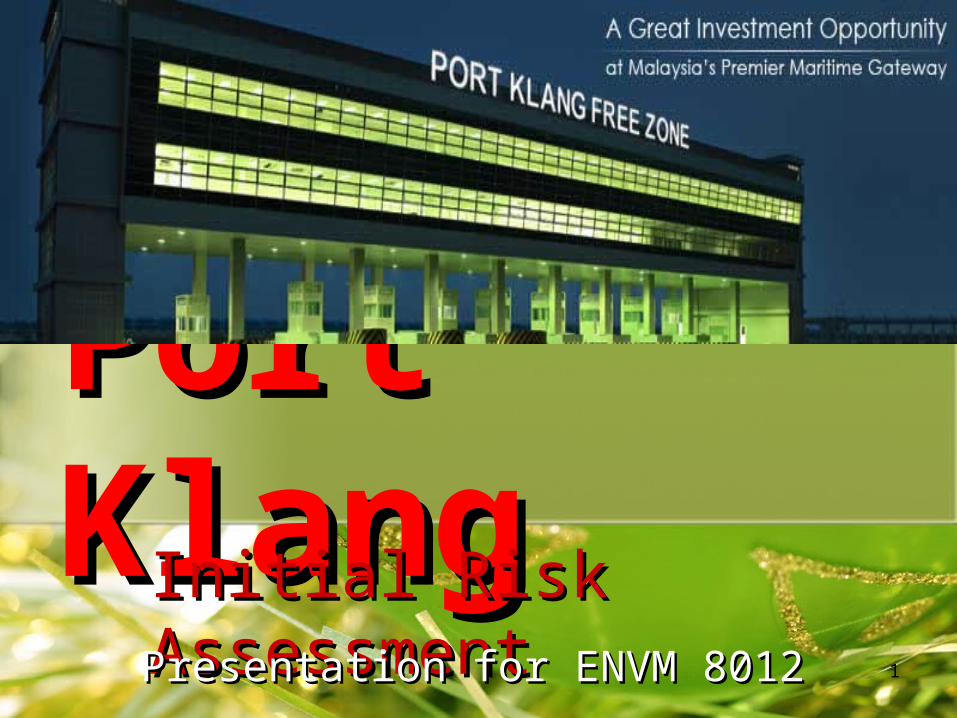
1 port klang initial risk assessment presentation for envm 8012
TRANSCRIPT
1
Port Port KlangKlangInitial Risk AssessmentInitial Risk Assessment
Presentation for ENVM 8012Presentation for ENVM 8012
2
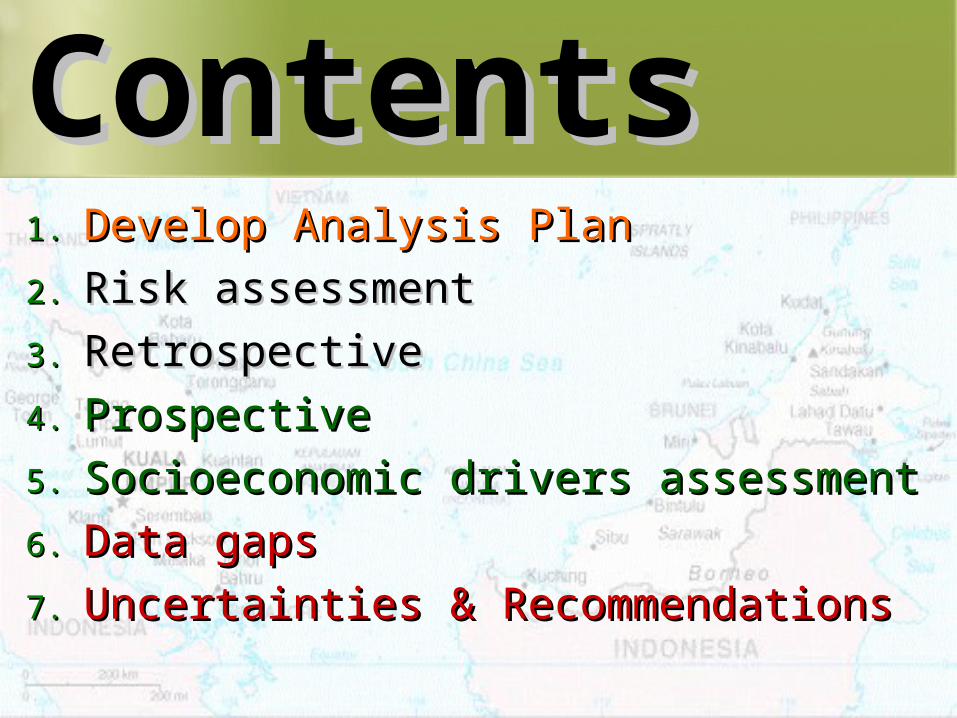
ContentsContents1.1. Develop Analysis PlanDevelop Analysis Plan
2.2. Risk assessmentRisk assessment
3.3. RetrospectiveRetrospective
4.4. Prospective Prospective
5.5. Socioeconomic drivers assessment Socioeconomic drivers assessment
6.6. Data gapsData gaps
7.7. Uncertainties & Recommendations Uncertainties & Recommendations
3
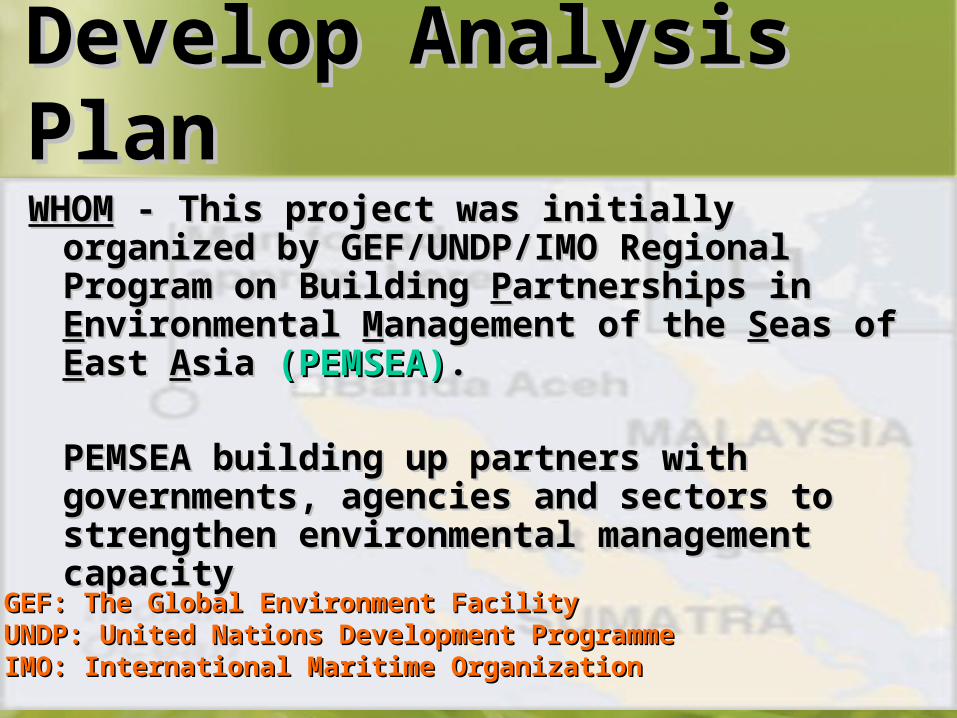
WHOMWHOM - This project was initially - This project was initially organized by GEF/UNDP/IMO Regional organized by GEF/UNDP/IMO Regional Program on Building Program on Building PPartnerships in artnerships in EEnvironmental nvironmental MManagement of the anagement of the SSeas eas of of EEast ast AAsia sia (PEMSEA)(PEMSEA). .
PEMSEA building up partners with PEMSEA building up partners with governments, agencies and sectors to governments, agencies and sectors to strengthen environmental management strengthen environmental management capacitycapacity
Develop Analysis Develop Analysis PlanPlan
GEF: The Global Environment FacilityGEF: The Global Environment FacilityUNDP: United Nations Development ProgrammeUNDP: United Nations Development ProgrammeIMO: International Maritime OrganizationIMO: International Maritime Organization

4
HOWHOW – Conduct Initial Risk – Conduct Initial Risk Assessment with collaboration with Assessment with collaboration with several government departments. several government departments.
WHYWHY – economic growth – economic growth contaminantscontaminants
Develop Analysis Develop Analysis PlanPlan
5
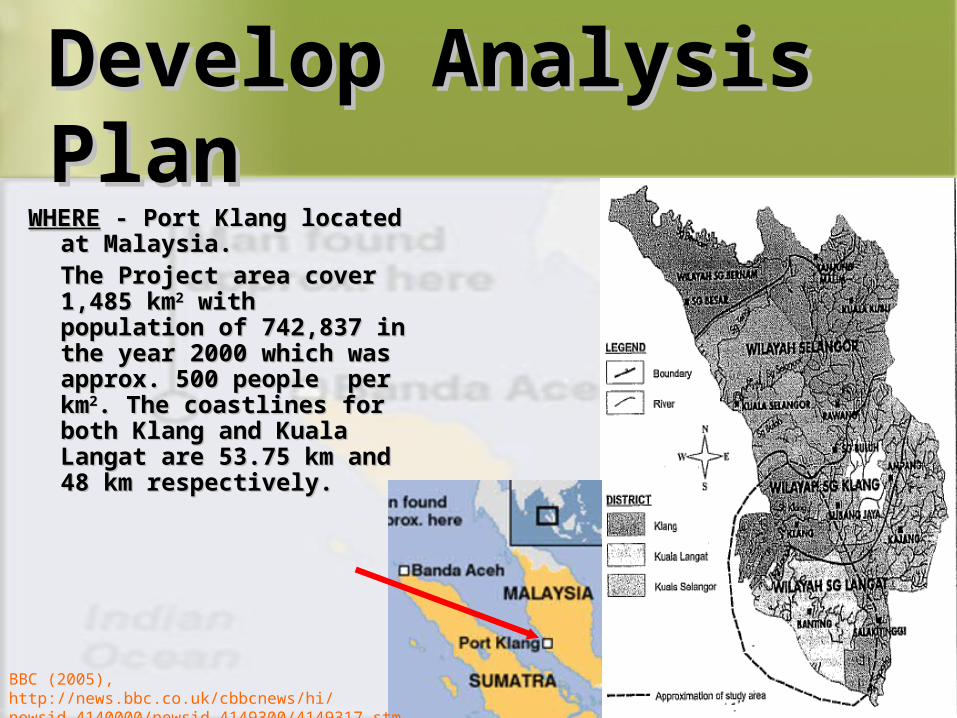
WHEREWHERE - Port Klang - Port Klang located at Malaysia.located at Malaysia.The Project area cover The Project area cover 1,485 km1,485 km22 with with population of 742,837 in population of 742,837 in the year 2000 which was the year 2000 which was approx. 500 people per approx. 500 people per kmkm22. The coastlines for . The coastlines for both Klang and Kuala both Klang and Kuala Langat are 53.75 km Langat are 53.75 km and 48 km respectively.and 48 km respectively.
Develop Analysis Develop Analysis PlanPlan
BBC (2005), http://news.bbc.co.uk/cbbcnews/hi/newsid_4140000/newsid_4149300/4149317.stm
6
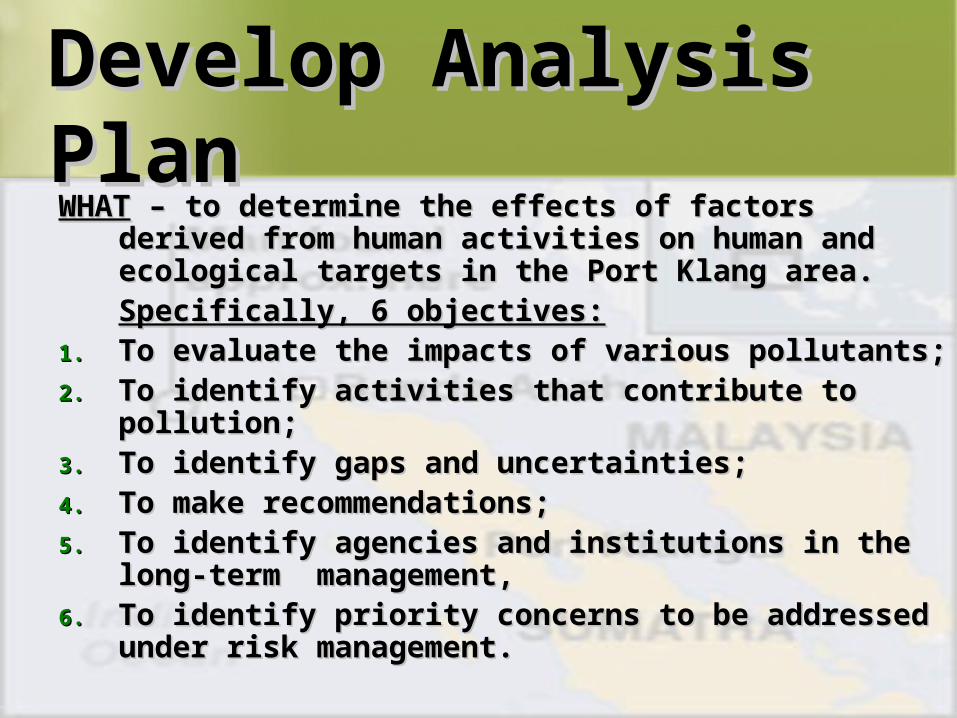
WHATWHAT – to determine the effects of factors – to determine the effects of factors derived from human activities on human and derived from human activities on human and ecological targets in the Port Klang area. ecological targets in the Port Klang area. Specifically, 6 objectives:Specifically, 6 objectives:
1.1. To evaluate the impacts of various pollutants;To evaluate the impacts of various pollutants;2.2. To identify activities that contribute to To identify activities that contribute to
pollution;pollution;3.3. To identify gaps and uncertainties;To identify gaps and uncertainties;4.4. To make recommendations;To make recommendations;5.5. To identify agencies and institutions in the To identify agencies and institutions in the
long-term management,long-term management,6.6. To identify priority concerns to be addressed To identify priority concerns to be addressed
under risk management.under risk management.
Develop Analysis Develop Analysis PlanPlan
7
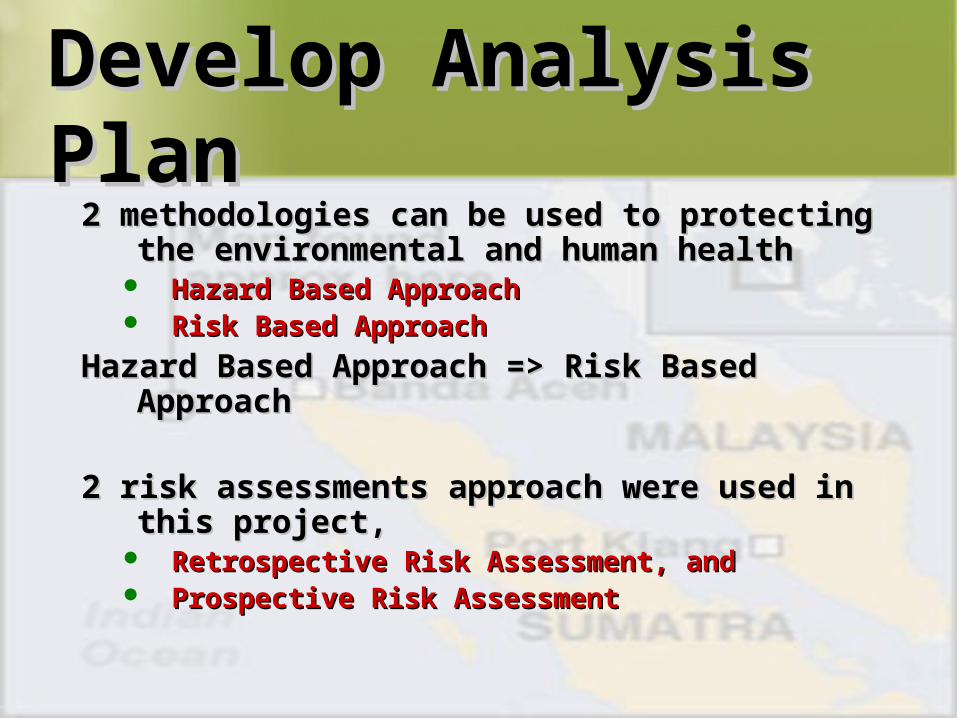
2 methodologies can be used to 2 methodologies can be used to protecting the environmental and protecting the environmental and human healthhuman health
Hazard Based ApproachHazard Based Approach Risk Based ApproachRisk Based Approach
Hazard Based Approach => Risk Based Hazard Based Approach => Risk Based ApproachApproach
2 risk assessments approach were used 2 risk assessments approach were used in this project,in this project,
Retrospective Risk Assessment, and Retrospective Risk Assessment, and Prospective Risk AssessmentProspective Risk Assessment
Develop Analysis Develop Analysis PlanPlan
8
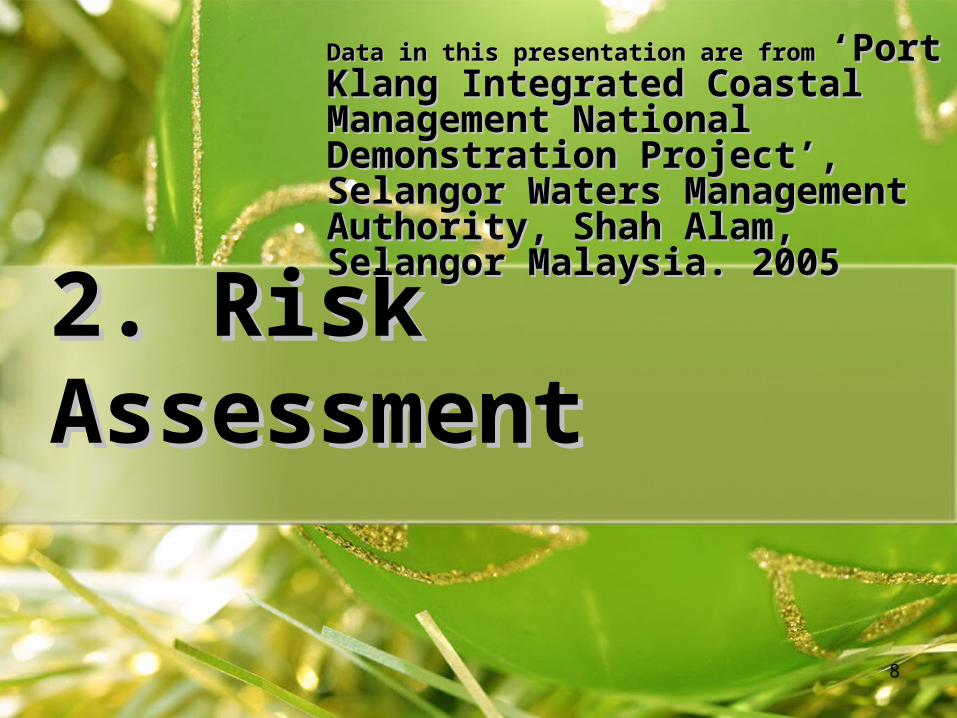
2. Risk 2. Risk AssessmentAssessment
Data in this presentation are from Data in this presentation are from ‘Port Klang ‘Port Klang Integrated Coastal Management Integrated Coastal Management National Demonstration Project’, National Demonstration Project’, Selangor Waters Management Selangor Waters Management Authority, Shah Alam, Selangor Authority, Shah Alam, Selangor Malaysia. 2005Malaysia. 2005
9
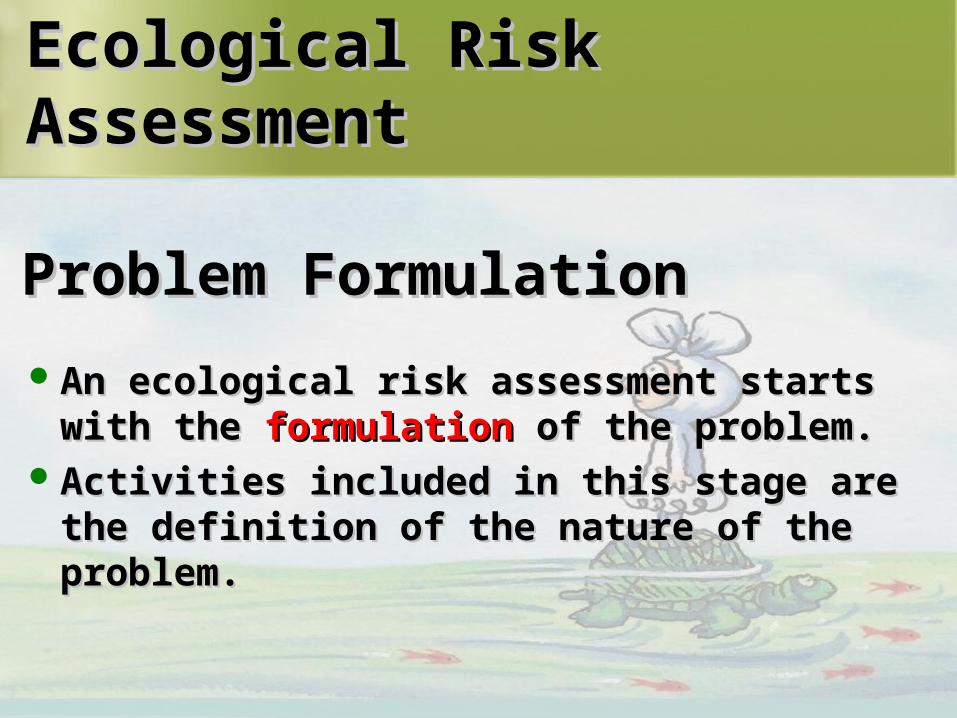
Problem FormulationProblem Formulation
An ecological risk assessment starts with An ecological risk assessment starts with the the formulationformulation of the problem. of the problem.
Activities included in this stage are the Activities included in this stage are the definition of the nature of the problem. definition of the nature of the problem.
Ecological Risk Ecological Risk AssessmentAssessment

10
Problem FormulationProblem Formulation
The Source What is the source?
Stressors What types of stressors are presented?
Exposure When? For how long? What was the intensity and distribution?
Ecosystem at risk What ecosystems are at risk?Where? Why?
Possible ecological effects
What are the possible effects associated to the pointed stressors?
11
3. Retrospective 3. Retrospective Assessment Assessment
12
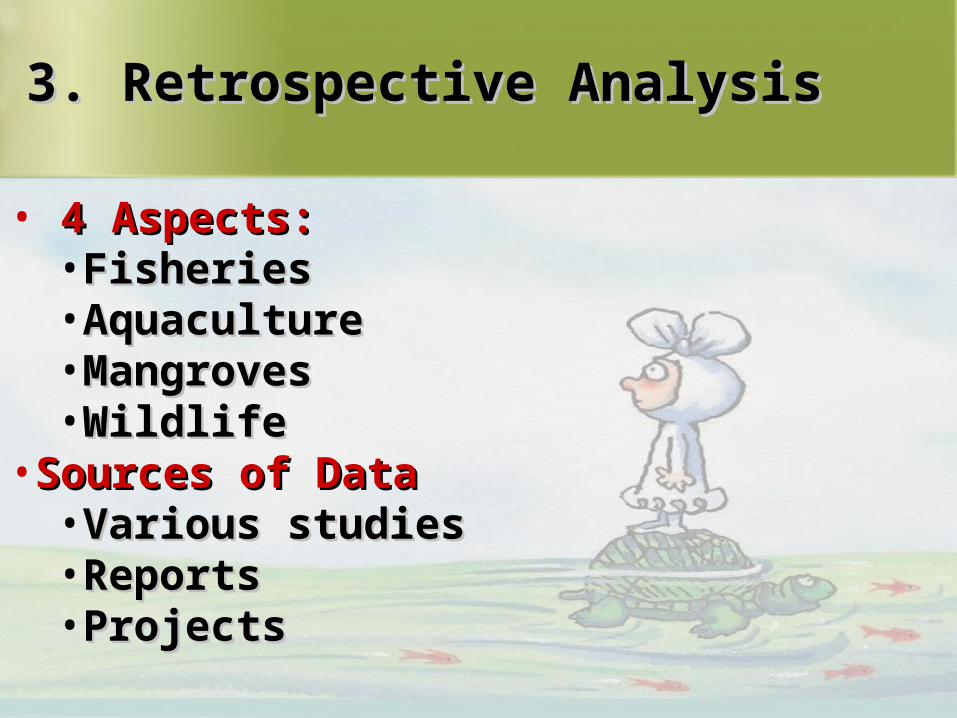
3. Retrospective Analysis3. Retrospective Analysis
• 4 Aspects:4 Aspects:•FisheriesFisheries•AquacultureAquaculture•MangrovesMangroves•WildlifeWildlife
•Sources of DataSources of Data•Various studiesVarious studies•ReportsReports•ProjectsProjects
13
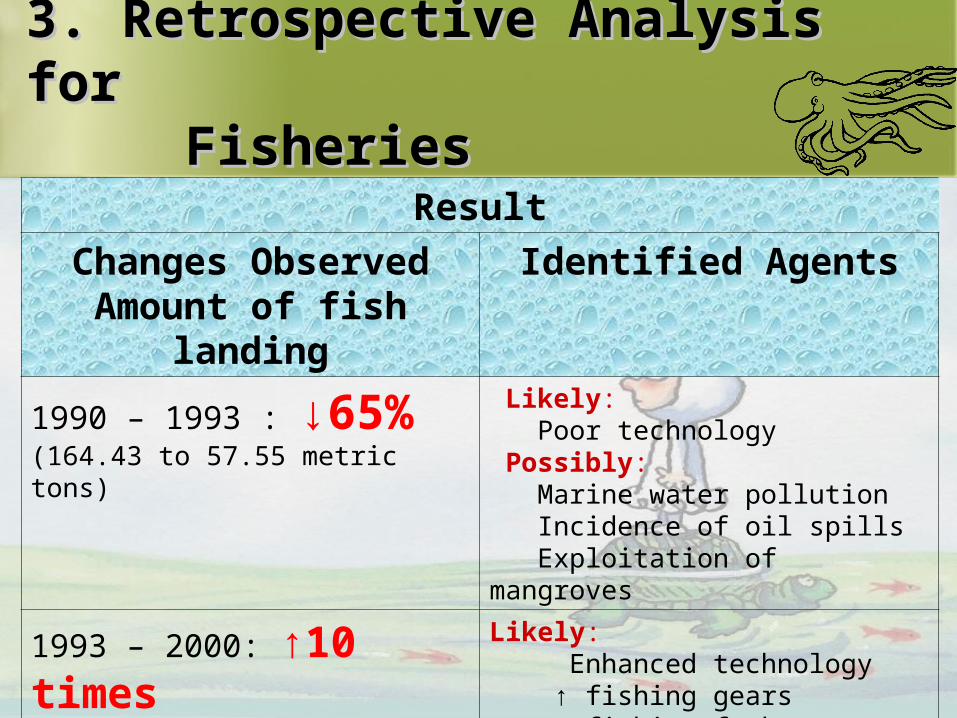
3. Retrospective Analysis for3. Retrospective Analysis for Fisheries Fisheries
Result
Changes ObservedAmount of fish
landing
Identified Agents
1990 – 1993 : ↓65%(164.43 to 57.55 metric tons)
Likely: Poor technologyPossibly: Marine water pollution Incidence of oil spills Exploitation of mangroves
1993 – 2000: ↑10 times(141.37 to 1,579.34 metric tons)
Likely: Enhanced technology ↑ fishing gears ↑ fishing forks
14
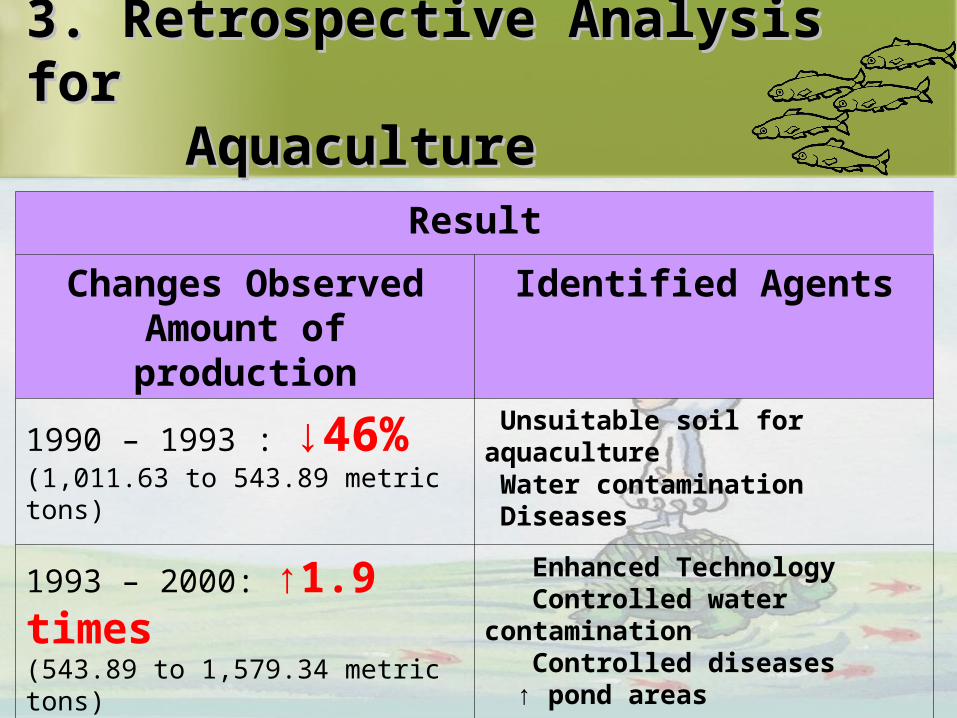
3. Retrospective Analysis for 3. Retrospective Analysis for Aquaculture Aquaculture
Result
Changes ObservedAmount of production
Identified Agents
1990 – 1993 : ↓46%(1,011.63 to 543.89 metric tons)
Unsuitable soil for aquacultureWater contaminationDiseases
1993 – 2000: ↑1.9 times(543.89 to 1,579.34 metric tons)
Enhanced Technology Controlled water
contamination Controlled diseases ↑ pond areas
15
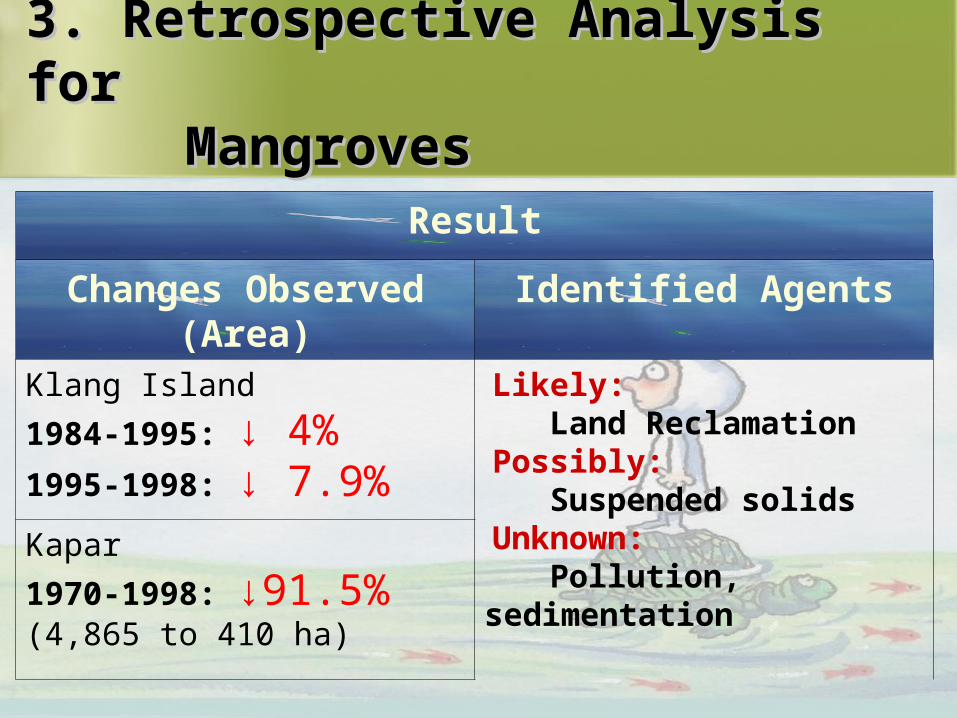
3. Retrospective Analysis for3. Retrospective Analysis for Mangroves Mangroves
Result
Changes Observed(Area)
Identified Agents
Klang Island
1984-1995: ↓ 4%1995-1998: ↓ 7.9%
Likely: Land ReclamationPossibly: Suspended solidsUnknown: Pollution, sedimentation
Kapar
1970-1998: ↓91.5%(4,865 to 410 ha)
16
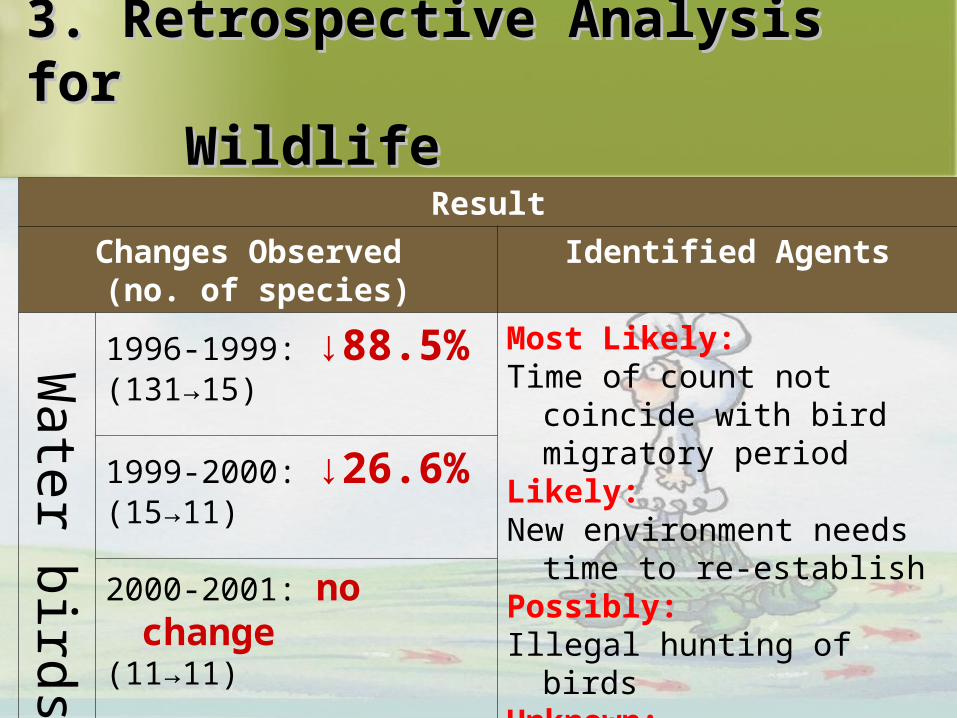
3. Retrospective Analysis for3. Retrospective Analysis for Wildlife Wildlife
Result
Changes Observed (no. of species)
Identified Agents
Wate
r bird
s
1996-1999: ↓88.5%(131→15)
Most Likely:Time of count not coincide
with bird migratory period
Likely: New environment needs
time to re-establish Possibly: Illegal hunting of birdsUnknown: Environmental pollution
1999-2000: ↓26.6%(15→11)
2000-2001: no change
(11→11)

17
ResultResult
Changes Observed Changes Observed (no. of species)(no. of species)
Identified AgentsIdentified Agents
Aq
uatic
Fau
na
Peat swamp forestPrimary ForestMangrove Forest
Land clearingReclamationSelective loggingMiningAgriculturehunting
Mam
mal
s
Decline no. of species in the above habitat
3. Retrospective Analysis 3. Retrospective Analysis forfor Wildlife Wildlife
18
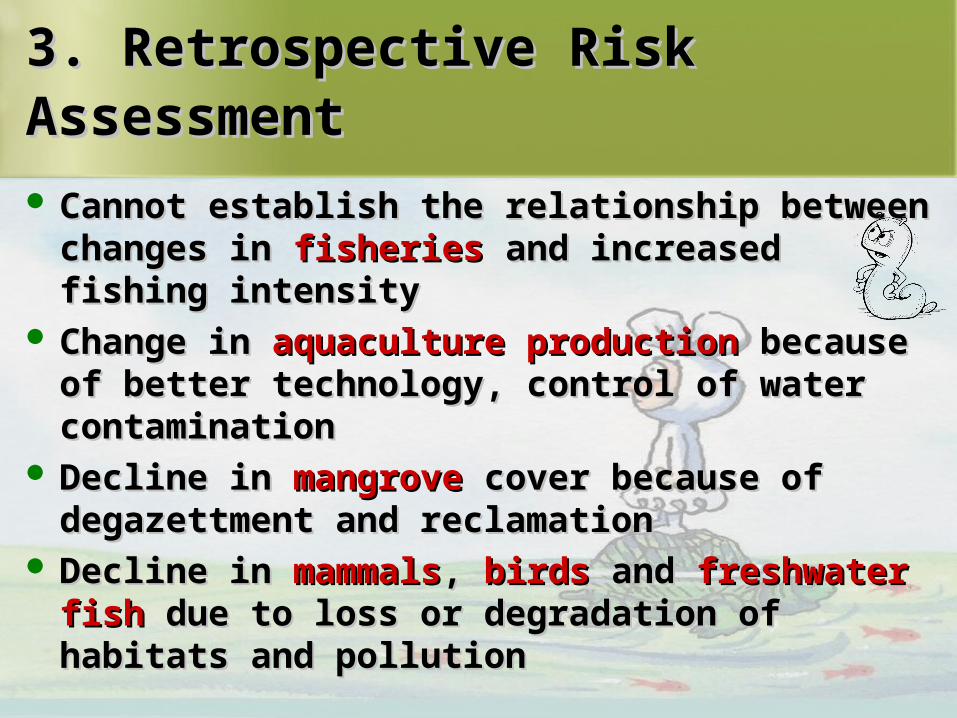
3. Retrospective Risk 3. Retrospective Risk AssessmentAssessment Cannot establish the relationship between Cannot establish the relationship between
changes in changes in fisheriesfisheries and increased fishing and increased fishing intensity intensity
Change in Change in aquaculture productionaquaculture production because because of of better technologybetter technology, , control of water control of water contamination contamination
Decline in Decline in mangrovemangrove cover because of cover because of degazettment and reclamation degazettment and reclamation
Decline in Decline in mammalsmammals, , birdsbirds and and freshwater freshwater fishfish due to loss or degradation of habitats due to loss or degradation of habitats and pollutionand pollution
19
4. Prospective 4. Prospective Risk Risk Assessment Assessment
20
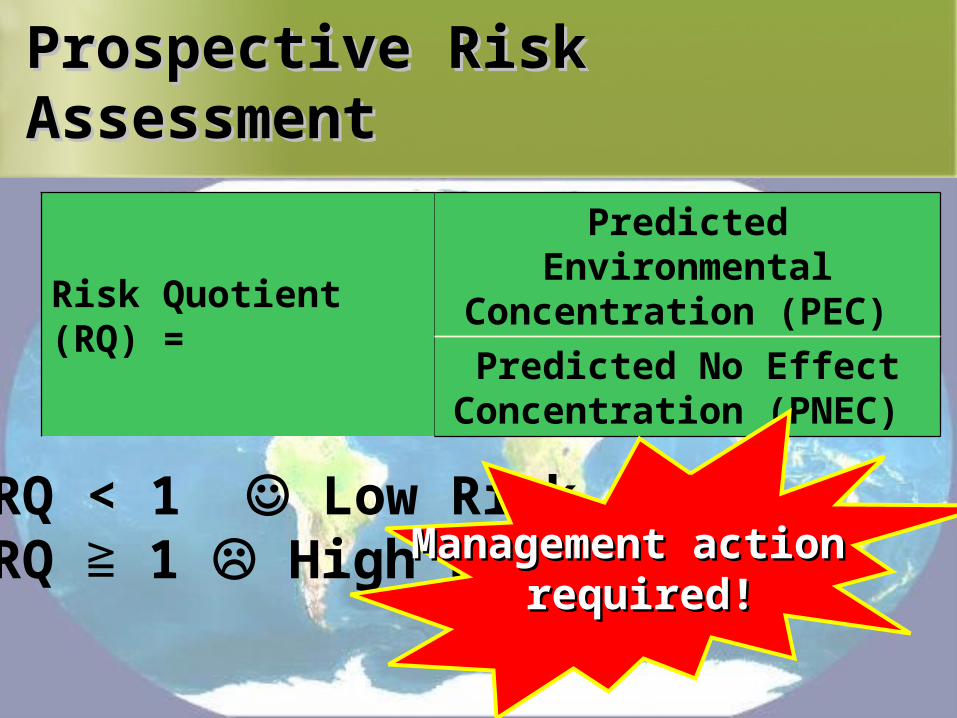
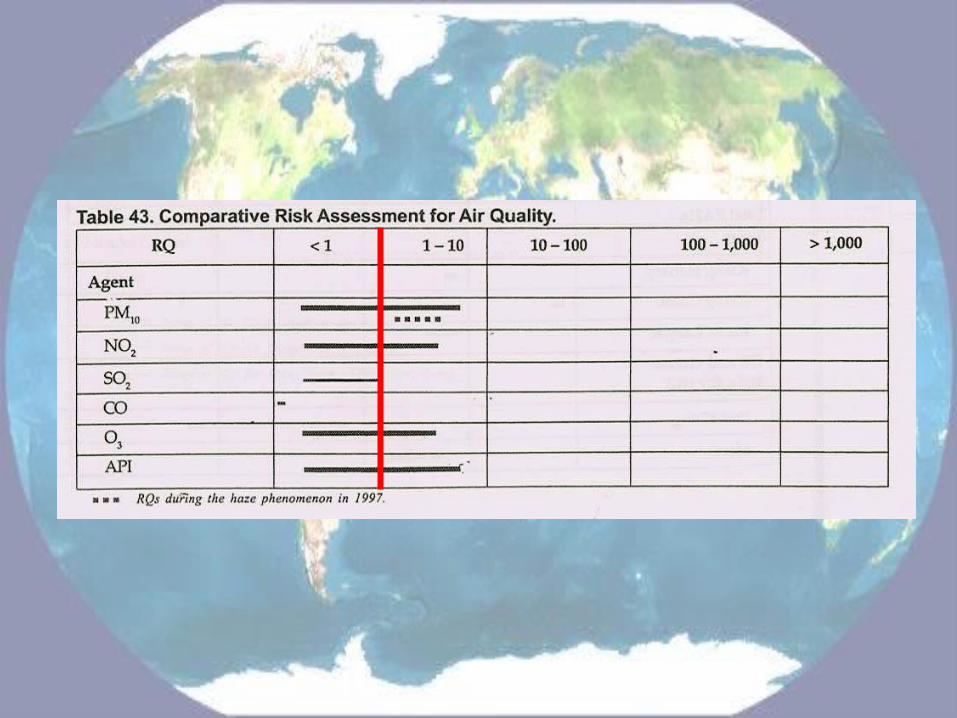
Prospective Risk Prospective Risk AssessmentAssessment
Risk Quotient (RQ) =
Predicted Environmental Concentration (PEC)
Predicted No Effect Concentration (PNEC)
RQ < 1 Low Risk RQ ≧ 1 High Risk Management action Management action
required!required!
21
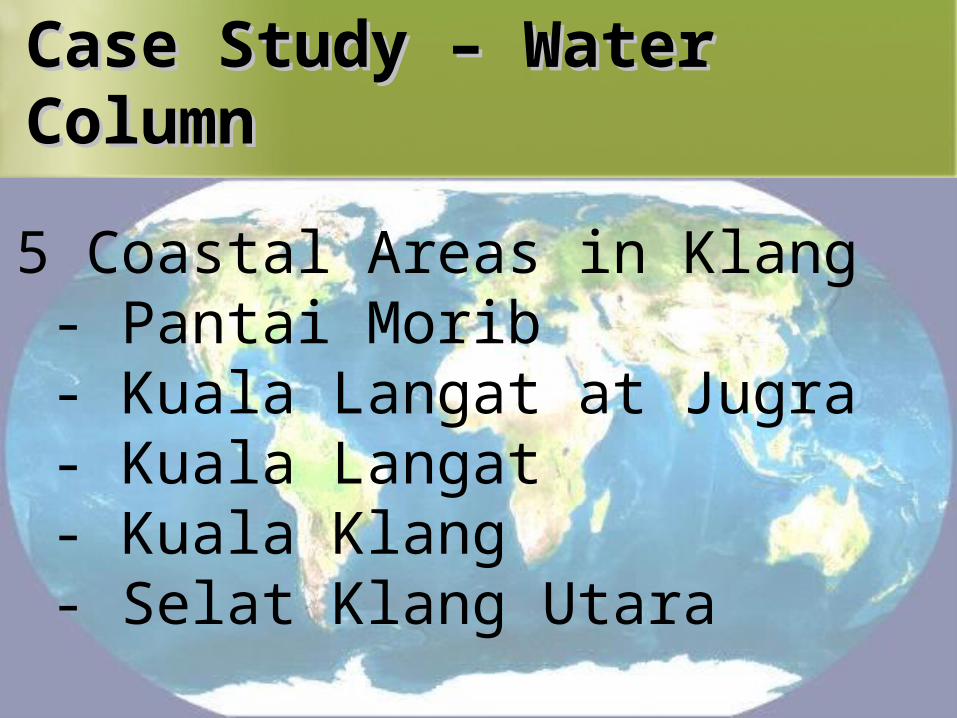
Case Study – Water Case Study – Water ColumnColumn
5 Coastal Areas in Klang - Pantai Morib - Kuala Langat at Jugra - Kuala Langat - Kuala Klang - Selat Klang Utara

22
23

24
25
26
27
5. 5. Risk and Socio-Risk and Socio-economic economic Drivers Drivers
28
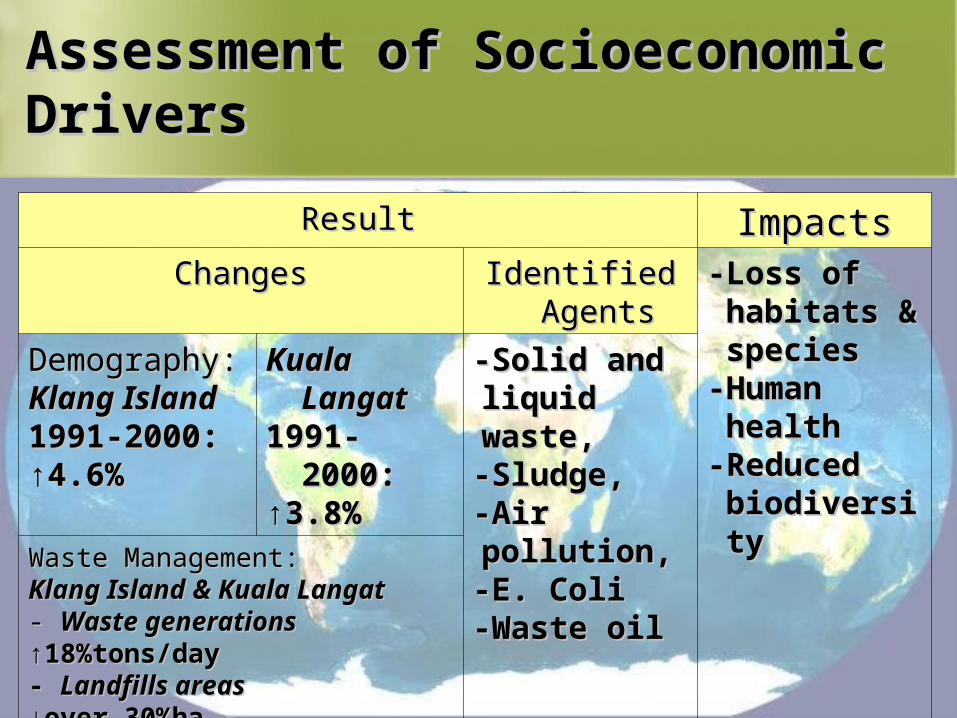
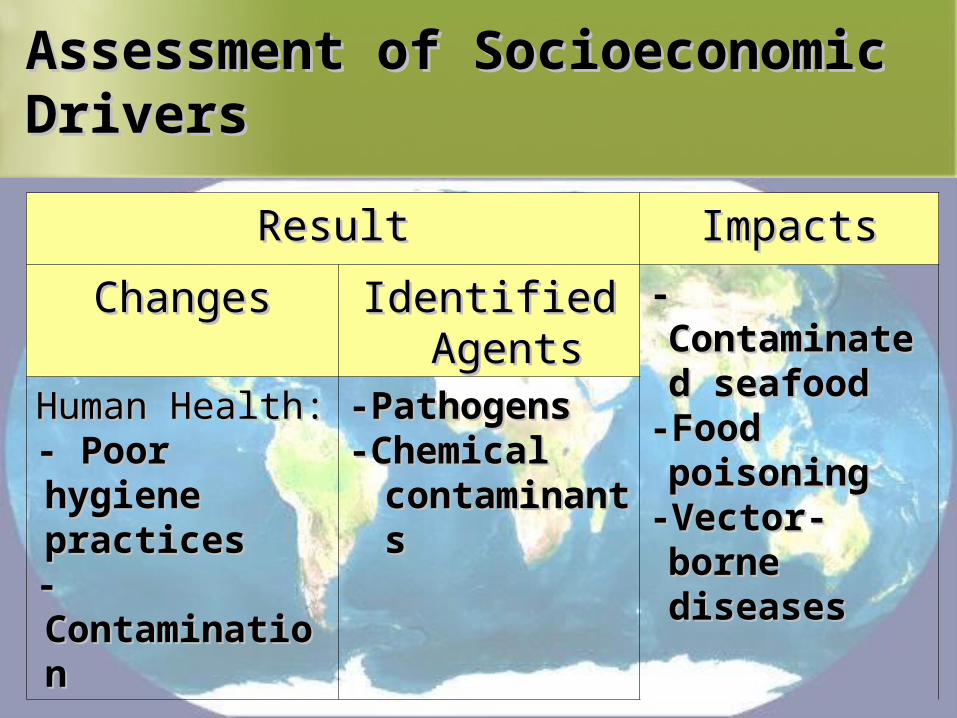
Assessment of Assessment of Socioeconomic DriversSocioeconomic Drivers
ResultResult ImpactsImpactsChangesChanges Identified Identified
AgentsAgents-Loss of -Loss of habitats & habitats & speciesspecies
-Human -Human healthhealth
-Reduced -Reduced biodiversitbiodiversityy
Demography:Demography:Klang Klang
IslandIsland1991-2000: 1991-2000: ↑↑4.6%4.6%
Kuala Kuala LangatLangat
1991-1991-2000: 2000:
↑↑3.8%3.8%
-Solid and -Solid and liquid liquid waste, waste, -Sludge, -Sludge, -Air -Air pollution, pollution, -E. Coli -E. Coli -Waste oil-Waste oil
Waste Management:Waste Management:Klang Island & Kuala Klang Island & Kuala
LangatLangat- - Waste generationsWaste generations↑↑18%tons/day18%tons/day- - Landfills areasLandfills areas↓↓over 30%haover 30%ha
29
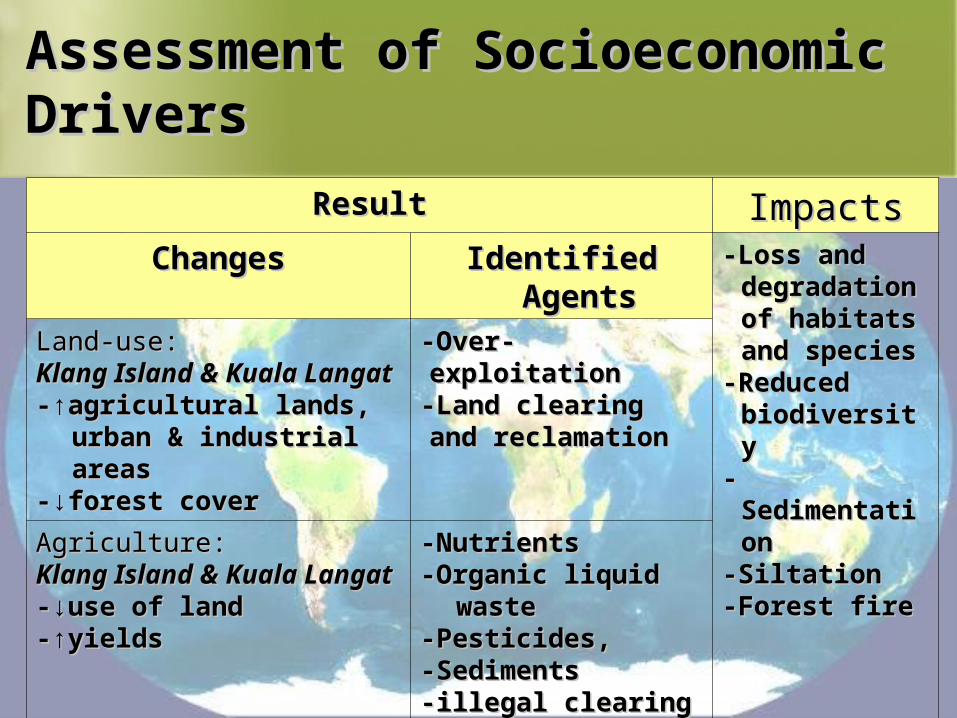
Assessment of Assessment of Socioeconomic DriversSocioeconomic Drivers
ResultResult ImpactsImpactsChangesChanges Identified Identified
AgentsAgents-Loss and -Loss and
degradation degradation of habitats of habitats and speciesand species
-Reduced -Reduced biodiversitybiodiversity
--SedimentatiSedimentationon
-Siltation-Siltation-Forest fire-Forest fire
Land-use:Land-use:Klang Island & Kuala Klang Island & Kuala
LangatLangat-↑agricultural lands, -↑agricultural lands,
urban & industrial urban & industrial areasareas
-↓forest cover-↓forest cover
-Over-exploitation-Over-exploitation-Land clearing and -Land clearing and reclamationreclamation
Agriculture:Agriculture:Klang Island & Kuala Klang Island & Kuala
LangatLangat-↓use of land -↓use of land -↑yields-↑yields
-Nutrients -Nutrients -Organic liquid -Organic liquid
wastewaste-Pesticides, -Pesticides, -Sediments-Sediments-illegal clearing-illegal clearing
30
Assessment of Assessment of Socioeconomic DriversSocioeconomic Drivers
ResultResult ImpactsImpacts
ChangesChanges Identified Identified AgentsAgents
--ContaminatContaminated seafooded seafood
-Food -Food poisoningpoisoning
-Vector--Vector-borne borne diseasesdiseases
Human HealthHuman Health::- Poor - Poor hygiene hygiene practicespractices- - ContaminatioContaminationn
-Pathogens-Pathogens-Chemical -Chemical
contaminacontaminantsnts

31
6. 6. Data Data GapsGaps
32
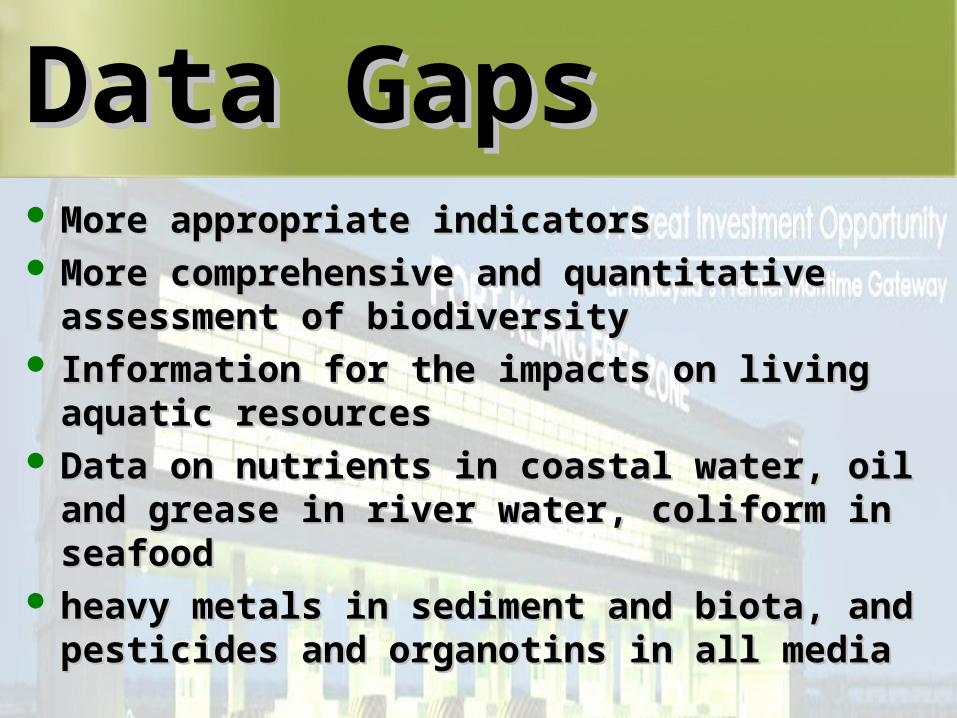
Data GapsData Gaps
More appropriate indicators More appropriate indicators More comprehensive and quantitative More comprehensive and quantitative
assessment of biodiversity assessment of biodiversity Information for the impacts on living Information for the impacts on living
aquatic resources aquatic resources Data on nutrients in coastal water, oil Data on nutrients in coastal water, oil
and grease in river water, coliform in and grease in river water, coliform in seafood seafood
heavy metals in sediment and biota, and heavy metals in sediment and biota, and pesticides and organotins in all media pesticides and organotins in all media
33
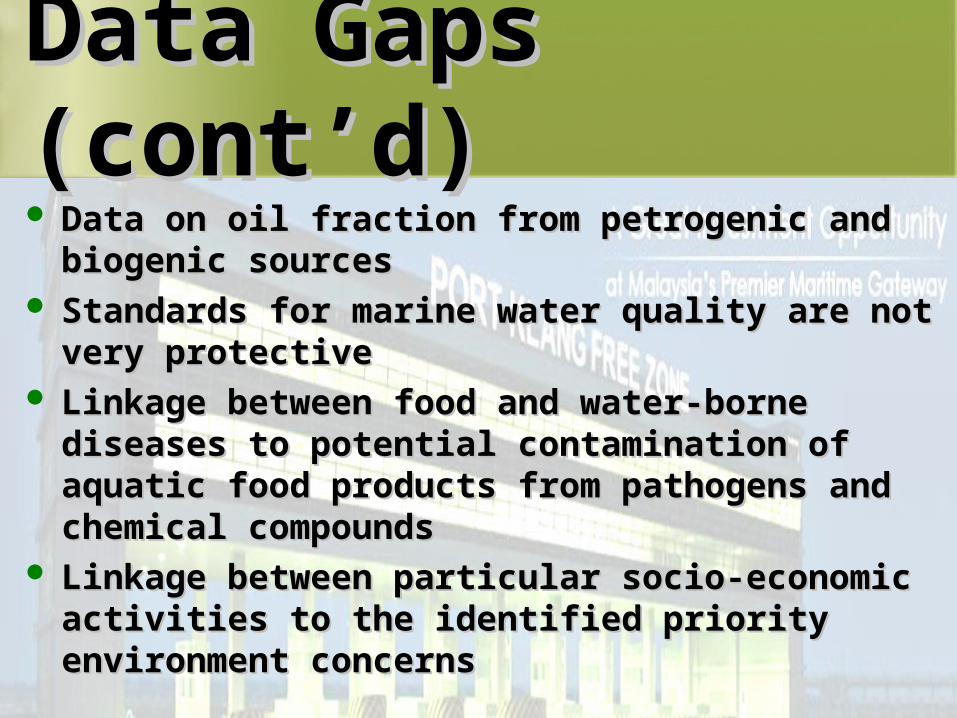
Data GapsData Gaps (cont’d)(cont’d) Data on oil fraction from petrogenic and Data on oil fraction from petrogenic and
biogenic sources biogenic sources Standards for marine water quality are not Standards for marine water quality are not
very protective very protective Linkage between food and water-borne Linkage between food and water-borne
diseases to potential contamination of diseases to potential contamination of aquatic food products from pathogens and aquatic food products from pathogens and chemical compoundschemical compounds
Linkage between particular socio-economic Linkage between particular socio-economic activities to the identified priority activities to the identified priority environment concerns environment concerns

34
7. Uncertainties & 7. Uncertainties & RecommendationsRecommendations
35
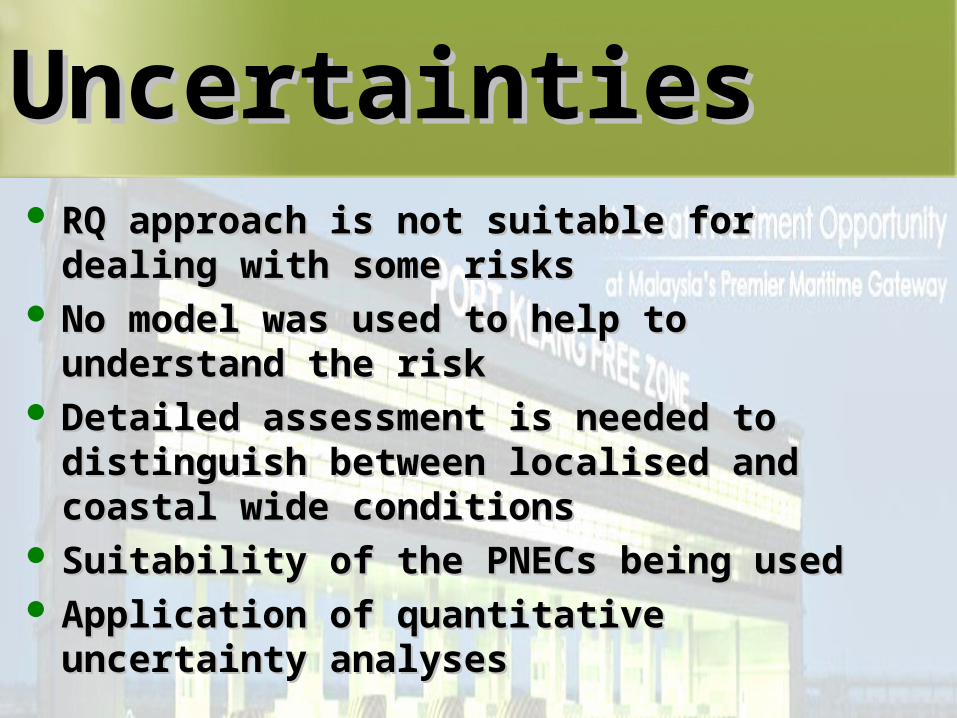
UncertaintiesUncertainties RQ approach is not suitable for dealing RQ approach is not suitable for dealing
with with some some risks risks No model was used to help to No model was used to help to
understand the riskunderstand the risk DetailDetaileded assessment is needed to assessment is needed to
distinguish between localised and distinguish between localised and coastal wide conditions coastal wide conditions
Suitability of the PNECs being used Suitability of the PNECs being used Application of quantitative uncertainty Application of quantitative uncertainty
analyses analyses

36
RecommendatioRecommendationsns On socio-economic driversOn socio-economic drivers: : further assessmentfurther assessmentss on waste management, industrial on waste management, industrial
development, agriculture and land use development, agriculture and land use On Ecological and Human Health RisksOn Ecological and Human Health Risks: : 1.1. Prioritize contaminants for risk managementPrioritize contaminants for risk management2.2. Prioritize the management of sewage discharge Prioritize the management of sewage discharge 3.3. Control for discharges of untreated wastes in the Control for discharges of untreated wastes in the
coastal area starting from the catchmentscoastal area starting from the catchments4.4. Conduct systematic monitoring on exposure to Conduct systematic monitoring on exposure to
contaminants of the seafoodcontaminants of the seafood5.5. Collect the data on heavy metals, pesticides and TBT Collect the data on heavy metals, pesticides and TBT
in water column, sediment and seafood in the coastal in water column, sediment and seafood in the coastal areasareas
37
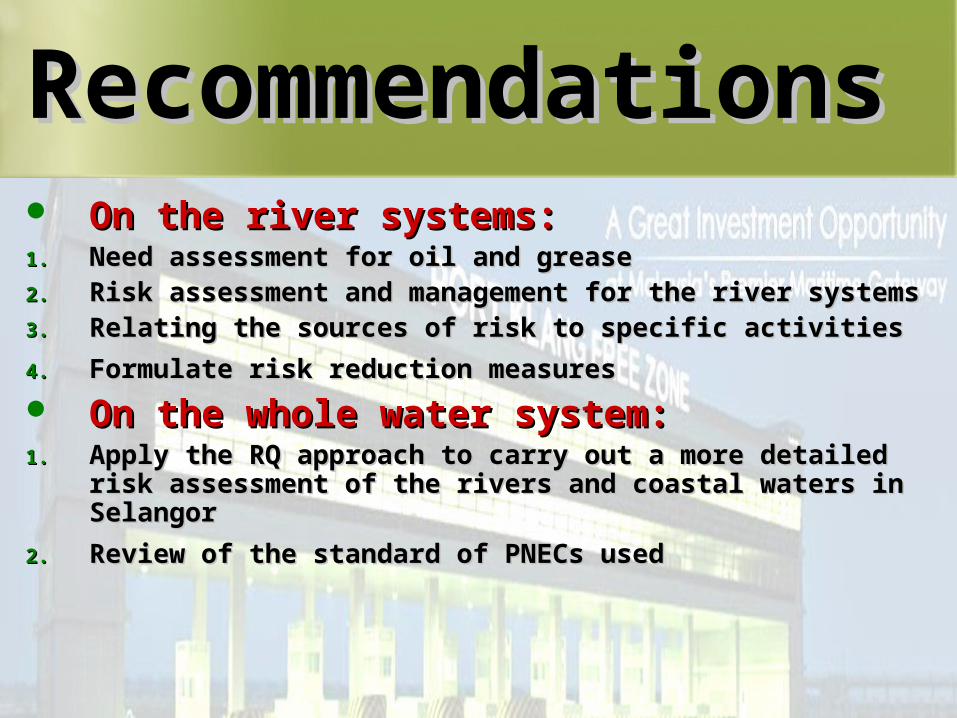
On the river systemsOn the river systems::1.1. Need assessment for oil and greaseNeed assessment for oil and grease2.2. Risk assessment and management for the river Risk assessment and management for the river
systemssystems3.3. Relating the sources of risk to specific activities Relating the sources of risk to specific activities
4.4. Formulate risk reduction measuresFormulate risk reduction measures On the whole On the whole water water systemsystem::1.1. Apply the RQ approach to carry out a more detailed Apply the RQ approach to carry out a more detailed
risk assessment of the rivers and coastal waters in risk assessment of the rivers and coastal waters in SelangorSelangor
2.2. Review of the standard of PNECs usedReview of the standard of PNECs used
RecommendatioRecommendationsns

38
On resources and habitatsOn resources and habitats:: Fisheries Fisheries 1.1. Use of CPUE, stock density, demersal biomass and Use of CPUE, stock density, demersal biomass and
change in catch composition to monitor and change in catch composition to monitor and assessment assessment
2.2. Estimate the MSY (maximum sustainable yield) and to Estimate the MSY (maximum sustainable yield) and to determine the current conditiondetermine the current condition
3.3. Evaluate the management frameworkEvaluate the management framework
RecommendatioRecommendationsns
39
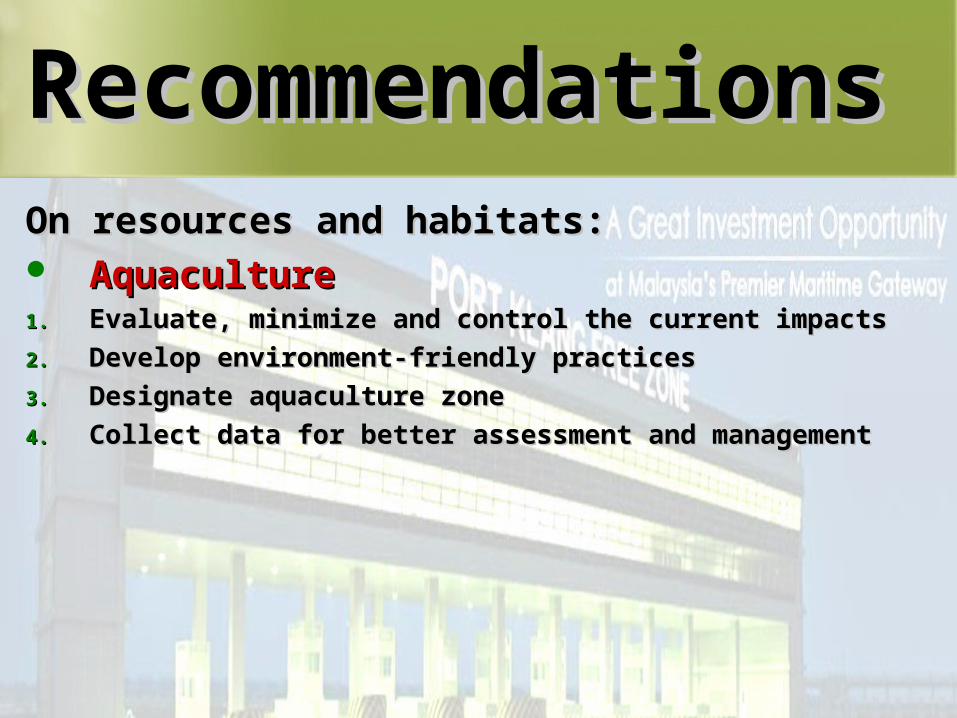
On resources and habitatsOn resources and habitats:: Aquaculture Aquaculture 1.1. Evaluate, minimize and control the current Evaluate, minimize and control the current iimpacts mpacts
2.2. Develop environment-friendly practicesDevelop environment-friendly practices
3.3. Designate aquaculture zoneDesignate aquaculture zone
4.4. Collect data for better assessment and management Collect data for better assessment and management
RecommendatioRecommendationsns
40
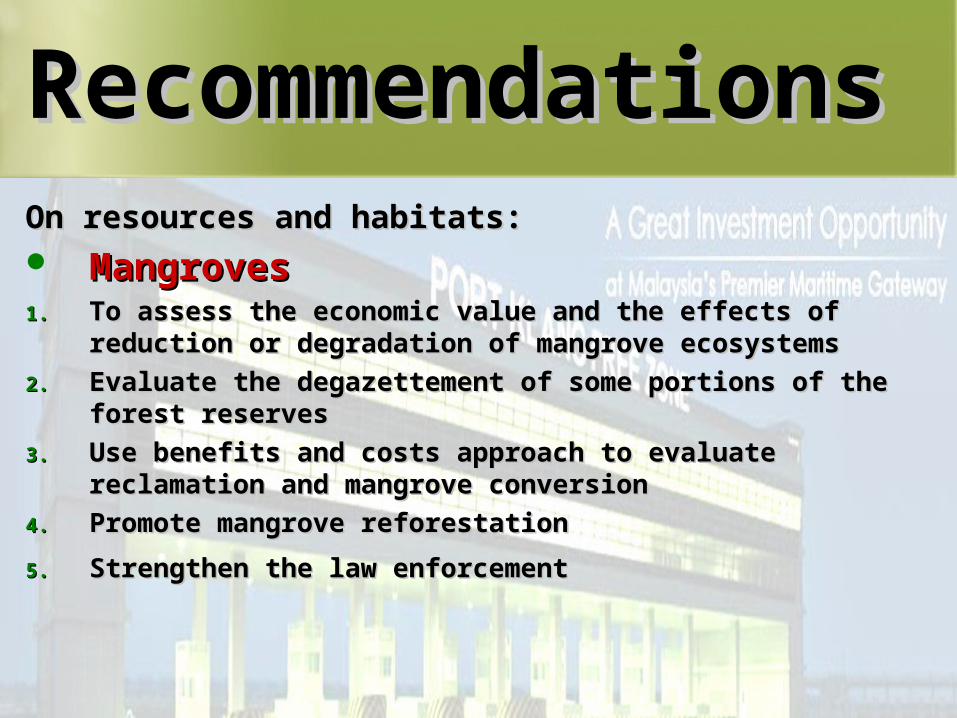
On resources and habitatsOn resources and habitats:: MangrovesMangroves 1.1. To assess the economic value To assess the economic value and the and the effects of effects of
reduction or degradation of mangrove ecosystems reduction or degradation of mangrove ecosystems
2.2. Evaluate the degazettement of some portions of the Evaluate the degazettement of some portions of the forestforest reserves reserves
3.3. Use benefits and costs approach to evaluate Use benefits and costs approach to evaluate reclamation and mangrove conversionreclamation and mangrove conversion
4.4. Promote mangrove reforestation Promote mangrove reforestation
5.5. Strengthen the law enforcementStrengthen the law enforcement
RecommendatioRecommendationsns
41
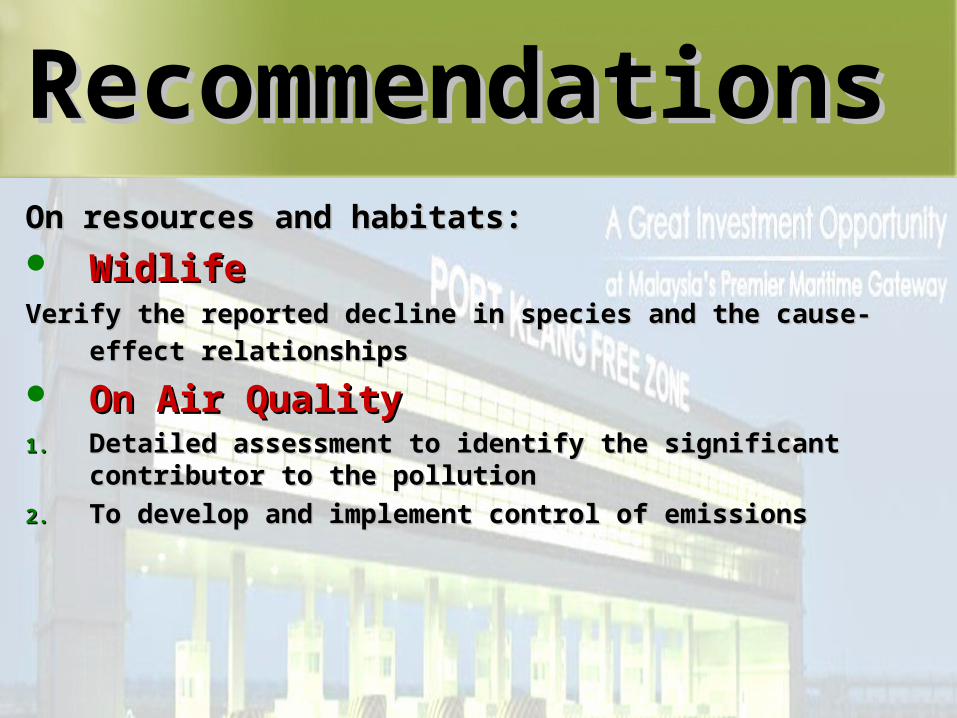
On resources and habitatsOn resources and habitats:: WidlifeWidlifeVerify the reported decline in species and the cause-effect Verify the reported decline in species and the cause-effect
relationshipsrelationships On Air QualityOn Air Quality 1.1. Detailed assessment to identify the significant Detailed assessment to identify the significant
contributor to the pollution contributor to the pollution
2.2. To develop and implement control of emissionsTo develop and implement control of emissions
RecommendatioRecommendationsns
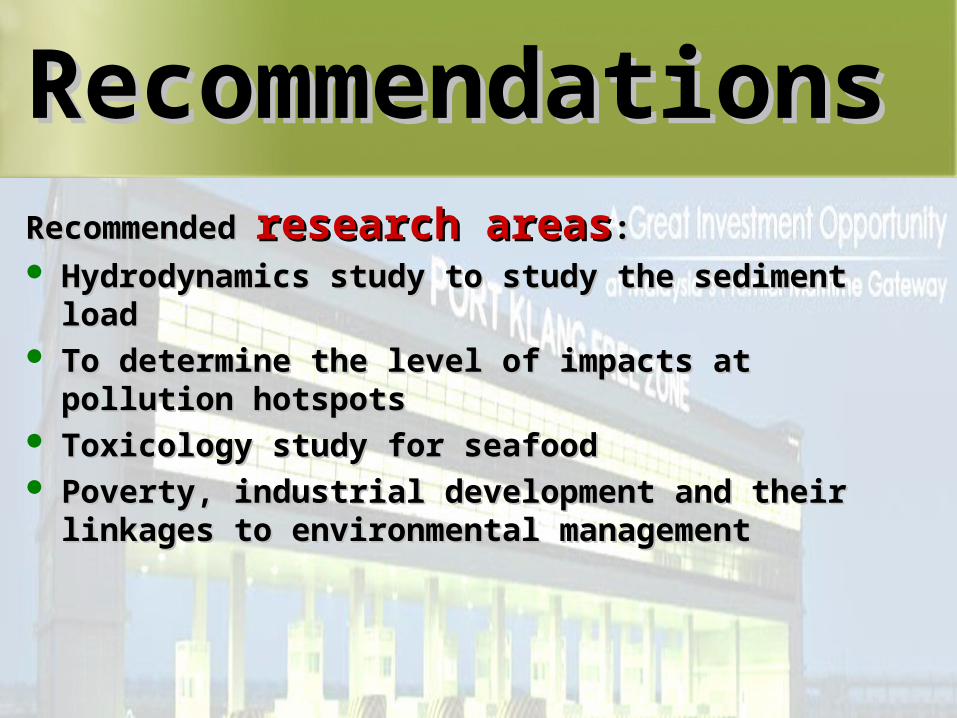
42
Recommended Recommended research areasresearch areas: : Hydrodynamics study to study the sediment Hydrodynamics study to study the sediment
loadload To determine the level of impacts at pollution To determine the level of impacts at pollution
hotspotshotspots Toxicology study for seafoodToxicology study for seafood Poverty, industrial development and their Poverty, industrial development and their
linkages to environmental management linkages to environmental management
RecommendatioRecommendationsns
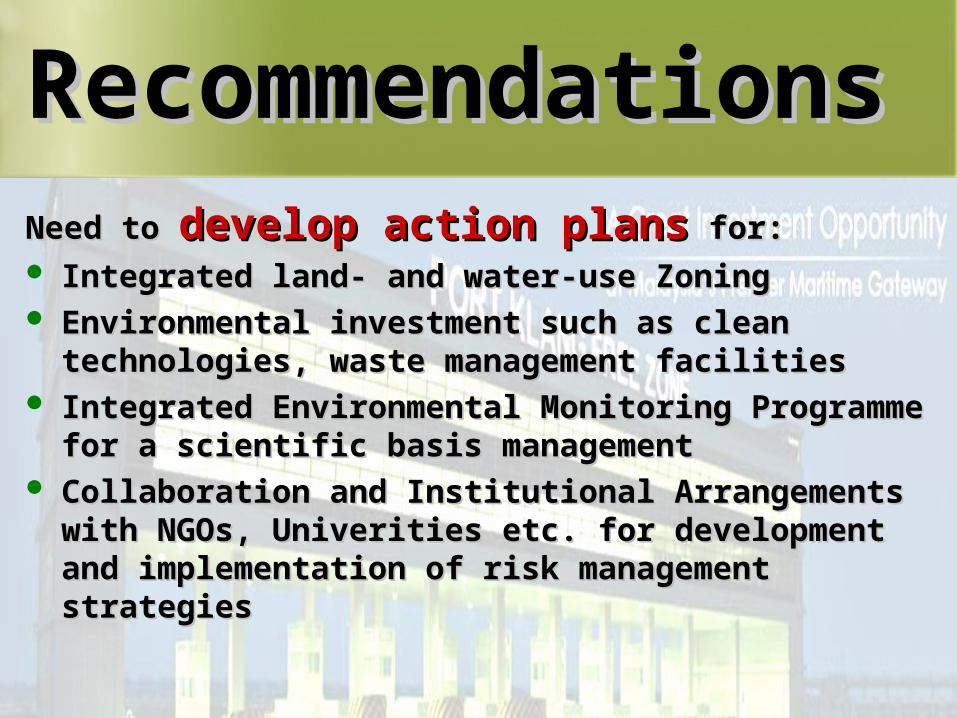
43
Need to Need to develop action develop action planplanss for: for: Integrated land- and water-use ZoningIntegrated land- and water-use Zoning Environmental investment such as clean Environmental investment such as clean
technologies, waste management facilitiestechnologies, waste management facilities Integrated Environmental Monitoring Integrated Environmental Monitoring
Programme for a scientific basis managementProgramme for a scientific basis management Collaboration and Institutional Arrangements Collaboration and Institutional Arrangements
with NGOs, Univerities etc. for development with NGOs, Univerities etc. for development and implementation of risk management and implementation of risk management strategies strategies
RecommendatioRecommendationsns
44
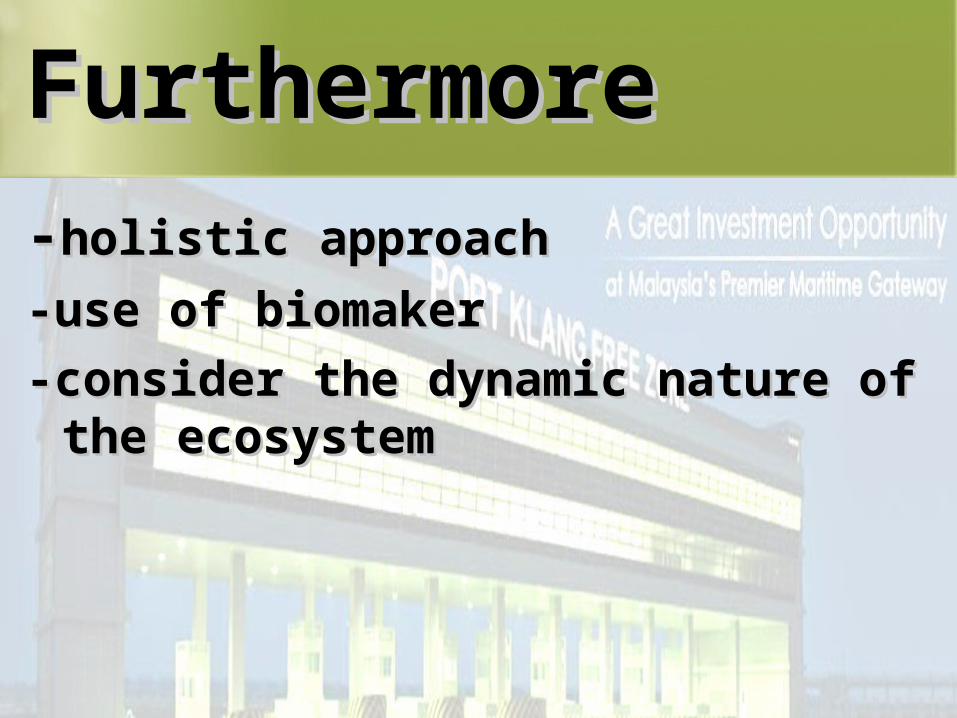
--holistic approach holistic approach
-use of biomaker-use of biomaker
-consider the dynamic nature of -consider the dynamic nature of the ecosystemthe ecosystem
FurthermoreFurthermore
45
The END. Thank The END. Thank You.You.
Q & AQ & A

46
References
BBC News (2005) http://news.bbc.co.uk/cbbcnews/hi/newsid_4140000/newsid_4149300/4149317.stm