1 may 2011 pride survey results our futures in licking county
TRANSCRIPT

1
May 2011 Pride Survey Results
Our Futures in Licking County
2
Prepared by
Presentation to the Our Futures Leadership Council
August 31, 2011
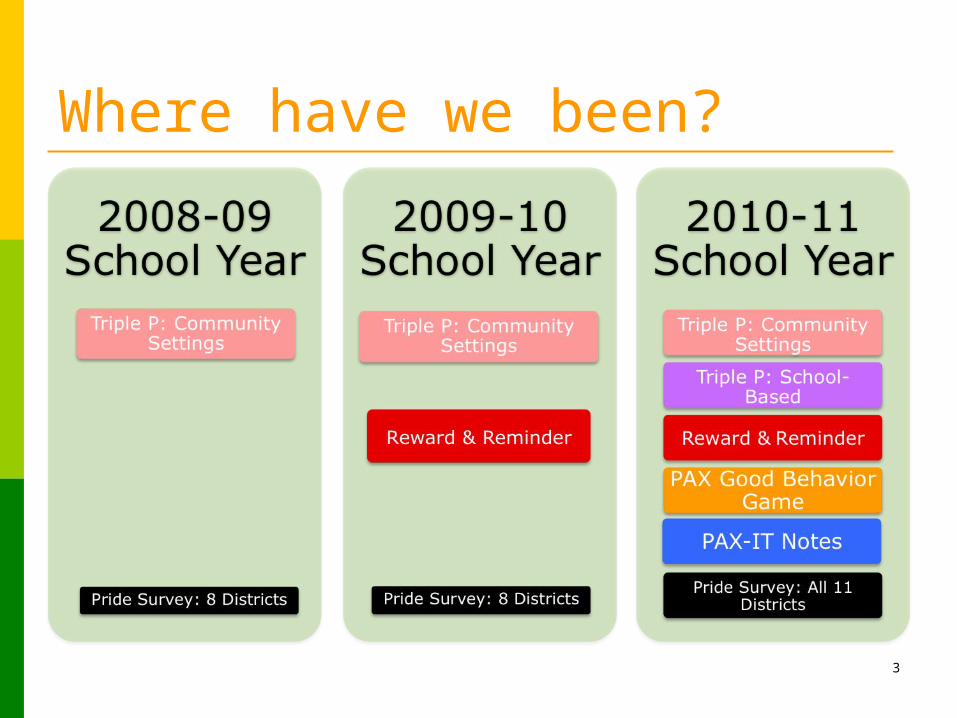
Where have we been?
3
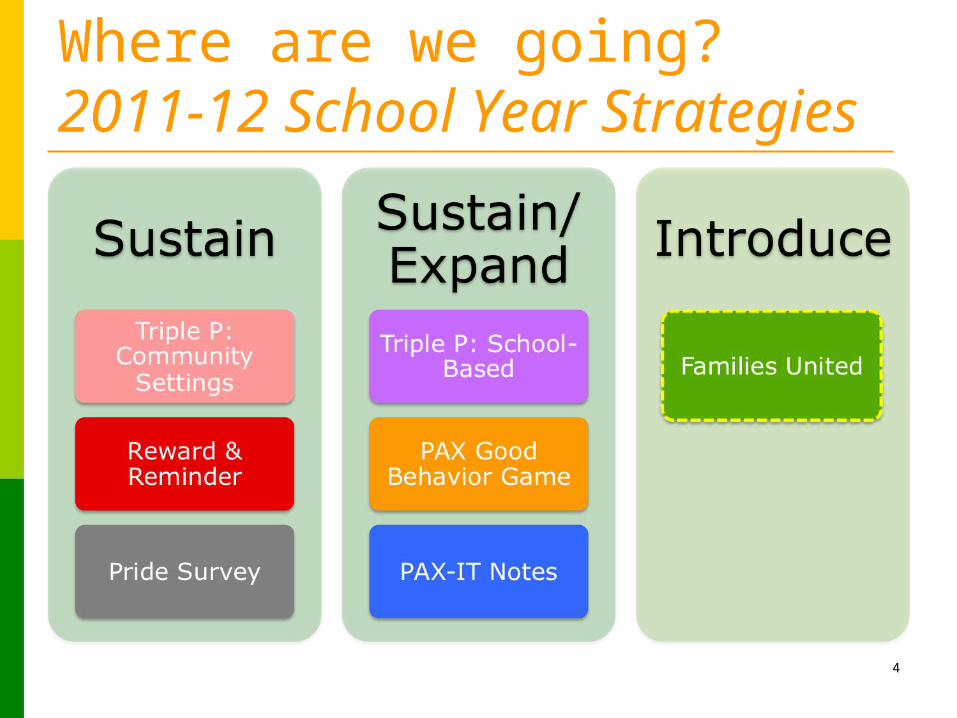
Where are we going?2011-12 School Year Strategies
4
5
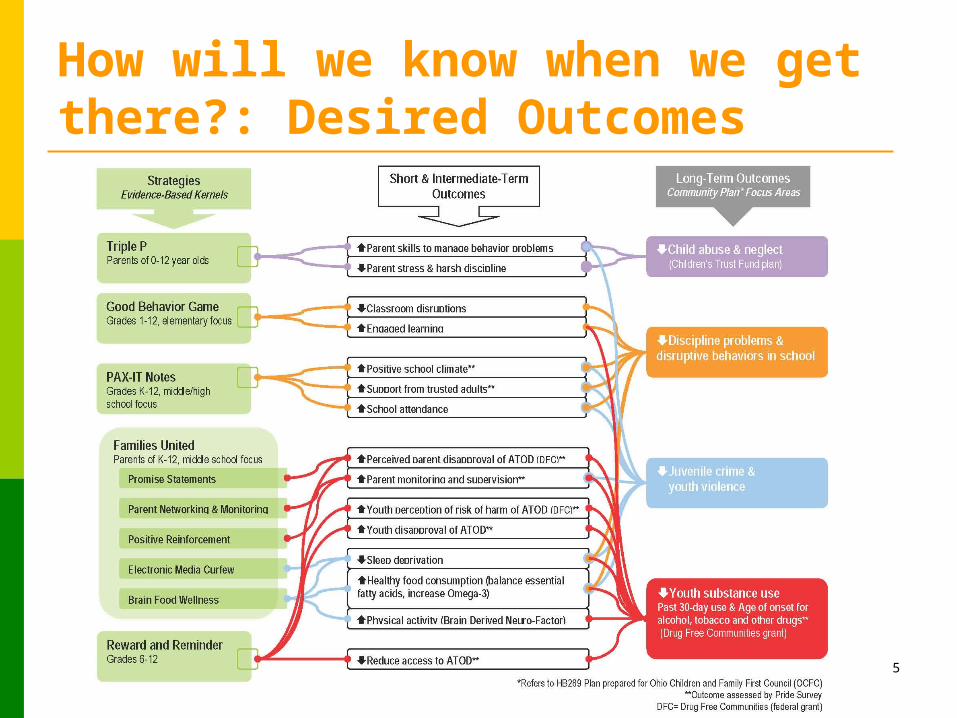
How will we know when we get there?: Desired Outcomes
Evaluation Update See “School District Reach” and “Outputs
and Outcomes” handouts Updated since May 2011 Leadership Breakfast
to include final 2010-11 school year numbers
6
7
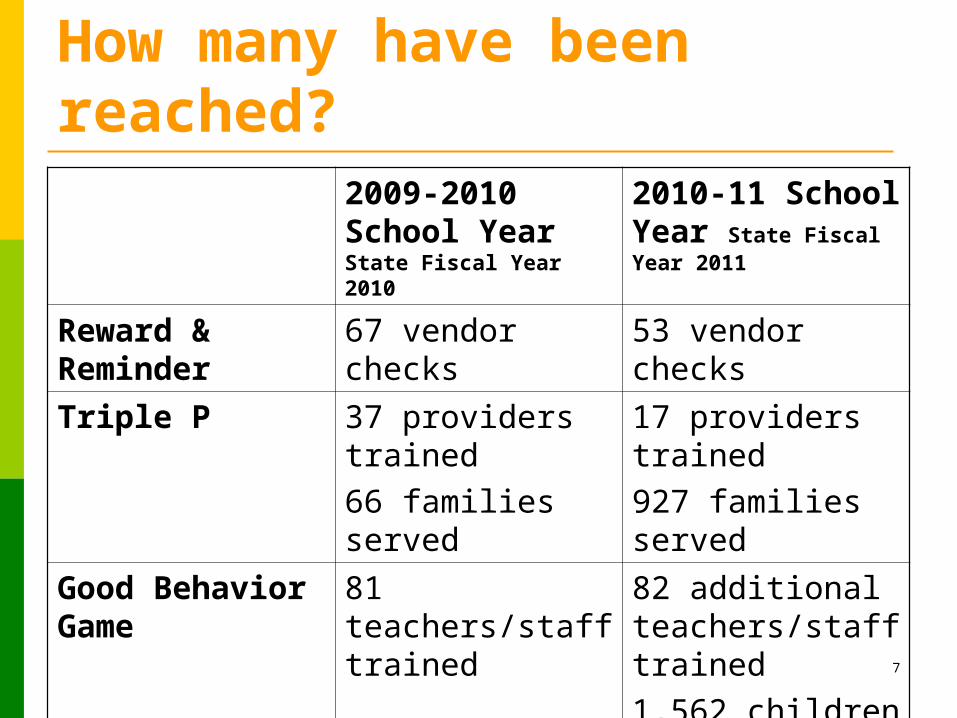
How many have been reached?
2009-2010 School Year State Fiscal Year 2010
2010-11 School Year State Fiscal Year 2011
Reward & Reminder 67 vendor checks 53 vendor checks
Triple P 37 providers trained66 families served
17 providers trained927 families served
Good Behavior Game 81 teachers/staff trained
82 additional teachers/staff trained1,562 children in GBG classrooms
PAX-IT Notes -- 1,387 notes handed out
8
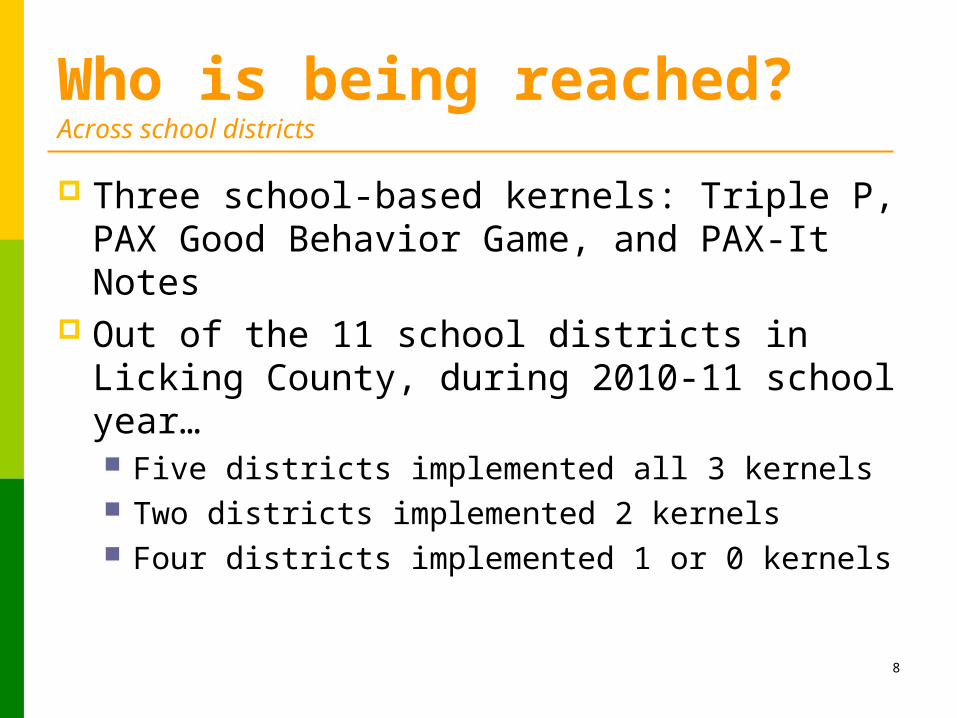
Who is being reached? Across school districts
Three school-based kernels: Triple P, PAX Good Behavior Game, and PAX-It Notes
Out of the 11 school districts in Licking County, during 2010-11 school year… Five districts implemented all 3 kernels Two districts implemented 2 kernels Four districts implemented 1 or 0 kernels
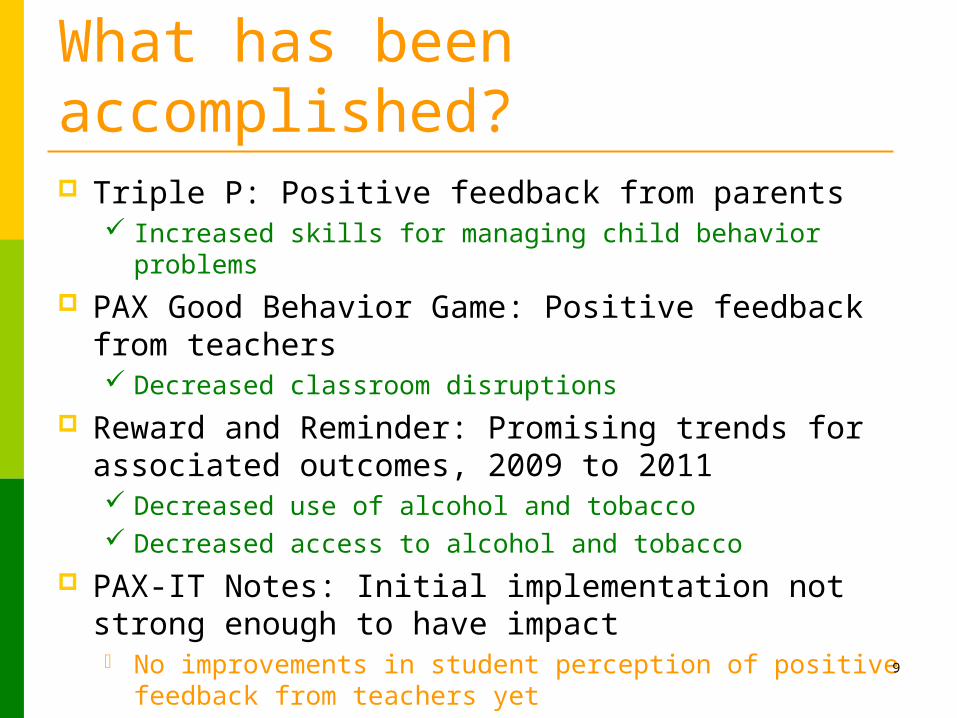
Outcomes: What has been accomplished? Triple P: Positive feedback from parents
Increased skills for managing child behavior problems PAX Good Behavior Game: Positive feedback from
teachers Decreased classroom disruptions
Reward and Reminder: Promising trends for associated outcomes, 2009 to 2011 Decreased use of alcohol and tobacco Decreased access to alcohol and tobacco
PAX-IT Notes: Initial implementation not strong enough to have impact No improvements in student perception of positive
feedback from teachers yet 9
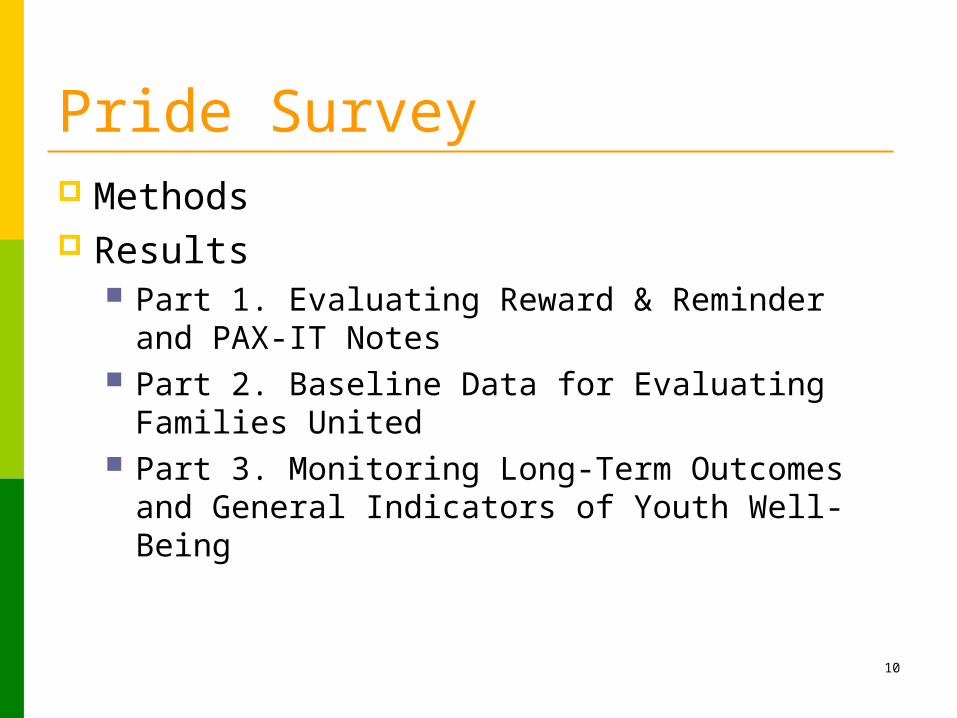
Pride Survey Methods Results
Part 1. Evaluating Reward & Reminder and PAX-IT Notes
Part 2. Baseline Data for Evaluating Families United
Part 3. Monitoring Long-Term Outcomes and General Indicators of Youth Well-Being
10
11
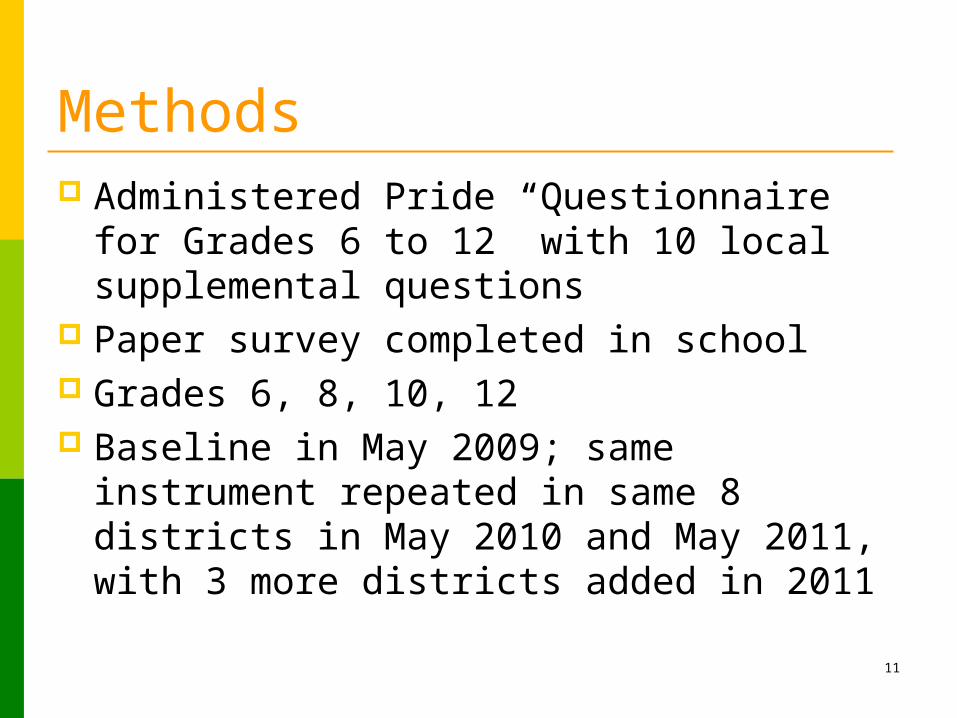
Methods Administered Pride “Questionnaire for
Grades 6 to 12” with 10 local supplemental questions
Paper survey completed in school Grades 6, 8, 10, 12 Baseline in May 2009; same instrument
repeated in same 8 districts in May 2010 and May 2011, with 3 more districts added in 2011
12
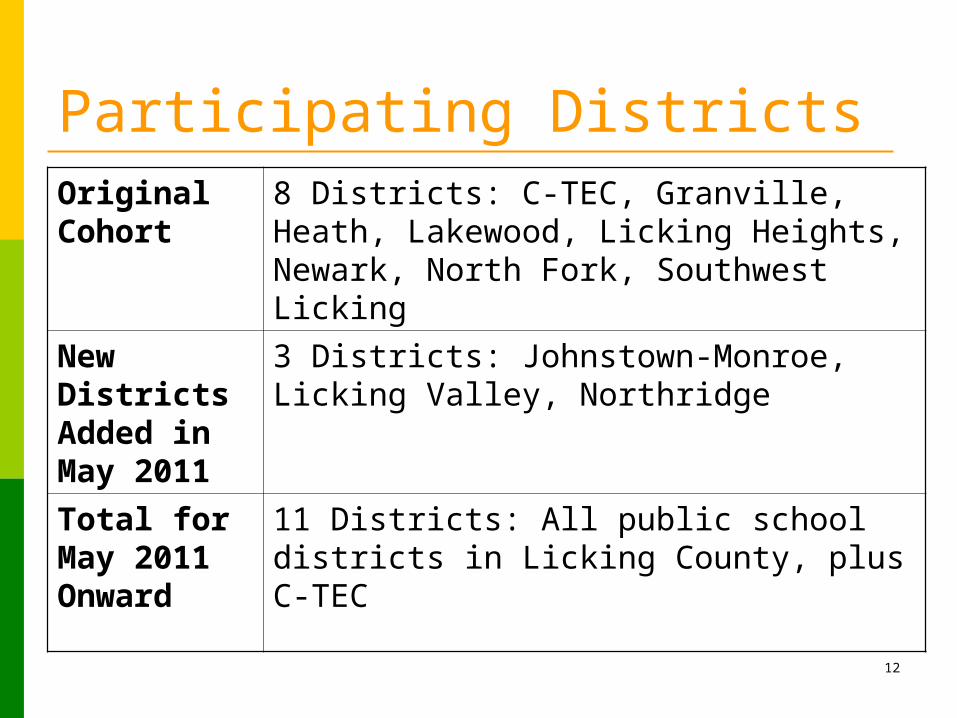
Participating DistrictsOriginal Cohort
8 Districts: C-TEC, Granville, Heath, Lakewood, Licking Heights, Newark, North Fork, Southwest Licking
New Districts Added in May 2011
3 Districts: Johnstown-Monroe, Licking Valley, Northridge
Total for May 2011 Onward
11 Districts: All public school districts in Licking County, plus C-TEC
13
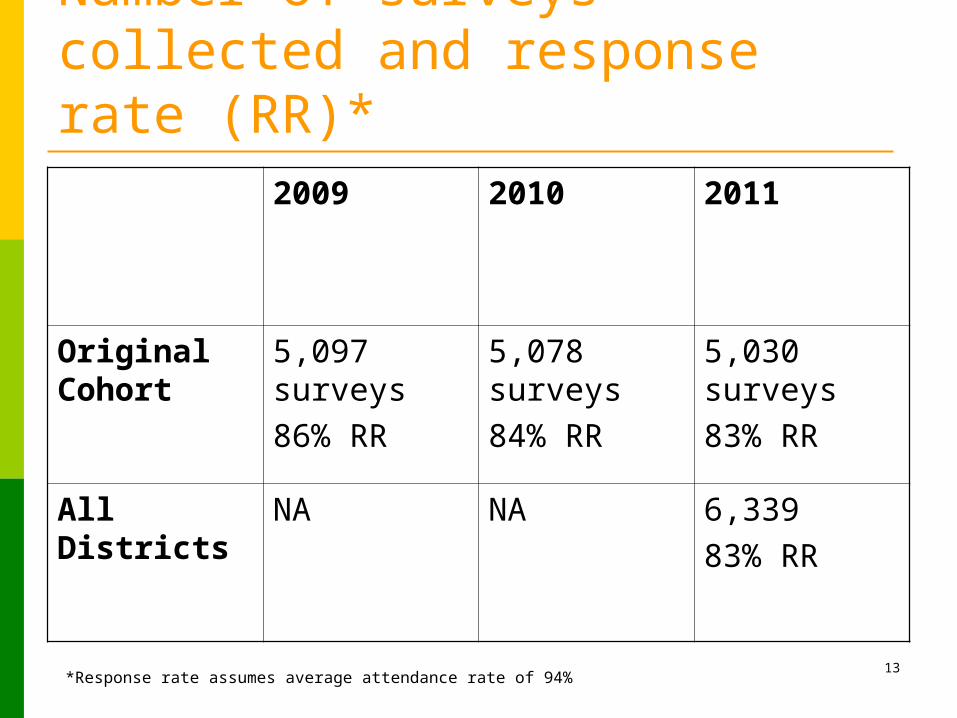
Number of surveys collected and response rate (RR)*
2009 2010 2011
Original Cohort
5,097 surveys86% RR
5,078 surveys84% RR
5,030 surveys83% RR
All Districts
NA NA 6,33983% RR
*Response rate assumes average attendance rate of 94%
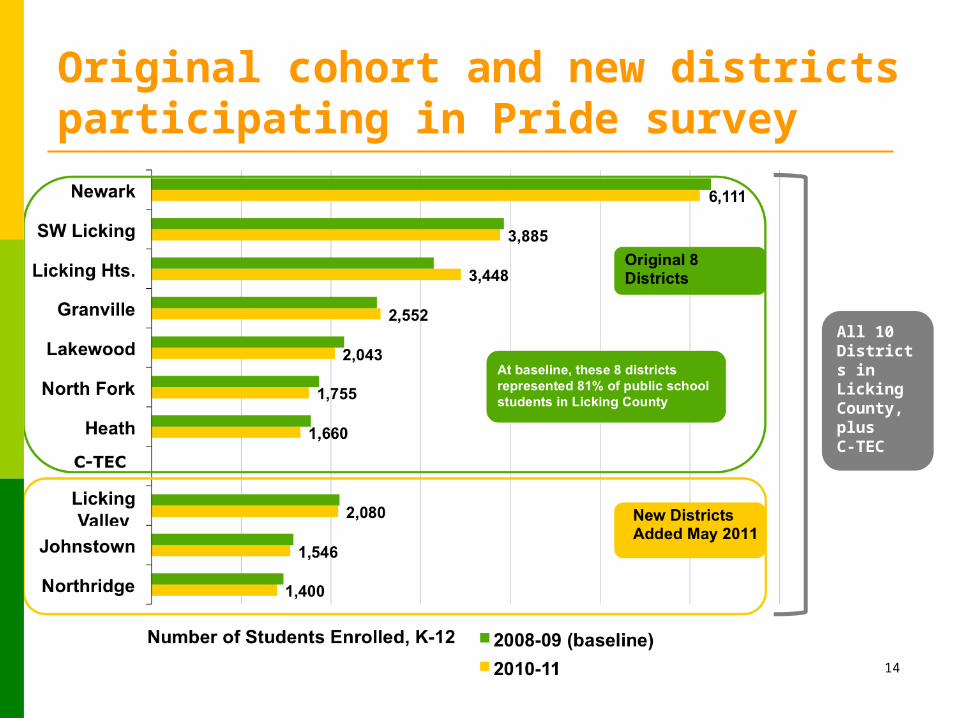
14
Original cohort and new districts participating in Pride survey
All 10 Districts in Licking County, plus C-TEC
15
National comparative dataNational: Pride Survey National
Summary, 2009-10 school year; n=103,864 2010-11 national data should be available fall
2011
Part 1. Evaluating Outcomes
Reward & Reminder PAX-IT Notes
16
Reward & Reminder
17
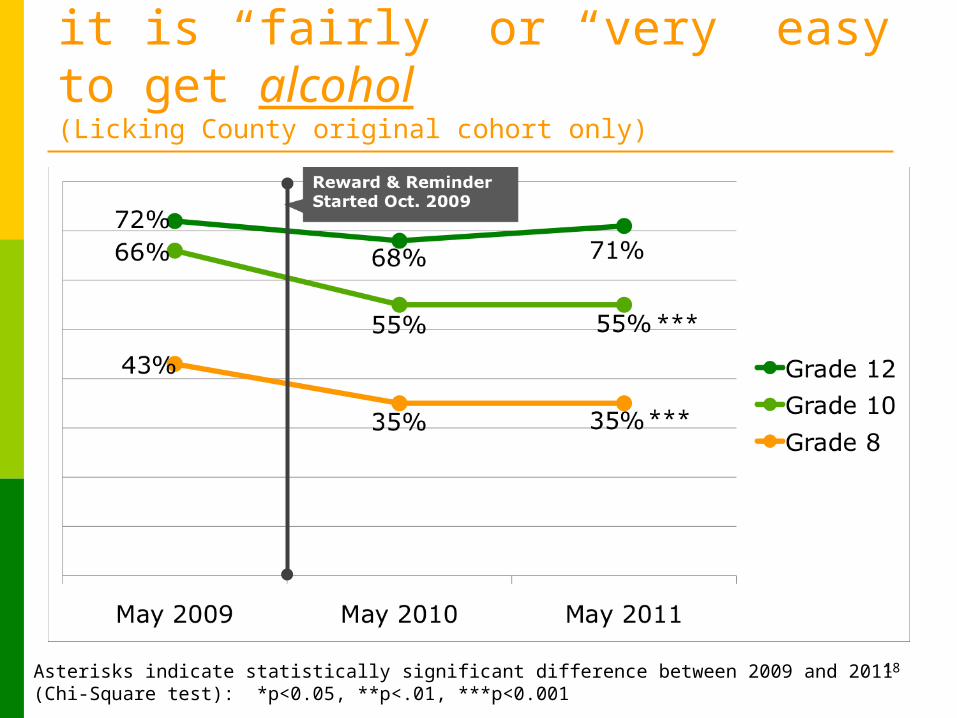
Percent of students who say it is “fairly” or “very” easy to get alcohol (Licking County original cohort only)
18Asterisks indicate statistically significant difference between 2009 and 2011 (Chi-Square test): *p<0.05, **p<.01, ***p<0.001
***
***
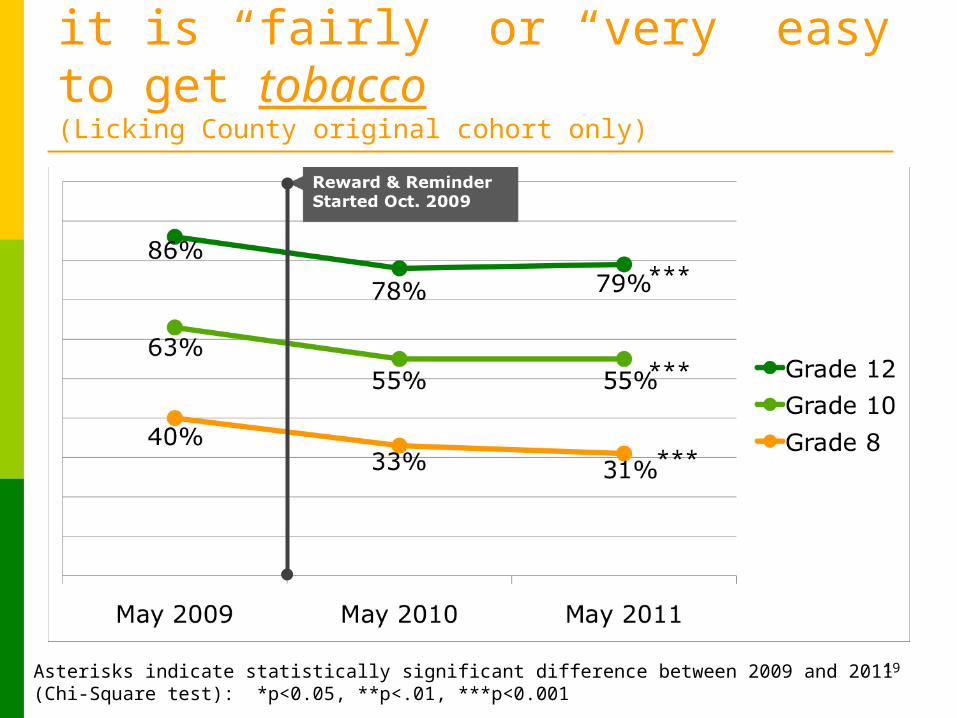
Percent of students who say it is “fairly” or “very” easy to get tobacco (Licking County original cohort only)
19
***
***
***
Asterisks indicate statistically significant difference between 2009 and 2011 (Chi-Square test): *p<0.05, **p<.01, ***p<0.001
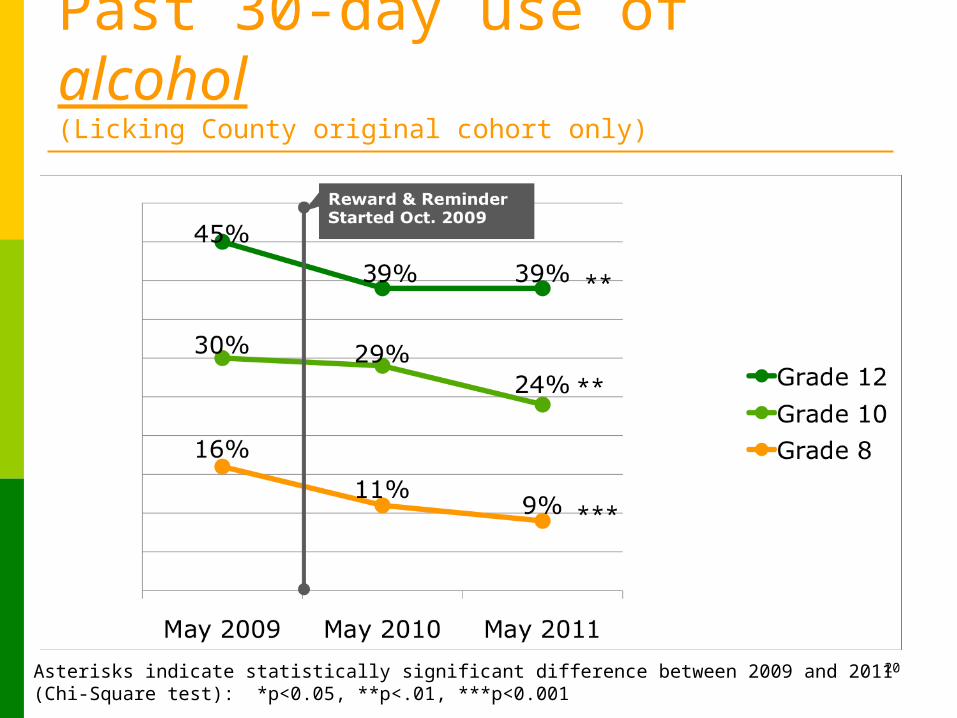
Past 30-day use of alcohol (Licking County original cohort only)
20Asterisks indicate statistically significant difference between 2009 and 2011 (Chi-Square test): *p<0.05, **p<.01, ***p<0.001
**
**
***
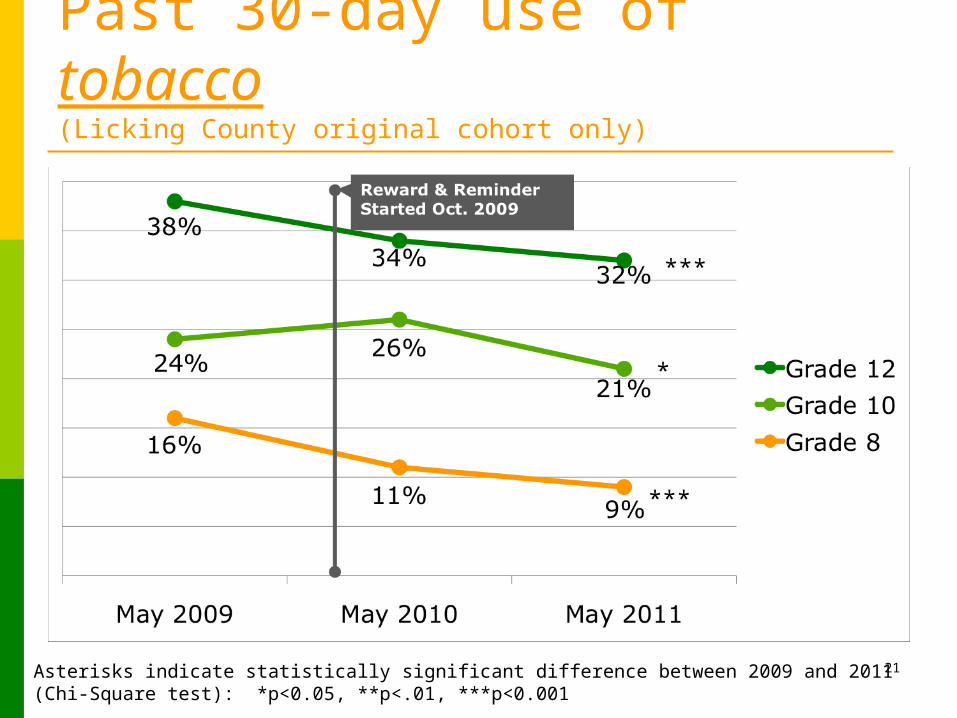
Past 30-day use of tobacco (Licking County original cohort only)
21
***
***
*
Asterisks indicate statistically significant difference between 2009 and 2011 (Chi-Square test): *p<0.05, **p<.01, ***p<0.001
PAX-IT Notes
22

Use of PAX-IT Notes in 2010-11 school year Implementation started February 2011 (four
month period from Feb.-May 2011) 7 districts participated (Note: 5 of these were in original Pride
Survey cohort)
6 High School Buildings 4 Middle School Buildings 4 Elementary/Intermediate Buildings
Total of 1,387 notes handed out On average, teachers handed out 2.2 notes
during the four month period Best Practice recommendation was for 32.0 notes per
teacher during 4 months23
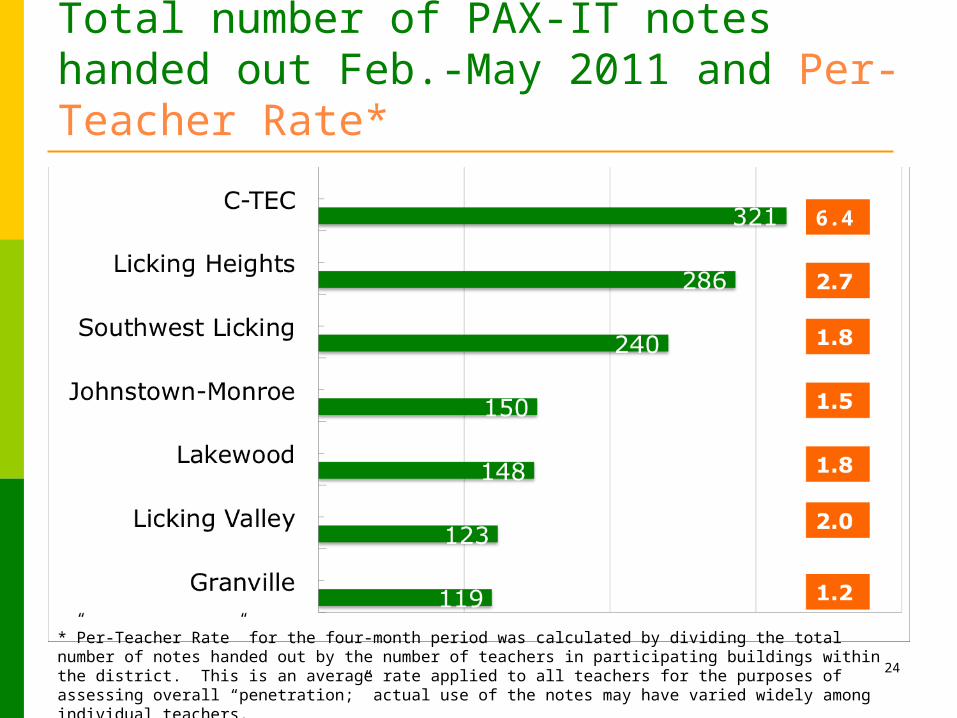
Total number of PAX-IT notes handed out Feb.-May 2011 and Per-Teacher Rate*
24
6.4
*”Per-Teacher Rate” for the four-month period was calculated by dividing the total number of notes handed out by the number of teachers in participating buildings within the district. This is an average rate applied to all teachers for the purposes of assessing overall “penetration;” actual use of the notes may have varied widely among individual teachers.
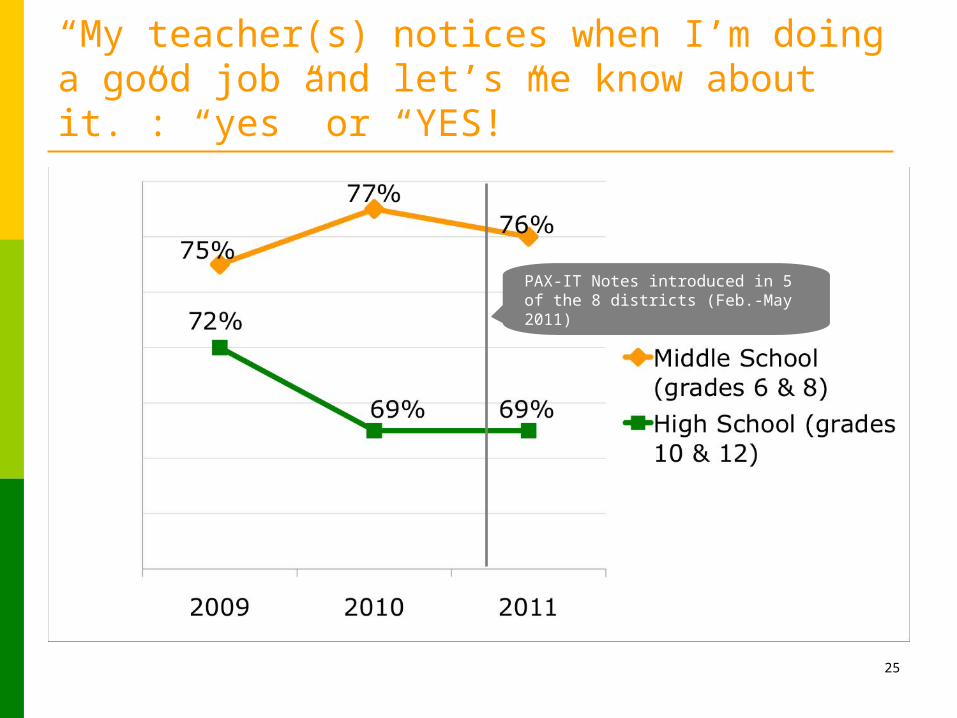
“My teacher(s) notices when I’m doing a good job and let’s me know about it.”: “yes” or “YES!”
25
PAX-IT Notes introduced in 5 of the 8 districts (Feb.-May 2011)
Part 2. Baseline data for Families United
evaluation
26
Desired outcomes for Families United Tracked with Pride Survey Kids know their parents don’t want them
to use ATOD (increase youth perception of parent disapproval of ATOD use)
Parents know where their kids are (increase parent monitoring)
Parents know their kids’ friends’ parents (increase parent networking)
Kids get enough sleep (increased use of media curfews and decrease sleep deprivation)
27
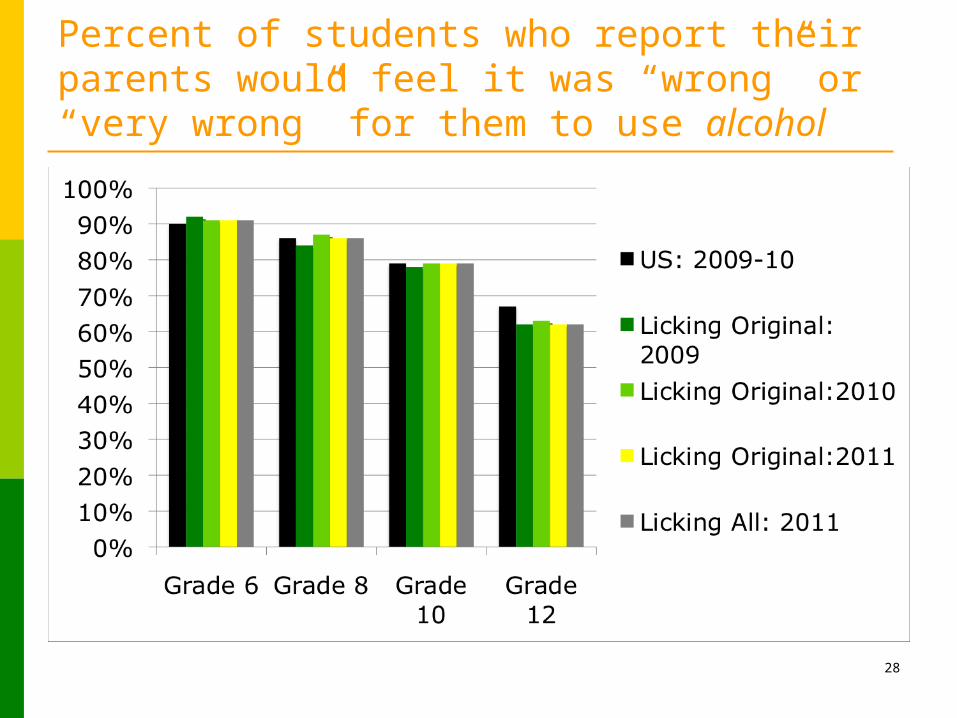
Percent of students who report their parents would feel it was “wrong” or “very wrong” for them to use alcohol
28
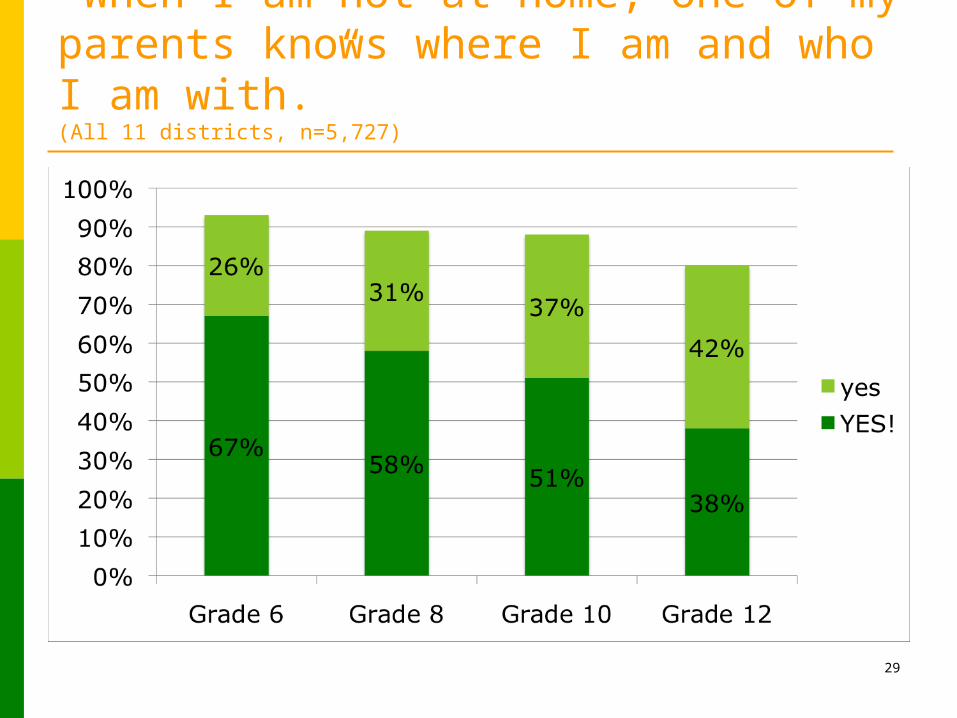
“When I am not at home, one of my parents knows where I am and who I am with.” (All 11 districts, n=5,727)
29
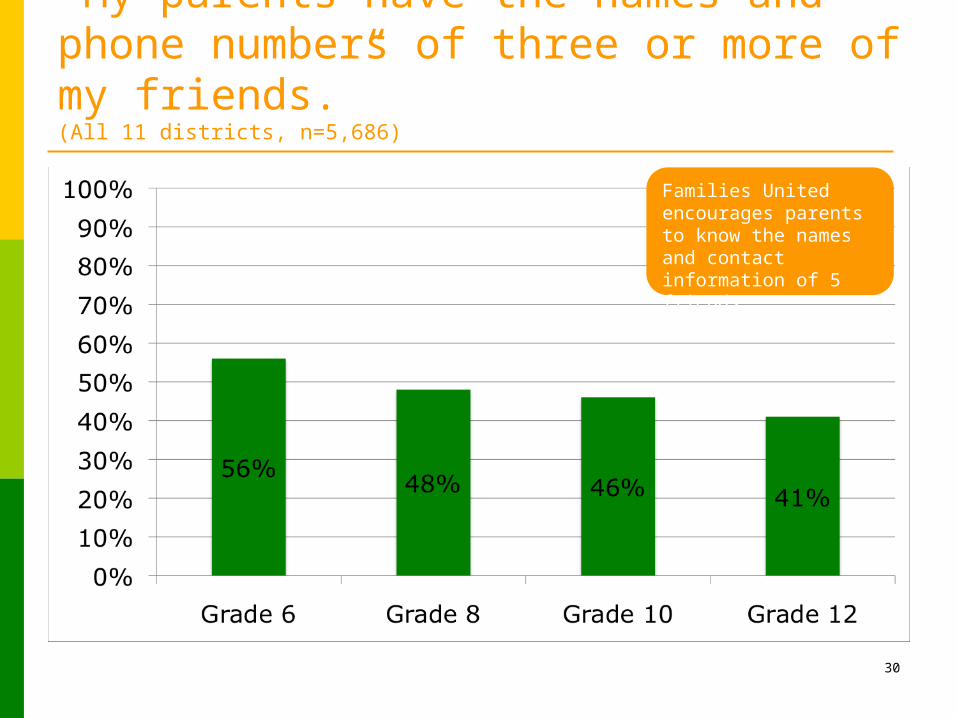
“My parents have the names and phone numbers of three or more of my friends.” (All 11 districts, n=5,686)
30
Families United encourages parents to know the names and contact information of 5 friends
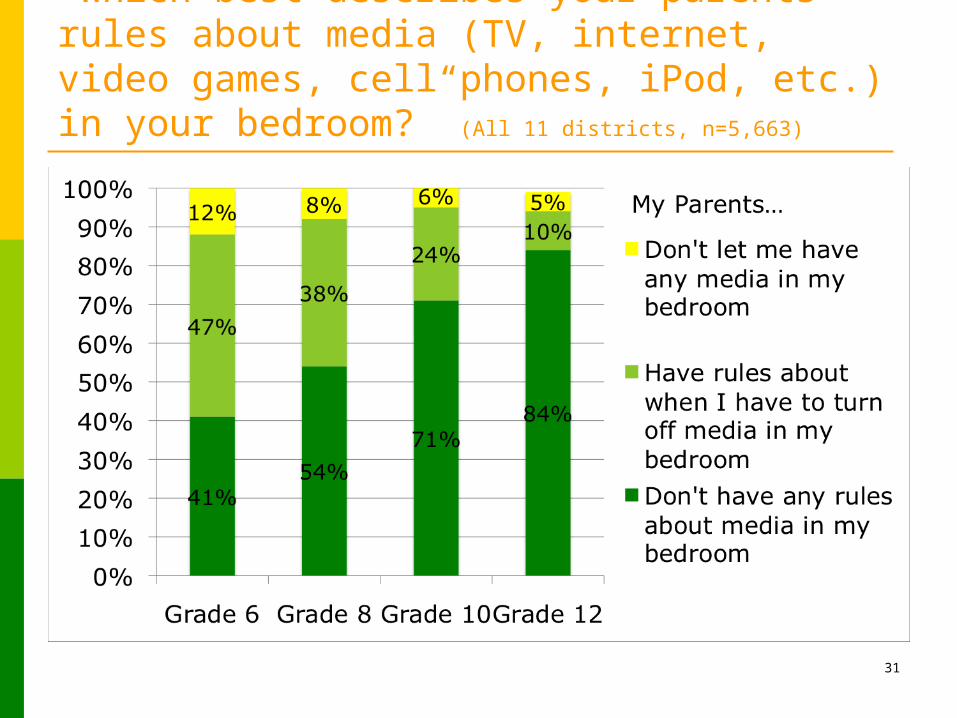
“Which best describes your parents’ rules about media (TV, internet, video games, cell phones, iPod, etc.) in your bedroom?” (All 11 districts, n=5,663)
31
32
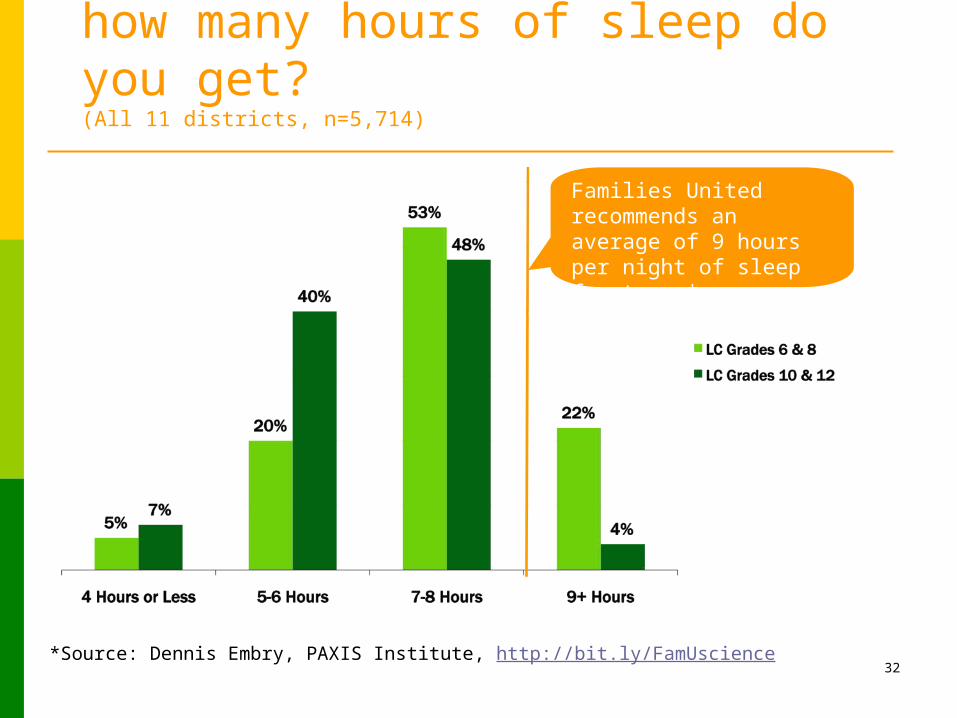
On an average school night, how many hours of sleep do you get? (All 11 districts, n=5,714)
Families United recommends an average of 9 hours per night of sleep for teens*
*Source: Dennis Embry, PAXIS Institute, http://bit.ly/FamUscience
Part 3. Ongoing monitoring of key indicators of
youth wellbeing Additional drug use: marijuana, prescription
drugs/pain killers, and heroin Where kids use ATOD Youth protective factors (supportive
adults/positive school climate) Suicide ideation
33
34
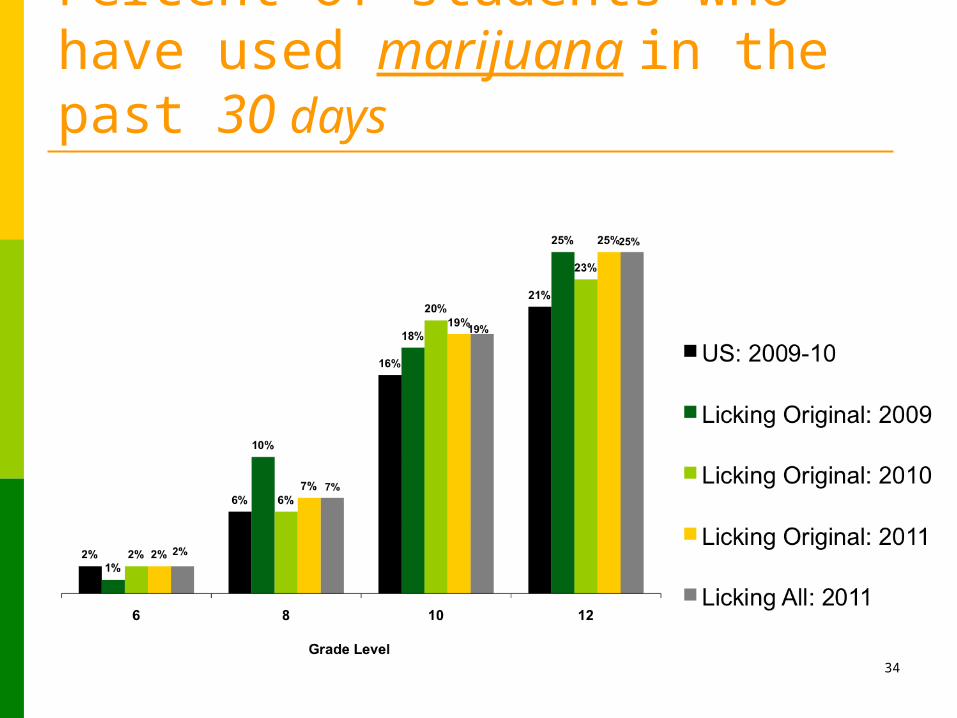
Percent of students who have used marijuana in the past 30 days
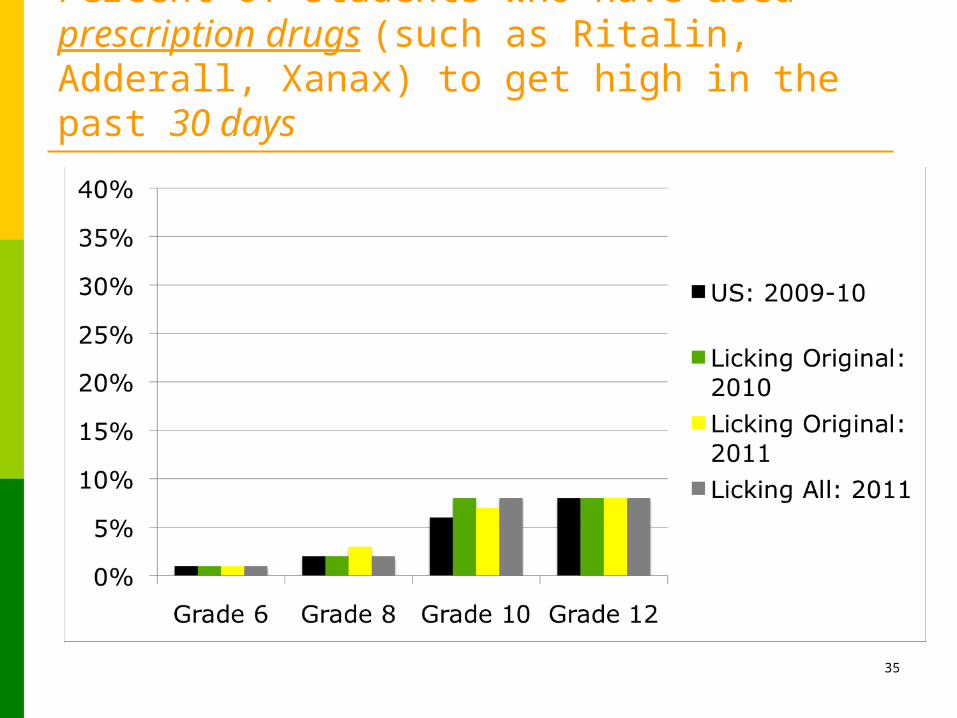
Percent of students who have used prescription drugs (such as Ritalin, Adderall, Xanax) to get high in the past 30 days
35

Percent of students who have used prescription pain killers (like Vicodin, OxyContin, or Percocet) to get high in the past 30 days
36
37
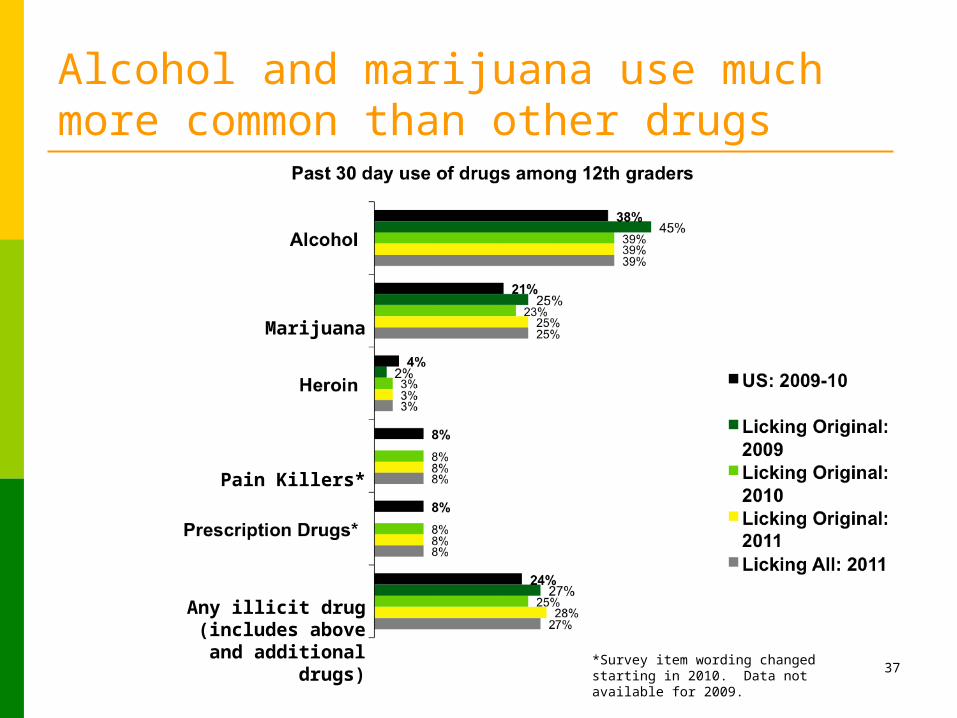
Alcohol and marijuana use much more common than other drugs
Pain Killers*
Marijuana
Any illicit drug (includes above and
additional drugs) *Survey item wording changed starting in 2010. Data not available for 2009.
38
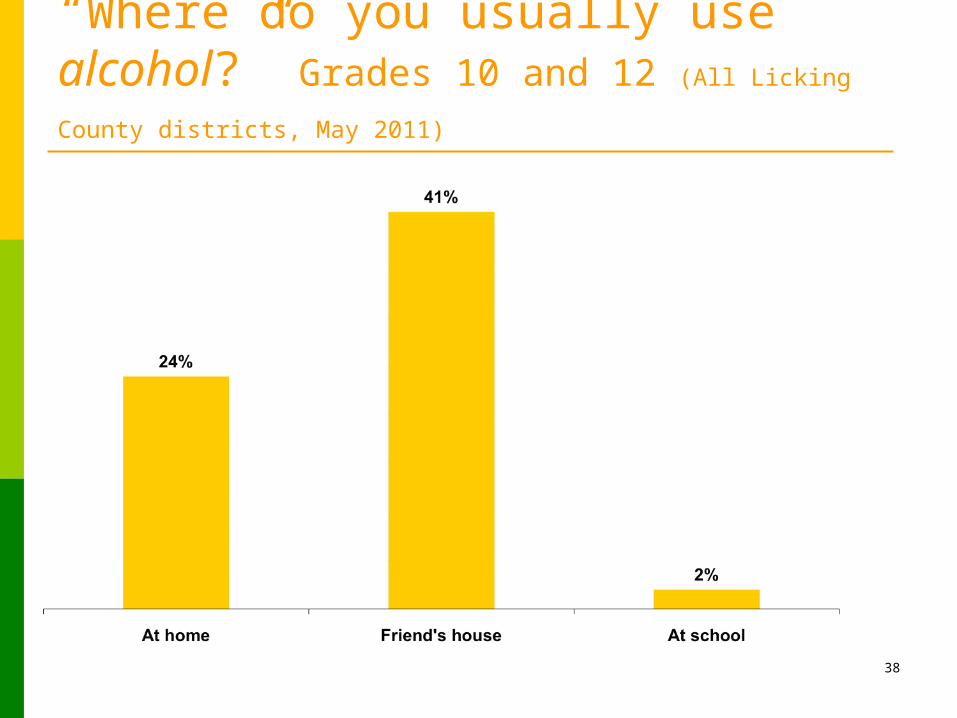
“Where do you usually use alcohol?” Grades 10 and 12 (All Licking County
districts, May 2011)
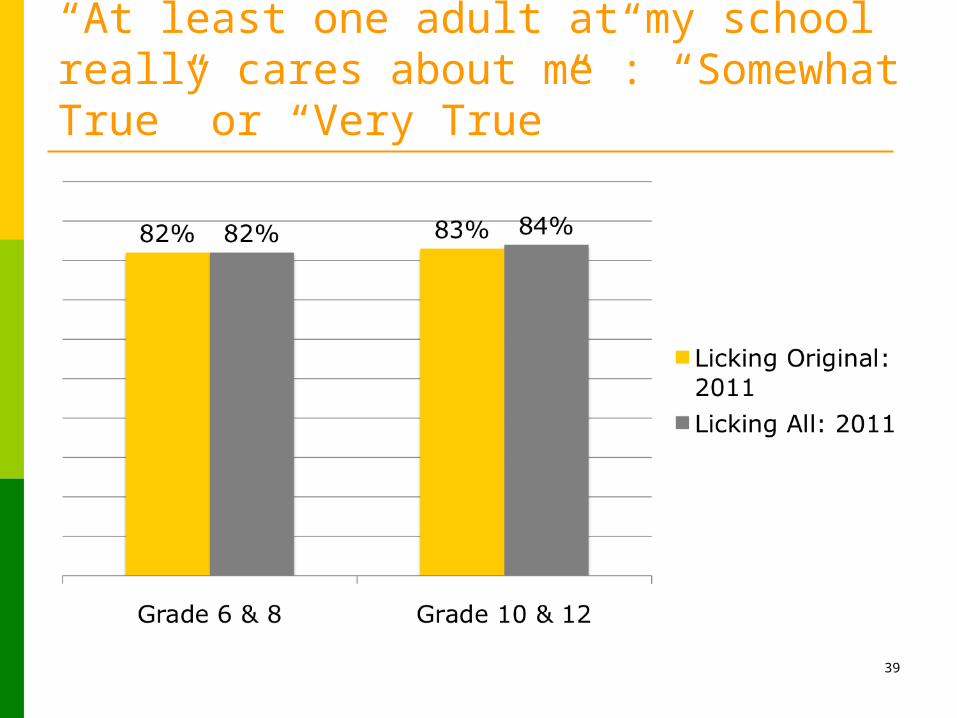
“At least one adult at my school really cares about me”: “Somewhat True” or “Very True”
39
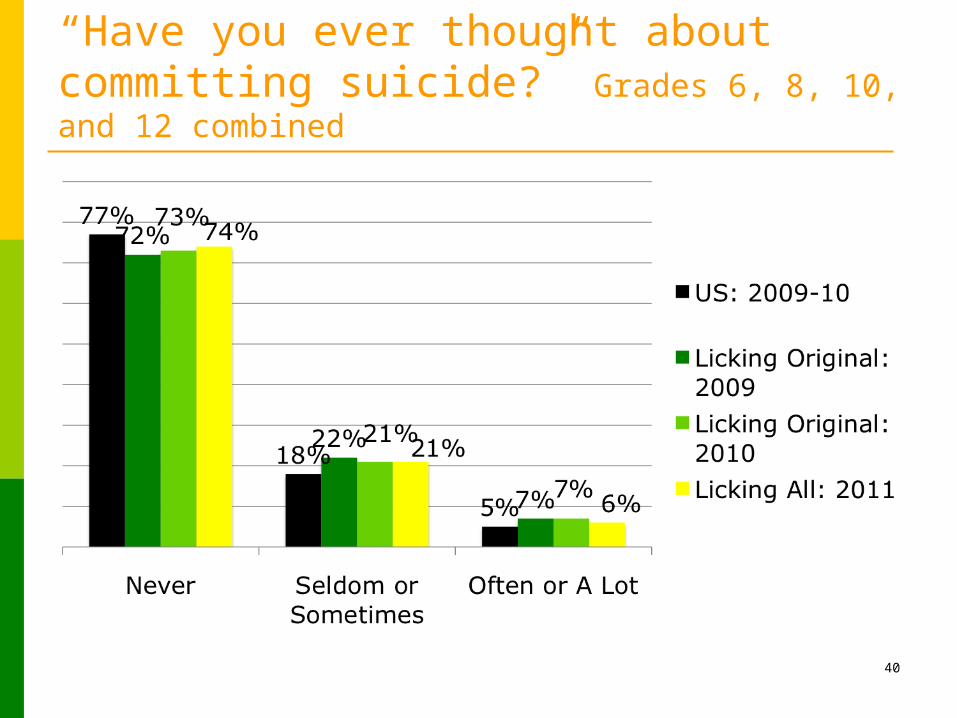
“Have you ever thought about committing suicide?” Grades 6, 8, 10, and 12 combined
40

41
Key findingsEvaluating Reward & Reminder and PAX-IT Notes
Since the implementation of Reward & Reminder during the 2009-10 school year, access to and use of alcohol and tobacco declined among Licking County youth 55% of 10th graders said it was “fairly” or “very” easy to
get alcohol in May 2011, down from 66% in May 2009 24% of 10th graders reported past 30-day use of alcohol
in May 2011, down from 30% in May 2009 Initial implementation of PAX-IT Notes in spring
2011 was not strong enough to be associated with any improvements in student perception of positive recognition from teachers Higher-dose implementation is needed during 2011-12
school year
42
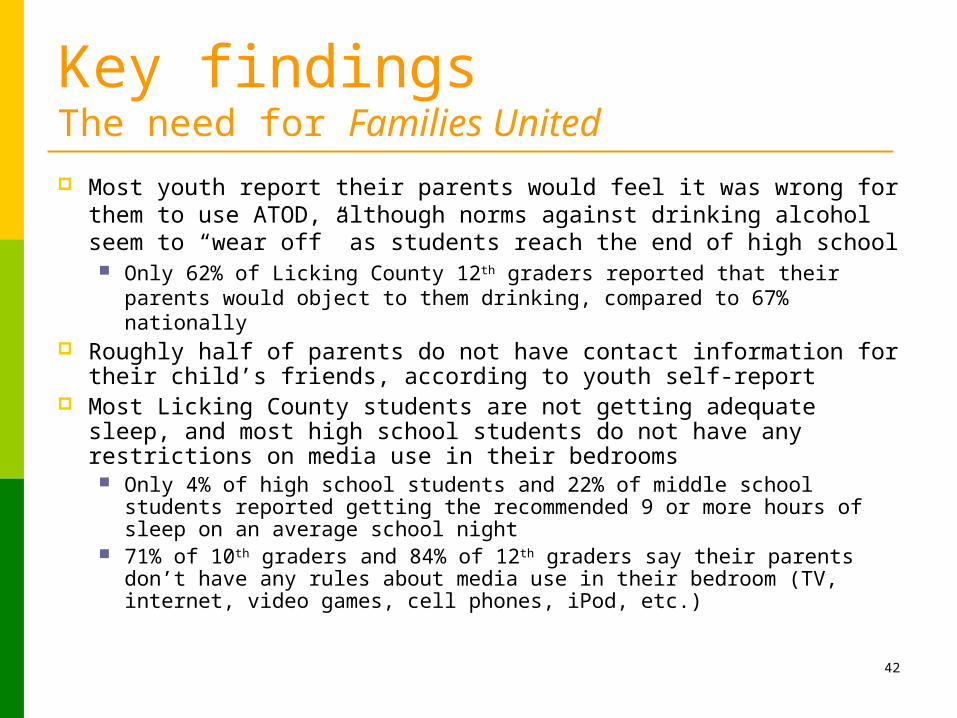
Key findingsThe need for Families United
Most youth report their parents would feel it was wrong for them to use ATOD, although norms against drinking alcohol seem to “wear off” as students reach the end of high school Only 62% of Licking County 12th graders reported that their parents
would object to them drinking, compared to 67% nationally Roughly half of parents do not have contact information for
their child’s friends, according to youth self-report Most Licking County students are not getting adequate sleep,
and most high school students do not have any restrictions on media use in their bedrooms Only 4% of high school students and 22% of middle school
students reported getting the recommended 9 or more hours of sleep on an average school night
71% of 10th graders and 84% of 12th graders say their parents don’t have any rules about media use in their bedroom (TV, internet, video games, cell phones, iPod, etc.)
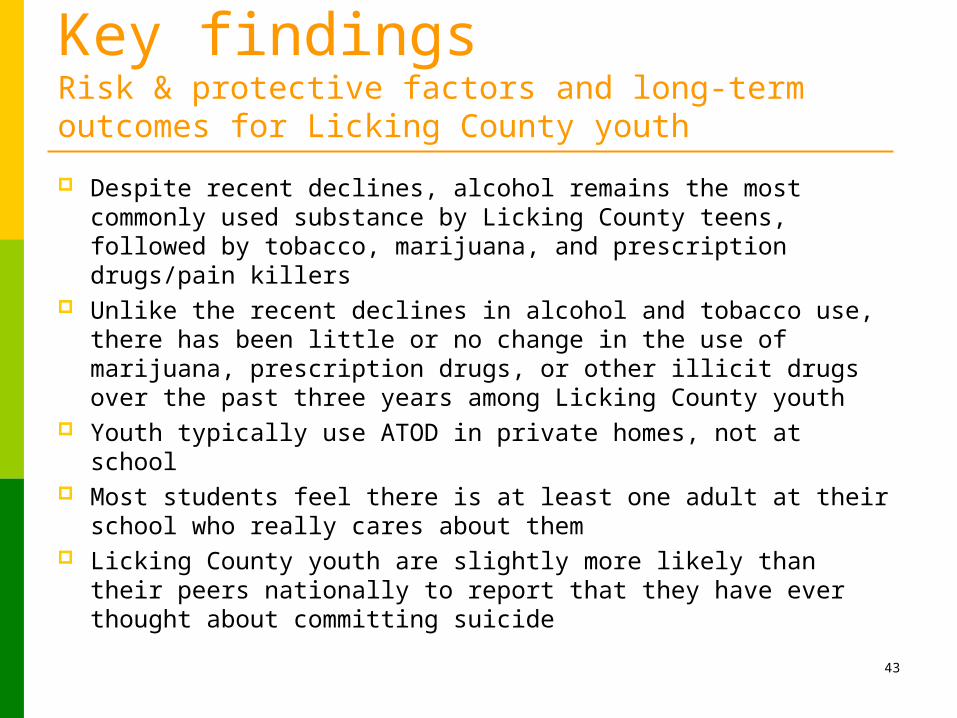
Key findingsRisk & protective factors and long-term outcomes for Licking County youth
Despite recent declines, alcohol remains the most commonly used substance by Licking County teens, followed by tobacco, marijuana, and prescription drugs/pain killers
Unlike the recent declines in alcohol and tobacco use, there has been little or no change in the use of marijuana, prescription drugs, or other illicit drugs over the past three years among Licking County youth
Youth typically use ATOD in private homes, not at school Most students feel there is at least one adult at their school
who really cares about them Licking County youth are slightly more likely than their
peers nationally to report that they have ever thought about committing suicide
43
44
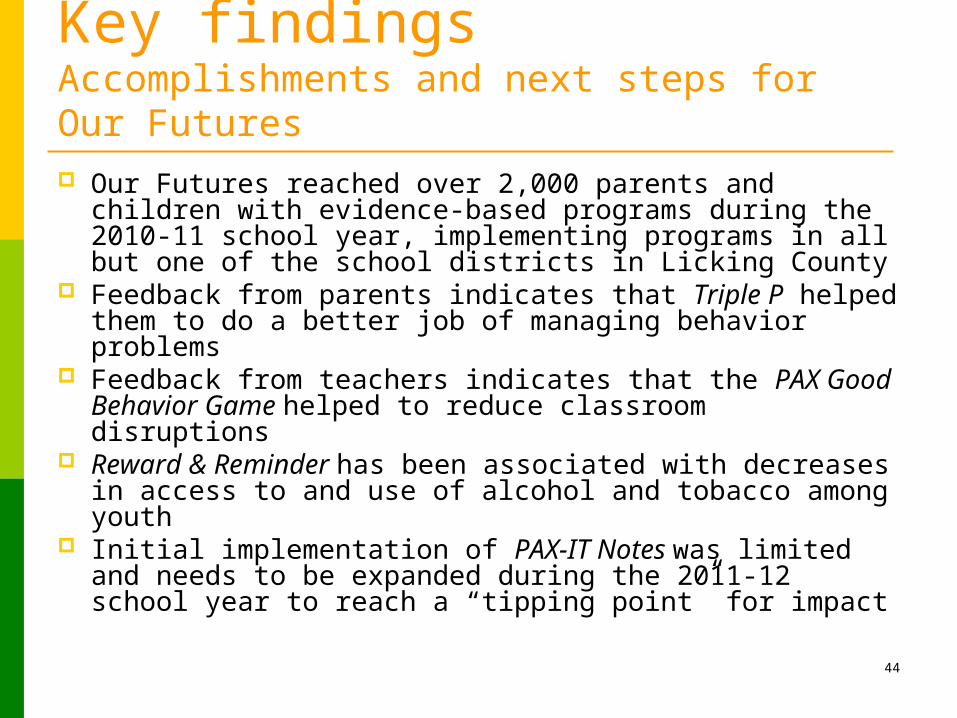
Key findingsAccomplishments and next steps for Our Futures Our Futures reached over 2,000 parents and children
with evidence-based programs during the 2010-11 school year, implementing programs in all but one of the school districts in Licking County
Feedback from parents indicates that Triple P helped them to do a better job of managing behavior problems
Feedback from teachers indicates that the PAX Good Behavior Game helped to reduce classroom disruptions
Reward & Reminder has been associated with decreases in access to and use of alcohol and tobacco among youth
Initial implementation of PAX-IT Notes was limited and needs to be expanded during the 2011-12 school year to reach a “tipping point” for impact
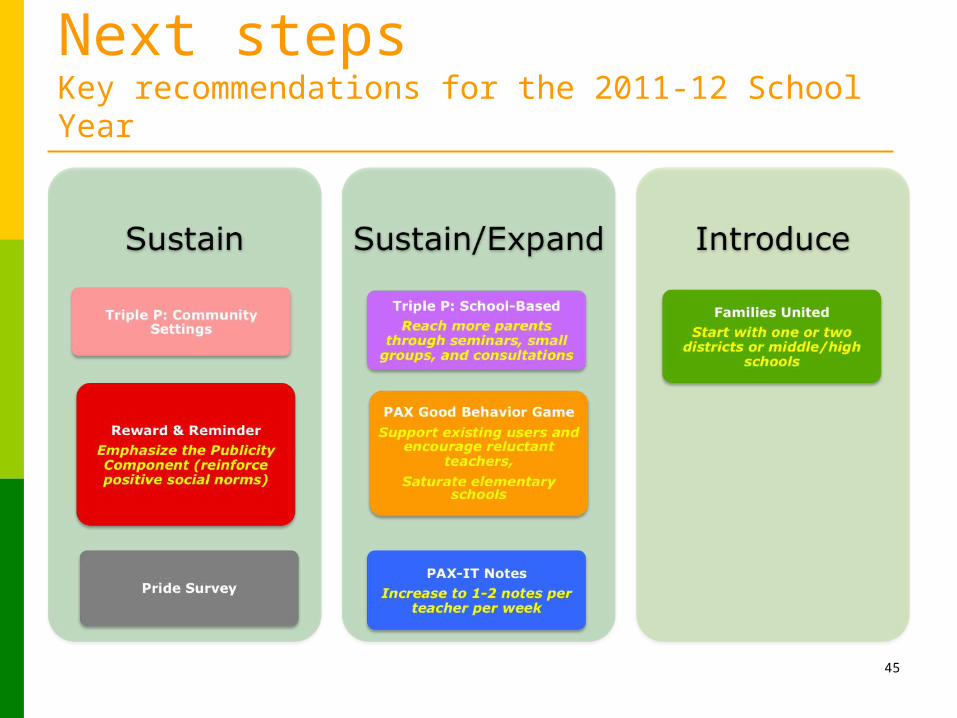
Next stepsKey recommendations for the 2011-12 School Year
45
46
More information about the Pride Survey Most commonly used survey of adolescent drug
use in the U.S. Valid and reliable instrument, in use since 1982 Survey was conducted at no cost to districts in
May 2011 Plan to repeat survey annually in Licking County CMHRB added 10 additional questions to 2-page
Pride survey to address additional Our Futures indicators
For more information, contact: Amy Bush Stevens, Program Evaluator, [email protected] or go to www.pridesurveys.com
47