1 light emitting diodes and solid-state lighting solid-state lighting
TRANSCRIPT
1
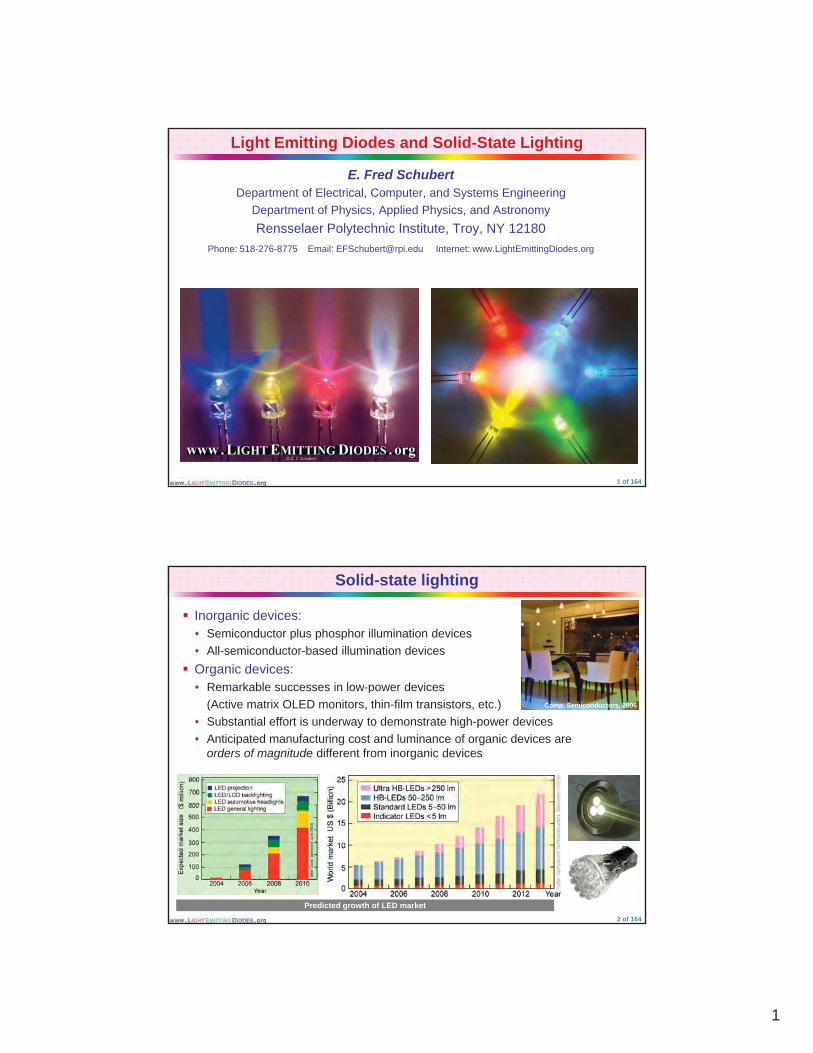
Light Emitting Diodes and Solid-State Lighting
E. Fred Schubert Department of Electrical, Computer, and Systems Engineering
Department of Physics, Applied Physics, and AstronomyRensselaer Polytechnic Institute, Troy, NY 12180
Phone: 518 276 8775 Email: EFSchubert@rpi edu Internet: www LightEmittingDiodes orgPhone: 518-276-8775 Email: [email protected] Internet: www.LightEmittingDiodes.org
1 of 164
Solid-state lighting
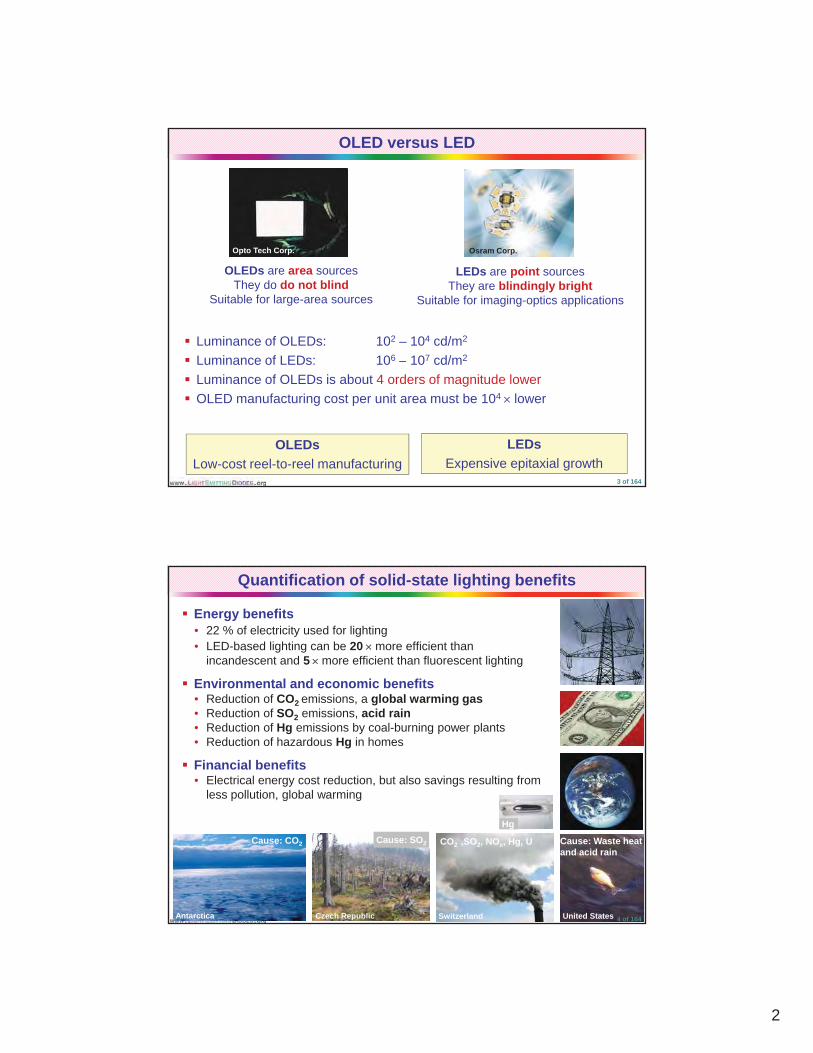
� Inorganic devices:• Semiconductor plus phosphor illumination devices • All-semiconductor-based illumination devices
� Organic devices:Remarkable successes in low power devices• Remarkable successes in low-power devices(Active matrix OLED monitors, thin-film transistors, etc.)
• Substantial effort is underway to demonstrate high-power devices• Anticipated manufacturing cost and luminance of organic devices are
orders of magnitude different from inorganic devices
Comp. Semiconductors, 2006
Predicted growth of LED market2 of 164
2
OLED versus LED
O CO t T h C
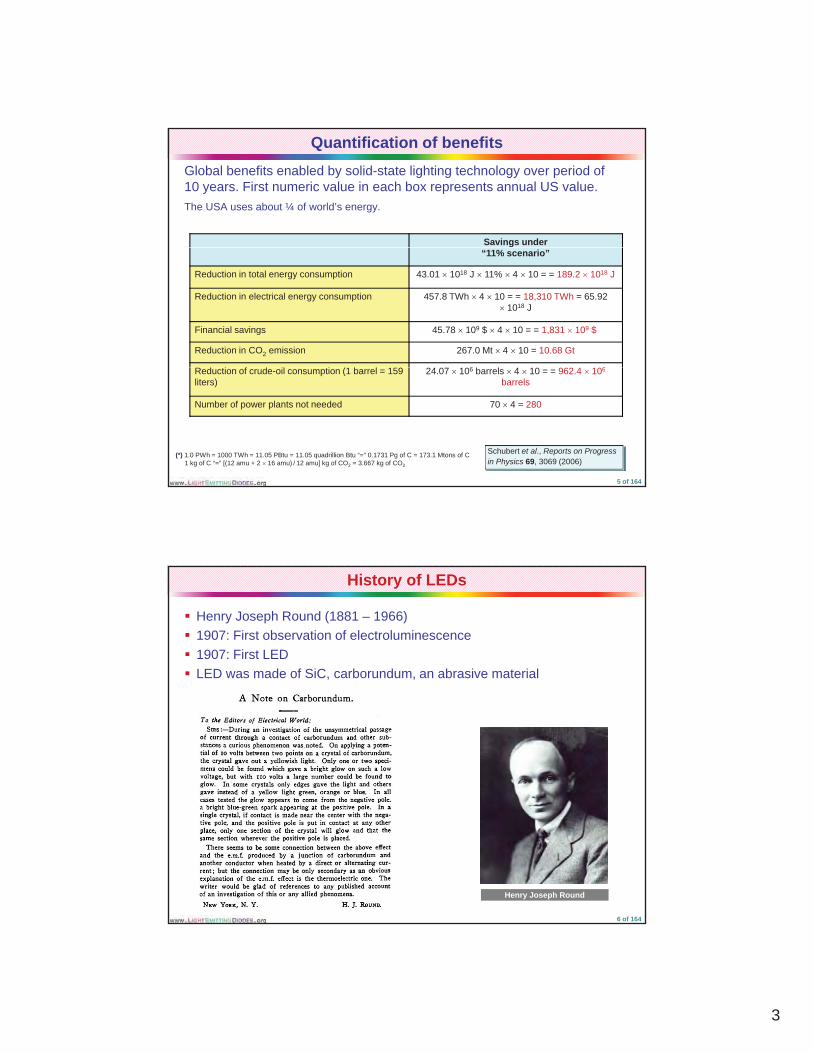
LEDs are point sourcesThey are blindingly bright
Suitable for imaging-optics applications
Osram Corp.
OLEDs are area sourcesThey do do not blind
Suitable for large-area sources
Opto Tech Corp.
� Luminance of OLEDs: 102 – 104 cd/m2
� Luminance of LEDs: 106 – 107 cd/m2
� Luminance of OLEDs is about 4 orders of magnitude lower� OLED manufacturing cost per unit area must be 104 � lower
OLEDsLow-cost reel-to-reel manufacturing
LEDsExpensive epitaxial growth
3 of 164
Quantification of solid-state lighting benefits
� Energy benefits• 22 % of electricity used for lighting• LED-based lighting can be 20 � more efficient than
incandescent and 5�� more efficient than fluorescent lighting
� Environmental and economic benefits� Environmental and economic benefits• Reduction of CO2 emissions, a global warming gas• Reduction of SO2 emissions, acid rain• Reduction of Hg emissions by coal-burning power plants• Reduction of hazardous Hg in homes
� Financial benefits• Electrical energy cost reduction, but also savings resulting from
less pollution, global warming
Antarctica United States
Hg
Cause: CO2
Switzerland
CO2 ,SO2, NOx, Hg, U
Czech Republic
Cause: SO2 Cause: Waste heatand acid rain
4 of 164
3
Quantification of benefitsGlobal benefits enabled by solid-state lighting technology over period of 10 years. First numeric value in each box represents annual US value. The USA uses about ¼ of world’s energy.
Savings under “11% scenario”
Reduction in total energy consumption 43.01 � 1018 J � 11% � 4 � 10 = = 189.2 � 1018 J
Reduction in electrical energy consumption 457.8 TWh � 4 � 10 = = 18,310 TWh = 65.92 � 1018 J
Financial savings 45.78 � 109 $ � 4 � 10 = = 1,831 � 109 $
Reduction in CO2 emission 267.0 Mt � 4 � 10 = 10.68 Gt
f ( 6 6Reduction of crude-oil consumption (1 barrel = 159 liters)
24.07 � 106 barrels � 4 � 10 = = 962.4 � 106
barrels
Number of power plants not needed 70 � 4 = 280
(*) 1.0 PWh = 1000 TWh = 11.05 PBtu = 11.05 quadrillion Btu “=” 0.1731 Pg of C = 173.1 Mtons of C1 kg of C “=” [(12 amu + 2 � 16 amu) / 12 amu] kg of CO2 = 3.667 kg of CO2
Schubert et al., Reports on Progress in Physics 69, 3069 (2006)
5 of 164
History of LEDs
� Henry Joseph Round (1881 – 1966) � 1907: First observation of electroluminescence� 1907: First LED� LED was made of SiC, carborundum, an abrasive material
Henry Joseph Round
6 of 164
4
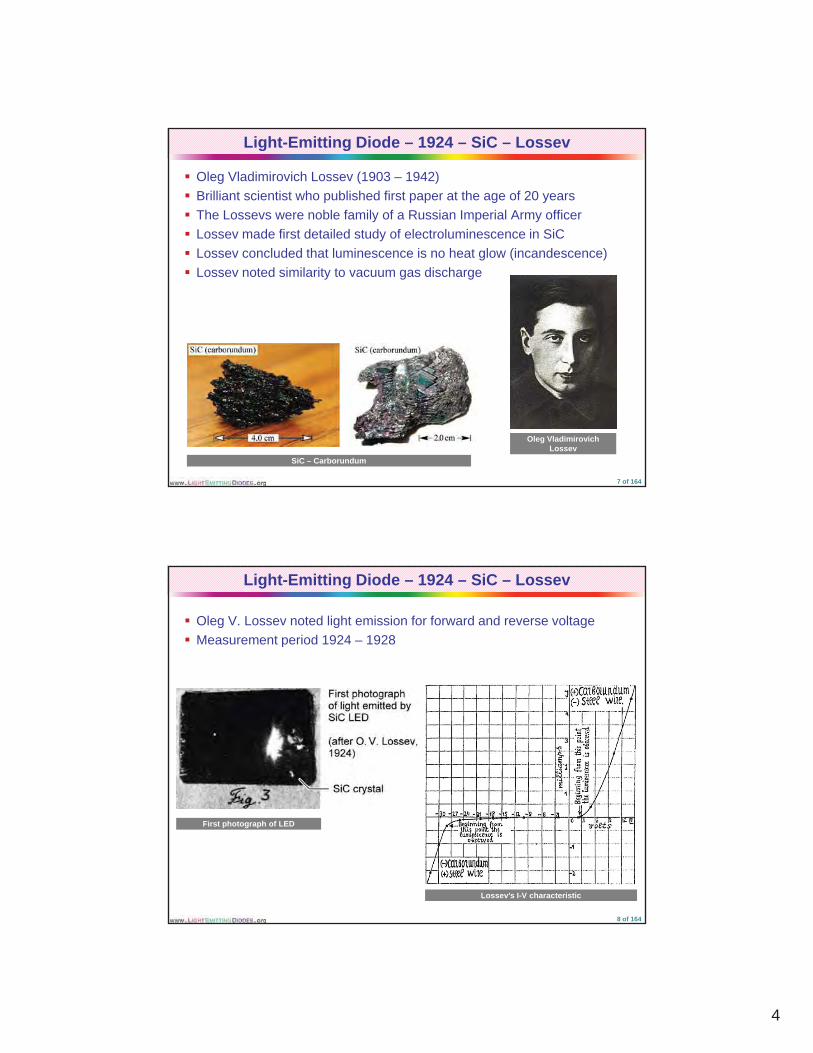
Light-Emitting Diode – 1924 – SiC – Lossev
� Oleg Vladimirovich Lossev (1903 – 1942) � Brilliant scientist who published first paper at the age of 20 years� The Lossevs were noble family of a Russian Imperial Army officer� Lossev made first detailed study of electroluminescence in SiC� Lossev concluded that luminescence is no heat glow (incandescence) � Lossev noted similarity to vacuum gas discharge
Oleg Vladimirovich Lossev
SiC – Carborundum
7 of 164
Light-Emitting Diode – 1924 – SiC – Lossev
� Oleg V. Lossev noted light emission for forward and reverse voltage� Measurement period 1924 – 1928
Lossev’s I-V characteristic
First photograph of LED
8 of 164
5
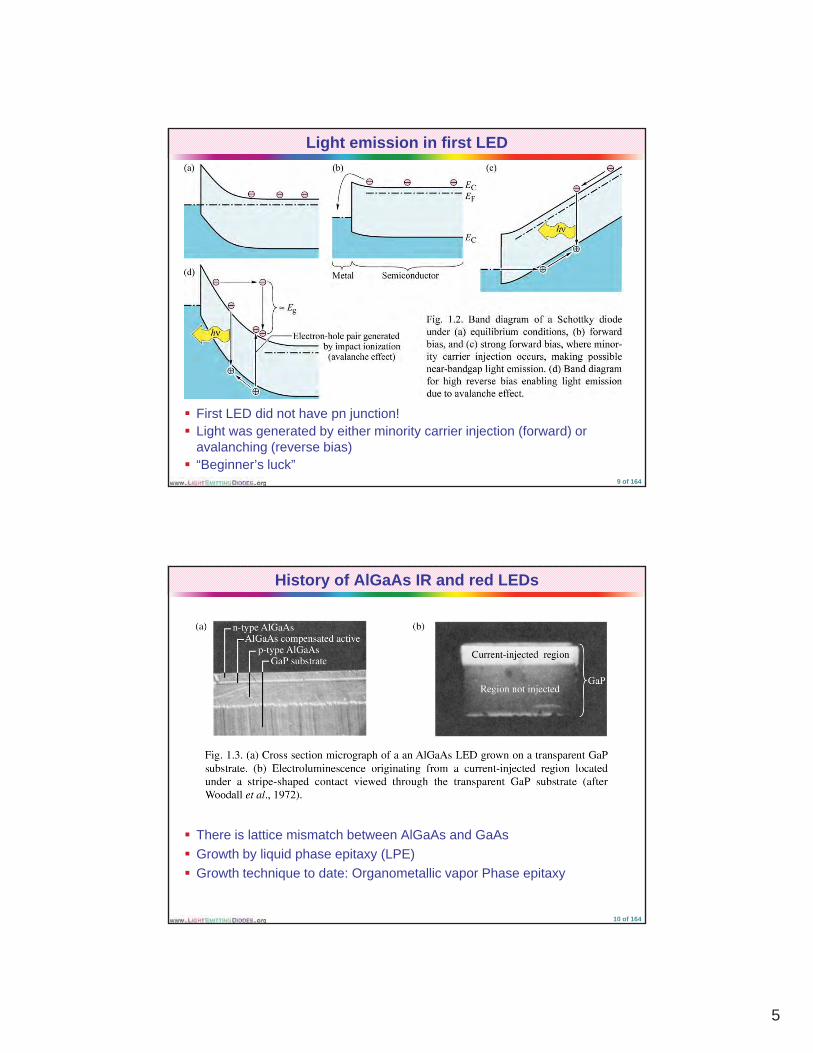
Light emission in first LED
� First LED did not have pn junction!� Light was generated by either minority carrier injection (forward) or
avalanching (reverse bias)� “Beginner’s luck”
9 of 164
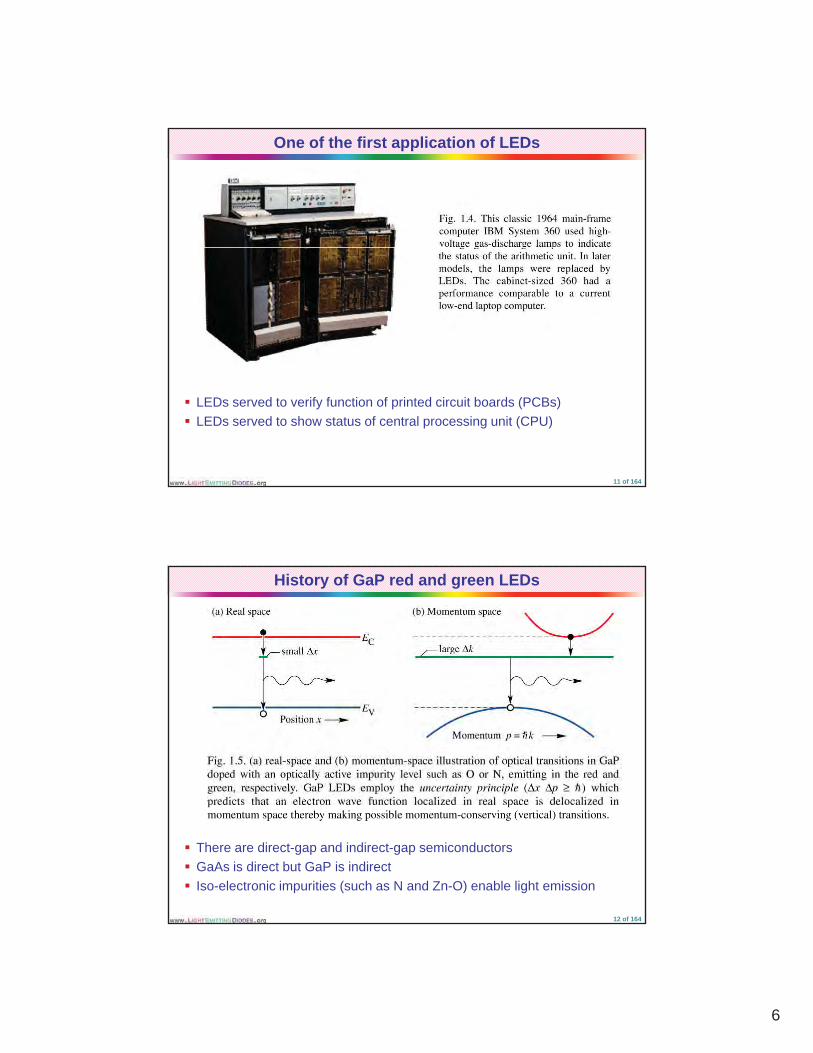
History of AlGaAs IR and red LEDs
� There is lattice mismatch between AlGaAs and GaAs� Growth by liquid phase epitaxy (LPE)� Growth technique to date: Organometallic vapor Phase epitaxy
10 of 164
6
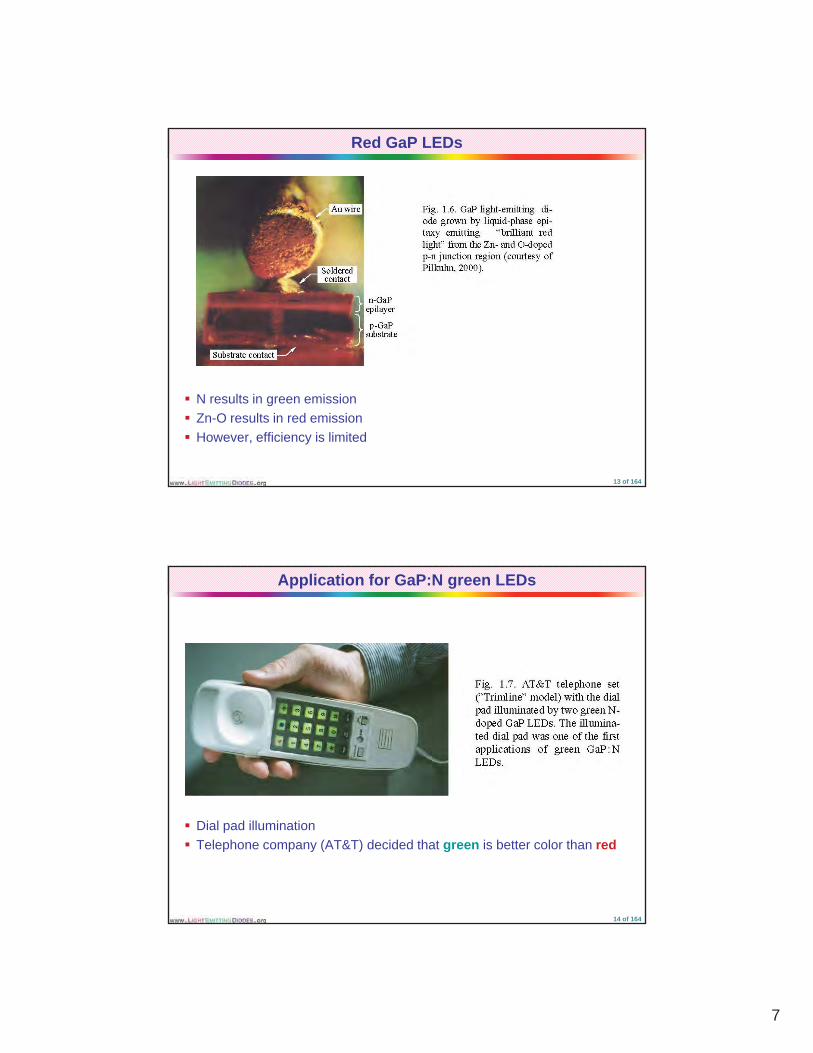
One of the first application of LEDs
� LEDs served to verify function of printed circuit boards (PCBs)� LEDs served to show status of central processing unit (CPU)
11 of 164
History of GaP red and green LEDs
� There are direct-gap and indirect-gap semiconductors� GaAs is direct but GaP is indirect� Iso-electronic impurities (such as N and Zn-O) enable light emission
12 of 164
7
Red GaP LEDs
� N results in green emission� Zn-O results in red emission� However, efficiency is limited
13 of 164
Application for GaP:N green LEDs
� Dial pad illumination� Telephone company (AT&T) decided that green is better color than red
14 of 164

8
LEDs in calculators
� LEDs were used in first generation of calculators� Displayed numbers could not be seen in bright daylight� LEDs consumed so much power that all calculators had rechargeable
batteries15 of 164
History of GaN blue, green, and white light emitters
� Blue emission in GaN in 1972, Maruska et al., 1972
� However, no p-doping attained� Devices were developed by RCA for
three-color flat-panel displaythree color flat panel displayapplications to replace cathode ray tubes (CRTs)
� Nichia Corporation (Japan) was instrumental in blue LED development� Dr. Shuji Nakamura lead of development
16 of 164

9
Applications of green LEDs
� High brightness� High-brightnessLEDs for outdoor applications
17 of 164
History of AlGaInP visible LEDs
� Hewlett-Packard Corporation and Toshiba Corporation developed first high-brightness AlGaInP LEDs
� AlGaInP suited for red, orange, yellow, and yellow-green emitters
18 of 164

10
Recent applications � High power applications
19 of 164
Radiative and nonradiative recombination
� Recombination rate is proportional to the product of the concentrations of electrons and holes
� R = B n pwhereB = bimolecular recombination coefficient n = electron concentrationp = hole concentration
20 of 164

11
Radiative electron-hole recombination
n � n0 � �n p � p0 � �pand
R � �dndt
� �dpdt
� B n p
n free electron concentration
n0 equilibrium free electron concentration
�n excess electron concentration
dt dt
R recombination rate per cm3 per s
B bimolecular recombination coefficient
21 of 164
Carrier decay (low excitation)
tpnBntn )(0 00e)( �����
� � 100
���� pnB
� carrier lifetime
B bimolecular recombination coefficient
22 of 164

12
Radiative recombination for low-level excitation
� Radiative lifetimes determine switch-on and switch-off times23 of 164
Recombination lifetime: Theory versus experiment
� Radiative lifetime decreases with doping concentration24 of 164

13
Nonradiative recombination in the bulk
� Generation of heat competes with generation of light� This is a very fundamental issue
25 of 164
Recombination mechanisms
� Recombination via deep levels� Auger recombination � Radiative recombination
26 of 164
14
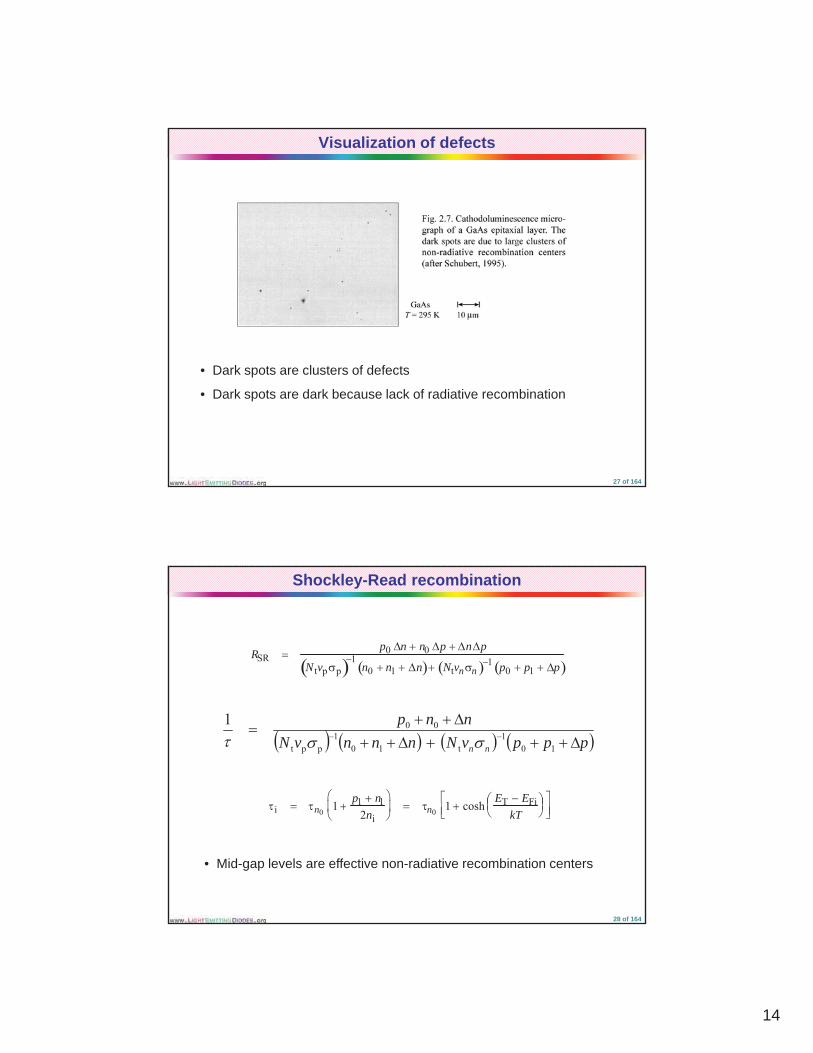
Visualization of defects
D k t l t f d f t• Dark spots are clusters of defects
• Dark spots are dark because lack of radiative recombination
27 of 164
Shockley-Read recombination
RSR �p0 �n � n0 �p � �n�p
N tvp p� �1 n0 � n1 � �n� � Ntvn n� �1 p0 � p1 � �p�
� � 1 �p1 � n1��
���� � 1 � cosh
ET � EFi��� ������
���
� � � � pppvNnnnvNnnp
nn ����������
� ��10
1t10
1ppt
001 �
�i � �n0 1 �2ni��
������ � �n0 1 � cosh
kT����
����
���� ����
• Mid-gap levels are effective non-radiative recombination centers
28 of 164
15
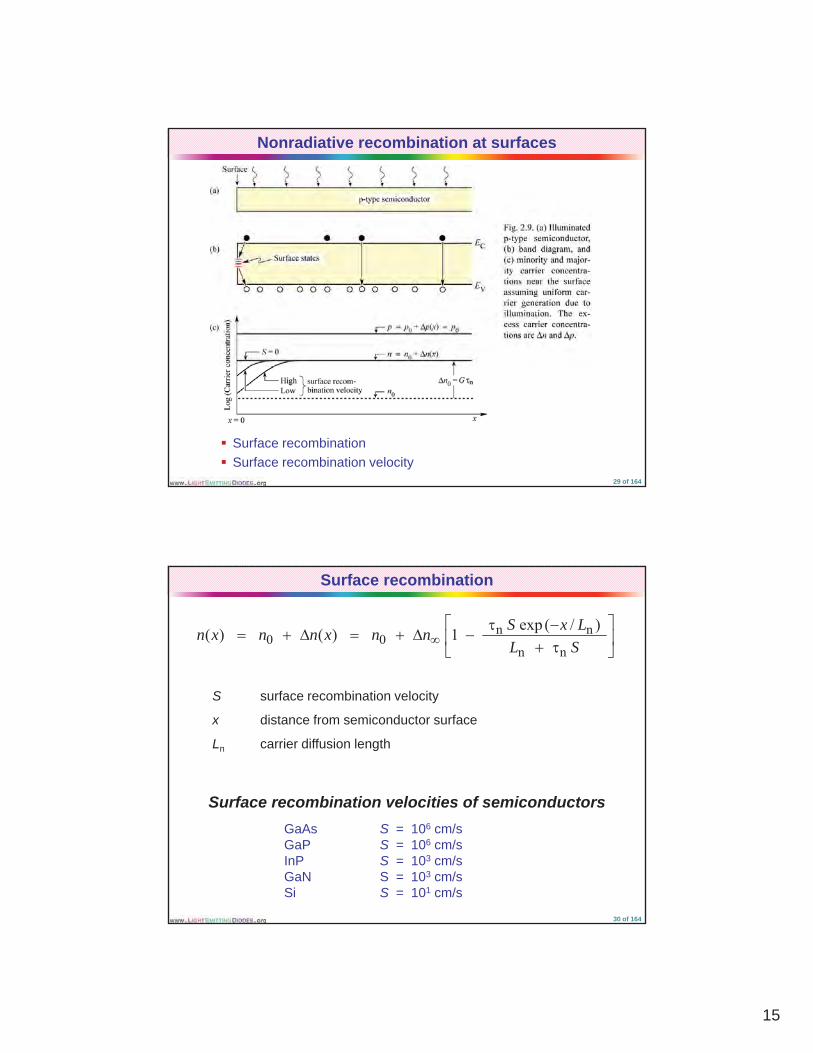
Nonradiative recombination at surfaces
� Surface recombination� Surface recombination velocity
29 of 164
Surface recombination
��
���
�����
������� � SLLxSnnxnnxn
nn
nn00
)/(exp1)()(
S surface recombination velocity
x distance from semiconductor surface
Ln carrier diffusion length
Surface recombination velocities of semiconductorsGaAs S = 106 cm/sGaP S = 106 cm/sInP S = 103 cm/sGaN S = 103 cm/sSi S = 101 cm/s
Surface recombination velocities of semiconductors
30 of 164
16
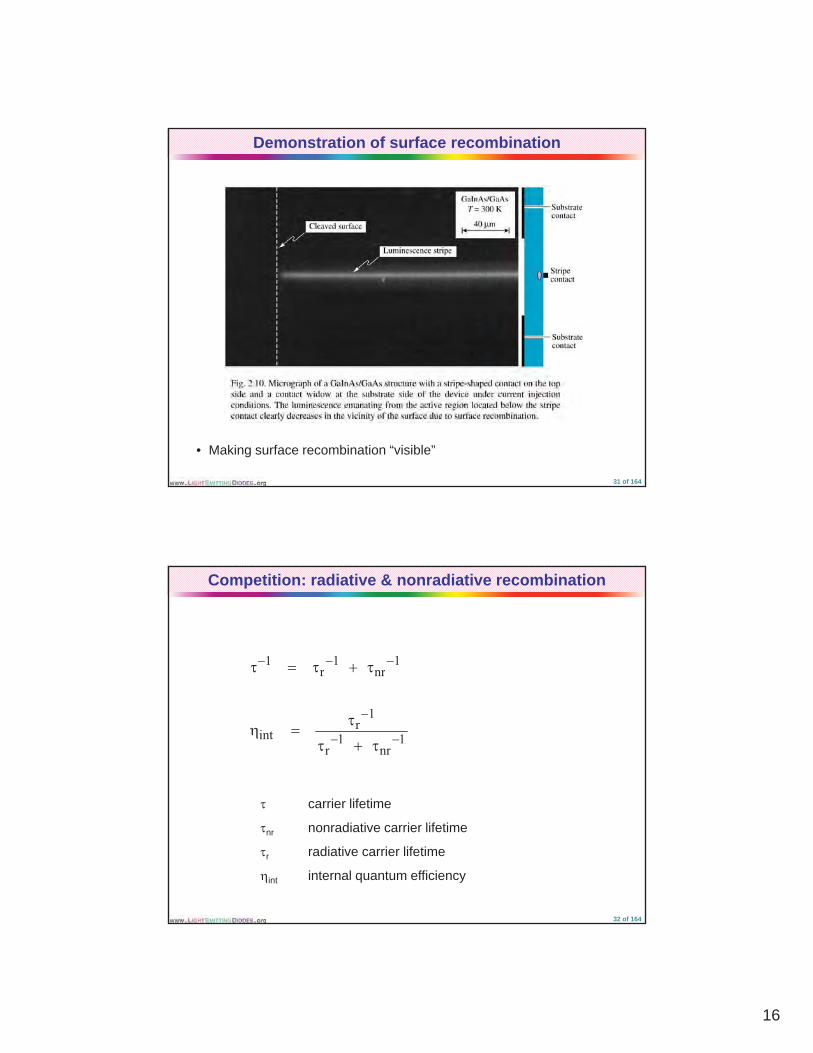
Demonstration of surface recombination
• Making surface recombination “visible”
31 of 164
Competition: radiative & nonradiative recombination
1nr
1r
1 ��� �����
1nr
1r
1r
int ��
�
���
���
� carrier lifetime� carrier lifetime
�nr nonradiative carrier lifetime
�r radiative carrier lifetime
�int internal quantum efficiency
32 of 164
17
LED basics: Electrical properties
Shockley equation for p-n junction diodes
� 1–e0pn
0np kTeVnDp
DAeI
���
���
��
Shockley equation for p-n junction diodes
�
�
�
1–eA
2i
n
n
D
2i
p
p
0pn
0np
k
kTeVNnD
NnD
Ae
p
��
�
�
��
�
�
��
��
��
�� ��
� 1–eskTeVI�
where Is is the saturation current
33 of 164
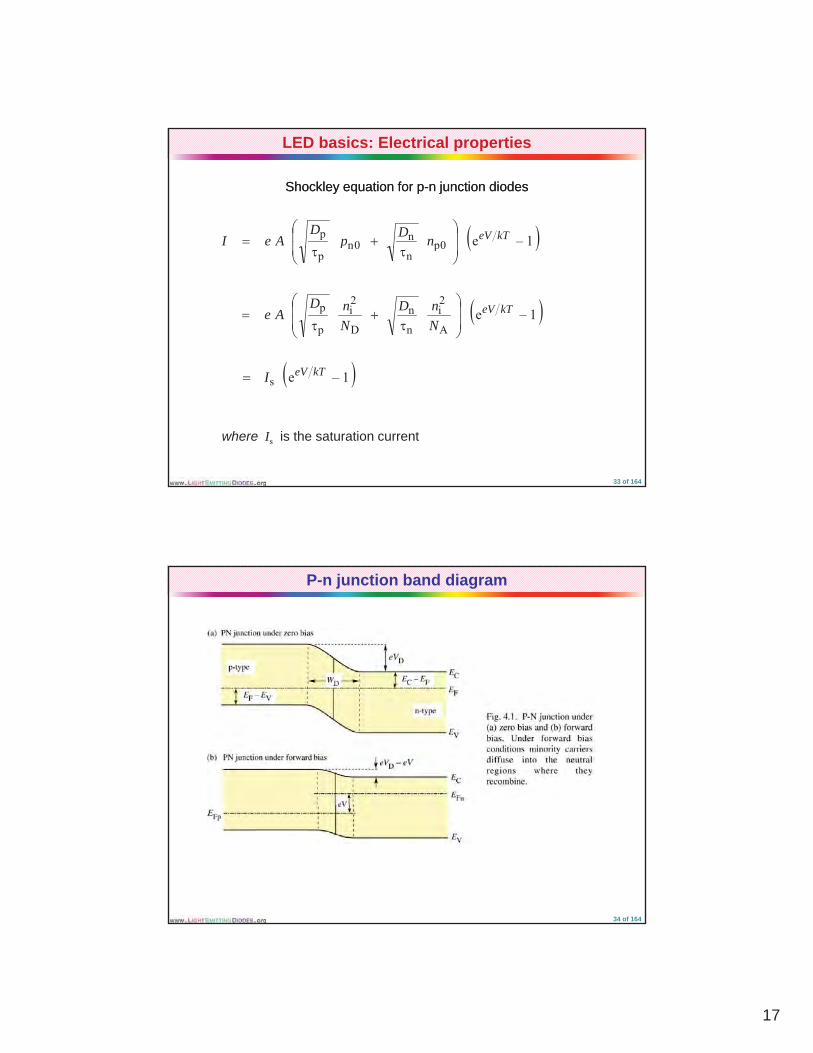
P-n junction band diagram
34 of 164
18
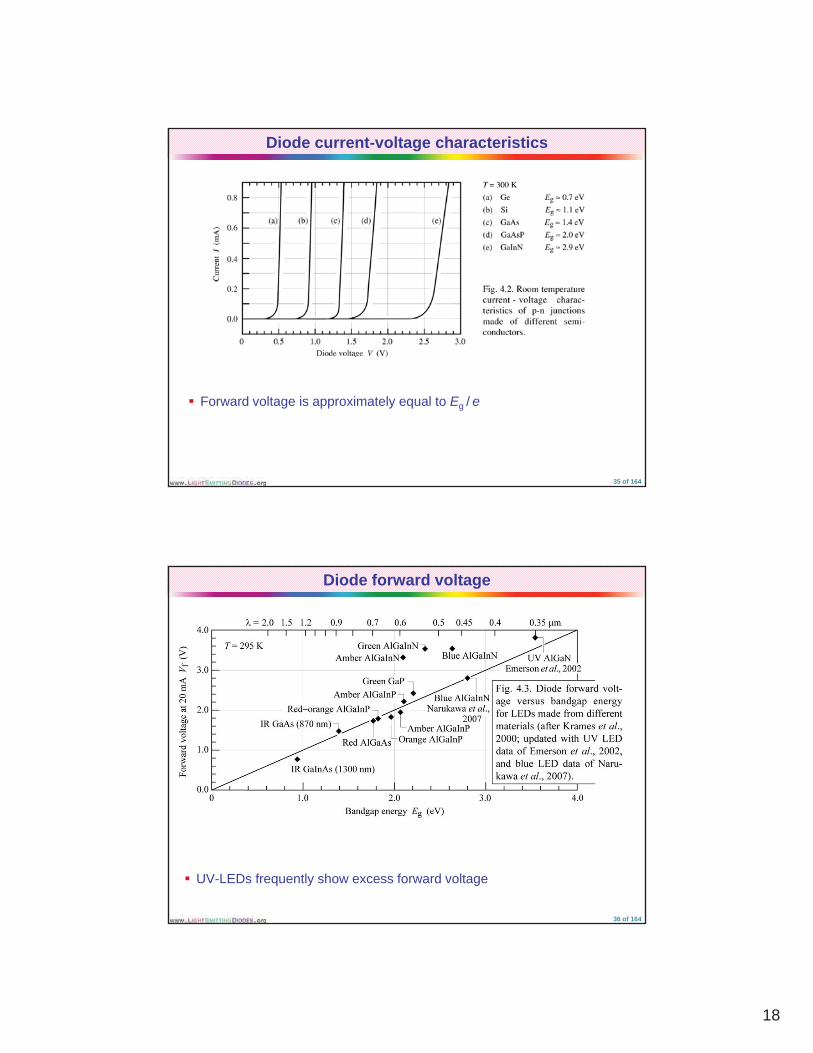
Diode current-voltage characteristics
� Forward voltage is approximately equal to Eg / e
35 of 164
Diode forward voltage
� UV-LEDs frequently show excess forward voltage
36 of 164

19
Deviations from ideal I-V characteristic
)(s ideale kTneVII �
)()(s
p
s idealse kTnRIVeIR
RIVI ���
�
nideal ideality factorideal y
Rs parasitic series resistance
Rp parasitic parallel resistance
37 of 164
Non-ideal I-V characteristics
� Problem areas of diode can be identified from I-V characteristic
38 of 164
20
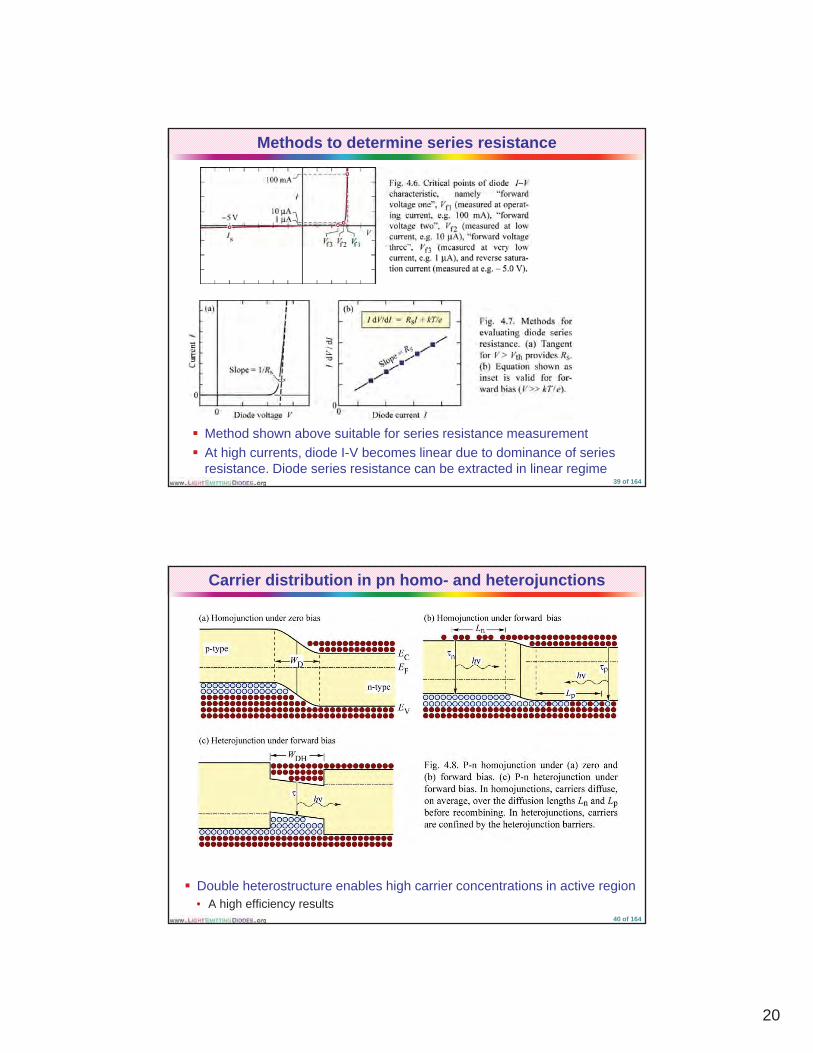
Methods to determine series resistance
� Method shown above suitable for series resistance measurement � At high currents, diode I-V becomes linear due to dominance of series
resistance. Diode series resistance can be extracted in linear regime 39 of 164
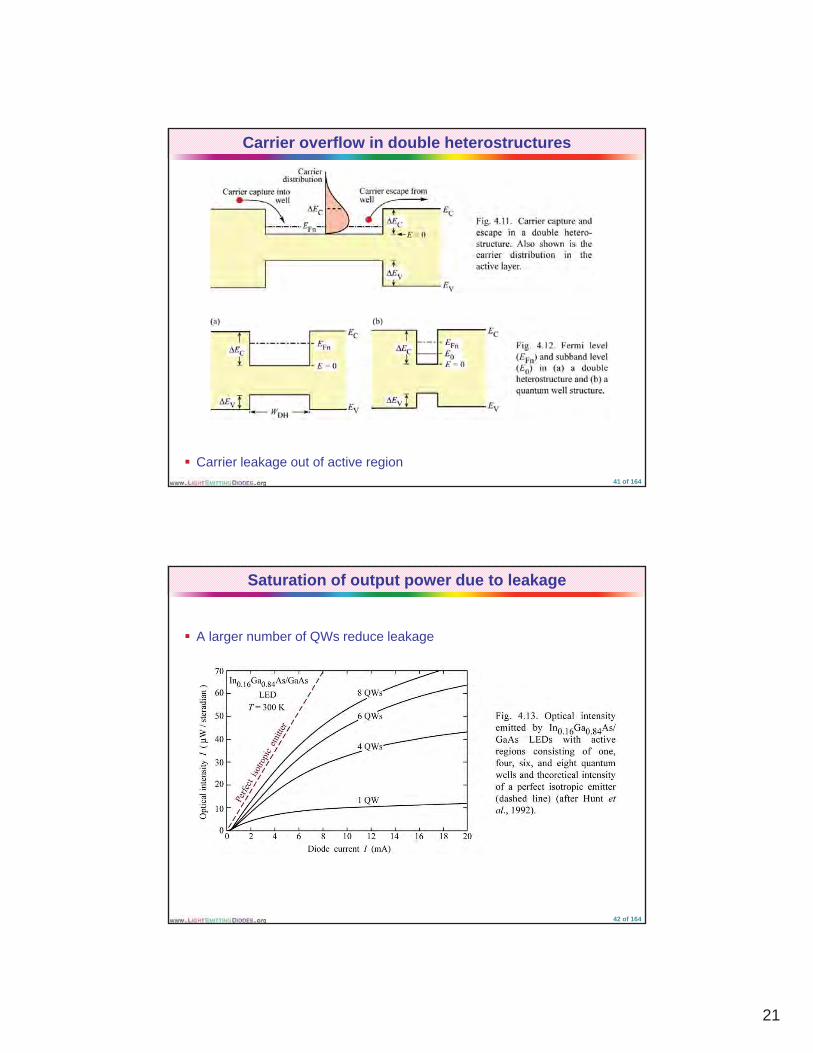
Carrier distribution in pn homo- and heterojunctions
� Double heterostructure enables high carrier concentrations in active region• A high efficiency results
40 of 164
21
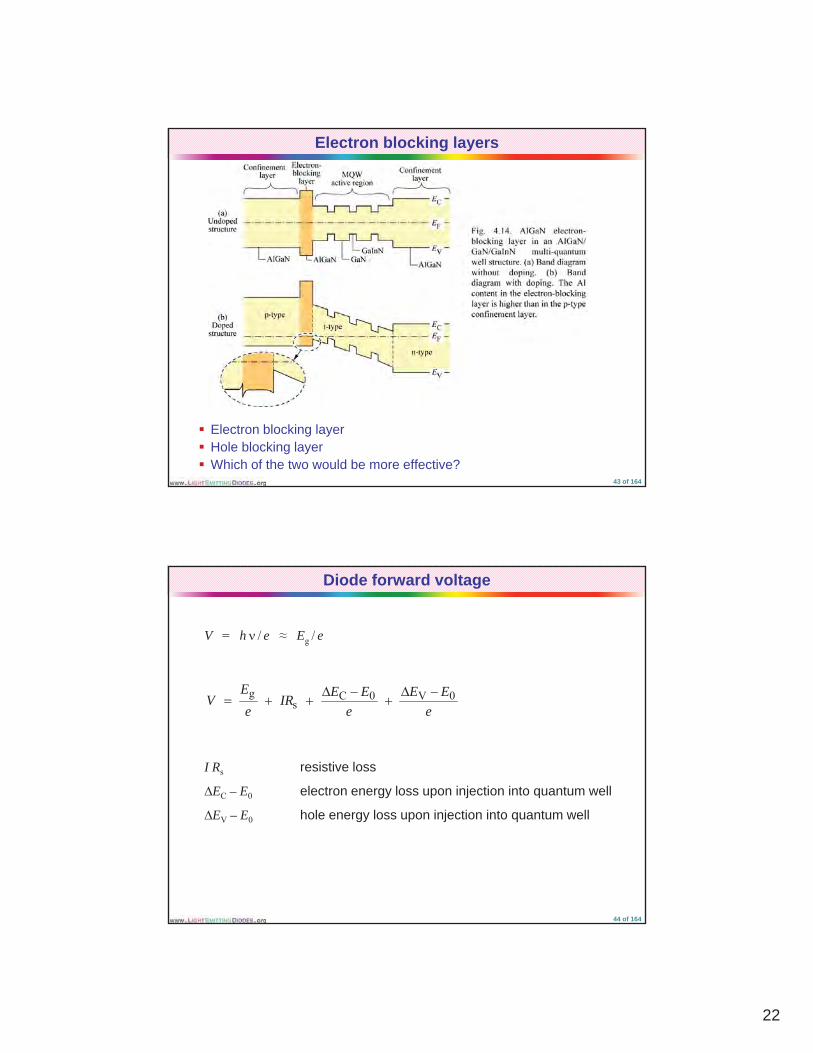
Carrier overflow in double heterostructures
� Carrier leakage out of active region41 of 164
Saturation of output power due to leakage
� A larger number of QWs reduce leakage
42 of 164
22
Electron blocking layers
� Electron blocking layer� Hole blocking layer� Which of the two would be more effective?
43 of 164
Diode forward voltage
V = h � / e � Eg / e
Ee
EEe
EEIRe
EV 0V0C
sg ��
���
���
I Rs resistive loss
�EC – E0 electron energy loss upon injection into quantum well
�EV – E0 hole energy loss upon injection into quantum well
44 of 164

23
LED basics: Optical properties
Internal, extraction, external, and power efficiency
eIhP
/)(/
secondperLEDintoinjectedelectronsofnumbersecondperregionactivefromemittedphotonsofnumber int
int�
���
secondperregionactivefromemittedphotonsofnumbersecondperspacefreeintoemittedphotonsofnumber
extraction ��
)/(sec.perspacefreeintoemittedphotonsofnumber �hP
eI /secondperLEDintoinjectedelectronsofnumber
extractionintext /)/(
sec.perLEDintoinjectedelectronsofnumbersec.perspacefreeintoemittedphotonsofnumber
����
���eIhP
VIP
��power Power efficiency = Wall-plug efficiency = “Power out” / “power in”
45 of 164
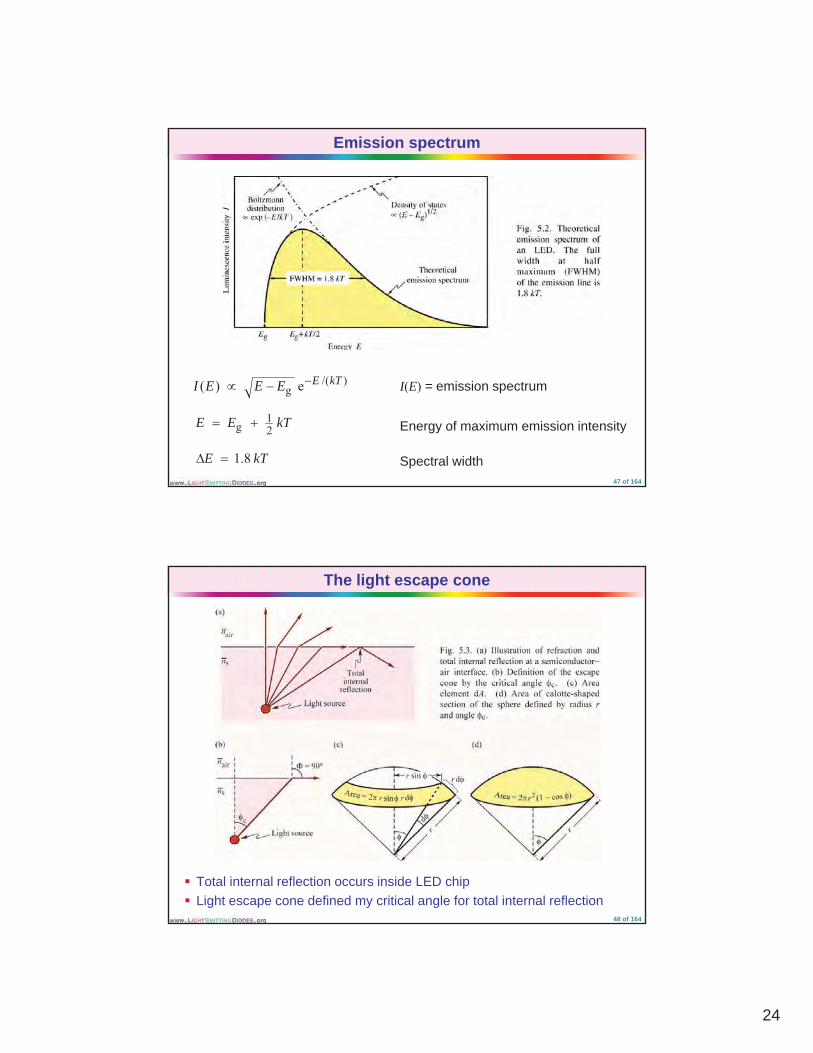
Emission spectrum
� Electron and hole momentum must be conserved� Photon has negligible momentum
46 of 164
24
Emission spectrum
)(/g e)( kTEEEEI ���
Energy of maximum emission intensitykTEE 21
g ��
kTE 8.1��
I(E) = emission spectrum
Spectral width47 of 164
The light escape cone
� Total internal reflection occurs inside LED chip� Light escape cone defined my critical angle for total internal reflection
48 of 164
25
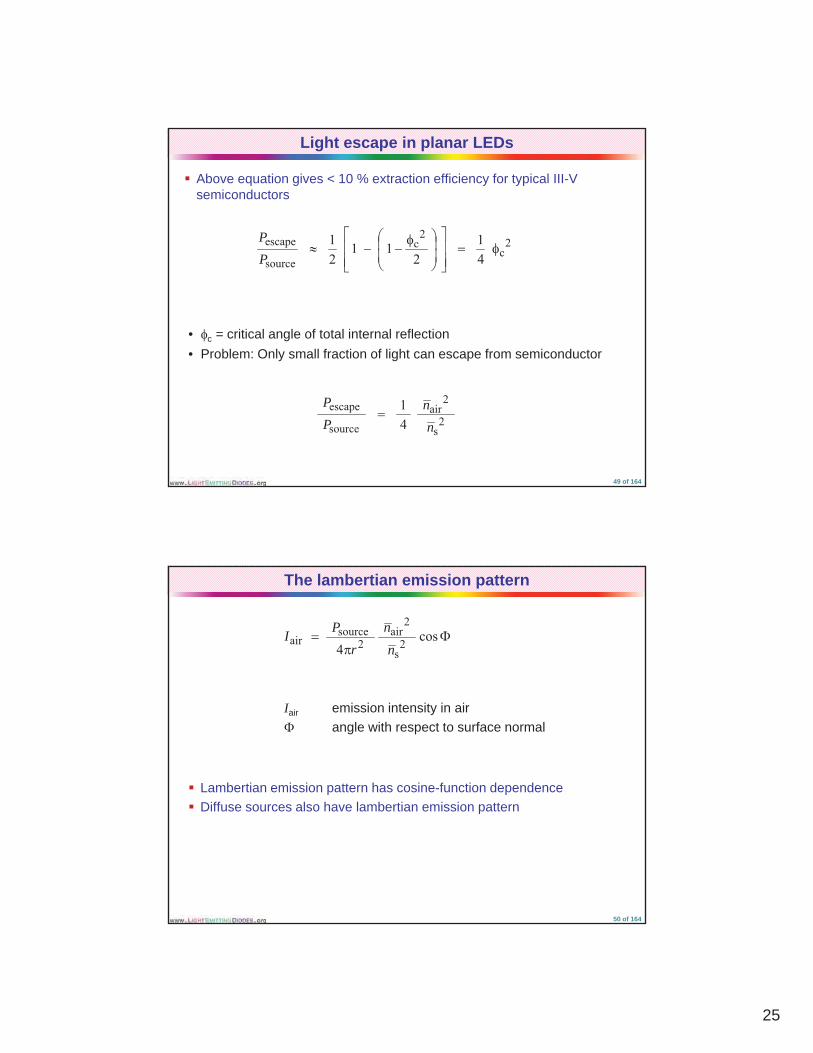
Light escape in planar LEDs
� Above equation gives < 10 % extraction efficiency for typical III-V semiconductors
22
cescape 1111��
���
��
�� �
�P
csource
p42
112
������
��
���
������
P
• �c = critical angle of total internal reflection• Problem: Only small fraction of light can escape from semiconductor
2s
2air
source
escape41
nn
PP
�
49 of 164
The lambertian emission pattern
!
� cos4 2
s
2air
2source
airn
nr
PI
� Lambertian emission pattern has cosine-function dependence � Diffuse sources also have lambertian emission pattern
Iair emission intensity in air angle with respect to surface normal
� Diffuse sources also have lambertian emission pattern
50 of 164
26
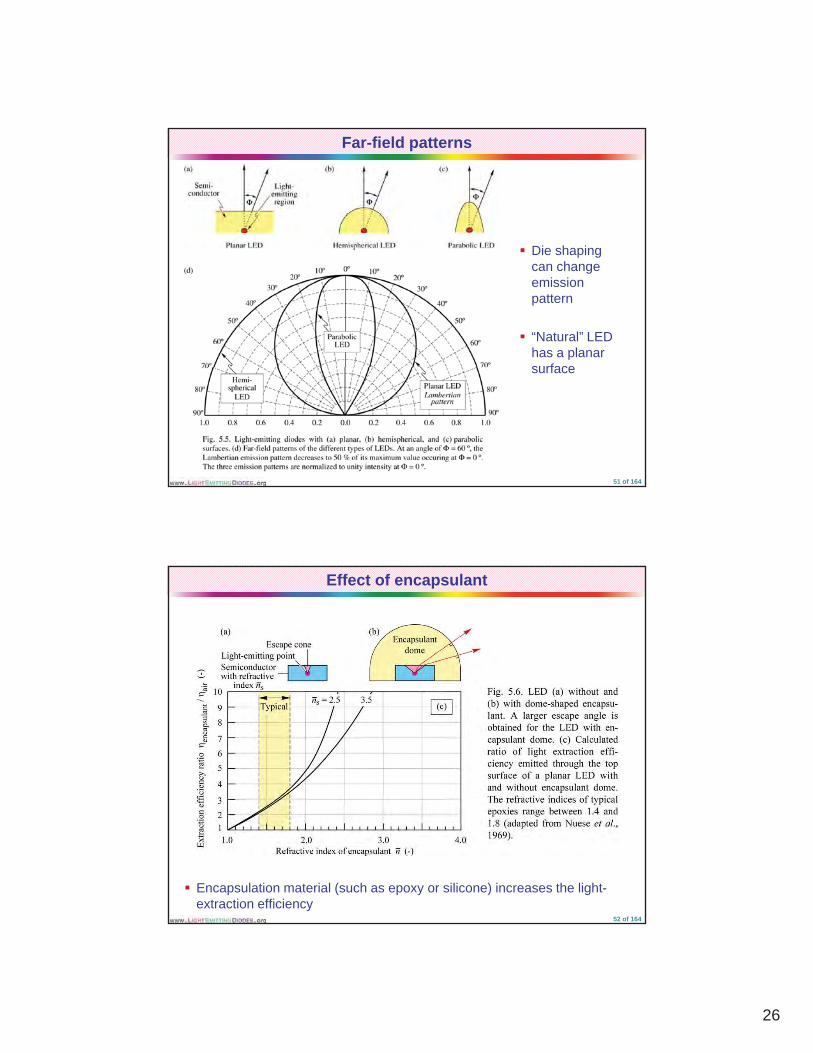
Far-field patterns
Di h i� Die shapingcan change emissionpattern
� “Natural” LED has a planar surfacesurface
51 of 164
Effect of encapsulant
� Encapsulation material (such as epoxy or silicone) increases the light-extraction efficiency
52 of 164

27
Temperature dependence of emission intensity
� Temperature dependence is characterized in terms of a characteristic temperature T1
� I = I0 exp ( – T / T1)� High T1 is desirable
53 of 164
Temperature dependence of diode voltage
Di d lt� Diode voltagedecreases with increasingtemperature due to decrease in energy gap and increase in saturation current densitycurrent density
54 of 164
28
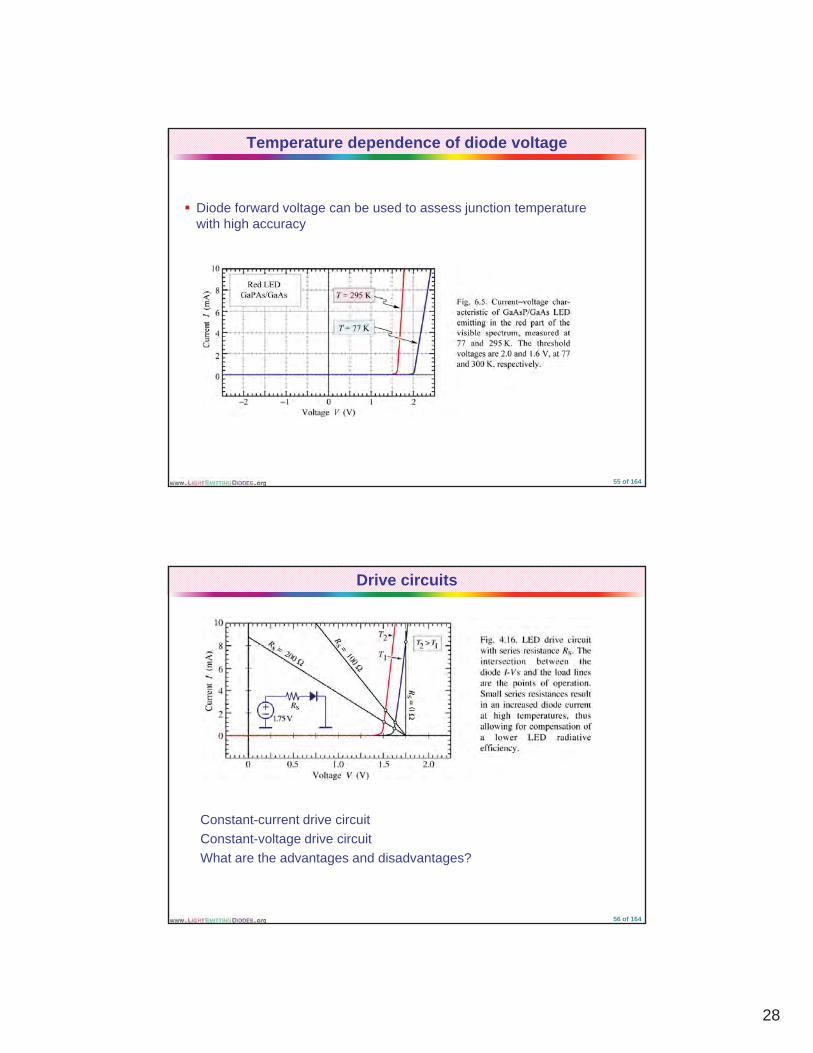
Temperature dependence of diode voltage
� Diode forward voltage can be used to assess junction temperature with high accuracy
55 of 164
Drive circuits
• Constant-current drive circuit • Constant-voltage drive circuit• What are the advantages and disadvantages?
56 of 164
29
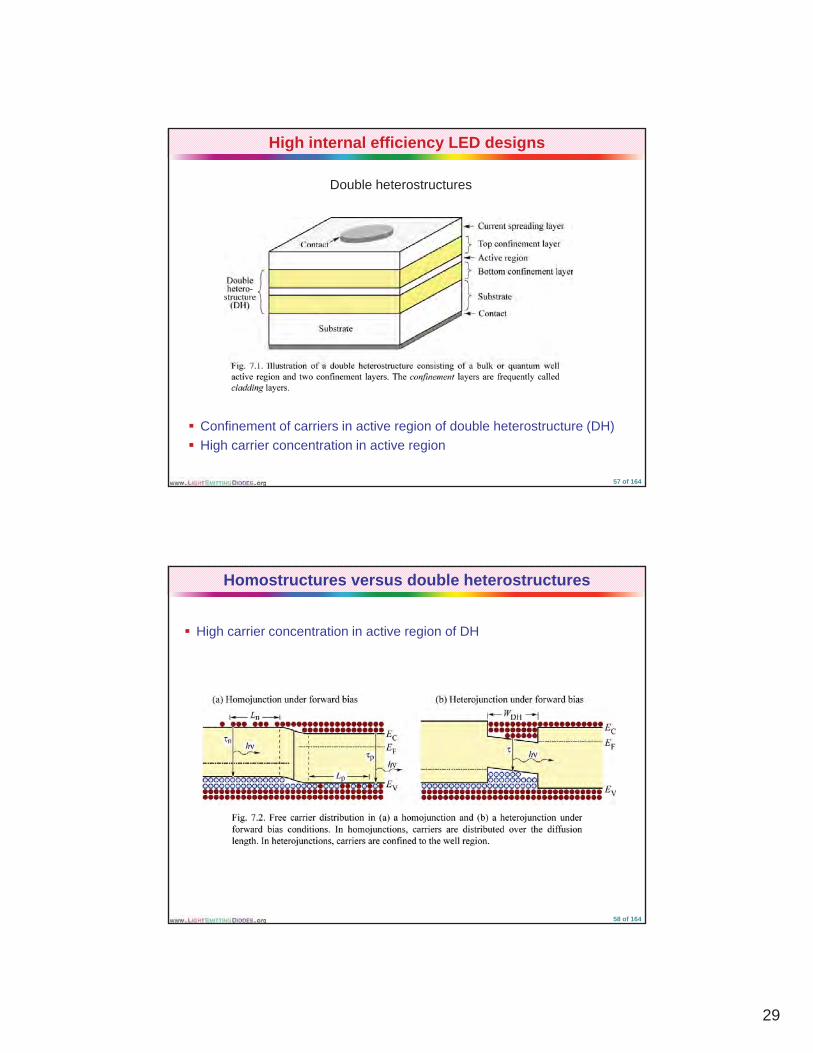
High internal efficiency LED designs
Double heterostructures
� Confinement of carriers in active region of double heterostructure (DH)� High carrier concentration in active region
57 of 164
Homostructures versus double heterostructures
� High carrier concentration in active region of DH
58 of 164
30
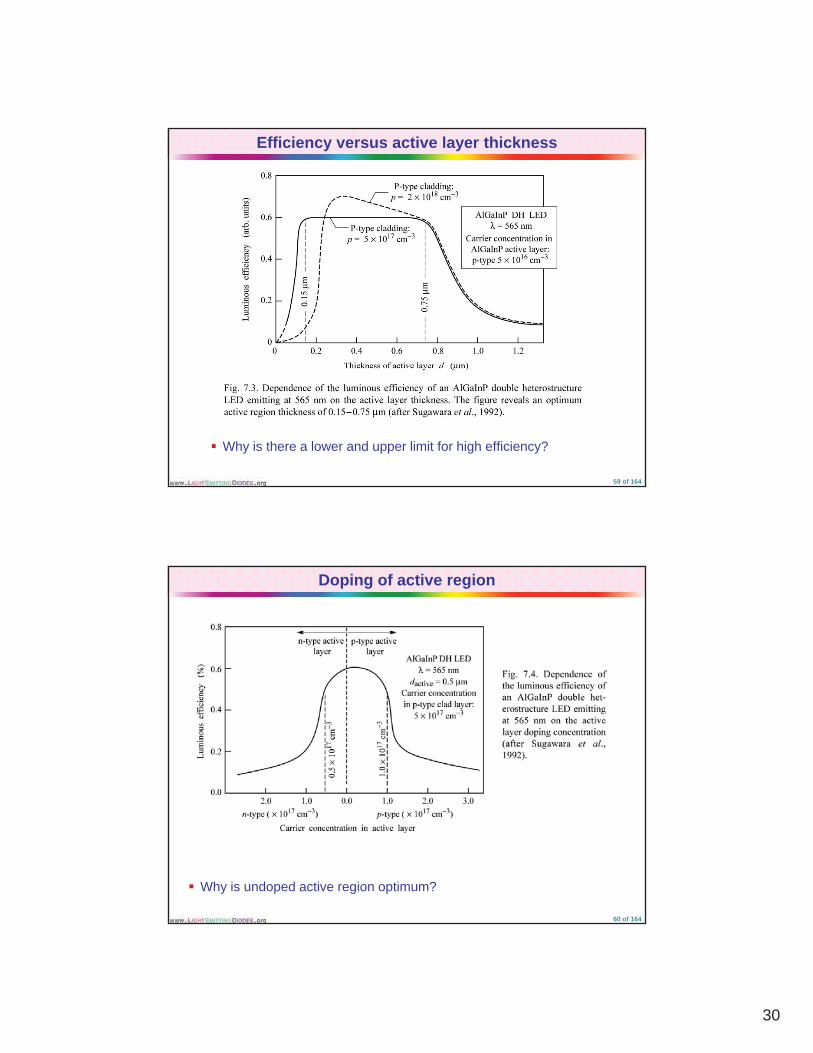
Efficiency versus active layer thickness
� Why is there a lower and upper limit for high efficiency?
59 of 164
Doping of active region
� Why is undoped active region optimum?
60 of 164

31
Non-radiative recombination and lifetime
� Device reliability affected by surface recombination
61 of 164
Lattice matching
� Lattice matching crucial for high efficiency� Multitude of defects are created in mismatched material systems
62 of 164

32
Lattice matching
� Dark lines due to dislocation lines� Radiative efficiency low at dislocation lines
63 of 164
Pseudomorphic layers
� Thin layers can be elastically strained without incurring defects
64 of 164

33
Lattice matching
� Lattice matching better than 0.2 % required in AlGaInP material system� Major challenge: High-quality crystal growth on mismatched substrates
65 of 164
Design of current flow
� Light is generated under top contact� Top contact shadows light � Current spreading layer spreads current to edges of the LED die
66 of 164
34
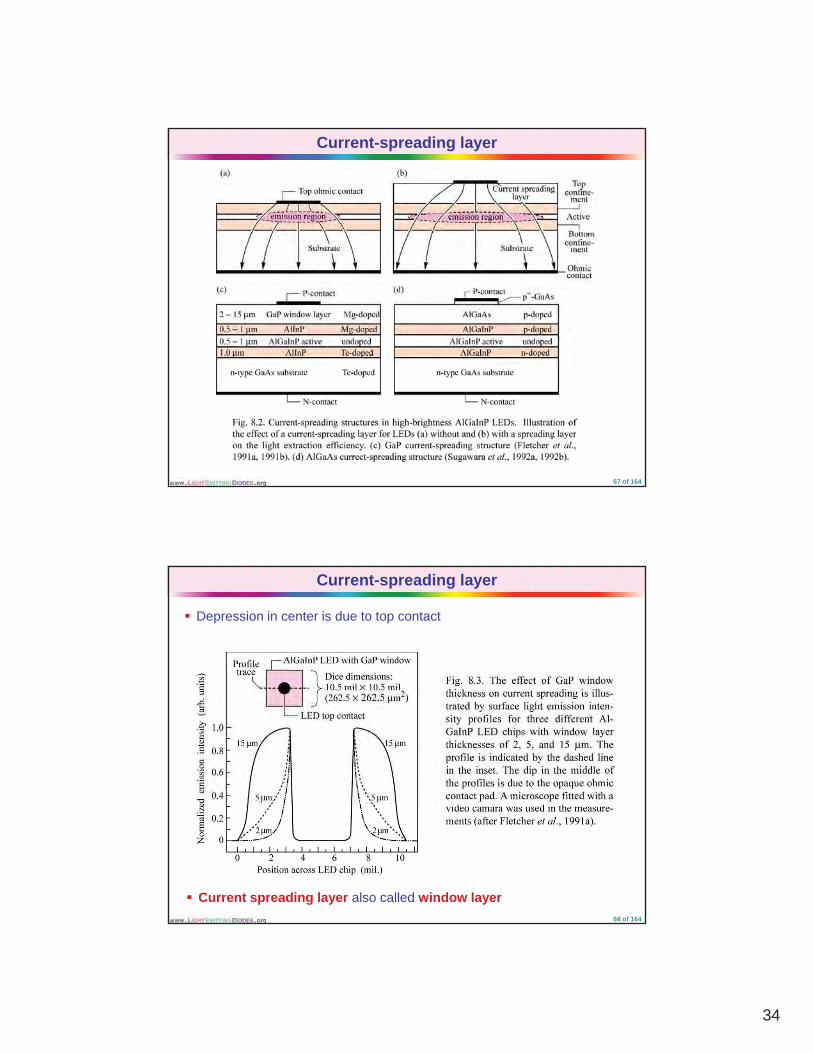
Current-spreading layer
67 of 164
Current-spreading layer
� Depression in center is due to top contact
� Current spreading layer also called window layer68 of 164

35
Current-spreading layer
� Why is there a lower limit and an upper limit for the optimum thickness of the current-spreading layer?
69 of 164
Theory of current spreading
70 of 164
36
Theory of current spreading
Current spreading length
t nideal k TLs �
t nideal k T" J0 e
t � " Ls2 J0
enideal kTideal
t = thickness of current spreading layer
71 of 164
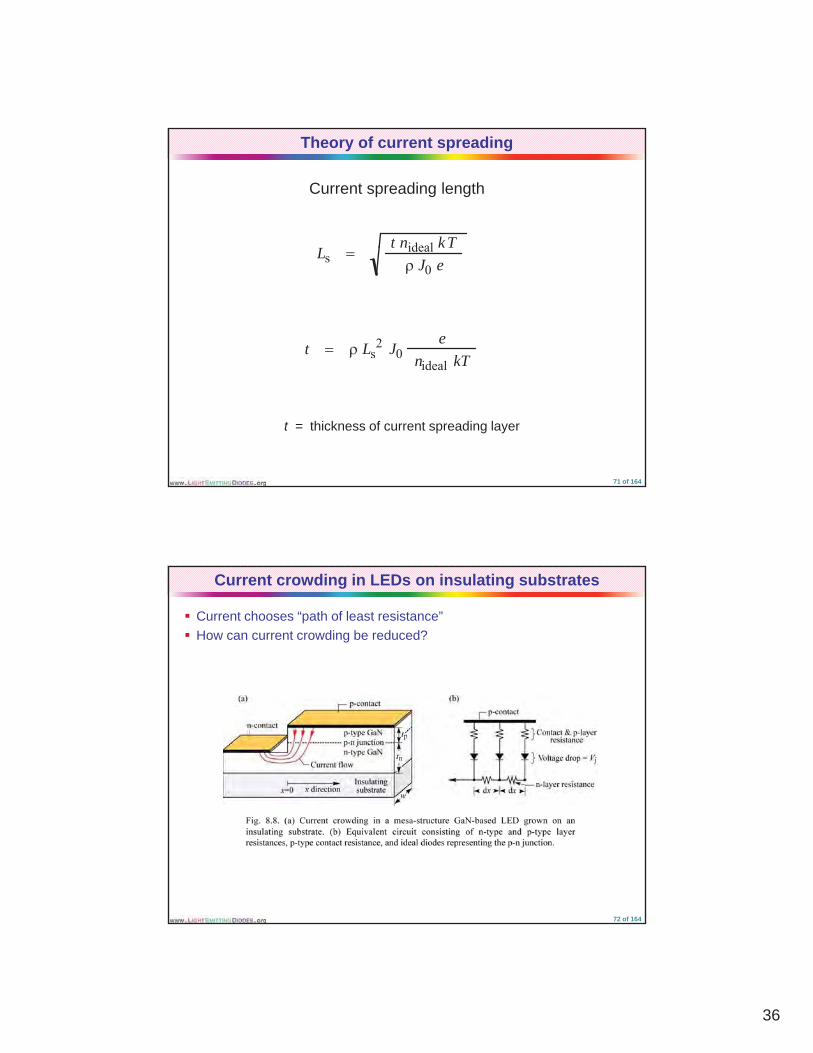
Current crowding in LEDs on insulating substrates
� Current chooses “path of least resistance” � How can current crowding be reduced?
72 of 164
37
Theory of current crowding
Theory of current crowding in LEDs on insulating substrates
J(x) � J(0) exp � x / Ls�
Ls � ("c � "ptp) tn / "n
Ls = current spreading length
73 of 164
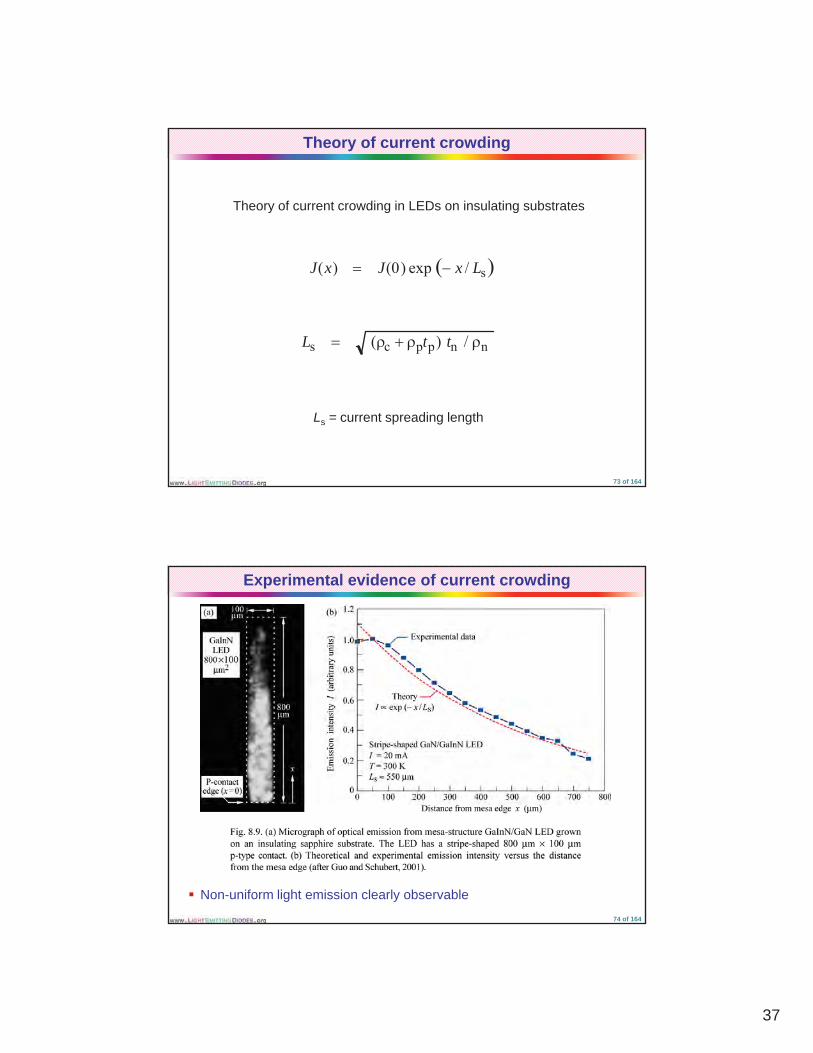
Experimental evidence of current crowding
� Non-uniform light emission clearly observable 74 of 164
38
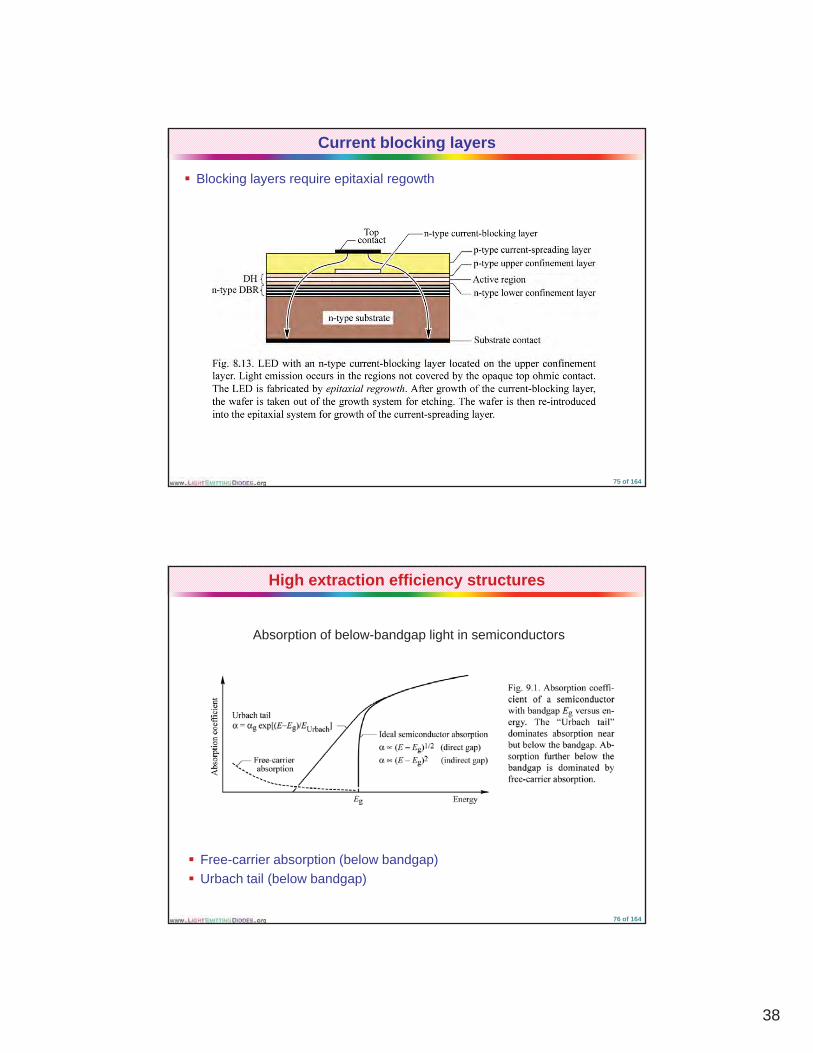
Current blocking layers
� Blocking layers require epitaxial regowth
75 of 164
High extraction efficiency structures
Absorption of below-bandgap light in semiconductors
� Free-carrier absorption (below bandgap) � Urbach tail (below bandgap)
76 of 164

39
Double heterostructures
� Double heterostructures (DHs) are optically transparent� All efficient LED designs use a DH
77 of 164
Shaping of LED dies
� Light “rattles around” and cannot escape� Die shaping promises advantages� Die shaping can be expensive
78 of 164
40
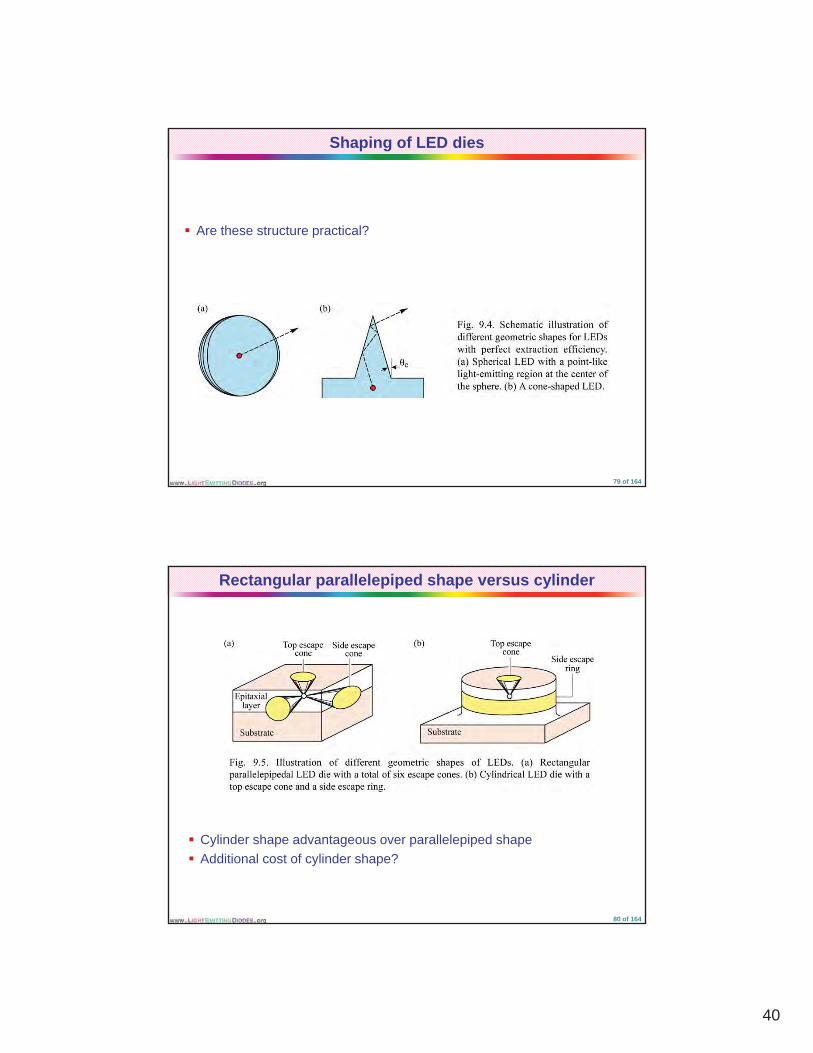
Shaping of LED dies
� Are these structure practical?
79 of 164
Rectangular parallelepiped shape versus cylinder
� Cylinder shape advantageous over parallelepiped shape� Additional cost of cylinder shape?
80 of 164

41
Truncated inverted pyramid (TIP) LED
� Additional cost of die shaping
81 of 164
Truncated inverted pyramid (TIP) LED
� One of the most efficient LED designs
82 of 164
42
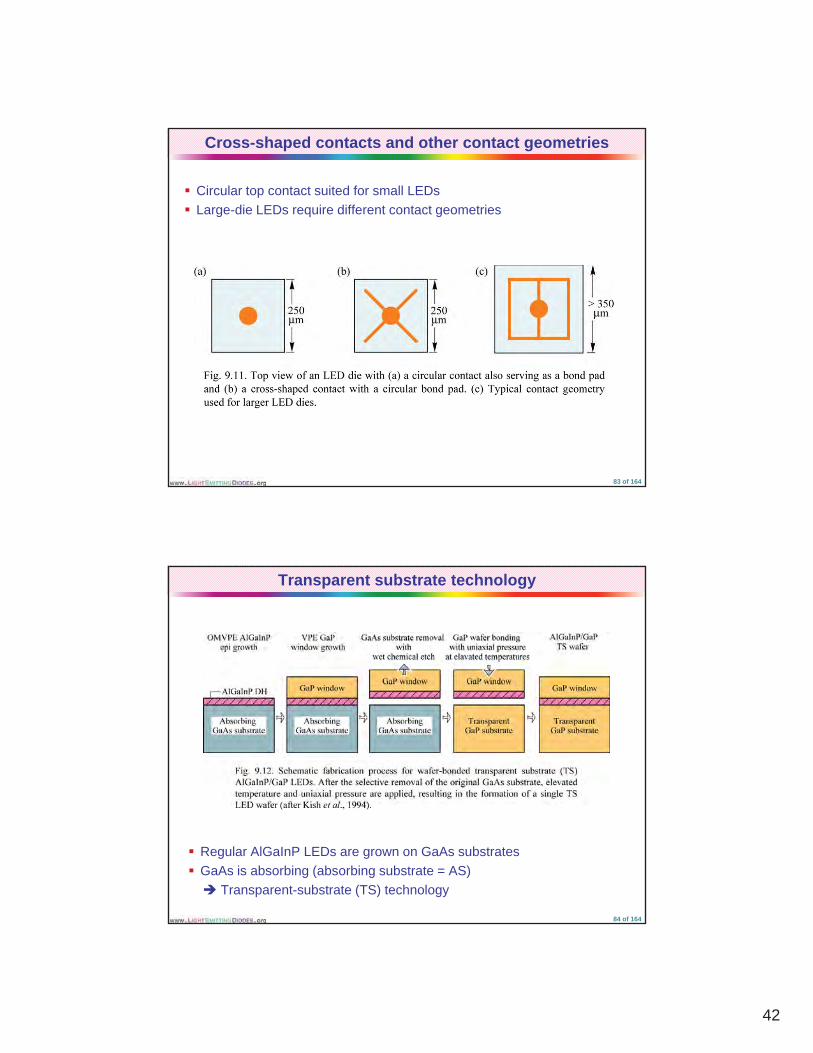
Cross-shaped contacts and other contact geometries
� Circular top contact suited for small LEDs� Large-die LEDs require different contact geometries
83 of 164
Transparent substrate technology
� Regular AlGaInP LEDs are grown on GaAs substrates� GaAs is absorbing (absorbing substrate = AS)
� Transparent-substrate (TS) technology
84 of 164

43
AS versus TS technology
� Transparent substrate (TS) clearly better than absorbing substrate (AS)
85 of 164
Anti-reflection optical coatings
2airs
2airs
)()(
nnnnR�
��
Dielectric material Refractiveindex
Transparency range
SiO2 (Silica) 1.45 > 0.15 #m
Al2O3 (Alumina) 1.76 > 0.15 #m
TiO (Titania) 2 50 > 0 35 #mTable: Refractive
i d d TiO2 (Titania) 2.50 > 0.35 #m
Si3N4 2.00 > 0.25 #m
ZnS 2.29 > 0.34 #m
CaF2 1.43 > 0.12 #m
index andtransparency range
of common dielectrics suitable as
anti-reflection (AR) coatings (after Palik,
1998)
86 of 164
44
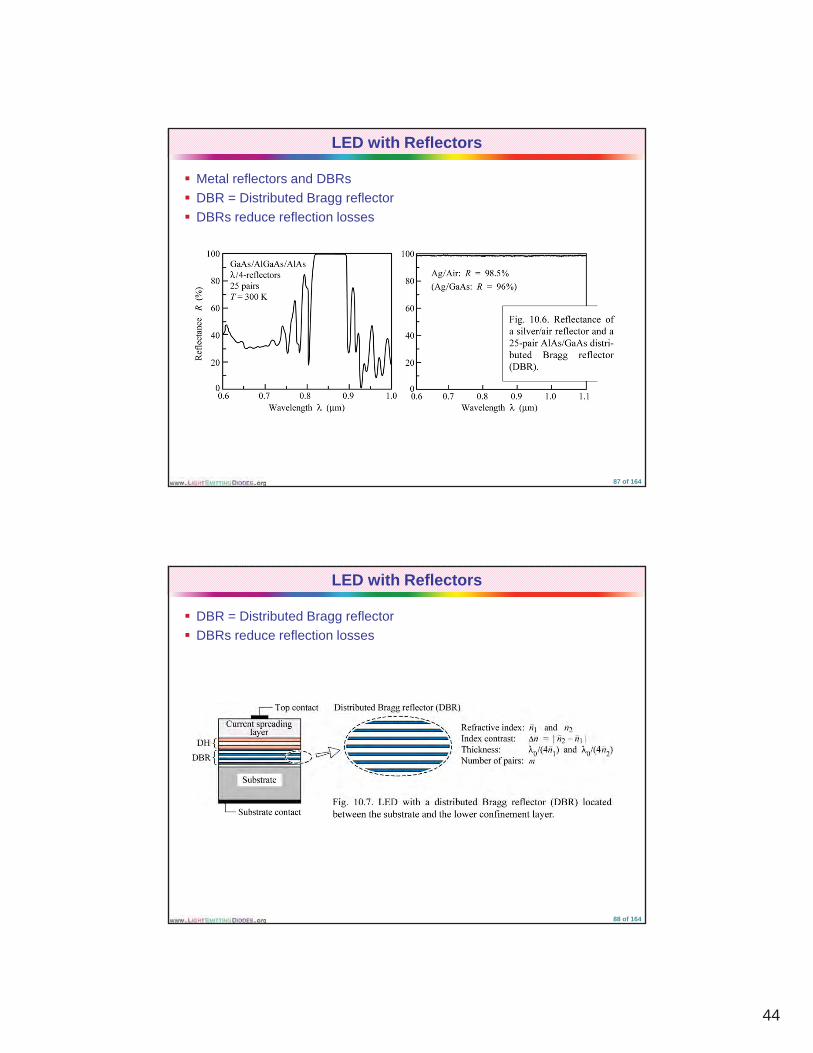
LED with Reflectors
� Metal reflectors and DBRs� DBR = Distributed Bragg reflector� DBRs reduce reflection losses
87 of 164
LED with Reflectors
� DBR = Distributed Bragg reflector� DBRs reduce reflection losses
88 of 164
45
Distributed Bragg reflectors
tl,h � $l,h / 4 � $ 0 / (4 nl,h )
… valid for normal incidence
tl,h � $l,h / ( 4 cos%l,h ) � $0 / ( 4 nl,h cos% l,h )
… valid for oblique incidence
89 of 164
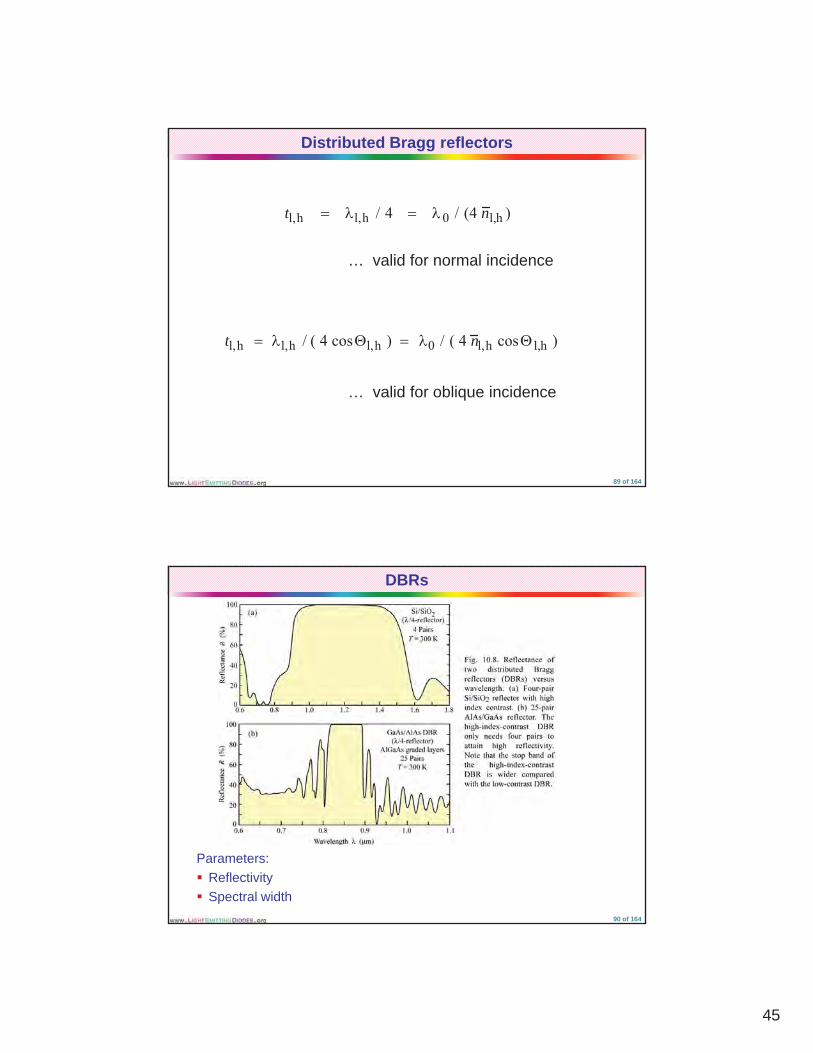
DBRs
Parameters:� Reflectivity� Spectral width
90 of 164
46
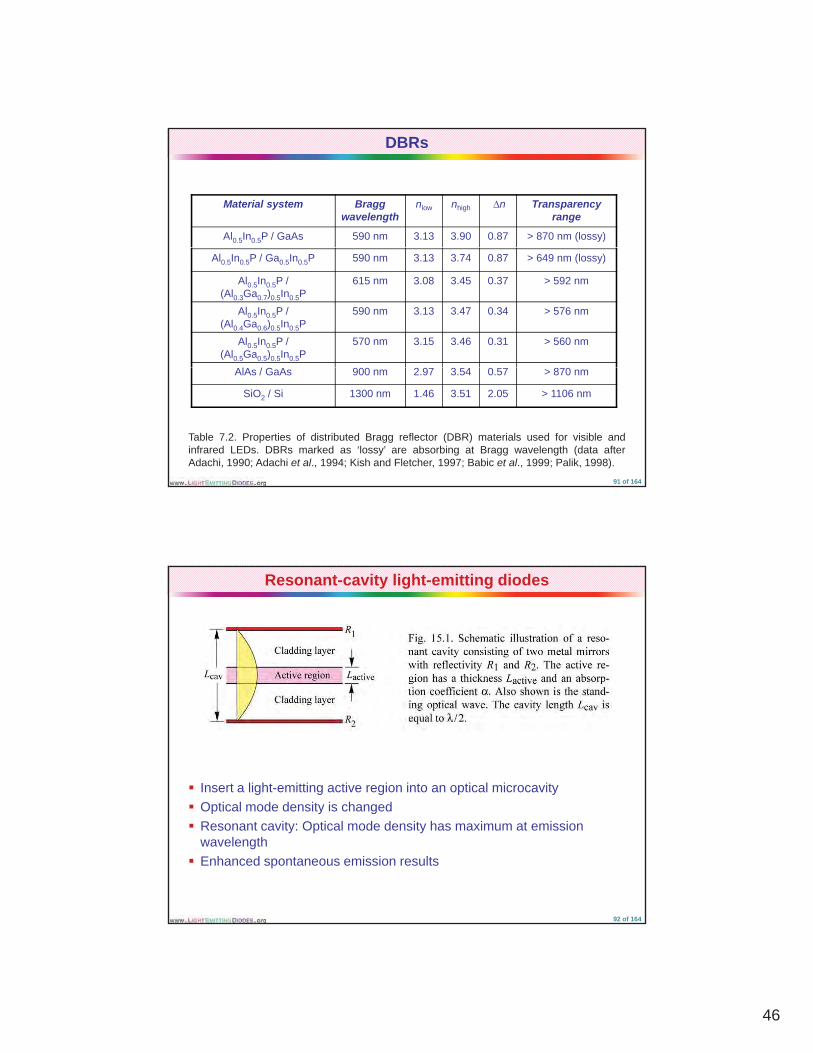
DBRs
Material system Bragg wavelength
nlow nhigh ��n Transparency range
Al0.5In0.5P / GaAs 590 nm 3.13 3.90 0.87 > 870 nm (lossy)
Al0.5In0.5P / Ga0.5In0.5P 590 nm 3.13 3.74 0.87 > 649 nm (lossy)
Al0.5In0.5P / (Al0.3Ga0.7)0.5In0.5P
615 nm 3.08 3.45 0.37 > 592 nm
Al0.5In0.5P / (Al0.4Ga0.6)0.5In0.5P
590 nm 3.13 3.47 0.34 > 576 nm
Al0.5In0.5P / (Al0.5Ga0.5)0.5In0.5P
570 nm 3.15 3.46 0.31 > 560 nm
AlAs / GaAs 900 nm 2.97 3.54 0.57 > 870 nm
SiO2 / Si 1300 nm 1.46 3.51 2.05 > 1106 nm
Table 7.2. Properties of distributed Bragg reflector (DBR) materials used for visible andinfrared LEDs. DBRs marked as ‘lossy’ are absorbing at Bragg wavelength (data afterAdachi, 1990; Adachi et al., 1994; Kish and Fletcher, 1997; Babic et al., 1999; Palik, 1998).
91 of 164
Resonant-cavity light-emitting diodes
� Insert a light-emitting active region into an optical microcavity� Optical mode density is changed� Optical mode density is changed� Resonant cavity: Optical mode density has maximum at emission
wavelength� Enhanced spontaneous emission results
92 of 164

47
RCLED design rules
21 RR &&First design rule
(Light-exit mirror should have lower reflectivity than back mirror)
Second design rule
Use shortest possible cavity length Lcav. Typically Lcav = $ / 2
Third design rule
� 1active 12 RL �&'((Absorption loss in active region should be smaller than the
mirror loss of the light-exit mirror)
93 of 164
First RCLED
� First RCLED had GaInAs active region and AlGaAs confinement layers
94 of 164

48
RCLED spectrum and performance
� Narrow emission line
� High emission intensity along surface-normal direction
95 of 164
650 nm RCLED for plastic optical fiber (POF) communications
� Plastic optical fibers (POFs) have loss minimum at about 550 – 650 nm96 of 164
49
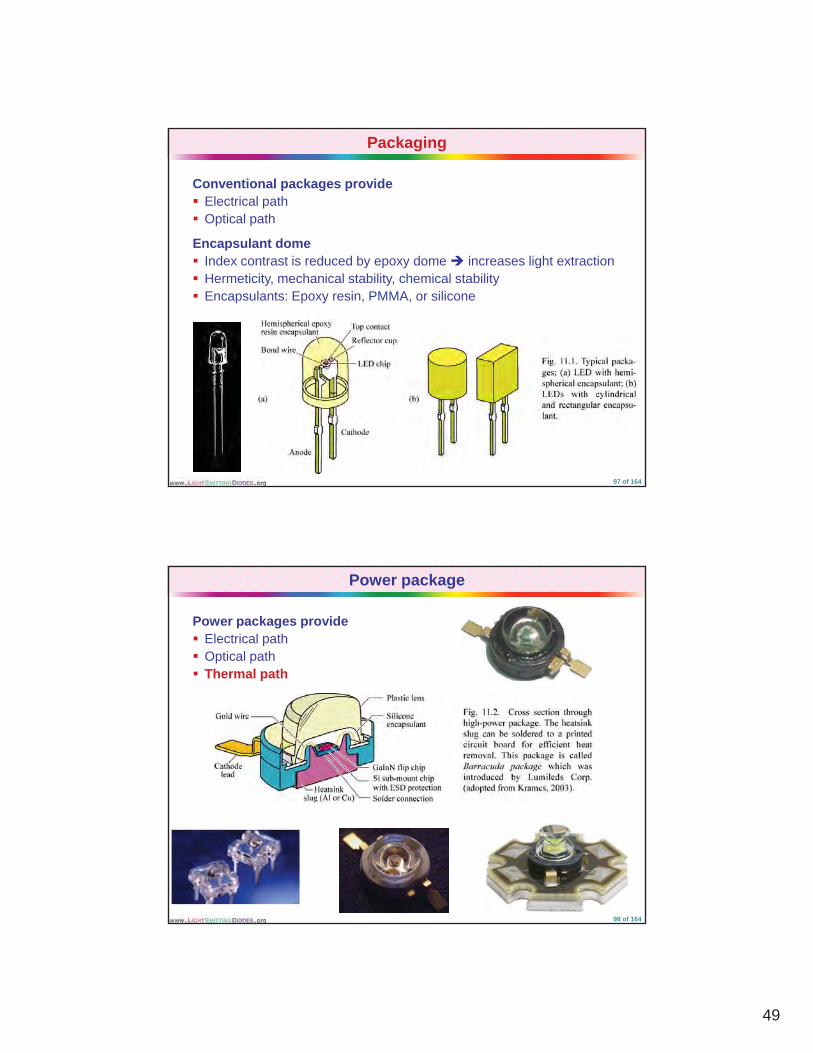
Packaging
Conventional packages provide� Electrical path� Optical path
Encapsulant domeEncapsulant dome� Index contrast is reduced by epoxy dome � increases light extraction� Hermeticity, mechanical stability, chemical stability� Encapsulants: Epoxy resin, PMMA, or silicone
97 of 164
Power package
Power packages provide� Electrical path� Optical path� Thermal path
98 of 164
50
Flat glass versus lens package
� Examples of packages are shown below• Flat top package with an air cavity
• These devices are injected with very high currents that also create much heat• Rounded top package
• Silicone encapsulantSilicone encapsulant• Side-emitting packages
• For LCD display applications
Flat-top package Rounded top package Side-emitting package
99 of 164
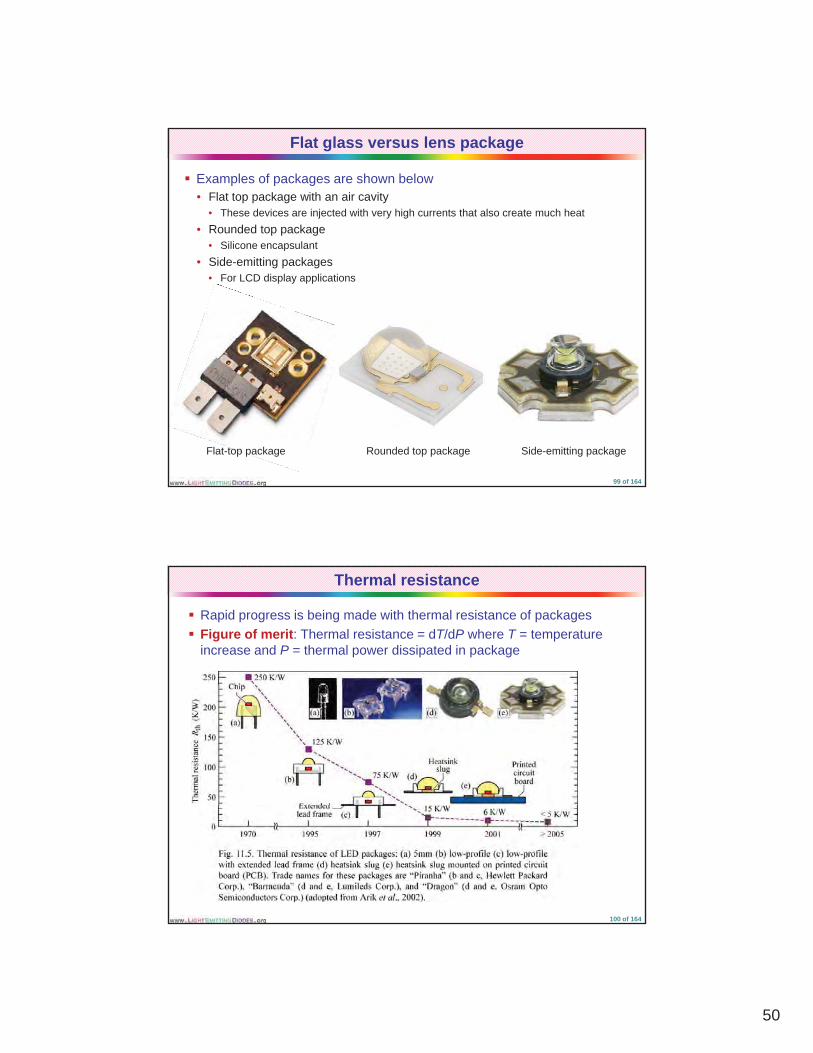
Thermal resistance
� Rapid progress is being made with thermal resistance of packages� Figure of merit: Thermal resistance = dT/dP where T = temperature
increase and P = thermal power dissipated in package
100 of 164
51
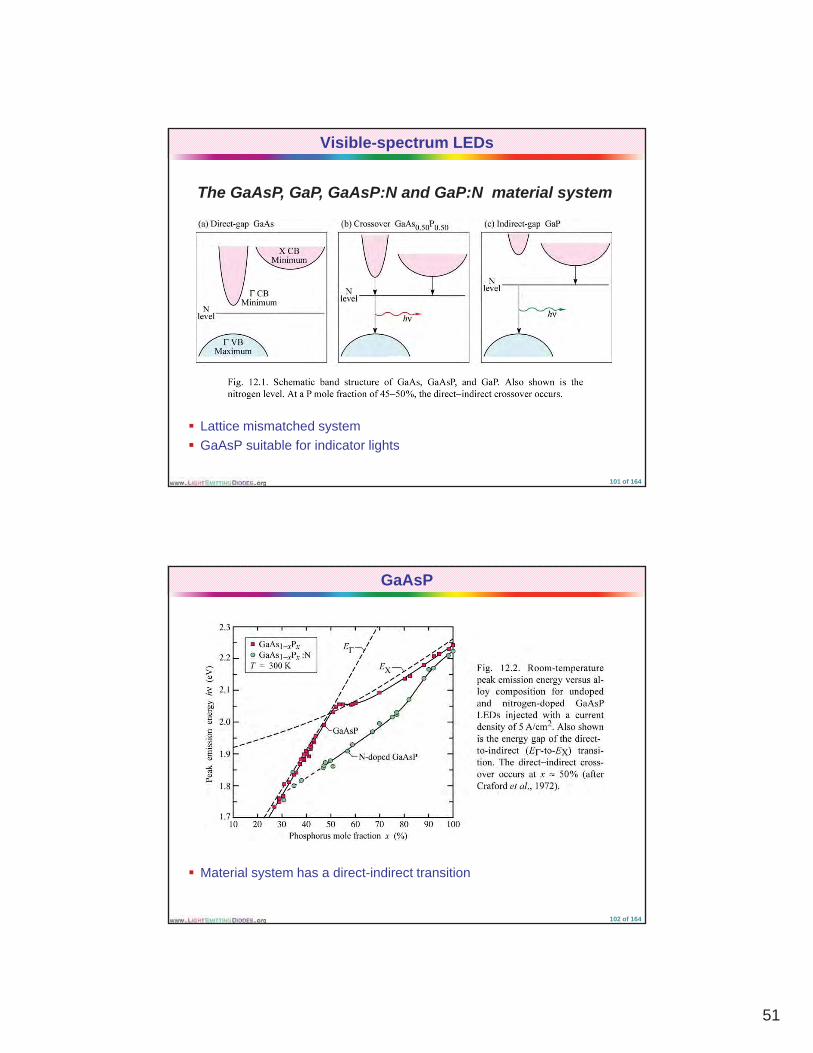
Visible-spectrum LEDs
The GaAsP, GaP, GaAsP:N and GaP:N material system
� Lattice mismatched system� GaAsP suitable for indicator lights
101 of 164
GaAsP
� Material system has a direct-indirect transition
102 of 164

52
GaAsP
Summary: The GaAsP, GaP, GaAsP:N and GaP:N material system has the fundamental problem of lattice mismatch and is not suitable for high-power LEDs
103 of 164
The AlGaAs/GaAs material system
104 of 164
53
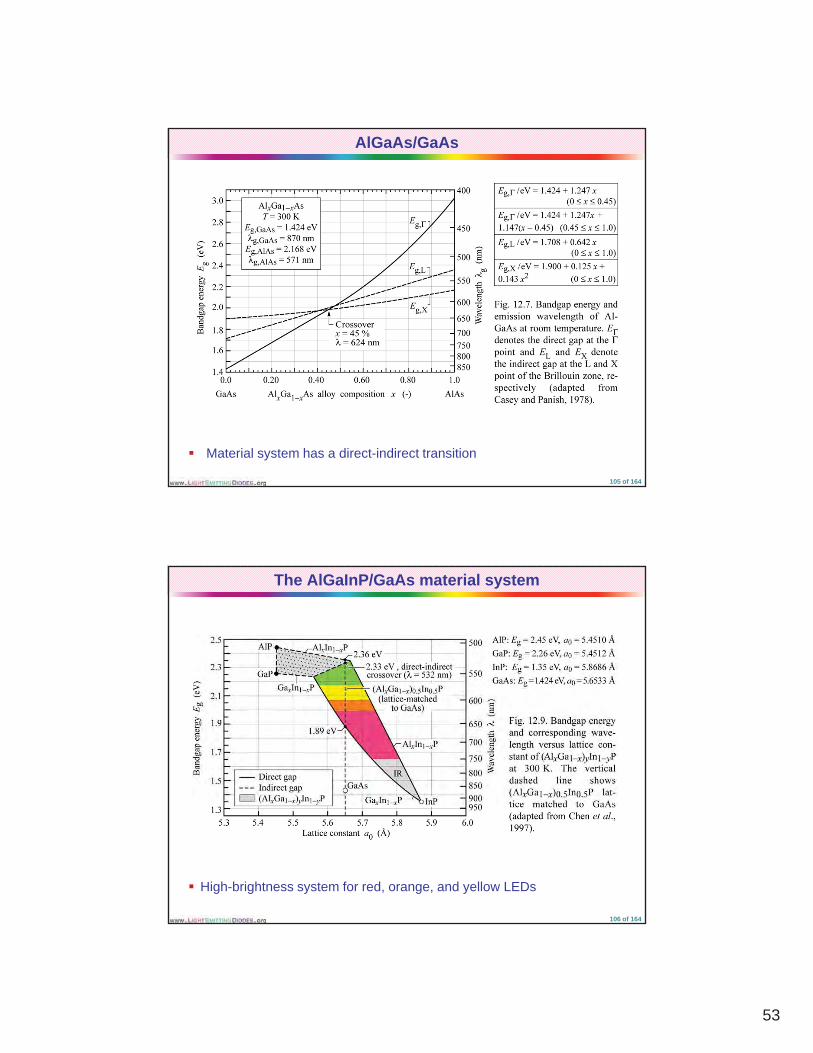
AlGaAs/GaAs
� Material system has a direct-indirect transition
105 of 164
The AlGaInP/GaAs material system
� High-brightness system for red, orange, and yellow LEDs
106 of 164
54
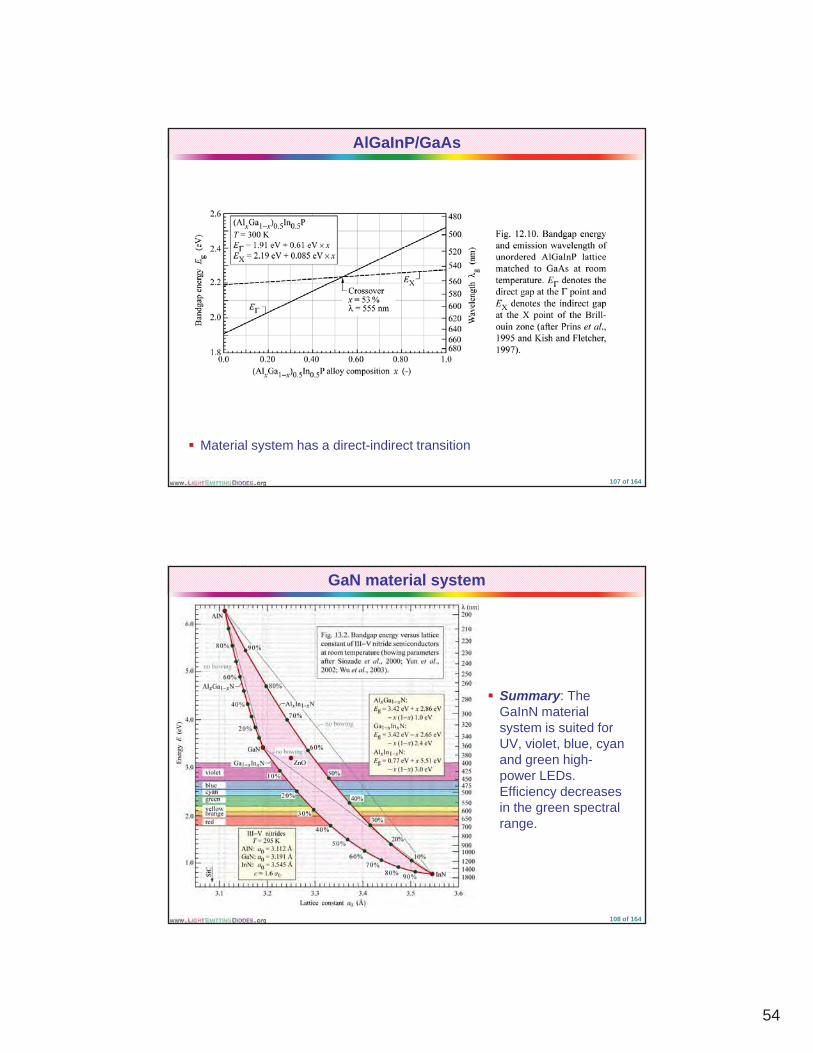
AlGaInP/GaAs
� Material system has a direct-indirect transition
107 of 164
GaN material system
� Summary: The GaInN material system is suited for UV, violet, blue, cyan and green high-power LEDs. Efficiency decreases i th t lin the green spectralrange.
108 of 164
55
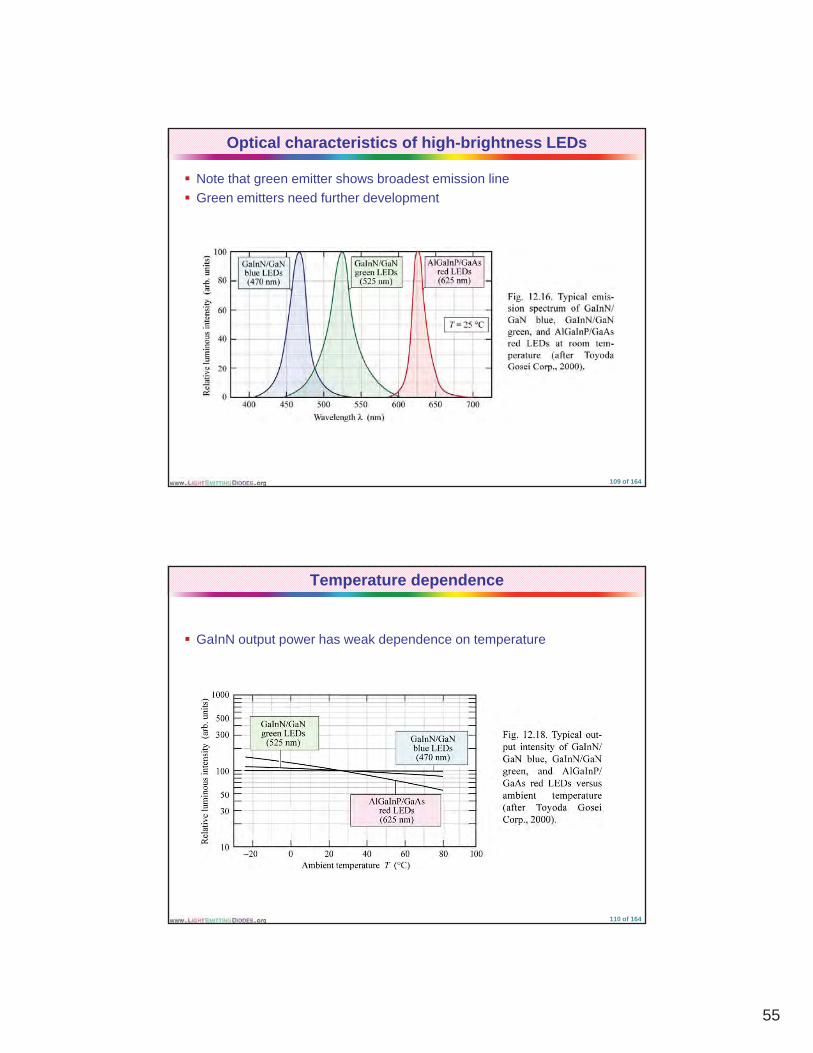
Optical characteristics of high-brightness LEDs
� Note that green emitter shows broadest emission line � Green emitters need further development
109 of 164
Temperature dependence
� GaInN output power has weak dependence on temperature
110 of 164
56
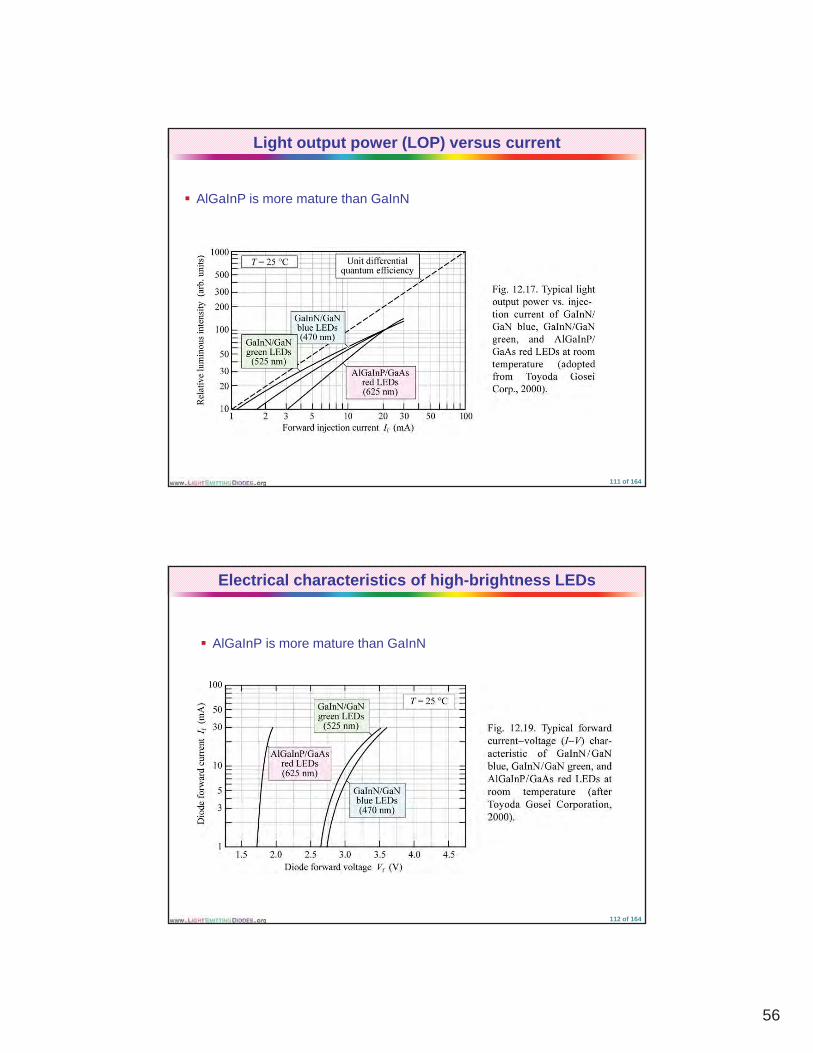
Light output power (LOP) versus current
� AlGaInP is more mature than GaInN
111 of 164
Electrical characteristics of high-brightness LEDs
� AlGaInP is more mature than GaInN
112 of 164
57
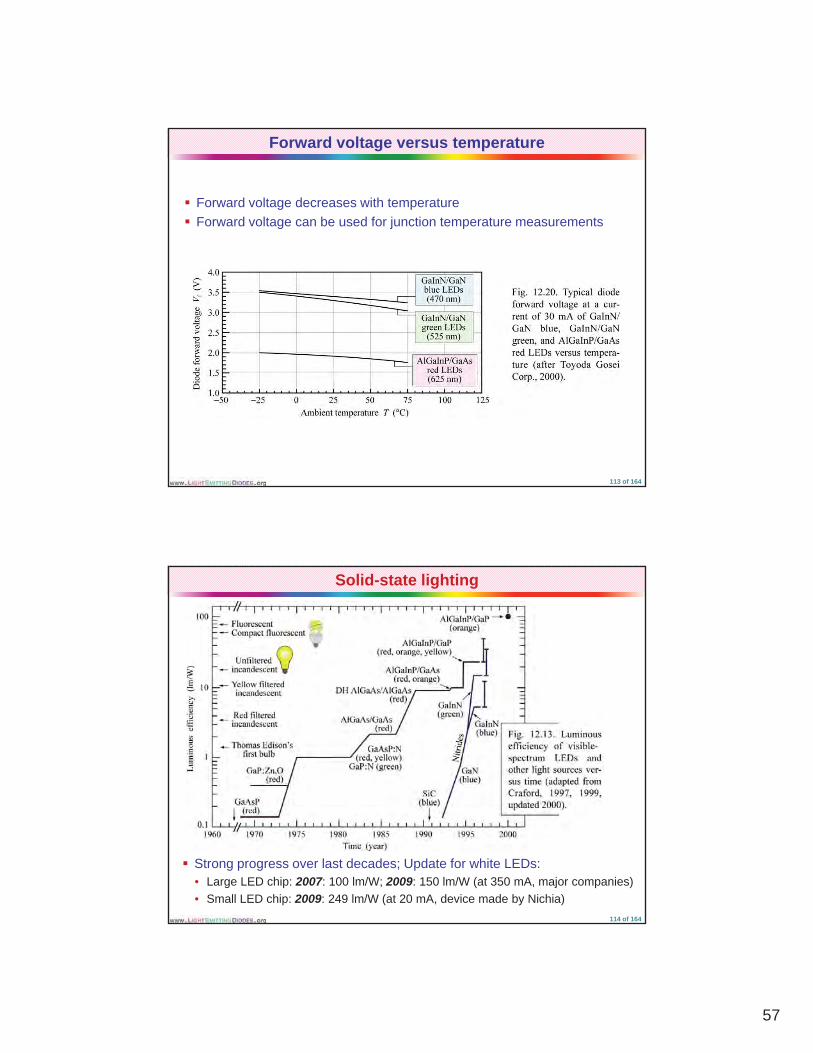
Forward voltage versus temperature
� Forward voltage decreases with temperature� Forward voltage can be used for junction temperature measurements
113 of 164
Solid-state lighting
� Strong progress over last decades; Update for white LEDs: • Large LED chip: 2007: 100 lm/W; 2009: 150 lm/W (at 350 mA, major companies)• Small LED chip: 2009: 249 lm/W (at 20 mA, device made by Nichia)
114 of 164

58
Comparison – Efficiency of LEDs versus other light sources
� Luminous efficacy of LEDs, to be attained by 2015, is based on the expectation that LEDs will be able to attain 50% to 70% of the theoretical maximum. The theoretical maximum of the luminous efficacy is 300 lm/W.
115 of 164
Comparison across spectrum
• Lack of efficient LEDs at 550 nm is sometimes referred to as the “green gap”
116 of 164
59
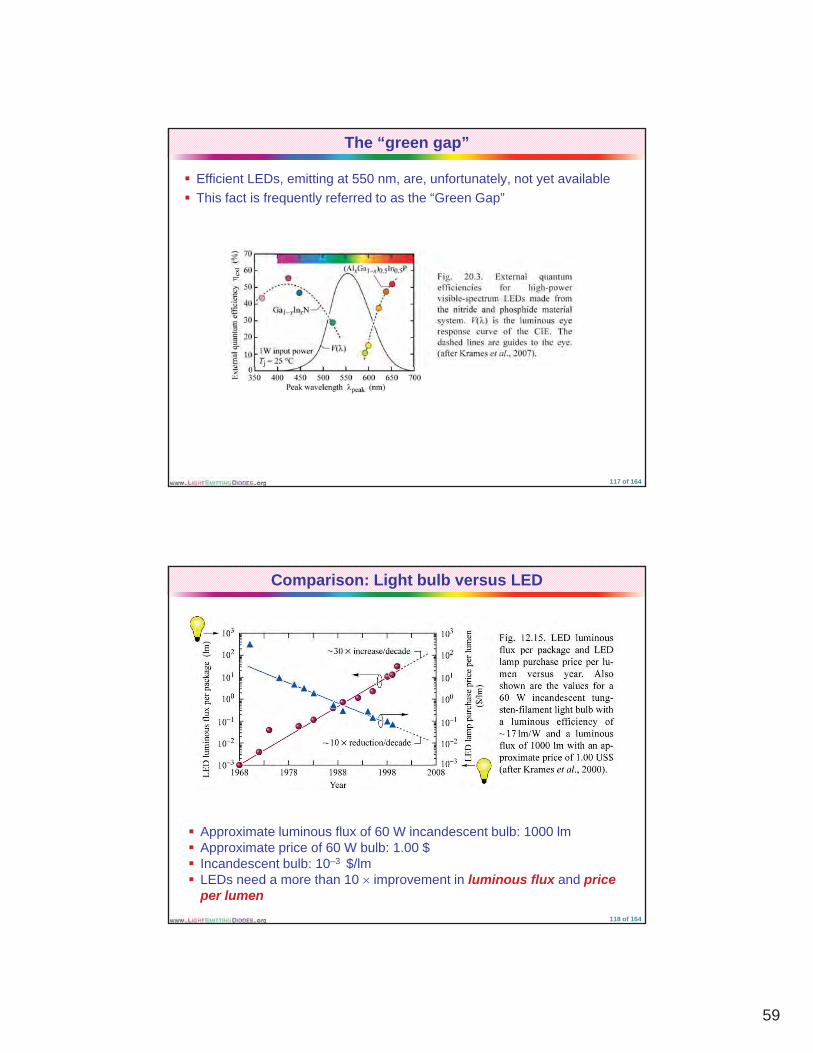
The “green gap”
� Efficient LEDs, emitting at 550 nm, are, unfortunately, not yet available� This fact is frequently referred to as the “Green Gap”
117 of 164
Comparison: Light bulb versus LED
� Approximate luminous flux of 60 W incandescent bulb: 1000 lm� Approximate price of 60 W bulb: 1.00 $� Incandescent bulb: 10–3 $/lm� LEDs need a more than 10 � improvement in luminous flux and price
per lumen118 of 164

60
Human vision
� Cones: Provide color sensitivity� Rods: Color-insensitive� Color perception depends on light level� Scotopic vision regime: Low-light-level-vision regime� Photopic vision regime: High-light-level-vision regime
119 of 164
Spectral sensitivity of rods and cones
� Approximate spectral sensitivity� There are radiometric units (W, W/m2, etc.) � There are photometric units (lm, cd, lux, etc.)
120 of 164
61
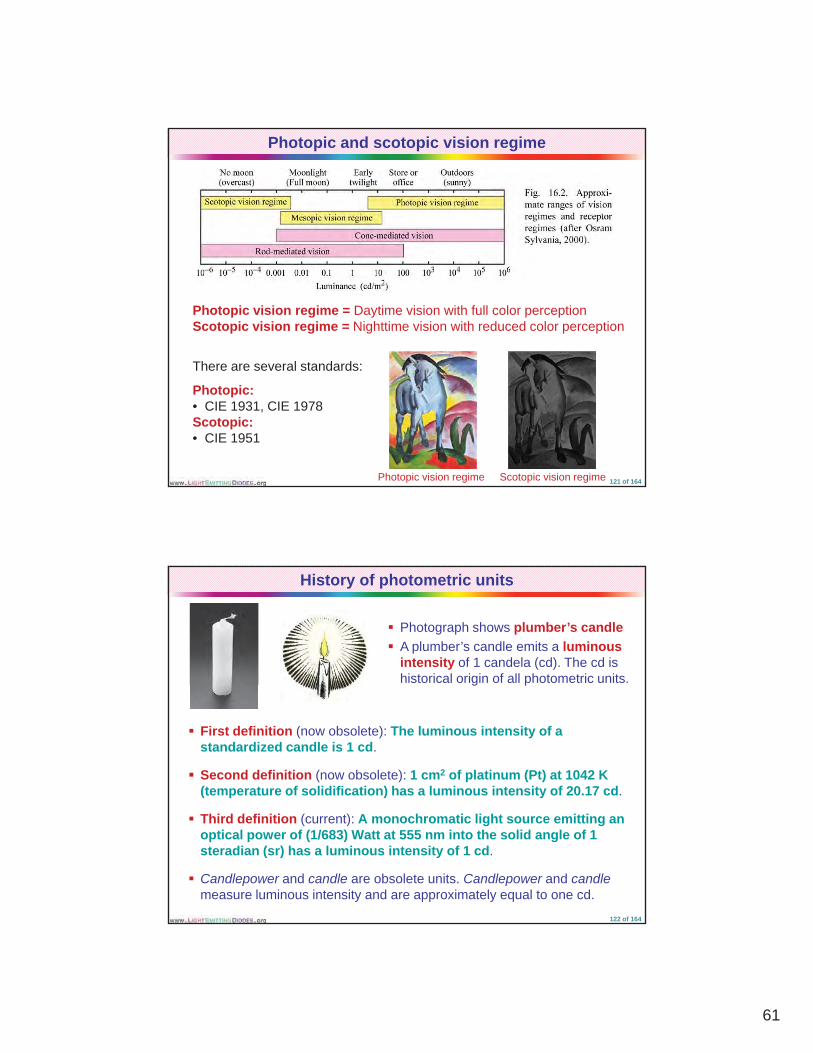
Photopic and scotopic vision regime
Photopic vision regime = Daytime vision with full color perceptionScotopic vision regime = Nighttime vision with reduced color perception
There are several standards:There are several standards:
Photopic:• CIE 1931, CIE 1978Scotopic:• CIE 1951
Photopic vision regime Scotopic vision regime 121 of 164
History of photometric units
� Photograph shows plumber’s candle� A plumber’s candle emits a luminous
intensity of 1 candela (cd). The cd is historical origin of all photometric units.
� First definition (now obsolete): The luminous intensity of a standardized candle is 1 cd.
� Second definition (now obsolete): 1 cm2 of platinum (Pt) at 1042 K (temperature of solidification) has a luminous intensity of 20.17 cd.
g p
� Third definition (current): A monochromatic light source emitting an optical power of (1/683) Watt at 555 nm into the solid angle of 1 steradian (sr) has a luminous intensity of 1 cd.
� Candlepower and candle are obsolete units. Candlepower and candlemeasure luminous intensity and are approximately equal to one cd.
122 of 164

62
Luminous flux, illuminance, and luminance
� luminous flux: A light source with a luminous intensity of 1 cd emits a luminous flux of 1 lm into a solid angle of one steradian• An isotropic light source with a luminous intensity of 1 cd emits a total
l i fl f 4 l 12 56 lluminous flux of 4! lm = 12.56 lm
� Illuminance: If a 1 m2 surface receives a luminous flux of 1 lm, then the illuminance of the surface is 1 lux• Example: Moonlight 1 lux; reading light 102 – 103 lux; surgery light 104 lux;
direct sunlight 105 lux
� Luminance is the luminous intensity emitted per unit area of a light source. Luminance is a figure of merit for displays. Typical displays have a luminance of 100 – 500 cd/m2
� Luminous efficacy of radiation is the relative eye sensitivity of the human eye. At 555 nm, the relative eye sensitivity is 683 lm / W
123 of 164
Eye sensitivity function and luminous efficacy
• Definition of
• Visible wavelength range: 400 – 720 nm
e t o olumen: Green light (555 nm) with power 1 W of has luminous flux 683 lm
• Efficacy of radiation givesnumber of lumens per optical Wattper optical Watt
• Amongst LEDs with same output power, green LEDs are brightest
124 of 164
63
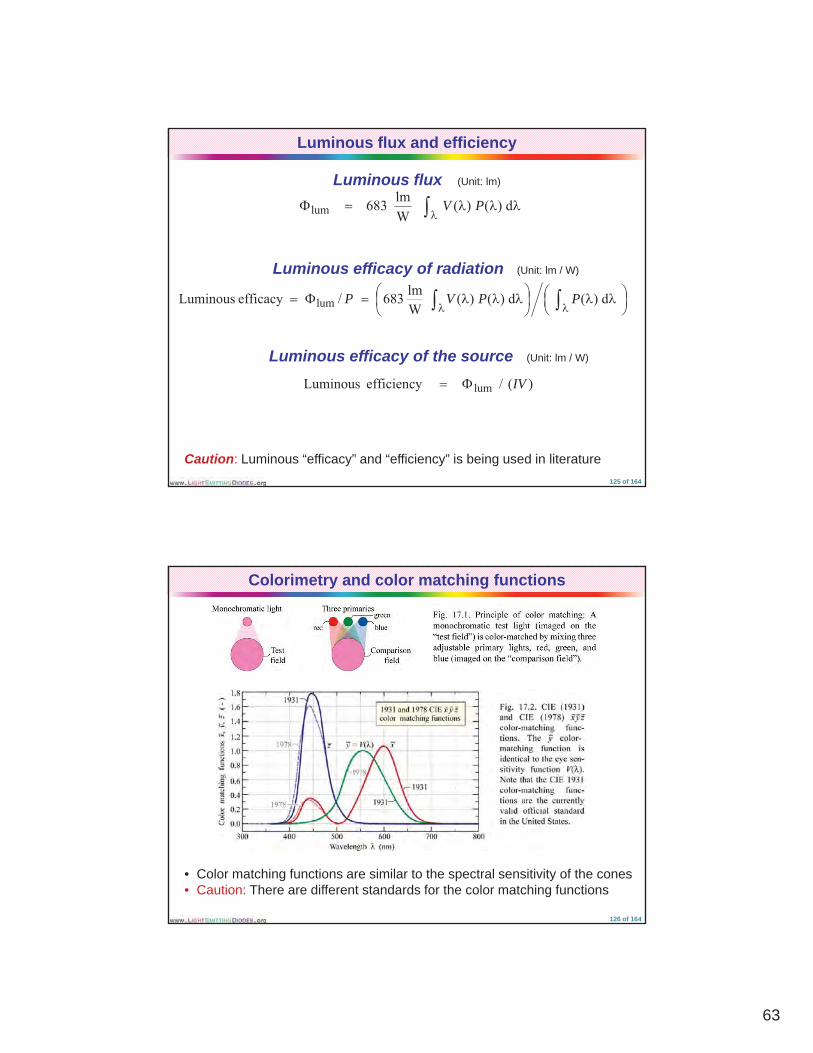
Luminous flux and efficiency
Luminous flux (Unit: lm)
)$ $$$� d)()(Wlm683lum PV
Luminous efficacy of radiation (Unit: lm / W)
���
��� $$�
��
��� $$$� � )) $$
d)(d)()(Wlm683/efficacyLuminous lum PPVP
Luminous efficacy of the source (Unit: lm / W)
)(/efficiencyLuminous lum IV �
Caution: Luminous “efficacy” and “efficiency” is being used in literature125 of 164
Colorimetry and color matching functions
• Color matching functions are similar to the spectral sensitivity of the cones• Caution: There are different standards for the color matching functions
126 of 164
64
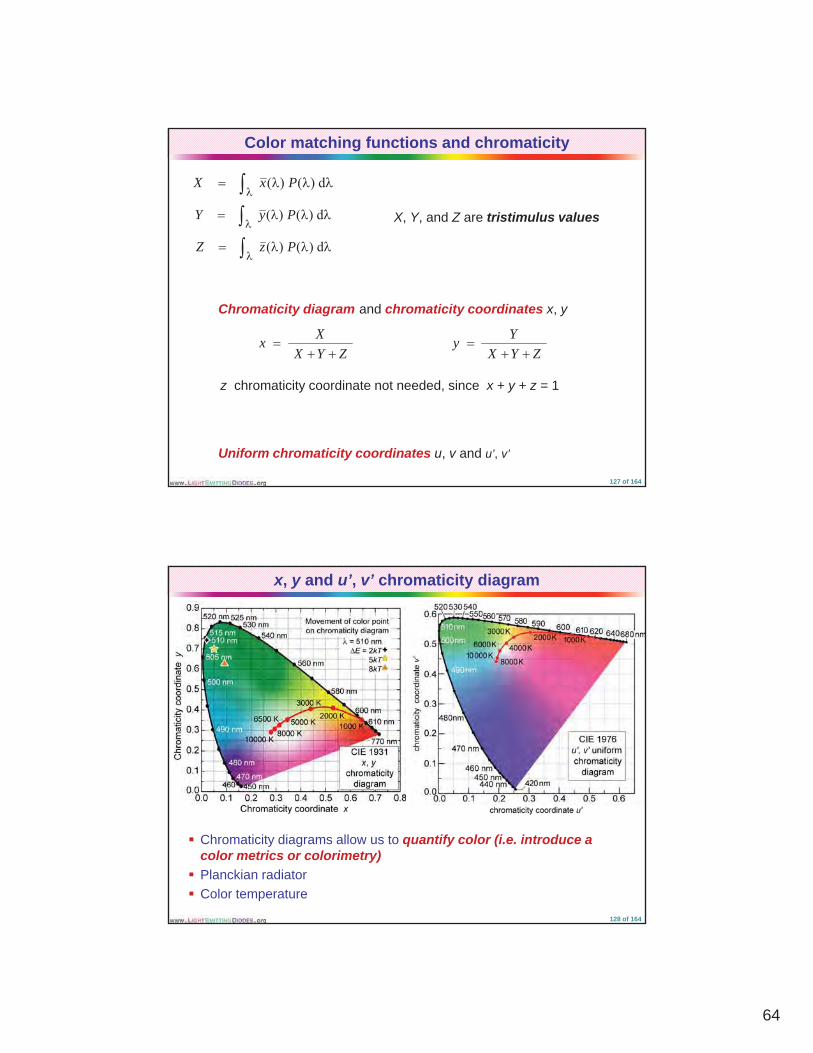
Color matching functions and chromaticity
$$$� )$ d)()( PxX
$$$� )$ d)()( PyY
$$$� ) d)()( PzZ
X, Y, and Z are tristimulus values
$$$� )$ d)()( PzZ
ZYXXx��
�ZYX
Yy��
�
Chromaticity diagram and chromaticity coordinates x, y
z chromaticity coordinate not needed, since x + y + z = 1
Uniform chromaticity coordinates u, v and u’, v’
127 of 164
x, y and u’, v’ chromaticity diagram
� Chromaticity diagrams allow us to quantify color (i.e. introduce a color metrics or colorimetry)
� Planckian radiator� Color temperature
128 of 164
65
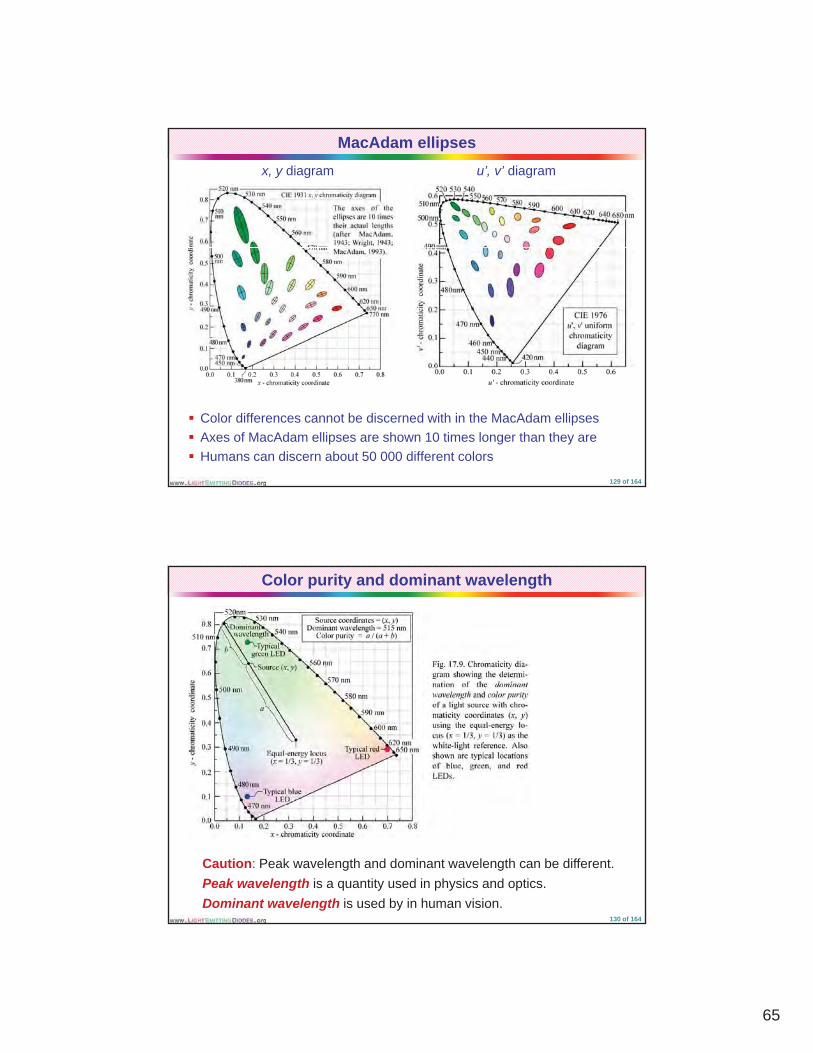
MacAdam ellipsesx, y diagram u’, v’ diagram
� Color differences cannot be discerned with in the MacAdam ellipses� Axes of MacAdam ellipses are shown 10 times longer than they are� Humans can discern about 50 000 different colors
129 of 164
Color purity and dominant wavelength
Caution: Peak wavelength and dominant wavelength can be different.Peak wavelength is a quantity used in physics and optics. Dominant wavelength is used by in human vision.
130 of 164
66
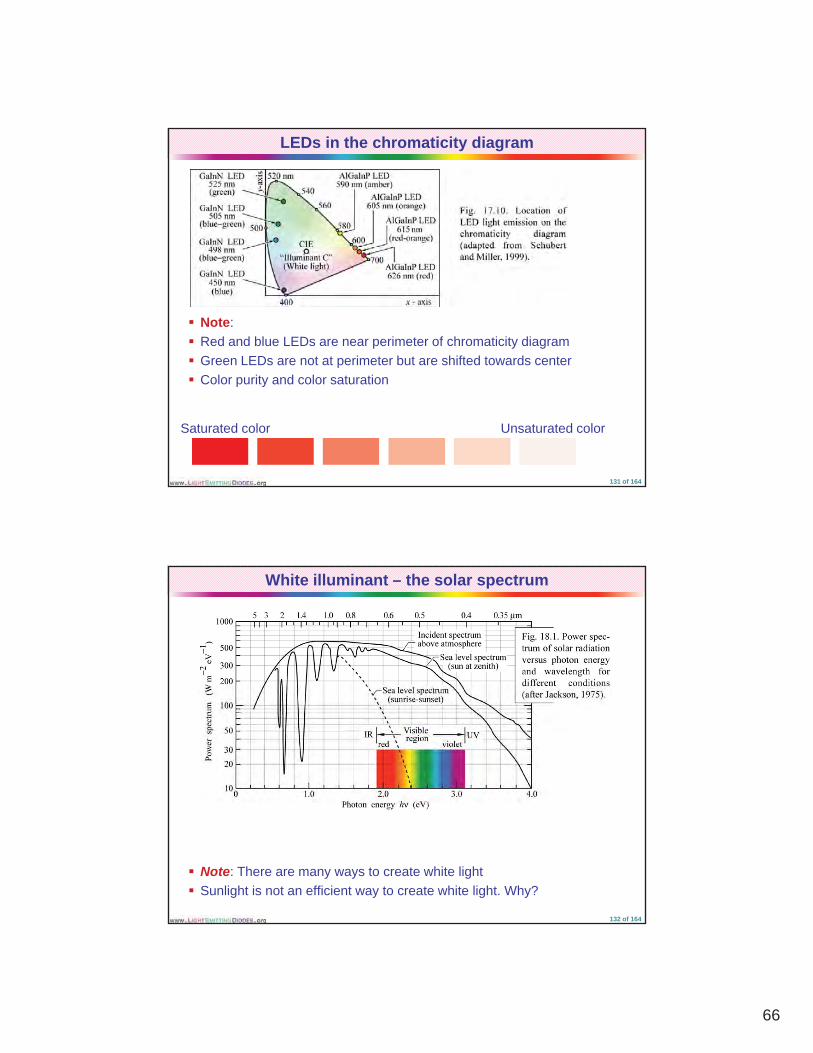
LEDs in the chromaticity diagram
� Note:� Red and blue LEDs are near perimeter of chromaticity diagram � Green LEDs are not at perimeter but are shifted towards centerp� Color purity and color saturation
Saturated color Unsaturated color
131 of 164
White illuminant – the solar spectrum
� Note: There are many ways to create white light� Sunlight is not an efficient way to create white light. Why?
132 of 164

67
Planckian spectrum or black-body radiation spectrum
� A black body has no emission or reflection spectrum and thus no color� Black-body radiation is heat glow or incandescence� Heat glow is a common phenomena
133 of 164
Color temperature
� Planckian spectrum or black-body radiation spectrum� As temperature increases, objects sequentially glow in the red, orange,
yellow, and white134 of 164
68
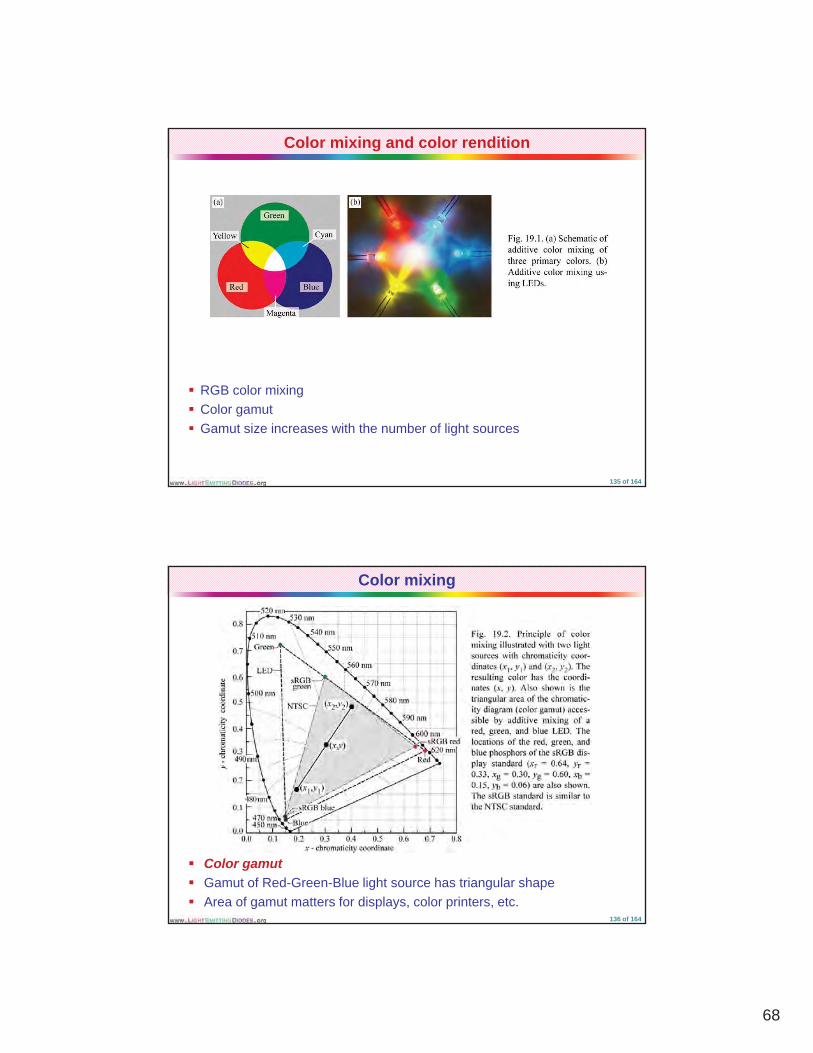
Color mixing and color rendition
� RGB color mixing� Color gamut� Gamut size increases with the number of light sources
135 of 164
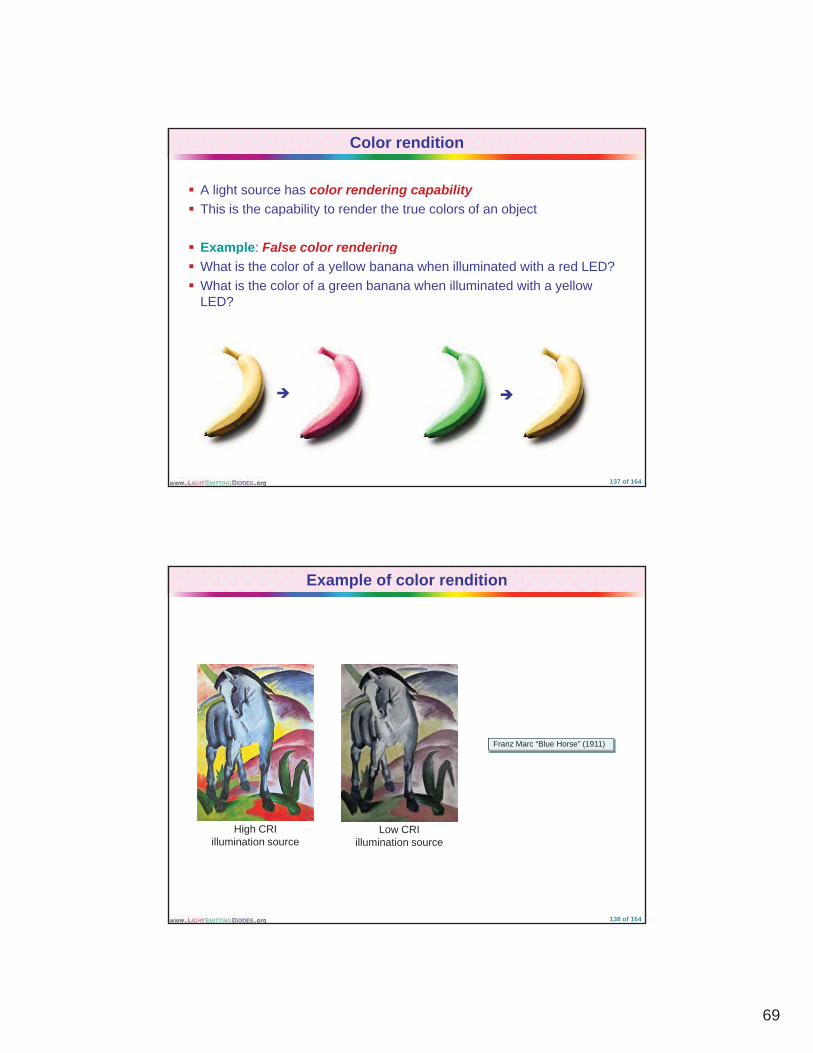
Color mixing
� Color gamut� Gamut of Red-Green-Blue light source has triangular shape � Area of gamut matters for displays, color printers, etc.
136 of 164
69
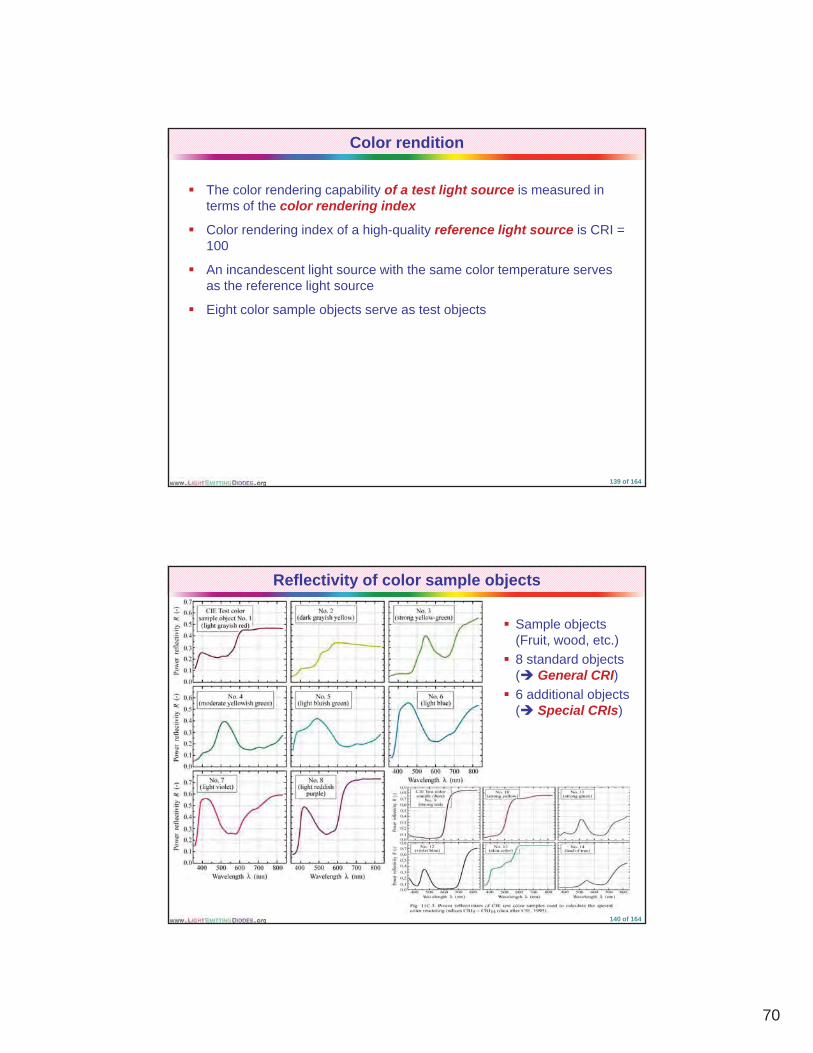
Color rendition
� A light source has color rendering capability� This is the capability to render the true colors of an object
� Example: False color rendering� Example: False color rendering� What is the color of a yellow banana when illuminated with a red LED?� What is the color of a green banana when illuminated with a yellow
LED?
� �
137 of 164
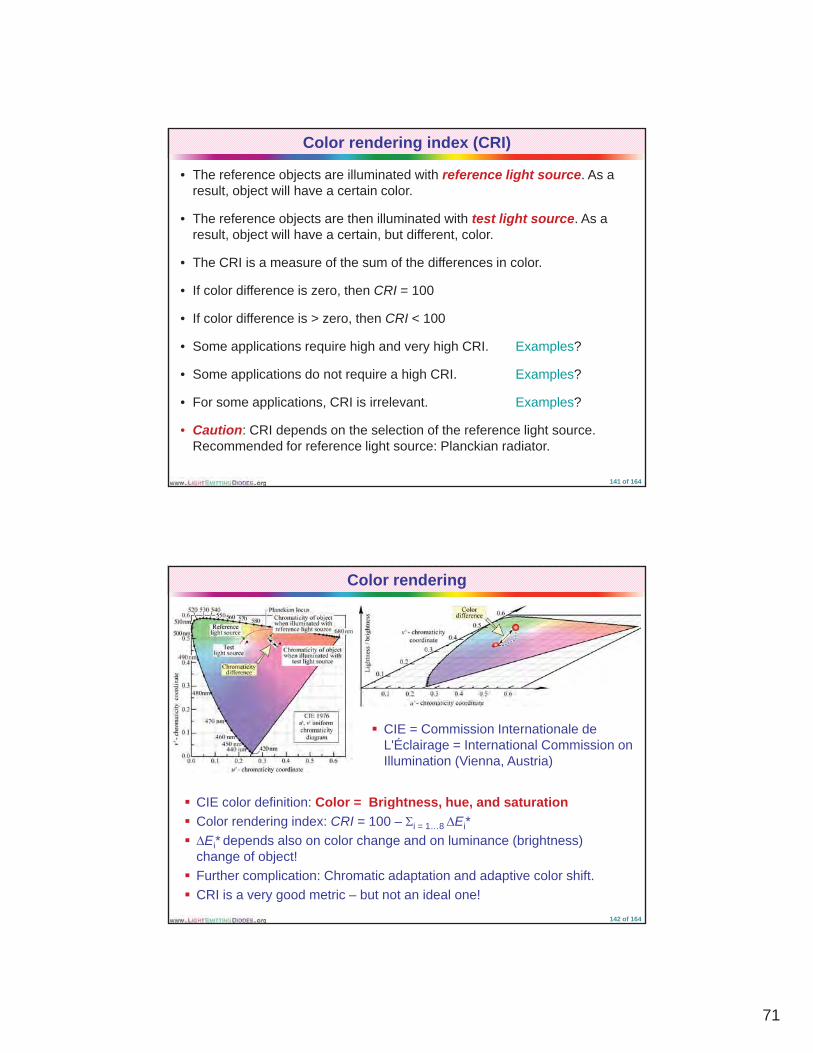
Example of color rendition
Franz Marc “Blue Horse” (1911)
High CRI illumination source
Low CRI illumination source
138 of 164
70
Color rendition
� The color rendering capability of a test light source is measured in terms of the color rendering index
� Color rendering index of a high-quality reference light source is CRI = 100100
� An incandescent light source with the same color temperature serves as the reference light source
� Eight color sample objects serve as test objects
139 of 164
Reflectivity of color sample objects
� Sample objects (Fruit, wood, etc.)
� 8 standard objects (� General CRI)
� 6 additional objects (� Special CRIs)
140 of 164
71
Color rendering index (CRI)
• The reference objects are illuminated with reference light source. As a result, object will have a certain color.
• The reference objects are then illuminated with test light source. As a result, object will have a certain, but different, color.
• The CRI is a measure of the sum of the differences in color.
• If color difference is zero, then CRI = 100
• If color difference is > zero, then CRI < 100
• Some applications require high and very high CRI. Examples?
• Some applications do not require a high CRI. Examples?
• For some applications, CRI is irrelevant. Examples?
• Caution: CRI depends on the selection of the reference light source. Recommended for reference light source: Planckian radiator.
141 of 164
Color rendering
� CIE color definition: Color = Brightness hue and saturation
� CIE = Commission Internationale de L'Éclairage = International Commission on Illumination (Vienna, Austria)
CIE color definition: Color Brightness, hue, and saturation� Color rendering index: CRI = 100 –�*i = 1…8 �Ei*� �Ei* depends also on color change and on luminance (brightness)
change of object! � Further complication: Chromatic adaptation and adaptive color shift.� CRI is a very good metric – but not an ideal one!
142 of 164
72
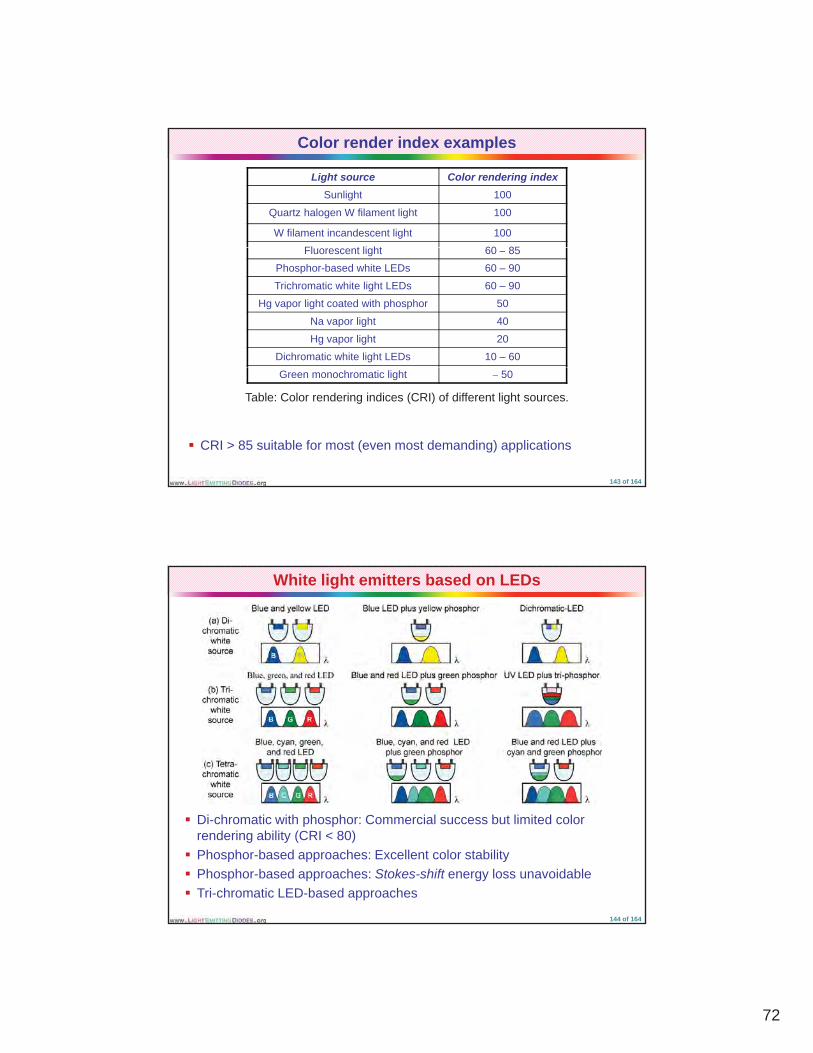
Color render index examples
Light source Color rendering index Sunlight 100
Quartz halogen W filament light 100
W filament incandescent light 100 Fl t li ht 60 85Fluorescent light 60 – 85
Phosphor-based white LEDs 60 – 90
Trichromatic white light LEDs 60 – 90
Hg vapor light coated with phosphor 50
Na vapor light 40
Hg vapor light 20 Dichromatic white light LEDs 10 – 60
� CRI > 85 suitable for most (even most demanding) applications
Table: Color rendering indices (CRI) of different light sources.
Green monochromatic light � 50
143 of 164
White light emitters based on LEDs
� Di-chromatic with phosphor: Commercial success but limited color rendering ability (CRI < 80)
� Phosphor-based approaches: Excellent color stability� Phosphor-based approaches: Stokes-shift energy loss unavoidable� Tri-chromatic LED-based approaches
144 of 164

73
Simplest approach: Dichromatic sources
Fundamentally the most efficient way to create white light
� Two complementary wavelengths give white light� Example: Blue and yellow
145 of 164
Luminous efficacy of dichromatic light sources
� Di-chromatic source is most efficient way to create white lightDi chromatic source is most efficient way to create white lightoutstanding
� Luminous efficacy > 400 lm/W for narrow emission lines� However, CRI is low � unsuitable for illumination applications� Great display device (e.g. pedestrian traffic signal, display, etc.)� There is a fundamental trade-off between CRI and luminous efficacy
146 of 164
74
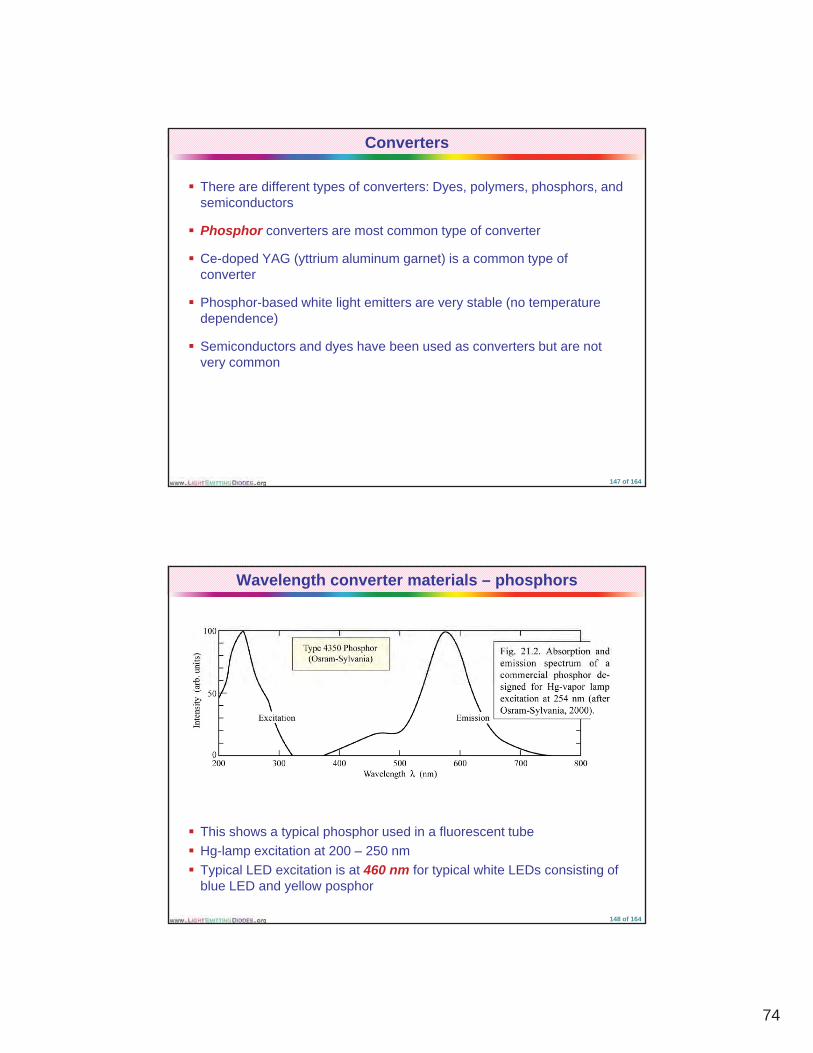
Converters
� There are different types of converters: Dyes, polymers, phosphors, and semiconductors
� Phosphor converters are most common type of converter
� Ce-doped YAG (yttrium aluminum garnet) is a common type of converter
� Phosphor-based white light emitters are very stable (no temperature dependence)
� Semiconductors and dyes have been used as converters but are not very commony
147 of 164
Wavelength converter materials – phosphors
� This shows a typical phosphor used in a fluorescent tube� Hg-lamp excitation at 200 – 250 nm� Typical LED excitation is at 460 nm for typical white LEDs consisting of
blue LED and yellow posphor
148 of 164
75
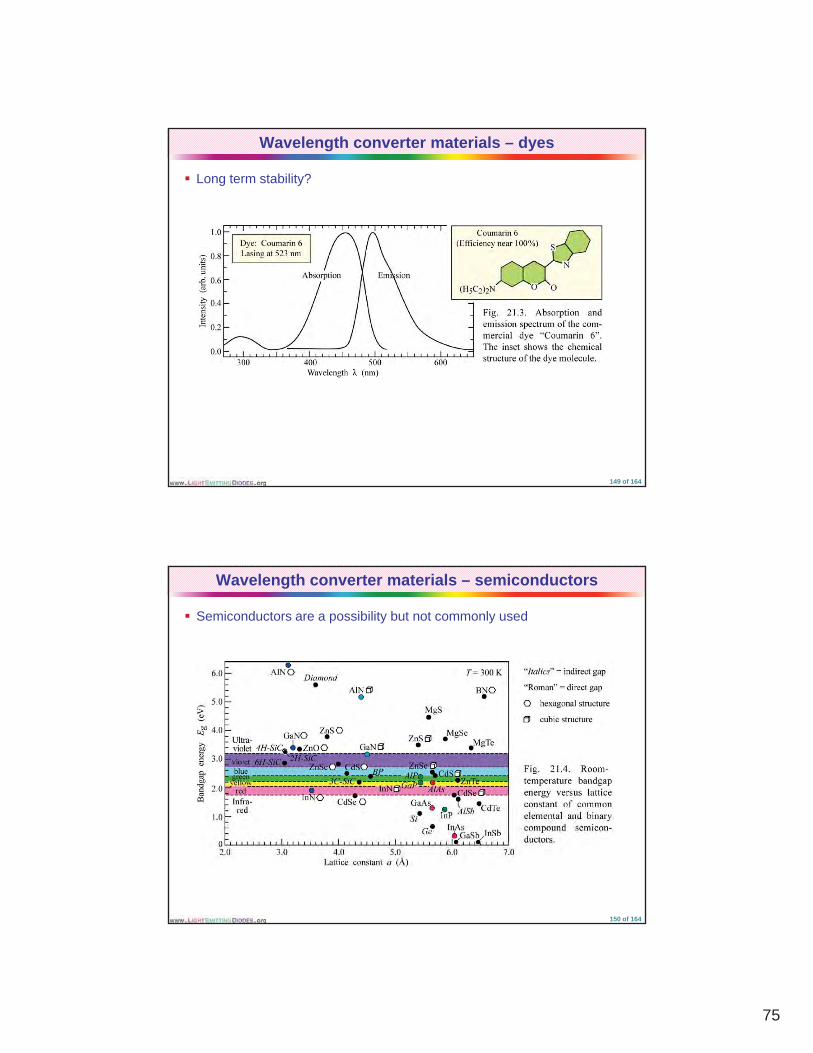
Wavelength converter materials – dyes
� Long term stability?
149 of 164
Wavelength converter materials – semiconductors
� Semiconductors are a possibility but not commonly used
150 of 164
76
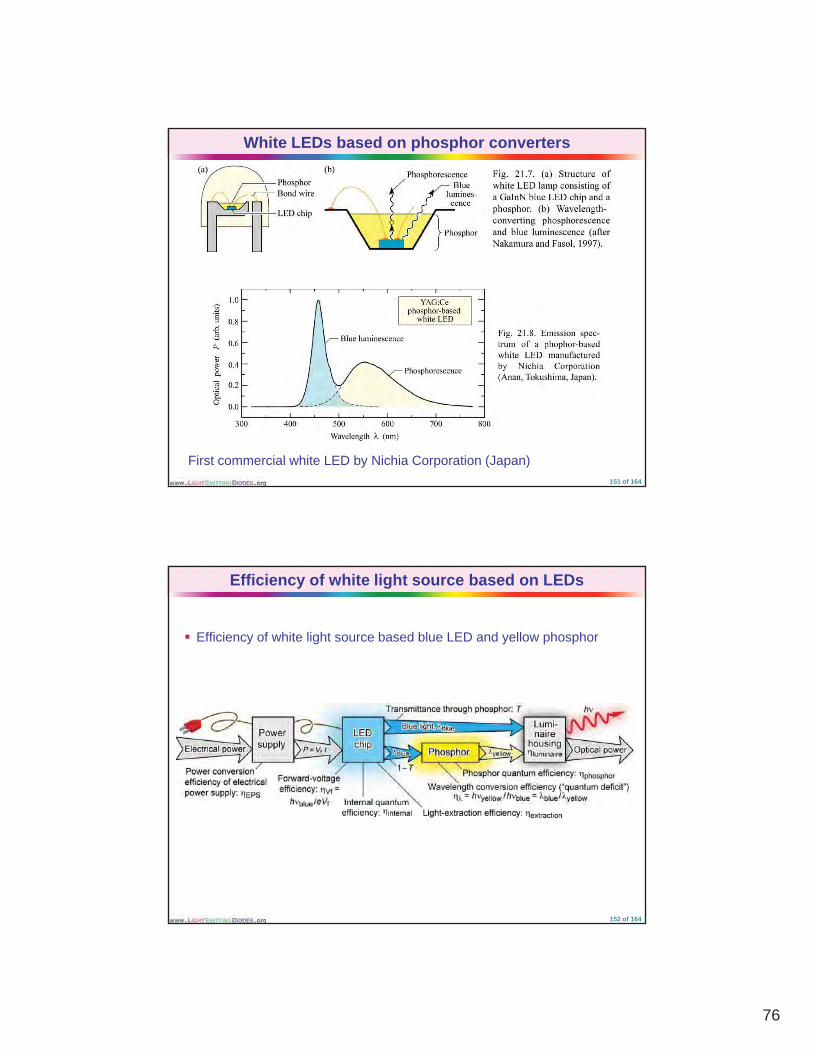
White LEDs based on phosphor converters
First commercial white LED by Nichia Corporation (Japan)151 of 164
Efficiency of white light source based on LEDs
� Efficiency of white light source based blue LED and yellow phosphor
152 of 164
77
Formula for efficiency of white light source based on LEDs
� is the overall efficiency of white LED�EPS is the efficiency of the electrical power supply which can be as high as 100%. In AC-driven scenarios,
��EPS = 100%. In DC scenarios,��EPS can be greater than 90%.
� luminaire�phosphorextractioninternalVfextractioninternalVfEPS ���)1()���()���(�� ����� TT
�EPS �EPS g�Vf is the electrical forward-voltage efficiency of the LED chip. It is ��Vf = h �blue / (e Vf). Ideally, the forward
energy (e Vf) would be equal to the photon energy, so that �Vf = 100%. However, for many current LED structures, Vf exceed this target value, particularly at high currents, where the series resistance loss, IR2, is large. Thus, there is room for significant improvement of �Vf.
�internal is the internal quantum efficiency of the LED chip. For most LED chips, there is room for significant improvement of �internal.
�extraction is the quantum efficiency for light to be extracted out of the LED chip and housing. For most LED chips, there is room for significant improvement of �extraction.
T is the fraction of light transmitted through the yellow phosphor. �phosphor is the quantum efficiency of the phosphor material, i.e. the ratio of photons emitted by the phosphor
divided by photons absorbed by the phosphor For optimized structures � can be high greaterdivided by photons absorbed by the phosphor. For optimized structures, �phosphor can be high, greaterthan 90%. However, for non-optimized structures, such as structures having non-uniform phosphors distribution, �phosphor can less than 50%.
�$ is the wavelength conversion efficiency, limited by the energy loss when converting one blue photon into one yellow photon (“quantum deficit”). It is �$ = h�yellow / h�blue = $blue / $yellow. This loss is unavoidable in LEDs employing a phosphor and is particularly high when UV excitation is used. Note that the quantum deficit is particularly high for conventional fluorescent sources that are based on Hg discharge lamps which emit in the deep UV at about 250 nm.
�luminaire is the efficiency of the luminaire housing surrounding the LED. Depending on the application, not every application requires a luminaire housing. Therefore, the luminaire efficiency can be as high as 100%.
153 of 164
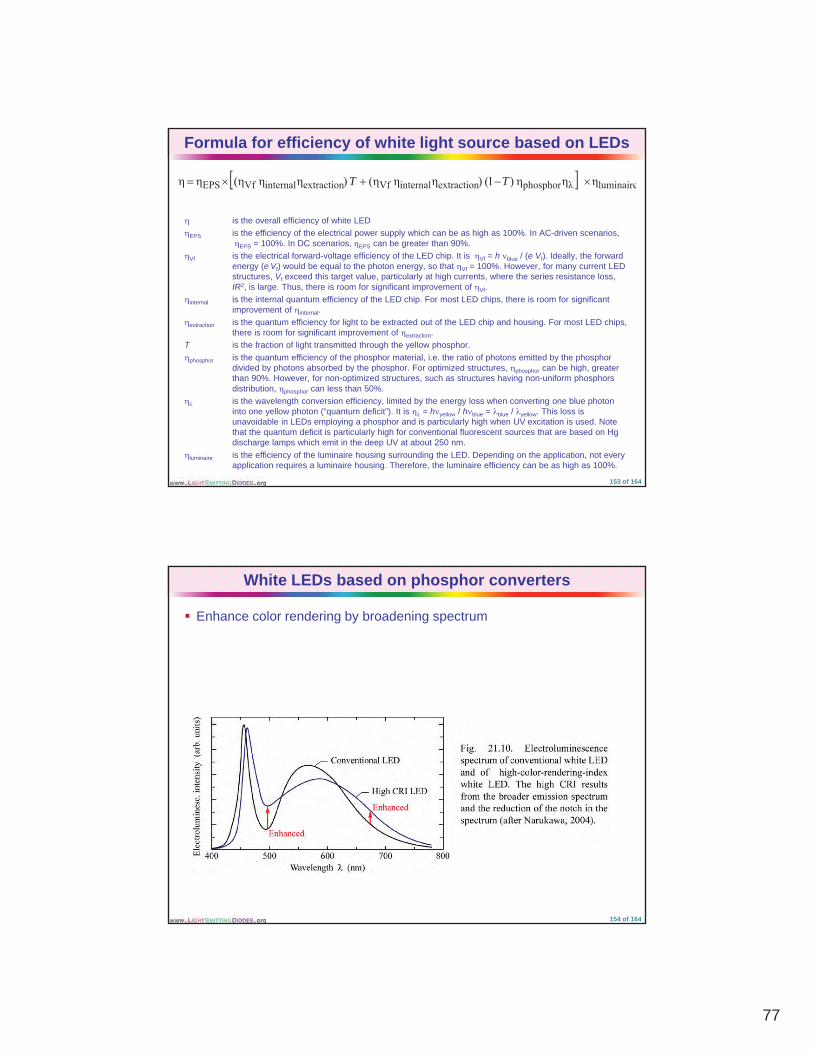
White LEDs based on phosphor converters
� Enhance color rendering by broadening spectrum
154 of 164
78
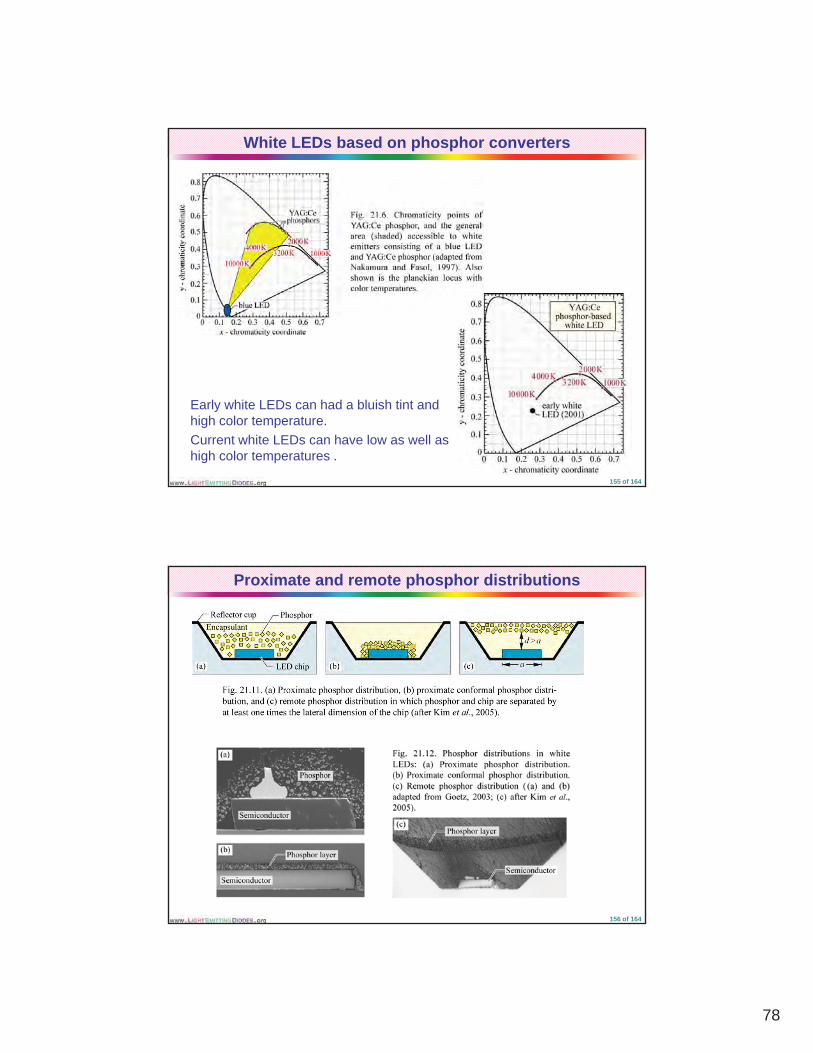
White LEDs based on phosphor converters
Early white LEDs can had a bluish tint and high color temperature.Current white LEDs can have low as well as high color temperatures .
155 of 164
Proximate and remote phosphor distributions
156 of 164
79
White LEDs based on semiconductor converters
157 of 164
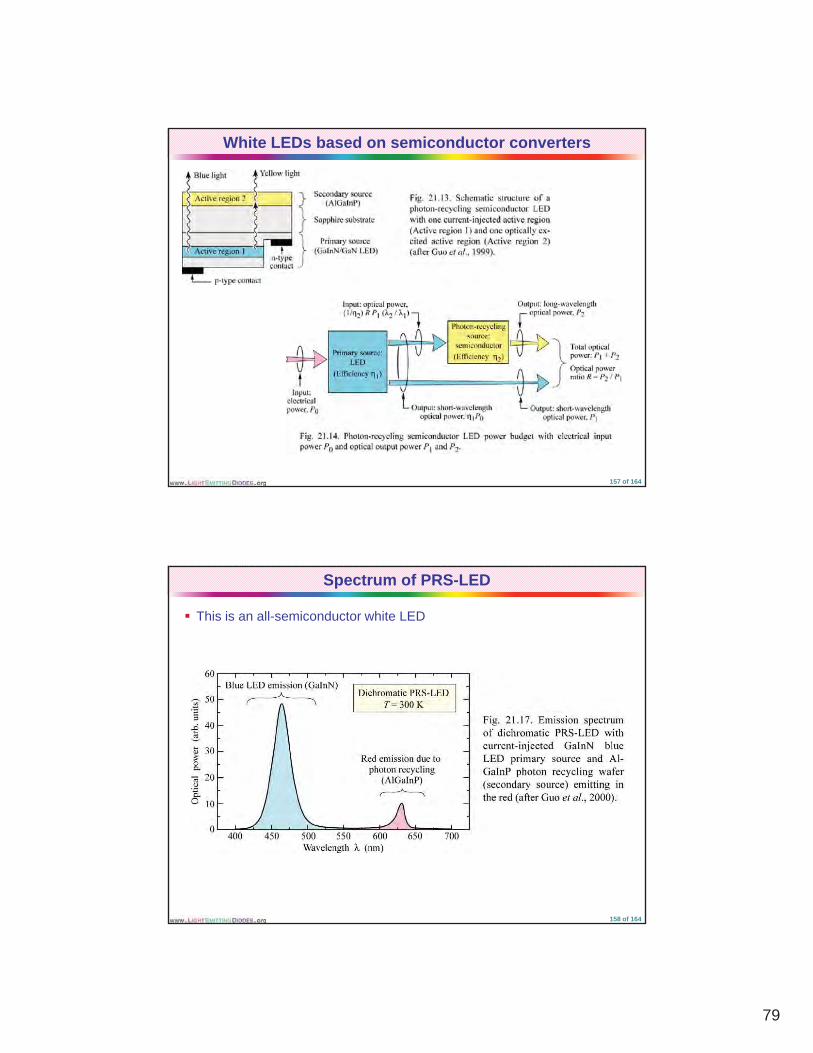
Spectrum of PRS-LED
� This is an all-semiconductor white LED
158 of 164
80
Multi-LED white light sources
E i t l LED i i li idth b t 2 7 kT d 8 2 kT� Experimental LED emission linewidth ranges between 2.7 kT and 8.2 kT� Much broader than predicted value of 1.8 kT� Difference due to alloy broadening� Alloy broadening particularly strong for GaInN� Alloy broadening helps color rendering
159 of 164
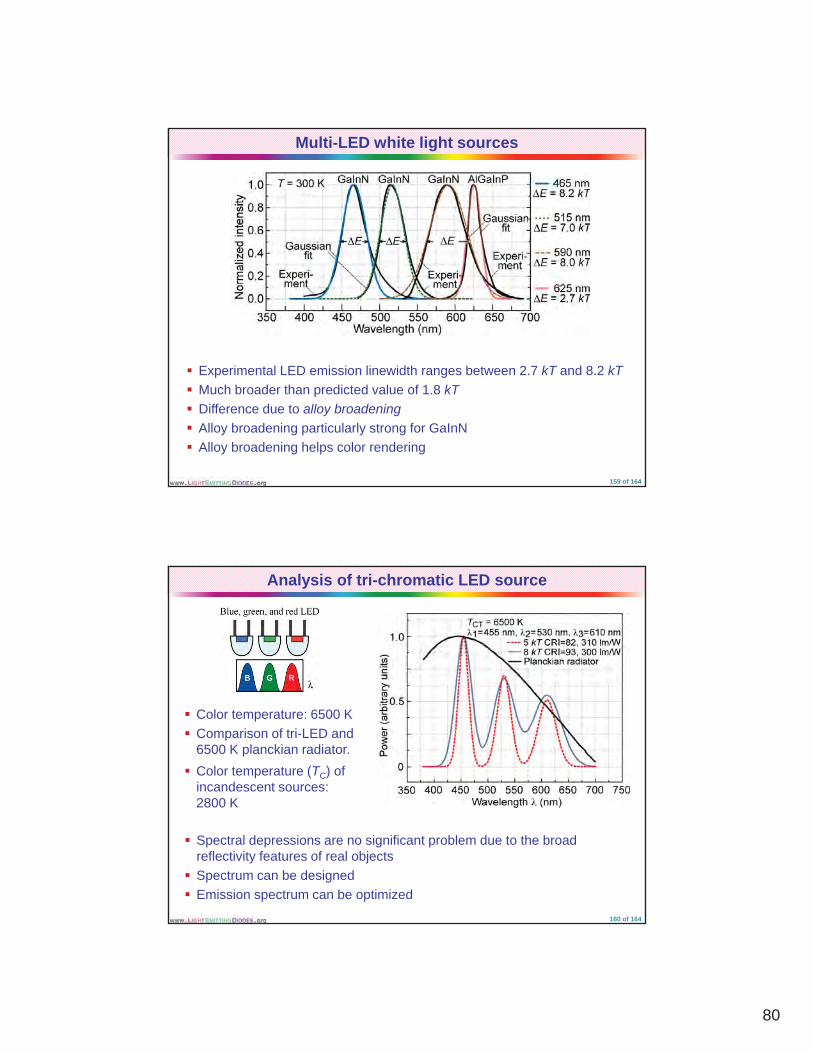
Analysis of tri-chromatic LED source
� Color temperature: 6500 K� Comparison of tri-LED and
6500 K planckian radiator. � Color temperature (TC) of
incandescent sources: 2800 K2800 K
� Spectral depressions are no significant problem due to the broad reflectivity features of real objects
� Spectrum can be designed� Emission spectrum can be optimized
160 of 164

81
Demonstration of trichromatic source
� CRI depends strongly on alloy broadening� RPI demonstrated trichromatic approach with
32 lm/W and CRI of 84� 64 lm/W possible at this time (CRI = 84)
161 of 164
Luminous efficacy and CRI of tri-chromatic source
162 of 164
82
Tri-chromatic white LED sources
� All-semiconductor approaches to solid-state lighting provide highest luminous efficacy and potentially highest luminous efficiency
� CRI depends sensitively on source spectral width
� Tri-chromatic systems with ��E = 8 kT:
� > 300 lm/W with CRI > 90, suitable for virtually all applications
� Tri-chromatic systems with ��E = 5 kT:
� > 300 lm/W with CRI > 80, suitable for most applications
� � Intentional emission-line broadening can be beneficial for CRI
163 of 164
Further information: Light-Emitting Diodes
Light-Emitting Diodes, second editionISBN: 0521865387 Cambridge University Press, Cambridge UK, 2006
The second edition of this graduate textbook offers a comprehensive explanation of the technology and physics of LEDs such as infrared, visible-spectrum, ultraviolet, and white LEDs made from III-V semiconductors. Elementary properties such as electrical and optical characteristics are reviewed, followed by the analysis of advanced device structures. With nine additional chapters, the treatment of LEDs has been vastly expanded, including new material on device packaging, reflectors, UV LEDs, III-V nitride materials, solid-state sources for illumination applications, and junction temperature. Radiative and non-radiative recombination dynamics, methods for improving light extraction high efficiency and high power device designs white lightextraction, high-efficiency and high-power device designs, white-lightemitters with wavelength-converting phosphor materials, optical reflectors, and spontaneous recombination in resonant-cavity structures are discussed in detail. With exercises, solutions, and illustrative examples, this textbook will be of interest to scientists and engineers working on LEDs and graduate students in electrical engineering, applied physics, and materials science.
164 of 164