1 lecture #2 – evolution of populations image of a population of penguins
Post on 21-Dec-2015
213 views
TRANSCRIPT
1
Lecture #2 – Evolution of Populations
Image of a population of penguins
2
Key Concepts:
• The Modern Synthesis• Populations and the Gene Pool• The Hardy-Weinberg Equilibrium• Micro-evolution• Sources of Genetic Variation• Natural Selection• Preservation of Genetic Variation

3
Images – species, population, community
Review definitions
• Species – individual organisms capable of mating and producing fertile offspring
• Population – a group of individuals of a single species
• Community – a group of individuals of different species
4
The Modern Synthesisintegrates our knowledge about
evolution
• Darwin’s natural selection• Mendel’s hereditary patterns• Particulate transfer (chromosomes)• Structure of the DNA molecule
All explain how the genetic structure of populations changes over time
5
KEY POINT
Environmental factors act on the individual to control the genetic future of
the population
Individuals don’t evolve…..populations do
* * * * * * * * * * * * * * * * * * * * *** * * * * * *
6
Image – population of iris
Population = a +/- localized group of individuals of one species
7
Critical Thinking
• How do we determine the boundaries of a population???
8
Critical Thinking
• How do we determine the boundaries of a population???
9
Recall basic genetic principles:
• In a diploid species (most are), every individual has two copies of every geneOne copy came from each parent
• Most genes have different versions = alleles• Diploid individuals are either heterozygous
or homozygous for each geneHeterozygous = AaHomozygous = AA or aa
10
Recall basic genetic principles:
• The total number of alleles for any gene in a population is the number of individuals in the population x 2If the population has 10 individuals, there are
20 copies of the A gene – some “A” alleles and some “a” alleles
• All these alleles comprise the “gene pool”
11
Hardy-Weinberg Theorem
• Gene pool = all alleles in a population• All alleles have a frequency in the
populationThere is a percentage of “A” and a
percentage of “a” that adds up to 100%• Hardy-Weinberg Theorem demonstrates
that allele frequencies don’t change through meiosis and fertilization alone
12
Hardy-Weinberg Theorem
• A simple, mathematical model• Shows that repeated random meiosis and
fertilization events alone will not change the distribution of alleles in a populationEven over many generations
p2 + 2pq + q2 = 1
we will not focus on the math – you’ll work on this in lab
13
Hands On
• The equation: p2 + 2pq + q2 = 1 (Page 2)• p = the frequency of one allele• q = the frequency of the other allele• p + q MUST = 1 = 100% of the gene pool
14
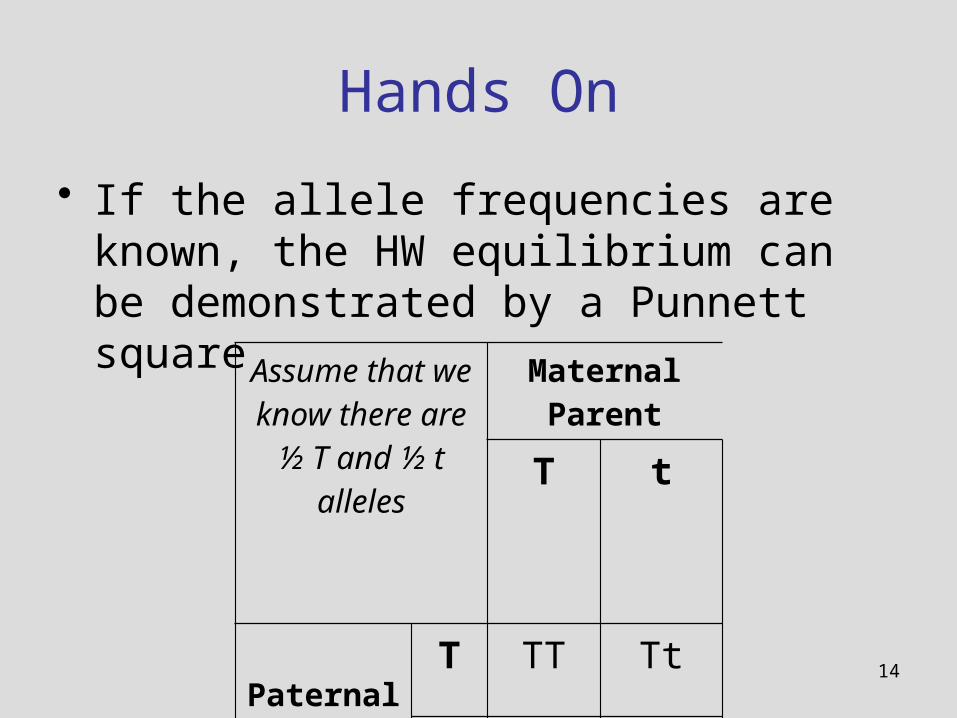
Hands On
• If the allele frequencies are known, the HW equilibrium can be demonstrated by a Punnett square
Assume that we know there are
½ T and ½ t alleles
Maternal Parent
T t
Paternal Parent
T TT Tt
t Tt tt
15
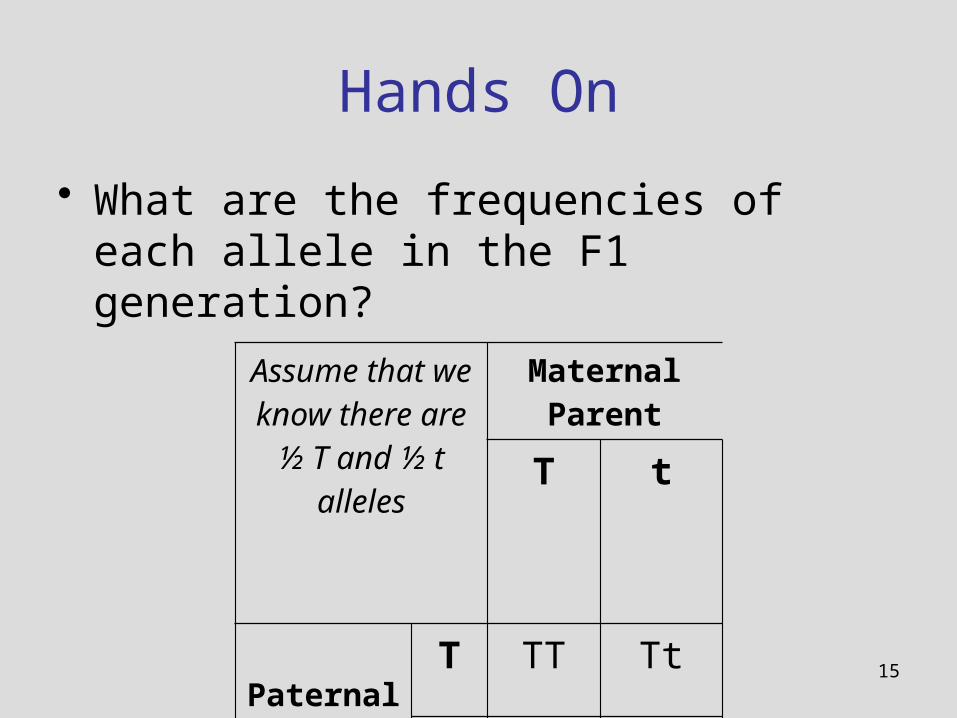
Hands On
• What are the frequencies of each allele in the F1 generation?
Assume that we know there are
½ T and ½ t alleles
Maternal Parent
T t
Paternal Parent
T TT Tt
t Tt tt
16
Hands On – Results
• What are the frequencies of each allele in the F1 generation?

17
Hands On – Results

18
Hands On – Results
19
Hands On
• How do you determine the allele frequencies???
• How do you find p and q???• In this example, how do you know the
percentage of T and the percentage of t???

20
Hands On – Results
21
Hands On
• Clasp your hands
22
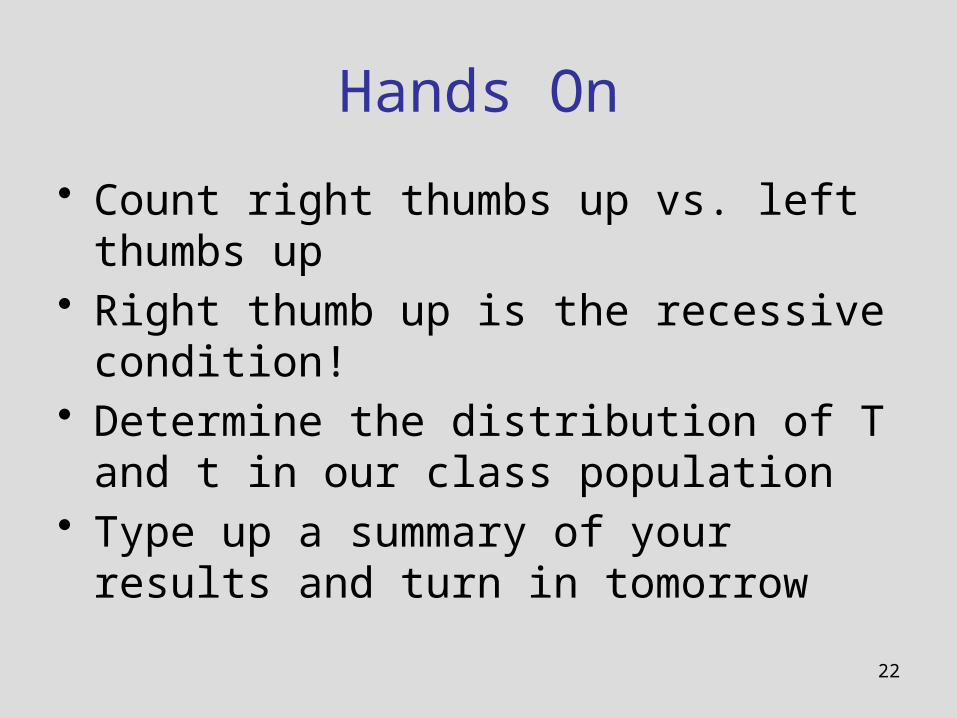
Hands On
• Count right thumbs up vs. left thumbs up• Right thumb up is the recessive condition!• Determine the distribution of T and t in our
class population• Type up a summary of your results and
turn in tomorrow
24
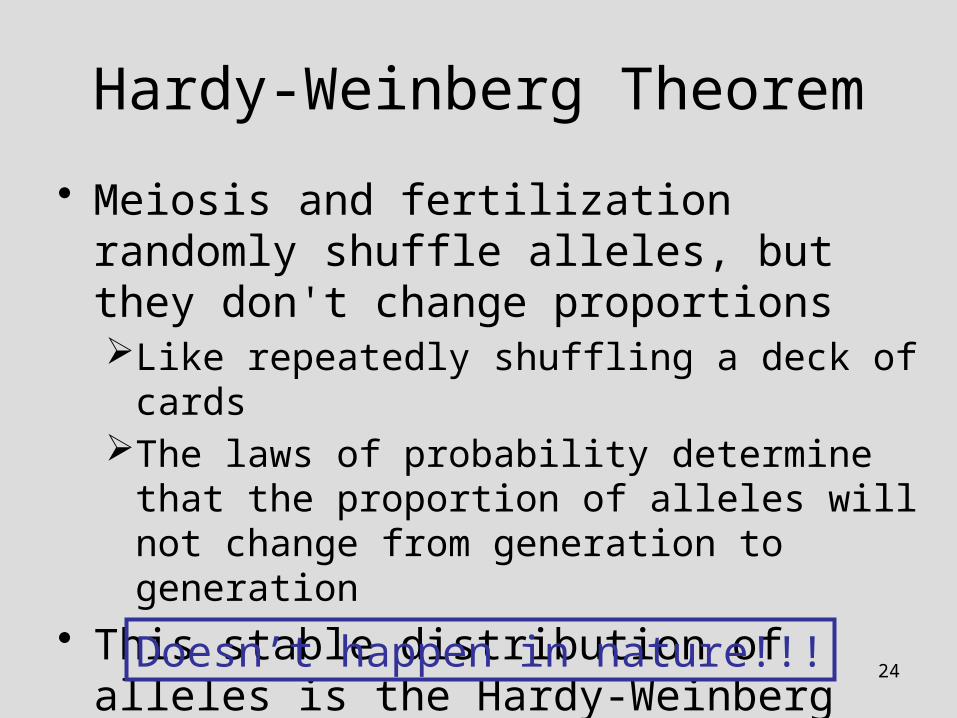
Hardy-Weinberg Theorem
• Meiosis and fertilization randomly shuffle alleles, but they don't change proportionsLike repeatedly shuffling a deck of cardsThe laws of probability determine that the
proportion of alleles will not change from generation to generation
• This stable distribution of alleles is the Hardy-Weinberg equilibrium
Doesn’t happen in nature!!!
25
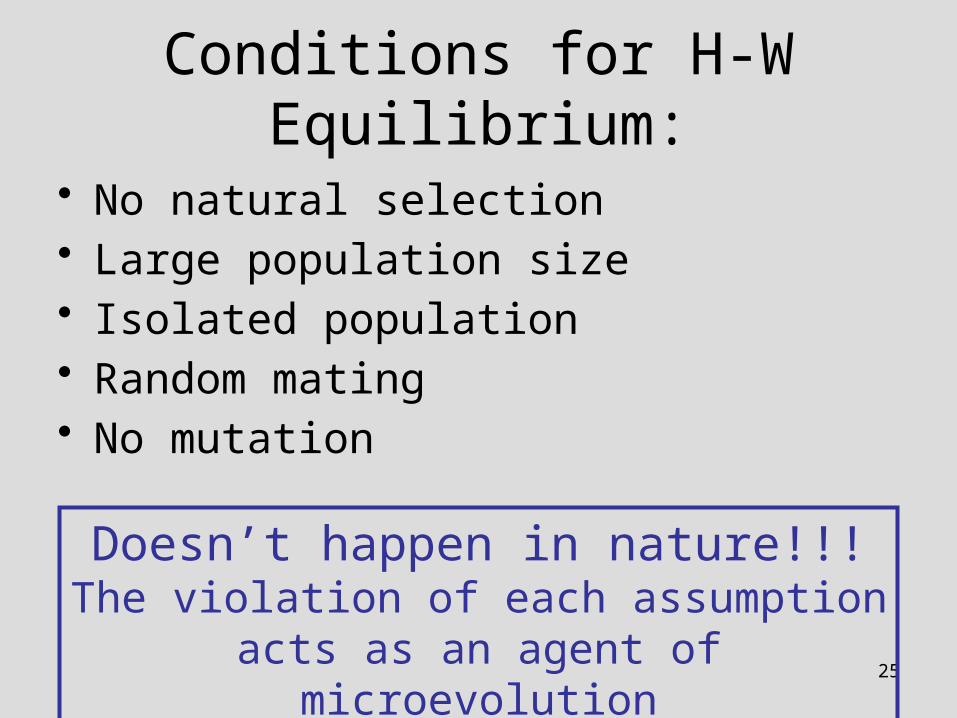
Conditions for H-W Equilibrium:
• No natural selection• Large population size• Isolated population• Random mating• No mutation
Doesn’t happen in nature!!!The violation of each assumption acts as
an agent of microevolution
26
The value of H-W???
• It provides a null hypothesis to compare to what actually happens in nature
• Allele frequencies DO change in nature• BUT, they change only under the conditions
of microevolutionIn nature, all the H-W assumptions are violated
• Result – populations DO evolve
27
Critical Thinking• What are the limitations of the Hardy-
Weinberg theorem???

28
Critical Thinking• What are the limitations of the Hardy-
Weinberg theorem???
29
Critical Thinking
30
Individuals Do Not Evolve
• Individuals vary, but populations evolve• Natural selection pressures make an
individual more or less likely to survive and reproduce
• But, it is the cumulative effects of selection on the genetic makeup of the whole population that results in changes to the species
The environment is a wall; natural selection is a gate
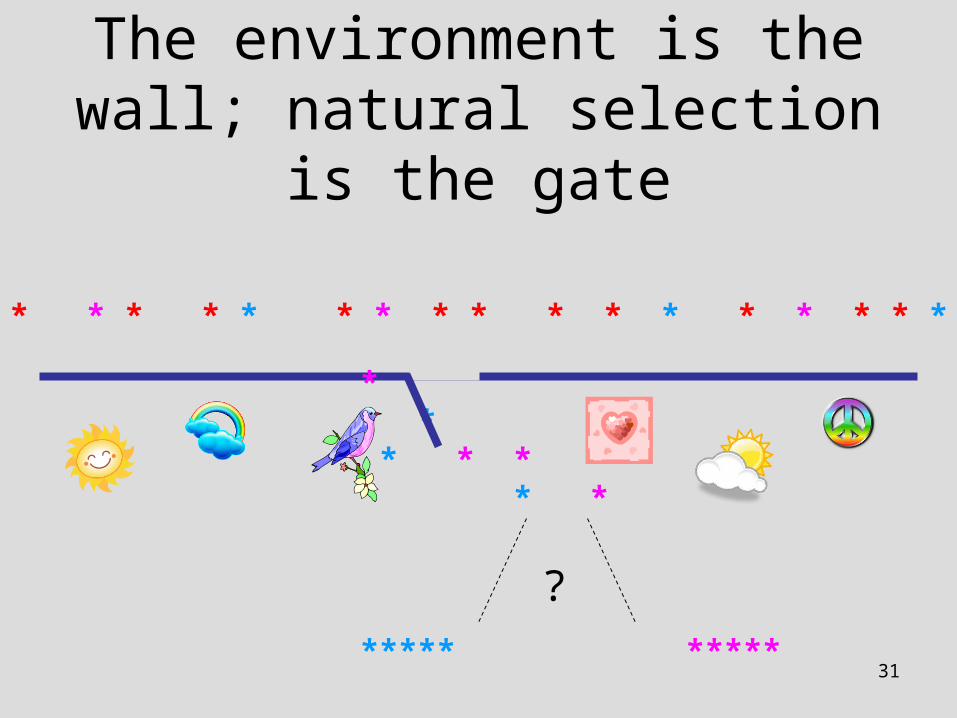
31
The environment is the wall; natural selection is the gate
* * * * * * * * * * * * * * * * * * * * *
** * * * * * *
***** *****
?
32
Image – natural variation in flower color; same image for all these summary slides
Micro-evolution:population-scale changes in allele
frequencies
• Natural Selection• Genetic Drift• Gene Flow• Selective Mating• Mutation
33
Cartoon – beaver with chainsaw paws “natural selection does not grant organisms what they “need””
Natural Selection – the essence of Darwin’s theory
Mor
e on
thi
s la
ter…
.
Differential reproductive success is the only way to account for the accumulation of
favorable traits in a population
34
Micro-evolution:population-scale changes in allele
frequencies
• Natural Selection• Genetic Drift• Gene Flow• Selective Mating• Mutation
35
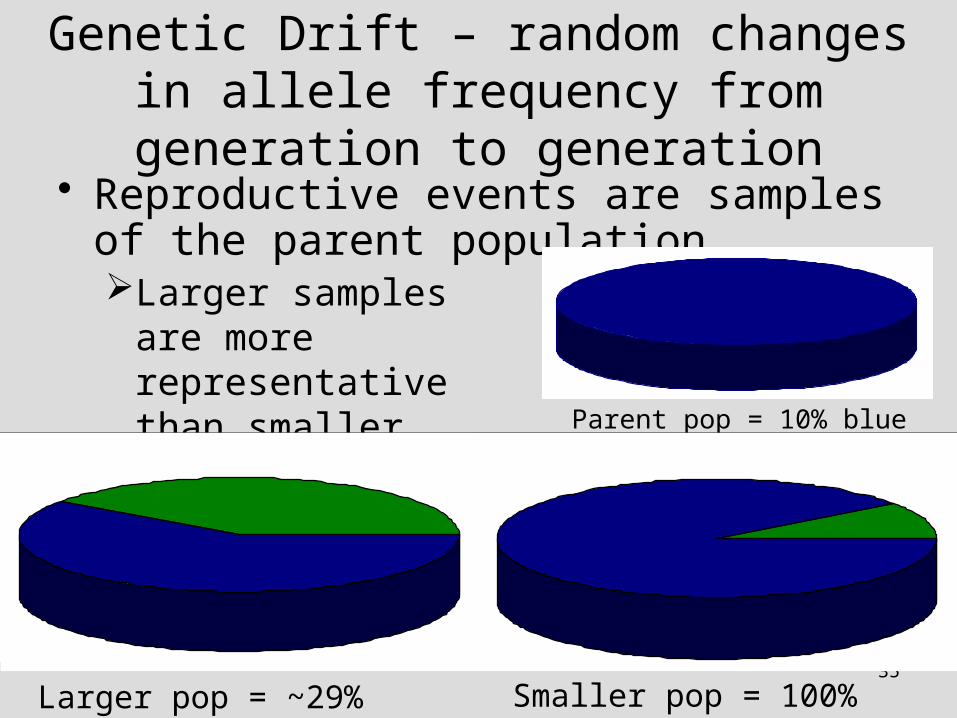
• Reproductive events are samples of the parent population
Genetic Drift – random changes in allele frequency from generation to generation
1
2
1
2
Larger pop = ~29% blue Smaller pop = 100% blue
1
2
Parent pop = 10% blue
Larger samples are more representative than smaller samples (probability theory)
36
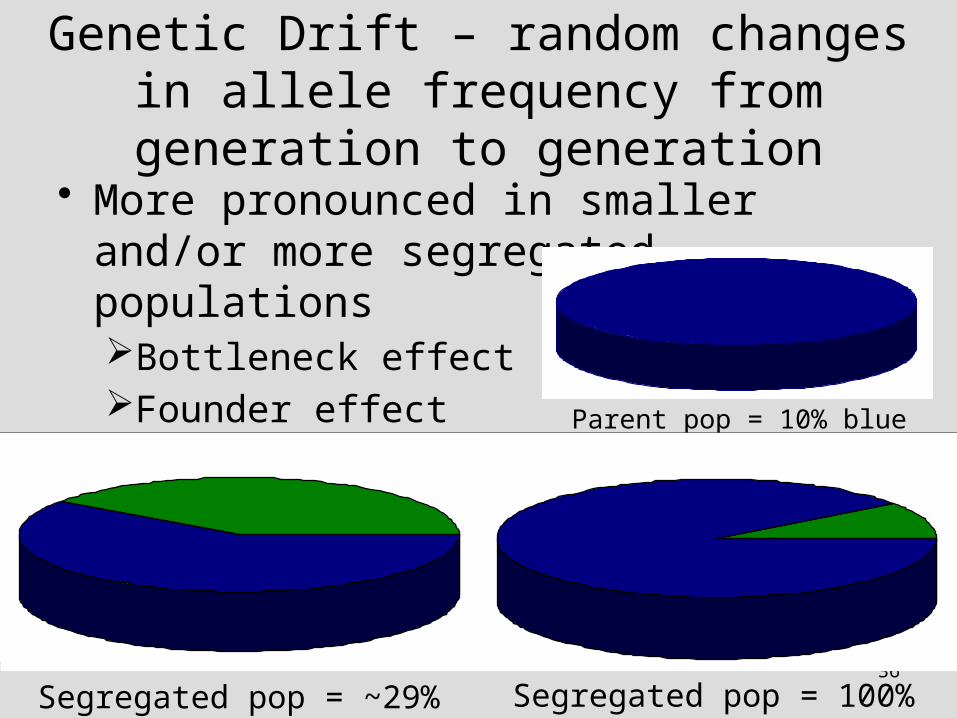
Genetic Drift – random changes in allele frequency from generation to generation
• More pronounced in smaller and/or more segregated populationsBottleneck effectFounder effect
1
2
1
2
Segregated pop = ~29% blue Segregated pop = 100% blue
1
2
Parent pop = 10% blue
37
Bottlenecking = extreme genetic drift
Diagram – bottlenecking
38
Critical Thinking
• What events could cause a bottleneck???
39
Critical Thinking
• What events could cause a bottleneck???
40
Image – cheetah
Conservation implications – cheetahs are a bottlenecked species

41
Maps – historic and current range of cheetahs
Extreme range reduction due to
habitat destruction and poaching
+Cheetahs were
naturally bottlenecked about 10,000 years
ago by the last major ice age (kinked tail)
The species is at risk of extinction
42
Images – bottlenecked and now endangered species
Australian Flame Robin, California Condor, Mauritian Kestrel
…..and many more, all driven nearly to extinction…..
Some colorful results of a quick web search on “bottlenecked species”
43
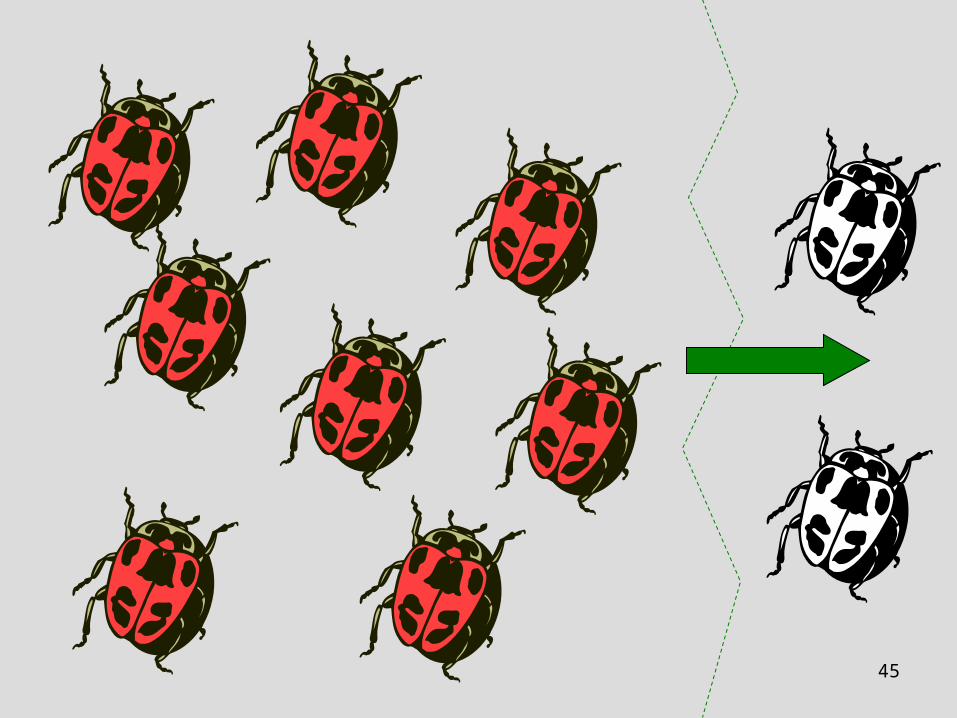
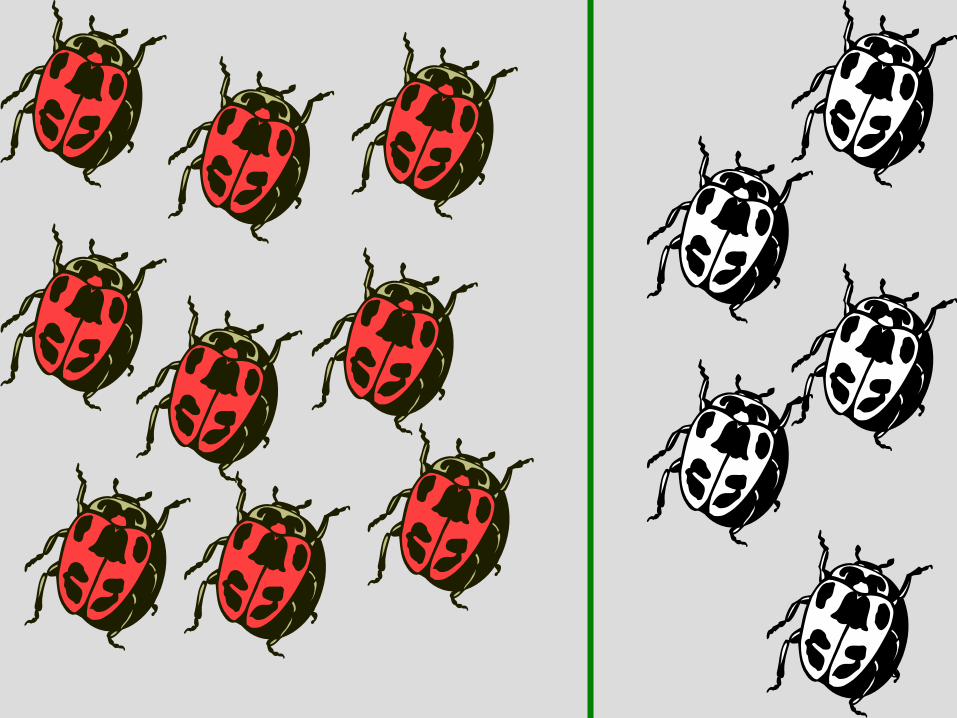
Founder Effect = extreme genetic drift
• Occurs when a single individual, or small group of individuals, breaks off from a larger population to colonize a new habitatIslandsOther side of mountainOther side of a river…
• This small group may not represent the allele distribution of the parent population
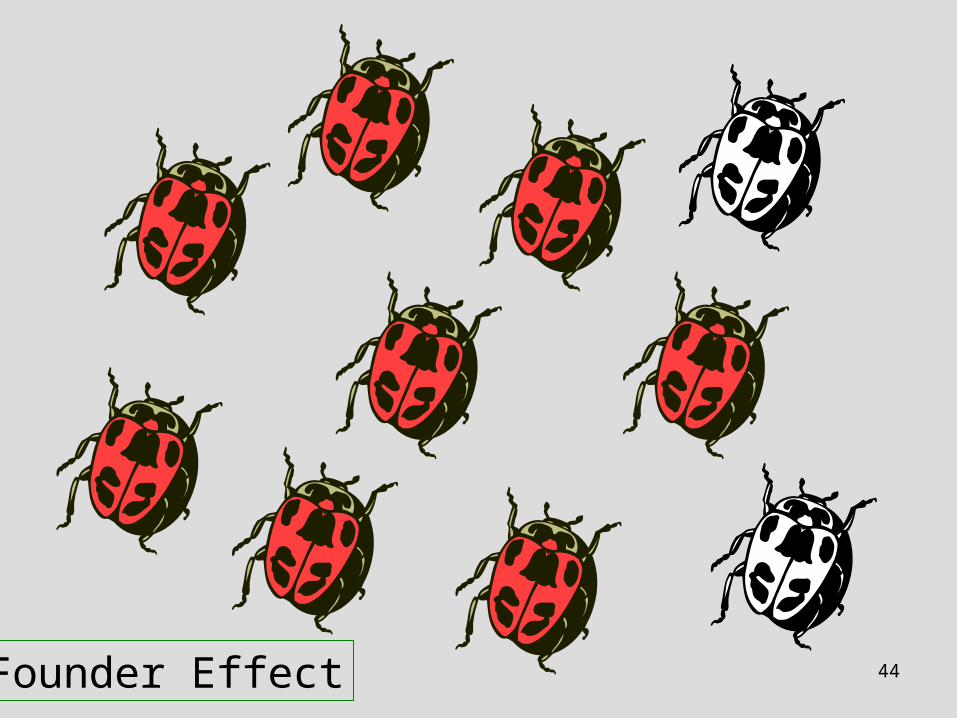
44Founder Effect
45
46
47
Image – a founding population of seeds; possibly also the bird if it’s a gravid female
Long distance dispersal events can lead to the founder effect
48
Critical Thinking
• What do you think follows long distance dispersal to a new ecosystem???

49
Critical Thinking
• What do you think follows long distance dispersal to a new ecosystem???
50
Hands On
• Genetic drift is random• Some drift is expected with every generation
Genetic drift is not necessarily extreme• Use the beads to explore this idea (Page 4)
Count out 50 beads each of 2 colorsEach bead represents an allele in the gene poolSince B and b are in equal proportion, what is
the phenotypic makeup of the diploid population???
p2 + 2pq + q2 = 1
51
Hands On – Results
• Genetic drift is random• Some drift is expected with every generation
Genetic drift is not necessarily extreme• Use the beads to explore this idea
Count out 50 beads each of 2 colorsEach bead represents an allele in the gene poolSince B and b are in equal proportion, what is
the phenotypic makeup of the diploid population???
52
Hands On
• Now simulate random mating by shaking up the beads and pulling out 2 beads at a time, with your eyes closedBe sure to return the beads to the “gene pool”We are sampling with replacement – random
• Record each offspring allele structureBe sure to assign a dominant and recessive
color• Repeat 50 times
Shake the pool each time to maintain random
53
Hands On
• Count and record the allele structure of your second generation
• Make a new gene pool of 100 beads that reflects this new allele structure
• Repeat the bead selection for a 3rd generation
• Repeat for a total of 5 generations
54
Hands On
• Is your 5th generation allele structure the same as your 1st generation???
• What is the phenotypic distribution of your 5th generation?
• What are your conclusions?• Use your lab notebook to record
observations
55
Hands On
• Now simulate a bottleneck• Shake up the beads and pull out 2 beads
at a time, with your eyes closedBe sure to return the beads to the “gene pool”We are sampling with replacement – random
• Record each offspring allele structureBe sure to assign a dominant and recessive
color• Repeat 5 times
Shake the pool each time to maintain random

56
Hands On
• Count and record the allele structure of your second generation
• Make a new gene pool of 100 beads that reflects this new allele structure
• Repeat the bead selection for a 3rd generation
• Repeat for a total of 5 generations
57
Hands On
• Is your 5th generation allele structure the same as your 1st generation???
• What is the phenotypic distribution of your 5th generation?
• What are your conclusions?• Compare 50 vs. 5 reproductive “events”• Use your lab notebook to record
observations, and type up a summary to turn in tomorrow
58
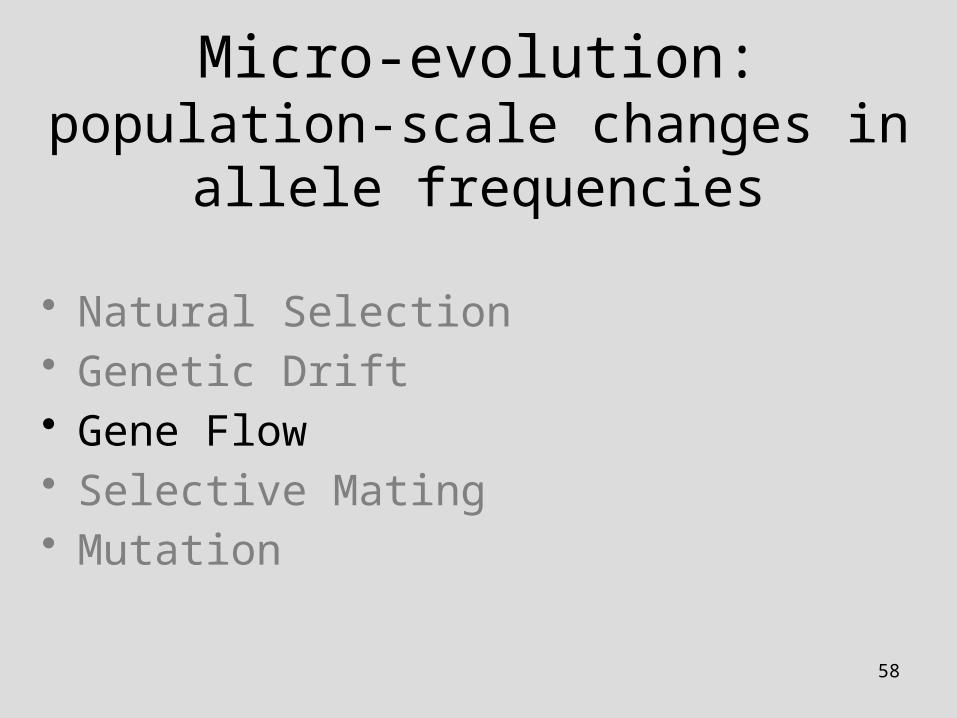
Micro-evolution:population-scale changes in allele
frequencies
• Natural Selection• Genetic Drift• Gene Flow• Selective Mating• Mutation
59
Gene Flow
• Mixes alleles between populationsImmigrationEmigration
• Most populations are NOT completely isolated
60
Critical Thinking
• Will gene flow tend to increase or decrease speciation???
61
Critical Thinking
• Will gene flow tend to increase or decrease speciation???
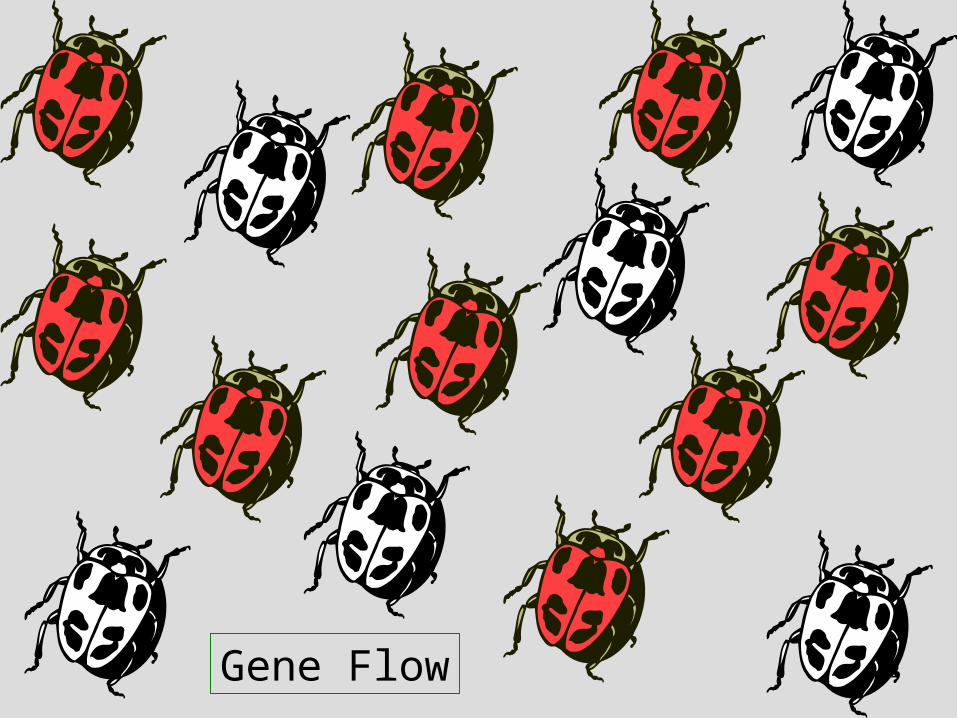
62Gene Flow
63
Hands On
• How could we demonstrate gene flow with our beads???
64
Hands On – Results
• How could we demonstrate gene flow with our beads???
65
Micro-evolution:population-scale changes in allele
frequencies
• Natural Selection• Genetic Drift• Gene Flow• Selective Mating• Mutation
66
Image – male peacock with mating display
Selective Breeding
67
Critical Thinking
• Animal behaviors are obvious examples• Can you think of others???
Critical Thinking
• Animal behaviors are obvious examples• Can you think of others???
69
Micro-evolution:population-scale changes in allele
frequencies
• Natural Selection• Genetic Drift• Gene Flow• Selective Mating• Mutation
70
Diagram – mutations in DNA strand
Cartoon - jackalope
Mutations• Random, rare, but
regular events• The only source of
completely new traits
just for fun…..
71
Evolution = random events
x“the gate”
* * * * * * * * * * * * * * * * * * * * *** * * * * * *
72
Review: Micro-evolution:population-scale changes in allele
frequencies
• Natural Selection• Genetic Drift• Gene Flow• Selective Mating• Mutation
73
Sources of Genetic Variation
• Natural selection acts on natural variation• Where does this variation come from???
MeiosisMutation
• Additional mechanisms help preserve variation (later)
74
Diagram – meiosis I
Meiosis = key source of variation
75
Diagram – meiosis II
76
Diagram – results of meiosis with n=2
Random, Independent Assortment of Homologous Chromosomes
n = 2
77
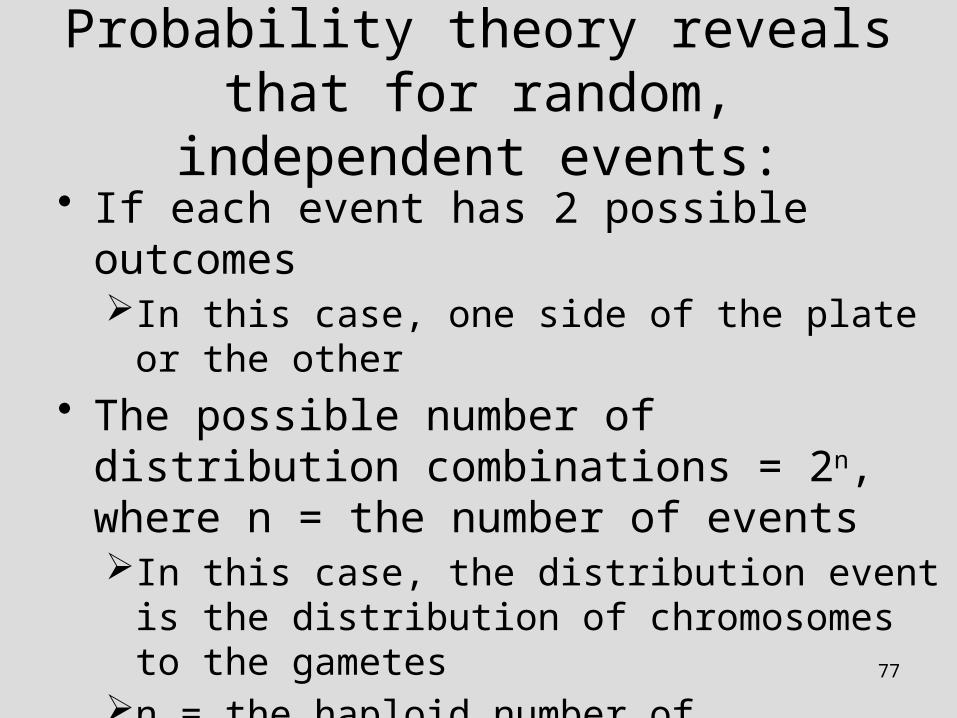
Probability theory reveals that for random, independent events:
• If each event has 2 possible outcomesIn this case, one side of the plate or the other
• The possible number of distribution combinations = 2n, where n = the number of eventsIn this case, the distribution event is the
distribution of chromosomes to the gametesn = the haploid number of chromosomes
• If n is 2, then combinations are 22 = 4
78
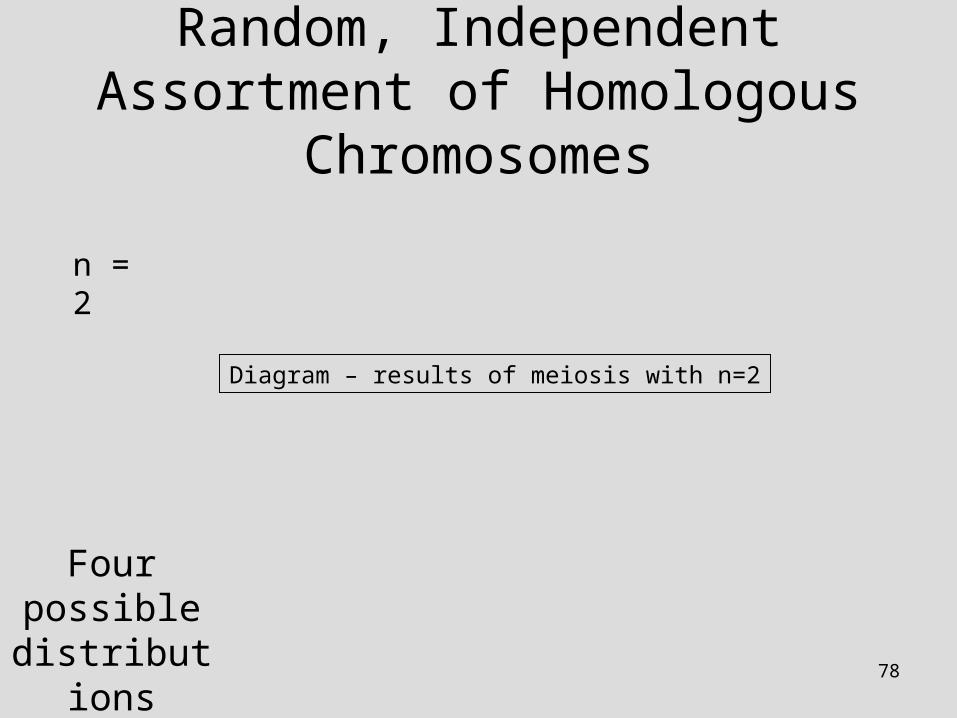
Diagram – results of meiosis with n=2
Random, Independent Assortment of Homologous Chromosomes
n = 2
Four possible
distributions
79
Probability theory reveals that for random, independent events:
• If each event has 2 possible outcomesIn this case, one side of the plate or the other
• The possible number of distribution combinations = 2n, where n = the number of eventsIn this case, distribution refers to the distribution
of chromosomes to the gametesn = the haploid number of chromosomes
• If n is 23, then combinations are 223 = 8.4 million!
80
Probability is Multiplicative:
8.4 million x 8.4 million > 70 trillion!!!
That is the number of possible combinations of maternal and paternal chromosomes in the offspring of a randomly mating pair of
humans
81
Diagram – recombinationRecombination increases the
potential variation to
infinity

82
Critical Thinking
• Can meiosis produce totally new traits???
83
Critical Thinking
• Can meiosis produce totally new traits???
84
Natural Selection as a Mechanism of Evolutionary Adaptation
• Natural selection acts on the variation produced by meiosis and mutation
• Selection increases the “fitness” of a population in a given environment
• Fitness = ???
85
Natural Selection as a Mechanism of Evolutionary Adaptation
• Natural selection acts on the variation produced by meiosis and mutation
• Selection increases the “fitness” of a population in a given environment
• Fitness =
86
Natural selection has limits• Individuals vary in fitness
Natural selection promotes the most fit• Selection acts on the phenotype – the
whole, complex organismResults from the combination of many different
genes for any organismThese genes are expressed in the whole,
complex environment • Selection is always constrained by the
whole, complex evolutionary history of the species
87
Critical Thinking
• Can evolution respond to “needs”???
Beaver cartoon again
88
Critical Thinking
• Can evolution respond to “needs”???
89
Hands On
• Calculate the allele distribution to the F1 with the dominant phenotype resulting in a 20% decline in the reproductive success rate (Page 3, with a twist)
• The twist – start with a 50/50 distribution of dominant and recessive alleles in the gene pool

90
Hands On – Results
91
Hands On
• Calculate the allele distribution to the F1 with the recessive phenotype resulting in 100% mortality (Page 3, with a twist)
• The twist – start with a 50/50 distribution of dominant and recessive alleles in the gene pool
92
Hands On – Results
93
Hands On
• In either case would either the T or t allele become extinct?
• Why or why not?
94
Hands On – Results
• In either case would either the T or t allele become extinct?
• Why or why not?
95
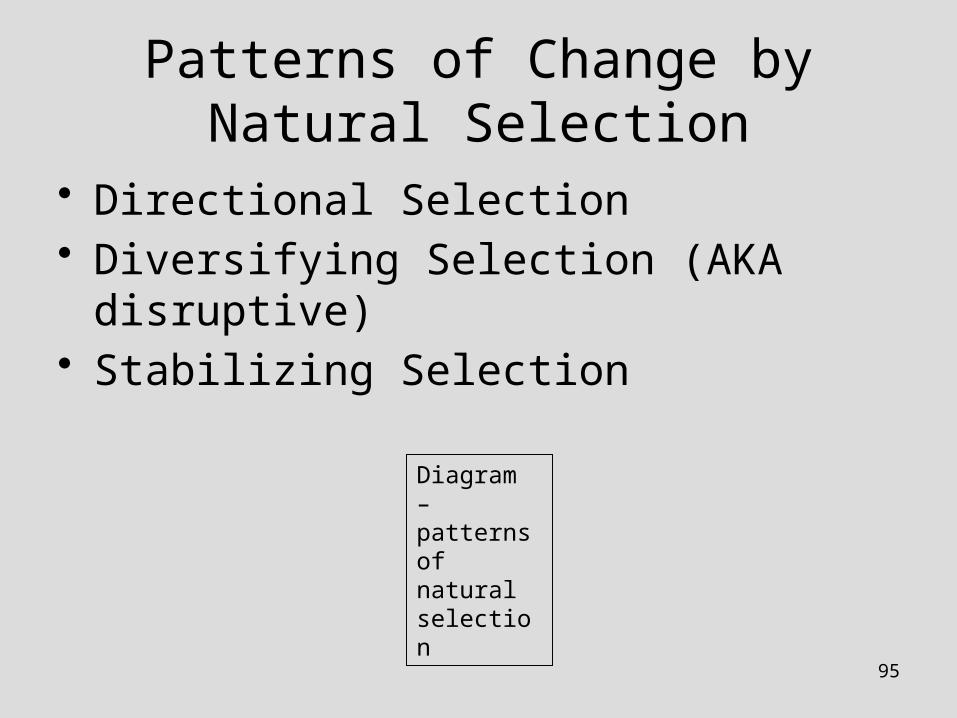
Diagram – patterns of natural selection
Patterns of Change by Natural Selection
• Directional Selection• Diversifying Selection (AKA disruptive)• Stabilizing Selection

96
Diagram – patterns of natural selection
Remember, all populations exhibit a range of natural variation
97
Diagram – directional selection
Directional Selection
• Phenotypes at one extreme of the range are most successfulColorPatternFormMetabolic processes
• The population shifts to favor the successful phenotype
98
Diagram – diversifying selection
Diversifying Selection
• Multiple, but not all, phenotypes are successfulPatchy environmentsSub-populations migrate to new habitats
• The population begins to fragment and new species begin to diverge
99
Diagram – stabilizing selection
Stabilizing Selection
• The intermediate phenotypes are most successfulHomogenous environmentsStable conditions
• The range of variation within the population is reduced
100
Critical Thinking
• Which selection mode will most quickly lead to the development of diversity???
101
Critical Thinking
• Which selection mode will most quickly lead to the development of diversity???

102
Critical Thinking
• Can you think of a real-life example of an adaptive phenotype???
103
Critical Thinking
• Can you think of a real-life example of an adaptive phenotype???
104
Images – natural variation in flower color
Preservation of Natural Variation
• Diploidy• Balanced Polymorphism• Neutral Variation
105
Diploidy – 2 alleles for every gene
• Recessive alleles retained in heterozygotesNot expressedNot eliminated, even if the recessive trait is aa may be eliminated, while Aa is preserved in
the population• Recessive alleles function as latent
variation that may prove helpful if environment changes
106
Balanced Polymorphism
• Heterozygote advantage• Frequency dependent selection• Phenotypic variation
107
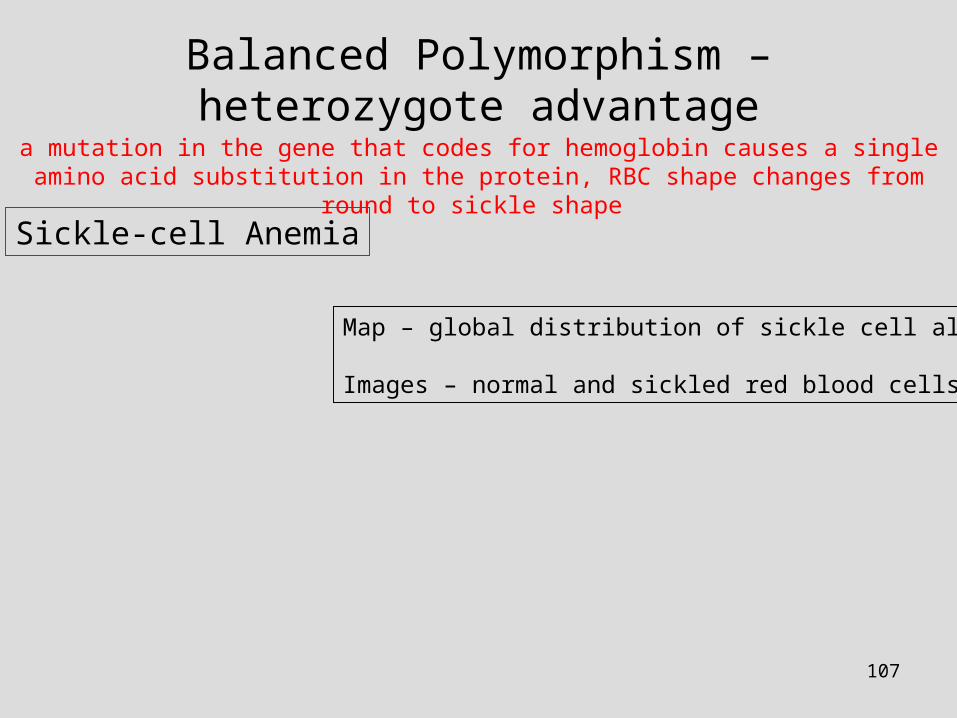
Map – global distribution of sickle cell allele
Images – normal and sickled red blood cells
Balanced Polymorphism – heterozygote advantage
Sickle-cell Anemia
a mutation in the gene that codes for hemoglobin causes a single amino acid substitution in the protein, RBC shape changes from round to sickle shape
108
Graph – frequency dependent selection results
Balanced Polymorphisms – Frequency Dependent Selection
rare clone is less infected
109
Images – balanced polymorphisms in asters and snakes
Balanced Polymorphisms – Phenotypic Variationmultiple morphotypes are favored by heterogeneous
(patchy) environment
110
Neutral Variation
• Genetic variation that has no apparent effect on fitness
• Not affected by natural selection• May provide an important base for future
selection, if environmental conditions change
111
Key Concepts: QUESTIONS???
• The Modern Synthesis• Populations and the Gene Pool• The Hardy-Weinberg Equilibrium• Micro-evolution• Sources of Genetic Variation• Natural Selection• Preservation of Genetic Variation