1. income - oecd.org - oecd · regional disposable household income is expressed per capita (per...
TRANSCRIPT
14
1. Income
Why does it matter for local well-being?
Income is an important component of individual well-being as it allows people to satisfy their basic needs and meet other purposes that are important for their lives. It is also associated to life satisfaction, perceived social status and social connections.
Indicator
The disposable income of private households per capita is derived from the balance of primary income by adding all current transfers from the government, except social transfers in kind, and subtracting current transfers from the households such as income taxes, regular taxes on wealth, regular inter-household cash transfers and social contributions. Regional disposable household income is expressed per capita (per person), in USD purchasing power parities (PPPs) at constant prices (year 2010).
Measuring outcome and trends
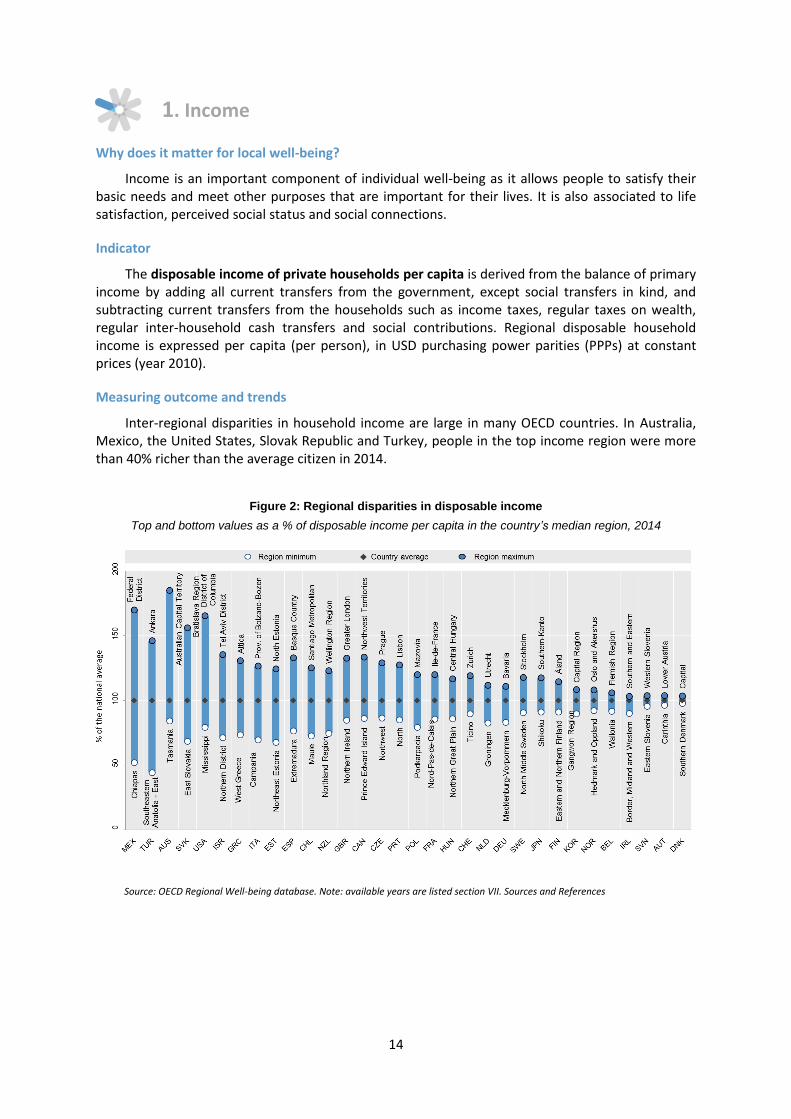
Inter-regional disparities in household income are large in many OECD countries. In Australia, Mexico, the United States, Slovak Republic and Turkey, people in the top income region were more than 40% richer than the average citizen in 2014.
Figure 2: Regional disparities in disposable income
Top and bottom values as a % of disposable income per capita in the country’s median region, 2014
Source: OECD Regional Well-being database. Note: available years are listed section VII. Sources and References
15
2. Jobs
Why does it matter for regional well-being?
Employment represents another well-being dimension that can have a huge impact on the material conditions of people. In addition, having a job helps people maintain and develop their skills, and it affects other well-being dimensions, such as health, social connections and life satisfaction. Unequal access to employment is a major driver of inter-regional inequalities.
Indicators
The employment rate is calculated as the ratio between employed persons and working age population (aged 15-64 years).
The unemployment rate is defined as the ratio between unemployed persons and labour force, where the latter is composed of unemployed and employed persons.
Measuring outcome and trends
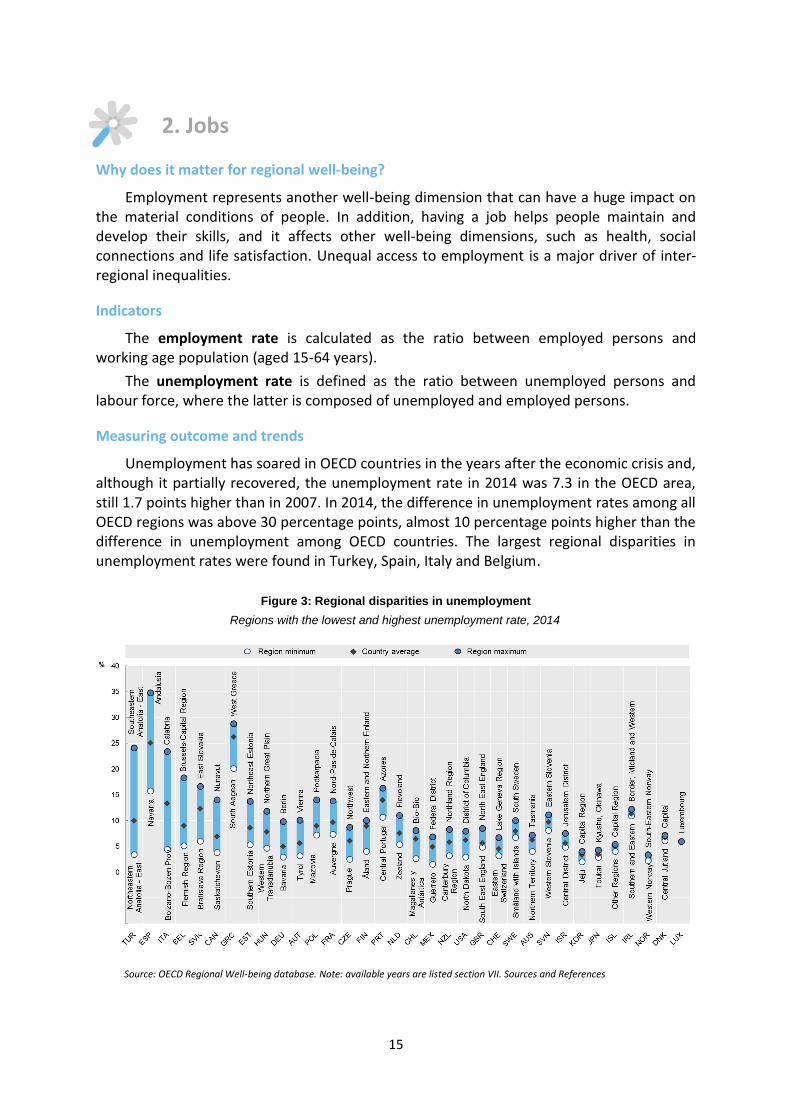
Unemployment has soared in OECD countries in the years after the economic crisis and, although it partially recovered, the unemployment rate in 2014 was 7.3 in the OECD area, still 1.7 points higher than in 2007. In 2014, the difference in unemployment rates among all OECD regions was above 30 percentage points, almost 10 percentage points higher than the difference in unemployment among OECD countries. The largest regional disparities in unemployment rates were found in Turkey, Spain, Italy and Belgium.
Figure 3: Regional disparities in unemployment
Regions with the lowest and highest unemployment rate, 2014
Source: OECD Regional Well-being database. Note: available years are listed section VII. Sources and References

16
3. Health
Why does it matter for local well-being?
There are also strong regional disparities in health outcomes, which are partly explained by unequal access to health services.
Indicators
Life expectancy at birth measures the number of years a new born can expect to live, if death rates in each age group were to stay the same during her or his lifetime.
Age-adjusted mortality rates eliminate the difference in mortality rates due to a population’s age profile and are comparable across countries and regions. Age-adjusted mortality rates are calculated by applying the age-specific death rates of one region to the age distribution of a standard population. In this case, the population by five years age class, averaged over all OECD regions.
Measuring outcome and trends
In 55% of OECD regions life expectancy at birth now exceeds 80 years. The lowest levels of life expectancy, below 75 years, are found in 30 OECD regions. The difference in life expectancy among OECD countries is 8 years (between Spain or Japan and Mexico). Within countries, it is 11 years between British Columbia and Nunavut in Canada, and 6 years between the Capital Territory and the Northern Territory in Australia, or Hawaii and Mississippi in the United States.
Figure 4: Regional disparities in life expectancy at birth
Regions with the lowest and highest life expectancy at birth, 2013
Source: OECD Regional Well-being database. Note: available years are listed section VII. Sources and References

17
4. Education
Why does it matter for local well-being?
Education can have many private returns, to skills, employment, health and civic engagement. Moreover, there is evidence that education also has important social returns, which affect the overall productivity of places, reduce crime rates and increase political participation. The industrial mix and a solid base of human capital make some regions competitive and attractive to employers. Evidence shows that the divergence in educational levels in regions is causing an equally large divergence in labour productivity and salaries for most of the workers, in particular for the highly-skilled but also for low-skills jobs.
Indicator
The labour force with at least upper secondary education is defined as the labour force, aged 15 and over, that has completed at least upper secondary educational programmes, defined as the ISCED level 3 by the international standard classification for education.
Measuring outcome and trends
Large educational variations can be observed across regions. In seven OECD countries the difference between the region with the highest value and that with the lowest value in the share of the workforce with at least upper secondary education is higher than 20 percentage points. In Turkey and Mexico, the same indicator in the two capital regions, Ankara and the Federal District, is over 30 percentage points higher than that in North-Eastern Anatolia (Turkey) and the state of Chiapas (Mexico) respectively.
Figure 5: Regional disparities in education
Regions with the lowest and highest percentage of workforce with at least upper secondary education, 2014
Source: OECD Regional Well-being database. Note: available years are listed section VII. Sources and References.
18
5. Environmental outcomes
Why does it matter for local well-being?
The quality of the local environment has important effects on well-being of current and future generations. While at the moment only air pollution is included, various aspects of the environmental quality should be included – such as water, waste, amenities, etc. – as they might be very different in the same region.
Indicator
Population exposure to air pollution is calculated by taking the weighted average value of PM2.5 for the grid cells present in each region, with the weight given by the estimated population count in each cell. These estimates are made possible by the computation of satellite-based observations in OECD estimates from van Donkelaar, A., R.V. Martin, M. Brauer and B. L. Boys (2014) “Use of Satellite Observations for Long-Term Exposure Assessment of Global Concentrations of Fine Particulate Matter”, Environmental Health Perspectives, Vol. 123.
Measuring outcome and trends
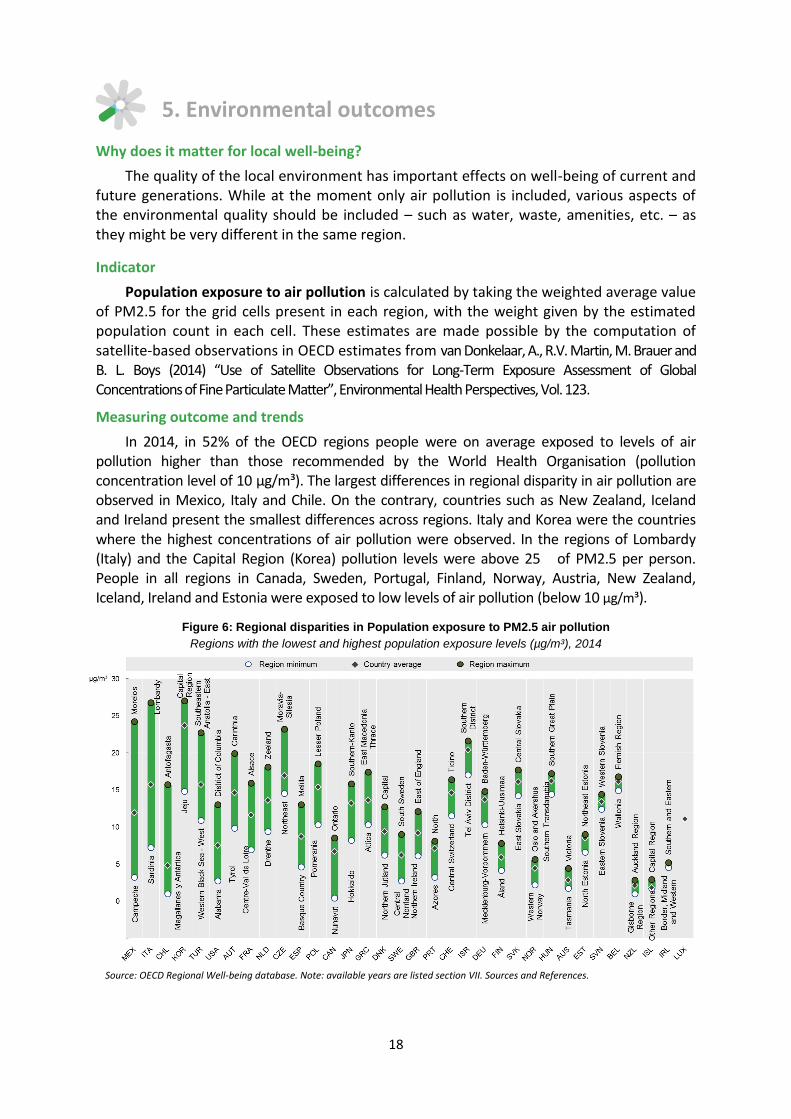
In 2014, in 52% of the OECD regions people were on average exposed to levels of air pollution higher than those recommended by the World Health Organisation (pollution concentration level of 10 µg/m³). The largest differences in regional disparity in air pollution are observed in Mexico, Italy and Chile. On the contrary, countries such as New Zealand, Iceland and Ireland present the smallest differences across regions. Italy and Korea were the countries where the highest concentrations of air pollution were observed. In the regions of Lombardy (Italy) and the Capital Region (Korea) pollution levels were above 25 of PM2.5 per person. People in all regions in Canada, Sweden, Portugal, Finland, Norway, Austria, New Zealand, Iceland, Ireland and Estonia were exposed to low levels of air pollution (below 10 µg/m³).
Figure 6: Regional disparities in Population exposure to PM2.5 air pollution
Regions with the lowest and highest population exposure levels (µg/m³), 2014
Source: OECD Regional Well-being database. Note: available years are listed section VII. Sources and References.

19
6. Safety
Why does it matter for local well-being?
Personal security is the extent to which people feel safe and rescued from personal harm or crime. Crime has of course a huge direct and often long-lasting effect on victims. However, it can also strongly affect the well-being of those who are not victims, but that live in the same community. While there is an increasing use of subjective measures of safety, data availability across OECD regions imposes the use of only objective indicators.
Indicator
Homicide is the unlawful killing of a human being with malice aforethought, more explicitly intentional murder. Reported homicides are the number of homicides reported to the police. The homicide rate is the number of reported homicides per 100 000 inhabitants.
Measuring outcome and trends
This indicator shows relatively large disparities across OECD regions, especially in Northern and Southern American countries. The variability of crime rates across space has been known for many years and evidence shows that there is a clear link to other well-being dimensions related to spatial contexts. These are, among others, education, access to jobs and social connections.
Figure 7: Regional disparities in homicide
Regions with the lowest and highest homicide rates, 2014
Source: OECD Regional Well-being database. Note: available years are listed section VII. Sources and References.

20
7. Civic engagement and governance
Why does it matter for local well-being?
Institutional conditions and governance matter for individual well-being, bearing in mind that many of the policies that affect people’s lives most directly are enacted at local level. Voter turnout is an indication of the degree of public trust in government and of citizens’ participation in the political process.
Indicator
Voter turnout is defined as the ratio between the number of voters to the number of persons with voting rights. The last national election is considered.
Measuring outcome and trends
Voter turnout varies across OECD regions (Figure 8). Australia and Belgium (where voting is mandatory), Chile and Turkey, have regions with a turnout of over 90%. The largest regional disparities in electoral participation to national elections are presented in the United States, Canada, Spain, Mexico, Chile and Portugal (above 20 percentage points).
Figure 8: Regional disparities in turnout
Regions with the lowest and highest turnout in general election, 2014 or latest year
Source: OECD Regional Well-being database. Note: available years are listed section VII. Sources and References.

21
8. Access to services
Why does it matter for local well-being?
Accessibility of services is one of the key dimensions of well-being, affecting how people obtain what is necessary to satisfy their wants and needs. Measuring accessibility of services allows for a better understanding of inequality in communities. Significant disparities in the access to basic and advanced services, such as transport, water and sanitation, education, health and ICT, still persist across and within regions. These differences are relevant for policy makers because they reflect the opportunities available to people (Sen, 1993) and can help prioritise interventions in underserviced areas.
Indicator
Percent of households with internet broadband access
Measuring outcome and trends
The largest regional disparities in broadband connection are observed in the countries where the average national level of access to services is relatively low, such as in Turkey, Mexico and Chile. In these three countries, the value in the region with the highest proportion of households with broadband connection is more than three times higher than the lowest value.
Figure 9: Regional disparities in broadband access
Regions with the lowest and highest share of household with broadband access, 2014 or latest year
Source: OECD Regional Well-being database. Note: available years are listed section VII. Sources and References.
22
9. Housing
Why does it matter for local well-being?
In measuring well-being, housing is an important dimension. Appropriate shelter is one of the most basic human needs, along with food and water. Furthermore, housing costs often represent the largest component of a household’s income. Housing is also strongly connected to other well-being dimensions, such as health, income and life satisfaction (OECD, 2011). At local and regional level, the characteristics of housing are also closely linked to the territorial/spatial configuration.
Indicator
Number of rooms per person in a dwelling. This indicator has some limitation, since it does not consider important elements such as housing prices, the overall cost of life in the region, the type of region (whether a city or a less densely populated region), or the potential benefits of trading space for location.
Measuring outcome and trends
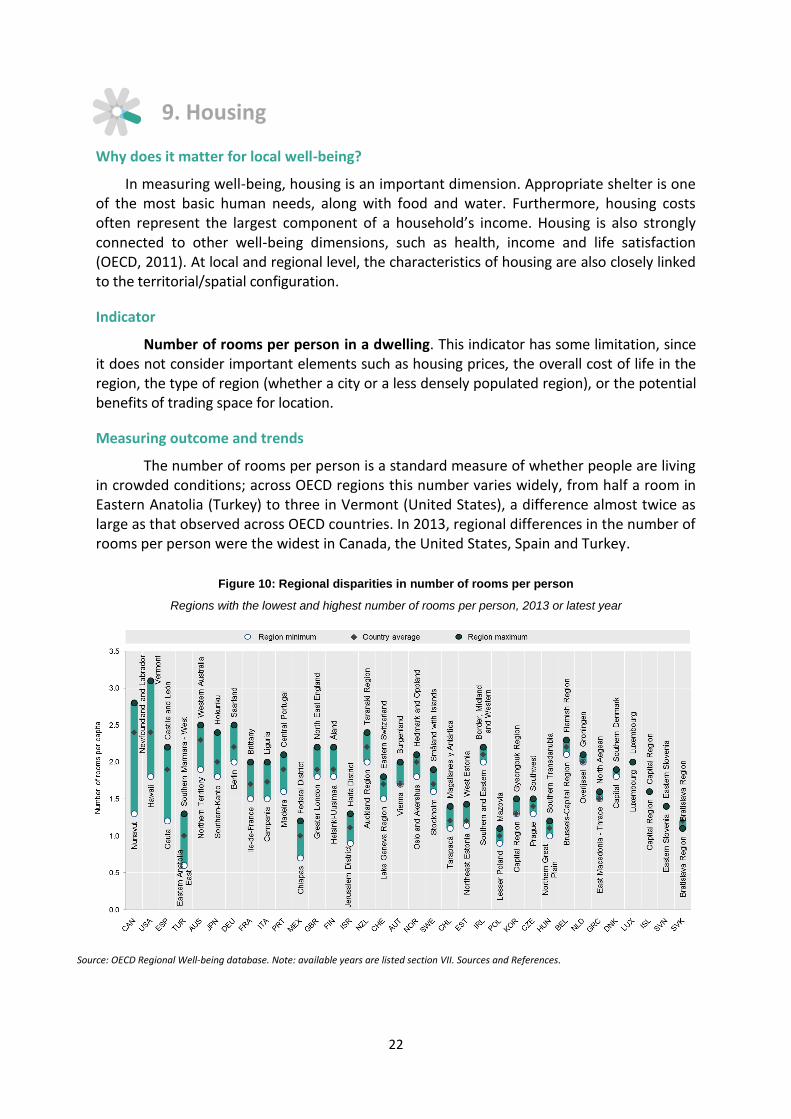
The number of rooms per person is a standard measure of whether people are living in crowded conditions; across OECD regions this number varies widely, from half a room in Eastern Anatolia (Turkey) to three in Vermont (United States), a difference almost twice as large as that observed across OECD countries. In 2013, regional differences in the number of rooms per person were the widest in Canada, the United States, Spain and Turkey.
Figure 10: Regional disparities in number of rooms per person
Regions with the lowest and highest number of rooms per person, 2013 or latest year
Source: OECD Regional Well-being database. Note: available years are listed section VII. Sources and References.
23
10. Community
Why does it matter for local well-being?
Good interpersonal relations, social network supports and general trust in others and institutions are considered important sources of individual well-being and social cohesion. Not only do they represent additional resources to the material and cultural ones, but they can also improve performance of institutions and reduce transaction costs.
Indicator
Perceived social network support is based on the survey question: “If you were in trouble, do you have relatives or friends you can count on to help you whenever you need them, or not?”. The data shown here reflect the percentage of the regional sample responding “Yes”.
Measuring outcome and trends
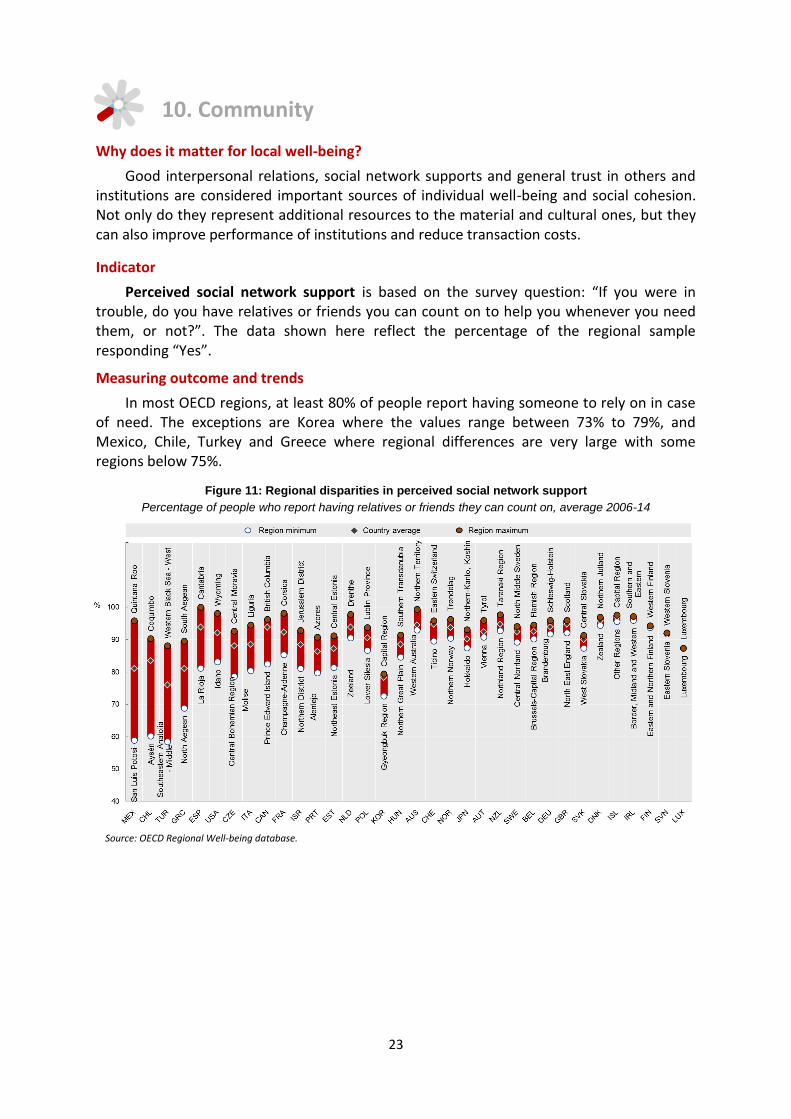
In most OECD regions, at least 80% of people report having someone to rely on in case of need. The exceptions are Korea where the values range between 73% to 79%, and Mexico, Chile, Turkey and Greece where regional differences are very large with some regions below 75%.
Figure 11: Regional disparities in perceived social network support
Percentage of people who report having relatives or friends they can count on, average 2006-14
Source: OECD Regional Well-being database.

24
11. Life satisfaction
Why does it matter for local well-being?
Subjective well-being reflects the notion of measuring how people experience and evaluate their lives. It includes evaluation of life as a whole (generally referred as “life satisfaction”), evaluations of particular domains of life (for example, “satisfaction with time available for leisure”), feelings and emotions, as well as measures of “meaningfulness” or “purpose” in life. People’s evaluations of different domains and their expectations are useful information to guide policy making.
Indicator
Life satisfaction is expressed as the mean score on an 11 point scale (based on the Cantril ladder measure). It is measured using a survey question in which respondents are asked “Please imagine a ladder, with steps numbered from 0 at the bottom to 10 at the top. The top of the ladder represents the best possible life for you and the bottom of the ladder represents the worst possible life for you. On which step of the ladder would you say you personally feel you stand at this time?”.
Measuring outcome and trends
This indicator shows relatively large disparities across OECD regions, especially in Northern and Southern American countries. The variability of crime rates across space has been known for many years and evidence shows that there is a clear link to other well-being dimensions related to spatial contexts. These are, among others, education, access to jobs and social connections.
Figure 12: Regional disparities in life satisfaction
Mean satisfaction with life; 0-10 points scale; average 2006-14
Source: OECD Regional Well-being database.