1 charts and graphs gantt chart pert chart introduction to microsoft project work breakdown...
TRANSCRIPT
1
Charts and Graphs
Gantt ChartPert ChartIntroduction to Microsoft ProjectWork breakdown structure
2
Introduction
These charts are used for
1.Strategic Management
2.Project Management
Project ManagementApplication of knowledge, skills, tools and
techniques for project activities in order to meet or exceed stakeholder needs and expectation from a project.
3
Introduction
Helps project manager and team in term ofScope managementTime managementCost managementQuality management
Charts for project scheduling Gantt Chart, also known as (Time Line Charts) PERT chart (Evaluation Review Technique)-
network diagram.
4
Gantt Chart
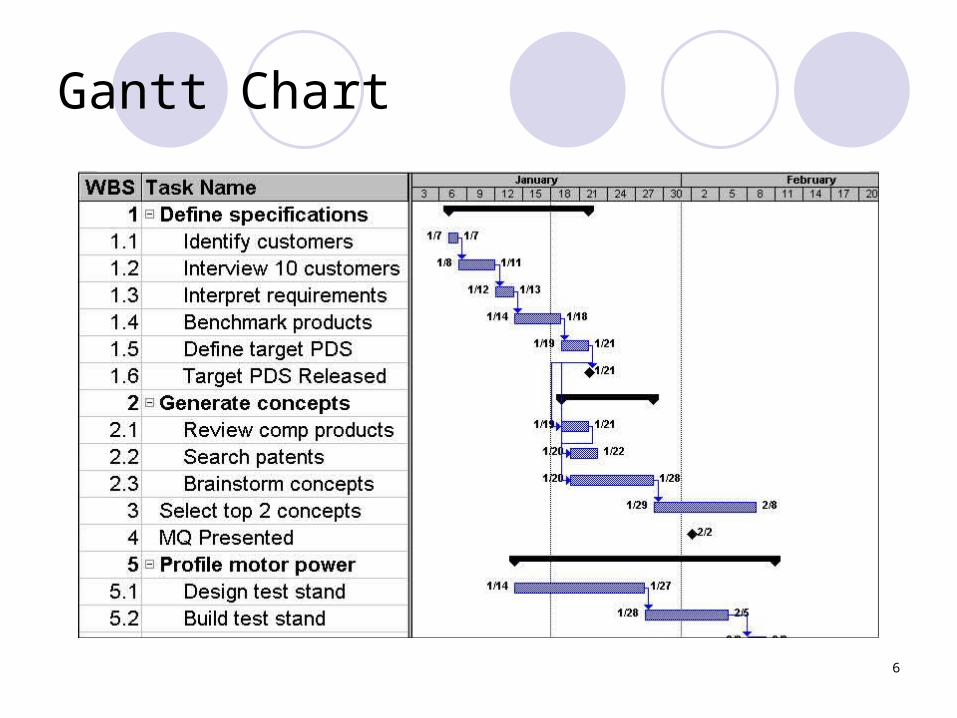
A Gantt chart is a graphical representation of the duration of tasks against the progression of time.
useful tools for planning and scheduling projects. allow you to assess how long a project should take. lay out the order in which tasks need to be carried
out. help manage the dependencies between tasks. determine the resources needed.
5
Advantages
Gantt charts are useful tools when a project is under way.
monitor progress. You can immediately see what should have been achieved at a point in time.
Show how remedial action may bring the project back on course.
6
Gantt Chart
7
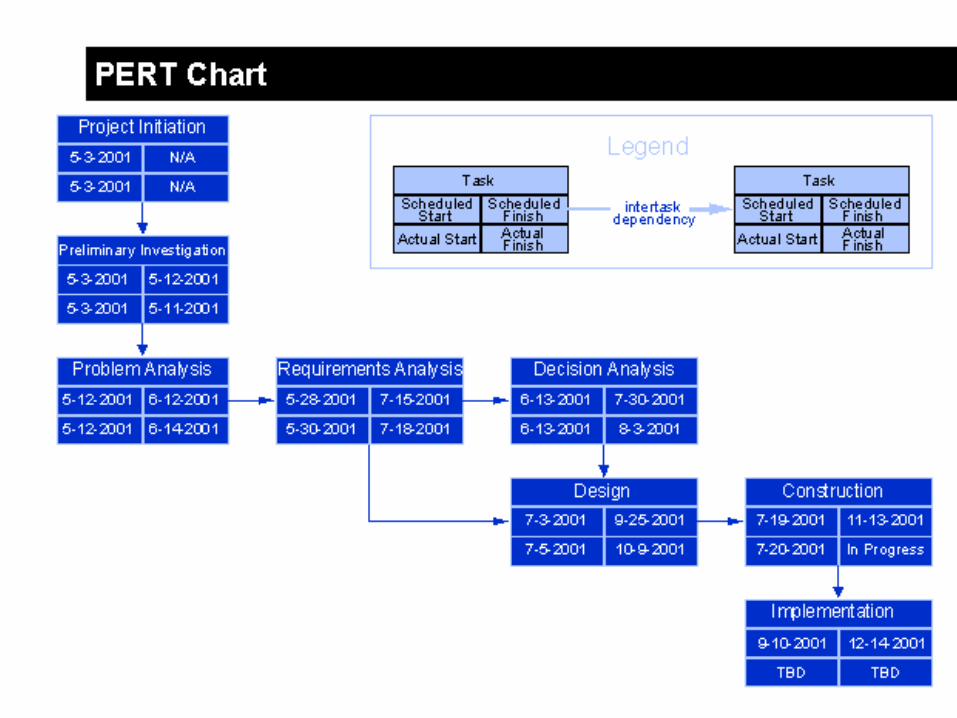
PERT chart
"PERT" developed by the United States Department of Defense as a management tool for complex military projects is an acronym for "Program Evaluation and Review Technique".
This technique was soon adapted for used in educational research and evaluation. Through PERT, complex projects can be blueprinted as a network of activities and events (Activity Network Diagram).
8
PERT chart
It is used for project scheduling. Pert charts allow software planners, or individuals to:Determine the critical path a project must follow.
Critical path is the longest overall duration, determining the shortest time to complete the project
Establish most likely time estimates for individual task by applying statistical models.
Calculate boundary times that define a time ‘window’ for a particular task.
9
10
Project Management Software
Among the project management software used to create charts and graph are:Microsoft ProjectMicrosoft Visio
11
Microsoft ProjectMicrosoft Project
Ikon Microsoft ProjectIkon Microsoft Project
12
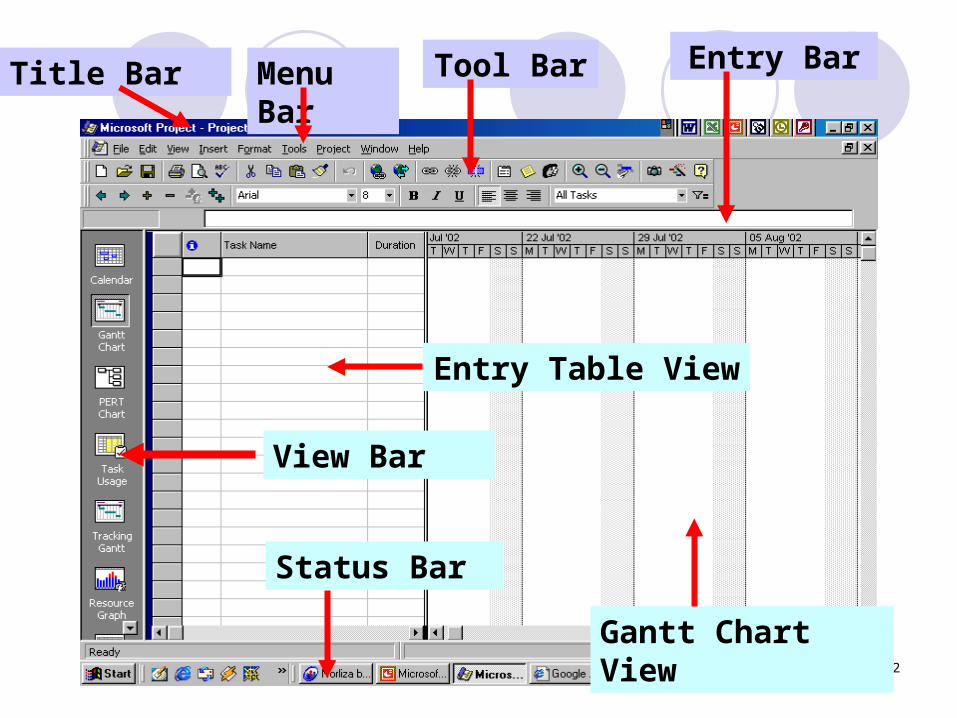
Title Bar Menu Bar
Tool Bar Entry Bar
View Bar
Status Bar
Gantt Chart View
Entry Table View
13
Microsoft Project-Gantt Charts
Gantt charts provide a standard format for displaying project schedule information by listing project activities and their corresponding start and finish dates in a calendar format
Symbols include:A black diamond: milestones or significant events on a
project with zero durationThick black bars: summary tasksLighter horizontal bars: tasksArrows: dependencies between tasks
14
Creating a Gantt Chart
The Gantt chart is constructed with a horizontal axis representing the total time span of the project, broken down into increments (days, weeks, or months).
constructed with a vertical axis representing the tasks that make up the project and constructed with a graph area which contains horizontal bars for each task connecting the period start and period ending symbols.
15
The Gantt chart also has variants such as: Milestones: important checkpoints or interim
goals for a projectResources: for team projects, it often helps to
have an additional column containing numbers or initials which identify who on the team is responsible for the task
16
Status: the projects progress, the chart is updated by filling in the task's bar to a length proportional to the amount of work that has been finished
Dependencies: an essential concept that some activities are dependent on other activities being completed first
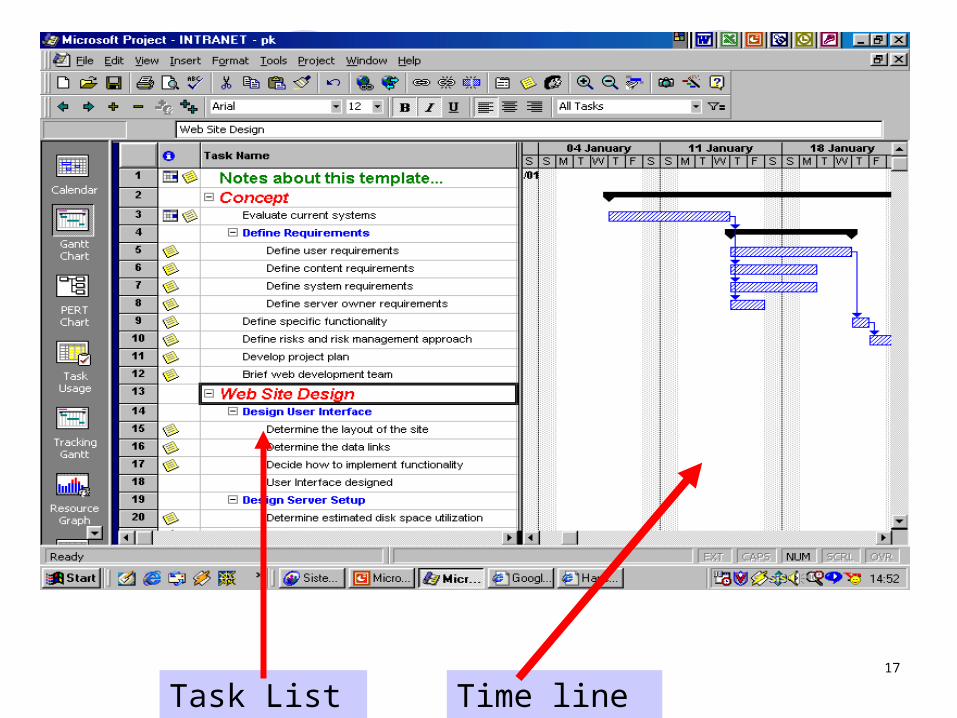
17
Task List Time line
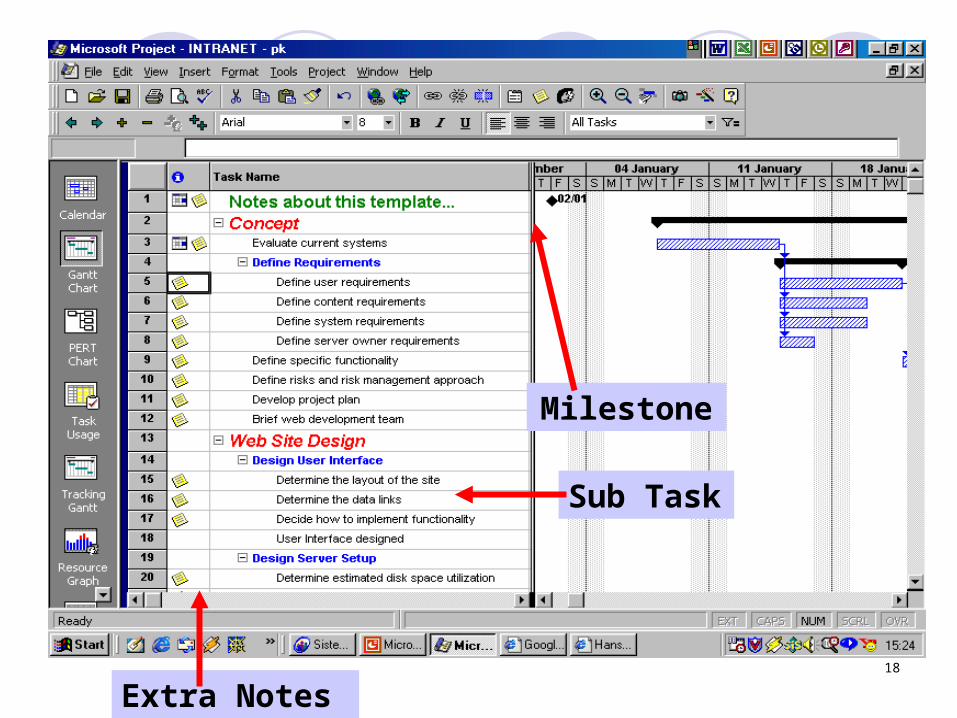
18
Milestone
Sub Task
Extra Notes
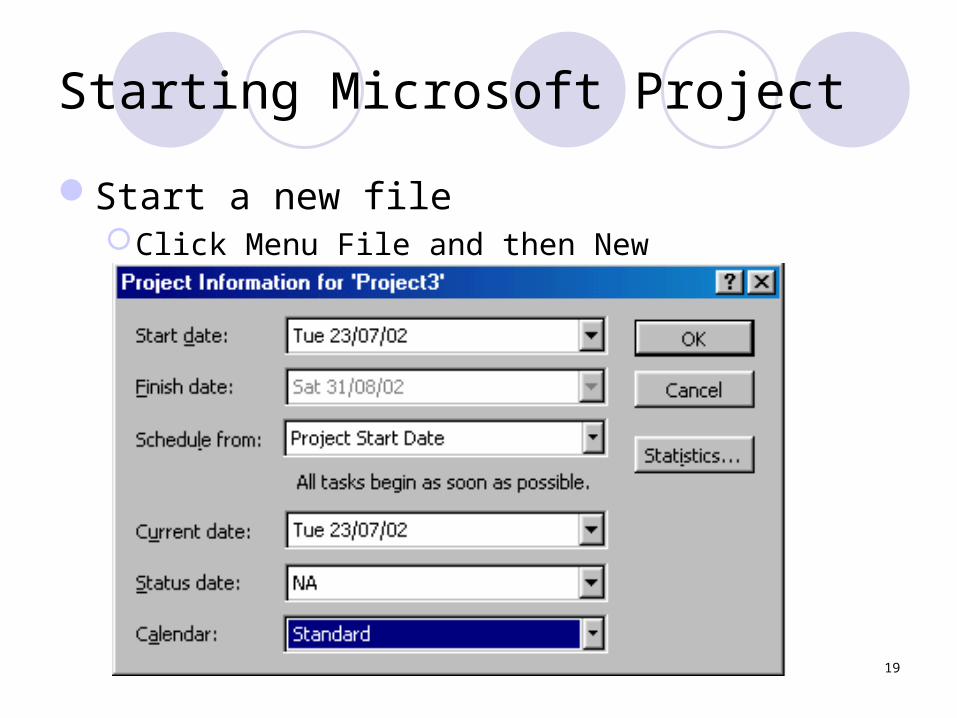
19
Starting Microsoft Project
Start a new fileClick Menu File and then New
20
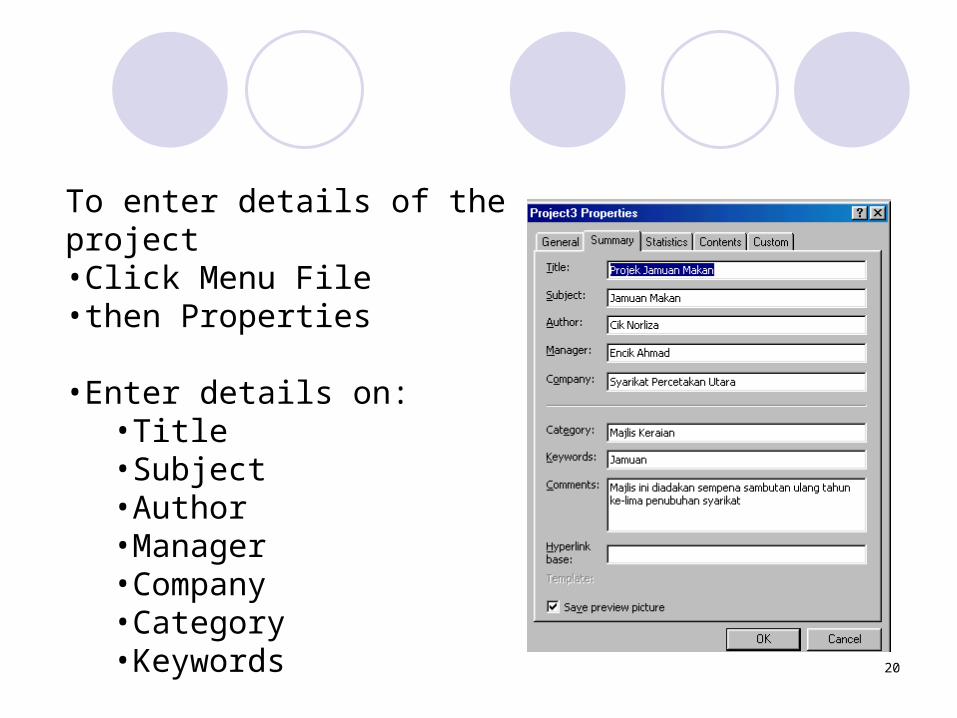
To enter details of the project•Click Menu File•then Properties
•Enter details on:•Title•Subject•Author•Manager•Company•Category•Keywords
21
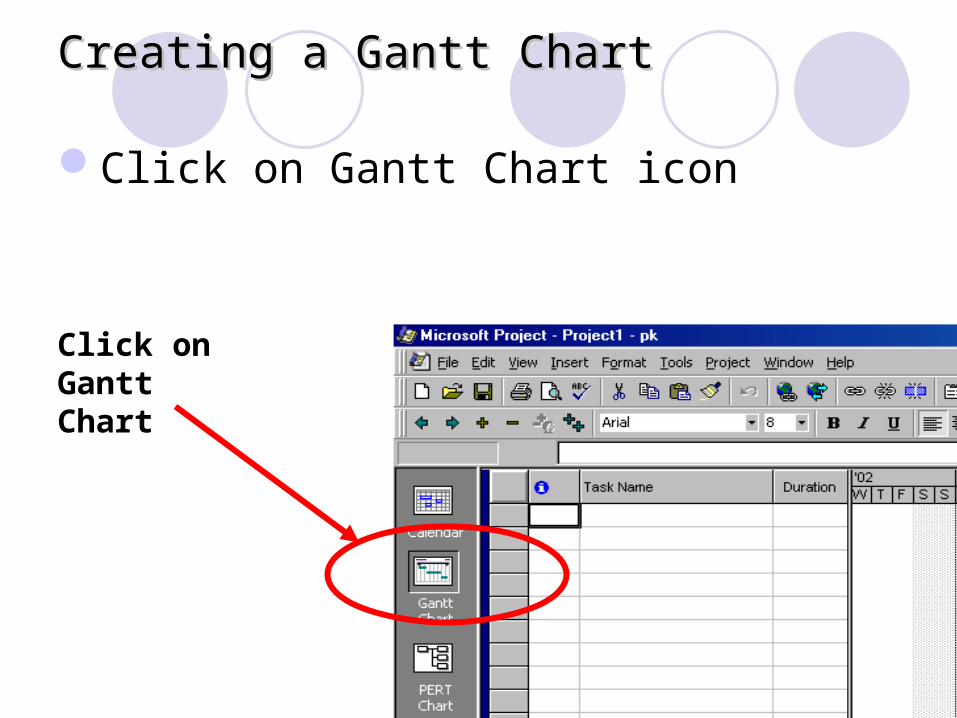
Creating a Gantt ChartCreating a Gantt Chart
Click on Gantt Chart icon
Click on Gantt Chart
22
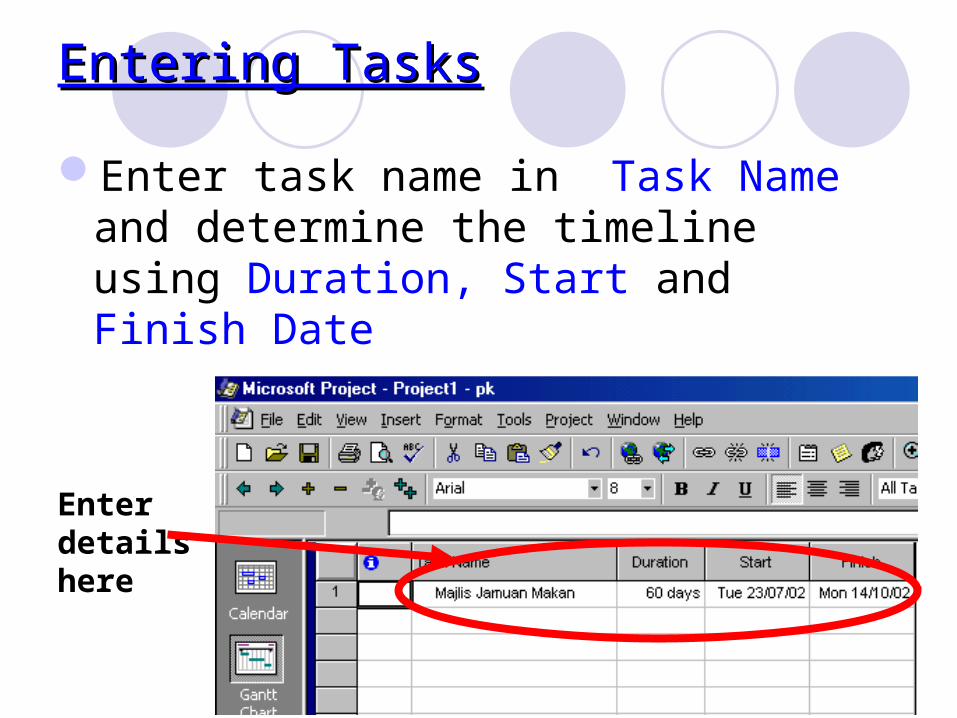
Enter task name in Task Name and determine the timeline using Duration, Start and Finish Date
Enter details here
Entering TasksEntering Tasks
23
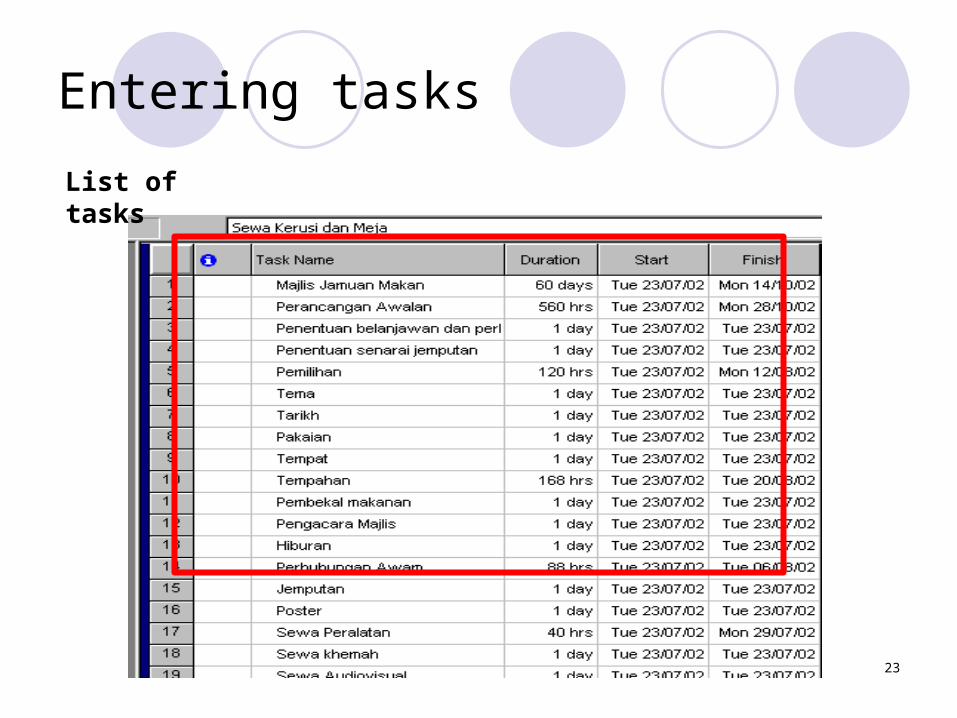
Entering tasks
List of tasks
24
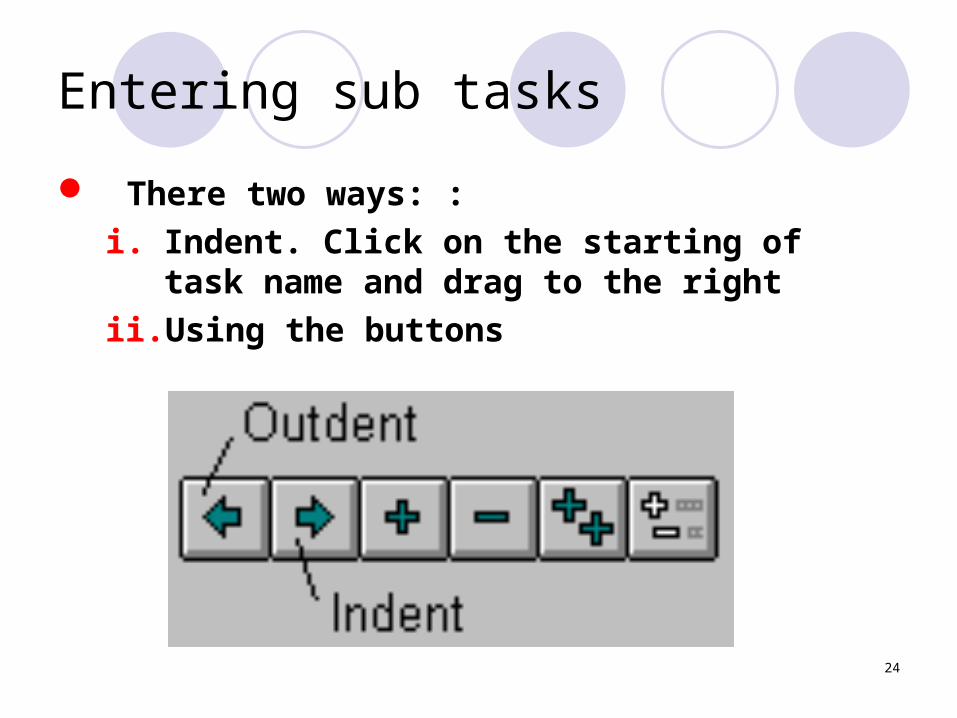
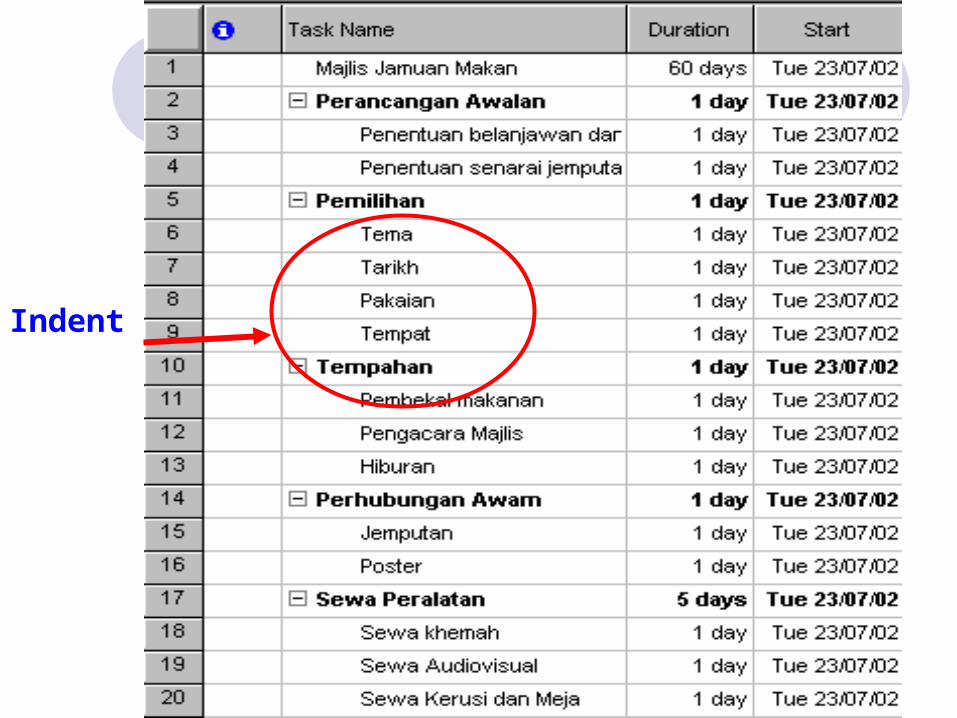
Entering sub tasks
There two ways: :
i. Indent. Click on the starting of task name and drag to the right
ii. Using the buttons
25
Indent
26
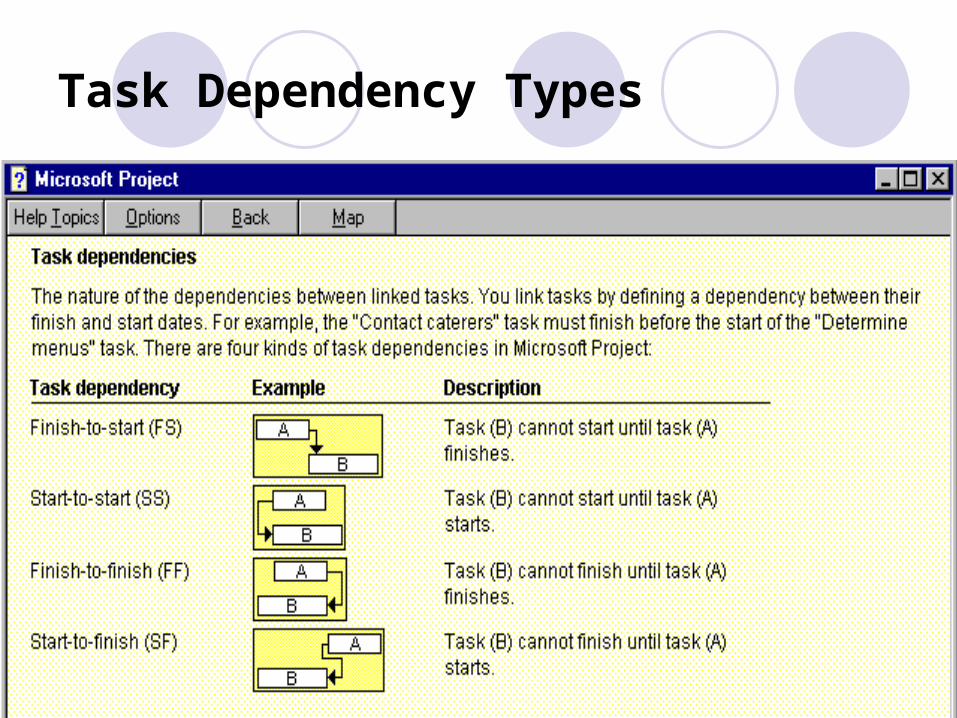
Task Dependency Types
27
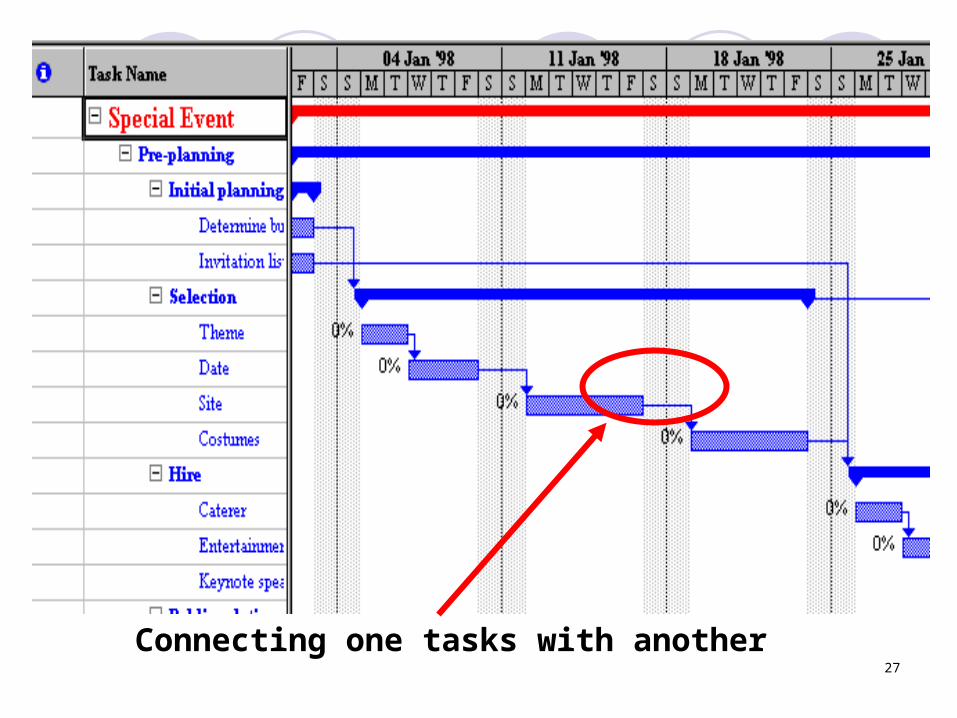
Connecting one tasks with another
28
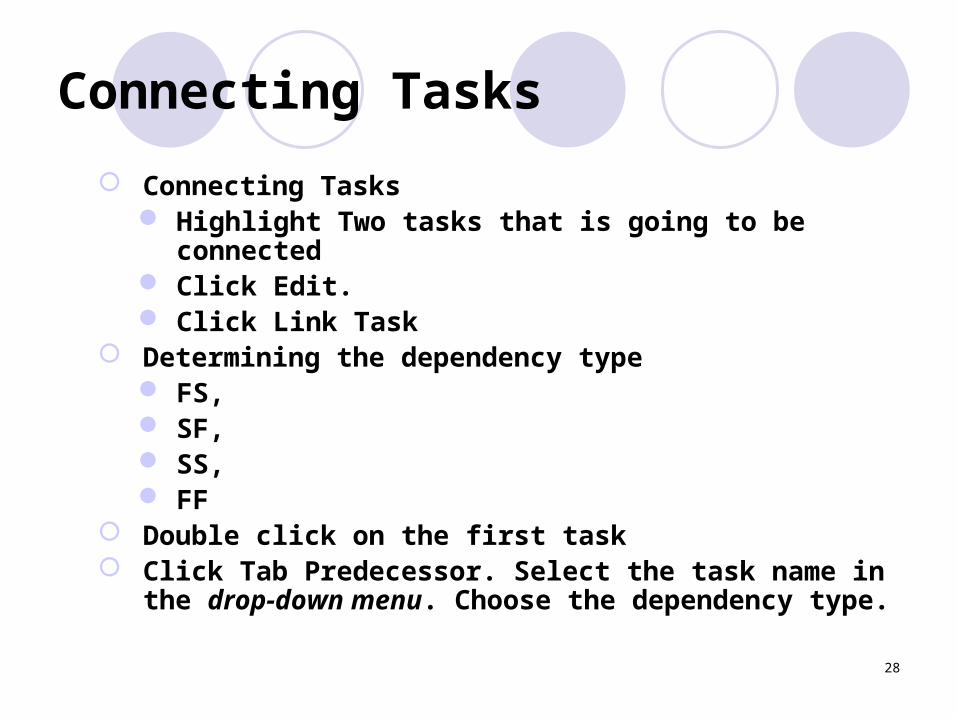
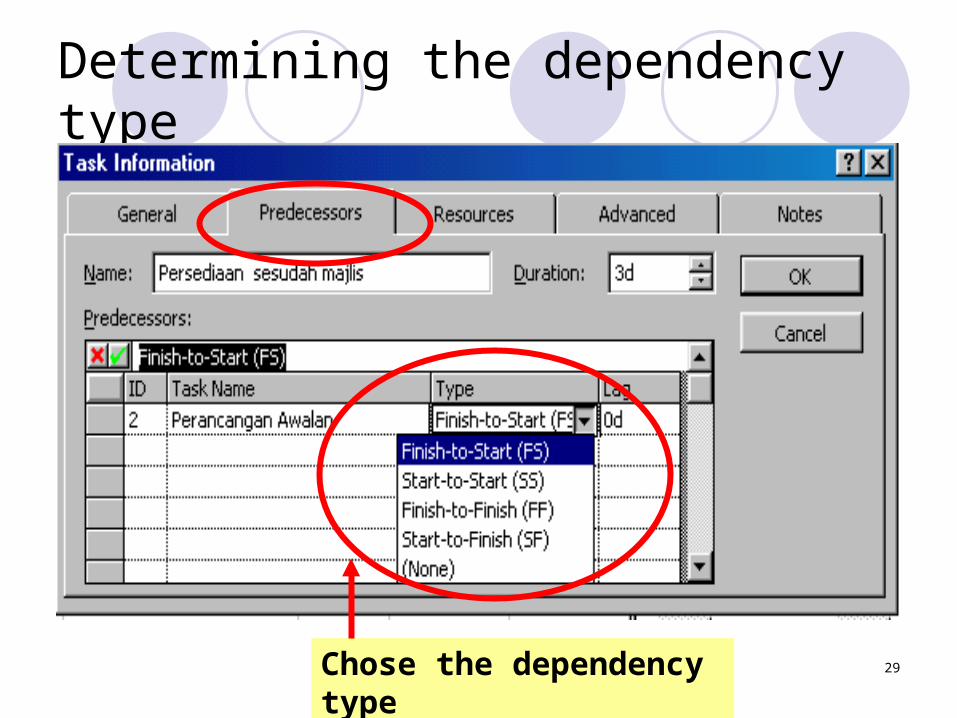
Connecting Tasks
Connecting Tasks Highlight Two tasks that is going to be connected Click Edit. Click Link Task
Determining the dependency type FS, SF, SS, FF
Double click on the first task Click Tab Predecessor. Select the task name in the drop-
down menu. Choose the dependency type.
29
Determining the dependency type
Chose the dependency type
30
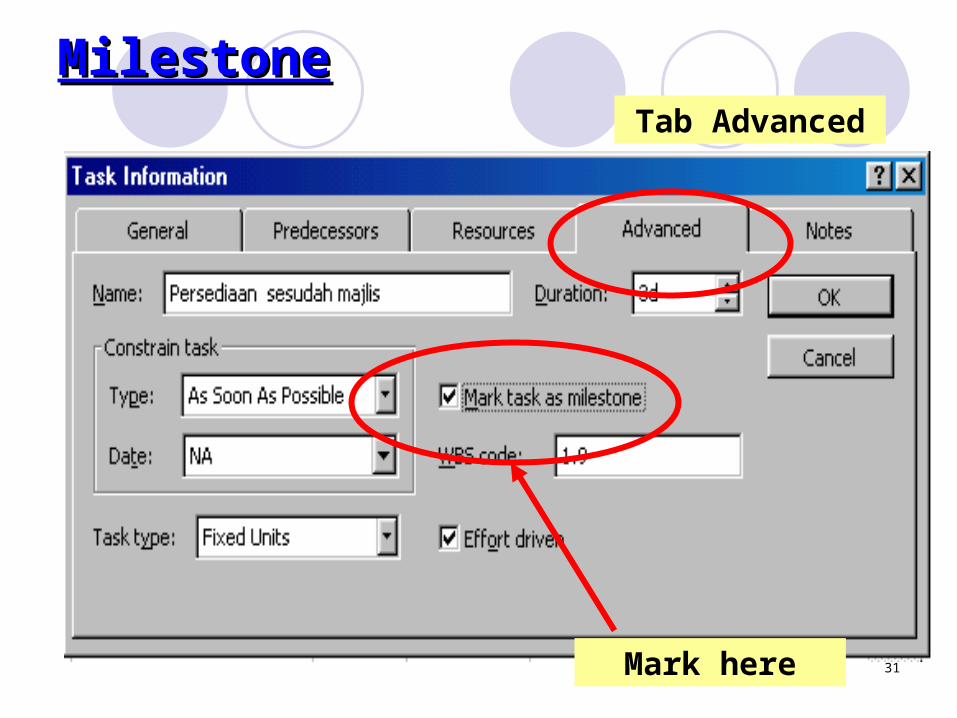
Milestone
MilestoneNormally show the eventThe time period is usually 0 or 1 day only..
Example: Start Project, End ProjectDouble click on the cell. Choose Tab Advance
and Mark Task As Milestone.
31
MilestoneMilestoneTab Advanced
Mark here
32
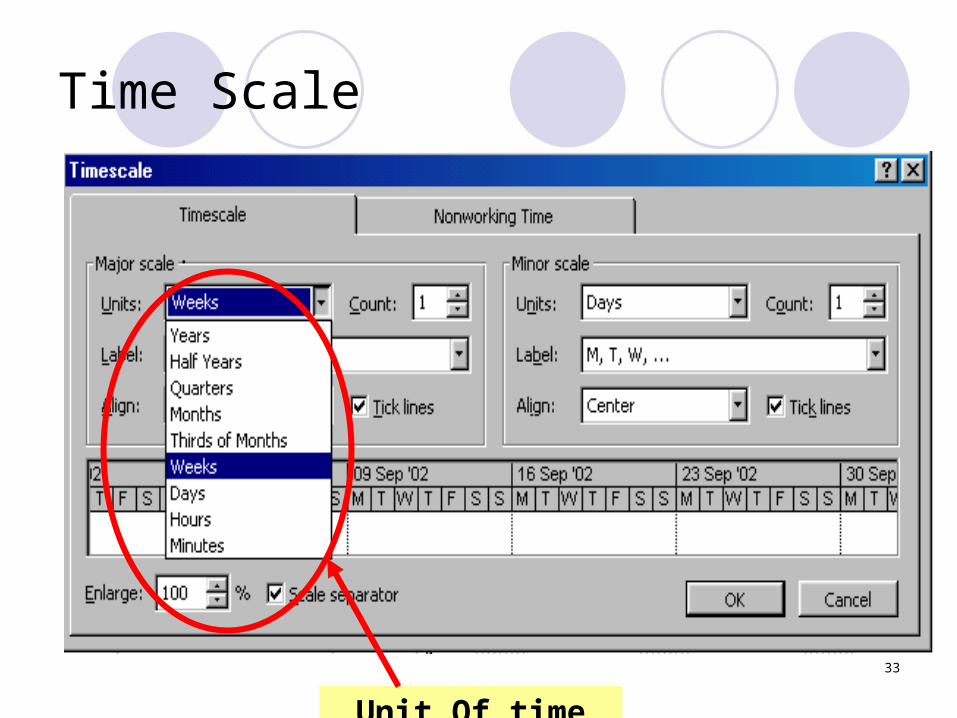
Time scale
To change the Time scale For example days, weeks, months
1. Click on Format.
2. Choose Timescale.
3. Choose the time scale unit desired
33
Time Scale
•
Unit Of time scale
34
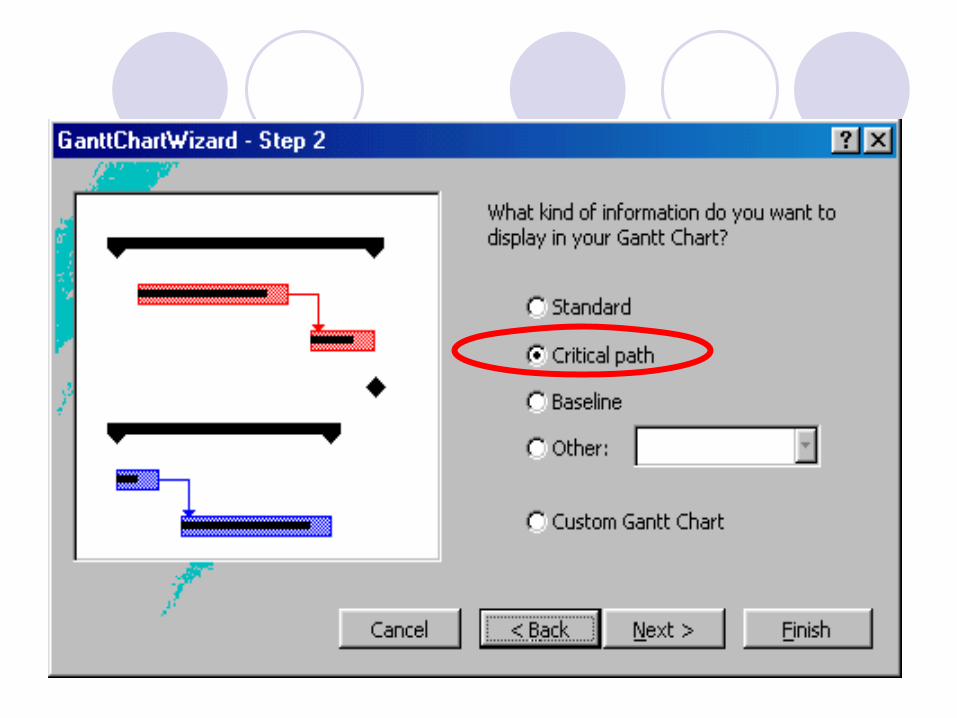
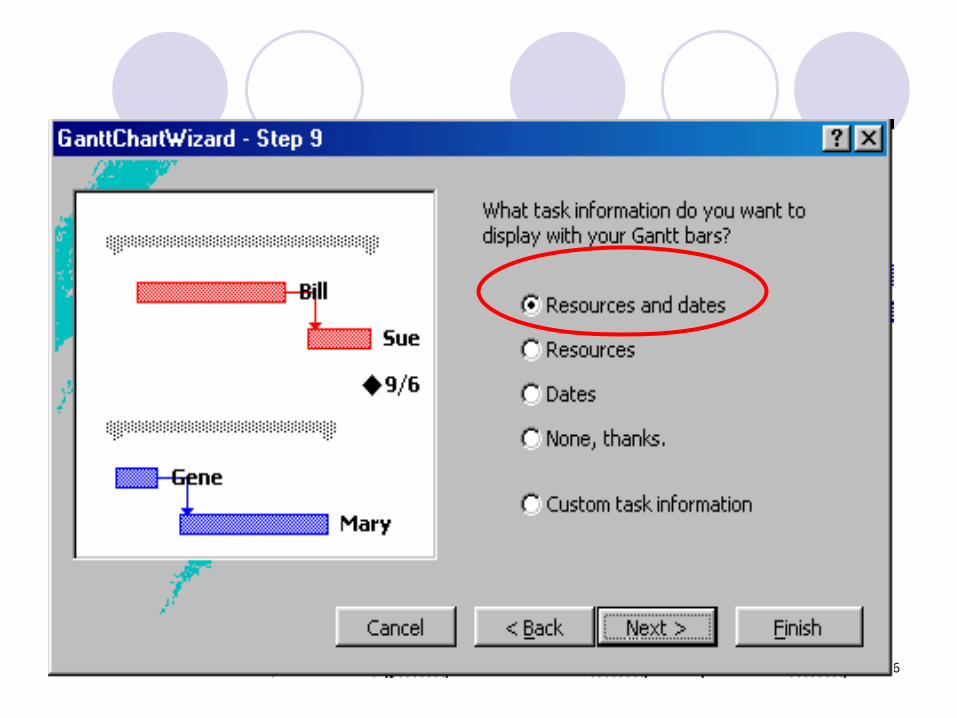
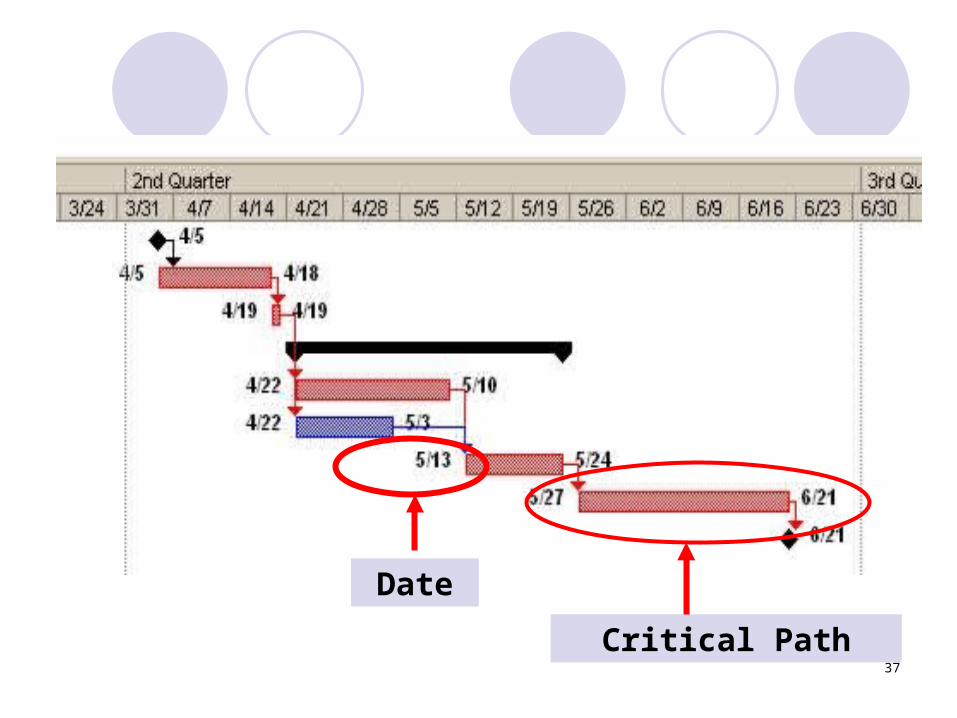
Gantt Chart View
To update the Gantt chart viewClick Format. Click on Gantt Chart Wizard to show
1.Critical Path
2.Date
3.Resources
35
36
37
•
Critical Path
Date
38
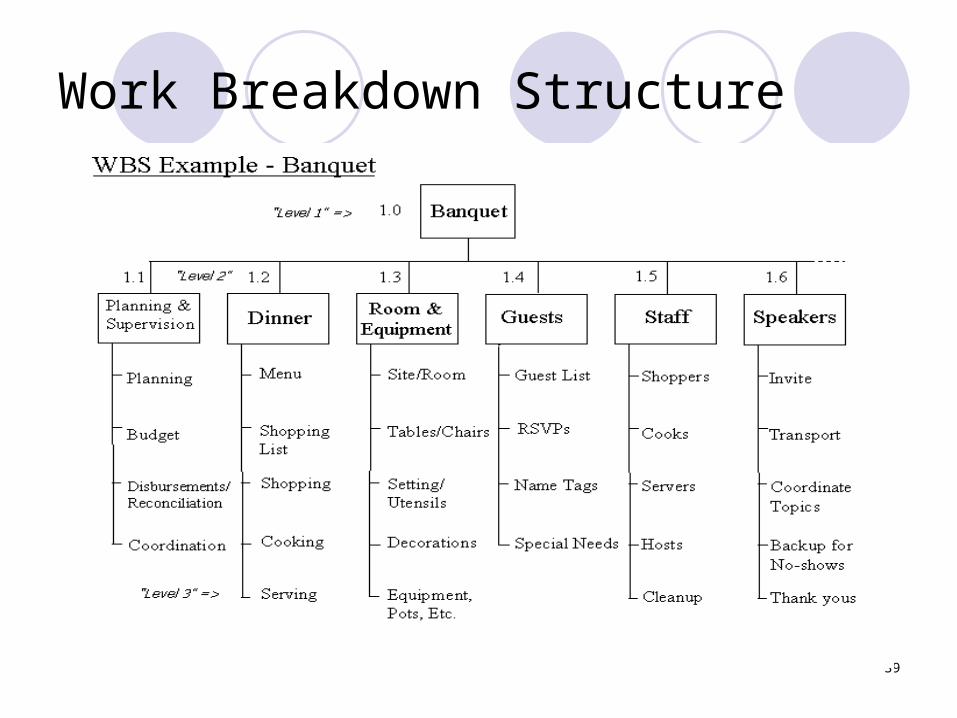
Work Breakdown Structure
a results-oriented family tree that captures all the work of a project in an organized way
portrayed graphically as a hierarchical tree, tabular list of "element" and tasks or the indented task list that appears in Gantt chart schedule
39
Work Breakdown Structure
40
PERT Chart Microsoft Project
41
Starting Pert Chart in Ms Project
Click on View. Choose PERT Chart or Click on PERT Chart icon on the left
side of Ms Project window
42
Pert Components
PERT has two main components:1. Arrows2. Node/ field Every node has information on task name, task ID,
duration, start, finish and resources Arrows shows the activities flow
Every arrows is possible to have crictical path.
2 format:AoA (ADM) = activity-on-arrow (arrow
diagramming method)AoN (PDM) = activity-on-node (precedence
diagramming method)
43
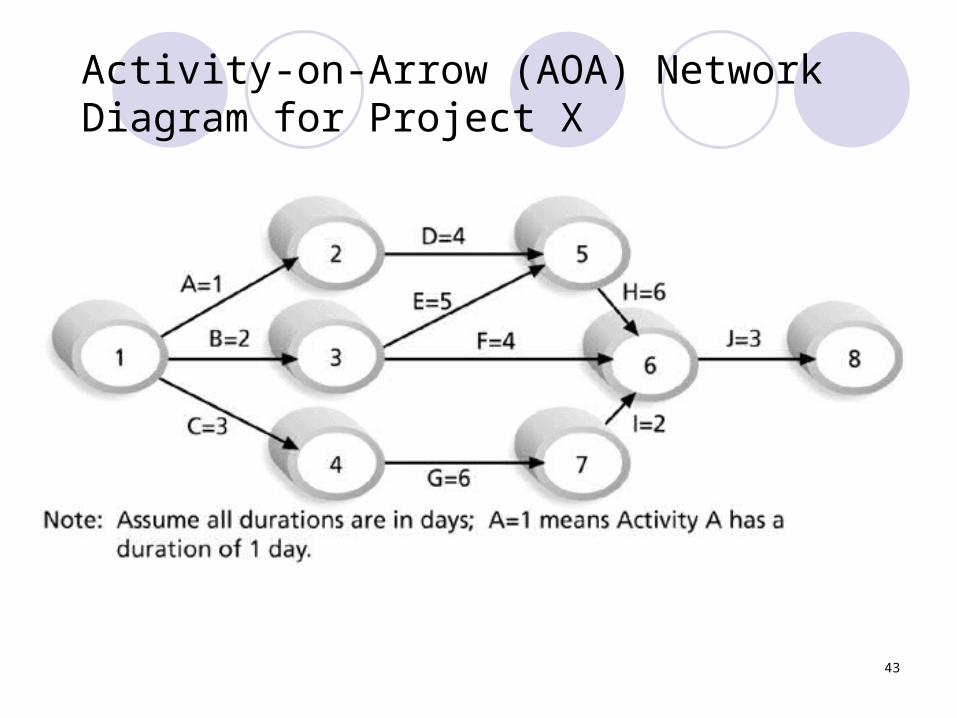
Activity-on-Arrow (AOA) Network Diagram for Project X
44
Arrow Diagramming Method (ADM)
Known as activity-on-arrow (AOA)Every activities is presented by arrowsNode shows the starting and finishing
date
45
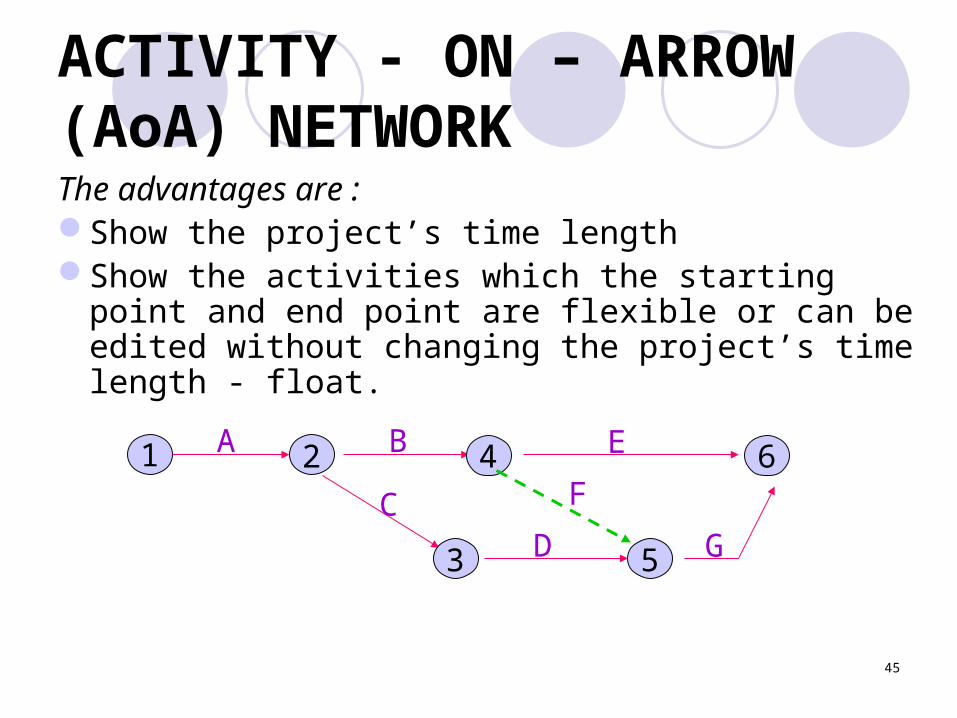
ACTIVITY - ON – ARROW (AoA) NETWORKThe advantages are :Show the project’s time length Show the activities which the starting point and
end point are flexible or can be edited without changing the project’s time length - float.
1 A B
CD
E F
G
2 4 6
3 5
46
Precedence Diagramming Method (PDM)Activities are presented by boxesArrows show the dependency between
activities More popular compared to ADM (AOA)Better in showing different types of
dependencies
47
Creating PERT Chart
Creating PERT chartDetermine the activitiesDetermine the flow of the activities Estimate the time for each activities Prepare a time-scale chart for activities to
determine the critical path
48
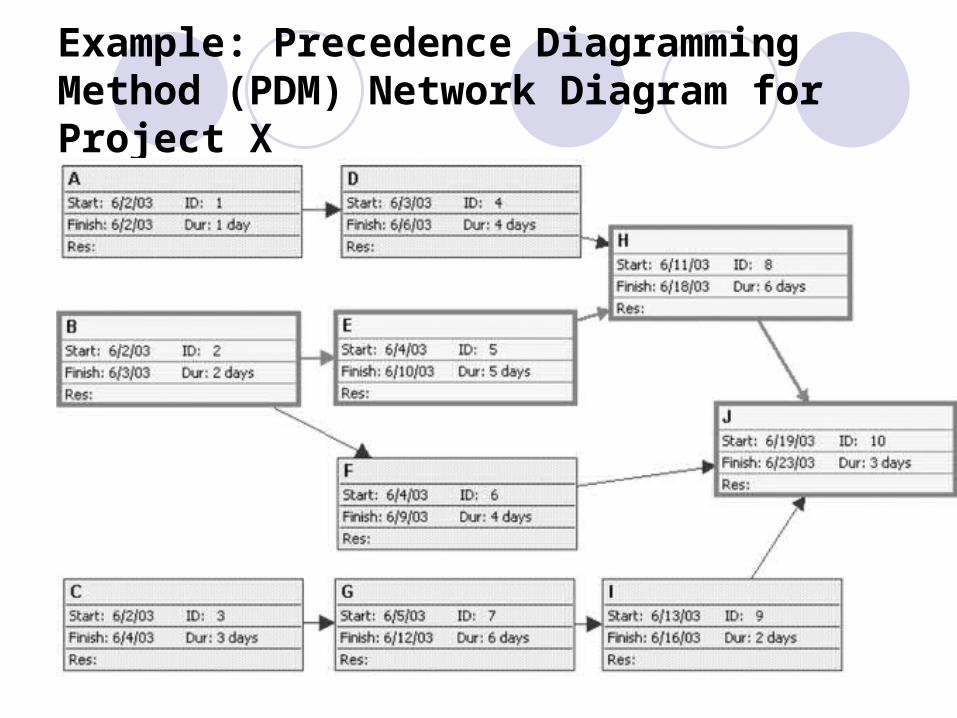
Example: Precedence Diagramming Method (PDM) Network Diagram for Project X
49
Critical Path
The flow of activities that must be completed in order to complete the whole project
The delay in critical path will delayed the whole project.
50
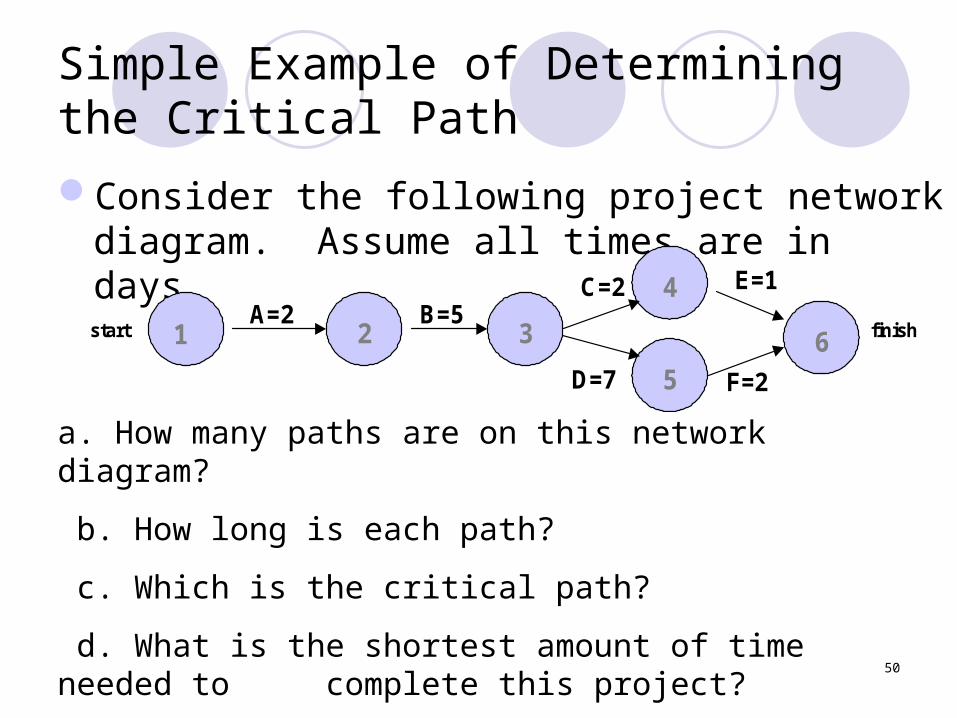
Simple Example of Determining the Critical Path
Consider the following project network diagram. Assume all times are in days.
2 3
4
5
A=2 B=5C=2
D=7
1 6
F=2
E=1
start finish
a. How many paths are on this network diagram?
b. How long is each path?
c. Which is the critical path?
d. What is the shortest amount of time needed to complete this project?
51
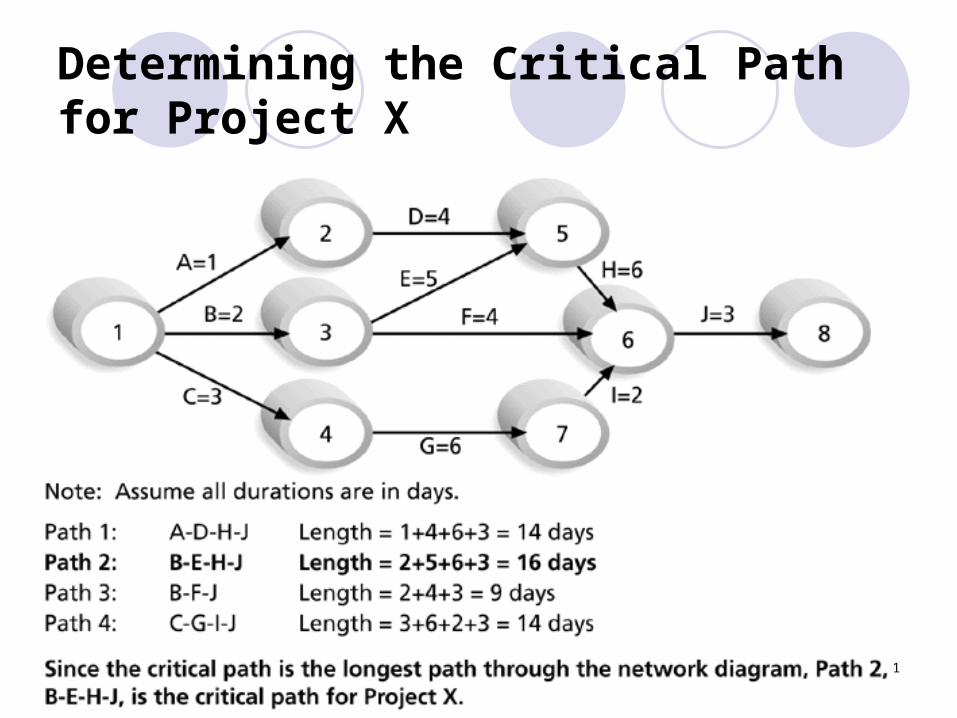
Determining the Critical Path for Project X
52
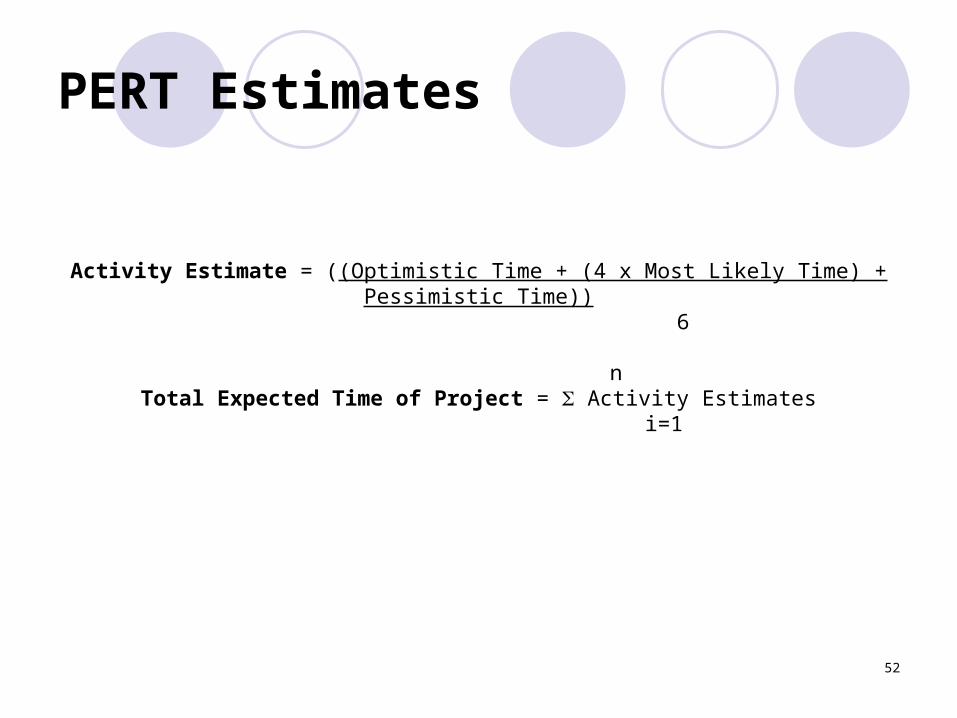
PERT Estimates
Activity Estimate = ((Optimistic Time + (4 x Most Likely Time) + Pessimistic Time)) 6
n
Total Expected Time of Project = Activity Estimates i=1
53
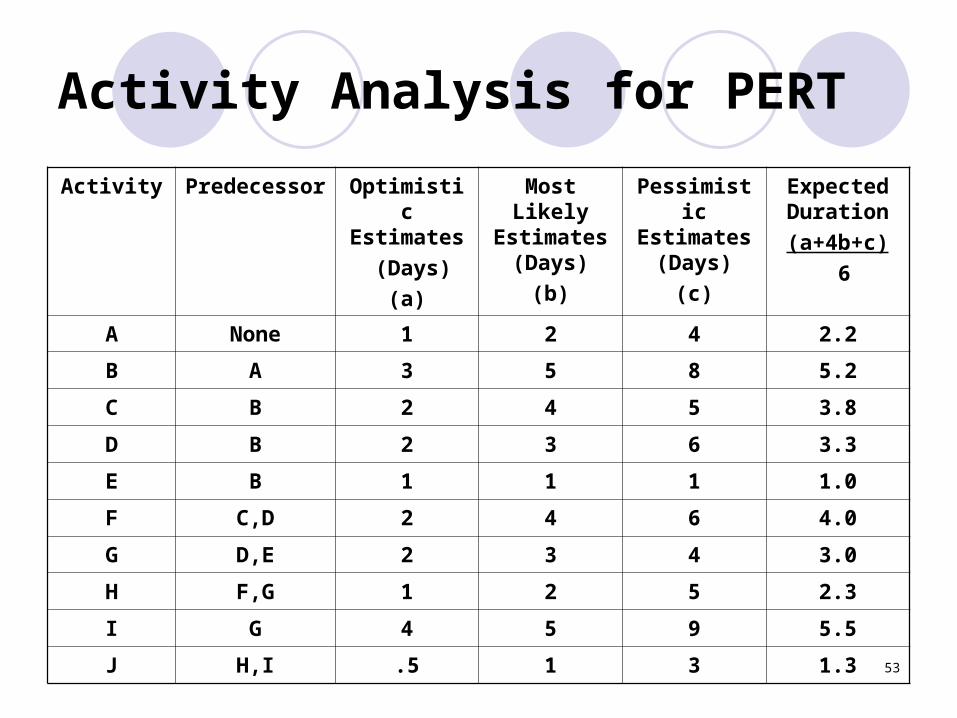
Activity Analysis for PERT
Activity Predecessor Optimistic Estimates
(Days)
(a)
Most Likely Estimates
(Days)
(b)
Pessimistic Estimates
(Days)
(c)
Expected Duration
(a+4b+c)
6
A None 1 2 4 2.2
B A 3 5 8 5.2
C B 2 4 5 3.8
D B 2 3 6 3.3
E B 1 1 1 1.0
F C,D 2 4 6 4.0
G D,E 2 3 4 3.0
H F,G 1 2 5 2.3
I G 4 5 9 5.5
J H,I .5 1 3 1.3
54
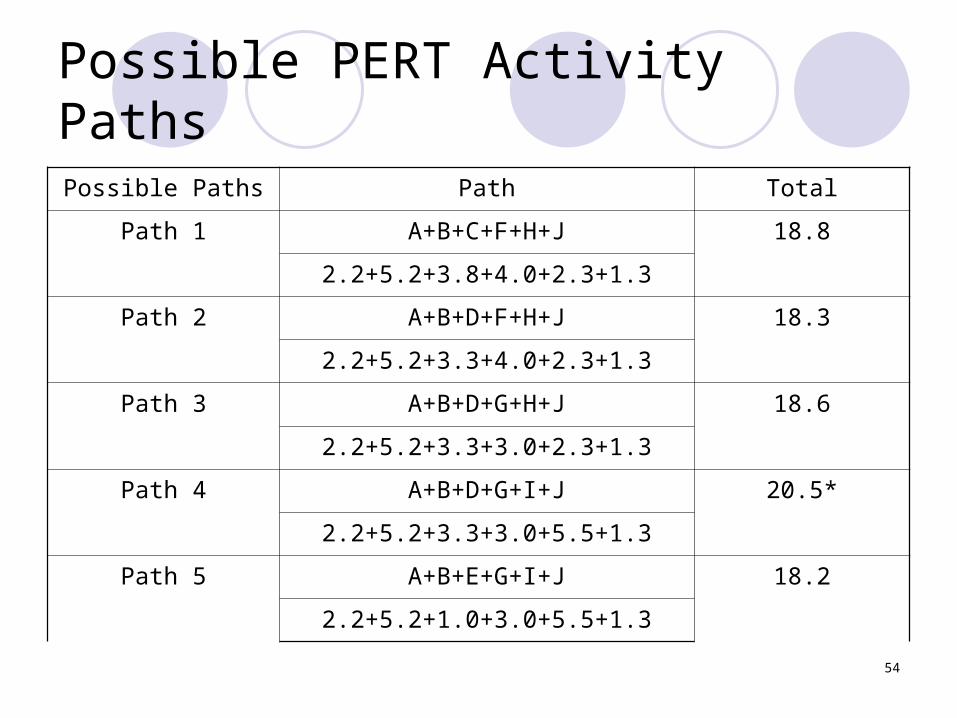
Possible PERT Activity Paths
Possible Paths Path Total
Path 1 A+B+C+F+H+J 18.8
2.2+5.2+3.8+4.0+2.3+1.3
Path 2 A+B+D+F+H+J 18.3
2.2+5.2+3.3+4.0+2.3+1.3
Path 3 A+B+D+G+H+J 18.6
2.2+5.2+3.3+3.0+2.3+1.3
Path 4 A+B+D+G+I+J 20.5*
2.2+5.2+3.3+3.0+5.5+1.3
Path 5 A+B+E+G+I+J 18.2
2.2+5.2+1.0+3.0+5.5+1.3