1 benchmark study le havre – antwerp – rotterdam july 2003
TRANSCRIPT
1
Benchmark StudyBenchmark StudyLe Havre – Antwerp – RotterdamLe Havre – Antwerp – Rotterdam
July 2003July 2003
2
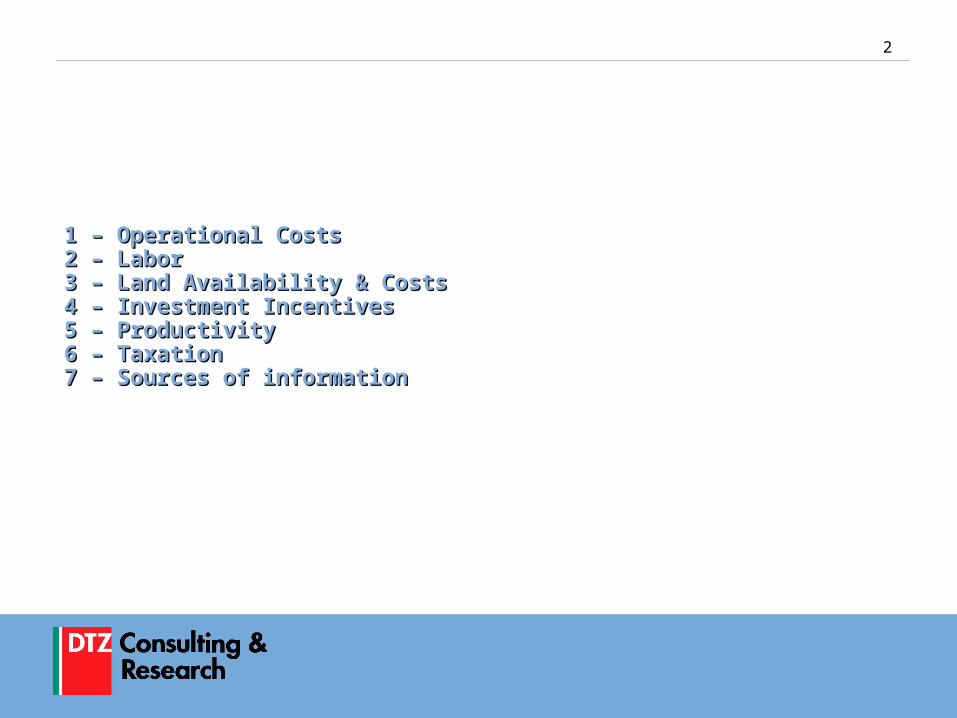
1 – Operational Costs1 – Operational Costs2 – Labor2 – Labor3 – Land Availability & Costs3 – Land Availability & Costs4 – Investment Incentives4 – Investment Incentives5 – Productivity5 – Productivity6 – Taxation6 – Taxation7 – Sources of information7 – Sources of information
3
1 – Operational Costs1 – Operational Costs
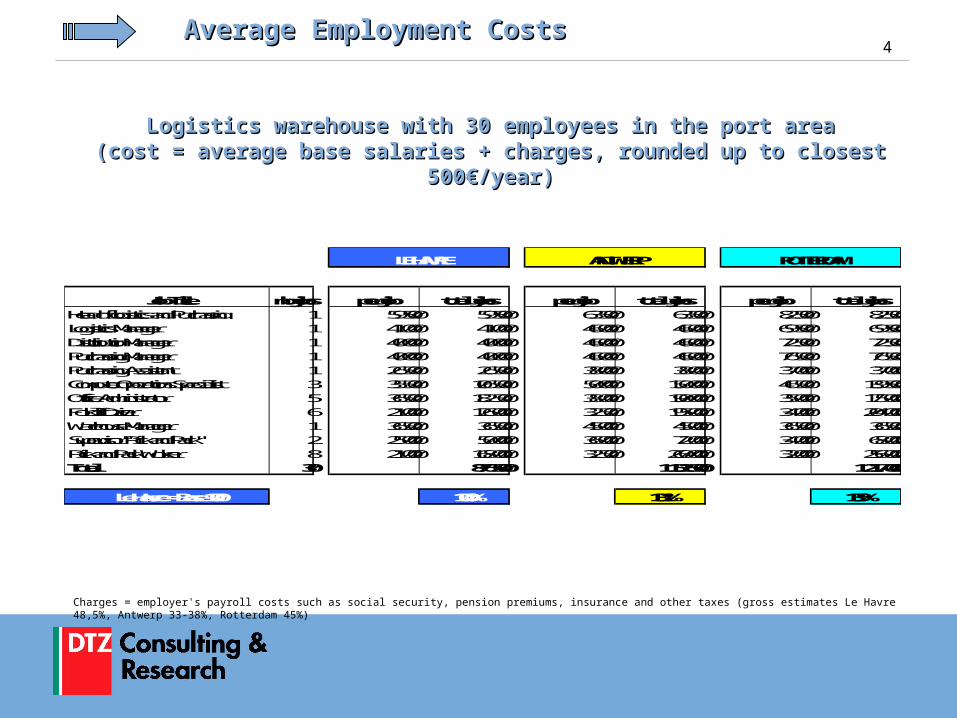
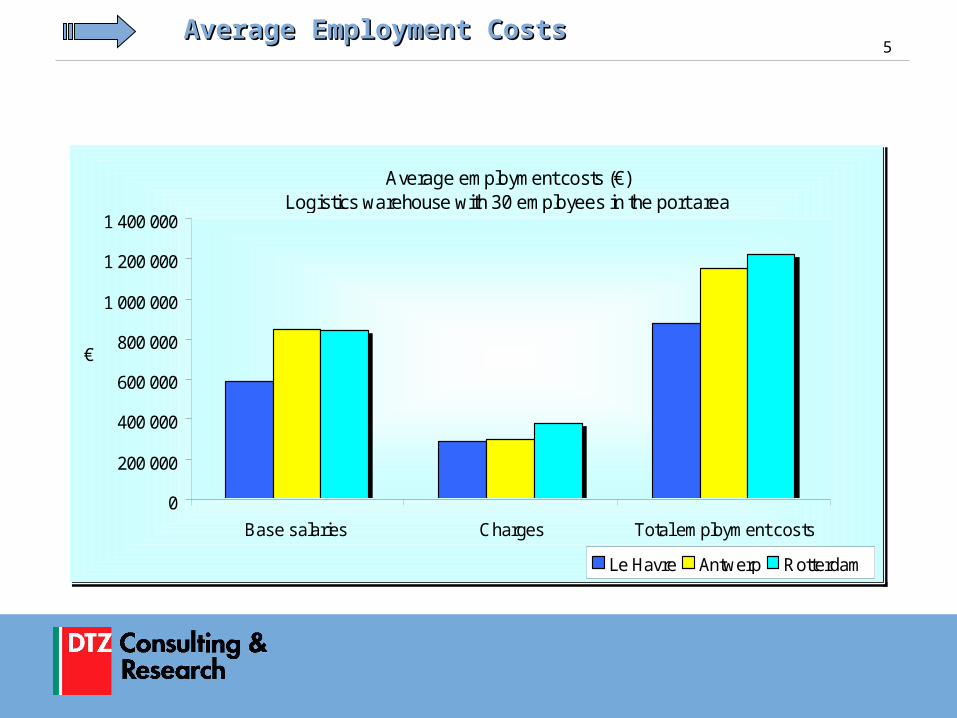
4Average Employment CostsAverage Employment Costs
Charges = employer's payroll costs such as social security, pension premiums, insurance and other taxes (gross estimates Le Havre 48,5%, Antwerp 33-38%, Rotterdam 45%)
Logistics warehouse with 30 employees in the port areaLogistics warehouse with 30 employees in the port area(cost = average base salaries + charges, rounded up to closest 500€/year)(cost = average base salaries + charges, rounded up to closest 500€/year)
Job Title nb jobs per job total jobs per job total jobs per job total jobsHead of logistics and Purchasing 1 59 500 59 500 63 500 63 500 82 500 82 500Logistics Manager 1 41 000 41 000 46 000 46 000 69 500 69 500Distribution Manager 1 40 000 40 000 46 000 46 000 72 500 72 500Purchasing Manager 1 40 000 40 000 46 000 46 000 76 500 76 500Purchasing Assistant 1 26 500 26 500 38 000 38 000 37 000 37 000Computer Operations Specialist 3 35 500 106 500 50 000 150 000 46 500 139 500Office Administrator 5 36 500 182 500 38 000 190 000 35 000 175 000Forklift Driver 6 21 000 126 000 32 500 195 000 34 000 204 000Warehouse Manager 1 36 500 36 500 45 000 45 000 36 500 36 500Supervisor "Pick and Pack" 2 25 000 50 000 36 000 72 000 34 000 68 000Pick and Pack Worker 8 21 000 168 000 32 500 260 000 32 000 256 000Total 30 876 500 1 151 500 1 217 000
Le Havre = Base 100 100% 131% 139%
LE HAVRE ANTWERP ROTTERDAM
5Average Employment CostsAverage Employment Costs
Average employment costs (€)Logistics warehouse with 30 employees in the port area
0
200 000
400 000
600 000
800 000
1 000 000
1 200 000
1 400 000
Base salaries Charges Total employment costs
€
Le Havre Antwerp Rotterdam

6 Average Employment CostsAverage Employment Costs
Le Havre =Le Havre =
Base 100Base 100
Average employment costs Logistics warehouse with 30 employees in the port area
0
20
40
60
80
100
120
140
Le Havre Antwerp Rotterdam
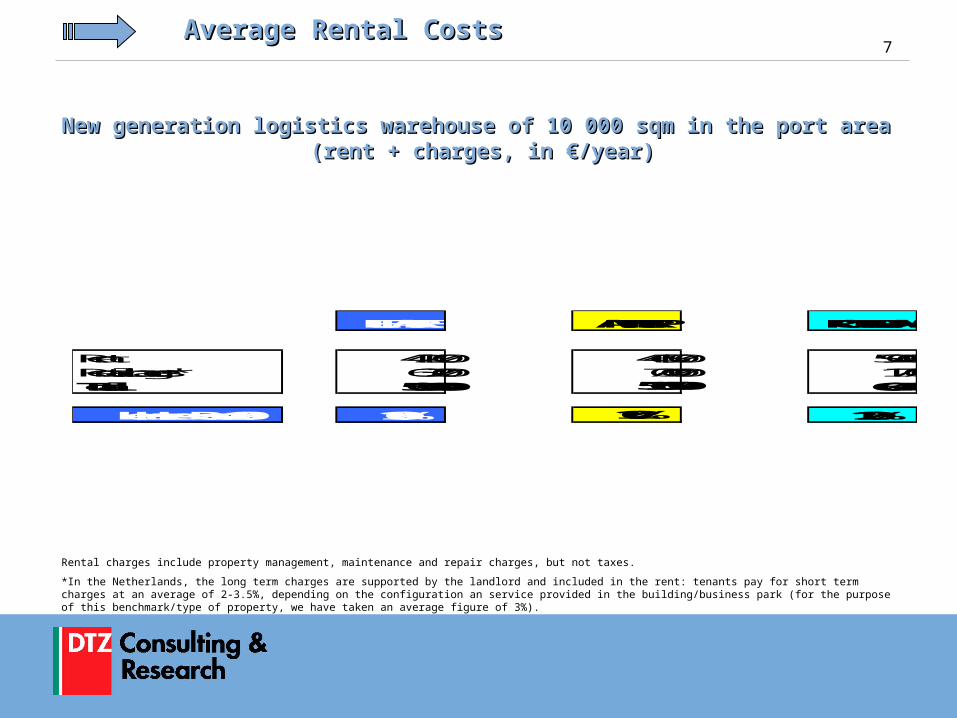
7Average Rental CostsAverage Rental Costs
Rental charges include property management, maintenance and repair charges, but not taxes.
*In the Netherlands, the long term charges are supported by the landlord and included in the rent: tenants pay for short term charges at an average of 2-3.5%, depending on the configuration an service provided in the building/business park (for the purpose of this benchmark/type of property, we have taken an average figure of 3%).
New generation logistics warehouse of 10 000 sqm in the port area New generation logistics warehouse of 10 000 sqm in the port area (rent + charges, in €/year)(rent + charges, in €/year)
LE HAVRE ANTWERP ROTTERDAM
Rent 442 100 446 500 590 000Rental charges* 63 200 70 000 17 700Total 505 300 516 500 607 700
Le Havre = Base 100 100% 102% 120%
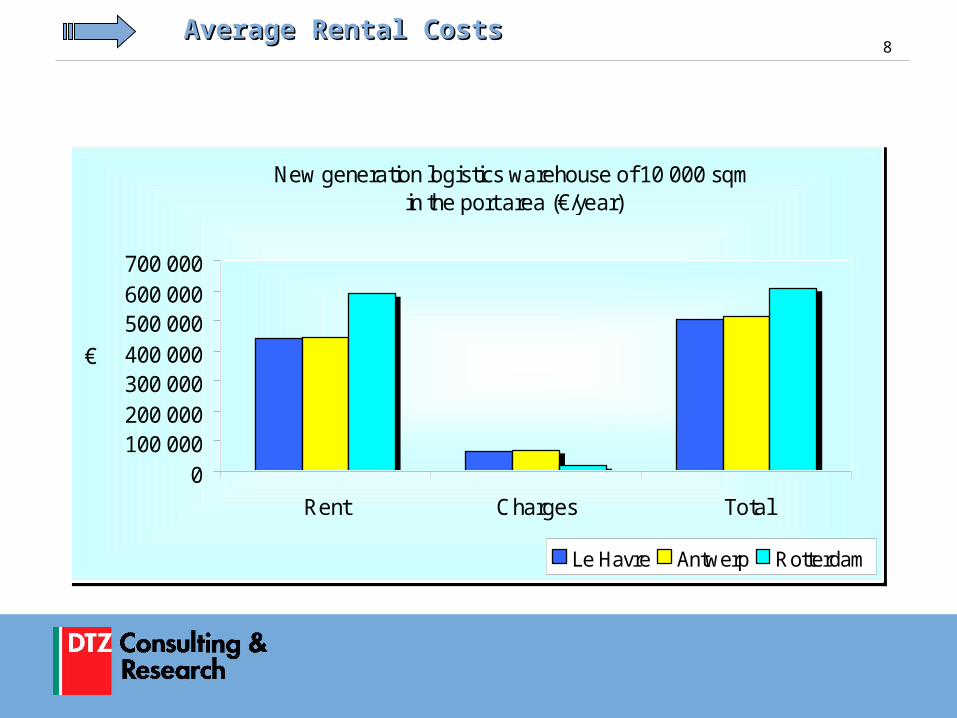
8Average Rental CostsAverage Rental Costs
New generation logistics warehouse of 10 000 sqmin the port area (€/year)
0100 000200 000300 000400 000500 000600 000700 000
Rent Charges Total
€
Le Havre Antwerp Rotterdam
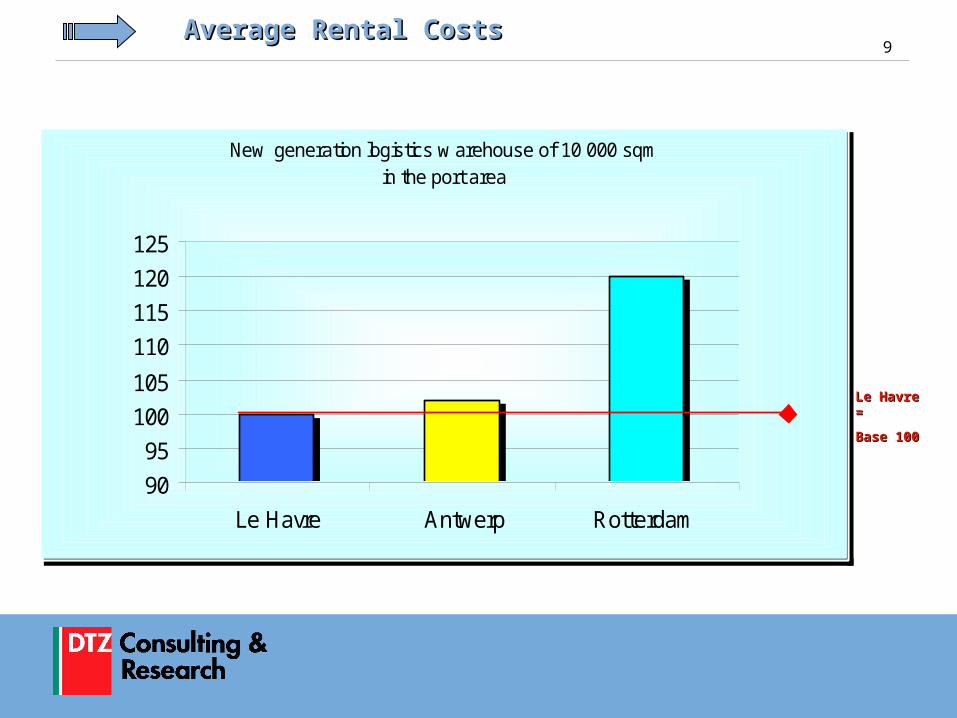
9Average Rental CostsAverage Rental Costs
Le Havre =Le Havre =
Base 100Base 100
New generation logistics w arehouse of 10 000 sqm in the port area
90
95
100
105
110
115
120
125
Le Havre Antwerp Rotterdam

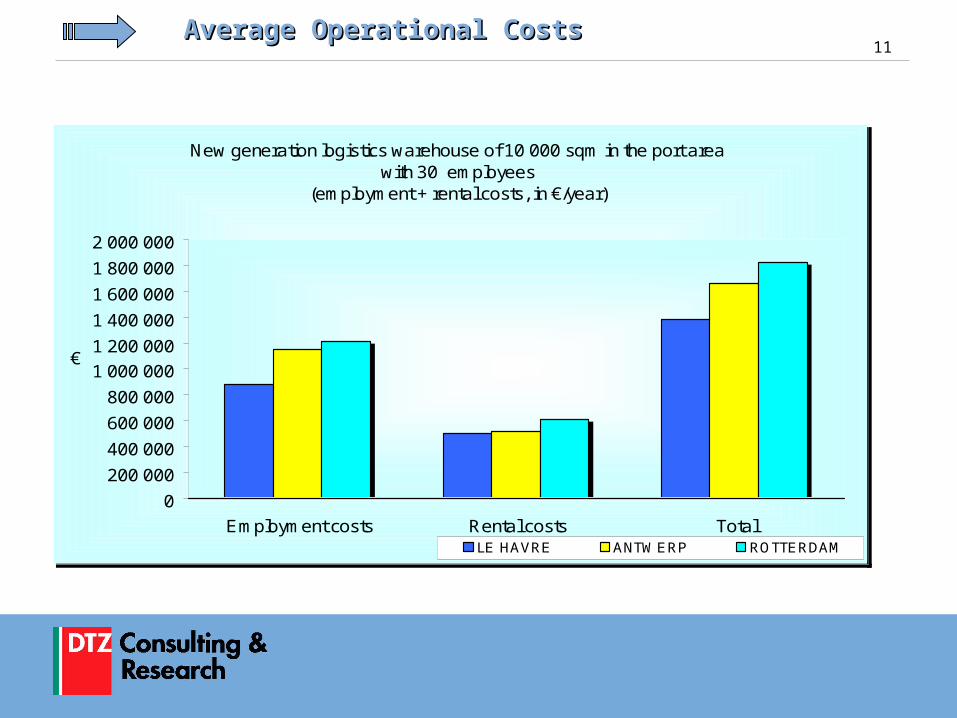
10Average Operational CostsAverage Operational Costs
New generation logistics warehouse of 10 000 sqm in the port area with 30 employees New generation logistics warehouse of 10 000 sqm in the port area with 30 employees (employment + real estate costs, in €/year)(employment + real estate costs, in €/year)
Job Title nb jobsper jobtotal jobsper jobtotal jobsper jobtotal jobsHead of logistics and Purchasing 1 #### 59 500 ## 63 500 # 82 500Logistics Manager 1 #### 41 000 ## 46 000 # 69 500Distribution Manager 1 #### 40 000 ## 46 000 # 72 500Purchasing Manager 1 #### 40 000 ## 46 000 # 76 500Purchasing Assistant 1 #### 26 500 ## 38 000 # 37 000Computer Operations Specialist 3 #### 106 500 ## 150 000 # 139 500Office Administrator 5 #### 182 500 ## 190 000 # 175 000Forklift Driver 6 #### 126 000 ## 195 000 # 204 000Warehouse Manager 1 #### 36 500 ## 45 000 # 36 500Supervisor "Pick and Pack" 2 #### 50 000 ## 72 000 # 68 000Pick and Pack Worker 8 #### 168 000 ## 260 000 # 256 000Total 30 876 500 1 151 500 1 217 000
France = Base 100 100% 131% 139%
LE HAVRE ANTWERP ROTTERDAM
Rent 442 100 446 500 590 000Rental charges (*) 63 200 70 000 17 700Total 505 300 516 500 607 700
Le Havre = Base 100 100% 102% 120%
LE HAVRE ANTWERP ROTTERDAM
Employment costs 876 500 1 151 500 1 217 000Rental costs 505 300 516 500 607 700Total 1 381 800 1 668 000 1 824 700
Le Havre = Base 100 100% 121% 132%
LE HAVRE ANTWERP ROTTERDAM
11Average Operational CostsAverage Operational Costs
New generation logistics warehouse of 10 000 sqm in the port area with 30 employees
(employment + rental costs, in €/year)
0
200 000
400 000
600 000
800 000
1 000 000
1 200 000
1 400 000
1 600 000
1 800 000
2 000 000
Employment costs Rental costs Total
€
LE HAVRE ANTWERP ROTTERDAM

12Average Operational CostsAverage Operational Costs
Le Havre =Le Havre =
Base 100Base 100
New generation logistics warehouse of 10 000 sqm in the port area with 30 employees
(employment + rental costs)
0
20
40
60
80
100
120
140
Le Havre Antwerp Rotterdam

13
2 – Labor2 – Labor
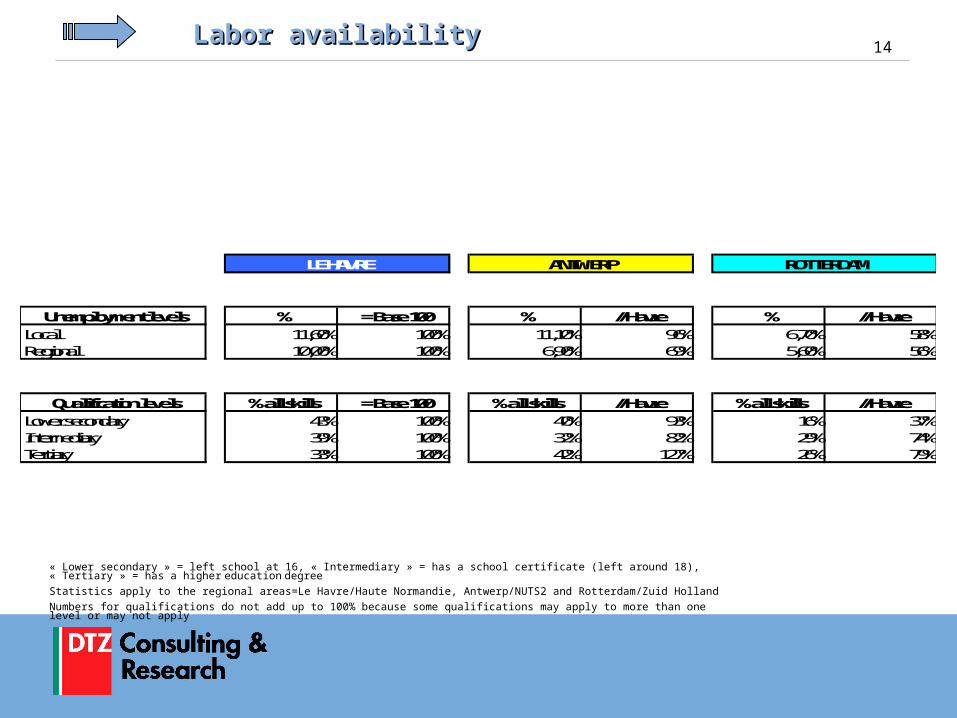
14Labor availabilityLabor availability
« Lower secondary » = left school at 16, « Intermediary » = has a school certificate (left around 18), « Tertiary » = has a higher education degree
Statistics apply to the regional areas=Le Havre/Haute Normandie, Antwerp/NUTS2 and Rotterdam/Zuid Holland
Numbers for qualifications do not add up to 100% because some qualifications may apply to more than one level or may not apply
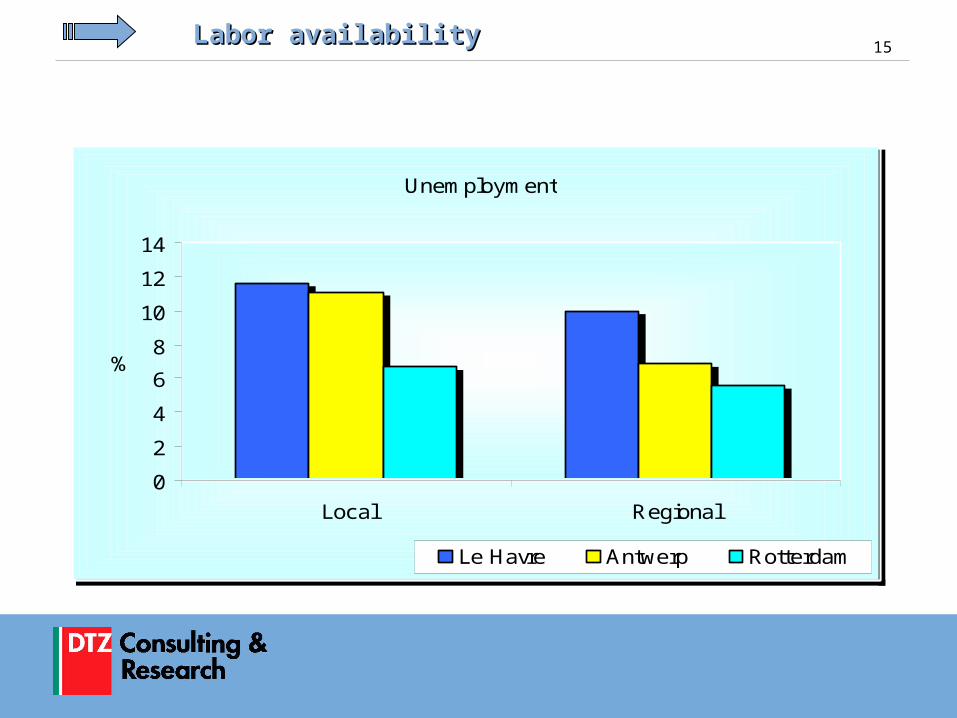
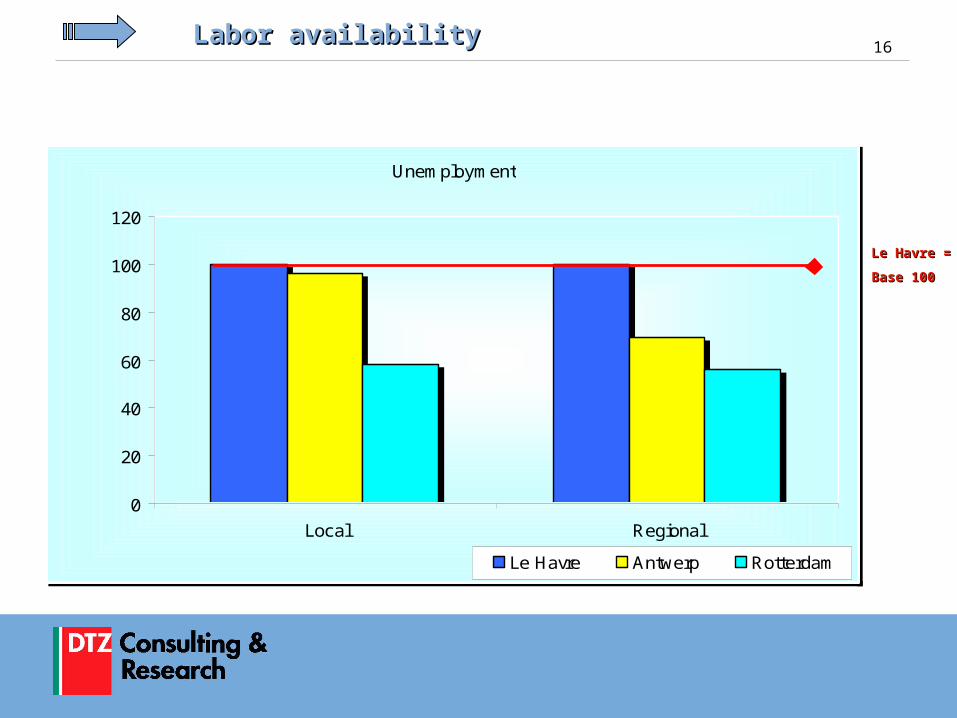
Unemployment levels % = Base 100 % // Havre % // HavreLocal 11,60% 100% 11,10% 96% 6,70% 58%Regional 10,00% 100% 6,90% 69% 5,60% 56%
Qualification levels % all skills = Base 100 % all skills // Havre % all skills // HavreLower secondary 43% 100% 40% 93% 16% 37%Intermediary 39% 100% 32% 82% 29% 74%Tertiary 33% 100% 42% 127% 26% 79%
Sources:INSEE, Antwerp Regional Grovernment (GOM), Rotterdam Port AuthorityUNESCO's "International Standard Classification of Education"
Notes:- "Lower secondary" = left school at 16, "Intermediary" = has a school certificate (left around 18), "Tertiary" = has a higher education degree- Statistics apply to the regional areas = Le Havre/Haute-Normandie, Antwerp/NUTS2 and Rotterdam/Zuid Holland- Numbers do not add up to 100% because some qualification may apply to more than one level
LE HAVRE ANTWERP ROTTERDAM
LABOR AVAILABILITY
15Labor availabilityLabor availability
Unemployment
0
2
4
6
8
10
12
14
Local Regional
Le Havre Antwerp Rotterdam
16Labor availabilityLabor availability
Le Havre =Le Havre =
Base 100Base 100
Unemployment
0
20
40
60
80
100
120
Local Regional
Le Havre Antwerp Rotterdam

17Labor availabilityLabor availability
Qualifications
0
5
10
15
20
25
30
35
40
45
50
Lower secondary Intermediary Tertiary
%
Le Havre Antwerp Rotterdam
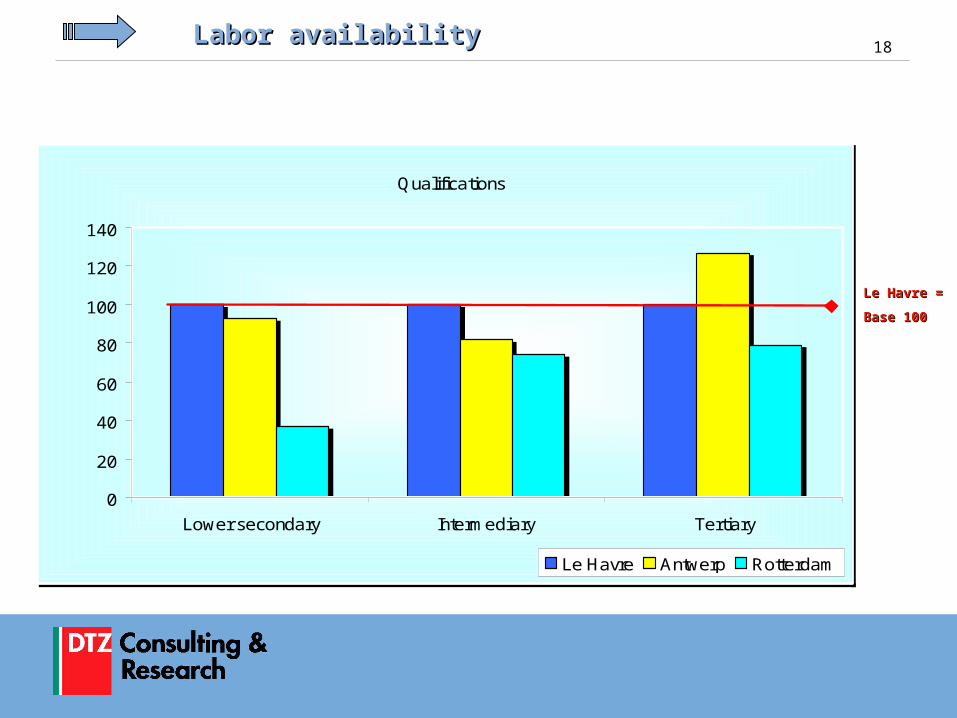
18Labor availabilityLabor availability
Le Havre =Le Havre =
Base 100Base 100
Qualifications
0
20
40
60
80
100
120
140
Lower secondary Intermediary Tertiary
Le Havre Antwerp Rotterdam

19
3 – Land Availability & Costs3 – Land Availability & Costs
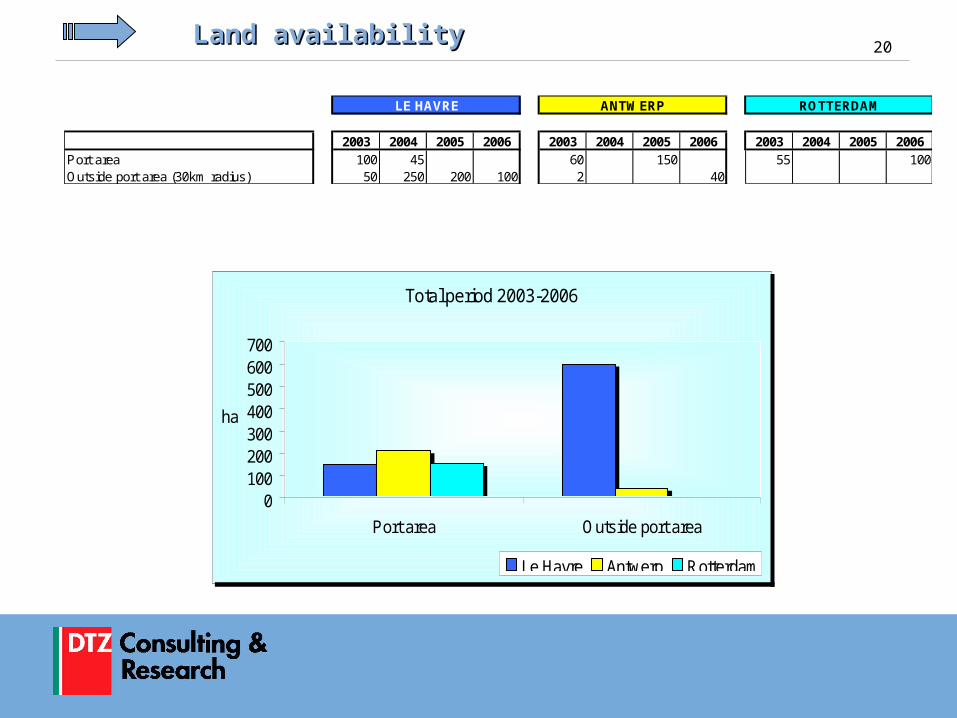
20Land availabilityLand availability
2003 2004 2005 2006 2003 2004 2005 2006 2003 2004 2005 2006Port area 100 45 60 150 55 100Outside port area (30km radius) 50 250 200 100 2 40
LE HAVRE ANTWERP ROTTERDAM
Total period 2003-2006
0100200300400500600700
Port area Outside port area
ha
Le Havre Antwerp Rotterdam
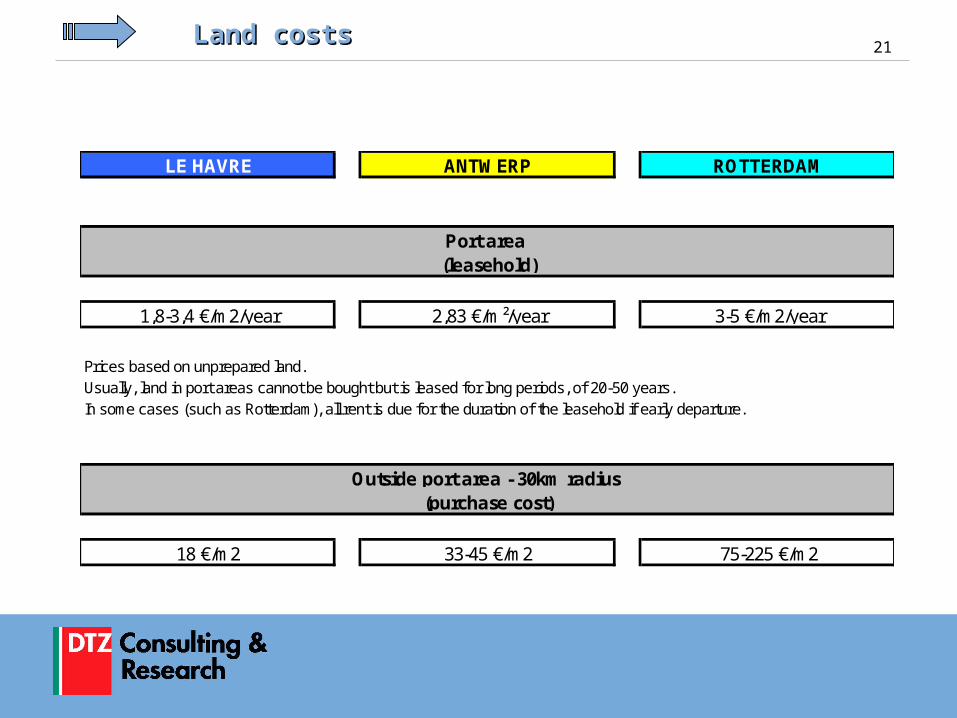
21Land costsLand costs
Prices based on unprepared land.Usually, land in port areas cannot be bought but is leased for long periods, of 20-50 years.In some cases (such as Rotterdam), all rent is due for the duration of the leasehold if early departure.
LE HAVRE ANTWERP ROTTERDAM
Port area (leasehold)
Outside port area - 30km radius
75-225 €/m2
2,83 €/m²/year 3-5 €/m2/year
33-45 €/m2
1,8-3,4 €/m2/year
18 €/m2
(purchase cost)
22
4 – Investment Incentives4 – Investment Incentives
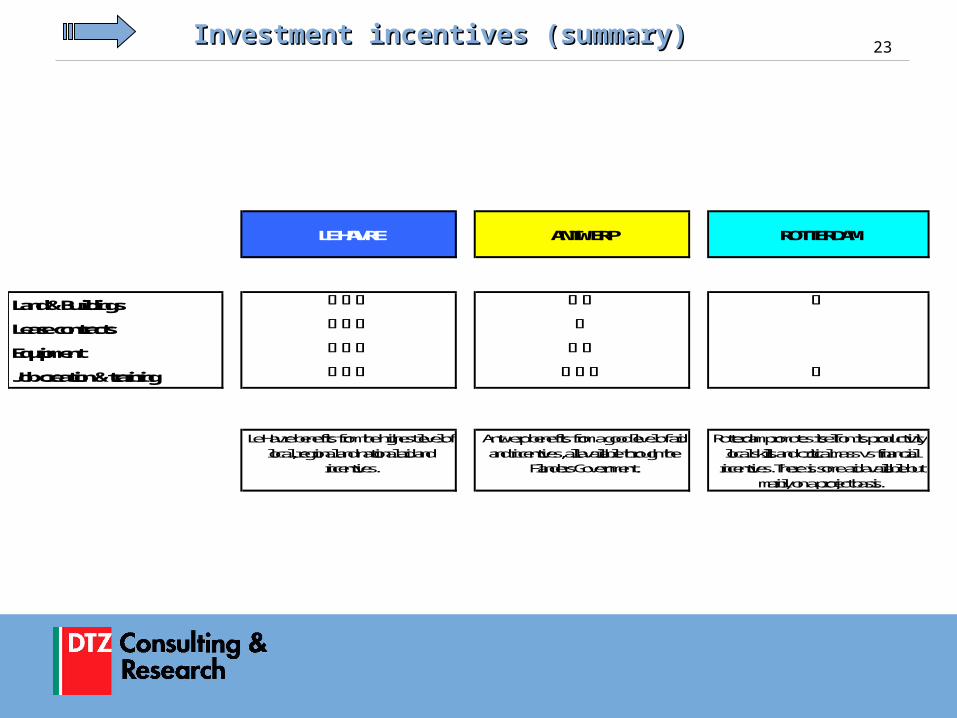
23Investment incentives (summary)Investment incentives (summary)
LE HAVRE ANTWERP ROTTERDAM
Land & Buildings
Lease contracts
Equipment
Job creation & training
Le Havre benefits from the highest level of local, regional and national aid and
incentives.
Antwerp benefits from a good level of aid and incentives, all available through the
Flanders Government.
Rotterdam promotes itself on its productivity, local skills and critical mass vs financial
incentives. There is some aid available but mainly on a project basis.
INVESTMENT INCENTIVES (Summary)
Logistics activities

24Investment incentives (detail)Investment incentives (detail)
LC = Large CompaniesSME = Small & medium size Enterprises of 250 employees and 40M€ turnover maximum
Land & Buildings Lease Contracts Equipment Job Creation & Training
Le Havre
Grants for industrial buildings are available
from local authorities through property leasing transactions.
Leasing costs can be reduced by 23%.
Local authorities can finance up to 100 000 € over 3 years (SME only).
National/regional help available through DRIRE, SME only: up to 33% of costs.
Job creation: cash grants are available, up to 5 000 € per job created. Conditions:
- if company creation: a minimum of 15 jobs must be created within 3 years
- if extension: minimum increase of 30 jobs or 50% of workforce.
Grants have no upper limit but are subject to maximum rates of 23% (LC)-33% (SME) of the investment program.
Antwerp
Cash grants are available for investment in buildings, equipment and intangible assets up to 15% of total approved investment for
SME and 7,5% for LC. Minimum investment required is 20 000 €.
Potential levy of the real estate taxes.
Determined on a project basis.
(see Land & buildings)
Job creation: - Reduction in social security charges available, up to
375 €/employee for 15 months or 250 € for 48 months (up to 1 115 €/employee for 12 months if
low educated staff in start jobs). - Wage subsidy up to 500 €/employee for 12 to 36
months, depending on employee age and duration of contract.
Training: variety of aids which cannot be cumulated,
eg: - salary grants for general and specific
training - salary grants for hiring-training unemployed
people - training checks.
Rotterdam
E.U./national aid available on a project basis depending on investment amount, jobs created, level of activity and local added
value. Grants also available from the Rotterdam
Port Authority for building a new warehouse in port area if the company meets specific criteria that fit the port development plans (activity, type of job, number of containers,
etc). Determined on a project basis.
No incentives available for renting space.
(No incentive identified)
Hiring and training help available through national and regional authorities if the project lowers
unemployment. Eligibility and rates are determined on a project basis.
Rotterdam promotes itself on its productivity, local kills and critical mass vs financial incentives, hence the limited information available on a general basis.

25
5 – Productivity5 – Productivity
26
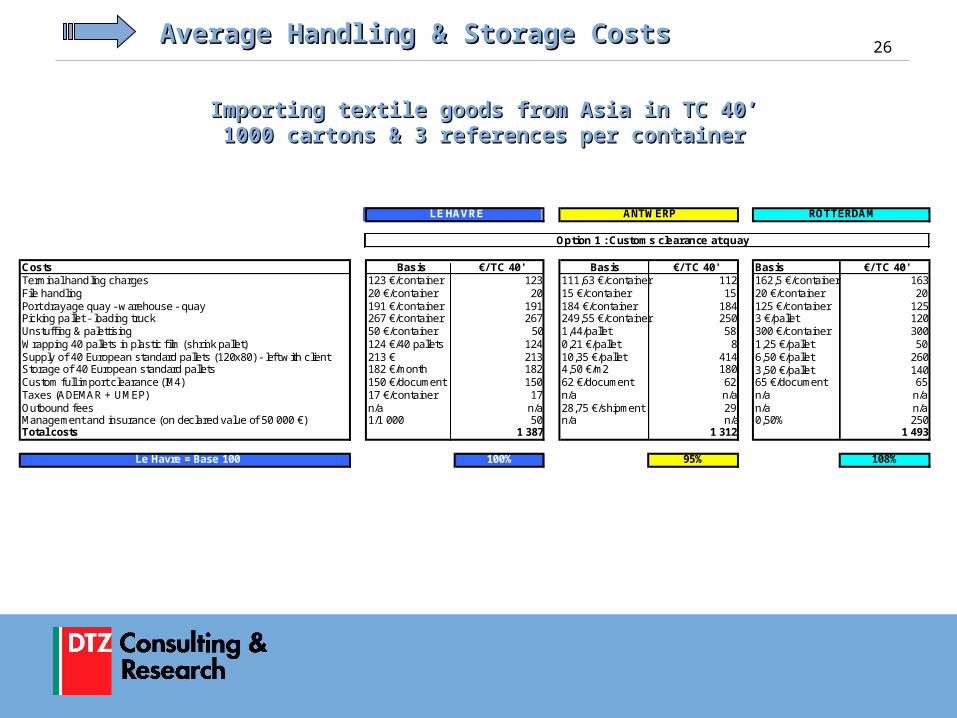
Importing textile goods from Asia in TC 40’ Importing textile goods from Asia in TC 40’ 1000 cartons & 3 references per container 1000 cartons & 3 references per container
Average Handling & Storage CostsAverage Handling & Storage Costs
Costs Basis €/ TC 40' Basis €/ TC 40' Basis €/ TC 40'Terminal handling charges 123 €/container 123 111,63 €/container 112 162,5 €/container 163File handling 20 €/container 20 15 €/container 15 20 €/container 20Port drayage quay - warehouse - quay 191 €/container 191 184 €/container 184 125 €/container 125Picking pallet - loading truck 267 €/container 267 249,55 €/container 250 3 €/pallet 120Unstuff ing & palettising 50 €/container 50 1,44/pallet 58 300 €/container 300Wrapping 40 pallets in plastic f ilm (shrink pallet) 124 €/40 pallets 124 0,21 €/pallet 8 1,25 €/pallet 50Supply of 40 European standard pallets (120x80) - left with client 213 € 213 10,35 €/pallet 414 6,50 €/pallet 260Storage of 40 European standard pallets 182 €/month 182 4,50 €/m2 180 3,50 €/pallet 140Custom full import clearance (IM4) 150 €/document 150 62 €/document 62 65 €/document 65Taxes (ADEMAR + UMEP) 17 €/container 17 n/a n/a n/a n/aOutbound fees n/a n/a 28,75 €/shipment 29 n/a n/aManagement and insurance (on declared value of 50 000 €) 1/1 000 50 n/a n/a 0,50% 250Total costs 1 387 1 312 1 493
Le Havre = Base 100 100% 95% 108%
Option 1 : Customs clearance at quay
ROTTERDAMLE HAVRE ANTWERP

27Average Handling & Storage CostsAverage Handling & Storage Costs
Importing textile goods from Asia in TC 40’ Importing textile goods from Asia in TC 40’ 1000 cartons & 3 references per container 1000 cartons & 3 references per container
Costs Basis €/ TC 40' Basis €/ TC 40' Basis €/ TC 40'Terminal handling charges 123 €/container 123 111,63 €/container 112 162,5 €/container 163File handling 20 €/container 20 15 €/container 15 20 €/container 20Port drayage quay - warehouse - quay 191 €/container 191 184 €/container 184 125 €/container 125Picking pallet - loading truck 267 €/container 267 249,55 €/container 250 3 €/pallet 120Unstuff ing & palettising 50 €/container 50 1,44/pallet 58 300 €/container 300Wrapping 40 pallets in plastic f ilm (shrink pallet) 124 €/40 pallets 124 0,21 €/pallet 8 1,25 €/pallet 50Supply of 40 European standard pallets (120x80) - left with client 213 € 213 10,35 €/pallet 414 6,50 €/pallet 260Storage of 40 European standard pallets 182 €/month 182 4,50 €/m2 180 3,50 €/pallet 140Customw arehouse transit costs (T1) 43 €/document 43 36 €/document 36 25 €/document 25Taxes (ADEMAR + UMEP) 17 €/container 17 n/a n/a n/a n/aOutbound fees n/a n/a 28,75 €/shipment 29 n/a n/aManagement and insurance (on declared value of 50 000 €) 1/1 000 50 n/a n/a 0,50% 250Total costs 1 280 1 286 1 453
Le Havre = Base 100 100% 100% 113%
Option 2 : Transit through customs warehouse
LE HAVRE ANTWERP ROTTERDAM

28Average Handling & Storage CostsAverage Handling & Storage Costs
Im p o r t in g t e x t ile g o o d s f r o m A s ia in T C 4 0 '1 0 0 0 c a r t o n s & 3 r e f e r e n c e s p e r c o n t a in e r
O p t io n 1 : C u s t o m s c le a r a n c e a t q u a y
1 2 0 0
1 3 0 0
1 4 0 0
1 5 0 0
1 6 0 0
L e H a v r e A n t w e r p R o t t e r d a m
€

29Average Handling & Storage CostsAverage Handling & Storage Costs
Importing textile goods from Asia in TC 40'1 000 cartons & 3 references per container
Option 2 : Transit through customs warehouse
1100
1200
1300
1400
1500
Le Havre Antwerp Rotterdam
€
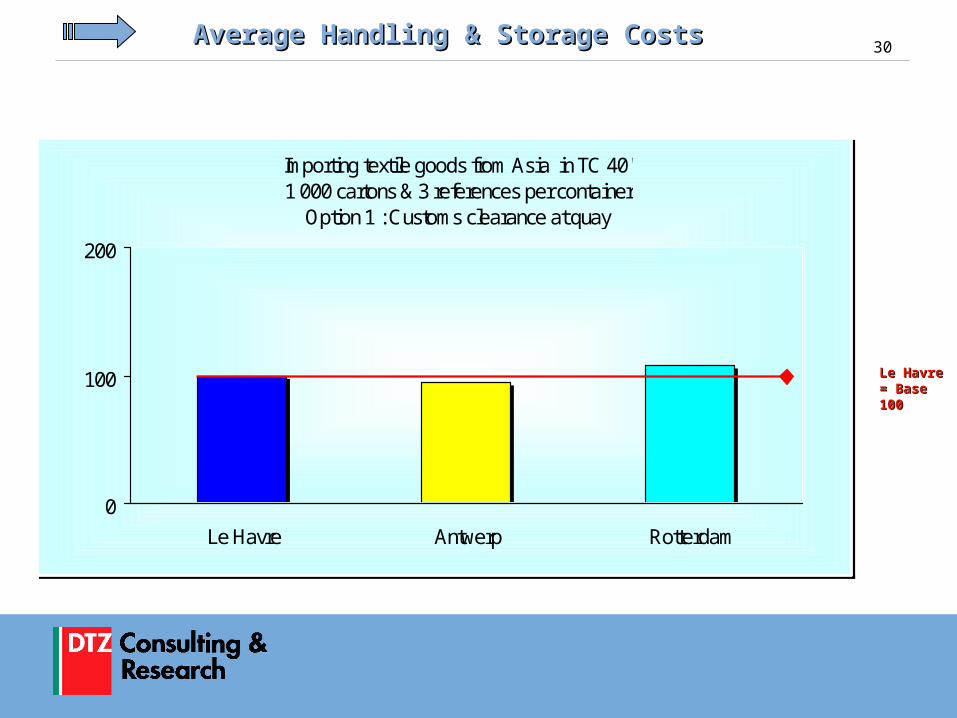
30Average Handling & Storage CostsAverage Handling & Storage Costs
Le Havre = Le Havre = Base 100Base 100
Importing textile goods from Asia in TC 40'1 000 cartons & 3 references per container
Option 1 : Customs clearance at quay
0
100
200
Le Havre Antwerp Rotterdam
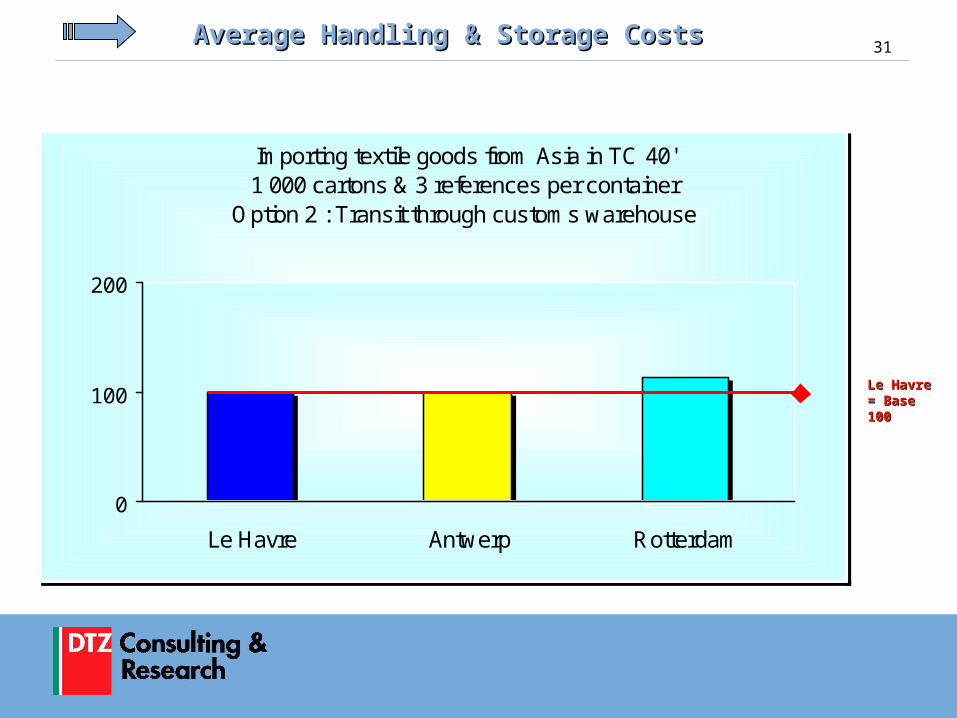
31Average Handling & Storage CostsAverage Handling & Storage Costs
Le Havre = Le Havre = Base 100Base 100
Importing textile goods from Asia in TC 40'1 000 cartons & 3 references per container
Option 2 : Transit through customs warehouse
0
100
200
Le Havre Antwerp Rotterdam

32Average costs of transportationAverage costs of transportation
Prices/destination vary from one truck company to other because they each have their own special routes and rates
Textile goods by truck – One-way tripTextile goods by truck – One-way trip
From :
To : € = Base 100 € // Havre € // Havre Paris 315 100% 490 156% 500 159%Bordeaux 510 100% 750 147% 850 167%Orleans 250 100% 505 202% 650 260%Lyon 540 100% 645 119% 800 148%Madrid 1 040 100% 1 275 123% 1 050 101%Milan 820 100% 875 107% 900 110%Barcelona 1 040 100% 1 075 103% 900 87%Lisbon 1 500 100% 1 120 75% 1 350 90%Geneva 750 100% 835 111% 900 120%
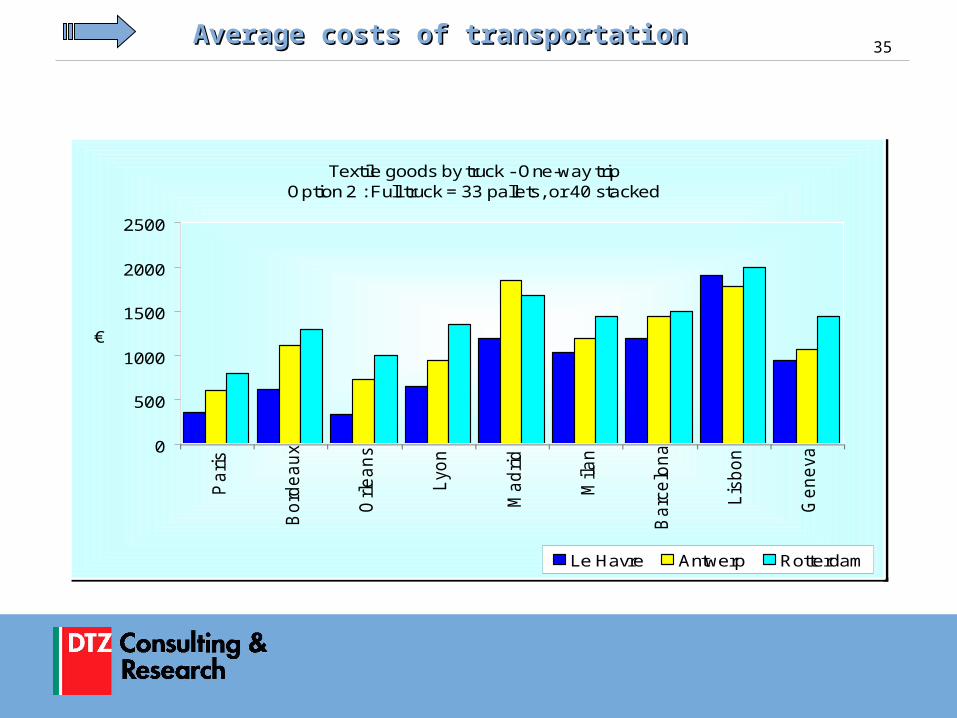
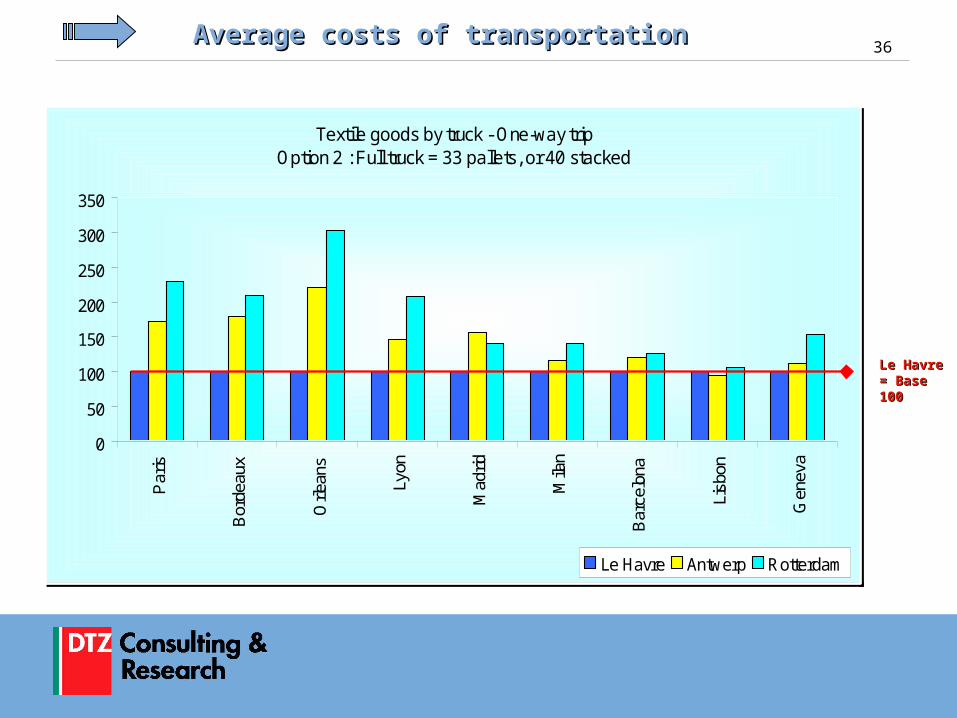
To : € = Base 100 € // Havre € // HavreParis 350 100% 605 173% 800 229%Bordeaux 620 100% 1 110 179% 1 300 210%Orleans 330 100% 730 221% 1 000 303%Lyon 650 100% 945 145% 1 350 208%Madrid 1 190 100% 1 850 155% 1 675 141%Milan 1 030 100% 1 195 116% 1 450 141%Barcelona 1 190 100% 1 440 121% 1 500 126%Lisbon 1 900 100% 1 775 93% 2 000 105%Geneva 940 100% 1 065 113% 1 450 154%
AVERAGE COSTS OF TRANSPORTATION
Textile goods by truck - One-way trip
Option 2 : Full truck = 33 pallets, or 40 stacked
Option 1 : Half-full truck = 15 pallets, or 20 stacked
ANTWERP ROTTERDAMLE HAVRE
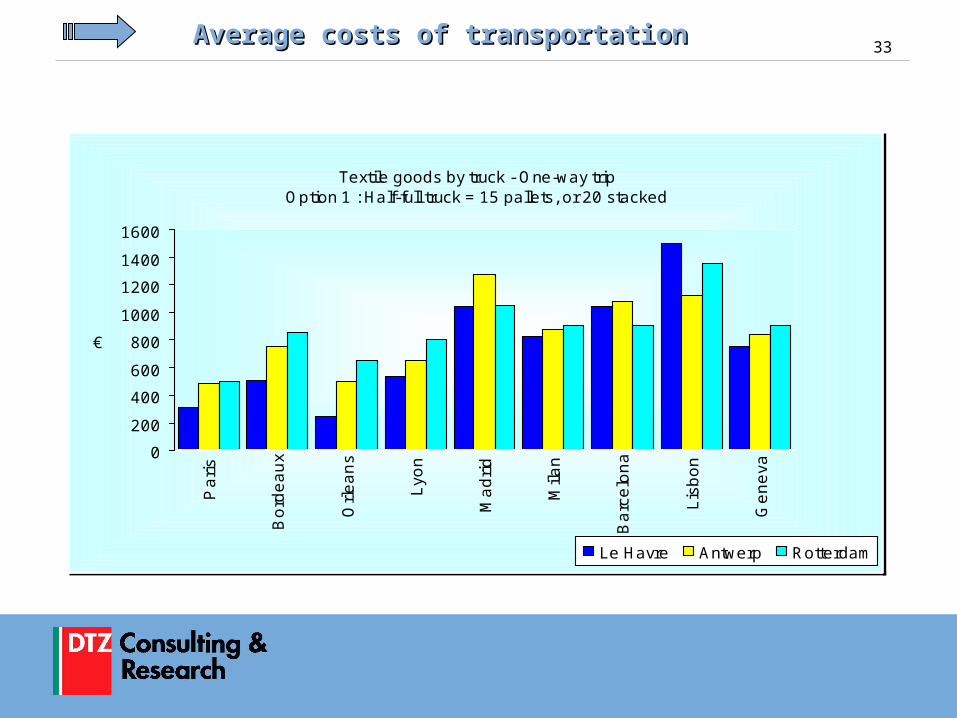
33Average costs of transportationAverage costs of transportation
Textile goods by truck - One-way tripOption 1 : Half-full truck = 15 pallets, or 20 stacked
0
200
400
600
800
1000
1200
1400
1600
Pa
ris
Bo
rde
au
x
Orl
ea
ns
Lyo
n
Ma
dri
d
Mila
n
Ba
rce
lon
a
Lis
bo
n
Ge
ne
va
€
Le Havre Antwerp Rotterdam

34Average costs of transportationAverage costs of transportation
Le Havre = Le Havre = Base 100Base 100
Textile goods by truck - One-w ay tripOption 1 : Half-full truck = 15 pallets, or 20 stacked
0
50
100
150
200
250
300P
aris
Bor
deau
x
Orle
ans
Lyon
Mad
rid
Mila
n
Bar
celo
na
Lisb
on
Gen
eva
Le Havre Antwerp Rotterdam
35Average costs of transportationAverage costs of transportation
Textile goods by truck - One-way tripOption 2 : Full truck = 33 pallets, or 40 stacked
0
500
1000
1500
2000
2500P
ari
s
Bo
rde
au
x
Orl
ea
ns
Lyo
n
Ma
dri
d
Mila
n
Ba
rce
lon
a
Lis
bo
n
Ge
ne
va
€
Le Havre Antwerp Rotterdam
36Average costs of transportationAverage costs of transportation
Le Havre = Le Havre = Base 100Base 100
Textile goods by truck - One-way tripOption 2 : Full truck = 33 pallets, or 40 stacked
0
50
100
150
200
250
300
350
Par
is
Bor
deau
x
Orle
ans
Lyon
Mad
rid
Mila
n
Bar
celo
na
Lisb
on
Gen
eva
Le Havre Antwerp Rotterdam

37
6 – Taxation6 – Taxation

38Corporate Income TaxCorporate Income Tax
FRANCE BELGIUM NETHERLANDS
33,33% 33,99% 35%
CORPORATE INCOME TAX
Corporate Income Tax
05
10152025303540
France Belgium Netherlands
%
39Local taxesLocal taxes
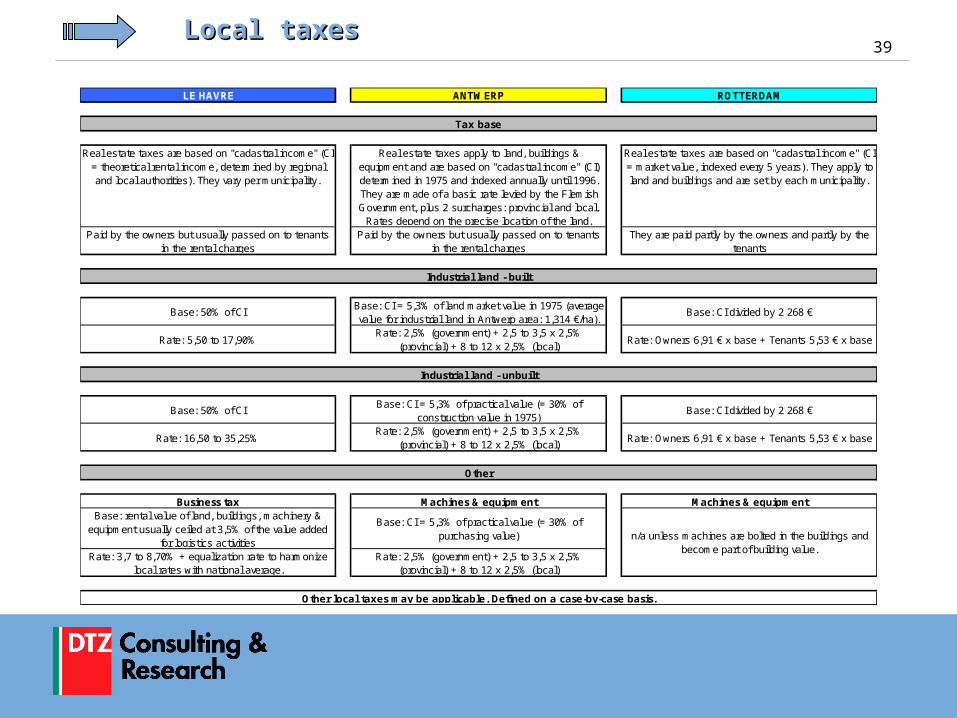
LE HAVRE ANTWERP ROTTERDAM
Real estate taxes are based on "cadastral income" (CI = theoretical rental income, determined by regional and local authorities). They vary per municipality.
Real estate taxes apply to land, buildings & equipment and are based on "cadastral income" (CI) determined in 1975 and indexed annually until 1996. They are made of a basic rate levied by the Flemish Government, plus 2 surcharges: provincial and local.
Rates depend on the precise location of the land.
Real estate taxes are based on "cadastral income" (CI = market value, indexed every 5 years). They apply to land and buildings and are set by each municipality.
Paid by the owners but usually passed on to tenants in the rental charges
Paid by the owners but usually passed on to tenants in the rental charges
They are paid partly by the owners and partly by the tenants
Base: 50% of CIBase: CI = 5,3% of land market value in 1975 (average value for industrial land in Antwerp area: 1,314 €/ha).
Base: CI divided by 2 268 €
Rate: 5,50 to 17,90%Rate: 2,5% (government) + 2,5 to 3,5 x 2,5%
(provincial) + 8 to 12 x 2,5% (local)Rate: Owners 6,91 € x base + Tenants 5,53 € x base
Base: 50% of CIBase: CI = 5,3% of practical value (= 30% of
construction value in 1975)Base: CI divided by 2 268 €
Rate: 16,50 to 35,25% Rate: 2,5% (government) + 2,5 to 3,5 x 2,5%
(provincial) + 8 to 12 x 2,5% (local)Rate: Owners 6,91 € x base + Tenants 5,53 € x base
Business tax Machines & equipment Machines & equipment
Base: rental value of land, buildings, machinery & equipment usually ceiled at 3,5% of the value added
for logistics activities
Base: CI = 5,3% of practical value (= 30% of purchasing value)
Rate: 3,7 to 8,70% + equalization rate to harmonize local rates with national average.
Rate: 2,5% (government) + 2,5 to 3,5 x 2,5% (provincial) + 8 to 12 x 2,5% (local)
Tax base
Other local taxes may be applicable. Defined on a case-by-case basis.
Industrial land - built
Industrial land - unbuilt
Other
n/a unless machines are bolted in the buildings and become part of building value.

40Treatment of VATTreatment of VAT
LE HAVRE ANTWERP ROTTERDAM
Delay of VAT payment is possible for up to 1 month Delay of VAT payment is possible for up to 6 w eeks. Delay of VAT payment is possible for up to 1-3 months
Company must have a local subsidiary or local representative otherw ise VAT is dued immediately
Company must have a Belgian VAT number or a local representative, otherw ise VAT is due immediately.
Company must have a local subsidiary or a tax representative otherw ise VAT is due immediately.
- If the company has a subsidiary in Holland, VAT can be paid w ith a delay of 2-3 months.
- If the company has a physical representative in Holland, VAT doesn't need to be paid until the 15th of the month follow ing the month of declaration.
It is impossible to make a general case, levels and modalities of payment depend on the nationality, set-up and operations of each specific company. Expert fiscal advice is recommended to optimize VAT situation.
Special paperw ork must be f illedLocal representative role is usually assumed by the logistics/freight company w ho w ill handle all the paperw ork. There is specif ic paperw ork for each case.
If the goods are destined for another European market, VAT must be declared at the port of entry but can be transferred/paid in country of destination.

41Sources of informationSources of information
LE HAVRE DEVELOPPEMENT Benchmark Study
SOURCES OF INFORMATION
EMPLOYMENT COSTS - Le Havre: Le Havre Entrepôts, ANPE, APEC, RH Partners - Antwerp: Partena, Profile Group - Rotterdam: Randstad, CCI (Chamber of Commerce) - FDI (E.U.) "European Business Incentives Report" (March 2003) - Ernst & Young "Worldwide Corporate Tax Guide" (2002) RENTAL COSTS - DTZ offices in France, Belgium and The Netherlands - Prologis LABOR - Le Havre: INSEE, ANPE - Antwerp: GOM (Antwerp Regional Government) - Rotterdam: Rotterdam Port Authority - UNESCO "International Standard Classification of Education" LAND COSTS & AVAILABILITY - Le Havre: Le Havre Développement, Port Autonome du Havre - Antwerp: DTZ, Antwerp Port Authority - Rotterdam: DTZ, Rotterdam Port Authority INVESTMENT INCENTIVES - Le Havre: Normandie Développement - Antwerp: FFIO (Flanders Foreign Investment Office), Antwerp Port Authority - Rotterdam: Netherlands Foreign Investment Agency, Rotterdam Port Authority PRODUCTIVITY - Le Havre: Le Havre Entrepôts, Maersk Logistics - Antwerp: Katoen Natie - Rotterdam: Neele Transport, CCBB TAXATION - Le Havre: Douanes françaises, CCI (Chambre de Commerce et d’Industrie) - Antwerp: DTZ, FFIO (Flanders Foreign Investment Office) - Rotterdam: DTZ, Rotterdam Port Authority
42
COPYRIGHT DTZ Consulting & Research 2003
This report should not be relied upon as a basis for entering into transactions without seeking specific, qualified, professional advice. Whilst facts have been rigorously checked, DTZ Consulting & Research can take no responsibility for any damage or loss suffered as a result of any inadvertent inaccuracy within this report.
Information contained herein should not, in whole or part, be published, reproduced or referred to without prior approval. Any such reproduction should be credited to DTZ Consulting & Research.