1 .5)&.5*$4 p6 mathematics - · pdf filemathematics written paper number ... p6...
TRANSCRIPT
P6 MATHEMATICS
312
P6 MATHEMATICS
1
Results of Primary 6 Mathematics in Territory-wide System Assessment 2017 The territory-wide percentage of P.6 students achieving Mathematics Basic Competency in TSA 2017 is 84.0% which is similar to that of the performance levels in 2013 and 2015.
Primary 6 Assessment Design
The assessment tasks for P.6 were based on the Basic Competency at the end of KS2 for the
Mathematics Curriculum (Trial Version) and the Mathematics Education Key Learning
Area – Mathematics Curriculum Guide (P1-P6) (2000). The tasks covered the five dimensions of the Mathematics curriculum, i.e. Number, Measures, Shape & Space, Data Handling and Algebra.
The Assessment assumed students had already mastered the Basic Competencies covered in Key Stage 1 (Primary 1 to 3) and therefore focused primarily on the basic and important areas of the Key Stage 2 (Primary 4 to 6) curriculum, testing the concepts, knowledge, skills and applications relevant to these areas.
The Assessment included a number of item types including multiple choice, fill in the blanks, solutions with working steps (or equations) required, as well as open-ended questions in which students were required to justify their answers, with item types varying according to the context. Some of the items consisted of sub-items. Besides finding the correct answers, students were also tested on their ability to present the solutions to problems, including writing out the necessary statements, mathematical expressions, equations and explanations.
The Assessment consisted of 89 test items (130 score points) covering the five dimensions. These items were grouped into four sub-papers, each 50 minutes in duration and covering all five dimensions. Some items appeared in more than one sub-paper to provide inter-paper links. Each student was required to attempt only one of the four sub-papers.
P6 MATHEMATICS
2
Table 8.4 Number of Items and Score Points for P.6
Subject Number of Items (Score Points)
Paper 1 Paper 2 Paper 3 Paper 4 Total *
Mathematics Written Paper
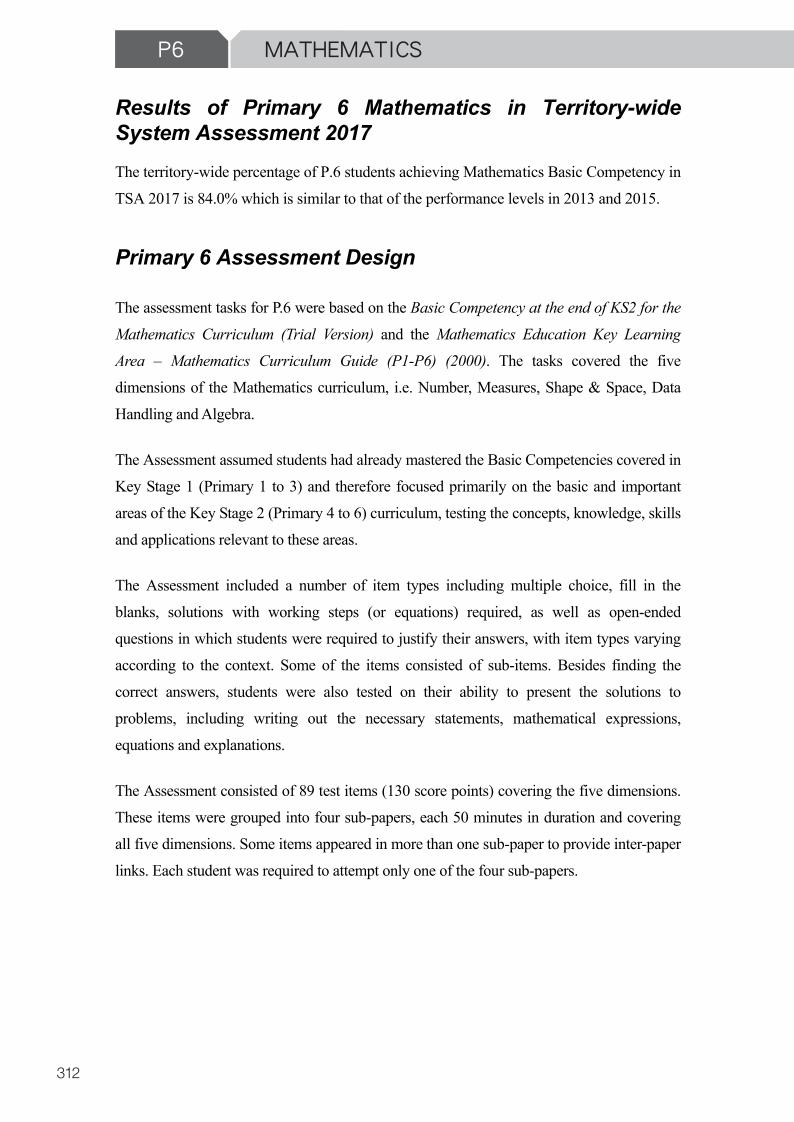
Number 21 (25) 21 (24) 18 (22) 17 (21) 47 (59) Measures 6 (11) 7 (13) 7 (11) 7 (12) 17 (29)
Shape and Space 3 (6) 3 (6) 4 (7) 5 (9) 8 (14) Data Handling 3 (5) 3 (6) 3 (7) 3 (5) 8 (15)
Algebra 3 (5) 2 (4) 4 (6) 4 (6) 9 (13) Total 36 (52) 36 (53) 36 (53) 36 (53) 89 (130)
* Items that appear in different sub-papers are counted once only.
Performance of Primary 6 Students Achieving Basic Competence in Territory-wide System Assessment 2017
P.6 Number Dimension
The performance of students was good in the Number Dimension. The majority of students understood the basic concepts including factors and multiples, conversion between fractions, decimals and percentages, arithmetic operations and methods of estimation. However, a small number of students confused the common factors with the common multiples of two numbers. Some students were weak in solving application problems involving fractions and percentages. Further comments on their performance are provided below with examples from different sub-papers quoted in brackets.
Understanding basic concepts
Most students understood the concept of place values (e.g. Q1/M1, Q1/M3).
Most students were able to arrange numbers in descending order (e.g. Q1/M4).
Multiples and factors
While the majority of students understood the concept of factors (e.g. Q2/M3), some students confused the factors with the multiples of a number and chose the options A or B in Q2/M1.
P.6 students were able to use the listing method to find all the factors of 85 (e.g. Q3/M1).
P6 MATHEMATICS
313
P6 MATHEMATICS
1
Results of Primary 6 Mathematics in Territory-wide System Assessment 2017 The territory-wide percentage of P.6 students achieving Mathematics Basic Competency in TSA 2017 is 84.0% which is similar to that of the performance levels in 2013 and 2015.
Primary 6 Assessment Design
The assessment tasks for P.6 were based on the Basic Competency at the end of KS2 for the
Mathematics Curriculum (Trial Version) and the Mathematics Education Key Learning
Area – Mathematics Curriculum Guide (P1-P6) (2000). The tasks covered the five dimensions of the Mathematics curriculum, i.e. Number, Measures, Shape & Space, Data Handling and Algebra.
The Assessment assumed students had already mastered the Basic Competencies covered in Key Stage 1 (Primary 1 to 3) and therefore focused primarily on the basic and important areas of the Key Stage 2 (Primary 4 to 6) curriculum, testing the concepts, knowledge, skills and applications relevant to these areas.
The Assessment included a number of item types including multiple choice, fill in the blanks, solutions with working steps (or equations) required, as well as open-ended questions in which students were required to justify their answers, with item types varying according to the context. Some of the items consisted of sub-items. Besides finding the correct answers, students were also tested on their ability to present the solutions to problems, including writing out the necessary statements, mathematical expressions, equations and explanations.
The Assessment consisted of 89 test items (130 score points) covering the five dimensions. These items were grouped into four sub-papers, each 50 minutes in duration and covering all five dimensions. Some items appeared in more than one sub-paper to provide inter-paper links. Each student was required to attempt only one of the four sub-papers.
P6 MATHEMATICS
2
Table 8.4 Number of Items and Score Points for P.6
Subject Number of Items (Score Points)
Paper 1 Paper 2 Paper 3 Paper 4 Total *
Mathematics Written Paper
Number 21 (25) 21 (24) 18 (22) 17 (21) 47 (59) Measures 6 (11) 7 (13) 7 (11) 7 (12) 17 (29)
Shape and Space 3 (6) 3 (6) 4 (7) 5 (9) 8 (14) Data Handling 3 (5) 3 (6) 3 (7) 3 (5) 8 (15)
Algebra 3 (5) 2 (4) 4 (6) 4 (6) 9 (13) Total 36 (52) 36 (53) 36 (53) 36 (53) 89 (130)
* Items that appear in different sub-papers are counted once only.
Performance of Primary 6 Students Achieving Basic Competence in Territory-wide System Assessment 2017
P.6 Number Dimension
The performance of students was good in the Number Dimension. The majority of students understood the basic concepts including factors and multiples, conversion between fractions, decimals and percentages, arithmetic operations and methods of estimation. However, a small number of students confused the common factors with the common multiples of two numbers. Some students were weak in solving application problems involving fractions and percentages. Further comments on their performance are provided below with examples from different sub-papers quoted in brackets.
Understanding basic concepts
Most students understood the concept of place values (e.g. Q1/M1, Q1/M3).
Most students were able to arrange numbers in descending order (e.g. Q1/M4).
Multiples and factors
While the majority of students understood the concept of factors (e.g. Q2/M3), some students confused the factors with the multiples of a number and chose the options A or B in Q2/M1.
P.6 students were able to use the listing method to find all the factors of 85 (e.g. Q3/M1).
P6 MATHEMATICS
314
P6 MATHEMATICS
3
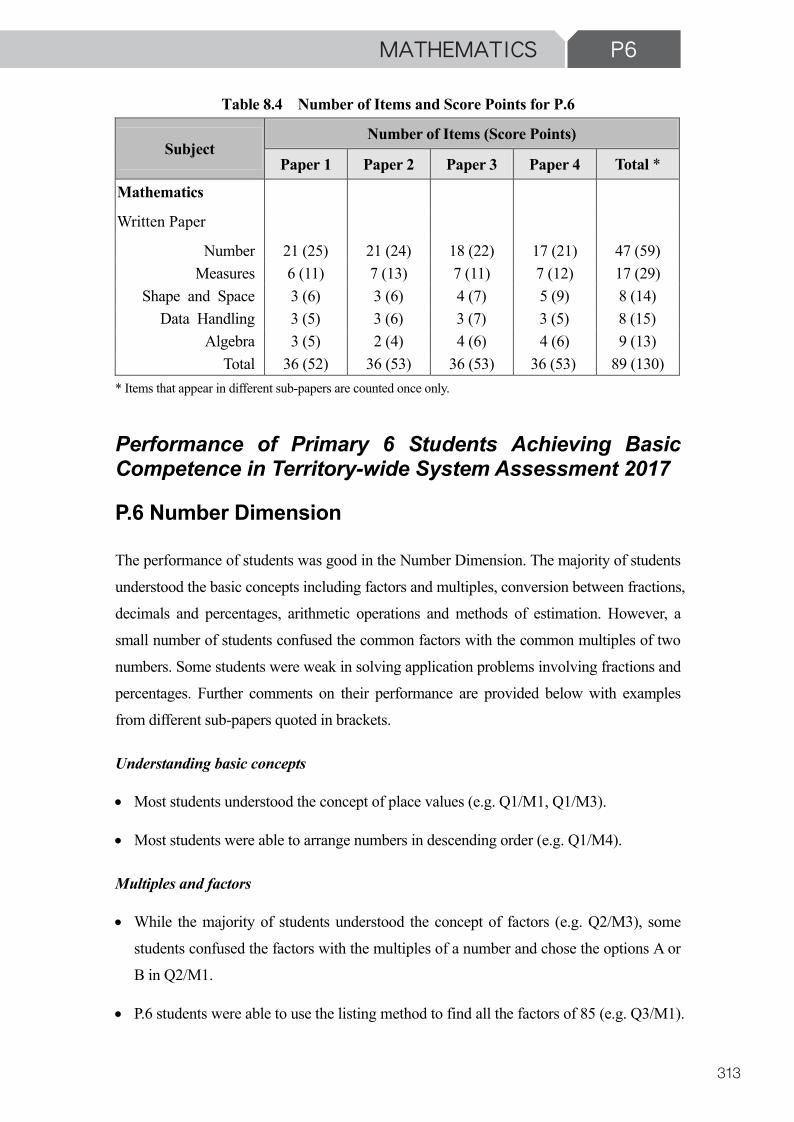
However, some students mistook 15 for a factor of 85 or missed the factor 17 (see the examples of students’ work below).
The majority of students were capable of finding the common factors (e.g. Q2/M4) and common multiples of two numbers (e.g. Q6/M1). However, a small number of students confused the common multiples with the common factors of a number (e.g. Q3/M3).
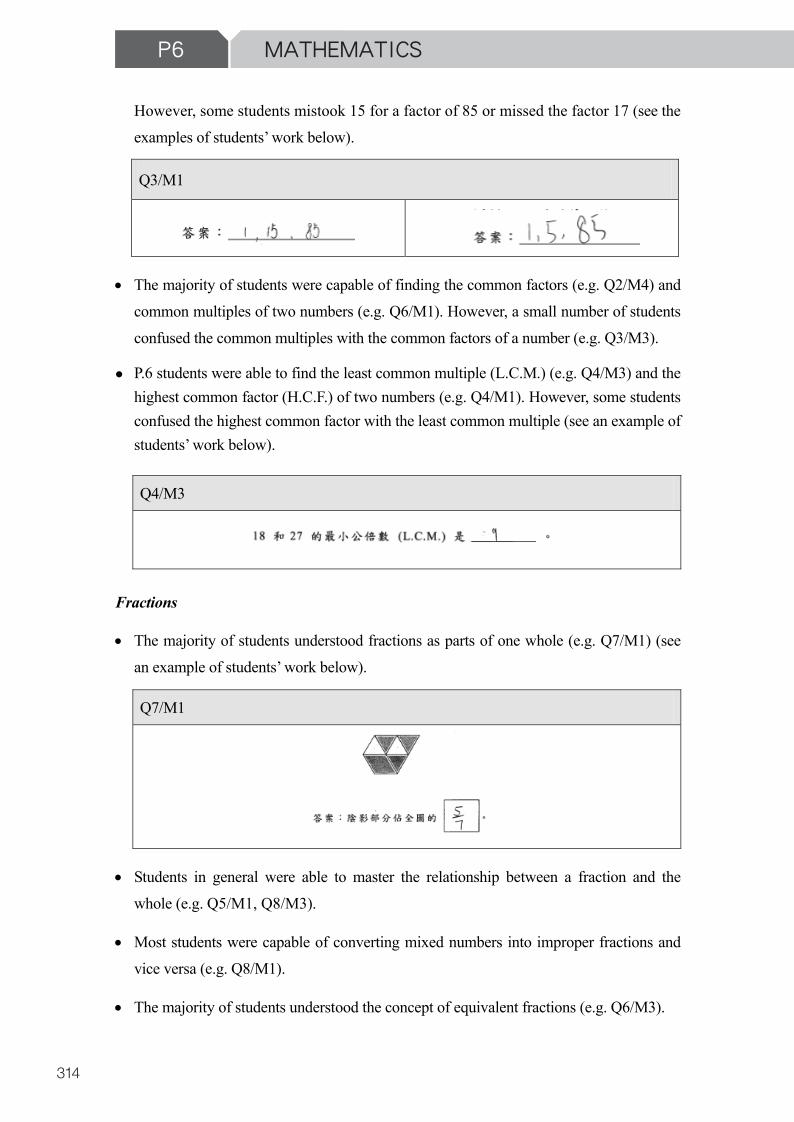
P.6 students were able to find the least common multiple (L.C.M.) (e.g. Q4/M3) and the highest common factor (H.C.F.) of two numbers (e.g. Q4/M1). However, some students confused the highest common factor with the least common multiple (see an example of students’ work below).
Q4/M3
Fractions
The majority of students understood fractions as parts of one whole (e.g. Q7/M1) (see an example of students’ work below).
Q7/M1
Students in general were able to master the relationship between a fraction and the whole (e.g. Q5/M1, Q8/M3).
Most students were capable of converting mixed numbers into improper fractions and vice versa (e.g. Q8/M1).
The majority of students understood the concept of equivalent fractions (e.g. Q6/M3).
Q3/M1
P6 MATHEMATICS
4
The performance of students in comparing fractions was satisfactory (e.g. Q9/M1).
Decimals
The majority of students were able to record numbers with decimals (e.g. Q14/M4).
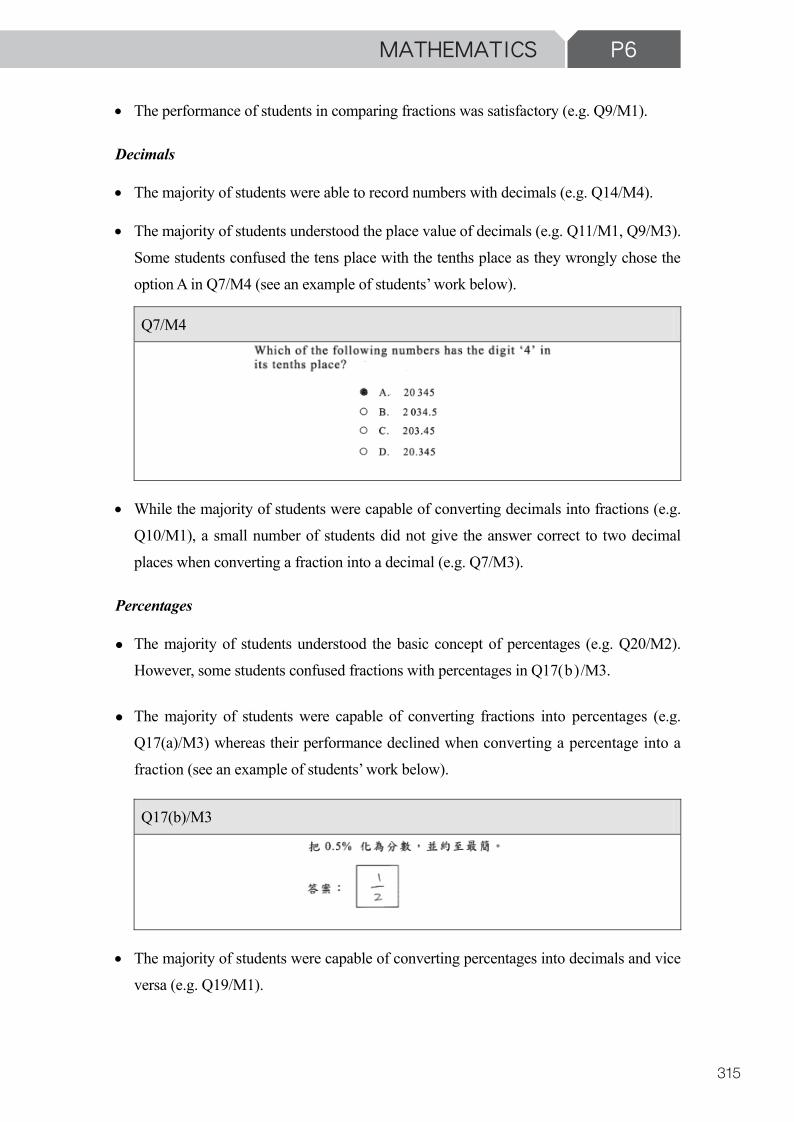
The majority of students understood the place value of decimals (e.g. Q11/M1, Q9/M3). Some students confused the tens place with the tenths place as they wrongly chose the option A in Q7/M4 (see an example of students’ work below).
Q7/M4
While the majority of students were capable of converting decimals into fractions (e.g. Q10/M1), a small number of students did not give the answer correct to two decimal places when converting a fraction into a decimal (e.g. Q7/M3).
Percentages
The majority of students understood the basic concept of percentages (e.g. Q20/M2). However, some students confused fractions with percentages in Q17(b)/M3.
The majority of students were capable of converting fractions into percentages (e.g. Q17(a)/M3) whereas their performance declined when converting a percentage into a fraction (see an example of students’ work below).
Q17(b)/M3
The majority of students were capable of converting percentages into decimals and vice versa (e.g. Q19/M1).
P6 MATHEMATICS
315
P6 MATHEMATICS
3
However, some students mistook 15 for a factor of 85 or missed the factor 17 (see the examples of students’ work below).
The majority of students were capable of finding the common factors (e.g. Q2/M4) and common multiples of two numbers (e.g. Q6/M1). However, a small number of students confused the common multiples with the common factors of a number (e.g. Q3/M3).
P.6 students were able to find the least common multiple (L.C.M.) (e.g. Q4/M3) and the highest common factor (H.C.F.) of two numbers (e.g. Q4/M1). However, some students confused the highest common factor with the least common multiple (see an example of students’ work below).
Q4/M3
Fractions
The majority of students understood fractions as parts of one whole (e.g. Q7/M1) (see an example of students’ work below).
Q7/M1
Students in general were able to master the relationship between a fraction and the whole (e.g. Q5/M1, Q8/M3).
Most students were capable of converting mixed numbers into improper fractions and vice versa (e.g. Q8/M1).
The majority of students understood the concept of equivalent fractions (e.g. Q6/M3).
Q3/M1
P6 MATHEMATICS
4
The performance of students in comparing fractions was satisfactory (e.g. Q9/M1).
Decimals
The majority of students were able to record numbers with decimals (e.g. Q14/M4).
The majority of students understood the place value of decimals (e.g. Q11/M1, Q9/M3). Some students confused the tens place with the tenths place as they wrongly chose the option A in Q7/M4 (see an example of students’ work below).
Q7/M4
While the majority of students were capable of converting decimals into fractions (e.g. Q10/M1), a small number of students did not give the answer correct to two decimal places when converting a fraction into a decimal (e.g. Q7/M3).
Percentages
The majority of students understood the basic concept of percentages (e.g. Q20/M2). However, some students confused fractions with percentages in Q17(b)/M3.
The majority of students were capable of converting fractions into percentages (e.g. Q17(a)/M3) whereas their performance declined when converting a percentage into a fraction (see an example of students’ work below).
Q17(b)/M3
The majority of students were capable of converting percentages into decimals and vice versa (e.g. Q19/M1).

P6 MATHEMATICS
316
P6 MATHEMATICS
5
Performing basic calculations
P.6 students were able to handle the four operations on whole numbers (e.g. Q12/M1, Q6/M4). Some students neglected the rule of ‘doing division before addition’ and wrongly chose the option B in Q11/M2.
The majority of students were capable of carrying out the four arithmetic operations involving fractions (e.g. Q13/M1, Q14/M1, Q11/M3, Q12/M3).
The majority of students were able to perform the four arithmetic operations involving decimals (e.g. Q15/M1, Q10/M3) but were weaker in the division of decimals (e.g. Q16/M1, Q10/M4).
Solving application problems
P.6 students were able to solve application problems involving whole numbers and fractions (e.g. Q17/M1, Q17/M2, Q18/M3) (see an example of students’ work on Q17/M1 below).
Q17/M1
The majority of students were capable of solving application problems involving decimals (e.g. Q13/M4).
Students performed well in solving problems involving money calculations (e.g. Q18/M1, Q16/M4) (see the examples of students’ work below).
Q16/M4
P6 MATHEMATICS
6
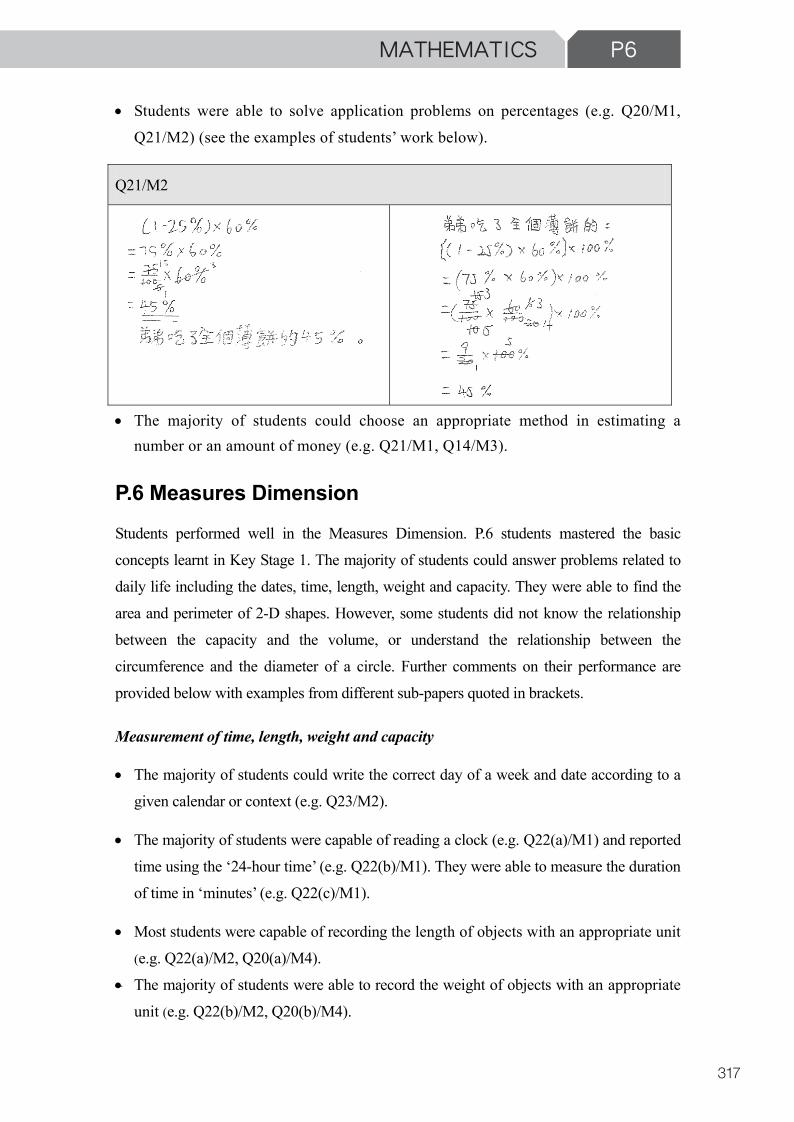
Students were able to solve application problems on percentages (e.g. Q20/M1, Q21/M2) (see the examples of students’ work below).
The majority of students could choose an appropriate method in estimating a number or an amount of money (e.g. Q21/M1, Q14/M3).
P.6 Measures Dimension
Students performed well in the Measures Dimension. P.6 students mastered the basic concepts learnt in Key Stage 1. The majority of students could answer problems related to daily life including the dates, time, length, weight and capacity. They were able to find the area and perimeter of 2-D shapes. However, some students did not know the relationship between the capacity and the volume, or understand the relationship between the circumference and the diameter of a circle. Further comments on their performance are provided below with examples from different sub-papers quoted in brackets.
Measurement of time, length, weight and capacity
The majority of students could write the correct day of a week and date according to a given calendar or context (e.g. Q23/M2).
The majority of students were capable of reading a clock (e.g. Q22(a)/M1) and reported time using the ‘24-hour time’ (e.g. Q22(b)/M1). They were able to measure the duration of time in ‘minutes’ (e.g. Q22(c)/M1).
Most students were capable of recording the length of objects with an appropriate unit (e.g. Q22(a)/M2, Q20(a)/M4).
The majority of students were able to record the weight of objects with an appropriate unit (e.g. Q22(b)/M2, Q20(b)/M4).
Q21/M2
P6 MATHEMATICS
317
P6 MATHEMATICS
5
Performing basic calculations
P.6 students were able to handle the four operations on whole numbers (e.g. Q12/M1, Q6/M4). Some students neglected the rule of ‘doing division before addition’ and wrongly chose the option B in Q11/M2.
The majority of students were capable of carrying out the four arithmetic operations involving fractions (e.g. Q13/M1, Q14/M1, Q11/M3, Q12/M3).
The majority of students were able to perform the four arithmetic operations involving decimals (e.g. Q15/M1, Q10/M3) but were weaker in the division of decimals (e.g. Q16/M1, Q10/M4).
Solving application problems
P.6 students were able to solve application problems involving whole numbers and fractions (e.g. Q17/M1, Q17/M2, Q18/M3) (see an example of students’ work on Q17/M1 below).
Q17/M1
The majority of students were capable of solving application problems involving decimals (e.g. Q13/M4).
Students performed well in solving problems involving money calculations (e.g. Q18/M1, Q16/M4) (see the examples of students’ work below).
Q16/M4
P6 MATHEMATICS
6
Students were able to solve application problems on percentages (e.g. Q20/M1, Q21/M2) (see the examples of students’ work below).
The majority of students could choose an appropriate method in estimating a number or an amount of money (e.g. Q21/M1, Q14/M3).
P.6 Measures Dimension
Students performed well in the Measures Dimension. P.6 students mastered the basic concepts learnt in Key Stage 1. The majority of students could answer problems related to daily life including the dates, time, length, weight and capacity. They were able to find the area and perimeter of 2-D shapes. However, some students did not know the relationship between the capacity and the volume, or understand the relationship between the circumference and the diameter of a circle. Further comments on their performance are provided below with examples from different sub-papers quoted in brackets.
Measurement of time, length, weight and capacity
The majority of students could write the correct day of a week and date according to a given calendar or context (e.g. Q23/M2).
The majority of students were capable of reading a clock (e.g. Q22(a)/M1) and reported time using the ‘24-hour time’ (e.g. Q22(b)/M1). They were able to measure the duration of time in ‘minutes’ (e.g. Q22(c)/M1).
Most students were capable of recording the length of objects with an appropriate unit (e.g. Q22(a)/M2, Q20(a)/M4).
The majority of students were able to record the weight of objects with an appropriate unit (e.g. Q22(b)/M2, Q20(b)/M4).
Q21/M2
P6 MATHEMATICS
318
P6 MATHEMATICS
7
Most students could record the capacity of containers with an appropriate unit (e.g. Q20(c) /M4).
The majority of students could measure and compare the capacity of containers using ‘litre’ (L) or ‘millilitre’ (mL) (e.g. Q23/M1).
Finding perimeters
The majority of students could compare the perimeters of 2-D shapes (e.g. Q21/M4).
Most students could calculate the perimeter of a rectangle (e.g. Q24(a)/M2).
Many students did not recognize the relationship between the circumference and the diameter of a circle (e.g. Q25/M1).
The majority of students could apply the circumference formula in solving problems (e.g. Q24(b)/M2, Q18(b)/M4).
Finding areas
Generally, students could estimate the area of an irregular 2-D shape using effective strategies (e.g. Q26/M2).
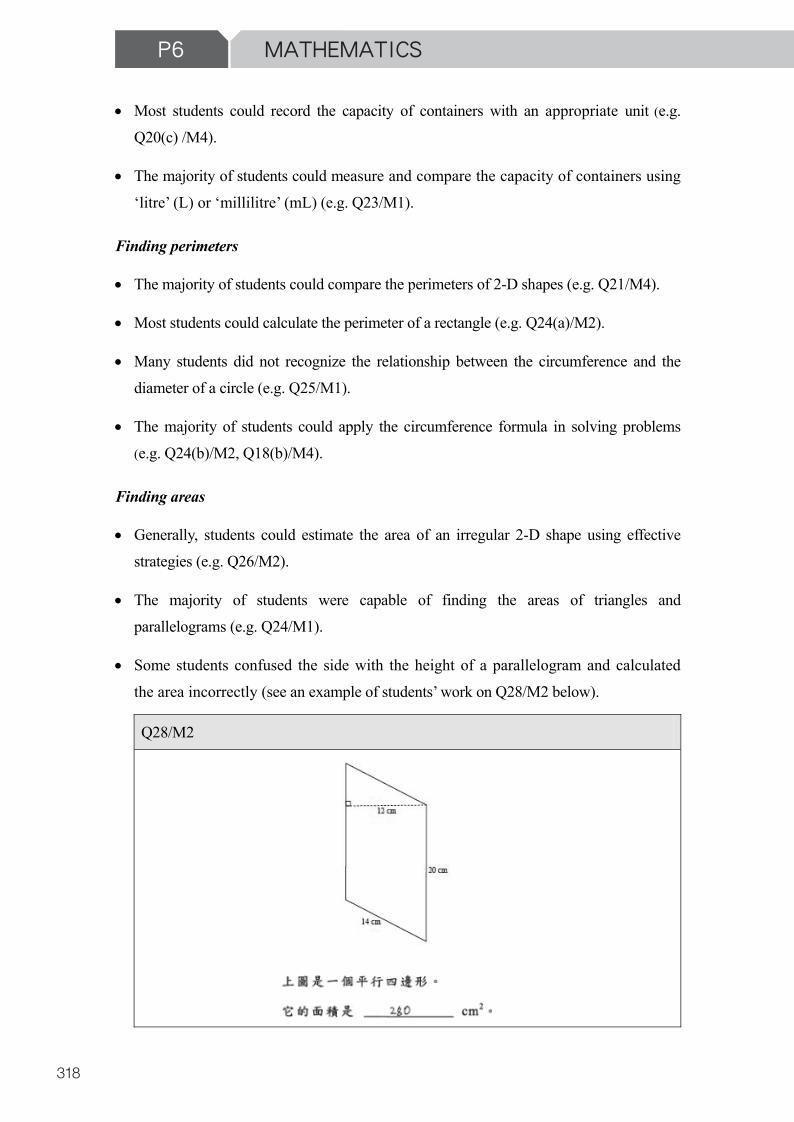
The majority of students were capable of finding the areas of triangles and parallelograms (e.g. Q24/M1).
Some students confused the side with the height of a parallelogram and calculated the area incorrectly (see an example of students’ work on Q28/M2 below).
Q28/M2
P6 MATHEMATICS
8
Finding volumes
The majority of students were able to find the volume of 3-D solids with a correct unit (e.g. Q23/M3).
The majority of students were able to calculate the volume of a cube (e.g. Q26/M1).
Many students did not understand the relationship between the capacity and the volume (e.g. Q24/M3).
The majority of students were capable of finding the volume of an irregular solid by displacement of water (e.g. Q25/M3).
Speed
Most students were able to choose the correct units of speed (e.g. Q27/M1).
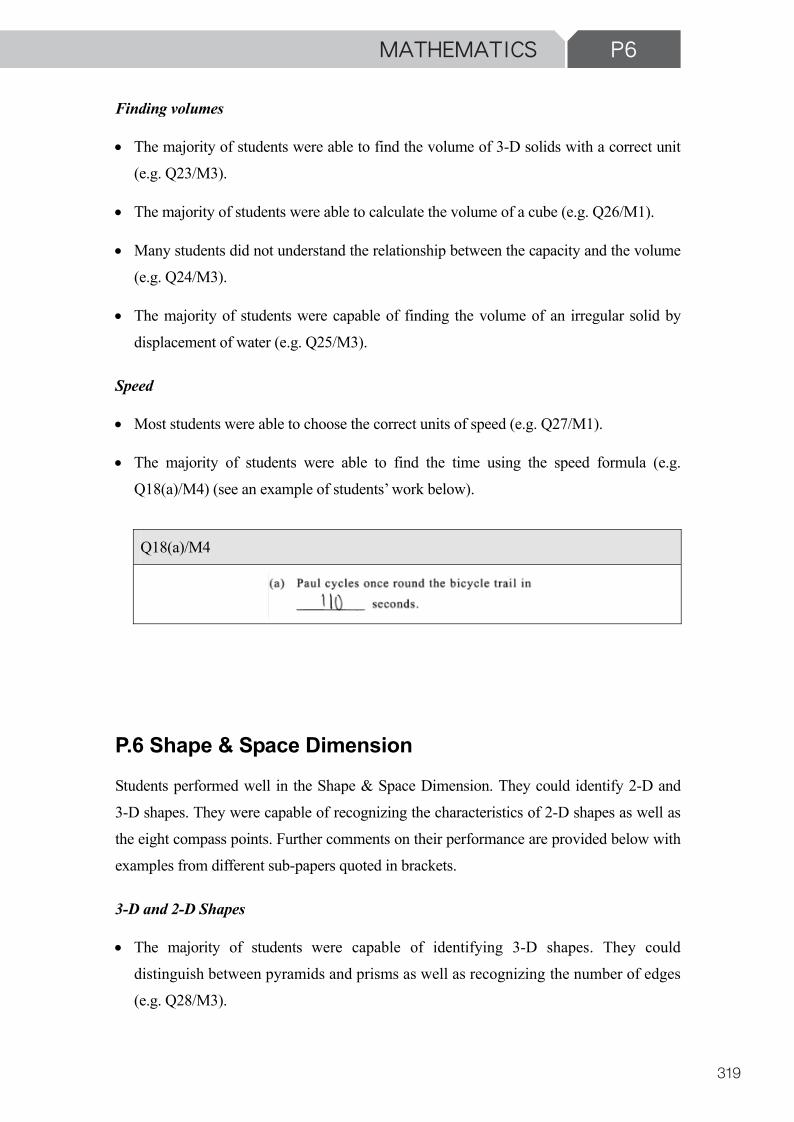
The majority of students were able to find the time using the speed formula (e.g. Q18(a)/M4) (see an example of students’ work below).
P.6 Shape & Space Dimension
Students performed well in the Shape & Space Dimension. They could identify 2-D and 3-D shapes. They were capable of recognizing the characteristics of 2-D shapes as well as the eight compass points. Further comments on their performance are provided below with examples from different sub-papers quoted in brackets.
3-D and 2-D Shapes
The majority of students were capable of identifying 3-D shapes. They could distinguish between pyramids and prisms as well as recognizing the number of edges (e.g. Q28/M3).
Q18(a)/M4
P6 MATHEMATICS
319
P6 MATHEMATICS
7
Most students could record the capacity of containers with an appropriate unit (e.g. Q20(c) /M4).
The majority of students could measure and compare the capacity of containers using ‘litre’ (L) or ‘millilitre’ (mL) (e.g. Q23/M1).
Finding perimeters
The majority of students could compare the perimeters of 2-D shapes (e.g. Q21/M4).
Most students could calculate the perimeter of a rectangle (e.g. Q24(a)/M2).
Many students did not recognize the relationship between the circumference and the diameter of a circle (e.g. Q25/M1).
The majority of students could apply the circumference formula in solving problems (e.g. Q24(b)/M2, Q18(b)/M4).
Finding areas
Generally, students could estimate the area of an irregular 2-D shape using effective strategies (e.g. Q26/M2).
The majority of students were capable of finding the areas of triangles and parallelograms (e.g. Q24/M1).
Some students confused the side with the height of a parallelogram and calculated the area incorrectly (see an example of students’ work on Q28/M2 below).
Q28/M2
P6 MATHEMATICS
8
Finding volumes
The majority of students were able to find the volume of 3-D solids with a correct unit (e.g. Q23/M3).
The majority of students were able to calculate the volume of a cube (e.g. Q26/M1).
Many students did not understand the relationship between the capacity and the volume (e.g. Q24/M3).
The majority of students were capable of finding the volume of an irregular solid by displacement of water (e.g. Q25/M3).
Speed
Most students were able to choose the correct units of speed (e.g. Q27/M1).
The majority of students were able to find the time using the speed formula (e.g. Q18(a)/M4) (see an example of students’ work below).
P.6 Shape & Space Dimension
Students performed well in the Shape & Space Dimension. They could identify 2-D and 3-D shapes. They were capable of recognizing the characteristics of 2-D shapes as well as the eight compass points. Further comments on their performance are provided below with examples from different sub-papers quoted in brackets.
3-D and 2-D Shapes
The majority of students were capable of identifying 3-D shapes. They could distinguish between pyramids and prisms as well as recognizing the number of edges (e.g. Q28/M3).
Q18(a)/M4
P6 MATHEMATICS
320
P6 MATHEMATICS
9
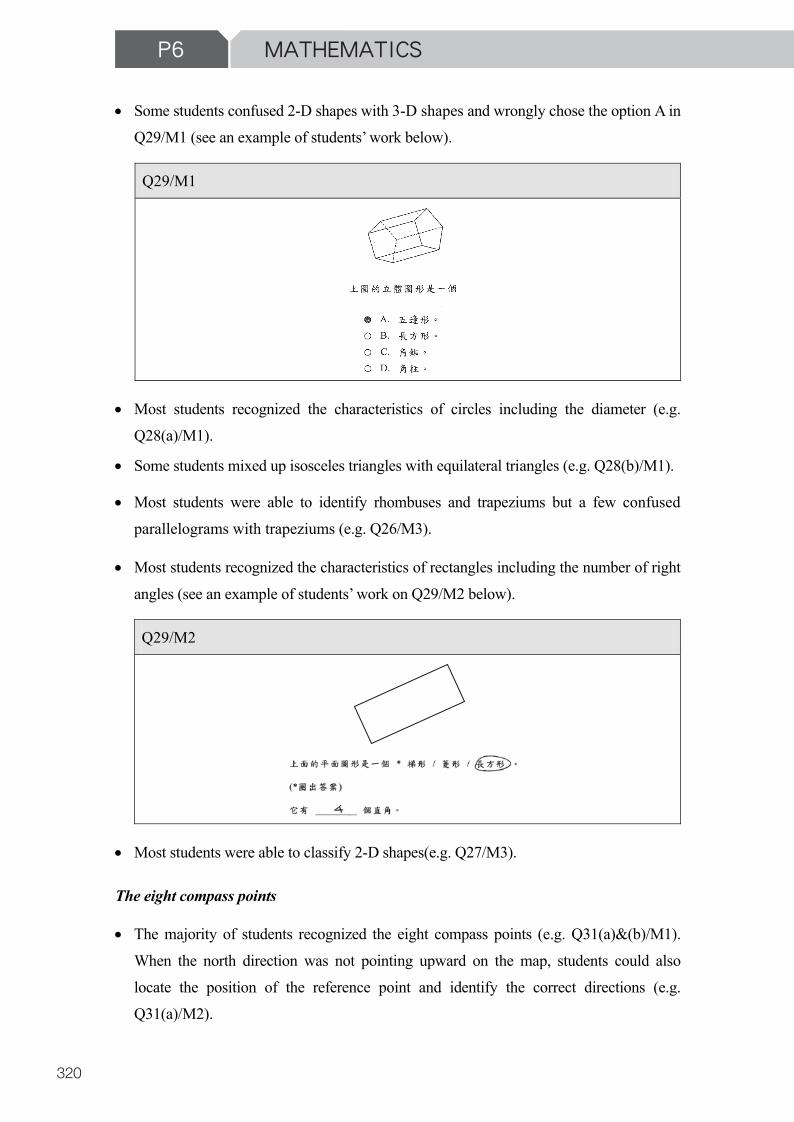
Some students confused 2-D shapes with 3-D shapes and wrongly chose the option A in Q29/M1 (see an example of students’ work below).
Most students recognized the characteristics of circles including the diameter (e.g. Q28(a)/M1).
Some students mixed up isosceles triangles with equilateral triangles (e.g. Q28(b)/M1).
Most students were able to identify rhombuses and trapeziums but a few confused parallelograms with trapeziums (e.g. Q26/M3).
Most students recognized the characteristics of rectangles including the number of right angles (see an example of students’ work on Q29/M2 below).
Most students were able to classify 2-D shapes(e.g. Q27/M3).
The eight compass points
The majority of students recognized the eight compass points (e.g. Q31(a)&(b)/M1). When the north direction was not pointing upward on the map, students could also locate the position of the reference point and identify the correct directions (e.g. Q31(a)/M2).
Q29/M1
Q29/M2
P6 MATHEMATICS
10
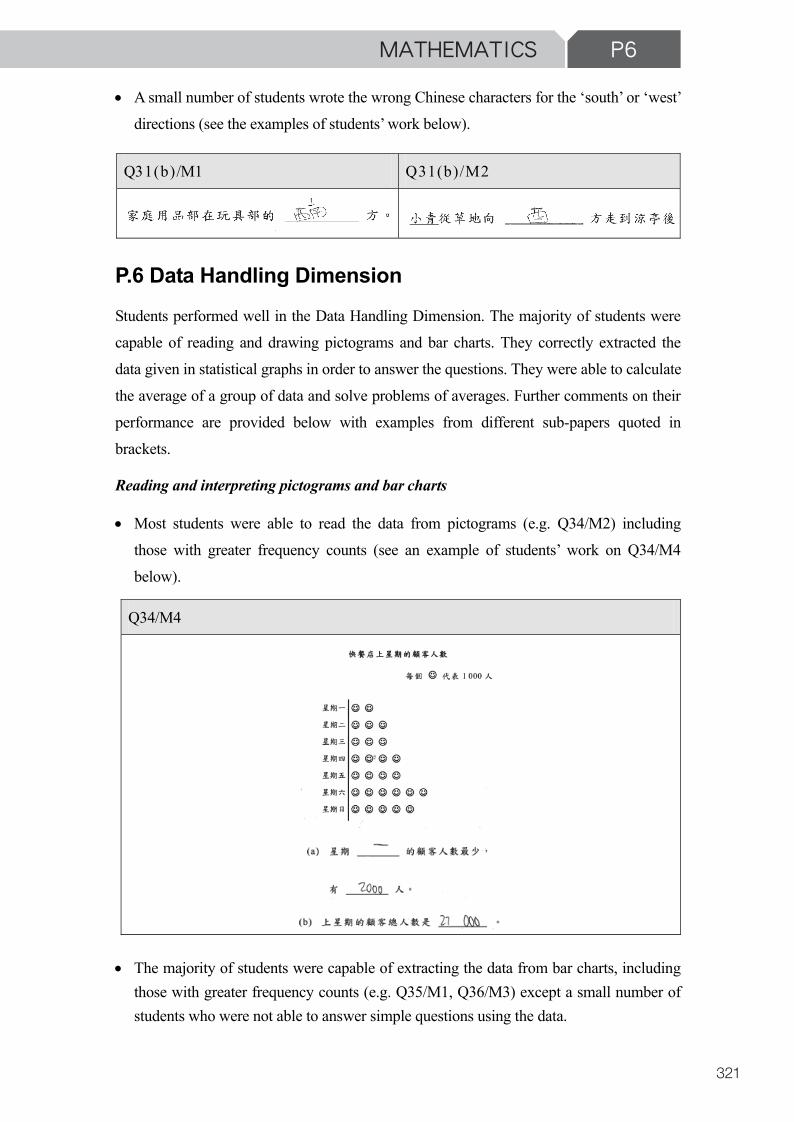
A small number of students wrote the wrong Chinese characters for the ‘south’ or ‘west’ directions (see the examples of students’ work below).
P.6 Data Handling Dimension
Students performed well in the Data Handling Dimension. The majority of students were capable of reading and drawing pictograms and bar charts. They correctly extracted the data given in statistical graphs in order to answer the questions. They were able to calculate the average of a group of data and solve problems of averages. Further comments on their performance are provided below with examples from different sub-papers quoted in brackets.
Reading and interpreting pictograms and bar charts
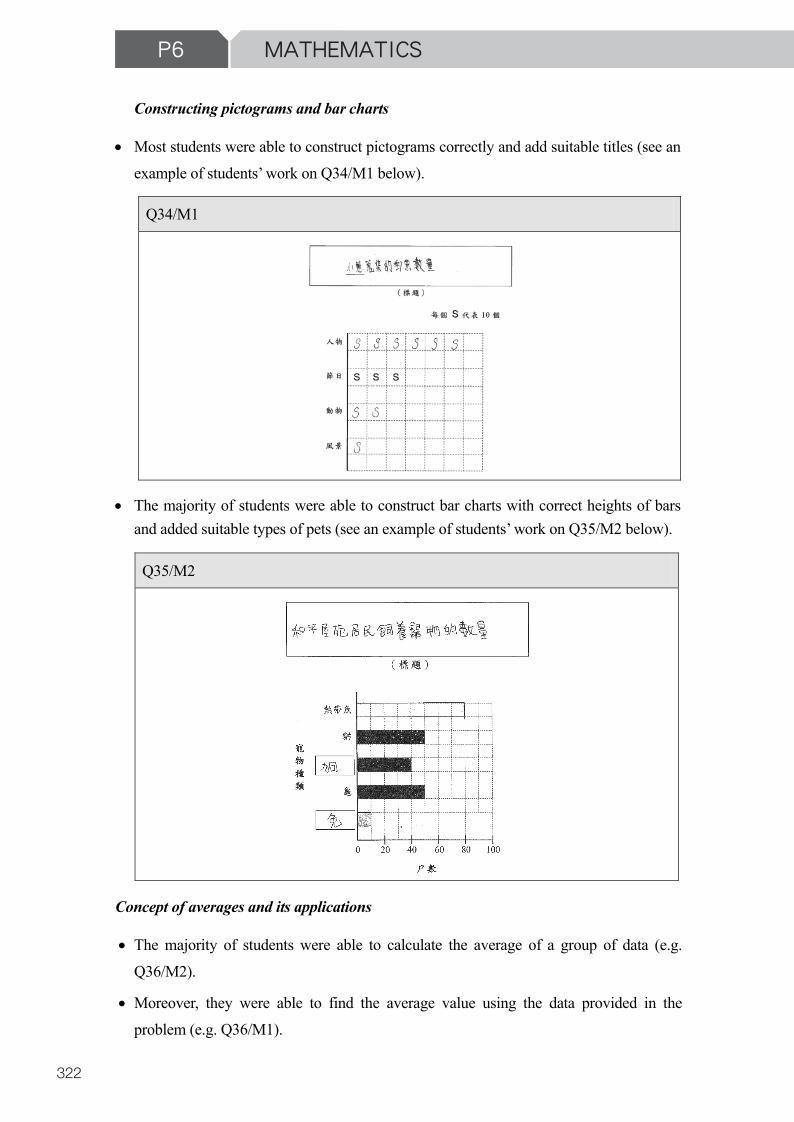
Most students were able to read the data from pictograms (e.g. Q34/M2) including those with greater frequency counts (see an example of students’ work on Q34/M4 below).
The majority of students were capable of extracting the data from bar charts, including those with greater frequency counts (e.g. Q35/M1, Q36/M3) except a small number of students who were not able to answer simple questions using the data.
Q31(b)/M1 Q31(b)/M2
Q34/M4
P6 MATHEMATICS
321
P6 MATHEMATICS
9
Some students confused 2-D shapes with 3-D shapes and wrongly chose the option A in Q29/M1 (see an example of students’ work below).
Most students recognized the characteristics of circles including the diameter (e.g. Q28(a)/M1).
Some students mixed up isosceles triangles with equilateral triangles (e.g. Q28(b)/M1).
Most students were able to identify rhombuses and trapeziums but a few confused parallelograms with trapeziums (e.g. Q26/M3).
Most students recognized the characteristics of rectangles including the number of right angles (see an example of students’ work on Q29/M2 below).
Most students were able to classify 2-D shapes(e.g. Q27/M3).
The eight compass points
The majority of students recognized the eight compass points (e.g. Q31(a)&(b)/M1). When the north direction was not pointing upward on the map, students could also locate the position of the reference point and identify the correct directions (e.g. Q31(a)/M2).
Q29/M1
Q29/M2
P6 MATHEMATICS
10
A small number of students wrote the wrong Chinese characters for the ‘south’ or ‘west’ directions (see the examples of students’ work below).
P.6 Data Handling Dimension
Students performed well in the Data Handling Dimension. The majority of students were capable of reading and drawing pictograms and bar charts. They correctly extracted the data given in statistical graphs in order to answer the questions. They were able to calculate the average of a group of data and solve problems of averages. Further comments on their performance are provided below with examples from different sub-papers quoted in brackets.
Reading and interpreting pictograms and bar charts
Most students were able to read the data from pictograms (e.g. Q34/M2) including those with greater frequency counts (see an example of students’ work on Q34/M4 below).
The majority of students were capable of extracting the data from bar charts, including those with greater frequency counts (e.g. Q35/M1, Q36/M3) except a small number of students who were not able to answer simple questions using the data.
Q31(b)/M1 Q31(b)/M2
Q34/M4
P6 MATHEMATICS
322
P6 MATHEMATICS
11
Constructing pictograms and bar charts
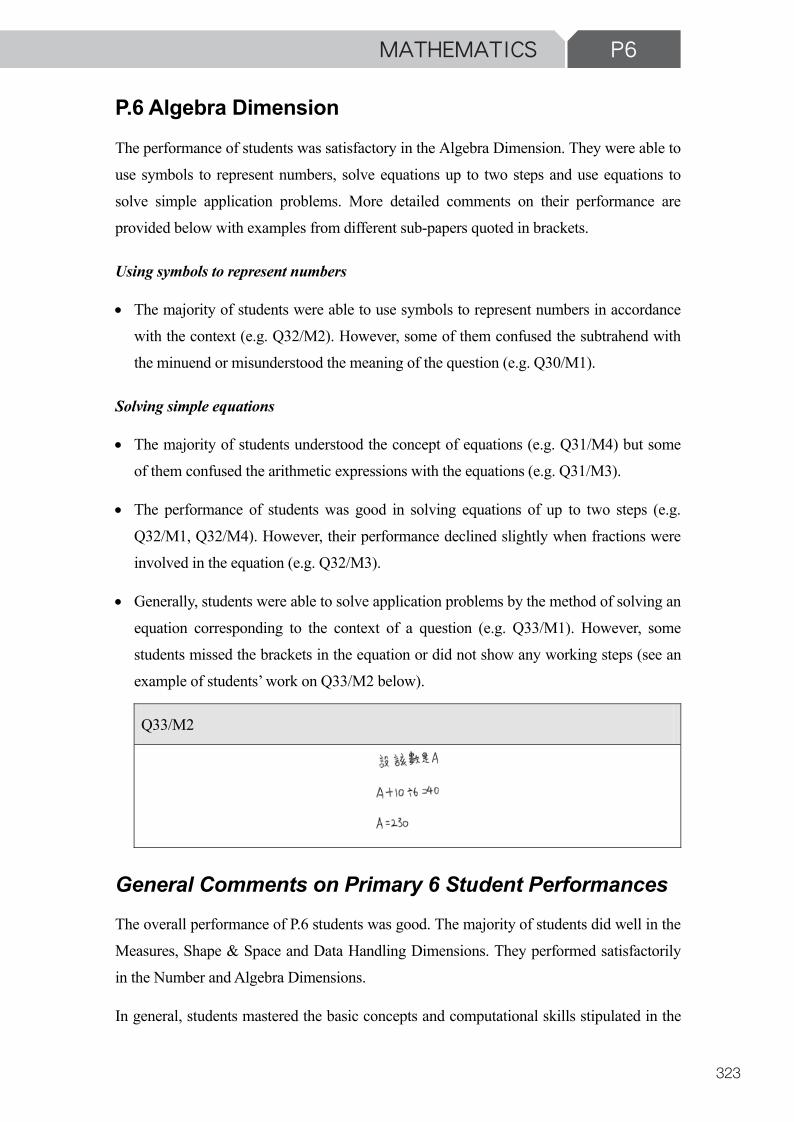
Most students were able to construct pictograms correctly and add suitable titles (see an example of students’ work on Q34/M1 below).
The majority of students were able to construct bar charts with correct heights of bars and added suitable types of pets (see an example of students’ work on Q35/M2 below).
Concept of averages and its applications
The majority of students were able to calculate the average of a group of data (e.g. Q36/M2).
Moreover, they were able to find the average value using the data provided in the problem (e.g. Q36/M1).
Q34/M1
Q35/M2
P6 MATHEMATICS
12
P.6 Algebra Dimension
The performance of students was satisfactory in the Algebra Dimension. They were able to use symbols to represent numbers, solve equations up to two steps and use equations to solve simple application problems. More detailed comments on their performance are provided below with examples from different sub-papers quoted in brackets.
Using symbols to represent numbers
The majority of students were able to use symbols to represent numbers in accordance with the context (e.g. Q32/M2). However, some of them confused the subtrahend with the minuend or misunderstood the meaning of the question (e.g. Q30/M1).
Solving simple equations
The majority of students understood the concept of equations (e.g. Q31/M4) but some of them confused the arithmetic expressions with the equations (e.g. Q31/M3).
The performance of students was good in solving equations of up to two steps (e.g. Q32/M1, Q32/M4). However, their performance declined slightly when fractions were involved in the equation (e.g. Q32/M3).
Generally, students were able to solve application problems by the method of solving an equation corresponding to the context of a question (e.g. Q33/M1). However, some students missed the brackets in the equation or did not show any working steps (see an example of students’ work on Q33/M2 below).
Q33/M2
General Comments on Primary 6 Student Performances
The overall performance of P.6 students was good. The majority of students did well in the Measures, Shape & Space and Data Handling Dimensions. They performed satisfactorily in the Number and Algebra Dimensions.
In general, students mastered the basic concepts and computational skills stipulated in the
P6 MATHEMATICS
323
P6 MATHEMATICS
11
Constructing pictograms and bar charts
Most students were able to construct pictograms correctly and add suitable titles (see an example of students’ work on Q34/M1 below).
The majority of students were able to construct bar charts with correct heights of bars and added suitable types of pets (see an example of students’ work on Q35/M2 below).
Concept of averages and its applications
The majority of students were able to calculate the average of a group of data (e.g. Q36/M2).
Moreover, they were able to find the average value using the data provided in the problem (e.g. Q36/M1).
Q34/M1
Q35/M2
P6 MATHEMATICS
12
P.6 Algebra Dimension
The performance of students was satisfactory in the Algebra Dimension. They were able to use symbols to represent numbers, solve equations up to two steps and use equations to solve simple application problems. More detailed comments on their performance are provided below with examples from different sub-papers quoted in brackets.
Using symbols to represent numbers
The majority of students were able to use symbols to represent numbers in accordance with the context (e.g. Q32/M2). However, some of them confused the subtrahend with the minuend or misunderstood the meaning of the question (e.g. Q30/M1).
Solving simple equations
The majority of students understood the concept of equations (e.g. Q31/M4) but some of them confused the arithmetic expressions with the equations (e.g. Q31/M3).
The performance of students was good in solving equations of up to two steps (e.g. Q32/M1, Q32/M4). However, their performance declined slightly when fractions were involved in the equation (e.g. Q32/M3).
Generally, students were able to solve application problems by the method of solving an equation corresponding to the context of a question (e.g. Q33/M1). However, some students missed the brackets in the equation or did not show any working steps (see an example of students’ work on Q33/M2 below).
Q33/M2
General Comments on Primary 6 Student Performances
The overall performance of P.6 students was good. The majority of students did well in the Measures, Shape & Space and Data Handling Dimensions. They performed satisfactorily in the Number and Algebra Dimensions.
In general, students mastered the basic concepts and computational skills stipulated in the
P6 MATHEMATICS
324
P6 MATHEMATICS
13
document Basic Competency at the end of KS2 for the Mathematics Curriculum (Trial
Version). For instance, they understood the concepts of fractions, decimals and percentages, and performed the arithmetic operations correctly. However, some students were weak in basic concepts such as confusing the common factors and commons multiples of two numbers, the tenths and hundredths places of a decimal. They need to deepen understanding of the relationship between the capacity and the volume, the relationship between the circumference and the diameter of a circle as well as the techniques of solving equations.
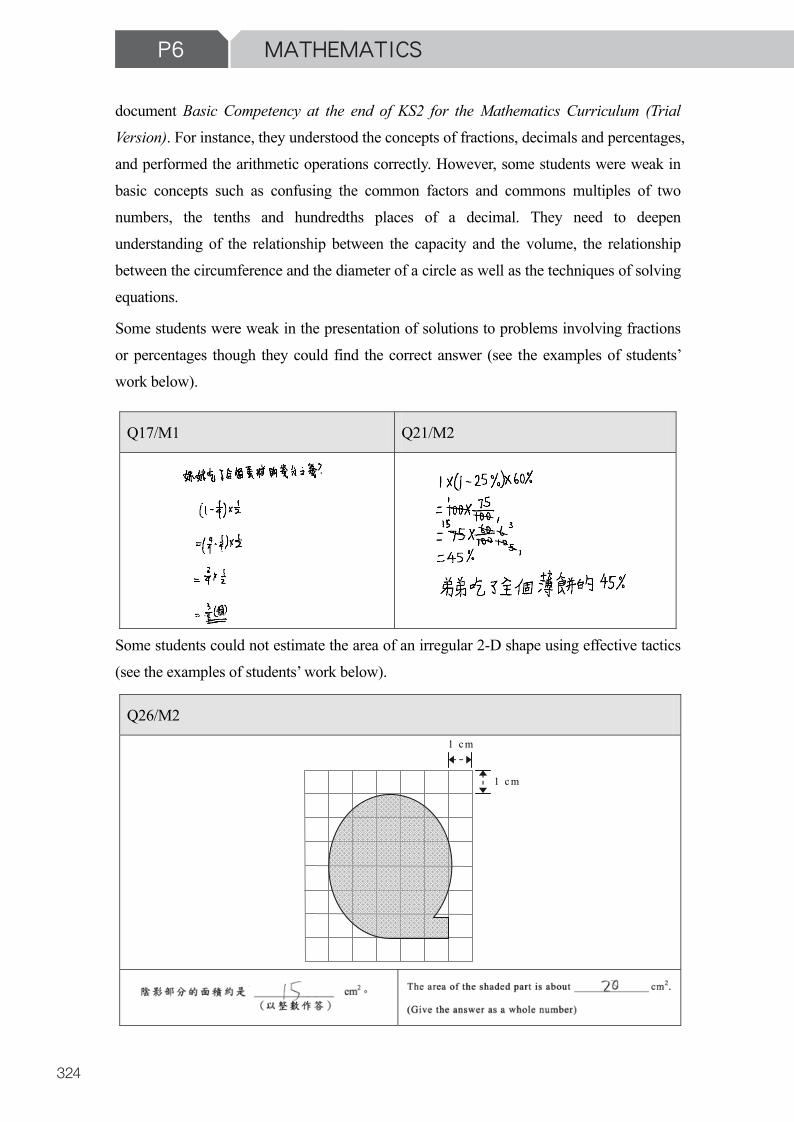
Some students were weak in the presentation of solutions to problems involving fractions or percentages though they could find the correct answer (see the examples of students’ work below).
Some students could not estimate the area of an irregular 2-D shape using effective tactics (see the examples of students’ work below).
Q26/M2
Q17/M1 Q21/M2
1 c m
1 c m
P6 MATHEMATICS
14
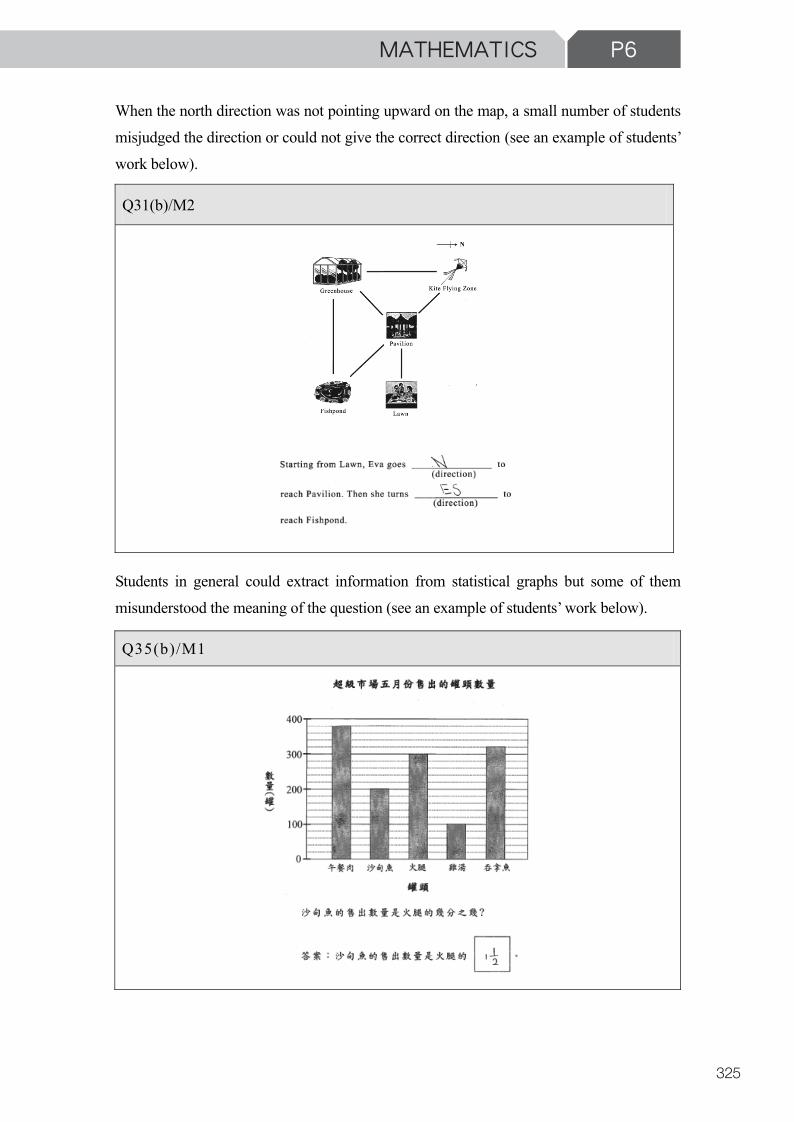
When the north direction was not pointing upward on the map, a small number of students misjudged the direction or could not give the correct direction (see an example of students’ work below).
Students in general could extract information from statistical graphs but some of them misunderstood the meaning of the question (see an example of students’ work below).
Q31(b)/M2
Q35(b)/M1
P6 MATHEMATICS
325
P6 MATHEMATICS
13
document Basic Competency at the end of KS2 for the Mathematics Curriculum (Trial
Version). For instance, they understood the concepts of fractions, decimals and percentages, and performed the arithmetic operations correctly. However, some students were weak in basic concepts such as confusing the common factors and commons multiples of two numbers, the tenths and hundredths places of a decimal. They need to deepen understanding of the relationship between the capacity and the volume, the relationship between the circumference and the diameter of a circle as well as the techniques of solving equations.
Some students were weak in the presentation of solutions to problems involving fractions or percentages though they could find the correct answer (see the examples of students’ work below).
Some students could not estimate the area of an irregular 2-D shape using effective tactics (see the examples of students’ work below).
Q26/M2
Q17/M1 Q21/M2
1 c m
1 c m
P6 MATHEMATICS
14
When the north direction was not pointing upward on the map, a small number of students misjudged the direction or could not give the correct direction (see an example of students’ work below).
Students in general could extract information from statistical graphs but some of them misunderstood the meaning of the question (see an example of students’ work below).
Q31(b)/M2
Q35(b)/M1
P6 MATHEMATICS
326
P6 MATHEMATICS
15
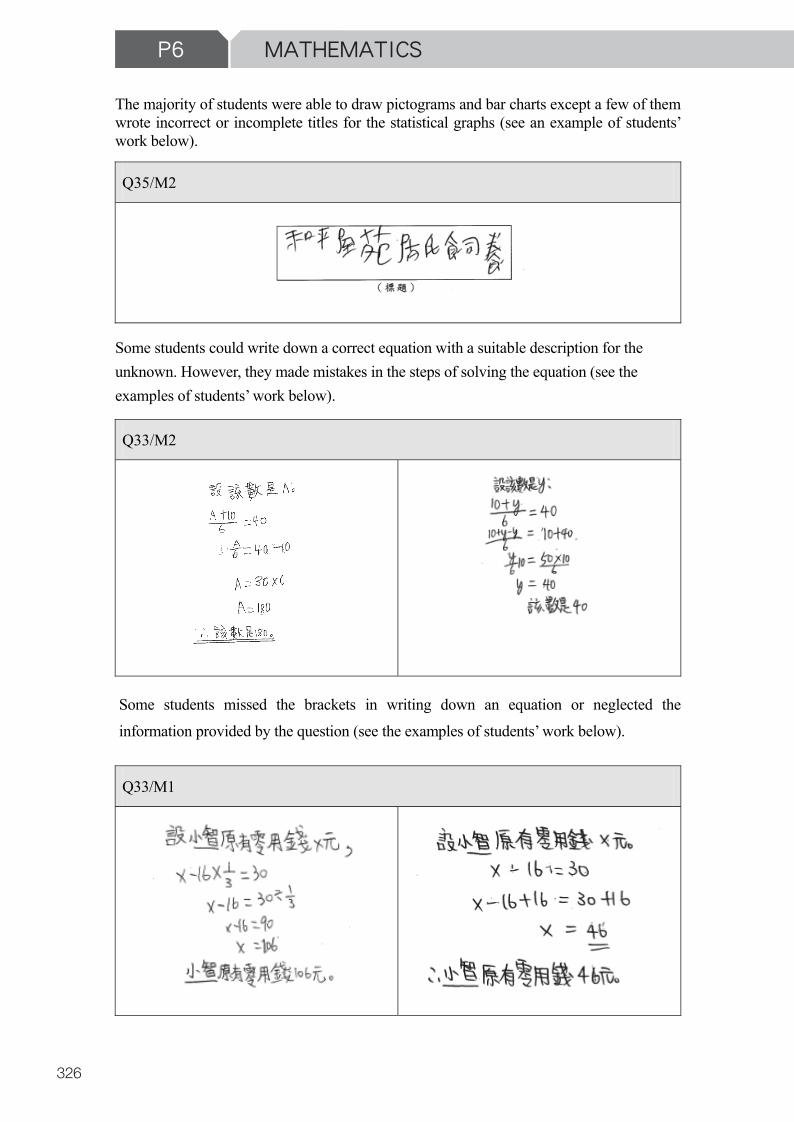
The majority of students were able to draw pictograms and bar charts except a few of them wrote incorrect or incomplete titles for the statistical graphs (see an example of students’ work below).
Q35/M2
Some students could write down a correct equation with a suitable description for the unknown. However, they made mistakes in the steps of solving the equation (see the examples of students’ work below).
Q33/M2
Some students missed the brackets in writing down an equation or neglected the information provided by the question (see the examples of students’ work below).
Q33/M1
P6 MATHEMATICS
16
Good Performance of Primary 6 Students in Territory-wide System Assessment 2017
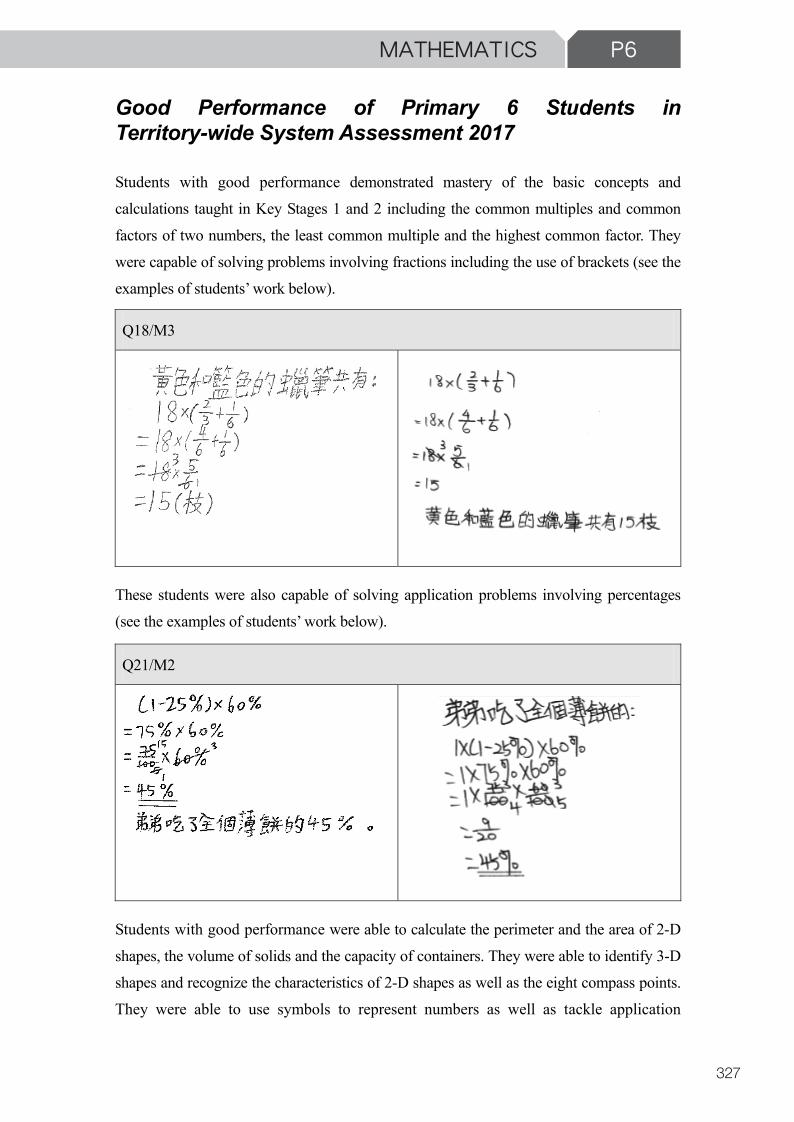
Students with good performance demonstrated mastery of the basic concepts and calculations taught in Key Stages 1 and 2 including the common multiples and common factors of two numbers, the least common multiple and the highest common factor. They were capable of solving problems involving fractions including the use of brackets (see the examples of students’ work below).
Q18/M3
These students were also capable of solving application problems involving percentages (see the examples of students’ work below).
Q21/M2
Students with good performance were able to calculate the perimeter and the area of 2-D shapes, the volume of solids and the capacity of containers. They were able to identify 3-D shapes and recognize the characteristics of 2-D shapes as well as the eight compass points. They were able to use symbols to represent numbers as well as tackle application
P6 MATHEMATICS
327
P6 MATHEMATICS
15
The majority of students were able to draw pictograms and bar charts except a few of them wrote incorrect or incomplete titles for the statistical graphs (see an example of students’ work below).
Q35/M2
Some students could write down a correct equation with a suitable description for the unknown. However, they made mistakes in the steps of solving the equation (see the examples of students’ work below).
Q33/M2
Some students missed the brackets in writing down an equation or neglected the information provided by the question (see the examples of students’ work below).
Q33/M1
P6 MATHEMATICS
16
Good Performance of Primary 6 Students in Territory-wide System Assessment 2017
Students with good performance demonstrated mastery of the basic concepts and calculations taught in Key Stages 1 and 2 including the common multiples and common factors of two numbers, the least common multiple and the highest common factor. They were capable of solving problems involving fractions including the use of brackets (see the examples of students’ work below).
Q18/M3
These students were also capable of solving application problems involving percentages (see the examples of students’ work below).
Q21/M2
Students with good performance were able to calculate the perimeter and the area of 2-D shapes, the volume of solids and the capacity of containers. They were able to identify 3-D shapes and recognize the characteristics of 2-D shapes as well as the eight compass points. They were able to use symbols to represent numbers as well as tackle application
P6 MATHEMATICS
328
P6 MATHEMATICS
17
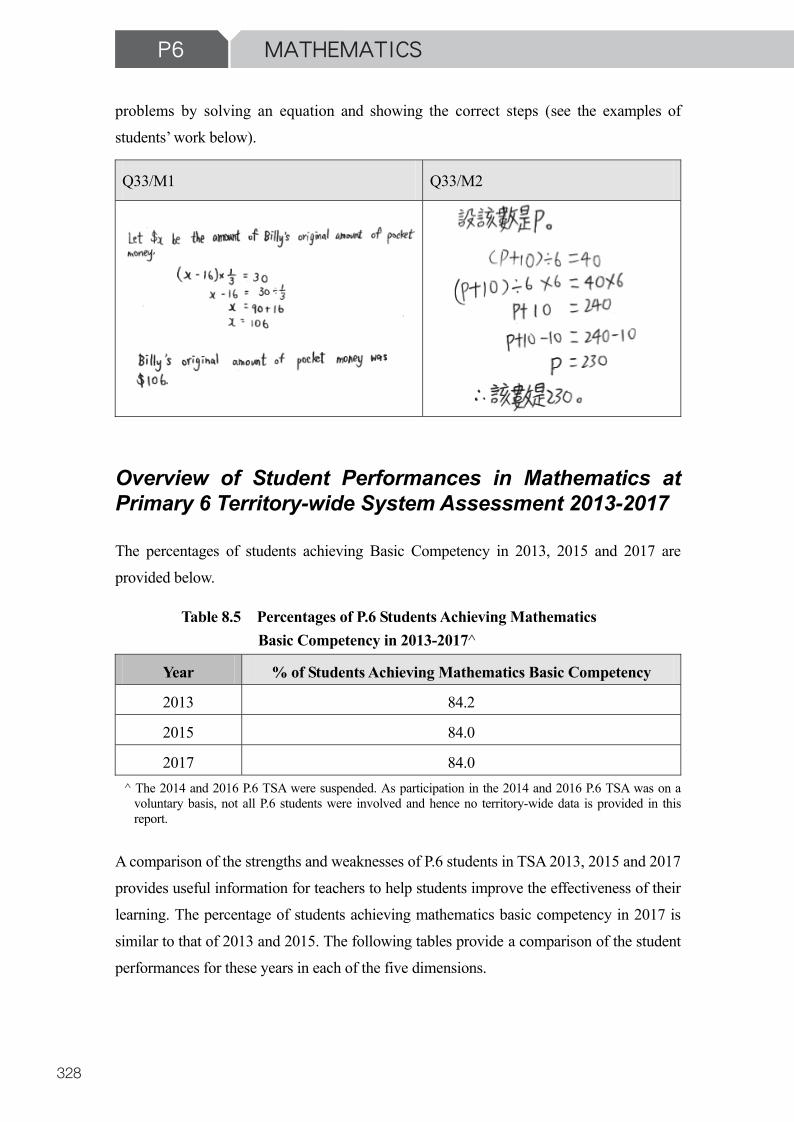
problems by solving an equation and showing the correct steps (see the examples of students’ work below).
Q33/M1 Q33/M2
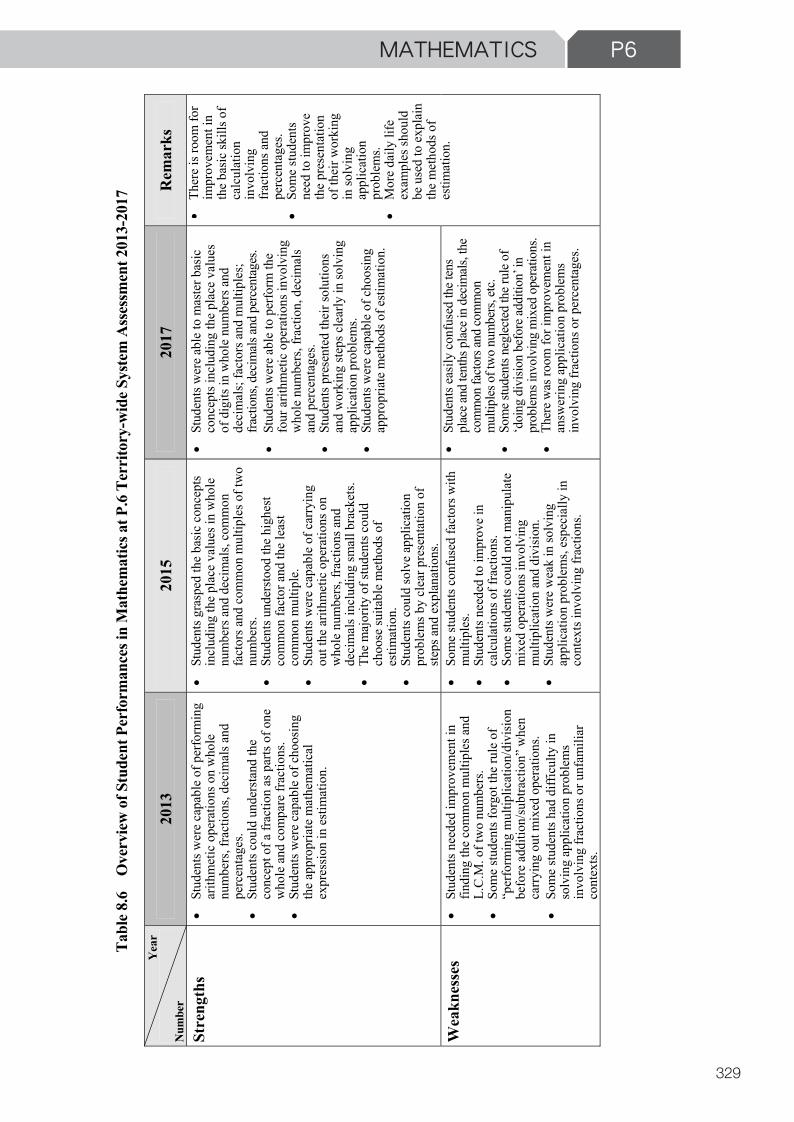
Overview of Student Performances in Mathematics at Primary 6 Territory-wide System Assessment 2013-2017
The percentages of students achieving Basic Competency in 2013, 2015 and 2017 are provided below.
Table 8.5 Percentages of P.6 Students Achieving Mathematics Basic Competency in 2013-2017^
Year % of Students Achieving Mathematics Basic Competency
2013 84.2
2015 84.0
2017 84.0 ^ The 2014 and 2016 P.6 TSA were suspended. As participation in the 2014 and 2016 P.6 TSA was on a
voluntary basis, not all P.6 students were involved and hence no territory-wide data is provided in this report.
A comparison of the strengths and weaknesses of P.6 students in TSA 2013, 2015 and 2017 provides useful information for teachers to help students improve the effectiveness of their learning. The percentage of students achieving mathematics basic competency in 2017 is similar to that of 2013 and 2015. The following tables provide a comparison of the student performances for these years in each of the five dimensions.
P6 MATHEMATICS
329
P6 MATHEMATICS
17
problems by solving an equation and showing the correct steps (see the examples of students’ work below).
Q33/M1 Q33/M2
Overview of Student Performances in Mathematics at Primary 6 Territory-wide System Assessment 2013-2017
The percentages of students achieving Basic Competency in 2013, 2015 and 2017 are provided below.
Table 8.5 Percentages of P.6 Students Achieving Mathematics Basic Competency in 2013-2017^
Year % of Students Achieving Mathematics Basic Competency
2013 84.2
2015 84.0
2017 84.0 ^ The 2014 and 2016 P.6 TSA were suspended. As participation in the 2014 and 2016 P.6 TSA was on a
voluntary basis, not all P.6 students were involved and hence no territory-wide data is provided in this report.
A comparison of the strengths and weaknesses of P.6 students in TSA 2013, 2015 and 2017 provides useful information for teachers to help students improve the effectiveness of their learning. The percentage of students achieving mathematics basic competency in 2017 is similar to that of 2013 and 2015. The following tables provide a comparison of the student performances for these years in each of the five dimensions.
P6 M
ATH
EMAT
ICS
18
Tabl
e 8.6
O
verv
iew
of S
tude
nt P
erfo
rman
ces i
n M
athe
mat
ics a
t P.6
Ter
rito
ry-w
ide S
yste
m A
sses
smen
t 201
3-20
17
Yea
r
Num
ber
2013
20
15
2017
R
emar
ks
Stre
ngth
s
Stud
ents
wer
e ca
pabl
e of
per
form
ing
arith
met
ic o
pera
tions
on
who
le
num
bers
, fra
ctio
ns, d
ecim
als a
nd
perc
enta
ges.
St
uden
ts co
uld
unde
rsta
nd th
e co
ncep
t of a
frac
tion
as p
arts
of o
ne
who
le a
nd c
ompa
re fr
actio
ns.
St
uden
ts w
ere
capa
ble
of c
hoos
ing
the
appr
opria
te m
athe
mat
ical
ex
pres
sion
in e
stim
atio
n.
St
uden
ts gr
aspe
d th
e ba
sic c
once
pts
incl
udin
g th
e pl
ace
valu
es in
who
le
num
bers
and
dec
imal
s, co
mm
on
fact
ors a
nd c
omm
on m
ultip
les o
f tw
o nu
mbe
rs.
St
uden
ts un
ders
tood
the
high
est
com
mon
fact
or a
nd th
e le
ast
com
mon
mul
tiple
.
Stud
ents
wer
e ca
pabl
e of
car
ryin
g ou
t the
arit
hmet
ic o
pera
tions
on
who
le n
umbe
rs, f
ract
ions
and
de
cim
als i
nclu
ding
smal
l bra
cket
s.
The
maj
ority
of s
tude
nts c
ould
ch
oose
suita
ble
met
hods
of
estim
atio
n.
St
uden
ts co
uld
solv
e ap
plic
atio
n pr
oble
ms b
y cl
ear p
rese
ntat
ion
of
steps
and
exp
lana
tions
.
St
uden
ts w
ere
able
to m
aste
r bas
ic
conc
epts
incl
udin
g th
e pl
ace
valu
es
of d
igits
in w
hole
num
bers
and
de
cim
als;
fact
ors a
nd m
ultip
les;
fract
ions
, dec
imal
s and
per
cent
ages
.
Stud
ents
wer
e ab
le to
per
form
the
four
arit
hmet
ic o
pera
tions
invo
lvin
g w
hole
num
bers
, fra
ctio
n, d
ecim
als
and
perc
enta
ges.
St
uden
ts pr
esen
ted
thei
r sol
utio
ns
and
wor
king
step
s cle
arly
in so
lvin
g ap
plic
atio
n pr
oble
ms.
St
uden
ts w
ere
capa
ble
of c
hoos
ing
appr
opria
te m
etho
ds o
f esti
mat
ion.
Th
ere
is ro
om fo
r im
prov
emen
t in
the
basic
skill
s of
calc
ulat
ion
invo
lvin
g fra
ctio
ns a
nd
perc
enta
ges.
So
me
stude
nts
need
to im
prov
e th
e pr
esen
tatio
n of
thei
r wor
king
in
solv
ing
appl
icat
ion
prob
lem
s.
Mor
e da
ily li
fe
exam
ples
shou
ld
be u
sed
to e
xpla
in
the
met
hods
of
estim
atio
n.
W
eakn
esse
s
Stud
ents
need
ed im
prov
emen
t in
findi
ng th
e co
mm
on m
ultip
les a
nd
L.C.
M. o
f tw
o nu
mbe
rs.
So
me
stude
nts f
orgo
t the
rule
of
“per
form
ing
mul
tiplic
atio
n/di
visio
n be
fore
add
ition
/subt
ract
ion”
whe
n ca
rryin
g ou
t mix
ed o
pera
tions
.
Som
e stu
dent
s had
diff
icul
ty in
so
lvin
g ap
plic
atio
n pr
oble
ms
invo
lvin
g fra
ctio
ns o
r unf
amili
ar
cont
exts.
So
me
stude
nts c
onfu
sed
fact
ors w
ith
mul
tiple
s.
St
uden
ts ne
eded
to im
prov
e in
ca
lcul
atio
ns o
f fra
ctio
ns.
So
me
stude
nts c
ould
not
man
ipul
ate
mix
ed o
pera
tions
invo
lvin
g m
ultip
licat
ion
and
divi
sion.
Stud
ents
wer
e w
eak
in so
lvin
g ap
plic
atio
n pr
oble
ms,
espe
cial
ly in
co
ntex
ts in
volv
ing
fract
ions
.
St
uden
tsea
sily
conf
used
the t
ens
plac
e and
tent
hs p
lace
in d
ecim
als,
the
com
mon
fact
ors a
nd co
mm
on
mul
tiple
s of t
wo
num
bers
, etc
.
Som
e stu
dent
s neg
lect
ed th
e rul
e of
‘doi
ng d
ivisi
on b
efor
e add
ition
’ in
prob
lem
s inv
olvi
ng m
ixed
ope
ratio
ns.
Th
ere w
as ro
om fo
r im
prov
emen
t in
answ
erin
g ap
plic
atio
n pr
oble
ms
invo
lvin
g fra
ctio
ns o
r per
cent
ages
.
P6 MATHEMATICS
330
P6 M
ATH
EMAT
ICS
19
Yea
r
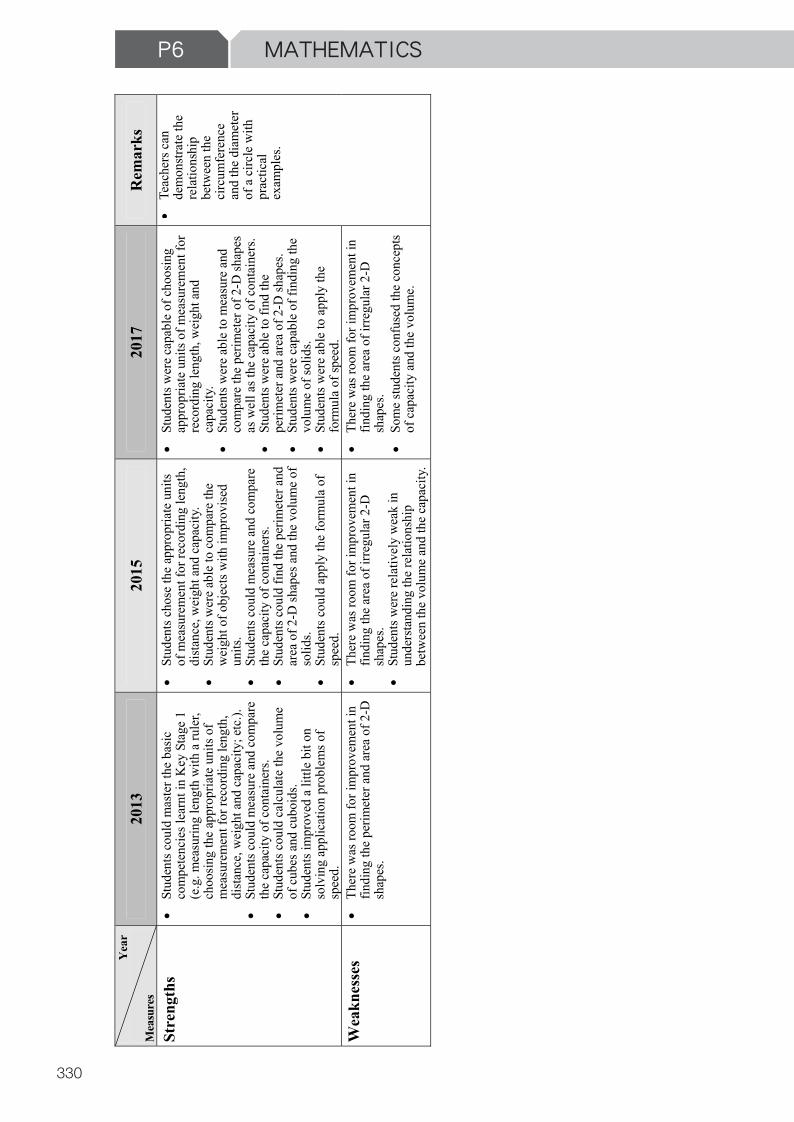
Mea
sure
s 20
13
2015
20
17
Rem
arks
Stre
ngth
s
Stud
ents
coul
d m
aste
r the
bas
ic
com
pete
ncie
s lea
rnt i
n K
ey S
tage
1
(e.g
. mea
surin
g le
ngth
with
a ru
ler,
choo
sing
the
appr
opria
te u
nits
of
mea
sure
men
t for
reco
rdin
g le
ngth
, di
stanc
e, w
eigh
t and
cap
acity
; etc
.).
St
uden
ts co
uld
mea
sure
and
com
pare
th
e ca
paci
ty o
f con
tain
ers.
St
uden
ts co
uld
calc
ulat
e th
e vo
lum
e of
cub
es a
nd c
uboi
ds.
St
uden
ts im
prov
ed a
littl
e bi
t on
solv
ing
appl
icat
ion
prob
lem
s of
spee
d.
St
uden
ts ch
ose
the
appr
opria
te u
nits
of m
easu
rem
ent f
or re
cord
ing
leng
th,
dista
nce,
wei
ght a
nd c
apac
ity.
Stud
ents
wer
e ab
le to
com
pare
the
wei
ght o
f obj
ects
with
impr
ovise
d un
its.
St
uden
ts co
uld
mea
sure
and
com
pare
th
e ca
paci
ty o
f con
tain
ers.
St
uden
ts co
uld
find
the
perim
eter
and
ar
ea o
f 2-D
shap
es a
nd th
e vo
lum
e of
so
lids.
St
uden
ts co
uld
appl
y th
e fo
rmul
a of
sp
eed.
St
uden
ts w
ere
capa
ble
of c
hoos
ing
appr
opria
te u
nits
of m
easu
rem
ent f
or
reco
rdin
g le
ngth
, wei
ght a
nd
capa
city
.
St
uden
ts w
ere
able
to m
easu
re a
nd
com
pare
the
perim
eter
of 2
-D sh
apes
as
wel
l as t
he c
apac
ity o
f con
tain
ers.
St
uden
ts w
ere
able
to fi
nd th
e pe
rimet
er a
nd a
rea
of 2
-D sh
apes
.
Stud
ents
wer
e ca
pabl
e of
find
ing
the
volu
me
of so
lids.
St
uden
ts w
ere
able
to a
pply
the
form
ula
of sp
eed.
Te
ache
rs c
an
dem
onstr
ate
the
rela
tions
hip
betw
een
the
circ
umfe
renc
e an
d th
e di
amet
er
of a
circ
le w
ith
prac
tical
ex
ampl
es.
Wea
knes
ses
Th
ere
was
room
for i
mpr
ovem
ent i
n fin
ding
the
perim
eter
and
are
a of
2-D
sh
apes
.
Th
ere
was
room
for i
mpr
ovem
ent i
n fin
ding
the
area
of i
rregu
lar 2
-D
shap
es.
St
uden
ts w
ere
rela
tivel
y w
eak
in
unde
rsta
ndin
g th
e re
latio
nshi
p be
twee
n th
e vo
lum
e an
d th
e ca
paci
ty.
Th
ere
was
room
for i
mpr
ovem
ent i
n fin
ding
the
area
of i
rregu
lar 2
-D
shap
es.
Som
e stu
dent
s con
fuse
d th
e co
ncep
ts of
cap
acity
and
the
volu
me.
P6 MATHEMATICS
331
P6 M
ATH
EMAT
ICS
20
Yea
r
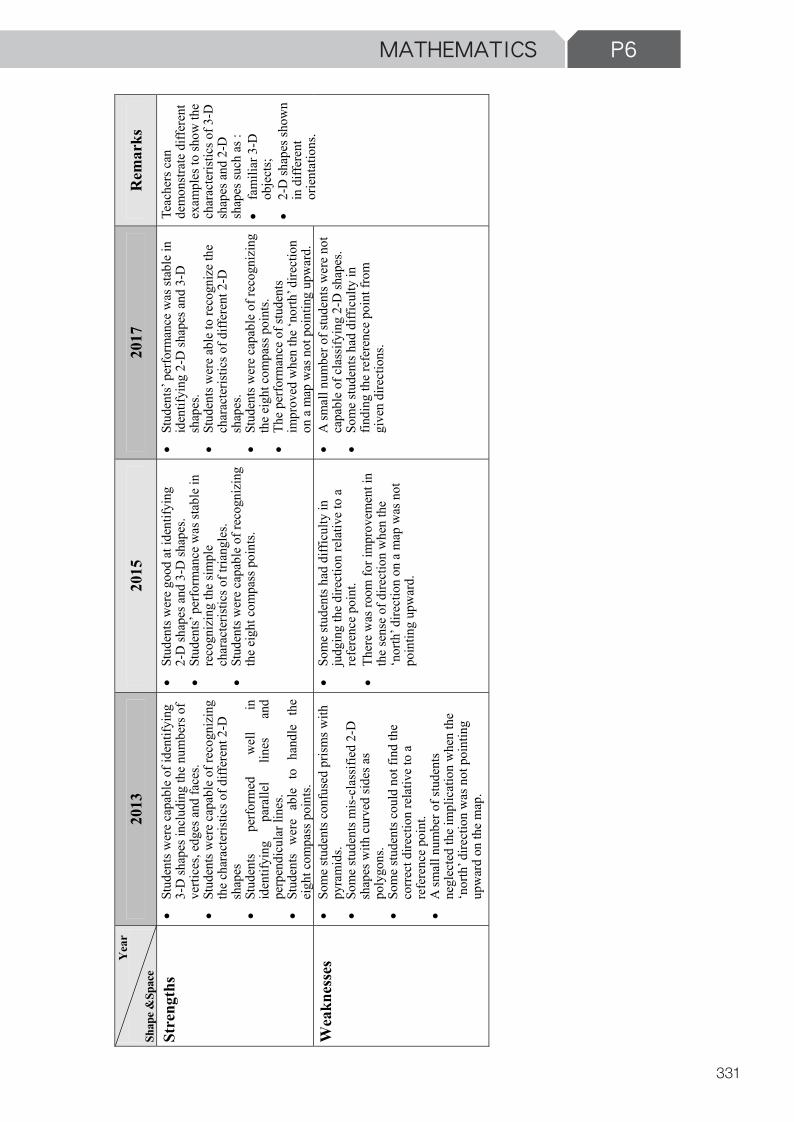
Shap
e &Sp
ace
2013
20
15
2017
R
emar
ks
Stre
ngth
s
Stud
ents
wer
e ca
pabl
e of
iden
tifyi
ng
3-D
shap
es in
clud
ing
the
num
bers
of
verti
ces,
edge
s and
face
s.
St
uden
ts w
ere
capa
ble
of re
cogn
izin
g th
e ch
arac
teris
tics o
f diff
eren
t 2-D
sh
apes
Stud
ents
perfo
rmed
w
ell
in
iden
tifyi
ng
para
llel
lines
an
d pe
rpen
dicu
lar l
ines
.
Stud
ents
wer
e ab
le t
o ha
ndle
the
ei
ght c
ompa
ss p
oint
s.
St
uden
ts w
ere
good
at i
dent
ifyin
g 2-
D sh
apes
and
3-D
shap
es.
St
uden
ts’ p
erfo
rman
ce w
as st
able
in
reco
gniz
ing
the
simpl
e ch
arac
teris
tics o
f tria
ngle
s.
Stud
ents
wer
e ca
pabl
e of
reco
gniz
ing
the
eigh
t com
pass
poi
nts.
St
uden
ts’ p
erfo
rman
ce w
as st
able
in
iden
tifyi
ng 2
-D sh
apes
and
3-D
sh
apes
.
Stud
ents
wer
e ab
le to
reco
gniz
e th
e ch
arac
teris
tics o
f diff
eren
t 2-D
sh
apes
.
Stud
ents
wer
e ca
pabl
e of
reco
gniz
ing
the
eigh
t com
pass
poi
nts.
The
perfo
rman
ce o
f stu
dent
s im
prov
ed w
hen
the
‘nor
th’ d
irect
ion
on a
map
was
not
poi
ntin
g up
war
d.
Teac
hers
can
de
mon
strat
e di
ffere
nt
exam
ples
to sh
ow th
e ch
arac
teris
tics o
f 3-D
sh
apes
and
2-D
sh
apes
such
as :
fam
iliar
3-D
ob
ject
s;
2-D
shap
es sh
own
in d
iffer
ent
orie
ntat
ions
.
Wea
knes
ses
So
me
stude
nts c
onfu
sed
prism
s with
py
ram
ids.
So
me
stude
nts m
is-cl
assif
ied
2-D
sh
apes
with
cur
ved
sides
as
poly
gons
.
Som
e stu
dent
s cou
ld n
ot fi
nd th
e co
rrect
dire
ctio
n re
lativ
e to
a
refe
renc
e po
int.
A
smal
l num
ber o
f stu
dent
s ne
glec
ted
the
impl
icat
ion
whe
n th
e ‘n
orth
’ dire
ctio
n w
as n
ot p
oint
ing
upw
ard
on th
e m
ap.
So
me
stude
nts h
ad d
iffic
ulty
in
judg
ing
the
dire
ctio
n re
lativ
e to
a
refe
renc
e po
int.
Th
ere
was
room
for i
mpr
ovem
ent i
n th
e se
nse
of d
irect
ion
whe
n th
e ‘n
orth
’ dire
ctio
n on
a m
ap w
as n
ot
poin
ting
upw
ard.
A
smal
l num
ber o
f stu
dent
s wer
e no
t ca
pabl
e of
cla
ssify
ing
2-D
shap
es.
So
me
stude
nts h
ad d
iffic
ulty
in
findi
ng th
e re
fere
nce
poin
t fro
m
give
n di
rect
ions
.
P6 MATHEMATICS
332
P6 M
ATH
EMAT
ICS
21
Yea
r
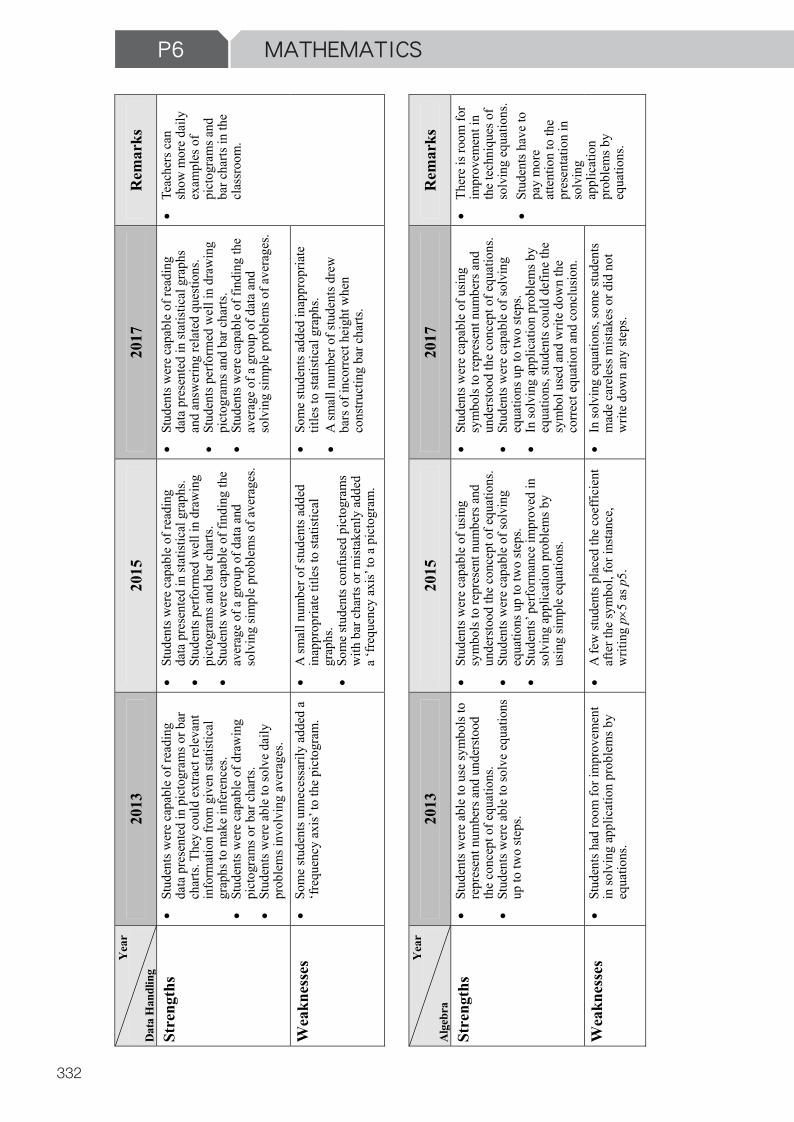
Dat
a H
andl
ing
2013
20
15
2017
R
emar
ks
Stre
ngth
s
Stud
ents
wer
e ca
pabl
e of
read
ing
data
pre
sent
ed in
pic
togr
ams o
r bar
ch
arts.
The
y co
uld
extra
ct re
leva
nt
info
rmat
ion
from
giv
en st
atist
ical
gr
aphs
to m
ake
infe
renc
es.
Stud
ents
wer
e ca
pabl
e of
dra
win
g pi
ctog
ram
s or b
ar c
harts
.
St
uden
ts w
ere
able
to so
lve
daily
pr
oble
ms i
nvol
ving
ave
rage
s.
St
uden
ts w
ere
capa
ble
of re
adin
g da
ta p
rese
nted
in st
atist
ical
gra
phs.
Stud
ents
perfo
rmed
wel
l in
draw
ing
pict
ogra
ms a
nd b
ar c
harts
.
Stud
ents
wer
e ca
pabl
e of
find
ing
the
aver
age
of a
gro
up o
f dat
a an
d so
lvin
g sim
ple
prob
lem
s of a
vera
ges.
St
uden
ts w
ere
capa
ble
of re
adin
g da
ta p
rese
nted
in st
atist
ical
gra
phs
and
answ
erin
g re
late
d qu
estio
ns.
St
uden
ts pe
rform
ed w
ell i
n dr
awin
g pi
ctog
ram
s and
bar
cha
rts.
St
uden
ts w
ere
capa
ble
of fi
ndin
g th
e av
erag
e of
a g
roup
of d
ata
and
solv
ing
simpl
e pr
oble
ms o
f ave
rage
s.
Te
ache
rs c
an
show
mor
e da
ily
exam
ples
of
pict
ogra
ms a
nd
bar c
harts
in th
e cl
assr
oom
.
Wea
knes
ses
So
me
stude
nts u
nnec
essa
rily
adde
d a
‘freq
uenc
y ax
is’ to
the
pict
ogra
m.
A
smal
l num
ber o
f stu
dent
s add
ed
inap
prop
riate
title
s to
statis
tical
gr
aphs
.
Som
e stu
dent
s con
fuse
d pi
ctog
ram
s w
ith b
ar c
harts
or m
istak
enly
add
ed
a ‘fr
eque
ncy
axis’
to a
pic
togr
am.
So
me
stude
nts a
dded
inap
prop
riate
tit
les t
o sta
tistic
al g
raph
s.
A sm
all n
umbe
r of s
tude
nts d
rew
ba
rs o
f inc
orre
ct h
eigh
t whe
n co
nstru
ctin
g ba
r cha
rts.
Y
ear
Alg
ebra
20
13
2015
20
17
Rem
arks
Stre
ngth
s
Stud
ents
wer
e ab
le to
use
sym
bols
to
repr
esen
t num
bers
and
und
ersto
od
the
conc
ept o
f equ
atio
ns.
St
uden
ts w
ere
able
to so
lve
equa
tions
up
to tw
o ste
ps.
St
uden
ts w
ere
capa
ble
of u
sing
sym
bols
to re
pres
ent n
umbe
rs a
nd
unde
rsto
od th
e co
ncep
t of e
quat
ions
.
Stud
ents
wer
e ca
pabl
e of
solv
ing
equa
tions
up
to tw
o ste
ps.
St
uden
ts’ p
erfo
rman
ce im
prov
ed in
so
lvin
g ap
plic
atio
n pr
oble
ms b
y us
ing
simpl
e eq
uatio
ns.
St
uden
ts w
ere
capa
ble
of u
sing
sym
bols
to re
pres
ent n
umbe
rs a
nd
unde
rsto
od th
e co
ncep
t of e
quat
ions
.
Stud
ents
wer
e ca
pabl
e of
solv
ing
equa
tions
up
to tw
o ste
ps.
In
solv
ing
appl
icat
ion
prob
lem
s by
equa
tions
, stu
dent
s cou
ld d
efin
e th
e sy
mbo
l use
d an
d w
rite
dow
n th
e co
rrect
equ
atio
n an
d co
nclu
sion.
Th
ere
is ro
om fo
r im
prov
emen
t in
the
tech
niqu
es o
f so
lvin
g eq
uatio
ns.
St
uden
ts ha
ve to
pa
y m
ore
atte
ntio
n to
the
pres
enta
tion
in
solv
ing
appl
icat
ion
prob
lem
s by
equa
tions
. W
eakn
esse
s
Stud
ents
had
room
for i
mpr
ovem
ent
in so
lvin
g ap
plic
atio
n pr
oble
ms b
y eq
uatio
ns.
A
few
stud
ents
plac
ed th
e co
effic
ient
af
ter t
he sy
mbo
l, fo
r ins
tanc
e,
writ
ing
p5
as p
5.
In
solv
ing
equa
tions
, som
e stu
dent
s m
ade
care
less
mist
akes
or d
id n
ot
writ
e do
wn
any
steps
.