1. 2 consolidated financials include: dei + dih + dni – inter-company interim consolidated numbers...
TRANSCRIPT

1
2
• Consolidated financials include: DEI + DIH + DNI – Inter-company
• Interim consolidated numbers are internal figures and reviewed by CPA
• Consolidated numbers are audited only at yearend
3
2003 Quarterly Results
4
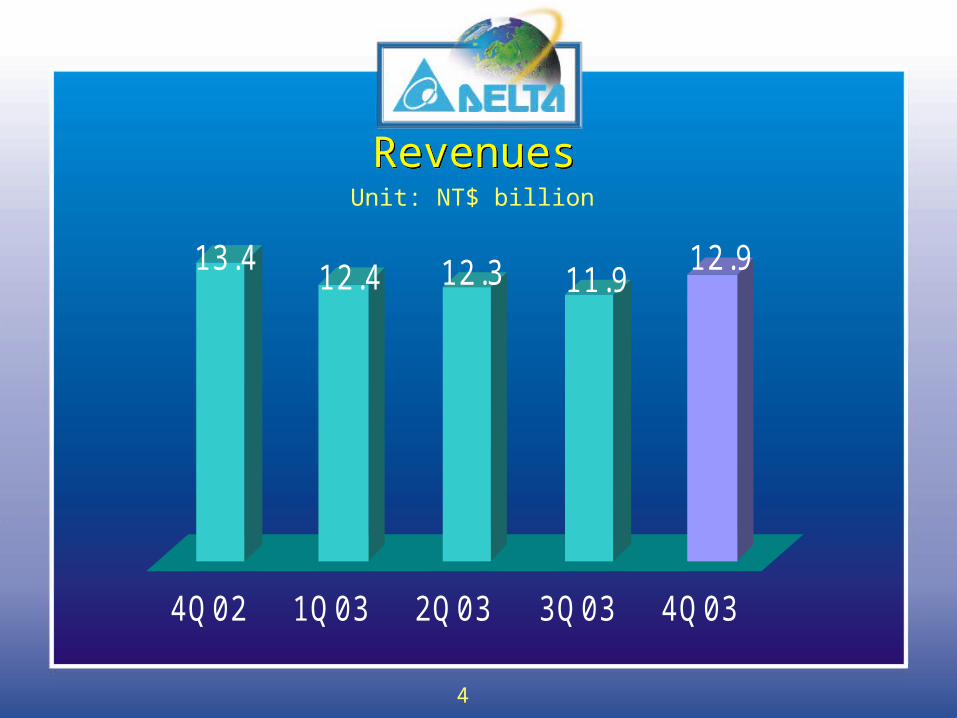
13.4 12.4 12.3 11.912.9
4Q02 1Q03 2Q03 3Q03 4Q03
RevenuesRevenuesUnit: NT$ billion
5
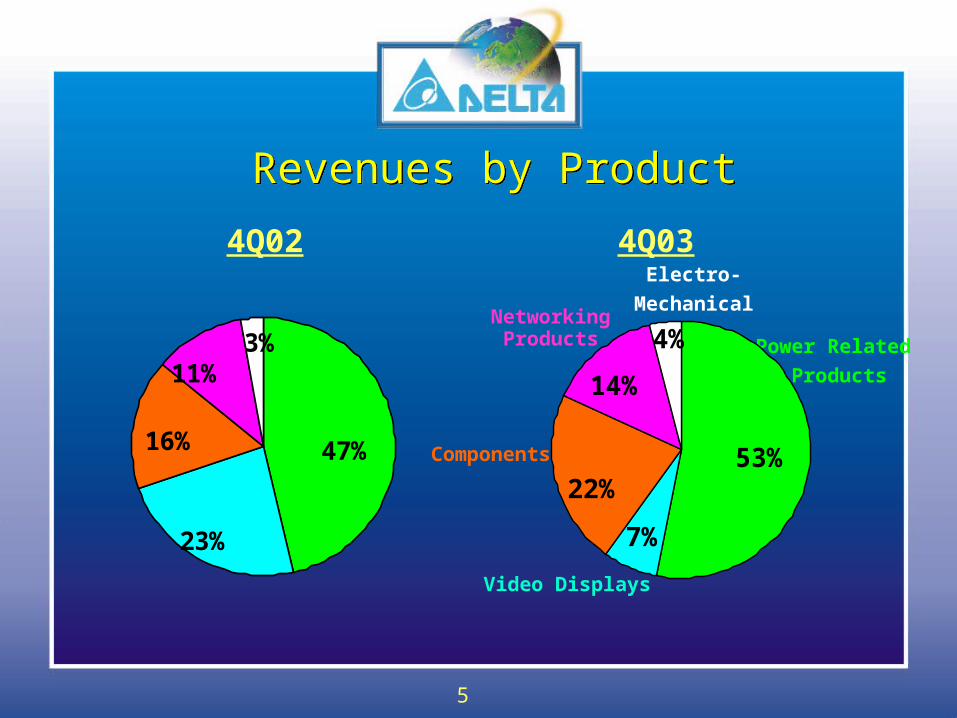
Power Related
Products
NetworkingProducts
Components
Video Displays
4Q02 4Q03
Revenues by ProductRevenues by Product
47%
3%11%
16%
23%
53%
7%
22%
14%
4%
Electro-
Mechanical
6
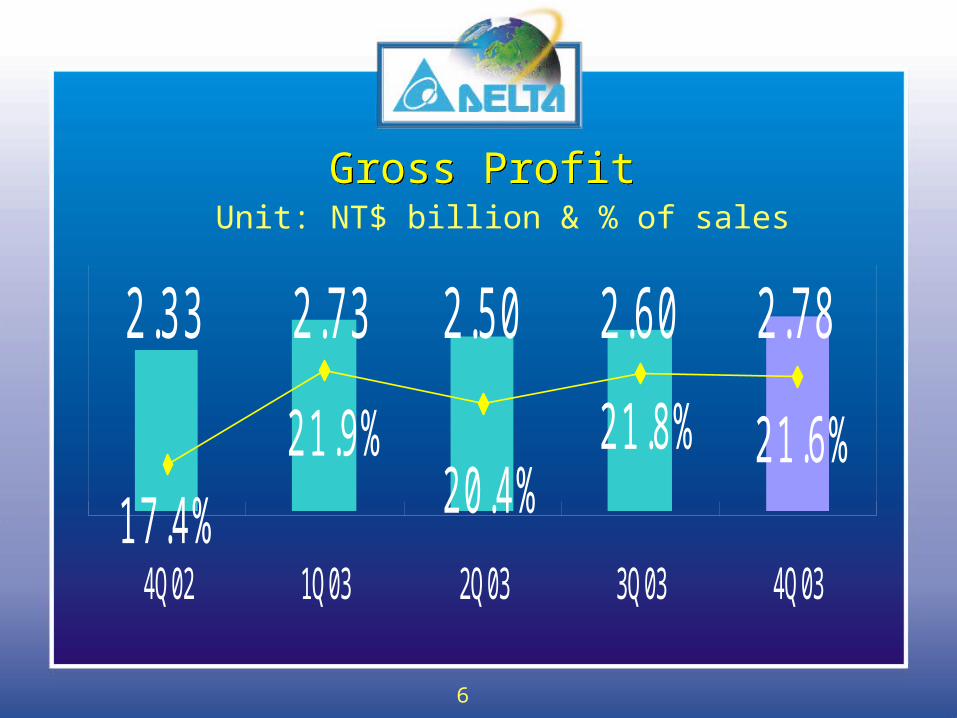
Gross ProfitGross ProfitUnit: NT$ billion & % of sales
2.33 2.50 2.60 2.782.73
21.6%21.8%20.4%
21.9%17.4%
4Q02 1Q03 2Q03 3Q03 4Q03
7
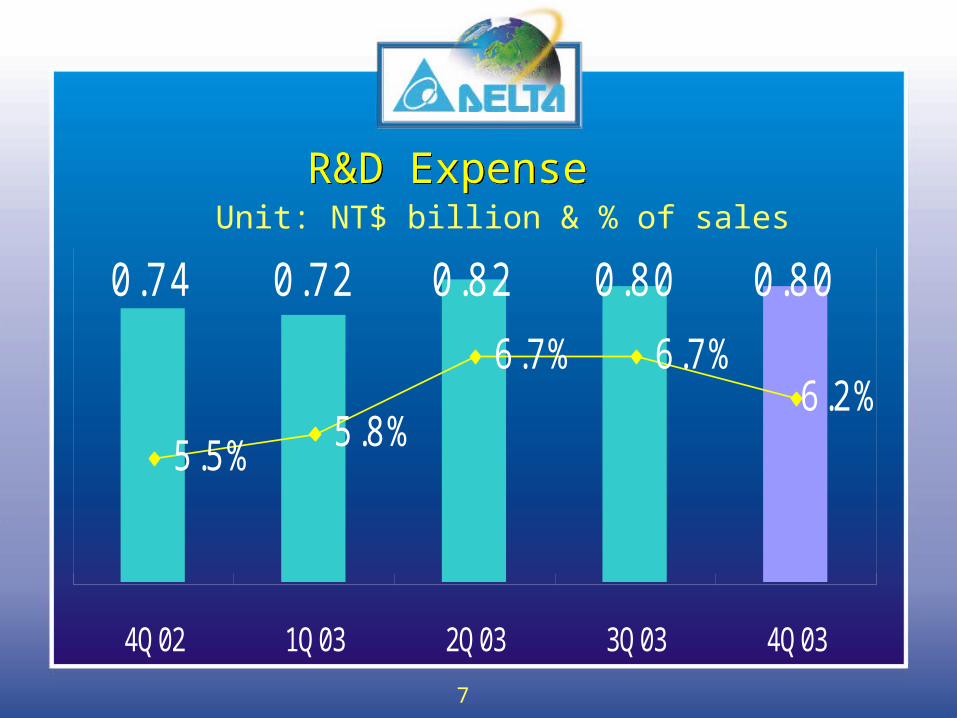
R&D ExpenseR&D ExpenseUnit: NT$ billion & % of sales
0.74 0.72 0.82 0.80 0.80
5.5% 5.8%
6.7% 6.7%6.2%
4Q02 1Q03 2Q03 3Q03 4Q03
8
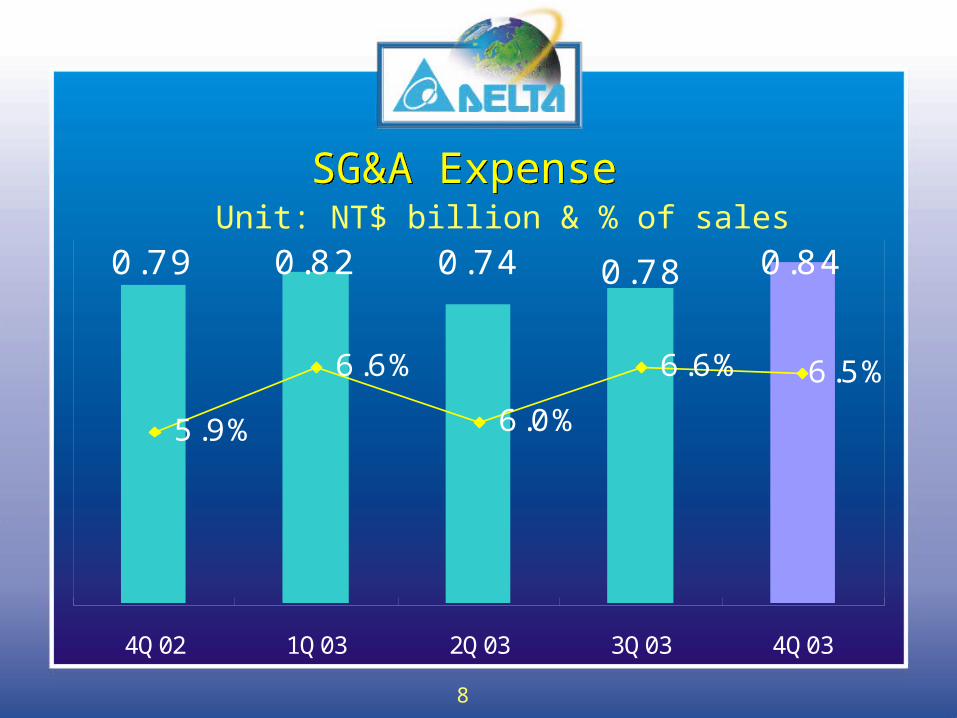
SG&A ExpenseSG&A ExpenseUnit: NT$ billion & % of sales
0.79 0.82 0.74 0.840.78
5.9%
6.6%
6.0%
6.6% 6.5%
4Q02 1Q03 2Q03 3Q03 4Q03
9
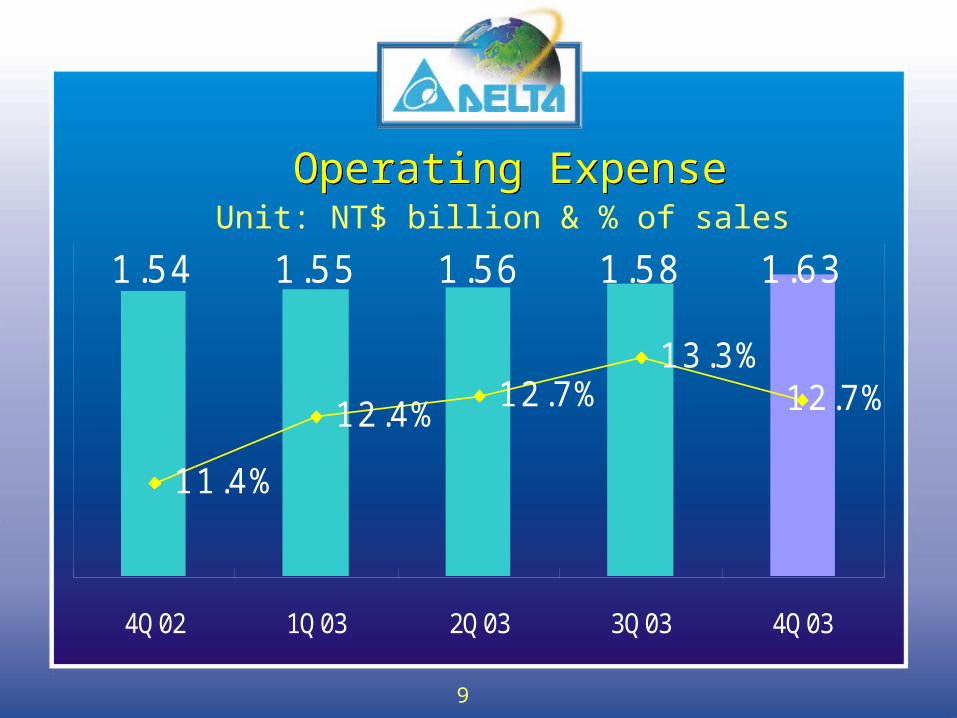
Operating ExpenseOperating ExpenseUnit: NT$ billion & % of sales
1.54 1.55 1.56 1.58 1.63
11.4%
12.4% 12.7%13.3%
12.7%
4Q02 1Q03 2Q03 3Q03 4Q03
10
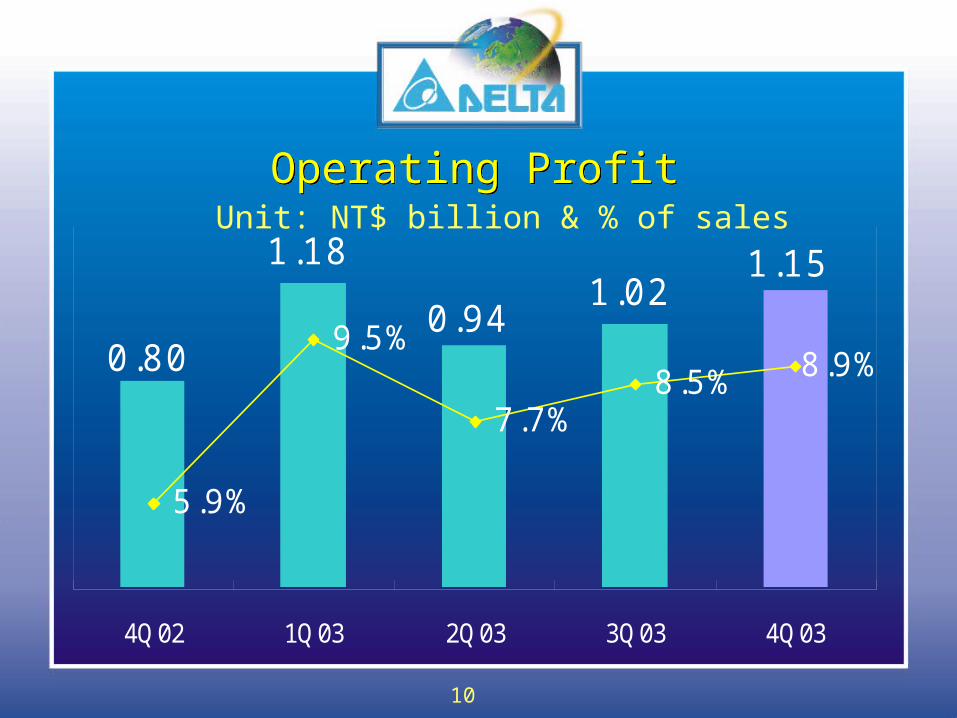
Operating ProfitOperating ProfitUnit: NT$ billion & % of sales
1.151.02
0.94
1.18
0.80
5.9%
9.5%
7.7%8.5% 8.9%
4Q02 1Q03 2Q03 3Q03 4Q03
11
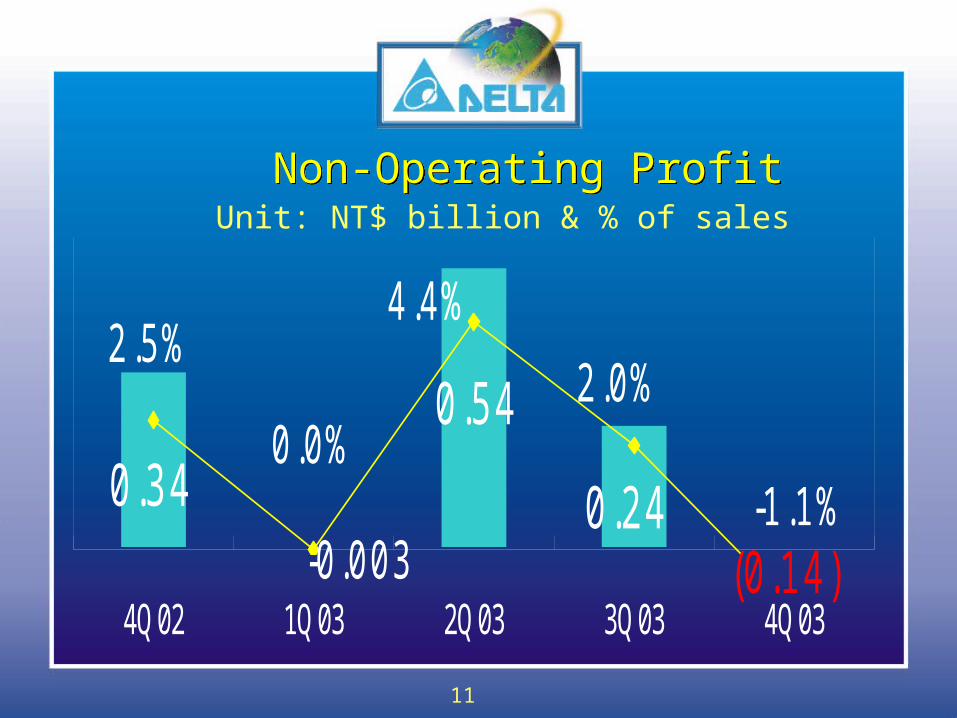
Non-Operating ProfitNon-Operating ProfitUnit: NT$ billion & % of sales
0.34 0.24
0.54
(0.14)-0.003-1.1%
4.4%2.5%
0.0%2.0%
4Q02 1Q03 2Q03 3Q03 4Q03
12
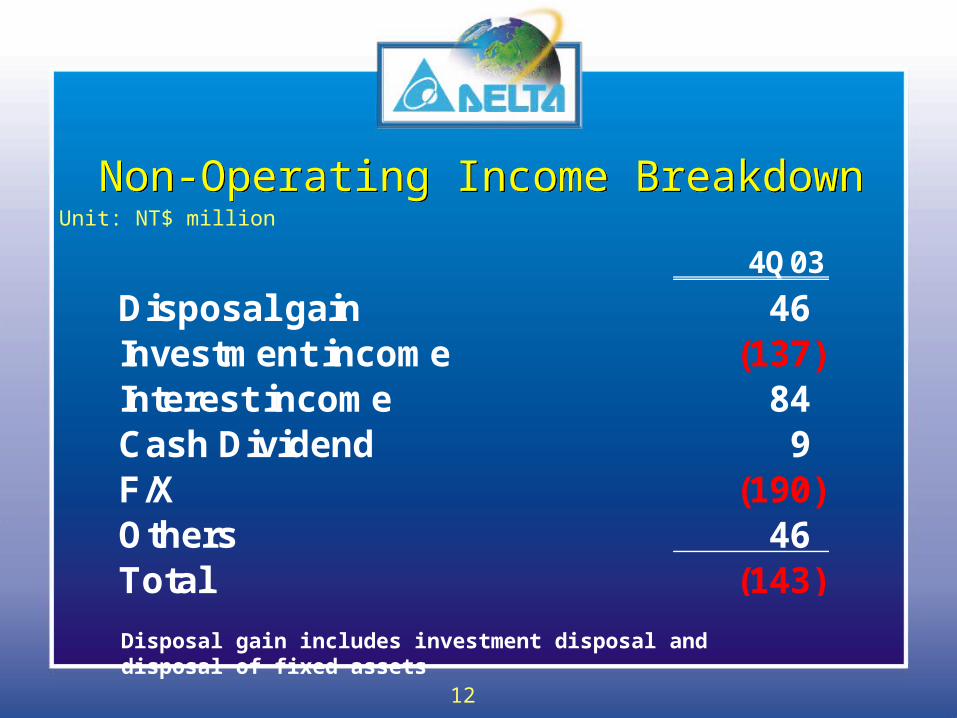
Non-Operating Income BreakdownNon-Operating Income BreakdownUnit: NT$ million
4Q03
Disposal gain 46Investment income (137)Interest income 84Cash Dividend 9F/X (190)Others 46Total (143)
Disposal gain includes investment disposal and disposal of fixed assets
13
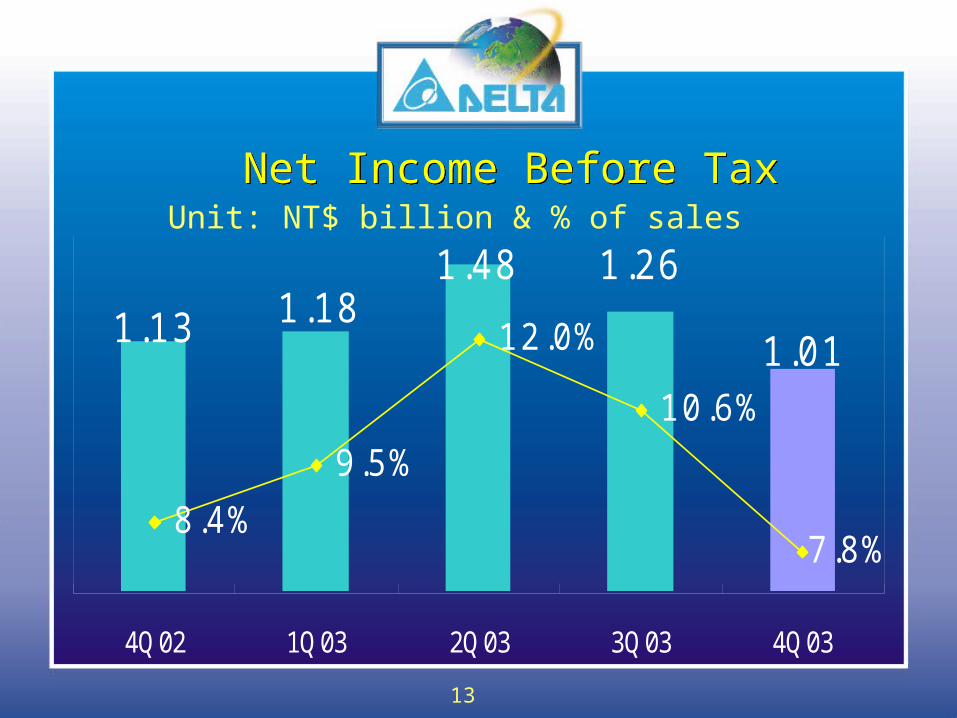
Net Income Before TaxNet Income Before TaxUnit: NT$ billion & % of sales
1.26
1.01
1.481.181.13
8.4%
9.5%
12.0%
10.6%
7.8%
4Q02 1Q03 2Q03 3Q03 4Q03
14
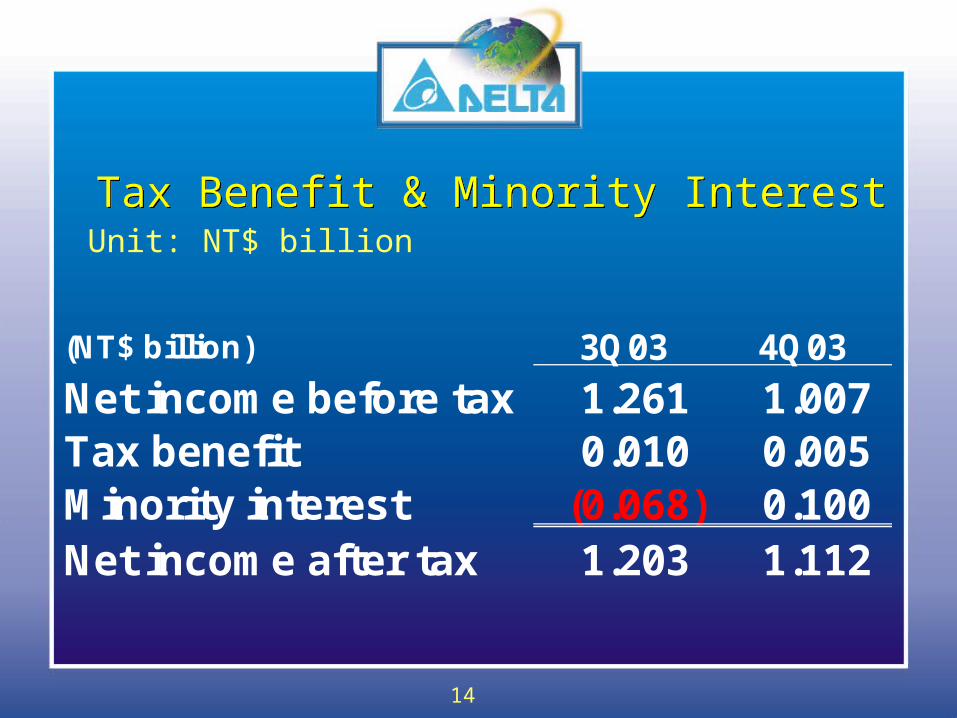
(NT$ billion) 3Q03 4Q03
Net income before tax 1.261 1.007Tax benefit 0.010 0.005Minority interest (0.068) 0.100Net income after tax 1.203 1.112
Tax Benefit & Minority InterestTax Benefit & Minority InterestUnit: NT$ billion
15
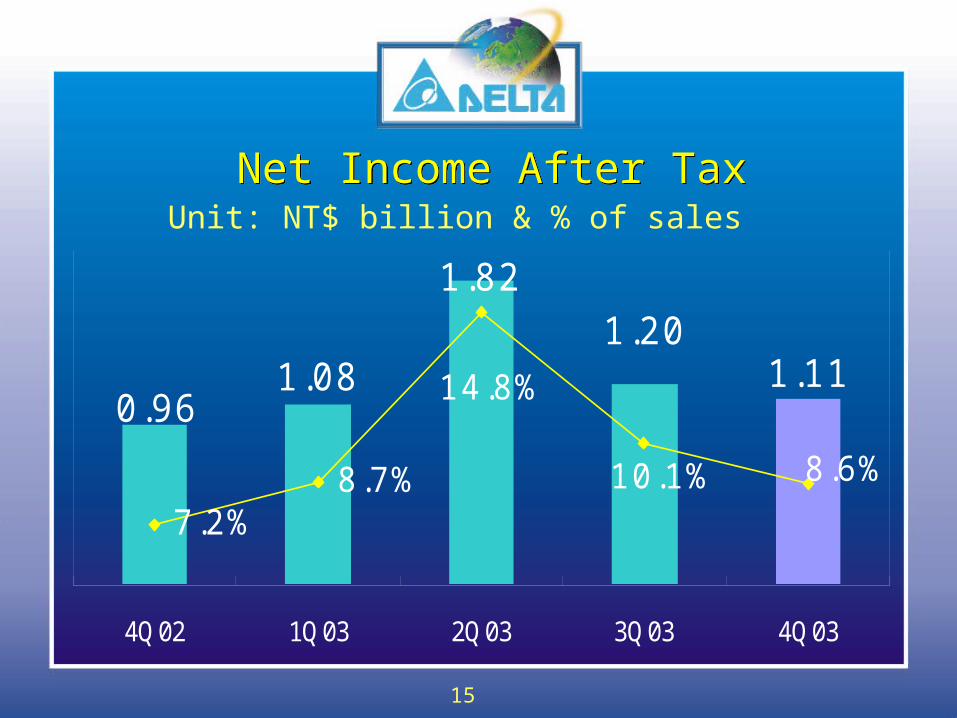
Net Income After TaxNet Income After TaxUnit: NT$ billion & % of sales
1.201.11
1.82
1.080.96
7.2%8.7%
14.8%
8.6%10.1%
4Q02 1Q03 2Q03 3Q03 4Q03
16
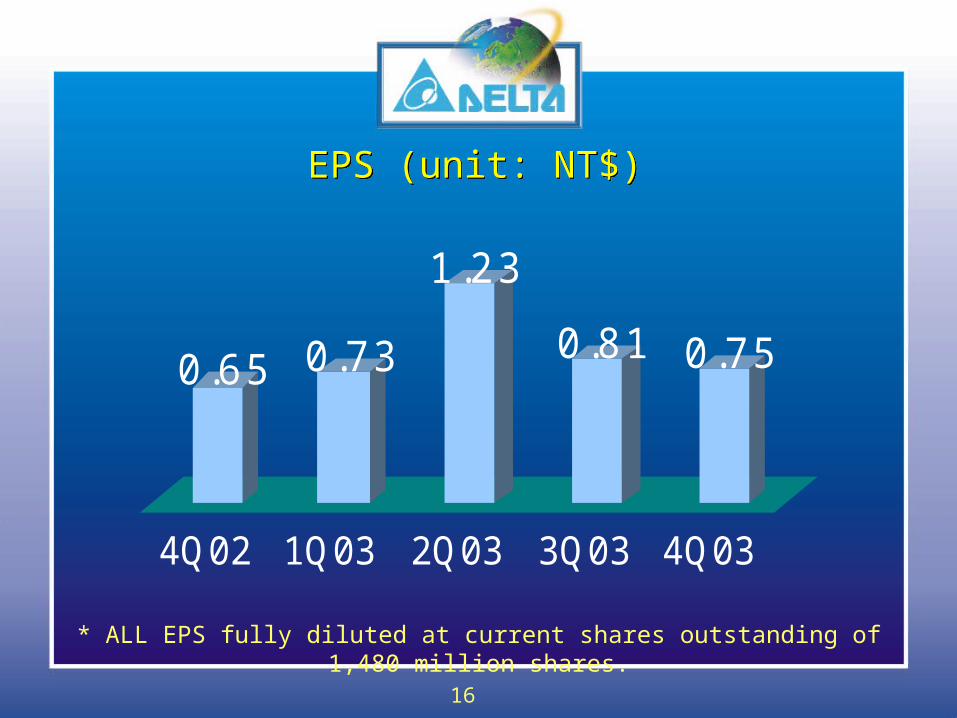
EPS (unit: NT$)EPS (unit: NT$)
0.65 0.73
1.23
0.81 0.75
4Q02 1Q03 2Q03 3Q03 4Q03
* ALL EPS fully diluted at current shares outstanding of 1,480 million shares.
17
Accumulated 2003 Results
18
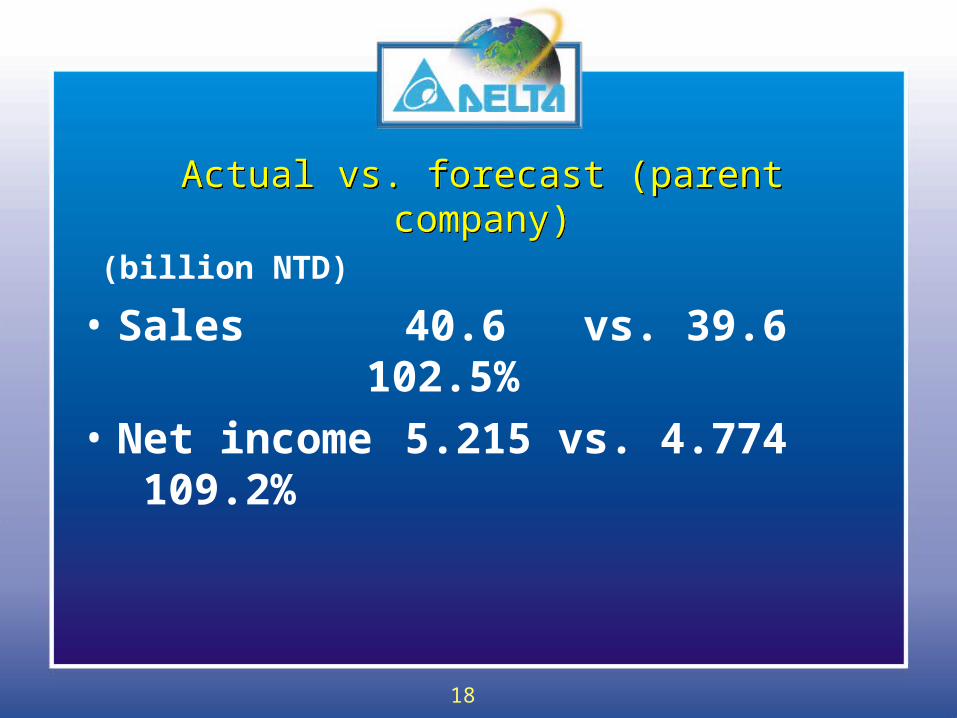
Actual vs. forecast (parent company)Actual vs. forecast (parent company)
(billion NTD)
• Sales 40.6 vs. 39.6 102.5%
• Net income 5.215 vs. 4.774 109.2%
19
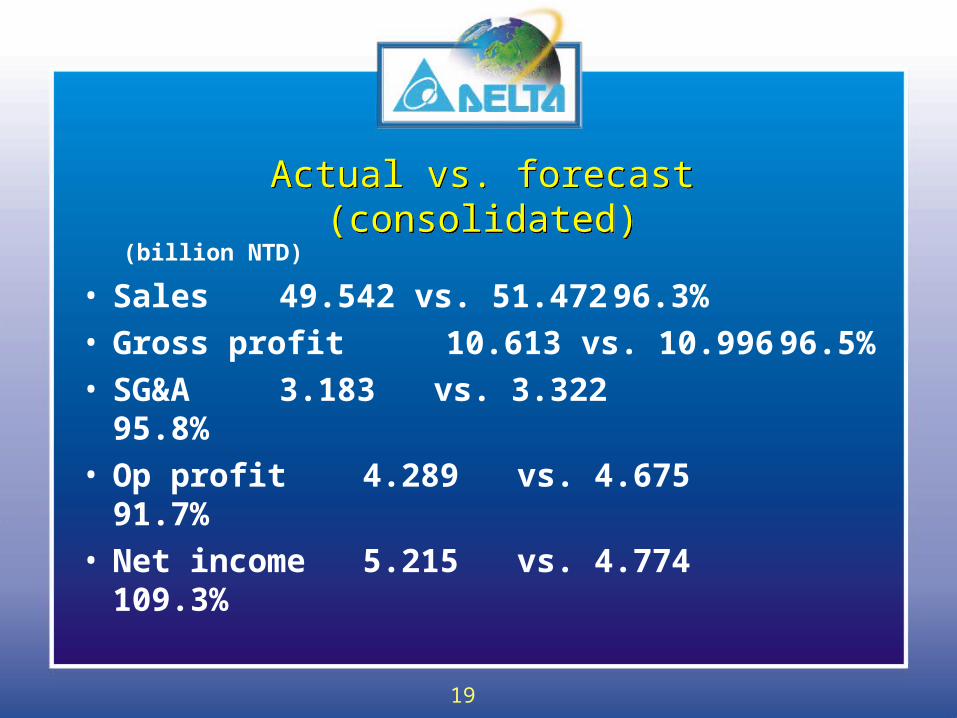
(billion NTD) • Sales 49.542 vs. 51.472 96.3%• Gross profit 10.613 vs. 10.996 96.5%• SG&A 3.183 vs. 3.322 95.8%• Op profit 4.289 vs. 4.675 91.7%• Net income 5.215 vs. 4.774 109.3%
Actual vs. forecast (consolidated)Actual vs. forecast (consolidated)
20
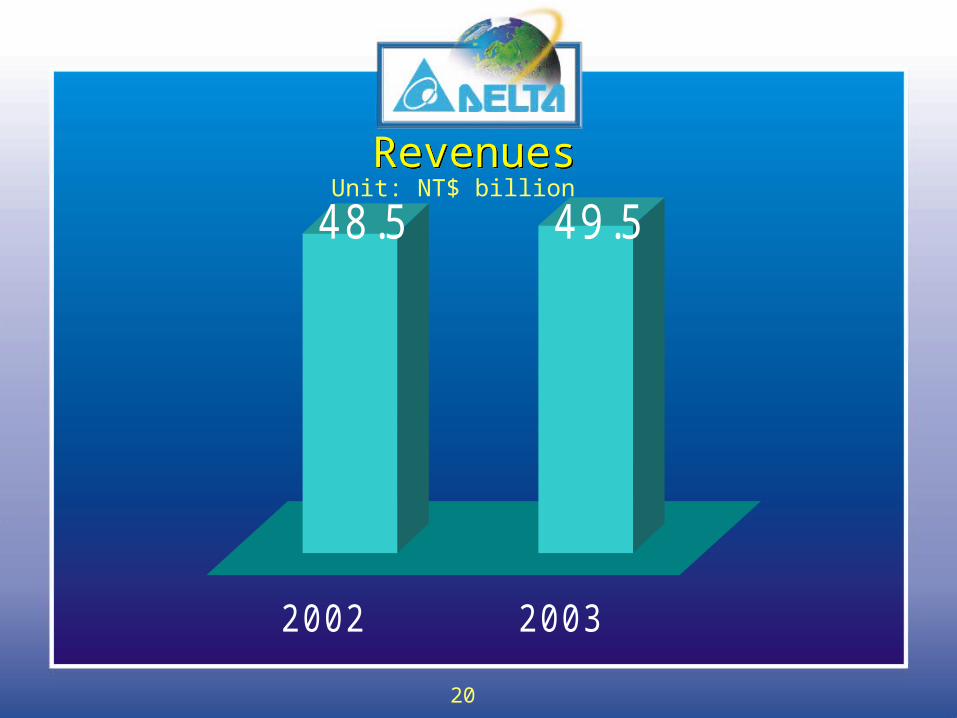
48.5 49.5
2002 2003
RevenuesRevenuesUnit: NT$ billion
21
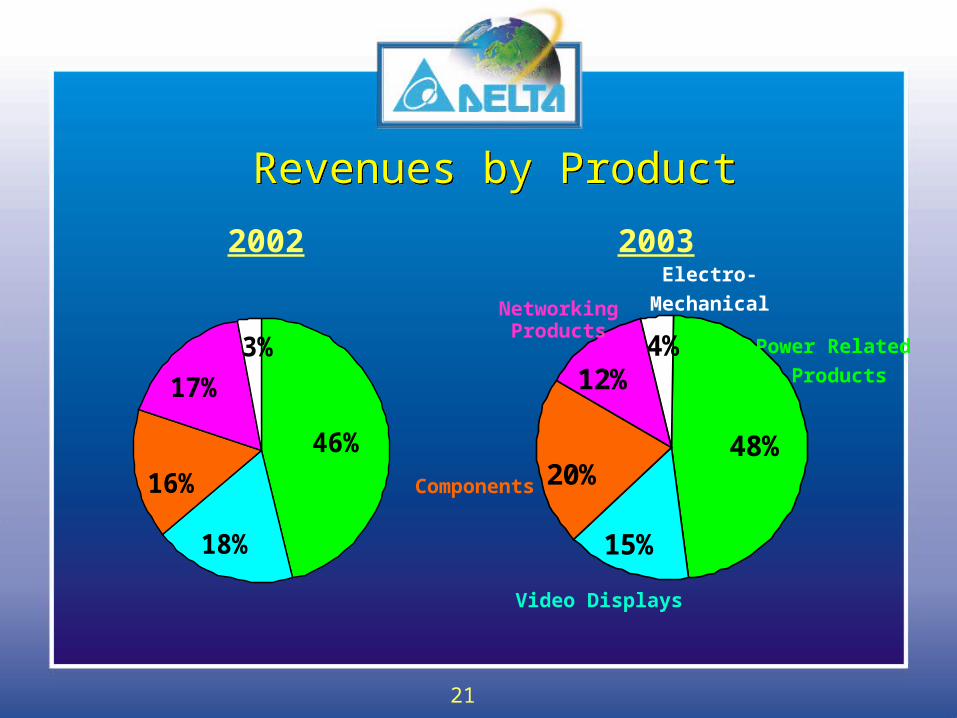
46%
18%
16%
17%
3%
48%
15%
20%
12%4% Power Related
Products
NetworkingProducts
Components
Video Displays
2002 2003
Revenues by ProductRevenues by Product
Electro-
Mechanical
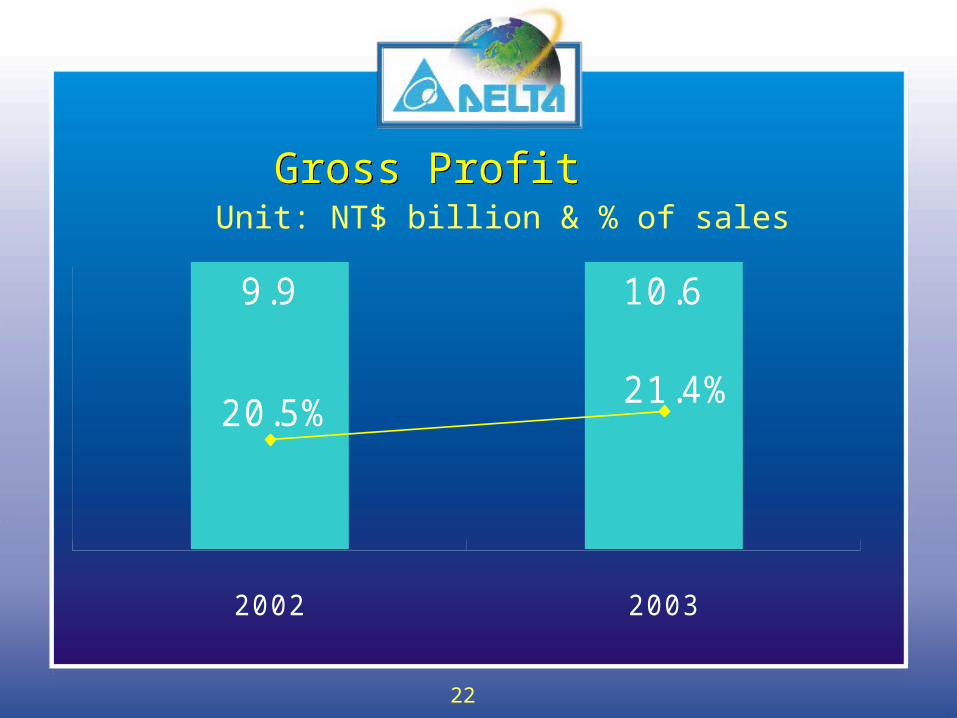
22
Gross ProfitGross ProfitUnit: NT$ billion & % of sales
9.9 10.6
21.4%20.5%
2002 2003
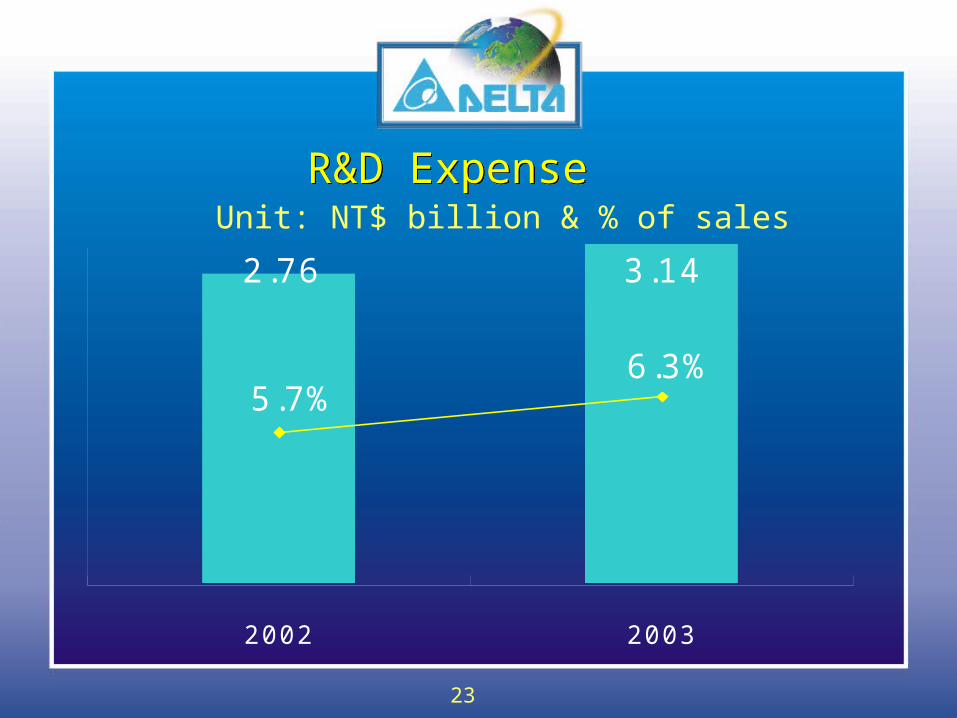
23
R&D ExpenseR&D ExpenseUnit: NT$ billion & % of sales
2.76 3.14
6.3%5.7%
2002 2003
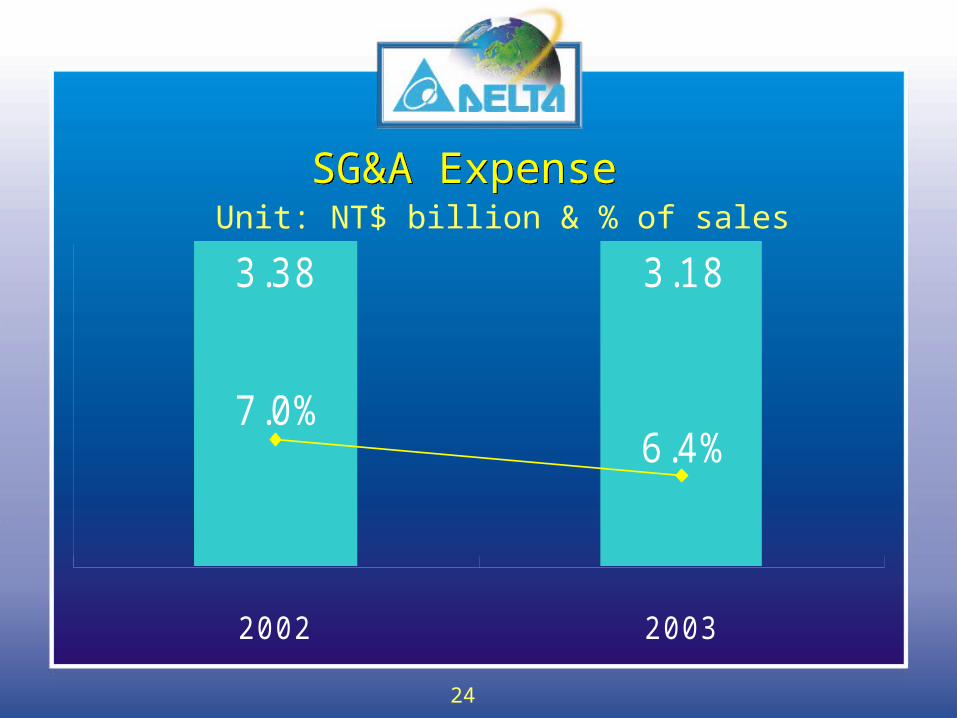
24
SG&A ExpenseSG&A ExpenseUnit: NT$ billion & % of sales
3.38 3.18
6.4%7.0%
2002 2003
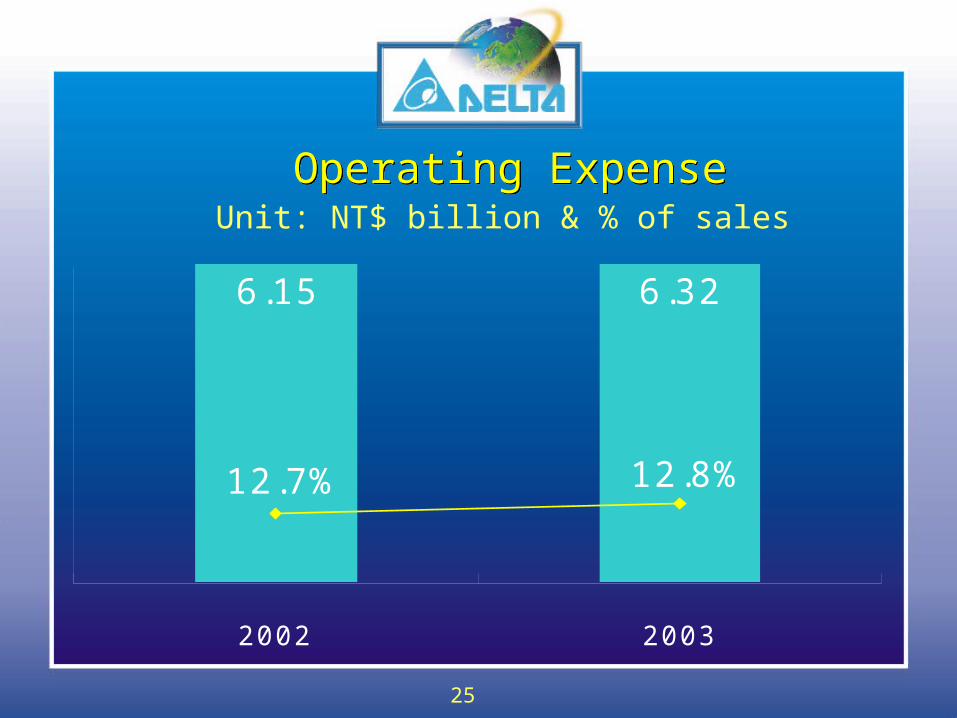
25
Operating ExpenseOperating ExpenseUnit: NT$ billion & % of sales
6.15 6.32
12.8%12.7%
2002 2003
26
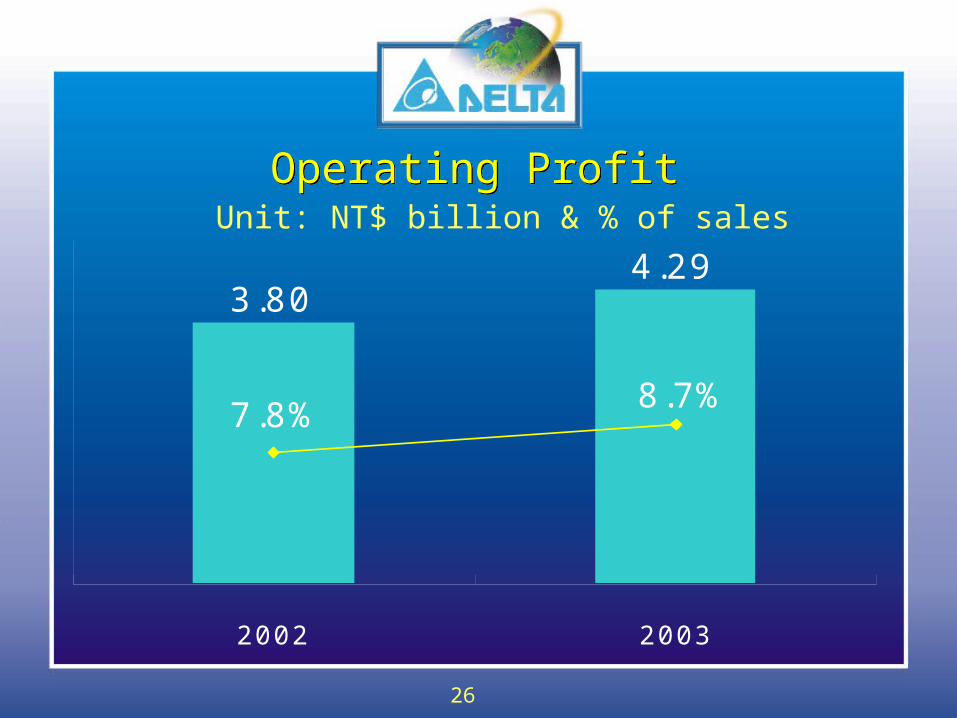
Operating ProfitOperating ProfitUnit: NT$ billion & % of sales
3.804.29
8.7%7.8%
2002 2003
27
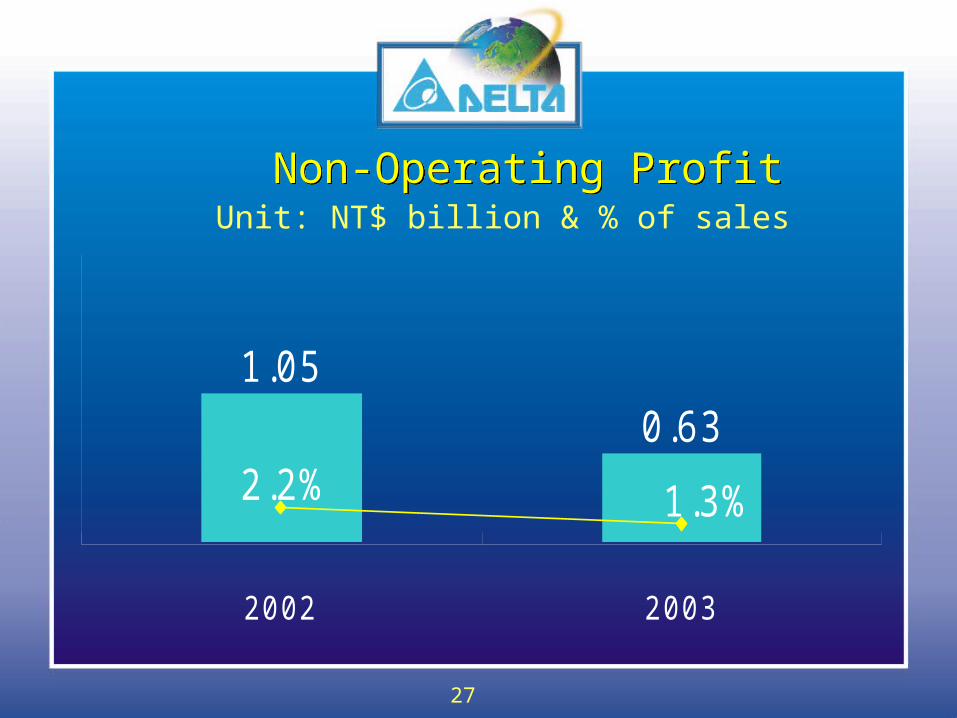
Non-Operating ProfitNon-Operating ProfitUnit: NT$ billion & % of sales
1.050.63
1.3%2.2%
2002 2003
28
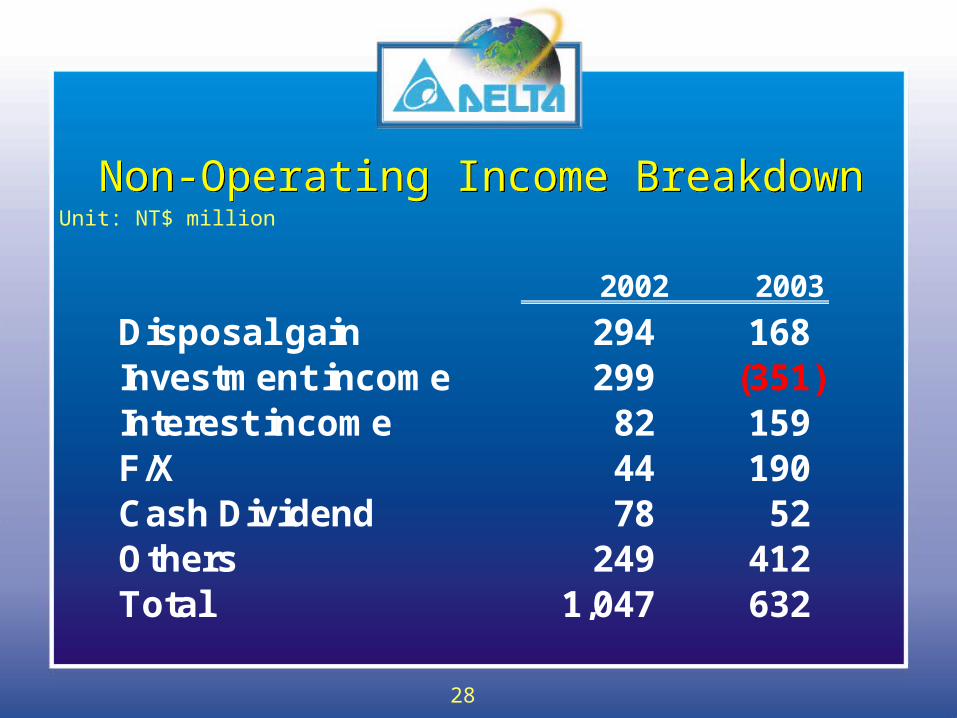
Non-Operating Income BreakdownNon-Operating Income BreakdownUnit: NT$ million
2002 2003
Disposal gain 294 168Investment income 299 (351)Interest income 82 159F/X 44 190Cash Dividend 78 52Others 249 412Total 1,047 632
29
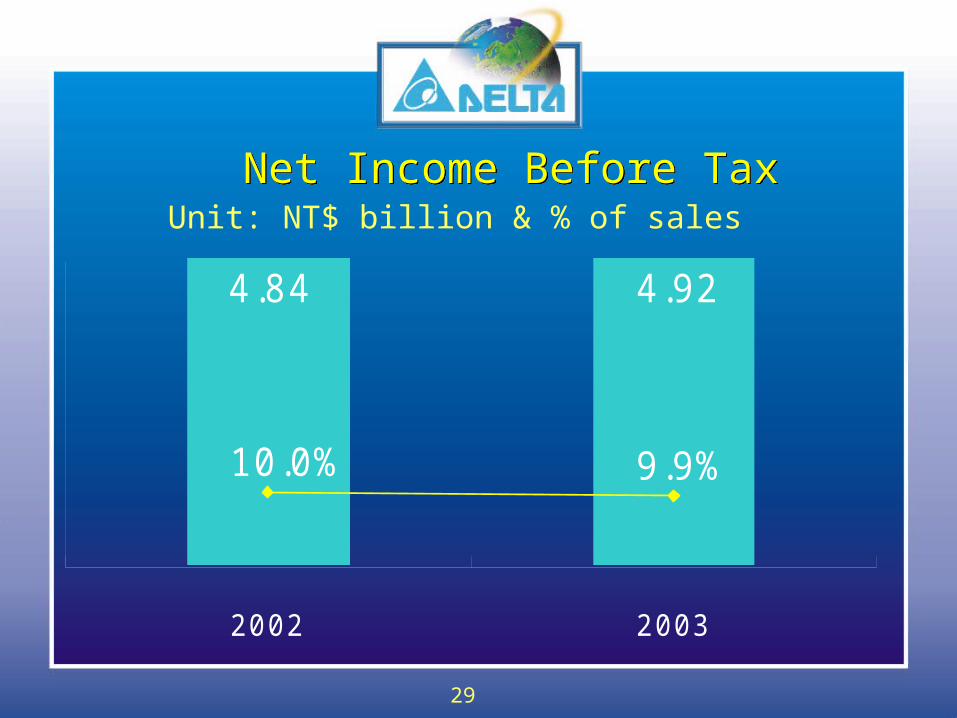
Net Income Before TaxNet Income Before TaxUnit: NT$ billion & % of sales
4.84 4.92
9.9%10.0%
2002 2003
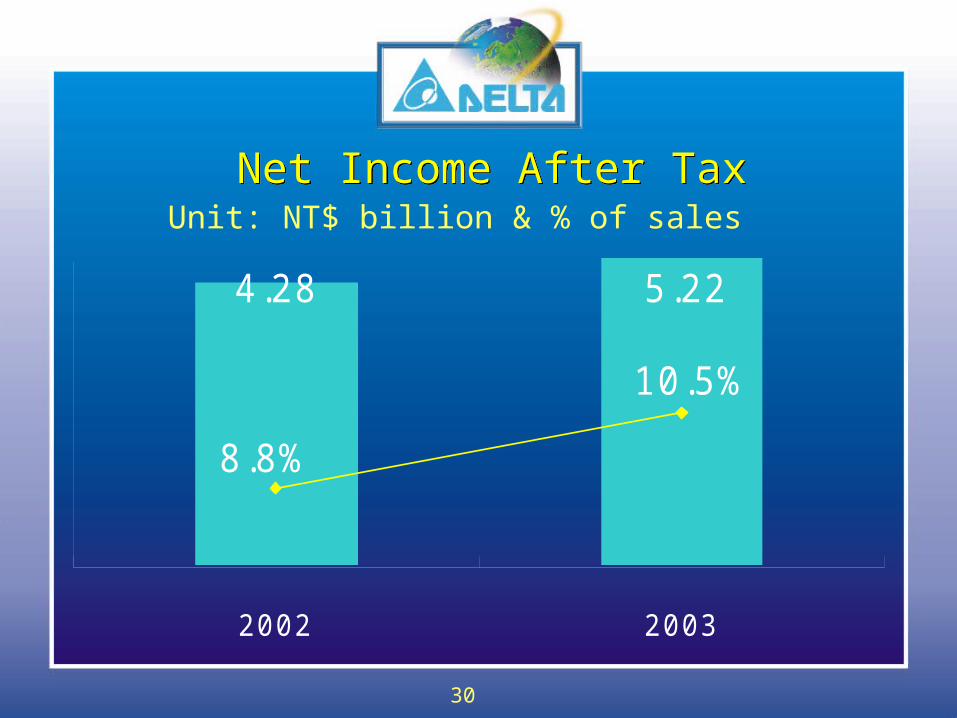
30
Net Income After TaxNet Income After TaxUnit: NT$ billion & % of sales
4.28 5.22
10.5%
8.8%
2002 2003
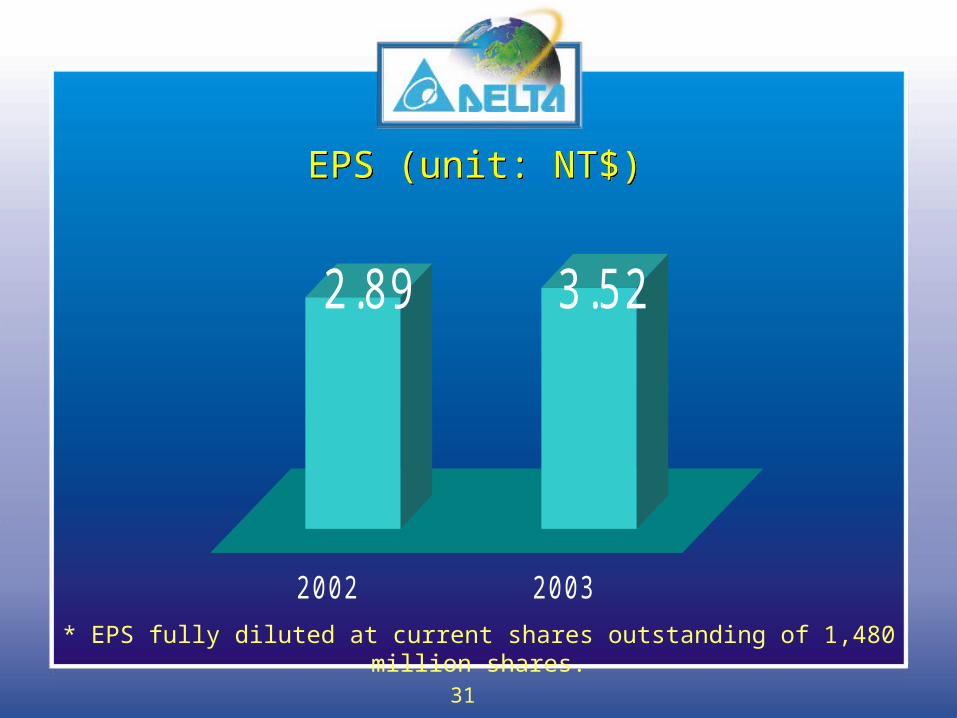
31
EPS (unit: NT$)EPS (unit: NT$)
2.89 3.52
2002 2003
* EPS fully diluted at current shares outstanding of 1,480 million shares.

32
THANK YOU ! THANK YOU !