1 2 3 4 - aavmc
TRANSCRIPT
1 2 3 4

1 2 3 4

1 2 3 4

1 2 3 4

1 2 3 4 5 6 7 8
Enrollment Data
Table of Contents
2- Total Enrollment at US Colleges of Veterinary Medicine3 - Total Enrollment of U.S. Citizens at all AAVMC Member Institutions4 - First Year & Graduation Classes at US Colleges of Veterinary Medicine5 - Total US Citizen Graduates from AAVMC Member Institutions6 - First Year Class at US Colleges of Veterinary Medicine ByResident/Non-Resident Status7 - First Year DVM Student Distribution by State/Territory8 - DVM Students Enrolled in Dual Degree Programs by US College of VeterinaryMedicine

1 2 3 4 5 6 7 8
Total Enrollment at US Colleges of Veterinary MedicineInternal AAVMC Data Reports
1980-2021
1980 1985 1990 1995 2000 2005 2010 2015 2020
Academic Year
0
2,000
4,000
6,000
8,000
10,000
12,000
14,000
On average, seats have increased 2.0% per year since 1980. During the last decade (1109-2011), thenumber of first year seats at US colleges of veterinary medicine have increased an average of 2.2%per year.

1 2 3 4 5 6 7 8
Total Enrollment of U.S. Citizens atall AAVMC Member InstitutionsInternal AAVMC Data Reports
2014-2021
Data set includes students who are US cizens aending an Internaonal AAVMC member instuon.
2013 2014 2015 2016 2017 2018 2019 2020 2021 2022
Academic Year
0
5,000
10,000
15,000
20,000U.S. Students at International CollegesStudents at US Colleges

1 2 3 4 5 6 7 8
First Year and Graduation Classesat US Colleges of Veterinary Medicine Internal AAVMC Data Reports
1980-2021
Although the relationship between first year seats and graduation is expected to be a direct one, there are numerousreasons that explain perceived lags in graduation of DVM students. Numerous dual-degree options allow DVMstudents to step in and out of the professional curriculum.
1980 1985 1990 1995 2000 2005 2010 2015 2020
Academic Year
0
1,000
2,000
3,000
4,000 First Year Class at U.S. CVMsUS Graduates from U.S. CVMs

1 2 3 4 5 6 7 8
Total US Citizen Graduatesfrom all AAVMC Member InstitutionsInternal AAVMC Data Reports
2014-2020
Data set includes all graduates who are US citizens graduating from an American or International AAVMC memberinstitution.
2013 2014 2015 2016 2017 2018 2019 2020 2021
Academic Year
0
1,000
2,000
3,000
4,000
5,000 US Graduates from International CVMsUS Graduates from U.S. CVMs
1 2 3 4 5 6 7 8
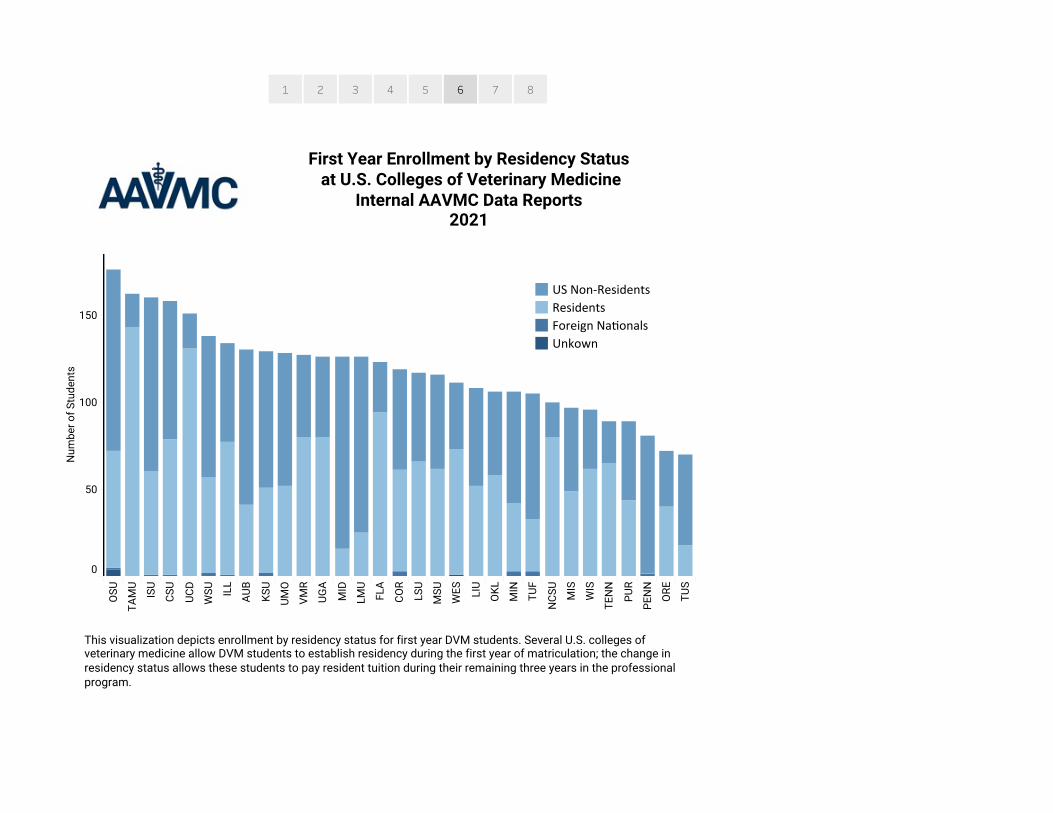
First Year Enrollment by Residency Status at U.S. Colleges of Veterinary Medicine
Internal AAVMC Data Reports2021
This visualization depicts enrollment by residency status for first year DVM students. Several U.S. colleges ofveterinary medicine allow DVM students to establish residency during the first year of matriculation; the change inresidency status allows these students to pay resident tuition during their remaining three years in the professionalprogram.
OSU
TAMU
ISU
CSU
UCD
WSU ILL
AUB
KSU
UMO
VMR
UGA
MID
LMU
FLA
COR
LSU
MSU
WES LIU
OKL
MIN
TUF
NCSU MIS
WIS
TENN
PUR
PENN
ORE
TUS
0
50
100
150
Number of Students
US Non-ResidentsResidentsForeign NaonalsUnkown

1 2 3 4 5 6 7 8
First Year DVM Student Distribution by StateInternal AAVMC Data Reports
2021
0 50 100 150 200 250 300 350 400
First Year Students
CATXFLNYILOHGANCTNMICOPAVANJWIINMAALMOLAKYWAIAOKMSMNMDORKSAZSC
Use the scroll bar to the right to see all state entries.

1 2 3 4 5 6 7 8
DVM Student Enrolled in Dual Degree Programsby US College of Veterinary MedicineInternal AAVMC Data Reports
2021
There are currently 423 DVM students enrolled in dual degree programs in the United States. There are 66 veterinary studentsalso enrolled in MS/MA programs; while there are 158 students who are also earning an MPH program. Finally, 199 veterinarystudents are also enrolled in PhD programs across the US.
0 5 10 15 20 25 30 35 40 45 50 55 60 65 70
Number of Students
CSUUMOVMRPENNILLKSUUGATENNUCDISUMINOSUCORMSUAUBMISNCSUWISOKLTUFTAMULSUWESORE
MPHMS/MAPhD

1 2 3 4 5 6 7 8 9 10
DVM Student Diversity
Table of Contents
2- Gender Representation at U.S. Colleges of Veterinary Medicine3 - Enrollment by Gender at U.S. Colleges of Veterinary Medicine4 - Male Representation by Percentage by U.S. Colleges of Veterinary Medicine5 - Applicants v. DVM Students Enrolled in the Class of 2022 by Gender6 - Aggregate URVM Representation at U.S. Colleges of Veterinary Medicine7- Representation by Race/Ethnicity within the DVM StudentPopulation at US Colleges of Veterinary Medicine8 - URVM Representation by U.S. College of Veterinary Medicine9 - URVM Representation by Percentage by U.S. College of Veterinary Medicine10 - Applicants v. DVM Students Enrolled in the Class of 2023 by Race/Ethnicity

1 2 3 4 5 6 7 8 9 10
Gender Representationat U.S. Colleges of Veterinary Medicine
Internal AAVMC Data Reports1980-2021
1980 1985 1990 1995 2000 2005 2010 2015 2020
Academic Year
0.0%
10.0%
20.0%
30.0%
40.0%
50.0%
60.0%
70.0%
80.0%
90.0%
Percentage of Students
Female Students in CVMsMale Students in CVMs
In 2017, AAVMC began collecting data for individuals identifying as non-binary. For the 2020-2021 academic year,these individuals comprised .20% of the professional DVM student population.
Total enrollment at the U.S. Colleges of Veterinary Medicine is 13,952.

1 2 3 4 5 6 7 8 9 10
Enrollment by Genderat U.S. College of Veterinary MedicineInternal AAVMC Data Reports
2021
Total DVM student enrollment at the U.S. Colleges of Veterinary Medicine is 13,952.
0 100 200 300 400 500 600 700
Number of Students
OSUISUUCDCSUTAMUILLWSUVMRPENNAUBLMUUMOKSUMIDMSUUGAFLACORMINWESNCSUOKLTUFLSUMISWISTENNPURORETUSLIUUAZ
FemaleGender UnknownMaleNon-Binary

1 2 3 4 5 6 7 8 9 10
Male Representation by Percentage at US Colleges of Veterinary Medicine
Internal AAVMC Data Reports2021
Total DVM student enrollment at the U.S. Colleges of Veterinary Medicine is 13,952.
0.0% 10.0% 20.0% 30.0% 40.0%
Male Student Percentage
VMRWSUWESOSUKSUPURWISFLALMUTAMUOKLUGAUS AverageAUBISUTUSUAZMSUCORTENNCSUUCDLSUMIDNCSUUMOLIUPENNMINILLTUFMISORE

1 2 3 4 5 6 7 8 9 10
Applicants v. DVM Students Enrolledin the US Class of 2024 by GenderInternal AAVMC Data Reports
2021
0.0%10.0% 20.0% 30.0% 40.0% 50.0% 60.0% 70.0% 80.0% 90.0%
Percentage of Applicants/Enrolled DVM Students
Female Applicants
Class of 2024
Male Applicants
Class of 2024
A gender notlisted here
Applicants
Class of 2024
ApplicantsClass of 2024
While not easily visible here, applicants and students who indicated their gender isnot listed here are represented as 0.4% and 0.2% respectively.
The total number of applicants to the class of 2024 was 8,152.
The total DVM student enrollment across the U.S. Colleges of Veterinary Medicinefor the class of 2023 is 3,719.

1 2 3 4 5 6 7 8 9 10
Aggregate Racial/Ethnic URVM Representationat US Colleges of Veterinary MedicineInternal AAVMC Data Reports
1980-2021
1975 1980 1985 1990 1995 2000 2005 2010 2015 2020
Academic Year
0.0%
5.0%
10.0%
15.0%
20.0%
25.0%
National URVM Students (All CVMs)
URVM: Underrepresented in Veterinary Medicine.In this visualization, URVM is specific to race and ethnicity.
Total DVM student enrollment at the U.S. Colleges of Veterinary Medicine is 13,952.
1 2 3 4 5 6 7 8 9 10
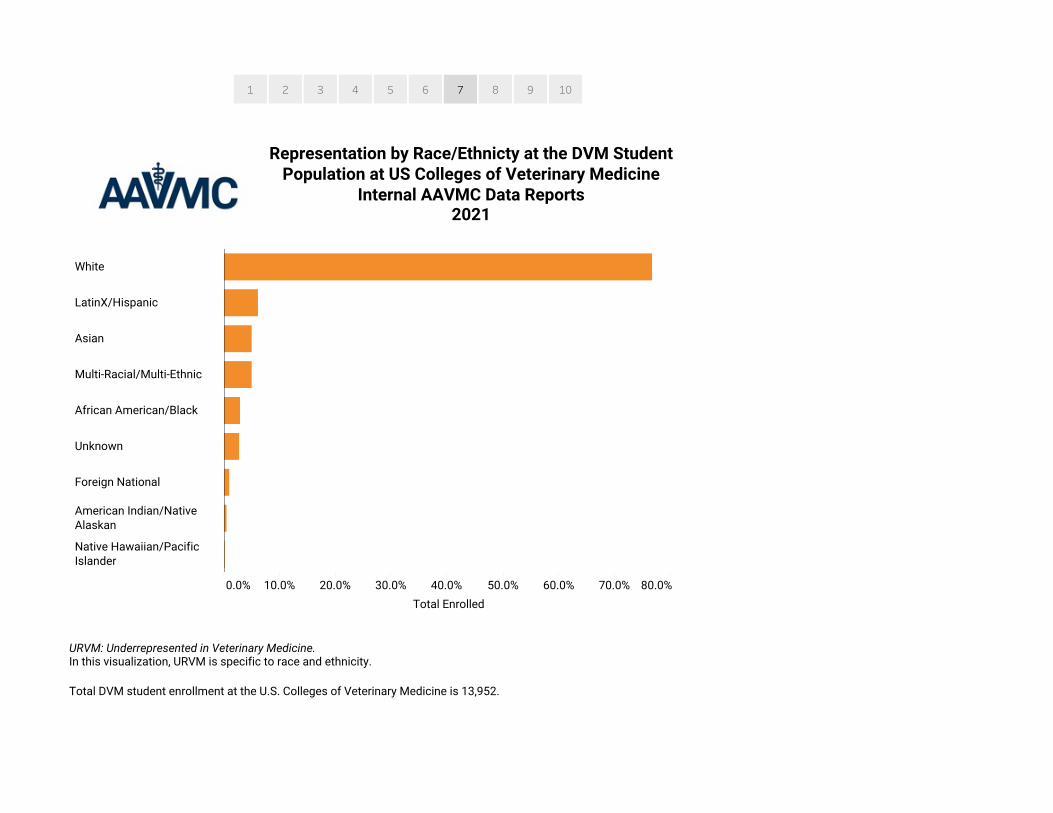
Representation by Race/Ethnicty at the DVM StudentPopulation at US Colleges of Veterinary Medicine
Internal AAVMC Data Reports2021
0.0% 10.0% 20.0% 30.0% 40.0% 50.0% 60.0% 70.0% 80.0%
Total Enrolled
White
LatinX/Hispanic
Asian
Multi-Racial/Multi-Ethnic
African American/Black
Unknown
Foreign National
American Indian/NativeAlaskan
Native Hawaiian/PacificIslander
URVM: Underrepresented in Veterinary Medicine.In this visualization, URVM is specific to race and ethnicity.
Total DVM student enrollment at the U.S. Colleges of Veterinary Medicine is 13,952.

1 2 3 4 5 6 7 8 9 10
URVM Representation by Percentage at US College of Veterinary MedicineInternal AAVMC Data Reports
2021
URVM: Underrepresented in Veterinary Medicine.In this visualization, URVM is specific to race and ethnicity.Total DVM student enrollment at the U.S. Colleges of Veterinary Medicine is 13,952.
0.0% 10.0% 20.0% 30.0% 40.0% 50.0% 60.0% 70.0%
URVM Student Percentage
TUSWESUCDUAZLIUMIDPURCOROSUFLANCSUOREVMRTAMUUS AverageTUFCSUMSULSUPENNOKLILLWSUUGAWISLMUMINTENNUMOMISKSU

1 2 3 4 5 6 7 8 9 10
Enrollment by US College of Veterinary Medicineby Race & Ethnicity
Internal AAVMC Data Reports2021
Data is shown in real numbers of students, not percentages. Total DVM student enrollment at the U.S. Colleges ofVeterinary Medicine is 13,952.
0 50 100 150 200 250 300 350 400 450 500 550 600
Percentage of Students
OSUISUCSUTAMUUCDILLWSUAUBVMRLMUUMOPENNMIDKSUUGACORFLAMSUWESMINOKLLSUTUFNCSUMISWISTENNPURORETUSLIUUAZ
Race Uknown
Foreign National
Native Hawaiian/ Pacific Islan..
American Indian/Native Alask..
Mutli-Racial/Multi-Ethnic
African American/Black
Asian
LatinX/Hispanic
White

1 2 3 4 5 6 7 8 9 10
Applicants v. DVM Students Enrolledin the U.S. Class of 2024 by Race/Ethnicity
Internal AAVMC Data Reports2021
10.0% 20.0% 30.0% 40.0% 50.0% 60.0% 70.0% 80.0% 90.0%
Percentage of Applicants/Enrolled DVM Students
White ApplicantsClass of 2024
LatinX/Hispanic ApplicantsClass of 2024
Asian ApplicantsClass of 2024
Multi-Racial/Multi-Ethnic ApplicantsClass of 2024
Unknown ApplicantsClass of 2024
African American/Black ApplicantsClass of 2024
Foreign National ApplicantsClass of 2024
American Indian/NativeAlaskan
ApplicantsClass of 2024
Native Hawaiian/PacificIslander
ApplicantsClass of 2024
ApplicantsClass of 2024
The total number of applicants to the class of 2024 was 8,152.
The total DVM student enrollment across the U.S. Colleges of VeterinaryMedicine for the class of 2023 is 3,3719

1 2 3 4 5 6 7 8 9 10 11 12 13 14 15 16 17 18
Applicant Data
Table of Contents
2 - Historical Applicant Trend - 1980-20203 - Applicant to Seat Rao - 2009-20204 - Applicant to First Year Seat Rao at U.S. Colleges of Veterinary Medicine (Class of 2024)5 - Applicants to First Year Seats by Residency Status at U.S. College of Veterinary Medicine (Classof 2024)6 - Applicants to the Class of 2025 by Race/Ethnicity7 - Applicants to the Class of 2025 by Gender Identy8 - Applicants to the Class of 2025 by Self-Idenfied Orientaon9 - Community College Courses & Internaonal Applicaons Applicants to the Class of 202510 - Mean & Median Experienal Hours Applicants to the Class of 202411 - Community Origin & Desired Pracce Community Applicants to Class of 202512 - Pell Grant Eligible/Recipients & First Generaon College Students Applicants to the Class of202513 - Applicaon Aempts Applicants to the Class of 202514 - Undergraduate Debt for Applicants to the Class of 202515 - Sources of Aid Reported Applicants to the Class of 2025 with Low /No Debt16 - Sources of Aid Ancipated by Appicants to the Class of 202517 - Class of 2025 Shown with Long-term Potenal Applicant Pool by Race/Ethnicity18 -- Class of 2025 shown with Long Term Potenal Applicant Pool by Sex

1 2 3 4 5 6 7 8 9 10 11 12 13 14 15 16 17 18
Historical Applicant TrendInternal AAVMC Data Reports
1980-2020
1980 1985 1990 1995 2000 2005 2010 2015 2020
Academic Year
0
2,000
4,000
6,000
8,000
10,000
Total Applications

1 2 3 4 5 6 7 8 9 10 11 12 13 14 15 16 17 18
Applicants to First Year Available SeatsInternal AAVMC Data Reports
2009-2020
Total available seats include all first year seats at AAVMC member instuons. First year seats at InternaonalAAVMC member instuons are based on historical enrollment trends of US cizens and instuonal targetenrollment figures.
20122013 2014 2015 2016 2017 2018 2019 20202021
Academic Year
0
2,000
4,000
6,000
8,000
10,000
Total Applications
0
2,000
4,000
6,000
8,000
10,000
Total Available Seats
Total ApplicantsTotal Available Seats

1 2 3 4 5 6 7 8 9 10 11 12 13 14 15 16 17 18
Class of 2024 Applicant to First Year Seat Ratioat US College of Veterinary MedicineInternal AAVMC Data Reports
2021
0.0 2.0 4.0 6.0 8.0 10.0 12.0 14.0 16.0 18.0
Per School Applicant to Seat Ratio
PUROREMSUCSULMUWISMISTENNNCSUVMRWSUUGAOSUMIDISUUMOCORMINOKLAUBTUFKSUILLLSUWESUCDTAMULIU

1 2 3 4 5 6 7 8 9 10 11 12 13 14 15 16 17 18
Applicant to First Year Seat Ratio by Residency Statusat U.S. College of Veterinary Medicine
Class of 2024Internal AAVMC Data Reports
2021
0 10 20 30 40 50 60 70 80 90
Applicant to Seat Ratio
MISPURNCSUTENNUGAOREWISCSUTAMUVMRMSUUS AverageLSUOSUISUCORUCDWSUUMOOKLLMU
Non-Resident App to Seat RatioResident App to Seat Ratio
Lincoln Memorial University reports all applicants to its college as non-residents.

1 2 3 4 5 6 7 8 9 10 11 12 13 14 15 16 17 18
Applicants to the Class of 2025by Race/Ethnicity
Internal AAVMC Data Reports2021
0.0% 20.0% 40.0% 60.0% 80.0% 100.0%
Percentage of Applicant Pool
White
LatinX/Hispanic
Asian
African American/Black
Foreign National
Race Ethnicity Unknown
A racial or ethnic group not listed
Native Hawaiian/Pacific Islander
1 2 3 4 5 6 7 8 9 10 11 12 13 14 15 16 17 18
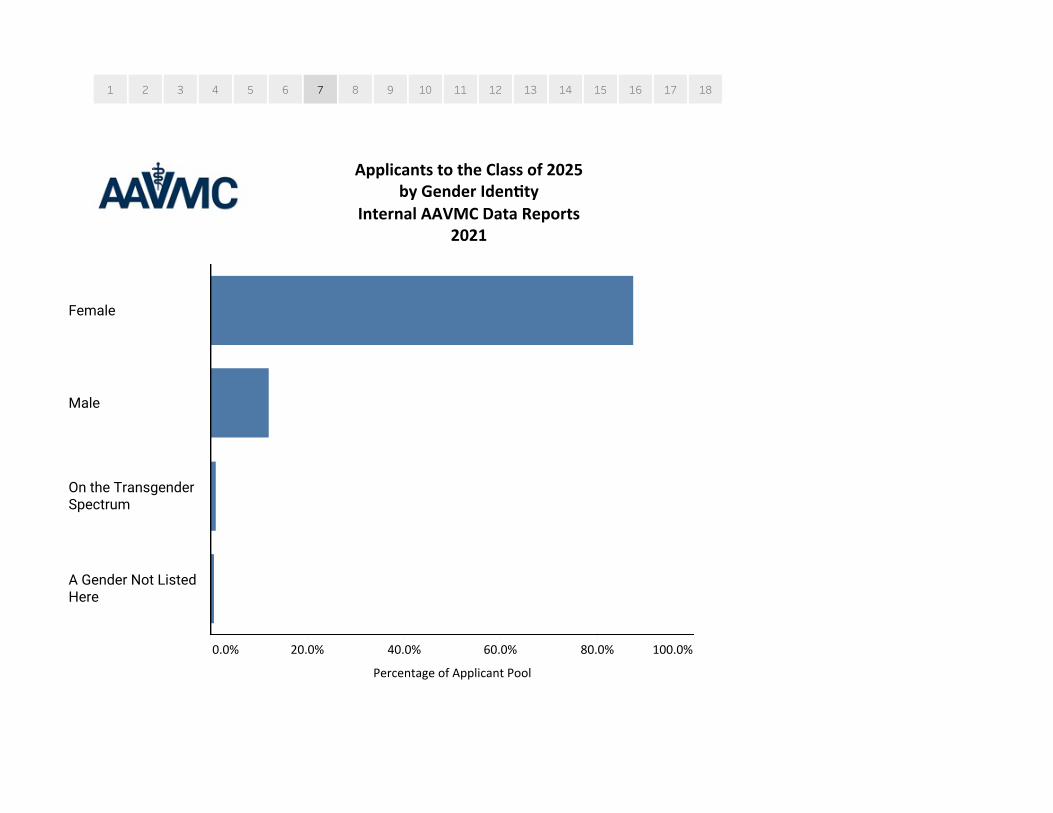
Applicants to the Class of 2025by Gender Identy
Internal AAVMC Data Reports2021
0.0% 20.0% 40.0% 60.0% 80.0% 100.0%
Percentage of Applicant Pool
Female
Male
On the TransgenderSpectrum
A Gender Not ListedHere

1 2 3 4 5 6 7 8 9 10 11 12 13 14 15 16 17 18
Applicants to the Class of 2025by Self-Idenfied OrientaonInternal AAVMC Data Reports
2021
Heterosexual Bisexual Gay/Lesbian Prefer Not toAnswer
Orientaon notlisted
0.0%
20.0%
40.0%
60.0%
80.0%
100.0%
Percentage of Applicant Pool

1 2 3 4 5 6 7 8 9 10 11 12 13 14 15 16 17 18
Community College Courses & International ApplicationsApplicants to the Class of 2025Internal AAVMC Data Reports
2021
NoYes
Applicants Taking CommunityCollege Courses
Applicants Applying Outsideof the US

1 2 3 4 5 6 7 8 9 10 11 12 13 14 15 16 17 18
Mean & Median Experiential HoursApplicants to the Class of 2025Internal AAVMC Data Reports
2021
Veterinary Animal Research0
500
1,000
1,500
Number of Hours
The mean experiential hours shown here should not be interpreted as recommendations by prospectiveapplicants. Application requirements regarding experiential hours vary widely across the colleges of veterinarymedicine, and applicants may be successful in earning admission with a portfolio of experiences that differgreatly than what is shown here.
This data simply represents the mean number by experience type reported by applicants to the class of 2025.

1 2 3 4 5 6 7 8 9 10 11 12 13 14 15 16 17 18
Community Origin & Desired Practice CommunityApplicants to the Class of 2025Internal AAVMC Data Reports
2021
Community of Origin Desired PracticeCommunity
Suburban Urban Rural0.0%
10.0%
20.0%
30.0%
40.0%
50.0%
60.0%
70.0%
Suburbs Urban Rural0.0%
10.0%
20.0%
30.0%
40.0%
50.0%
60.0%
70.0%

1 2 3 4 5 6 7 8 9 10 11 12 13 14 15 16 17 18
Pell Grant Eligible/Recipients &First Generation College SudentsApplicants to the Class of 2025Internal AAVMC Data Reports
2021
Applicants Identifyingas First GenerationCollege Students
NoYes
Applicants who are Pell GrantEligible and/orRecipients

1 2 3 4 5 6 7 8 9 10 11 12 13 14 15 16 17 18
Application AttemptsApplicants to the Class of 2025Internal AAVMC Data Reports
2021
1st application 2nd application 3rd application 4 or more apps0.0%
20.0%
40.0%
60.0%
80.0%
100.0%
Percentage

1 2 3 4 5 6 7 8 9 10 11 12 13 14 15 16 17 18
Undergraduate Debt Status of Applicantsto the Class of 2024
Internal AAVMC Data Reports2020
0.0% 20.0% 40.0% 60.0% 80.0% 100.0%
No Debt
Indebted
The mean for indebted applicants to to the Class of 2024 is $34,903.

1 2 3 4 5 6 7 8 9 10 11 12 13 14 15 16 17 18
Sources of Aid Reported by Applicants to the Class of 2025with Low or No Undergraduate DebtInternal AAVMC Data Reports
2021
Family Support Working Full/.. Merit-base.. Need-base.. Other Financing Military benefits0.0%
10.0%
20.0%
30.0%
40.0%
50.0%
60.0%
70.0%
Percentage of Applicants
Family SupportWorking Full/Part TimeMerit-based scholarshipNeed-based scholarshipOther FinancingMilitary benefits
Applicants were allowed to select multiple sources of anticipated aid.

1 2 3 4 5 6 7 8 9 10 11 12 13 14 15 16 17 18
Anticipated Sources of Aid Reported by Applicantsto the Class of 2025
Internal AAVMC Data Reports2021
Student Loans Family Support Working F/.. Person.. I do not know yet Other Financing0.0%
10.0%
20.0%
30.0%
40.0%
50.0%
60.0%
70.0%
Percentage of Applicants
Student LoansFamily SupportWorking F/P TimePersonal SavingsI do not know yet Other Financing
Applicants were allowed to select mulple sources of ancipated aid.
1 2 3 4 5 6 7 8 9 10 11 12 13 14 15 16 17 18
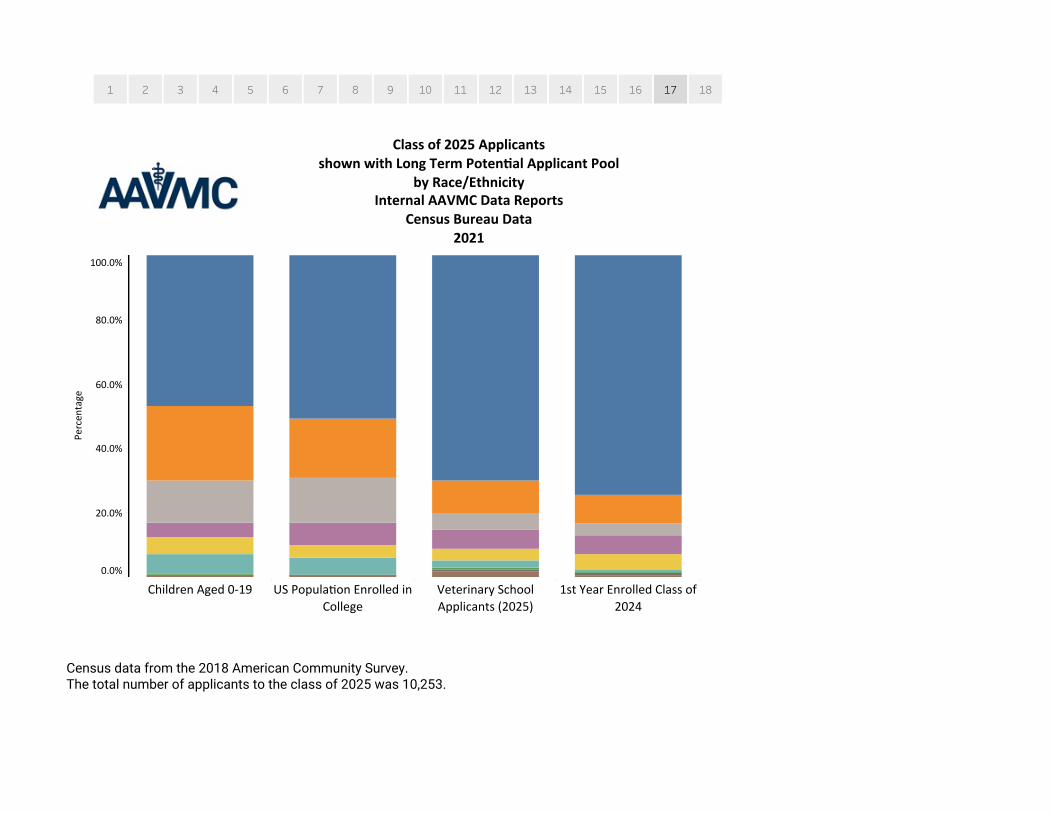
Class of 2025 Applicantsshown with Long Term Potenal Applicant Pool
by Race/EthnicityInternal AAVMC Data Reports
Census Bureau Data2021
Census data from the 2018 American Community Survey.The total number of applicants to the class of 2025 was 10,253.
Children Aged 0-19 US Populaon Enrolled inCollege
Veterinary SchoolApplicants (2025)
1st Year Enrolled Class of2024
0.0%
20.0%
40.0%
60.0%
80.0%
100.0%
Percentage

1 2 3 4 5 6 7 8 9 10 11 12 13 14 15 16 17 18
Class of 2025 Applicantsshown with Long Term Potential Applicant Pool
by SexInternal AAVMC Data Reports
Census Bureau Data2020
Census data from the 2018 American Community Survey.
The total number of men between the ages of 18-24 who have completed an undergraduatedegree was 1,299,000. The total number of applicants to the class of 2024 was 10,253.
Total Population Ages 0-19 Enrolled inCollege
BA/BS Applicants toClass of 2025
DVM first yearClass of 2024
0.0%
20.0%
40.0%
60.0%
80.0%
100.0%
Percent of Population
WomenMaleNon-Binary

1 2 3 4 5 6 7 8 9
Veterinary Medical College Tuion& Graduate Indebtedness
Table of Contents
2 - First Year Resident Tuion & Fees at U.S. Colleges of Veterinary Medicine3 - First Year Non-Resident Tuion & Fees at AAVMC Member Instuons4 - Median Tuion at U.S. Colleges of Veterinary Medicine5 - Instuonal Scholarship Aid for All DVM Students & for 1st Year DVM Students atU.S. Colleges of Veterinary Medicine6 - Mean Instuonal Indebtedness at AAVMC Instuonal Member Instuons7 - Percentage of 2020 Indebted Graduates at AAVMC Instuonal Member Instuons8 - Median Indebtedness of 2020 Graduates9 - Minimum & Maximum Indebtedness of 2020 Graduates by U.S. College of VeterinaryMedicine

1 2 3 4 5 6 7 8 9
First Year Resident Tuition & Feesat U.S. Colleges of Veterinary Medicine
Internal AAVMC Data Reports2021
$0 $10,000 $20,000 $30,000 $40,000 $50,000 $60,000 $70,000
First Year Tuition & Fees
MIDLIUWESTUFPENNLMUTUSCSUCORUS AverageOSUWISMINUCDILLMSUTENNFLAUMOLSUMISOREWSUTAMUISUVMROKLAUBKSUPURUGANCSU

1 2 3 4 5 6 7 8 9
First Year Non-Resident Tuition & Feesat AAMC Colleges of Veterinary Medicine
Internal AAVMC Data Reports2021
$0 $20,000 $40,000 $60,000 $80,000
Non-Resident Tuition
OSUMIDUMOWSUPENNCSUTUFMINTENNLSUMSUONTWESCORISUVMRILLPEIKSUAverageUNEDWISOKLUNOMOREUGAMISAUBLMUNCSUFLAUNOSPURRUSVMUCDTUSUNOLUNQAUNCDSGUTAMUUNOGMSSU

1 2 3 4 5 6 7 8 9
Median Tuition & Feesat U.S. Colleges of Veterinary Medicine
Internal AAVMC Data Reports2011-2021
20112012201320142015201620172018201920202021
Academic Year
$0
$10,000
$20,000
$30,000
$40,000
$50,000
$60,000
$0
$10,000
$20,000
$30,000
$40,000
$50,000
$60,000Non-Resident Tuition
Resident Tuition

1 2 3 4 5 6 7 8 9
Institutional Scholarship Aid Data for All DVM Students & for1st Year DVM Students at U.S. Colleges of Veterinary Medicine
Internal AAVMC Data Reports2021
0.0% 20.0% 40.0% 60.0% 80.0% 100.0%
Percentage of First Year DVM Students Receiving Aid
$0 $1,000 $2,000 $3,000 $4,000 $5,000 $6,000 $7,000
Average Award to First Year DVM Students
Institutional scholarship aid counts any scholarship, grant or fellowship - including athletic awards - but does not include tuitionremission or other benefits associated with employment at the institution or grant dollars awarded for room and board. Thesefunds are college/university funds and are separate from externally funded scholarships such as those from student clubs,pratitioner groups, foundations or corporations.
0% 10% 20% 30% 40% 50% 60% 70% 80% 90% 100%
$0 $1,000 $2,000 $3,000 $4,000 $5,000 $6,000 $7,000
Average AwardPercengage of Students Receiving Aid

1 2 3 4 5 6 7 8 9
Mean Institutionally Reported Indebtednessat U.S. Colleges of Veterinary Medicine
Internal AAVMC Data Reports2021
2008 2010 2012 2014 2016 2018 2020
Academic Year
$0
$50,000
$100,000
$150,000
$200,000
Institutional Indebtedness
0.0%
10.0%
20.0%
30.0%
40.0%
Percentage with No Debt
Institutional IndebtednessPercentage with No Debt
Historical data has been adjusted for inflaon. Data represents indebtedness for indebted graduatesonly and all educaonal debt acquired and accrued during matriculaon in the DVM professionalprogram.

1 2 3 4 5 6 7 8 9
Percentage of 2020 Indebted Graduatesat AAVMC Member InstuonsInternal AAVMC Data Reports
2021
TUS
MID
LMU
OSU MIS
MSUWES
TENN
PUR
UMOISU
RUSVM
AUB
CSU WISOKL
US Total
ILL
KSU MIN
NCSUSGU
TUF
ORE
LSU
VMR
PENN
UNOL
WSUCOR
FLA
UGA
UCDPEI
TAMU
MSSU
0.0%
20.0%
40.0%
60.0%
80.0%
100.0%
Percentage of Indebted Graduates
AAVMC International Members indebtedness data represents 2020 U.S. graduates only.

1 2 3 4 5 6 7 8 9
Median Institutional Indebtednessat U.S. Colleges of Veterinary Medicine
Internal AAVMC Data Reports2021
School $0 $100,000 $200,000 $300,000 $400,000
Median Educational Debt for all 2020 Graduates
$0 $50,000 $100,000 $150,000 $200,000 $250,000 $300,000 $350,000
Educational Debt for Indebted 2020 Graduates Only
MIDRUSVMWESSGULMUUNOLPENNTUFILLMSSUMINOSUKSULSUUS TotalCSUMSUVMRMISTENNAUBUMOORECOROKLUCDISUWISTAMUFLANCSUUGAPURPEIWSUTUS
Educational Debt for all 2020 GraduatesEducational Debt of Indebted 2020 Graduates Only
AAVMC International Members indebtednessdata represents 2020 U.S. graduates only.

1 2 3 4 5 6 7 8 9
Minimum & Maximum Indebtedness of 2020 Graduatesat AAVMC Member InstitutionsInternal AAVMC Data Reports
2021
$0 $100,000 $200,000 $300,000 $400,000 $500,000 $600,000Minimum
$0 $100,000 $200,000 $300,000 $400,000 $500,000 $600,000Maximum
PEILSUUNOLMSUPENNFLAAUBKSUWESMIDILLLMUSGUTUFMINTENNOREUCDUS TotalCSUVMRUGAOKLCORUNCDOSUISUPURWISTAMUUMOTUSMISNCSUWSU
MinimumMaximum

1 2 3 4
College Budgets
Table of Contents
2 - Mean Revenue Percentage by Category at U.S. Colleges of VeterinaryMedicine3 - Mean Percentage by Category at U.S. Colleges of Veterinary Medicine4 - Total Research Grant Amounts by Agency at U.S. Colleges of VeterinaryMedicine

1 2 3 4
College Revenue by Categoryat U.S. Colleges of Veterinary Medicine
Internal AAVMC Data Reports2020-2021
0.0% 20.0% 40.0% 60.0% 80.0% 100.0%
Average Percentage of College Budget
2020
2021
Other RevenueDevelopment RevenueRevenue from Tuion/FeesDirect Government Appropriaon to CVMGrants & ContractsUniversity Appropriaon to CVMTeaching Hospital & Diagnosc Lab Revenue
Mean 2020Total CollegeBudget
$89,456,649
Mean 2021Total CollegeBudget
$89,456,649

1 2 3 4
College Expenditure by Categoryat U.S. Colleges of Veterinary Medicine
Internal AAVMC Data Reports2020-2021
0.0% 20.0% 40.0% 60.0% 80.0% 100.0%
Average Percentage of College Expenditures
2020
2021
Mean 2020Total CollegeExpenditures$89,433,074
Mean 2021Total CollegeExpenditures$89,990,581
Extramurally Sponsored Student AidUniversity Sponsored Student AidService ExpendituresOther ExpendituresResearch ExpendituresTeaching Hospital & Diagnostic Lab ExpendituresInstruction, Academic Support & Student Services
1 2 3 4
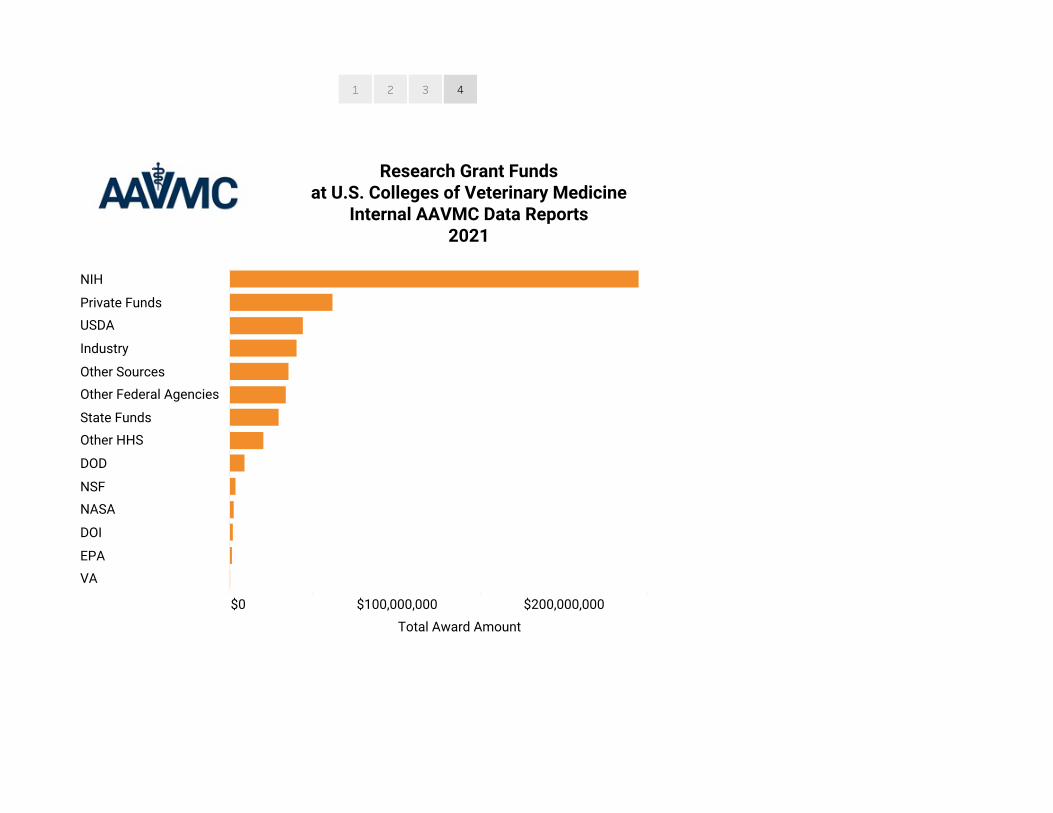
Research Grant Fundsat U.S. Colleges of Veterinary Medicine
Internal AAVMC Data Reports2021
$0 $100,000,000 $200,000,000
Total Award Amount
NIH
Private Funds
USDA
Industry
Other Sources
Other Federal Agencies
State Funds
Other HHS
DOD
NSF
NASA
DOI
EPA
VA

1 2 3 4 5 6 7 8 9 10 11 12
Academic Personnel atU.S. Colleges of Veterinary Medicine
Table of Contents
2 - Total Faculty at U.S. Colleges of Veterinary Medicine3 - Percentage of Faculty by Position at U.S. Colleges of Veterinary Medicine4 - URVM Faculty by Position at U.S. Colleges of Veterinary Medicine5 - Women Faculty by Position at U.S. Colleges of Veterinary Medicine6 - Total Number of Residents at U.S. Colleges of Veterinary Medicine7 - Resident Salaries by State8 - Resident Salaries by Practice Area9 - Total Number of Interns at U.S. Colleges of Veterinary Medicine10 - Intern Salaries by State11 - Intern Salaries by Practice Area12- Total Number of Certified Veterinary Technicians at U.S. Colleges ofVeterinary Medicine

1 2 3 4 5 6 7 8 9 10 11 12
Total Number of Facultyat U.S. Colleges of Veterinary Medicine
Internal AAVMC Data Reports2010 - 2021
2010 2011 2012 2013 2014 2015 2016 2017 2018 2019 2020 2021
Academic Year
0
2,000
4,000
6,000
8,000
Total Number of Faculty
This data does not include temporary/locum faculty, residents or interns. This data represents onlyadministrators with faculty appointments, all tenured-track positions, and non-tenured track clinicaland research faculty.

1 2 3 4 5 6 7 8 9 10 11 12
Faculty by Percentage of Positions Heldat U.S. Colleges of Veterinary Medicine
Internal AAVMC Data Reports2017 - 2021
2016 2017 2018 2019 2020 2021 2022
Academic Year
0.0%
20.0%
40.0%
60.0%
80.0%
100.0%
Percentage of Total Faculty Positions
AdministratorNon-Tenure Faculty: ResearchNon-Tenure Faculty: ClinicalTenure/Tenure Track Faculty
The total number of faculty atUS Colleges of Veterinary Medicine is 4,385.

1 2 3 4 5 6 7 8 9 10 11 12
URVM Faculty by Percentage of Positions Heldat U.S. Colleges of Veterinary Medicine
Internal AAVMC Data Reports2013 - 2019
URVM: Underrepresented in Veterinary Medicine.
In this context, the data is specific to racial/ethnic underrepresentaon.The data shown represents the percentage of URVM faculty perposion type per year.
Total faculty data is unavailable for 2016.
2012 2013 2014 2015 2016 2017 2018 2019 2020
Academic Year
0.0%
10.0%
20.0%
30.0%
40.0%
Percentage by Faculty Position
URVM AdministratorURVM Research FacultyURVM Clinical FacultyURVM Tenure/Tenure Track Faculty

1 2 3 4 5 6 7 8 9 10 11 12
Women Faculty by Percentage of Positions Heldat U.S. Colleges of Veterinary Medicine
Internal AAVMC Data Reports2017 - 2021
The data shown represents the percentage of women faculty per positiontype per year.
2016 2017 2018 2019 2020 2021 2022
Academic Year
0.0%
20.0%
40.0%
60.0%
80.0%
100.0%
Percentage by Faculty Position
Women Administrators
Women Clinical Faculty
Women Research Faculty
Women Tenure/Tenure Track Faculty

1 2 3 4 5 6 7 8 9 10 11 12
Total Number of Resident Traineesat U.S. Colleges of Veterinary Medicine
Internal AAVMC Data Reports2021
0 10 20 30 40 50 60 70 80 90 100 110
Number of Residents
UCDNCSUCSUPENNCORFLAWISOSUUGATAMUTUFMINILLTENNMSUUMOWSUPURAUBVMRLSUKSUISUMISOREOKLMID
URVM means Underrepresented in Veterinary Medicine; in this chart, URVM is specific to historicracial/ethnic underrepresentation.
The total number of resident trainees is 1,299.

1 2 3 4 5 6 7 8 9 10 11 12
Resident Salaries by StateVIRMP Match Data
2021
The total number of residents at US Colleges of Veterinary Medicine is 329.The national mean and median salaries are $37,375 and $36,000, respectively.
© 2021 Mapbox © OpenStreetMap

1 2 3 4 5 6 7 8 9 10 11 12
Resident Salaries by Practice AreaVIRMP Match Data
2021
The total number of residents at US Colleges of Veterinary Medicine is 329.The national mean and median salaries are $37,375 and $36,000, respectively.
$30,000 $40,000 $50,000 $60,000
Median
$30,000 $40,000 $50,000 $60,000
Mean
AmbulatoryAnesthesiaAvian MedicineCardiologyClinical NutritionDentistryDermatologyDiagnostic Imaging And RadiologyEmergency Medicine/Critical CareEquine MedicineEquine SurgeryExotic/Wildlife/ZooFood Animal Medicine And SurgeryHerd Medicine/Agricultural Practices/Herd ProductionLaboratory Animal/Comparative MedicineMedicine - Large AnimalMedicine - Small AnimalNeurology/NeurosurgeryOncologyOphthalmologyRadiation Oncology/TherapySports Medicine And RehabilitationSurgery - Large AnimalSurgery - Small AnimalTheriogenologyZoological Medicine
MeanMedian

1 2 3 4 5 6 7 8 9 10 11 12
Total Number of Intern Traineesat U.S. Colleges of Veterinary Medicine
Internal AAVMC Data Reports2021
URVM means Underrepresented in Veterinary Medicine; in this chart, URVM is specific to historicracial/ethnic underrepresentation.
The total number of intern trainees is 480.
0 5 10 15 20 25 30 35 40 45
Number of Interns
TUFLSUFLANCSUILLUMOUGACORTAMUPENNOSUWSUVMRMISAUBMINWISTENNMSUKSUISUCSUPURUCDOREOKLTUSMID

1 2 3 4 5 6 7 8 9 10 11 12
Intern Salaries by StateVIRMP Match Data
2021
The total number of interns at US Colleges of Veterinary Medicine is 371.The national mean and median salaries are $30,306 and $29,050, respectively.
© 2021 Mapbox © OpenStreetMap

1 2 3 4 5 6 7 8 9 10 11 12
Intern Salaries by Practice AreaVIRMP Match Data
2021
The total number of interns at US Colleges of Veterinary Medicine is 371.The national mean and median salaries are $30,306 and $29,050, respectively.
$20,000 $25,000 $30,000 $35,000 $40,000
Median
$20,000 $25,000 $30,000 $35,000 $40,000
Mean
Agricultural PracticesAmbulatoryAnesthesiologyAvianCardiologyClinical NutritionCommunity PracticeDermatologyDiagnostic Imaging & RadiologyEmergency Medicine/Critical CareEquineExotic/Wildlife/ZooFarm Practice/Production Animal MedicineFood AnimalLarge Animal RotatingLarge Animal Rotating (Diversity)*Large Animal SurgeryNeurologyOncologyOtherShelter MedicineSmall Animal Internal MedicineSmall Animal RotatingSmall Animal Rotating (Diversity)*Small Animal SurgerySports Medicine & Rehabilitation
MeanMedian

1 2 3 4 5 6 7 8 9 10 11 12
Total Number of Certified Veterinary Techniciansat U.S. Colleges of Veterinary Medicine
Internal AAVMC Data Reports2021
The total number of Cerfied Veterinary Technicians is 1,932
0 10 20 30 40 50 60 70 80 90 100 110 120 130
Credentialed Veterinary Technicians
PENNMINUCDOSUCORMSUILLNCSUPURWISTUFTENNUGAFLAVMRCSUUMOMISISUORETAMUWSUKSULSUAUBOKLMIDWESLMUTUSLIU