1 1 privatization update: gencos and transco january 2005 presentation to ledac
TRANSCRIPT
1111
Privatization Update:Privatization Update:
GENCOS and TRANSCOGENCOS and TRANSCO
January 2005
Presentation to LEDAC
Feb OctJul Aug Sep Nov DecJan Mar Apr May Jun
12 MW Masiway
150 MW Bacman
192.5 MW Palinpinon
75 MW Ambuklao / 100 MW
Binga
112.5 MW Tongonan
275 MW Tiwi /410
MW Makban
600 MW Calaca
44.8 MW Iligan II
146.5 MW Dingle
(110 MW Pinamuca
n/ 36.5 MW
Panay I)
2005
850 MW Sucat
620 MW Limay/ Bataan Thermal
Site
210 MW Navotas I / 100
MW Navotas II
108 MW Aplaya
22.3 MW Gen.Santo
s
54 MW Cebu II
225 MW Bataan Thermal
200 MW Manila
Thermal22 MW Bohol
FebJan Mar Apr
360 MW Magat
0.8 MW Amlan
2006
246 MW Angat
100 MW Pantabanga
n
68.5 MW Iligan I
Operating Plants
Non-TSC
Decommissioned Plants/Non-TSC
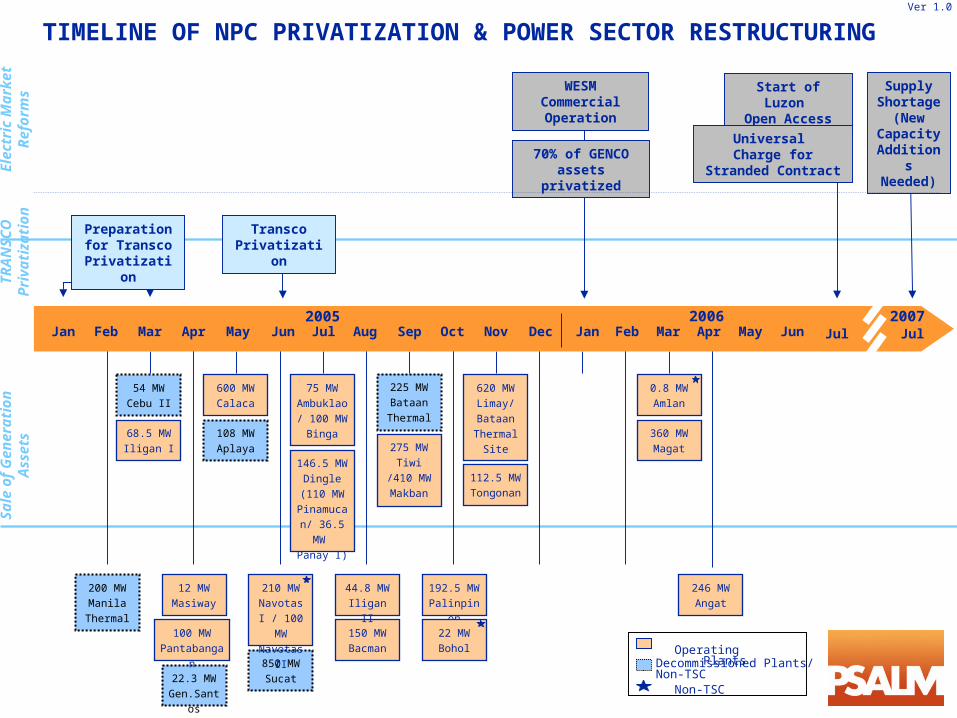
Preparation for Transco Privatizatio
n
70% of GENCO assets
privatized
WESM Commercial Operation
Start of Luzon Open Access
Universal Charge for
Stranded Contract
Jul Jul
Supply Shortage (New Capacit
y Addition
s Needed)
2007May Jun
Transco Privatizatio
n
Sale
of
Gen
era
tion
A
ssets
TR
AN
SC
OP
rivati
zati
on
Ele
ctr
ic M
ark
et
Refo
rms
TIMELINE OF NPC PRIVATIZATION & POWER SECTOR RESTRUCTURING Ver 1.0
3333
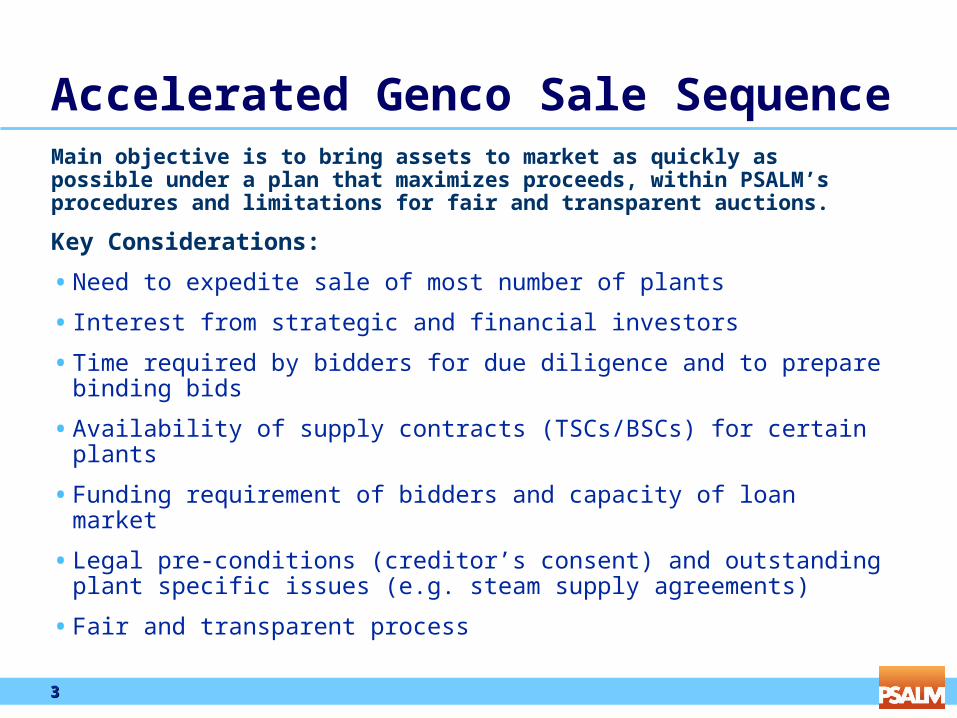
Accelerated Genco Sale Sequence Main objective is to bring assets to market as quickly as possible under a plan that maximizes proceeds, within PSALM’s procedures and limitations for fair and transparent auctions.
Key Considerations:
• Need to expedite sale of most number of plants
• Interest from strategic and financial investors
• Time required by bidders for due diligence and to prepare binding bids
• Availability of supply contracts (TSCs/BSCs) for certain plants
• Funding requirement of bidders and capacity of loan market
• Legal pre-conditions (creditor’s consent) and outstanding plant specific issues (e.g. steam supply agreements)
• Fair and transparent process
4444
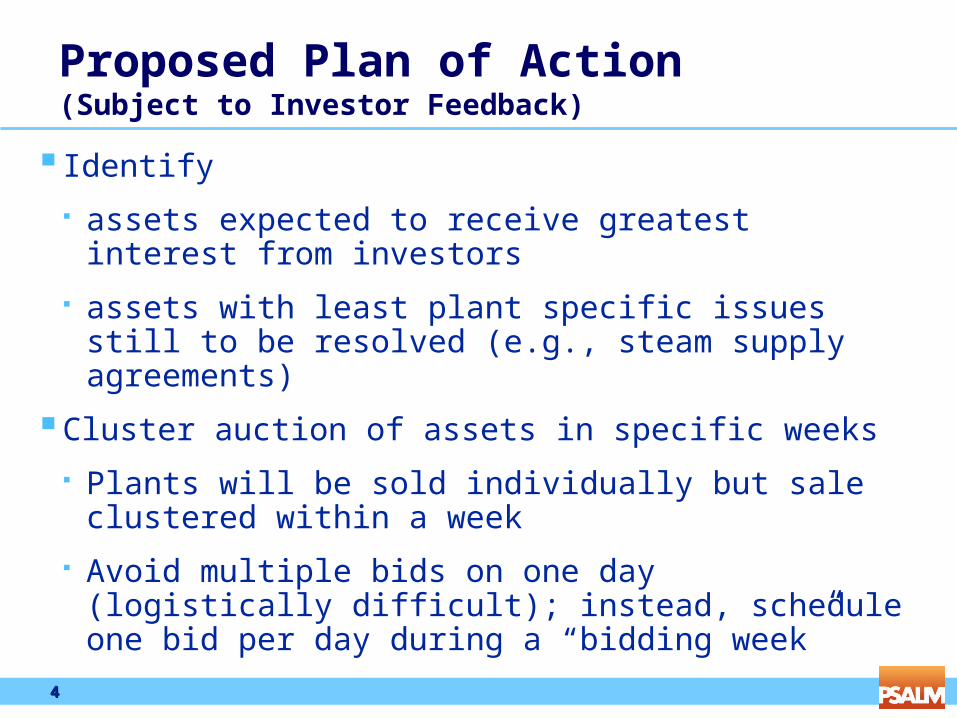
Proposed Plan of Action(Subject to Investor Feedback)
Identify
assets expected to receive greatest interest from investors
assets with least plant specific issues still to be resolved (e.g., steam supply agreements)
Cluster auction of assets in specific weeks
Plants will be sold individually but sale clustered within a week
Avoid multiple bids on one day (logistically difficult); instead, schedule one bid per day during a “bidding week”
5555
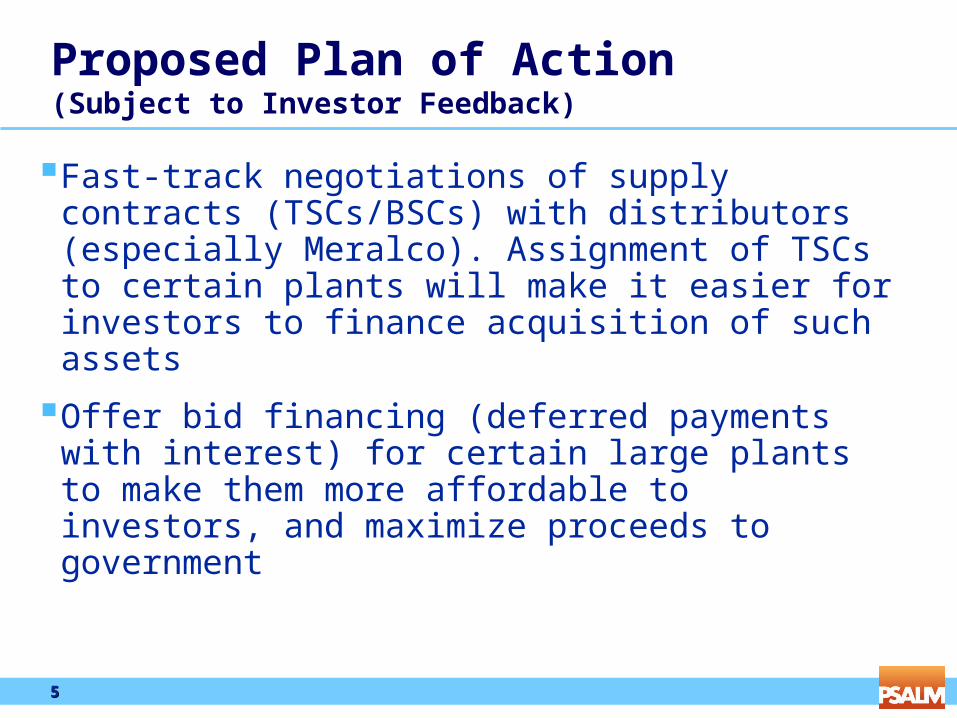
Proposed Plan of Action(Subject to Investor Feedback)
Fast-track negotiations of supply contracts (TSCs/BSCs) with distributors (especially Meralco). Assignment of TSCs to certain plants will make it easier for investors to finance acquisition of such assets
Offer bid financing (deferred payments with interest) for certain large plants to make them more affordable to investors, and maximize proceeds to government
6666
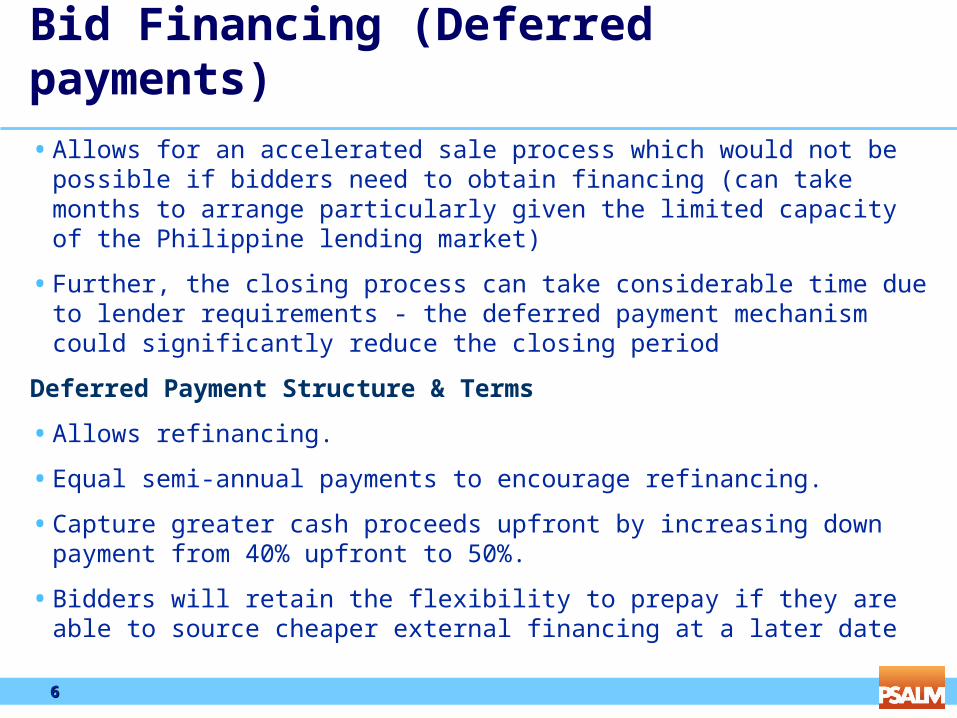
Bid Financing (Deferred payments)
• Allows for an accelerated sale process which would not be possible if bidders need to obtain financing (can take months to arrange particularly given the limited capacity of the Philippine lending market)
• Further, the closing process can take considerable time due to lender requirements - the deferred payment mechanism could significantly reduce the closing period
Deferred Payment Structure & Terms
• Allows refinancing.
• Equal semi-annual payments to encourage refinancing.
• Capture greater cash proceeds upfront by increasing down payment from 40% upfront to 50%.
• Bidders will retain the flexibility to prepay if they are able to source cheaper external financing at a later date
7777
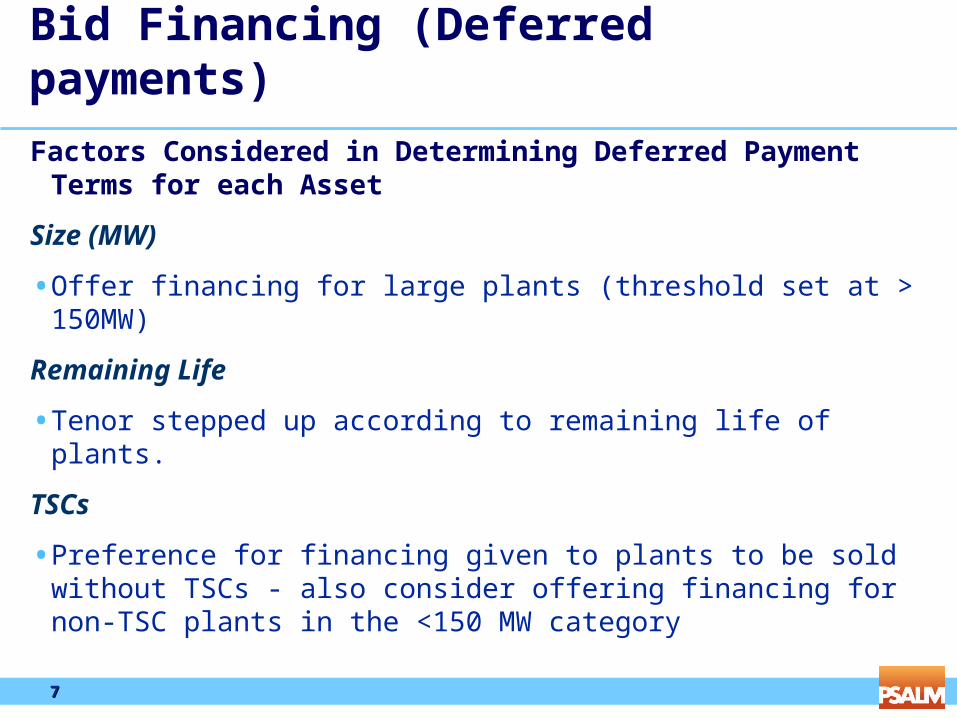
Bid Financing (Deferred payments)
Factors Considered in Determining Deferred Payment Terms for each Asset
Size (MW)
• Offer financing for large plants (threshold set at > 150MW)
Remaining Life
• Tenor stepped up according to remaining life of plants.
TSCs
• Preference for financing given to plants to be sold without TSCs - also consider offering financing for non-TSC plants in the <150 MW category

Masinloc Case StudyMasinloc Case Study
9999
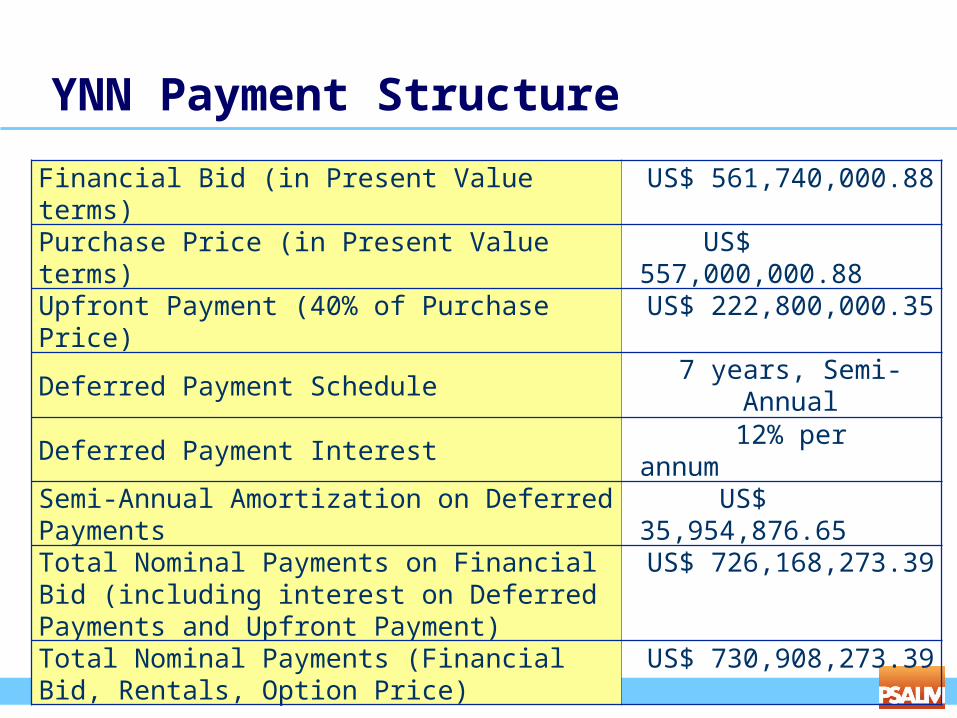
YNN Payment Structure
Financial Bid (in Present Value terms) US$ 561,740,000.88
Purchase Price (in Present Value terms) US$ 557,000,000.88
Upfront Payment (40% of Purchase Price) US$ 222,800,000.35
Deferred Payment Schedule7 years, Semi-Annual
Deferred Payment Interest 12% per annum
Semi-Annual Amortization on Deferred Payments US$ 35,954,876.65
Total Nominal Payments on Financial Bid (including interest on Deferred Payments and Upfront Payment)
US$ 726,168,273.39
Total Nominal Payments (Financial Bid, Rentals, Option Price)
US$ 730,908,273.39
10101010
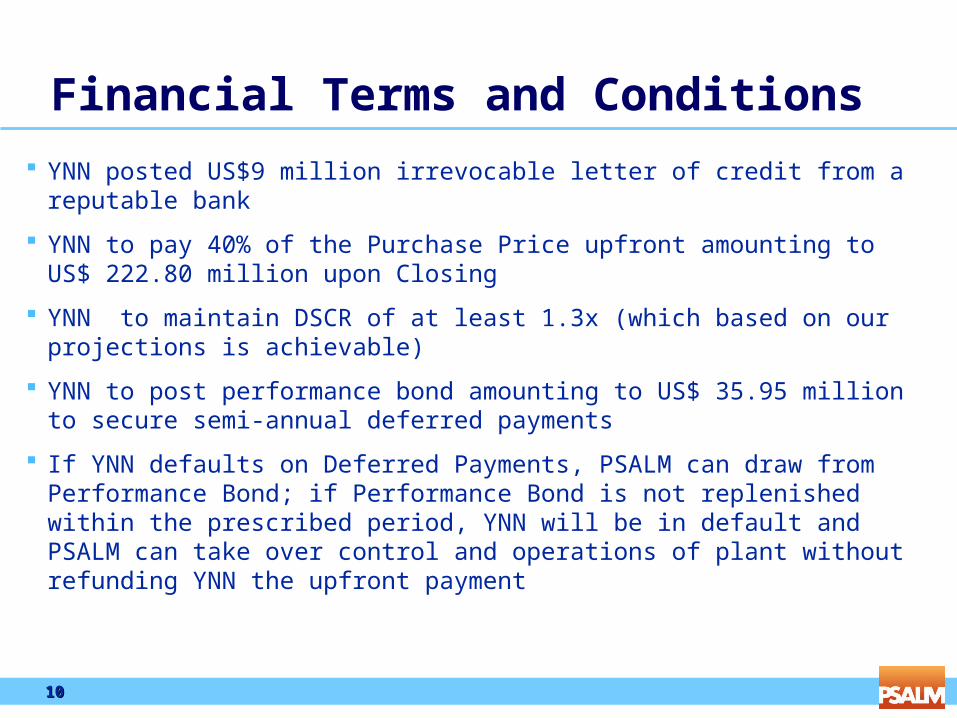
Financial Terms and Conditions
YNN posted US$9 million irrevocable letter of credit from a reputable bank
YNN to pay 40% of the Purchase Price upfront amounting to US$ 222.80 million upon Closing
YNN to maintain DSCR of at least 1.3x (which based on our projections is achievable)
YNN to post performance bond amounting to US$ 35.95 million to secure semi-annual deferred payments
If YNN defaults on Deferred Payments, PSALM can draw from Performance Bond; if Performance Bond is not replenished within the prescribed period, YNN will be in default and PSALM can take over control and operations of plant without refunding YNN the upfront payment
11111111
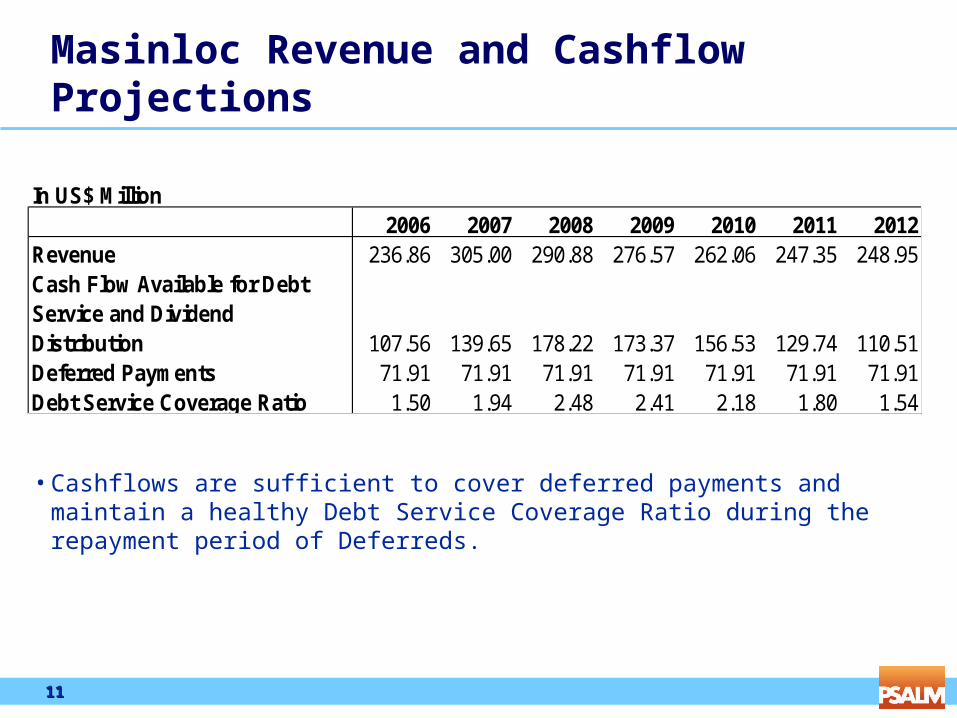
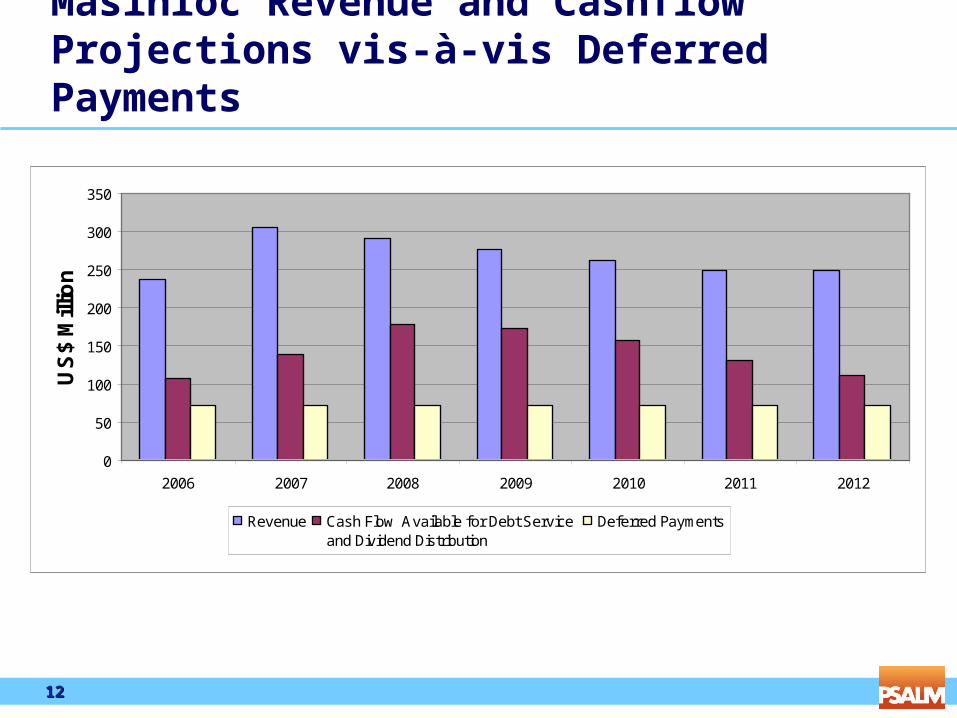
Masinloc Revenue and Cashflow Projections
• Cashflows are sufficient to cover deferred payments and maintain a healthy Debt Service Coverage Ratio during the repayment period of Deferreds.
In US$ Million 2006 2007 2008 2009 2010 2011 2012
Revenue 236.86 305.00 290.88 276.57 262.06 247.35 248.95Cash Flow Available for Debt Service and Dividend Distribution 107.56 139.65 178.22 173.37 156.53 129.74 110.51Deferred Payments 71.91 71.91 71.91 71.91 71.91 71.91 71.91Debt Service Coverage Ratio 1.50 1.94 2.48 2.41 2.18 1.80 1.54
12121212
Masinloc Revenue and Cashflow Projections vis-à-vis Deferred Payments
0
50
100
150
200
250
300
350
2006 2007 2008 2009 2010 2011 2012
US
$ M
illio
n
Revenue Cash Flow Available for Debt Service and Dividend Distribution
Deferred Payments
13131313
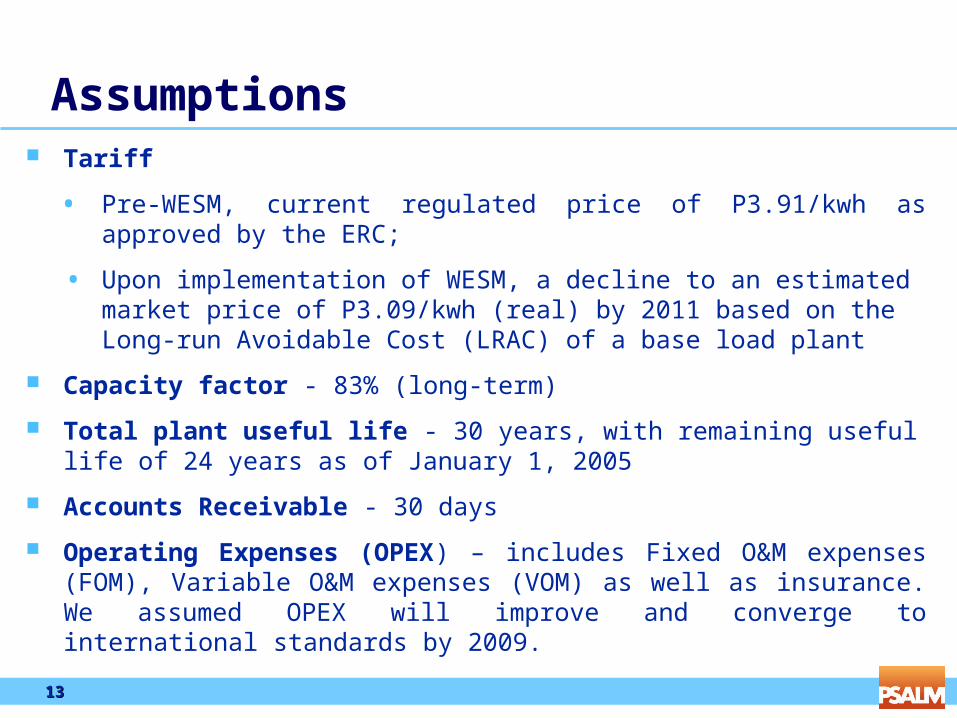
Assumptions Tariff
• Pre-WESM, current regulated price of P3.91/kwh as approved by the ERC;
• Upon implementation of WESM, a decline to an estimated market price of P3.09/kwh (real) by 2011 based on the Long-run Avoidable Cost (LRAC) of a base load plant
Capacity factor - 83% (long-term)
Total plant useful life - 30 years, with remaining useful life of 24 years as of January 1, 2005
Accounts Receivable - 30 days
Operating Expenses (OPEX) – includes Fixed O&M expenses (FOM), Variable O&M expenses (VOM) as well as insurance. We assumed OPEX will improve and converge to international standards by 2009.

Masinloc Next Steps and TimetableMasinloc Next Steps and Timetable
15151515
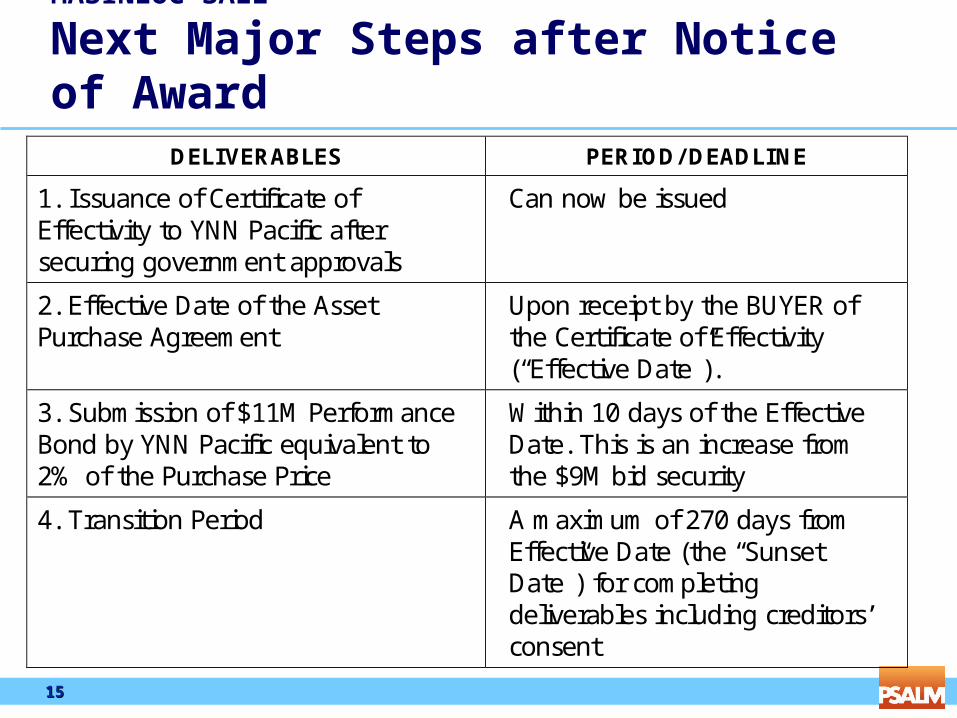
MASINLOC SALE
Next Major Steps after Notice of Award ̀ DELIVERABLES PERIOD/ DEADLINE
1. Issuance of Certificate of Effectivity to YNN Pacific after securing government approvals
Can now be issued
2. Effective Date of the Asset Purchase Agreement
Upon receipt by the BUYER of the Certificate of Effectivity (“Effective Date”).
3. Submission of $11M Performance Bond by YNN Pacific equivalent to 2% of the Purchase Price
Within 10 days of the Effective Date. This is an increase from the $9M bid security
4. Transition Period A maximum of 270 days from Effective Date (the “Sunset Date”) for completing deliverables including creditors’ consent
16161616
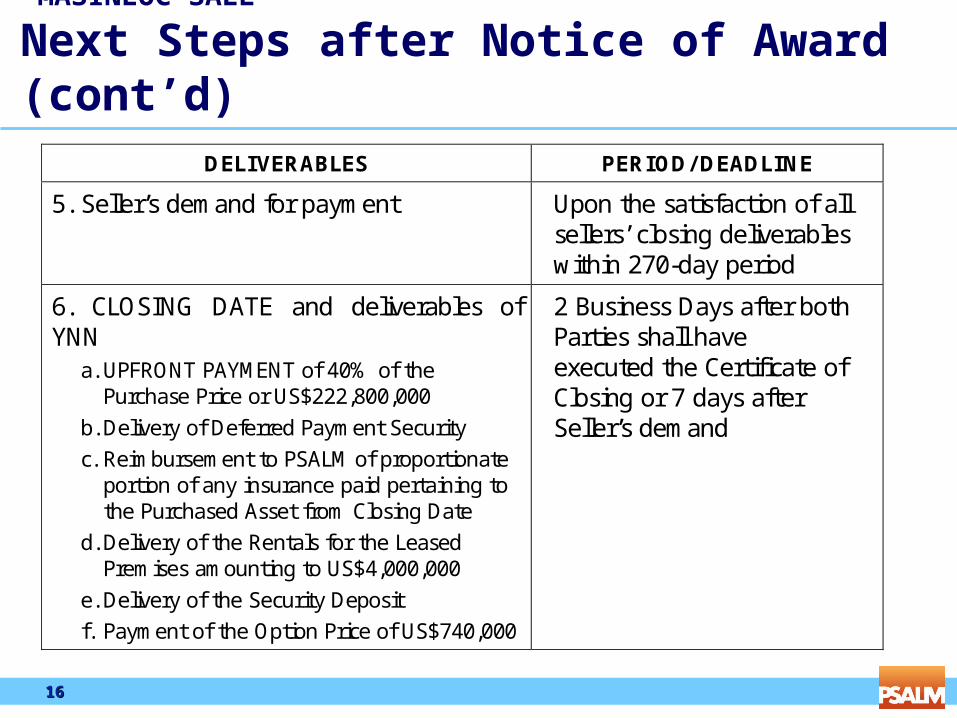
MASINLOC SALE
Next Steps after Notice of Award (cont’d) DELIVERABLES PERIOD/ DEADLINE
5. Seller’s demand for payment Upon the satisfaction of all sellers’ closing deliverables within 270-day period
6. CLOSING DATE and deliverables of YNN
a. UPFRONT PAYMENT of 40% of the Purchase Price or US$222,800,000
b. Delivery of Deferred Payment Security c. Reimbursement to PSALM of proportionate
portion of any insurance paid pertaining to the Purchased Asset from Closing Date
d. Delivery of the Rentals for the Leased Premises amounting to US$4,000,000
e. Delivery of the Security Deposit f. Payment of the Option Price of US$740,000
2 Business Days after both Parties shall have executed the Certificate of Closing or 7 days after Seller’s demand
17171717
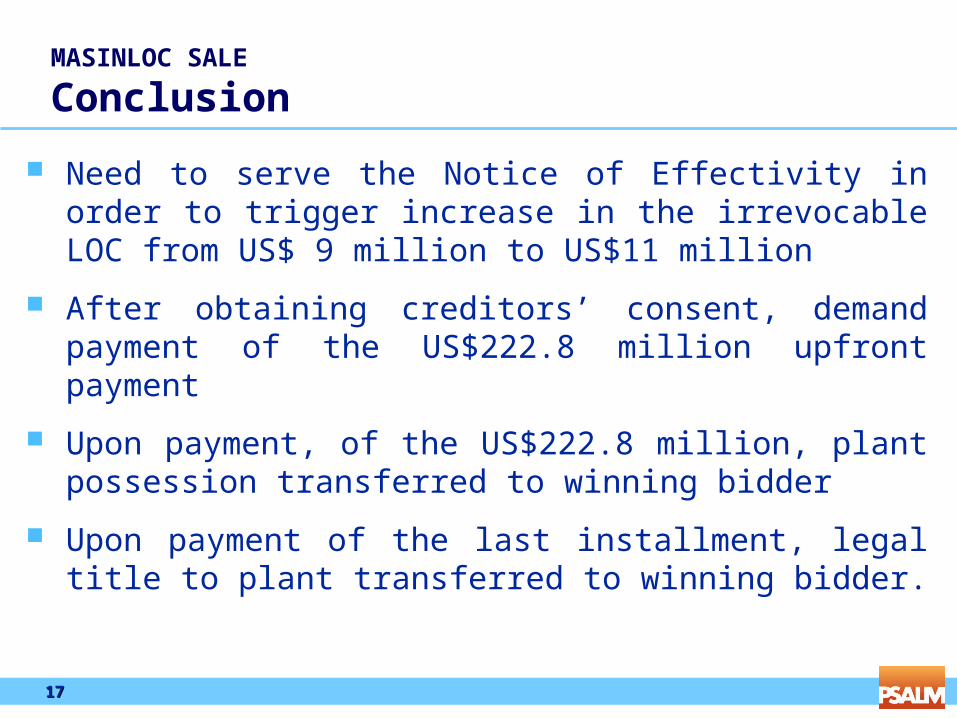
MASINLOC SALE
Conclusion
Need to serve the Notice of Effectivity in order to trigger increase in the irrevocable LOC from US$ 9 million to US$11 million
After obtaining creditors’ consent, demand payment of the US$222.8 million upfront payment
Upon payment, of the US$222.8 million, plant possession transferred to winning bidder
Upon payment of the last installment, legal title to plant transferred to winning bidder.

TRANSCOTRANSCO
19191919
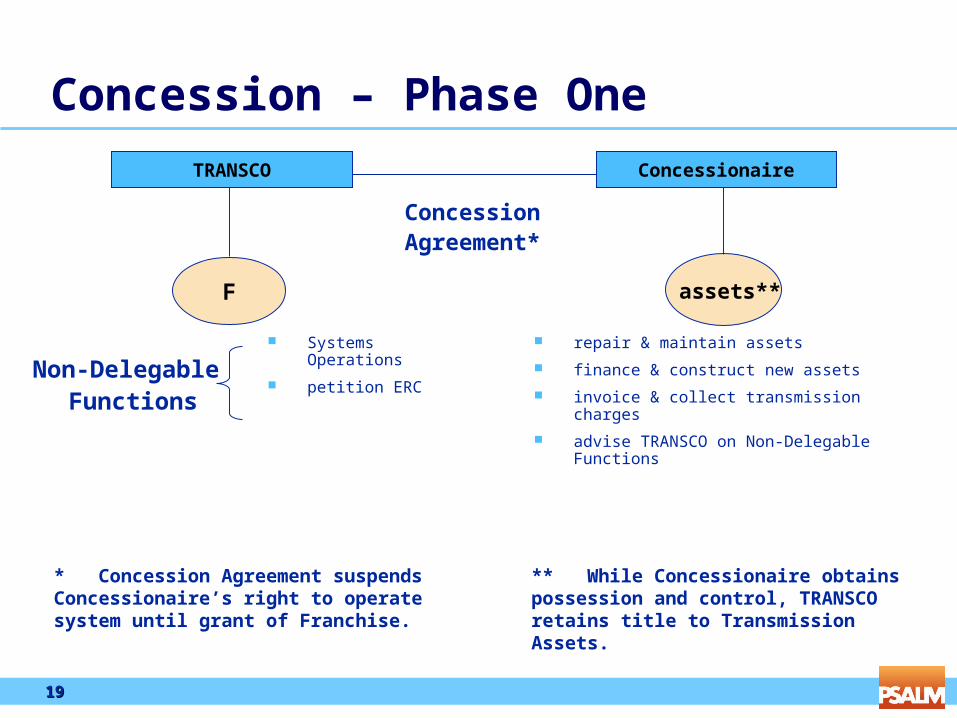
Concession – Phase One
Systems Operations
petition ERC
repair & maintain assets
finance & construct new assets
invoice & collect transmission charges
advise TRANSCO on Non-Delegable Functions
Non-Delegable Functions
Concession Agreement*
assets**F
ConcessionaireTRANSCO
* Concession Agreement suspends Concessionaire’s right to operate system until grant of Franchise.
** While Concessionaire obtains possession and control, TRANSCO retains title to Transmission Assets.
20202020
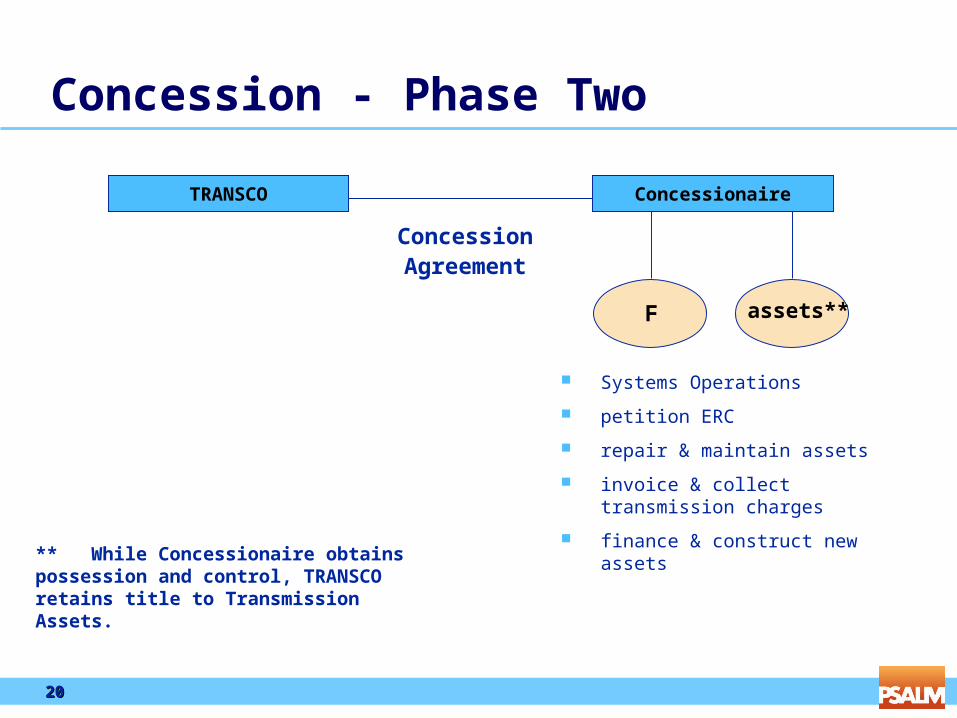
Concession - Phase Two
Systems Operations
petition ERC
repair & maintain assets
invoice & collect transmission charges
finance & construct new assets
Concession Agreement
assets**F
ConcessionaireTRANSCO
** While Concessionaire obtains possession and control, TRANSCO retains title to Transmission Assets.
21212121
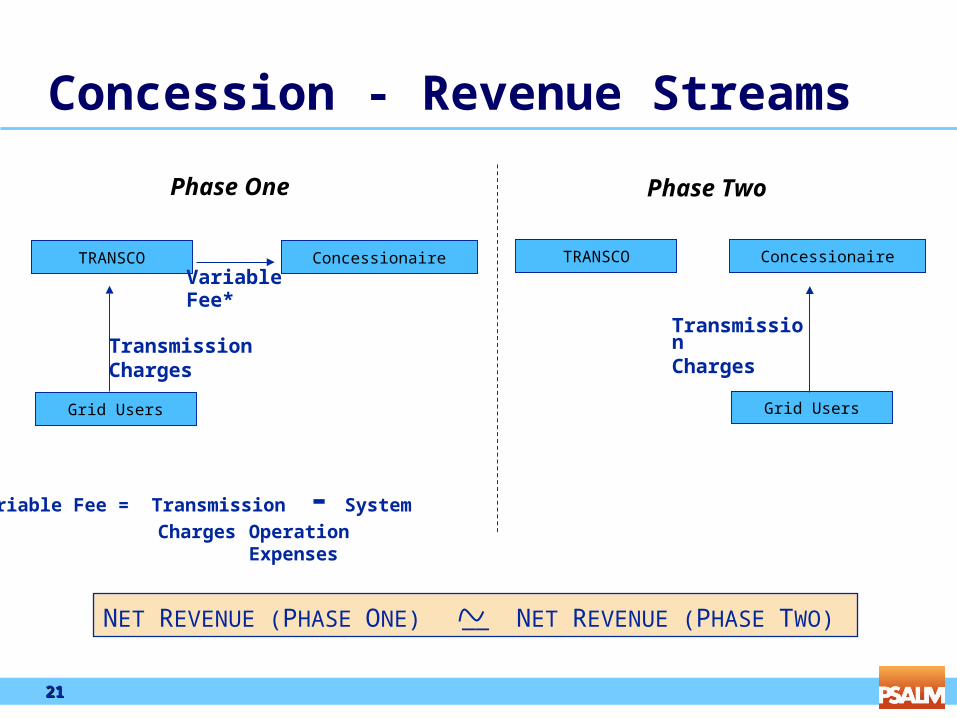
Concession - Revenue Streams
ConcessionaireTRANSCO
Transmission Charges
*Variable Fee = Transmission - System
Charges OperationExpenses
Phase One Phase Two
ConcessionaireTRANSCOVariable Fee*
Grid Users Grid Users
Transmission Charges
NET REVENUE (PHASE ONE) __ NET REVENUE (PHASE TWO)
22222222
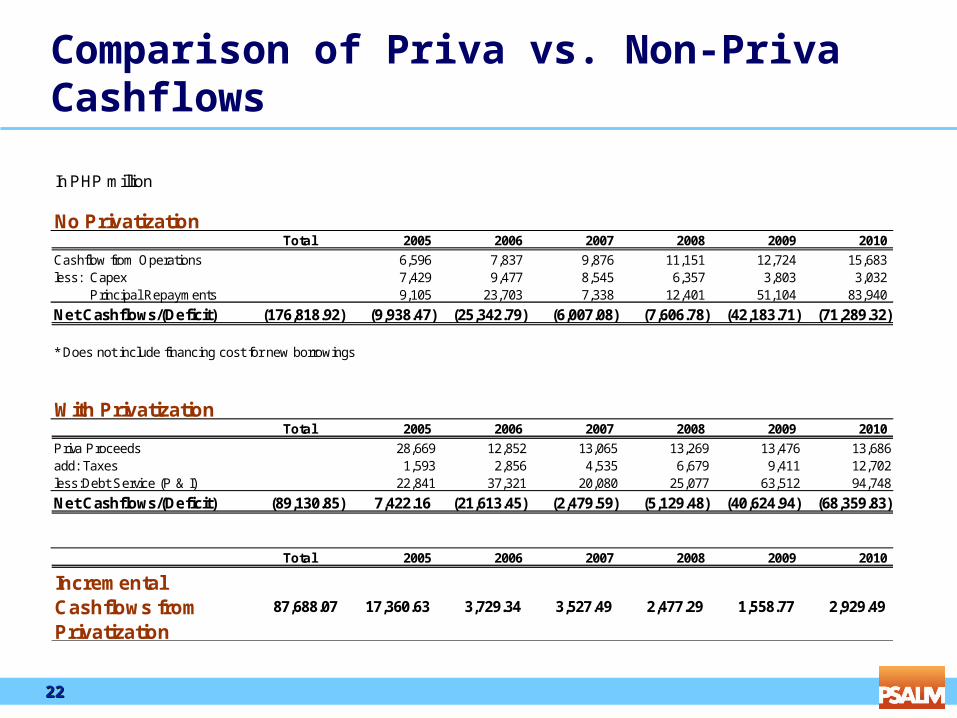
Comparison of Priva vs. Non-Priva Cashflows
In PHP million
No PrivatizationTotal 2005 2006 2007 2008 2009 2010
Cashflow from Operations 6,596 7,837 9,876 11,151 12,724 15,683 less: Capex 7,429 9,477 8,545 6,357 3,803 3,032 Principal Repayments 9,105 23,703 7,338 12,401 51,104 83,940
Net Cashflows/(Deficit) (176,818.92) (9,938.47) (25,342.79) (6,007.08) (7,606.78) (42,183.71) (71,289.32)
* Does not include financing cost for new borrowings
With PrivatizationTotal 2005 2006 2007 2008 2009 2010
Priva Proceeds 28,669 12,852 13,065 13,269 13,476 13,686add: Taxes 1,593 2,856 4,535 6,679 9,411 12,702less:Debt Service (P & I) 22,841 37,321 20,080 25,077 63,512 94,748
Net Cashflows/(Deficit) (89,130.85) 7,422.16 (21,613.45) (2,479.59) (5,129.48) (40,624.94) (68,359.83)
Total 2005 2006 2007 2008 2009 2010
Incremental Cashflows from Privatization
87,688.07 17,360.63 3,729.34 3,527.49 2,477.29 1,558.77 2,929.49
23232323
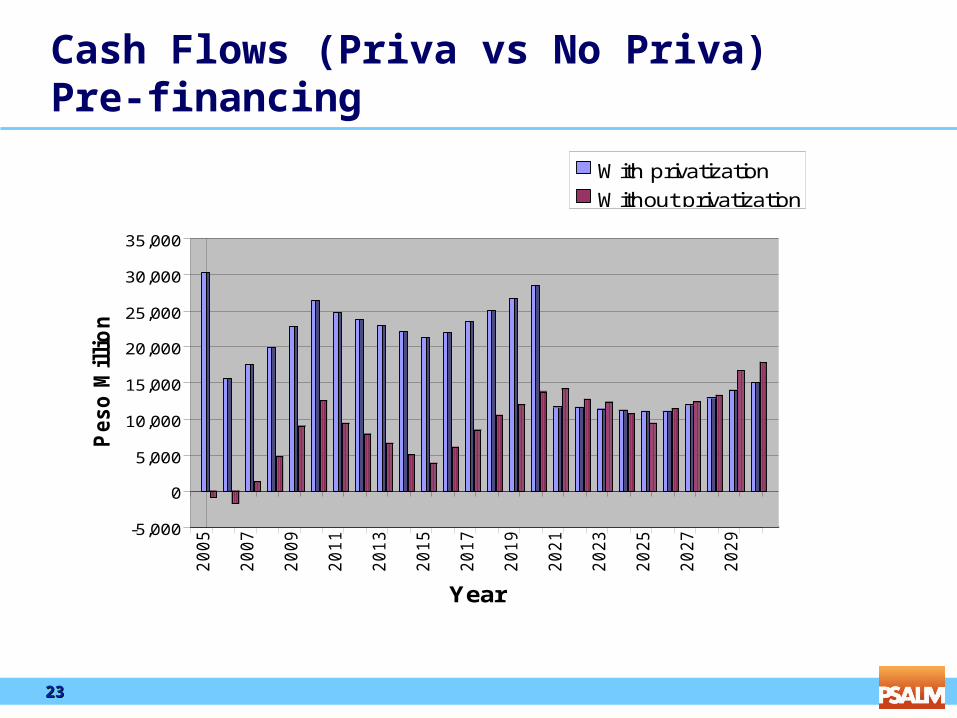
Cash Flows (Priva vs No Priva)Pre-financing
20
05
20
07
20
09
20
11
20
13
20
15
20
17
20
19
20
21
20
23
20
25
20
27
20
29-5,000
0
5,000
10,000
15,000
20,000
25,000
30,000
35,000
Peso
Mil
lio
ns
Year
With privatization
Without privatization
24242424
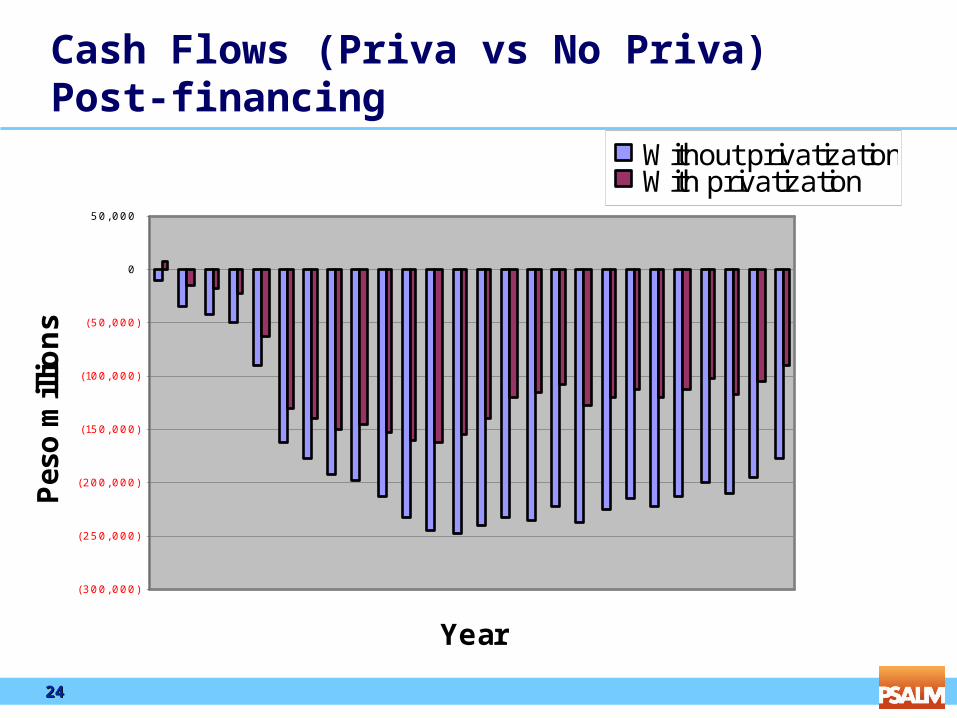
Cash Flows (Priva vs No Priva)Post-financing
(300, 000)
(250, 000)
(200, 000)
(150, 000)
(100, 000)
(50, 000)
0
50, 000
Year
Pes
o m
illio
ns
Without privatizationWith privatization

25252525