09 chapter
DESCRIPTION
gfbndnfnTRANSCRIPT
45
CHAPTER 4
RESULTS
4.1 ISOLATION AND IDENTIFICATION OF ACTINOMYCETES
FROM SOIL SAMPLES OF EASTERN GHATS
4.1.1 Soil Nutrient Analysis of Yercaud Hills
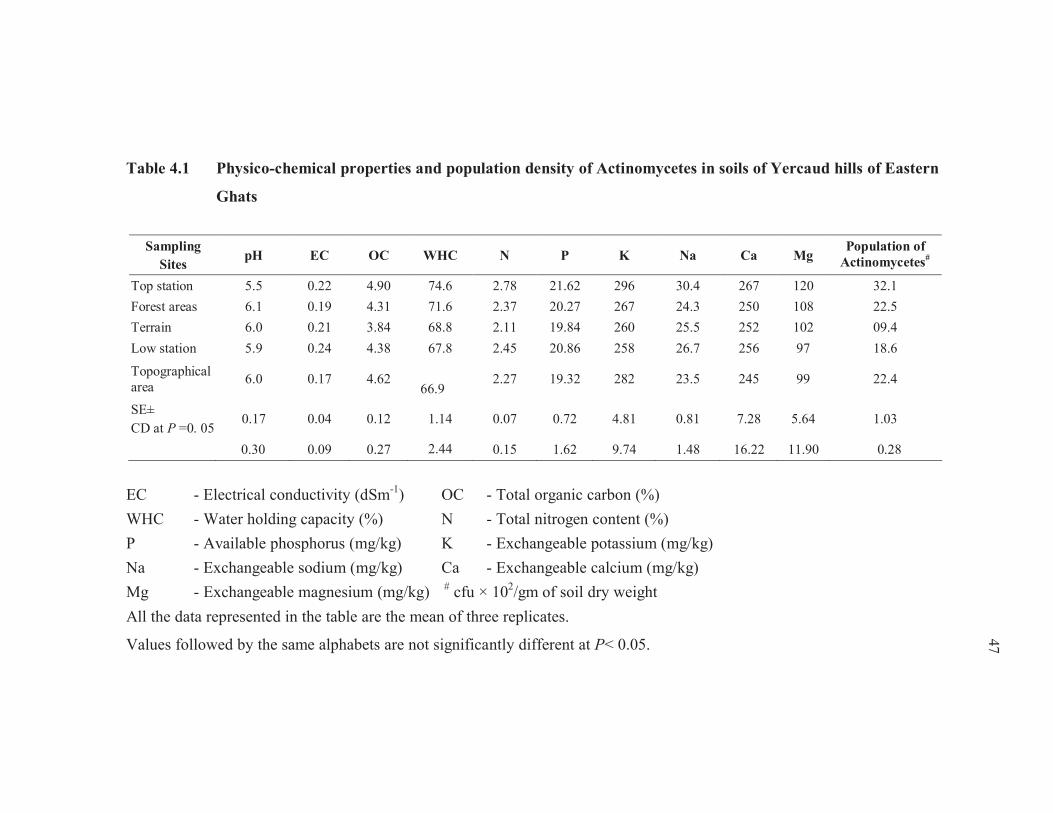
The results on soil nutrient analysis of Yercaud hills belonging to
eastern Ghats showed that soils were found to be neutral with a pH range of
5.9–6.1 (Table 4.1). Further, electrical conductivity (EC) was ranged between
0.17 and 0.24 dSm-1
and the total organic carbon content was varied in varying
levels of 3.84–4.90%. Soil samples obtained from the top station areas of
Yercaud hills registered with high organic carbon (4.90 %) content when
compared to soils of other sites analyzed. Available potassium content in soil
samples was determined between 228 and 292 mg/g of soil dry weight. A least
potassium nutrient level was observed in a low station (228 mg/kg) soil
samples. Similarly, available nitrogen and phosphorus contents were
determined between 2.11 - 2.47% and 17.86 - 21.62 mg/kg soil dry weight;
respectively. Water holding capacity (WHC) in soil samples was estimated
between 65.2 and 78.5%. The concentration of calcium was found to be higher
in top station (267 mg/kg) soils than in soil samples collected from other sites
of Yercaud hills. Available magnesium and sodium contents of soil samples
were observed between 92-108 and 20.8–26.7 mg/kg soil dry weight;
respectively.
46
4.1.2 Soil Nutrient Analysis of Kolli Hills
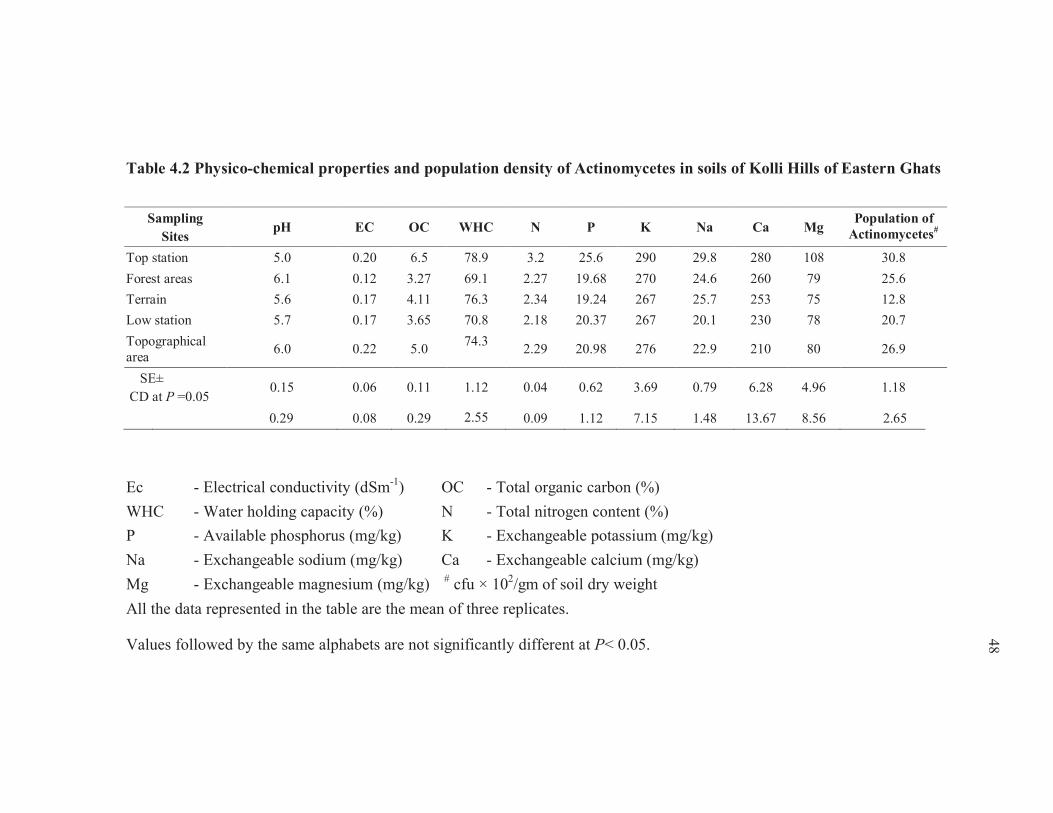
The pH of soil samples of Kolli hills to the same eastern Ghats
showed that it was found to be the same with that of the Yercaud soil with a pH
range of 5.6 – 6.2 (Table 4.2). Further, the EC and total organic carbon content
were ranged between 0.17 – 0.23 dSm-1
and 4.65%-4.88%; respectively in soil
samples. Available potassium content in a topographical area was recorded at
the maximum (296 mg/g) when compared to that of forest (282 mg/g of soil
dry weight) areas. A least nitrogen nutrient level was observed in a low station
(2.11 mg/kg) soil samples. Available phosphorus content determined was in the
range of 19.24 – 21.25 mg/kg soil dry weight. Water holding capacity (WHC)
in soil samples was estimated between 69.1 and 85.2%. Exchangeable calcium
concentration was found to be higher in the soils of forest areas (267 mg/kg)
than other sites of Kolli hills. Similarly, available magnesium and sodium
contents of soil samples were observed between 92 - 110 and 20.1– 25.7 mg/kg
soil dry weight; respectively.
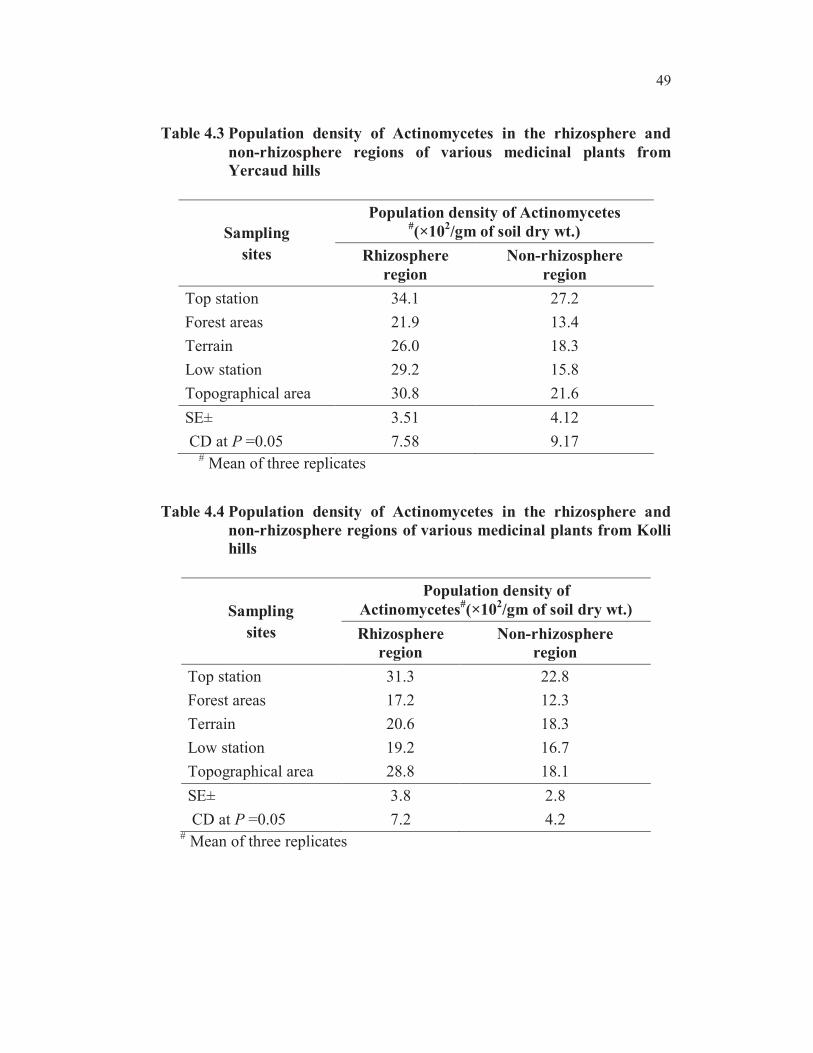
4.1.3 Population Density of Actinomycetes in Yercaud and Kolli hills
Actinomycetes population was enumerated from soil samples
collected from various sites of Yercaud and Kolli Hills of Eastern Ghats using
a starch casein nitrate (SCN) agar medium by following serial dilution
technique. Population density of actinomycetes in rhizosphere and non-
rhizosphere soils of various medicinal plants revealed that it was found to be
higher in the rhizosphere than in non-rhizosphere regions. Moreover, it was
found to be more in top station when compared to other sites of Yercaud and
Kolli hills (Tables 4.3 and 4.4). The population was found to be 34.1×10² /gm
soil dry weight in top station site, followed by topographical area (30.8 gm soil
dry weight). A least population load was recorded in the terrain region of both
rhizosphere and non-rhizosphere regions (21.9 and 13.4×10² /gm soil dry
weight; respectively). With respect to Kolli Hills, the least population density
was recorded with forest areas which accounted as 12.3×10² /gm soil dry
weight.
47
Table 4.1 Physico-chemical properties and population density of Actinomycetes in soils of Yercaud hills of Eastern
Ghats
Sampling
SitespH EC OC WHC N P K Na Ca Mg
Population of
Actinomycetes#
Top station 5.5 0.22 4.90 74.6 2.78 21.62 296 30.4 267 120 32.1
Forest areas 6.1 0.19 4.31 71.6 2.37 20.27 267 24.3 250 108 22.5
Terrain 6.0 0.21 3.84 68.8 2.11 19.84 260 25.5 252 102 09.4
Low station 5.9 0.24 4.38 67.8 2.45 20.86 258 26.7 256 97 18.6
Topographical
area6.0 0.17 4.62
66.92.27 19.32 282 23.5 245 99 22.4
SE±
CD at P =0. 050.17 0.04 0.12 1.14 0.07 0.72 4.81 0.81 7.28 5.64 1.03
0.30 0.09 0.27 2.44 0.15 1.62 9.74 1.48 16.22 11.90 0.28
EC - Electrical conductivity (dSm-1
) OC - Total organic carbon (%)
WHC - Water holding capacity (%) N - Total nitrogen content (%)
P - Available phosphorus (mg/kg) K - Exchangeable potassium (mg/kg)
Na - Exchangeable sodium (mg/kg) Ca - Exchangeable calcium (mg/kg)
Mg - Exchangeable magnesium (mg/kg) #
cfu × 102/gm of soil dry weight
All the data represented in the table are the mean of three replicates.
Values followed by the same alphabets are not significantly different at P< 0.05.
48
Table 4.2 Physico-chemical properties and population density of Actinomycetes in soils of Kolli Hills of Eastern Ghats
Sampling
SitespH EC OC WHC N P K Na Ca Mg
Population of
Actinomycetes#
Top station 5.0 0.20 6.5 78.9 3.2 25.6 290 29.8 280 108 30.8
Forest areas 6.1 0.12 3.27 69.1 2.27 19.68 270 24.6 260 79 25.6
Terrain 5.6 0.17 4.11 76.3 2.34 19.24 267 25.7 253 75 12.8
Low station 5.7 0.17 3.65 70.8 2.18 20.37 267 20.1 230 78 20.7
Topographical
area6.0 0.22 5.0
74.32.29 20.98 276 22.9 210 80 26.9
SE±
CD at P =0.050.15 0.06 0.11 1.12 0.04 0.62 3.69 0.79 6.28 4.96 1.18
0.29 0.08 0.29 2.55 0.09 1.12 7.15 1.48 13.67 8.56 2.65
Ec - Electrical conductivity (dSm-1
) OC - Total organic carbon (%)
WHC - Water holding capacity (%) N - Total nitrogen content (%)
P - Available phosphorus (mg/kg) K - Exchangeable potassium (mg/kg)
Na - Exchangeable sodium (mg/kg) Ca - Exchangeable calcium (mg/kg)
Mg - Exchangeable magnesium (mg/kg) #
cfu × 102/gm of soil dry weight
All the data represented in the table are the mean of three replicates.
Values followed by the same alphabets are not significantly different at P< 0.05.
49
Table 4.3 Population density of Actinomycetes in the rhizosphere and
non-rhizosphere regions of various medicinal plants from
Yercaud hills
Sampling
sites
Population density of Actinomycetes#(×10
2/gm of soil dry wt.)
Rhizosphere
region
Non-rhizosphere
region
Top station 34.1 27.2
Forest areas 21.9 13.4
Terrain 26.0 18.3
Low station 29.2 15.8
Topographical area 30.8 21.6
SE± 3.51 4.12
CD at P =0.05 7.58 9.17 #
Mean of three replicates
Table 4.4 Population density of Actinomycetes in the rhizosphere and
non-rhizosphere regions of various medicinal plants from Kolli
hills
Sampling
sites
Population density of
Actinomycetes#(×10
2/gm of soil dry wt.)
Rhizosphere
region
Non-rhizosphere
region
Top station 31.3 22.8
Forest areas 17.2 12.3
Terrain 20.6 18.3
Low station 19.2 16.7
Topographical area 28.8 18.1
SE± 3.8 2.8
CD at P =0.05 7.2 4.2 #
Mean of three replicates
50
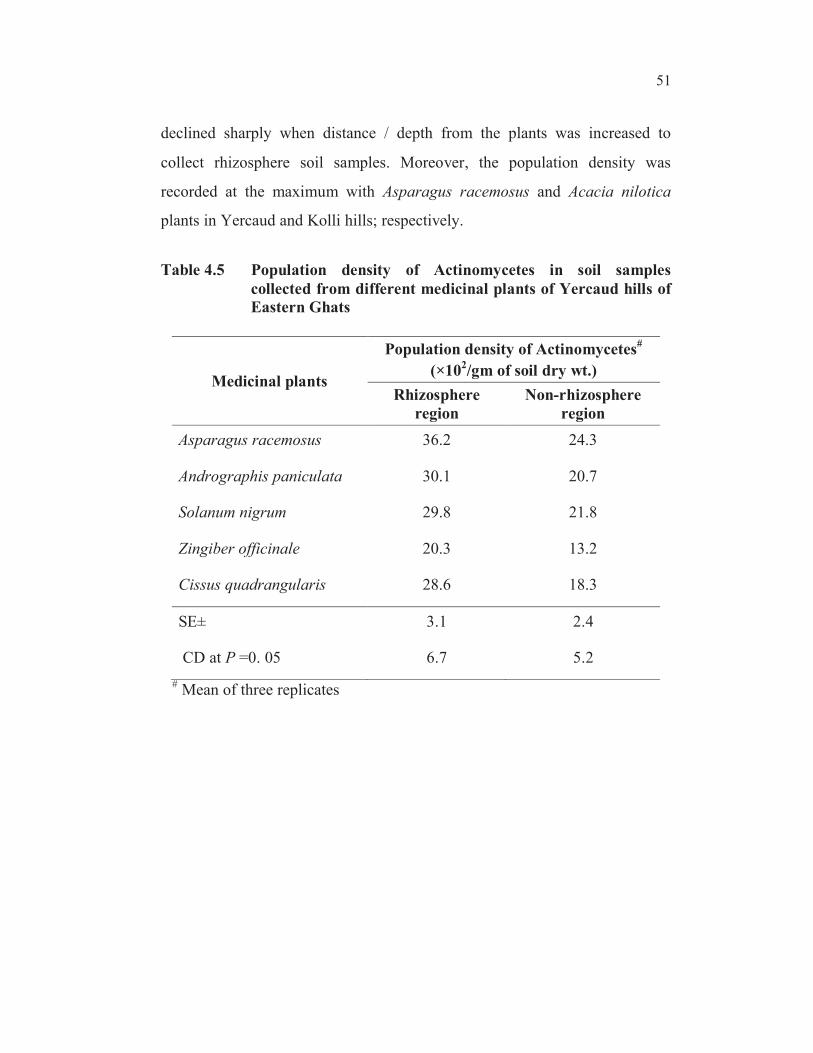
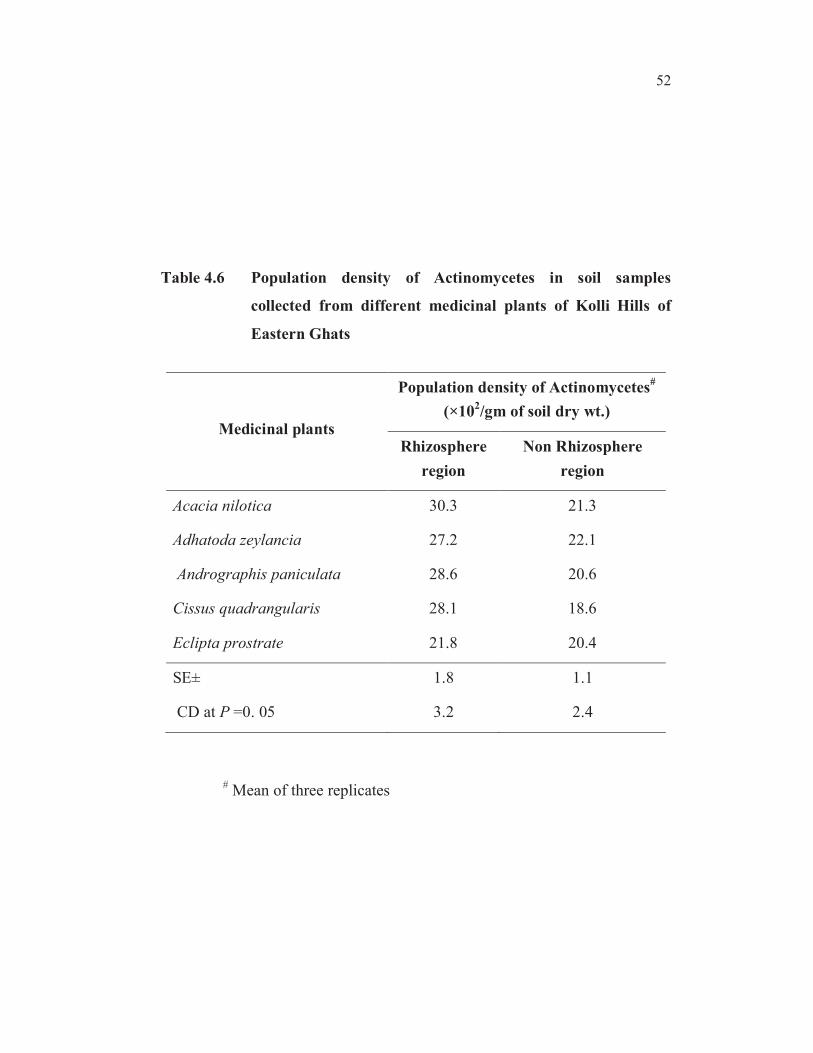
4.1.4 Population density of Actinomycetes in soilsamples collected
from different medicinal plants of Yercaud and Kolli hills
The population of actinomycetes was enumerated from rhizosphere
as well as from non-rhizosphere regions of important medicinal plants of
Yercaud and Kolli hills (Table 4.5 and Table 4.6). The results revealed that
the population density of actinomycetes was found to be higher in soil
samples collected from rhizosphere than in non-rhizosphere regions. It was
higher in the rhizosphere soils of Asparagus racemosus (36.2 gm soil dry
weight) followed by Andrographis paniculata (30.1 gm soil dry weight)
plants at Yercaud hills. A least population density was recorded with
Cissusquadrangularisand Gymnemasylvestre (20.3 gm soil dry weight)
plants.In Kolli hills, the population density was high in the rhizosphere region
of Acacia nilotica (30.3 gm soil dry weight) followed by Andrographis
paniculata (28.6 gm soil dry weight) plants. The population load was found to
be least with Cissus quadrangularis (18.6 gm soil dry weight) plant.
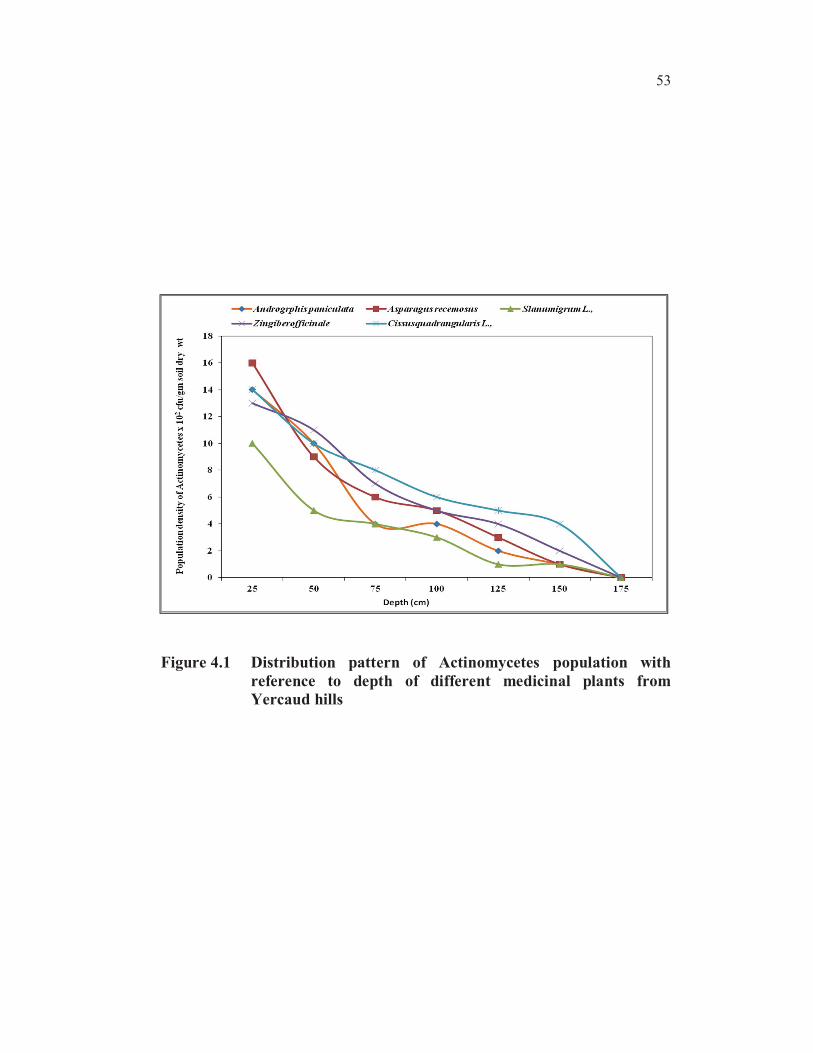
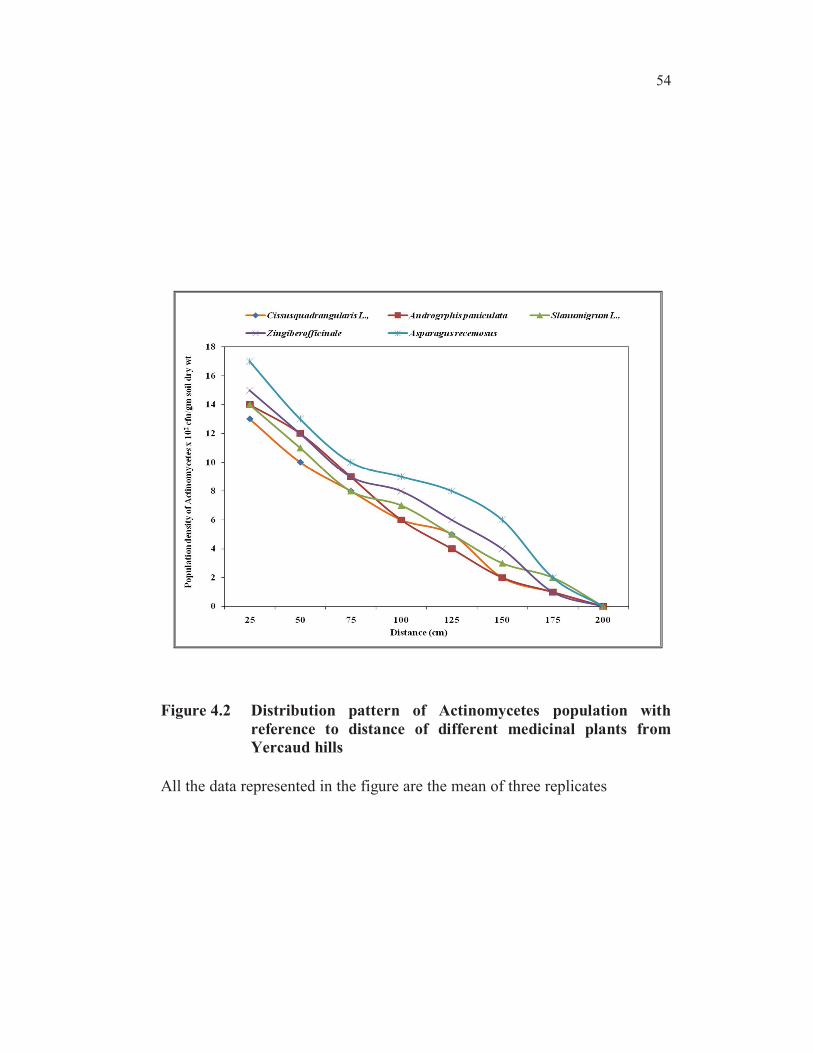
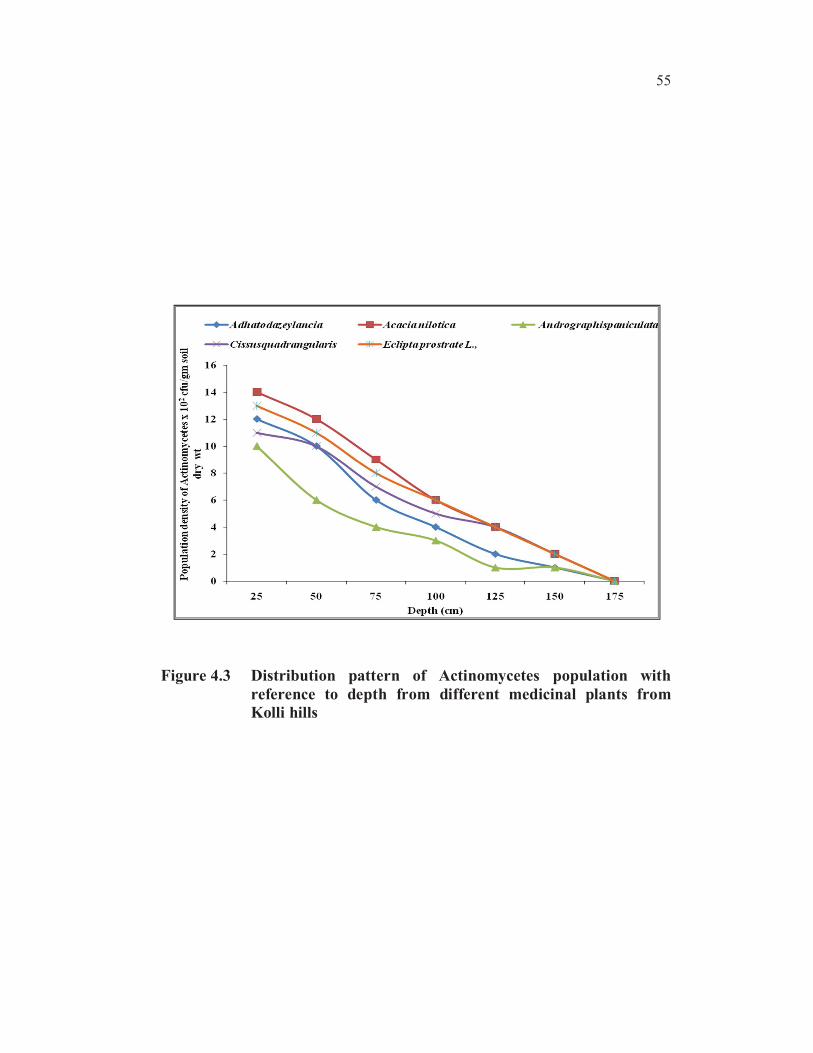
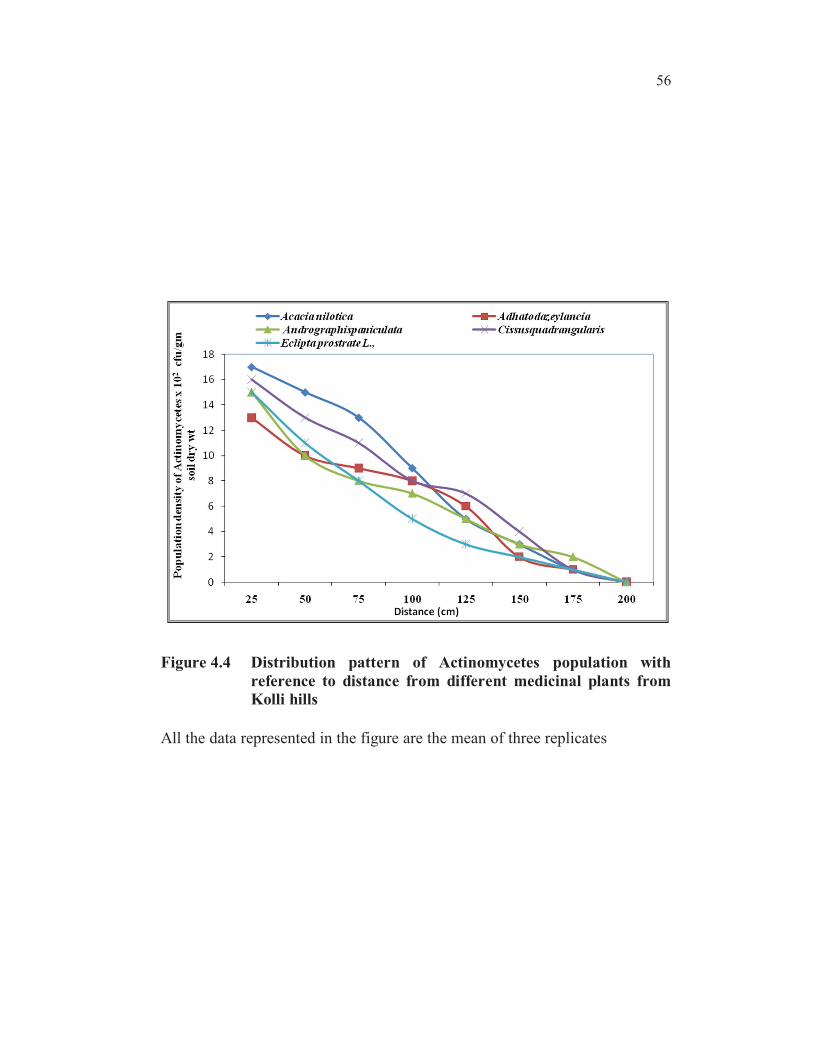
4.1.5 Distribution Pattern of Population Density of Actinomycetes in
Eastern Ghats (Yercaud and Kolli hills)
The distribution pattern of actinomycetes population in the
rhizosphere soils of different medicinal plants is presented in the Figures 4.1-
4.4. The results revealed that the population density was decreased when the
distance as well as depth of soil sampling of the plants was increased. At
175cm depth and 200 cm distance from the plants, the population of
actinomycetes was not recovered completely in both Yercaud and Kolli hills.
This is because of the close relationship between the rhizosphere region of
plants and microorganisms. The population load of actinomycetes at 25 cm
distance was found to be more (16.2×10²gm/soil dry wt.) and thereafter it was
51
declined sharply when distance / depth from the plants was increased to
collect rhizosphere soil samples. Moreover, the population density was
recorded at the maximum with Asparagus racemosus and Acacia nilotica
plants in Yercaud and Kolli hills; respectively.
Table 4.5 Population density of Actinomycetes in soil samples
collected from different medicinal plants of Yercaud hills of
Eastern Ghats
Medicinal plants
Population density of Actinomycetes#
(×102/gm of soil dry wt.)
Rhizosphere
region
Non-rhizosphere
region
Asparagus racemosus 36.2 24.3
Andrographis paniculata 30.1 20.7
Solanum nigrum 29.8 21.8
Zingiber officinale 20.3 13.2
Cissus quadrangularis 28.6 18.3
SE± 3.1 2.4
CD at P =0. 05 6.7 5.2
# Mean of three replicates
52
Table 4.6 Population density of Actinomycetes in soil samples
collected from different medicinal plants of Kolli Hills of
Eastern Ghats
Medicinal plants
Population density of Actinomycetes#
(×102/gm of soil dry wt.)
Rhizosphere
region
Non Rhizosphere
region
Acacia nilotica 30.3 21.3
Adhatoda zeylancia 27.2 22.1
Andrographis paniculata 28.6 20.6
Cissus quadrangularis 28.1 18.6
Eclipta prostrate 21.8 20.4
SE± 1.8 1.1
CD at P =0. 05 3.2 2.4
# Mean of three replicates
53
Figure 4.1 Distribution pattern of Actinomycetes population with
reference to depth of different medicinal plants from
Yercaud hills
54
Figure 4.2 Distribution pattern of Actinomycetes population with
reference to distance of different medicinal plants from
Yercaud hills
All the data represented in the figure are the mean of three replicates
55
Figure 4.3 Distribution pattern of Actinomycetes population with
reference to depth from different medicinal plants from
Kolli hills
56
Figure 4.4 Distribution pattern of Actinomycetes population with
reference to distance from different medicinal plants from
Kolli hills
All the data represented in the figure are the mean of three replicates
57
4.2 CHARACTERIZATION AND IDENTIFICATION OF
ACTINOMYCETES FROM EASTERN GHATS
4.2.1 Characterization and identification of actinomycetes
A total of 168 strains were isolated from soil samples collected
from eastern Ghats and screened them subsequently based on their potential
of secondary metabolite production in which two isolates from each hill
(Yercaud and Kolli hills) were chosen for further studies. All the strains were
identified by following the method of Bergey’s manual, wherein, the
polyphasic taxonomic approach was adopted. All the actinomycete strains
were identified as Streptomyces sannanensis. Further identification was
confirmed by Microbial Type Culture collection Centre (MTCC), Chandigarh,
India. The results of various morphological, biochemical and physiological
tests were summarized in the Table 4.8 and 4.9. The strains such as Yer11 and
Yer28 obtained from Yercaud hills and Kol35 and Kol44 strains obtained
from Kolli hills were selected. These proven strains were designated based on
the hills and depository strain number (KSR College Microbial Collection
Depository). In addition, a standard strain (MTCC 6285) was procured and
used for comparison purpose.
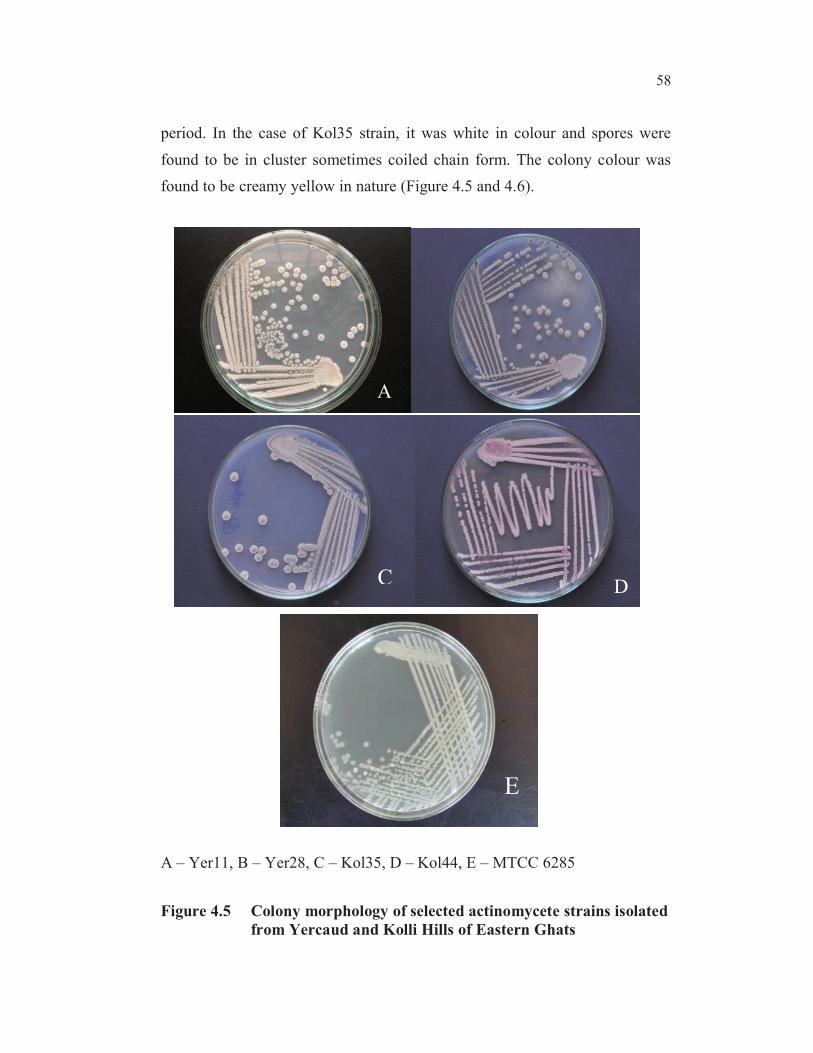
The actinomycete strains were found to be spiral spore
morphology, Gram-positive bacterium and from greyish to pinkish in colour.
They were produced different colour of pigments and catalytic and oxidative
enzymes such as catalase, lipase and urease. All the strains were hydrolyzed
gelatine, casein and starch in the basal medium as well. They were negative to
indole production, methyl red and voges proskauer test but utilized citrate.
Further, the cultures were negative for oxidase production. Nitrate was
reduced very significantly and mannitol was utilized by the strains and they
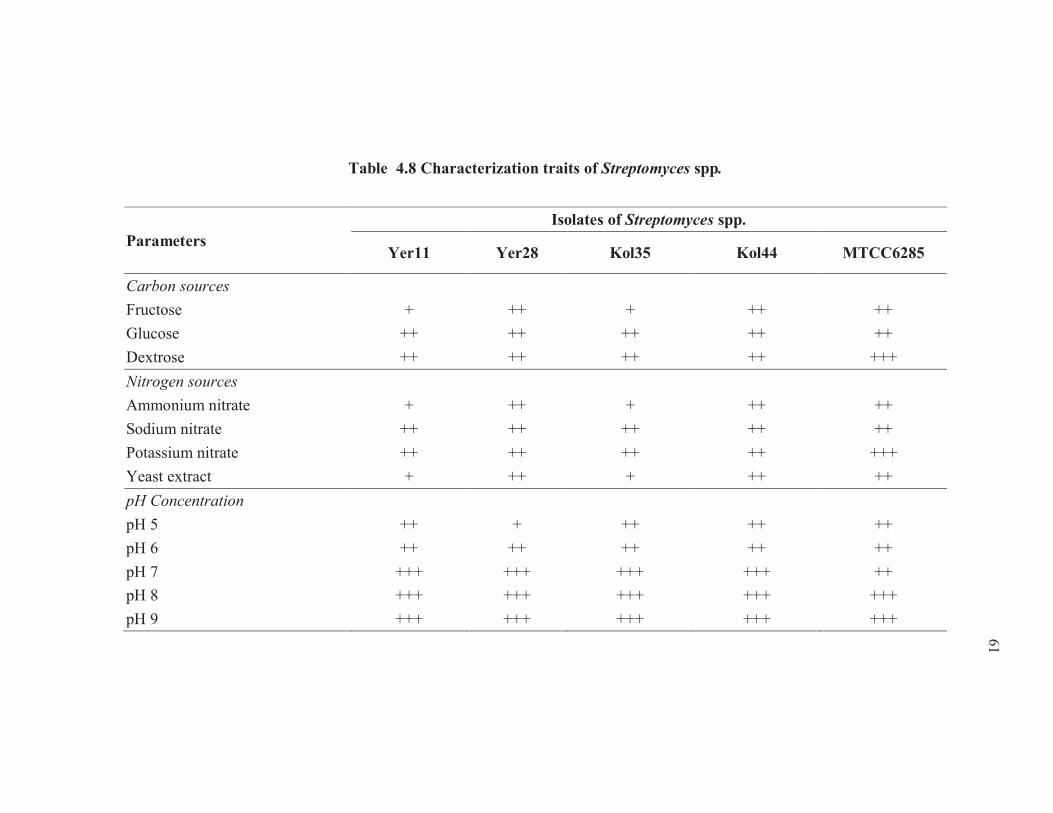
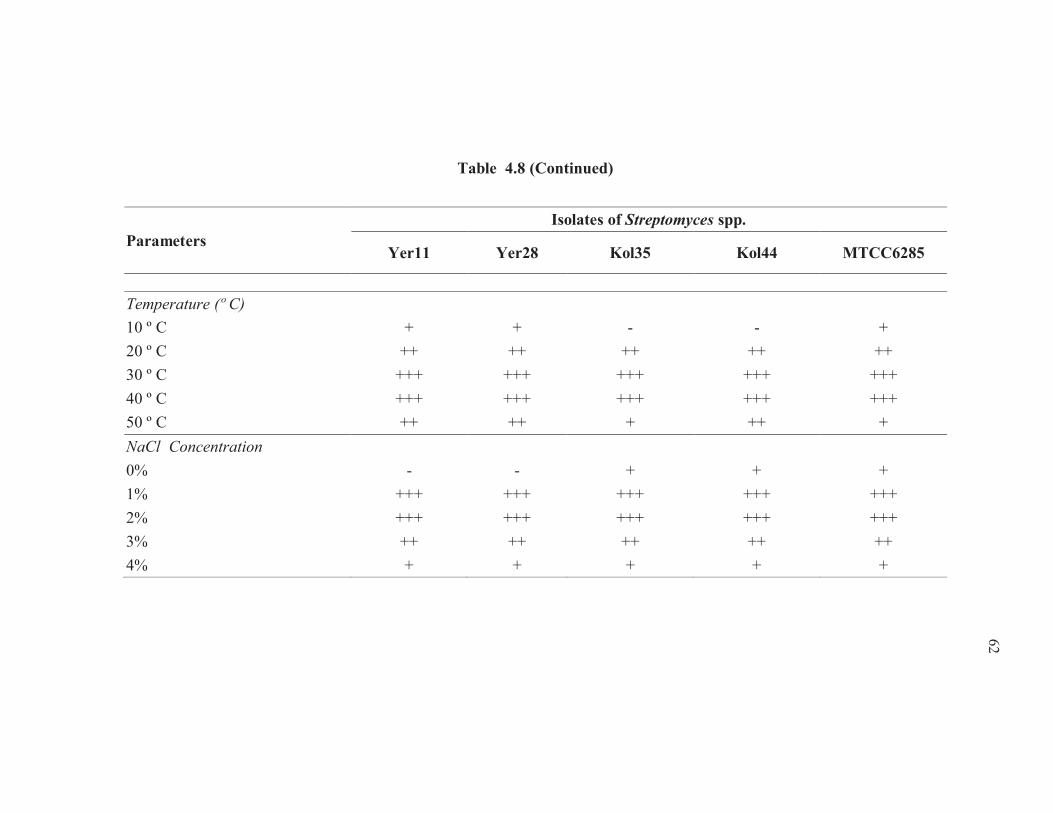
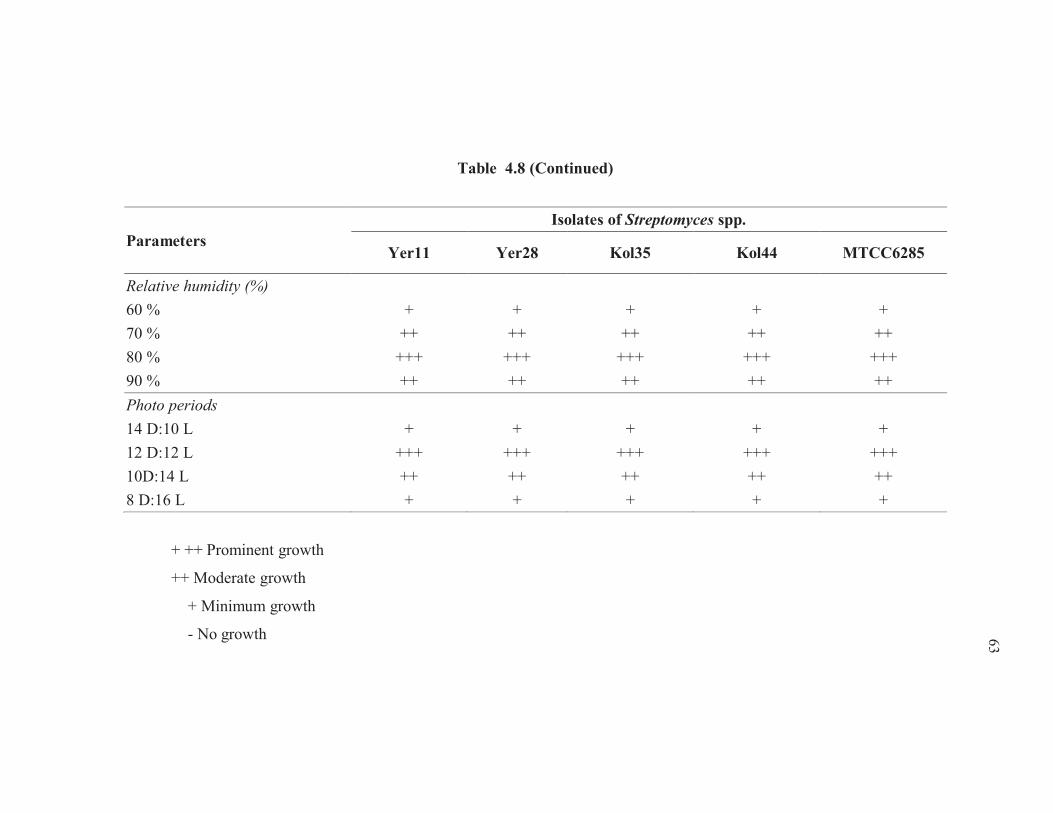
utilized fructose, glucose and dextrose as well. They showed a prominent
growth at a pH of 6, 30º C temperature, 80% relative humidity and 2% NaCl
concentration. All the proven strains were grown well in 12D:12L photo
58
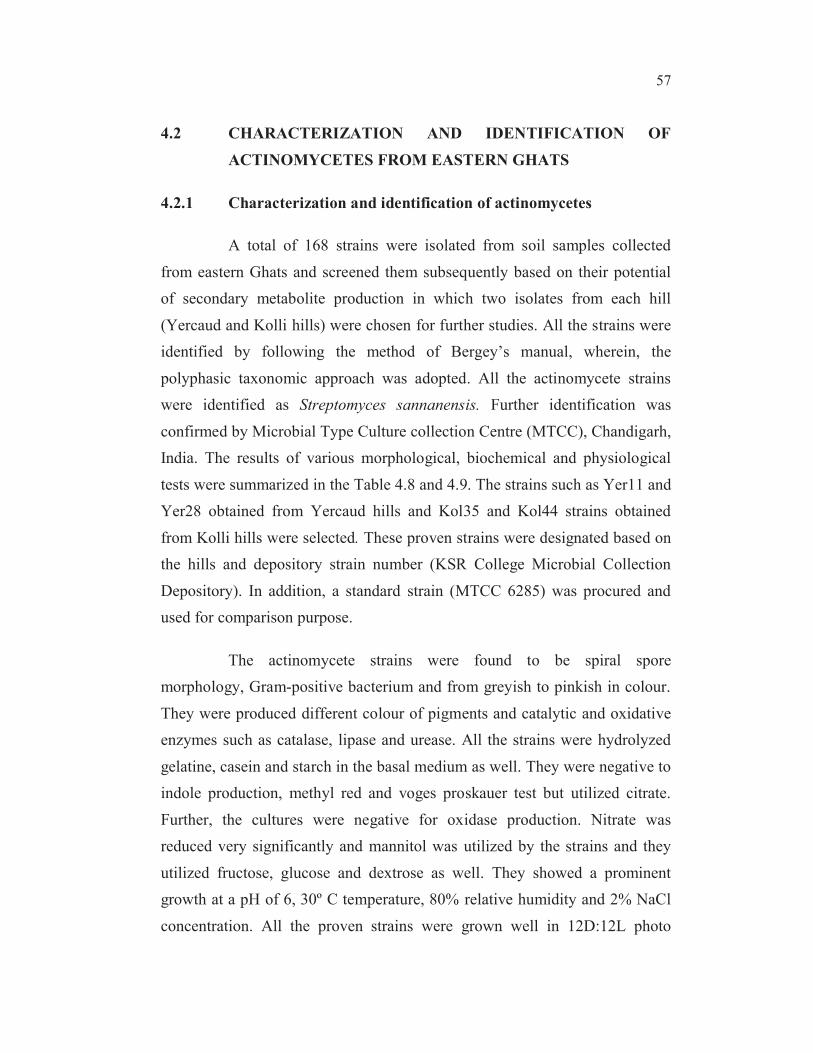
period. In the case of Kol35 strain, it was white in colour and spores were
found to be in cluster sometimes coiled chain form. The colony colour was
found to be creamy yellow in nature (Figure 4.5 and 4.6).
A – Yer11, B – Yer28, C – Kol35, D – Kol44, E – MTCC 6285
Figure 4.5 Colony morphology of selected actinomycete strains isolated
from Yercaud and Kolli Hills of Eastern Ghats
A
C D
E
59
A – Yer11, B – Yer28, C – Kol35, D – Kol44
Figure 4.6 Microscopic observation of selected isolates of actinomycetes
after Gram’s staining from Yercaud and Kolli hills of
Eastern Ghats
A B
C D
60
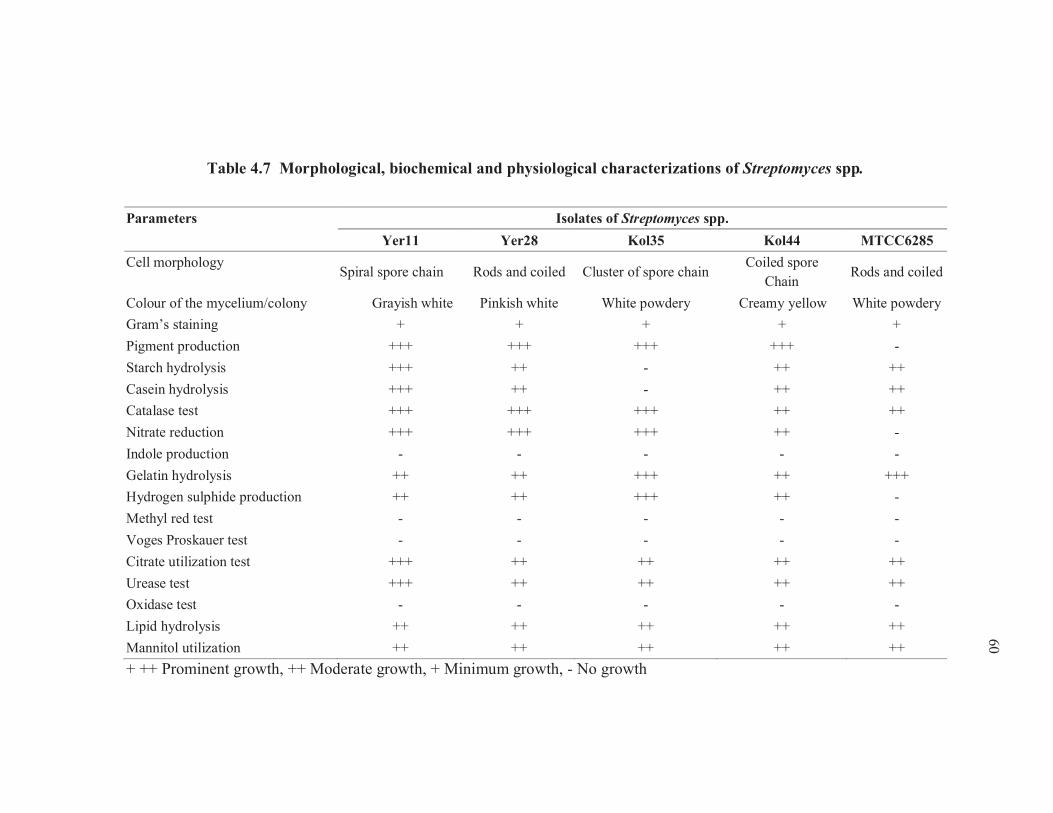
Table 4.7 Morphological, biochemical and physiological characterizations of Streptomyces spp.
Parameters Isolates of Streptomyces spp.
Yer11 Yer28 Kol35 Kol44 MTCC6285
Cell morphologySpiral spore chain Rods and coiled Cluster of spore chain
Coiled spore
ChainRods and coiled
Colour of the mycelium/colony Grayish white Pinkish white White powdery Creamy yellow White powdery
Gram’s staining + + + + +
Pigment production +++ +++ +++ +++ -
Starch hydrolysis +++ ++ - ++ ++
Casein hydrolysis +++ ++ - ++ ++
Catalase test +++ +++ +++ ++ ++
Nitrate reduction +++ +++ +++ ++ -
Indole production - - - - -
Gelatin hydrolysis ++ ++ +++ ++ +++
Hydrogen sulphide production ++ ++ +++ ++ -
Methyl red test - - - - -
Voges Proskauer test - - - - -
Citrate utilization test +++ ++ ++ ++ ++
Urease test +++ ++ ++ ++ ++
Oxidase test - - - - -
Lipid hydrolysis ++ ++ ++ ++ ++
Mannitol utilization ++ ++ ++ ++ ++
+ ++ Prominent growth, ++ Moderate growth, + Minimum growth, - No growth
61
Table 4.8 Characterization traits of Streptomyces spp.
Parameters
Isolates of Streptomyces spp.
Yer11 Yer28 Kol35 Kol44 MTCC6285
Carbon sources
Fructose + ++ + ++ ++
Glucose ++ ++ ++ ++ ++
Dextrose ++ ++ ++ ++ +++
Nitrogen sources
Ammonium nitrate + ++ + ++ ++
Sodium nitrate ++ ++ ++ ++ ++
Potassium nitrate ++ ++ ++ ++ +++
Yeast extract + ++ + ++ ++
pH Concentration
pH 5 ++ + ++ ++ ++
pH 6 ++ ++ ++ ++ ++
pH 7 +++ +++ +++ +++ ++
pH 8 +++ +++ +++ +++ +++
pH 9 +++ +++ +++ +++ +++
62
Table 4.8 (Continued)
Parameters
Isolates of Streptomyces spp.
Yer11 Yer28 Kol35 Kol44 MTCC6285
Temperature (º C)
10 º C + + - - +
20 º C ++ ++ ++ ++ ++
30 º C +++ +++ +++ +++ +++
40 º C +++ +++ +++ +++ +++
50 º C ++ ++ + ++ +
NaCl Concentration
0% - - + + +
1% +++ +++ +++ +++ +++
2% +++ +++ +++ +++ +++
3% ++ ++ ++ ++ ++
4% + + + + +
63
Table 4.8 (Continued)
Parameters
Isolates of Streptomyces spp.
Yer11 Yer28 Kol35 Kol44 MTCC6285
Relative humidity (%)
60 % + + + + +
70 % ++ ++ ++ ++ ++
80 % +++ +++ +++ +++ +++
90 % ++ ++ ++ ++ ++
Photo periods
14 D:10 L + + + + +
12 D:12 L +++ +++ +++ +++ +++
10D:14 L ++ ++ ++ ++ ++
8 D:16 L + + + + +
+ ++ Prominent growth
++ Moderate growth
+ Minimum growth
- No growth
64
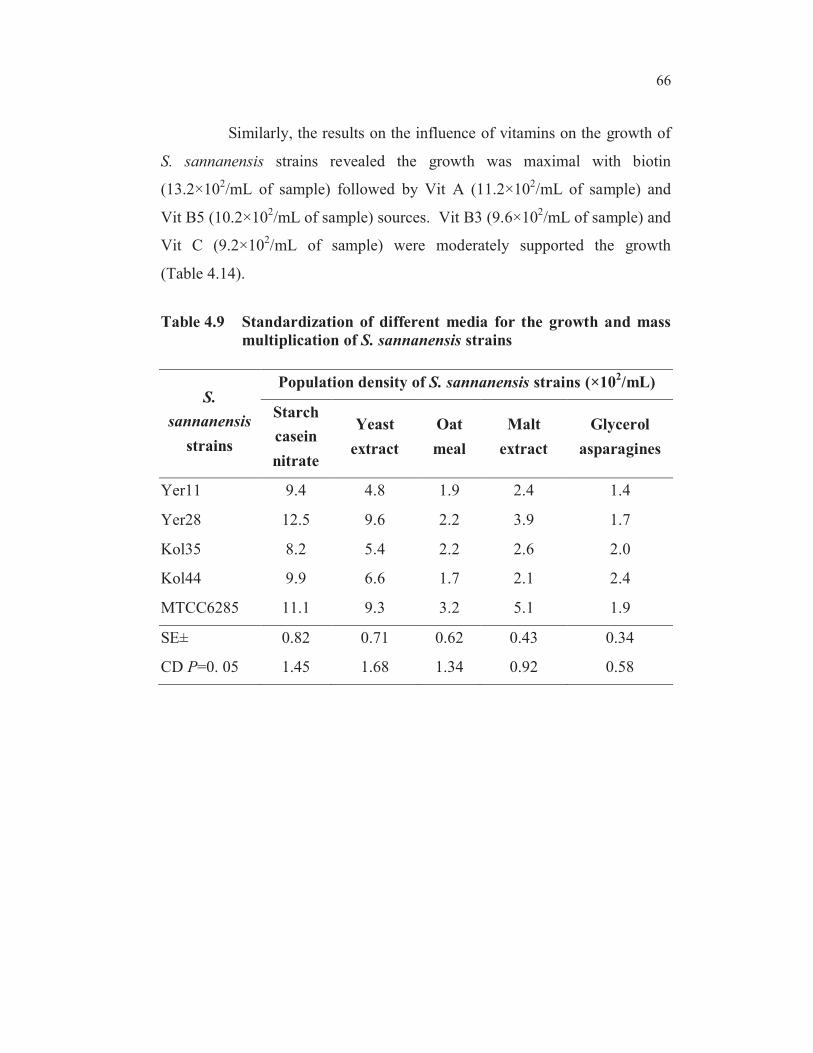
4.2.2 Standardization of Different Media for Mass Multiplication of
Streptomyces Strains
Various types of synthetic, semi-synthetic and natural media were
selected to find out a suitable medium for the maximal growth and mass
multiplication of S. sannanensis strains under in vitro condition. The
population load of S. sannanensis strains in the media was determined and
presented in the Table 4.10. The results indicated that among the various
media used, SCN medium was found to be an appropriate one for the growth
of S. sannanensis strains. The maximum growth was obtained in the strain of
Yer28 (12.5 × 10²/mL) and followed by MTCC6285 (11.1 × 10
2/mL) strain.
Further, the results were indicated that Yeast extract and malt extract media
were moderately enhanced the growth. In contrast, the growth was
significantly low in glycerol asparagines (1.4 ×10²/ mL of sample) medium.
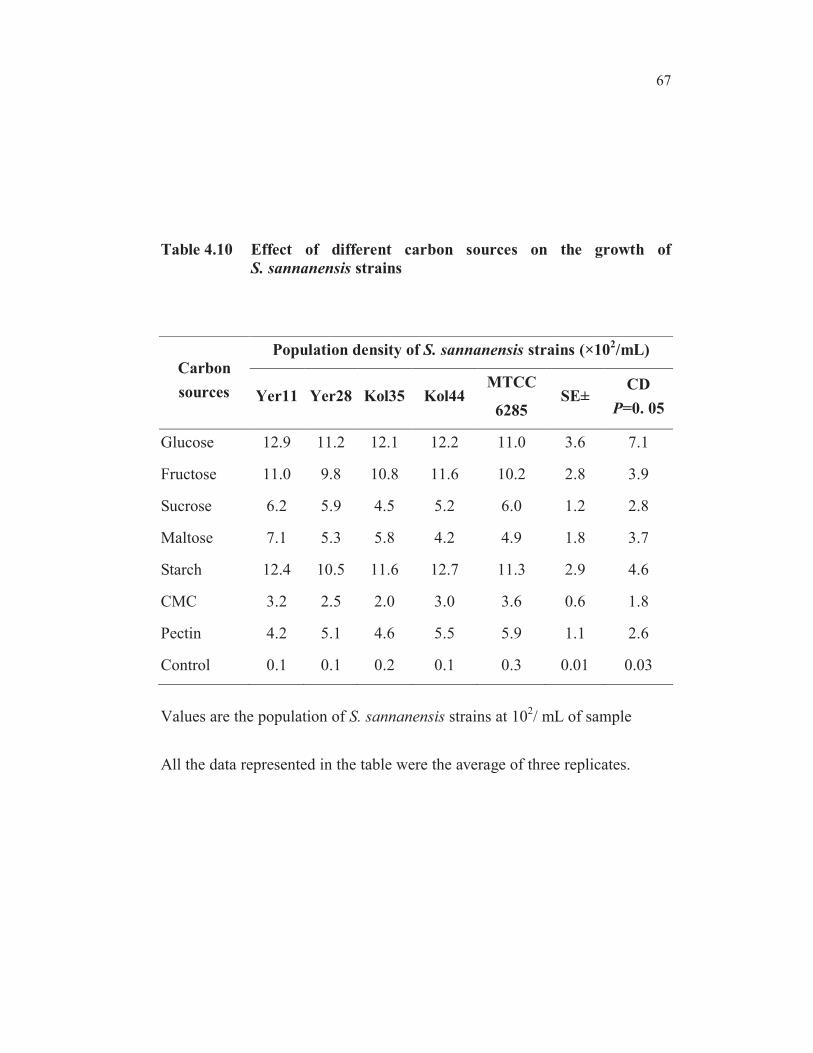
4.2.3 Effect of different Carbon Sources on the Growth of
S. sannanensis strains
Carbon sources covering different monosaccharides, disaccharides
and polysaccharides on the growth of S. sannanensis strains were carried out
to identify the array of utilization of various carbon sources. Among the
various carbon sources tested, monosaccharides followed by disaccharides
were preferred by S. sannanensis strains rather than polysaccharides for their
maximal growth (Table 4.11). The choice of carbon sources varied from
strain to strain at minimum level. The results revealed that S. sannanensis
strains (Yer11 and Kol44) preferred monosaccharides especially glucose as
the sole carbon source (12.9 × 10²/mL and 12.2 × 10
2/mL of sample). The
trend remained the same with all the strains with glucose as a best carbon
source. In addition to glucose source, starch also favoured the growth of
S. sannanensis. However, fructose (11.0 × 10²/mL of sample), maltose
65
(7.1 × 10²/mL of sample) and sucrose (6.2 × 10
2/mL of sample) were
moderately improved the growth of S. sannanensis strains, while CMC and
pectin were found to be poor carbon sources in terms of enhancing growth.
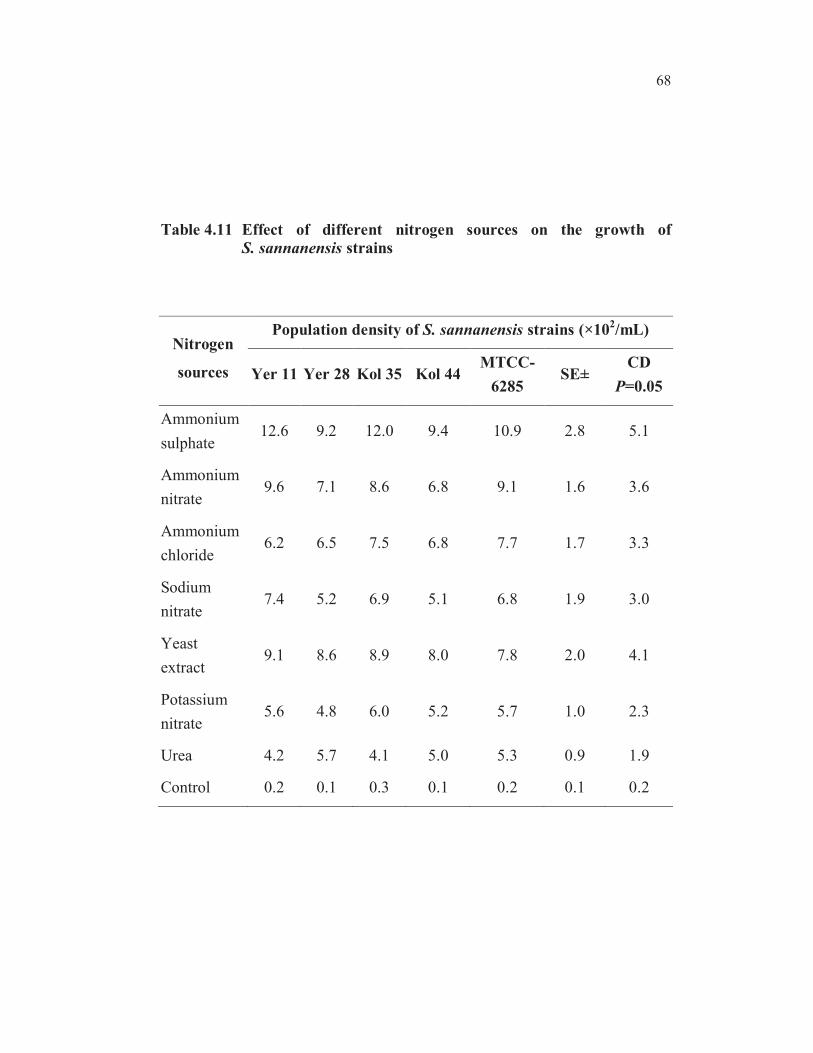
4.2.4 Effect of various Nitrogen Compounds on the Growth of S.
sannanensis Strains
Various nitrogen sources including organic, inorganic, nitrate,
nitrogen and ammonical derivatives on the growth of S. sannanensis strains
were studied. The results revealed that S. sannanensis strains were capable of
utilizing a wide range of nitrogenous compounds. However, its efficiency in
utilizing various nitrogen sources significantly varied in varying levels
(Table 4.12). The growth of Yer11 strain was shown as 12.6 × 10²/mL of
sample in ammonium sulphate followed by ammonium nitrate (9.6 × 10²/mL
of sample). The organic and inorganic nitrogen sources were supporting the
growth of all selected strains partially while that of at least growth was
recorded (4.1 × 10²/ mL of sample) with basal medium incorporated with urea
as a nitrogen source inoculated with Kol35 and Yer11 strains.
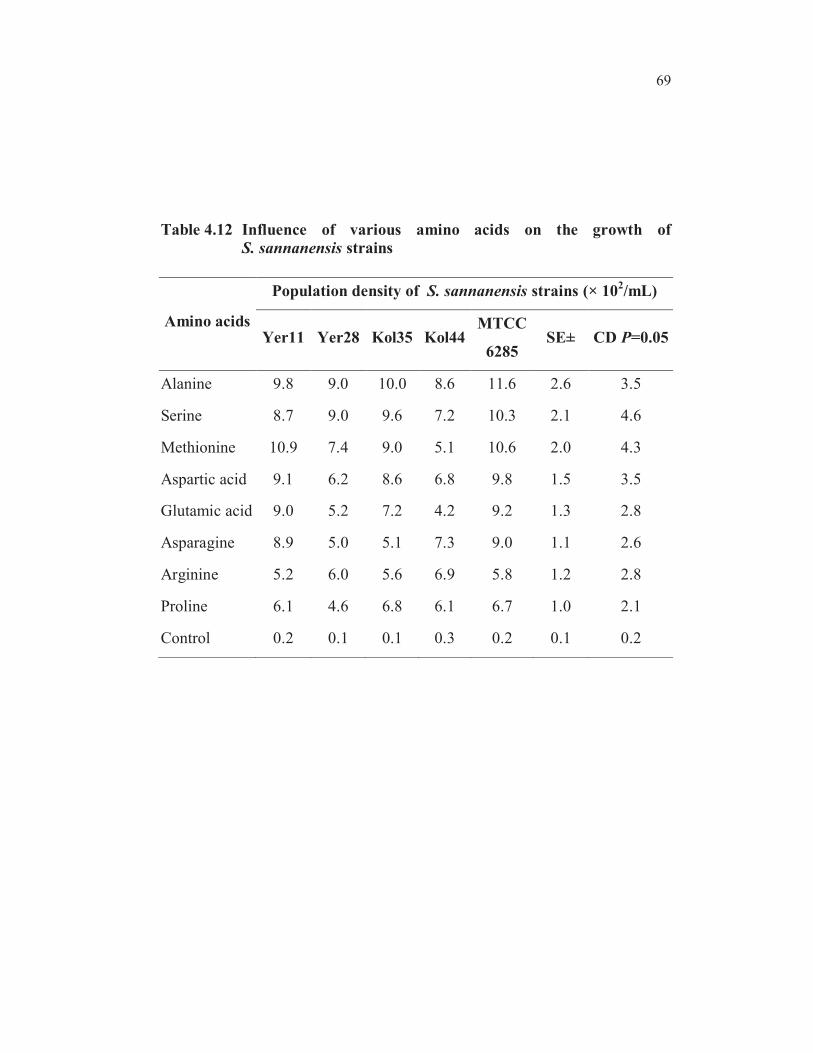
4.2.5 Influence of various Amino acids and Vitamins on the Growth
of S. sannanensis Strains
Influence of various amino acids and vitamins on the growth of
S. sannanensis strains were studied using basal medium incorporated with
wide sources of amino acids and vitamins. The results revealed that among
the ten amino acids tested, the maximal growth of Yer11 strain was found in
methionine (10.9 × 10²/mL of sample) followed by alanine (9.8 × 10
2/mL of
sample) and aspartic acid (9.1 × 10²/mL of sample). However, other amino
acids namely arginine and proline were poorly supported the growth of
S. sannanensis strains (Table 4.13).
66
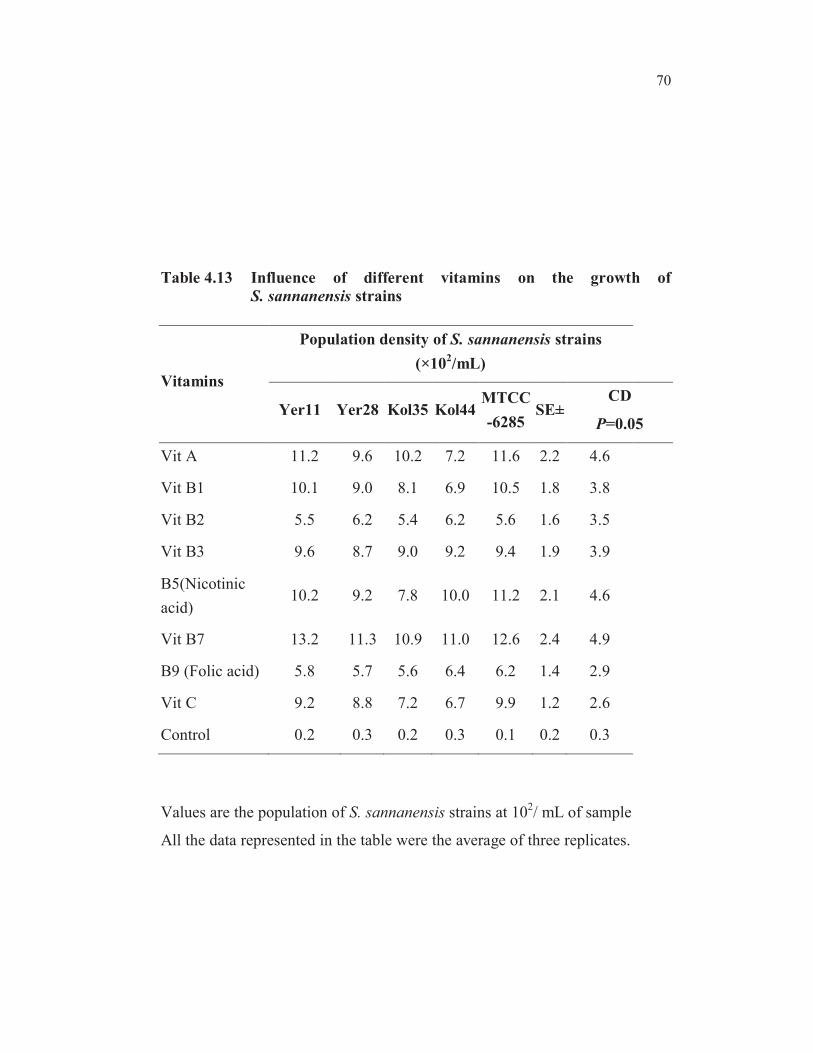
Similarly, the results on the influence of vitamins on the growth of
S. sannanensis strains revealed the growth was maximal with biotin
(13.2×10²/mL of sample) followed by Vit A (11.2×10
2/mL of sample) and
Vit B5 (10.2×10²/mL of sample) sources. Vit B3 (9.6×10
2/mL of sample) and
Vit C (9.2×10²/mL of sample) were moderately supported the growth
(Table 4.14).
Table 4.9 Standardization of different media for the growth and mass
multiplication of S. sannanensis strains
S.
sannanensis
strains
Population density of S. sannanensis strains (×102/mL)
Starch
casein
nitrate
Yeast
extract
Oat
meal
Malt
extract
Glycerol
asparagines
Yer11 9.4 4.8 1.9 2.4 1.4
Yer28 12.5 9.6 2.2 3.9 1.7
Kol35 8.2 5.4 2.2 2.6 2.0
Kol44 9.9 6.6 1.7 2.1 2.4
MTCC6285 11.1 9.3 3.2 5.1 1.9
SE± 0.82 0.71 0.62 0.43 0.34
CD P=0. 05 1.45 1.68 1.34 0.92 0.58
67
Table 4.10 Effect of different carbon sources on the growth of
S. sannanensis strains
Carbon
sources
Population density of S. sannanensis strains (×102/mL)
Yer11 Yer28 Kol35 Kol44MTCC
6285SE±
CD
P=0. 05
Glucose 12.9 11.2 12.1 12.2 11.0 3.6 7.1
Fructose 11.0 9.8 10.8 11.6 10.2 2.8 3.9
Sucrose 6.2 5.9 4.5 5.2 6.0 1.2 2.8
Maltose 7.1 5.3 5.8 4.2 4.9 1.8 3.7
Starch 12.4 10.5 11.6 12.7 11.3 2.9 4.6
CMC 3.2 2.5 2.0 3.0 3.6 0.6 1.8
Pectin 4.2 5.1 4.6 5.5 5.9 1.1 2.6
Control 0.1 0.1 0.2 0.1 0.3 0.01 0.03
Values are the population of S. sannanensis strains at 102/ mL of sample
All the data represented in the table were the average of three replicates.
68
Table 4.11 Effect of different nitrogen sources on the growth of
S. sannanensis strains
Nitrogen
sources
Population density of S. sannanensis strains (×102/mL)
Yer 11 Yer 28 Kol 35 Kol 44MTCC-
6285SE±
CD
P=0.05
Ammonium
sulphate12.6 9.2 12.0 9.4 10.9 2.8 5.1
Ammonium
nitrate9.6 7.1 8.6 6.8 9.1 1.6 3.6
Ammonium
chloride6.2 6.5 7.5 6.8 7.7 1.7 3.3
Sodium
nitrate7.4 5.2 6.9 5.1 6.8 1.9 3.0
Yeast
extract9.1 8.6 8.9 8.0 7.8 2.0 4.1
Potassium
nitrate5.6 4.8 6.0 5.2 5.7 1.0 2.3
Urea 4.2 5.7 4.1 5.0 5.3 0.9 1.9
Control 0.2 0.1 0.3 0.1 0.2 0.1 0.2
69
Table 4.12 Influence of various amino acids on the growth of
S. sannanensis strains
Amino acids
Population density of S. sannanensis strains (× 102/mL)
Yer11 Yer28 Kol35 Kol44MTCC
6285SE± CD P=0.05
Alanine 9.8 9.0 10.0 8.6 11.6 2.6 3.5
Serine 8.7 9.0 9.6 7.2 10.3 2.1 4.6
Methionine 10.9 7.4 9.0 5.1 10.6 2.0 4.3
Aspartic acid 9.1 6.2 8.6 6.8 9.8 1.5 3.5
Glutamic acid 9.0 5.2 7.2 4.2 9.2 1.3 2.8
Asparagine 8.9 5.0 5.1 7.3 9.0 1.1 2.6
Arginine 5.2 6.0 5.6 6.9 5.8 1.2 2.8
Proline 6.1 4.6 6.8 6.1 6.7 1.0 2.1
Control 0.2 0.1 0.1 0.3 0.2 0.1 0.2
70
Table 4.13 Influence of different vitamins on the growth of
S. sannanensis strains
Vitamins
Population density of S. sannanensis strains
(×102/mL)
Yer11 Yer28 Kol35 Kol44MTCC
-6285SE±
CD
P=0.05
Vit A 11.2 9.6 10.2 7.2 11.6 2.2 4.6
Vit B1 10.1 9.0 8.1 6.9 10.5 1.8 3.8
Vit B2 5.5 6.2 5.4 6.2 5.6 1.6 3.5
Vit B3 9.6 8.7 9.0 9.2 9.4 1.9 3.9
B5(Nicotinic
acid)10.2 9.2 7.8 10.0 11.2 2.1 4.6
Vit B7 13.2 11.3 10.9 11.0 12.6 2.4 4.9
B9 (Folic acid) 5.8 5.7 5.6 6.4 6.2 1.4 2.9
Vit C 9.2 8.8 7.2 6.7 9.9 1.2 2.6
Control 0.2 0.3 0.2 0.3 0.1 0.2 0.3
Values are the population of S. sannanensis strains at 102/ mL of sample
All the data represented in the table were the average of three replicates.
71
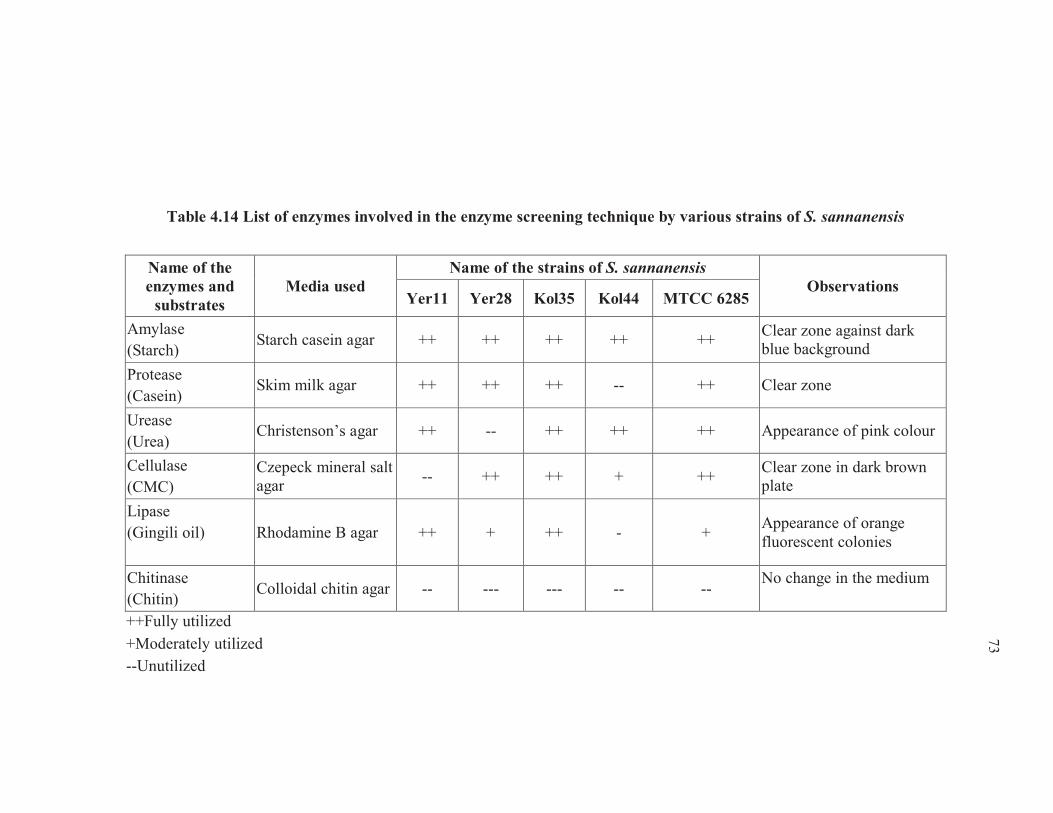
4.2.6 Enzymatic screening of S. sannanensis strains
The active isolates of S. sannanensis obtained from the rhizosphere
region of the Yercaud and Kolli hills were subjected to screen for the
enzymatic activity as a secondary screening method. On the other hand, the
effect of various biotic and abiotic factors on the growth metabolism of S.
sannanensis strains were studied which were considered as the primary
screening traits. It was observed that all the strains of S. sannanensis were
found to possess amylase, protease, urease, cellulase and lipase. In contrast,
chitinase was observed to be absent in all the strains (Table 4.14). In the case
of amylase and cellulase, a clear zone against dark blue and dark brown
background was registered in Starch casein agar and Czepeck mineral salt
agar; respectively by all the strains. Similarly, appearance of orange
fluorescent colonies was observed in Rhodamine B agar plates during lipase
production (Table 4.15).
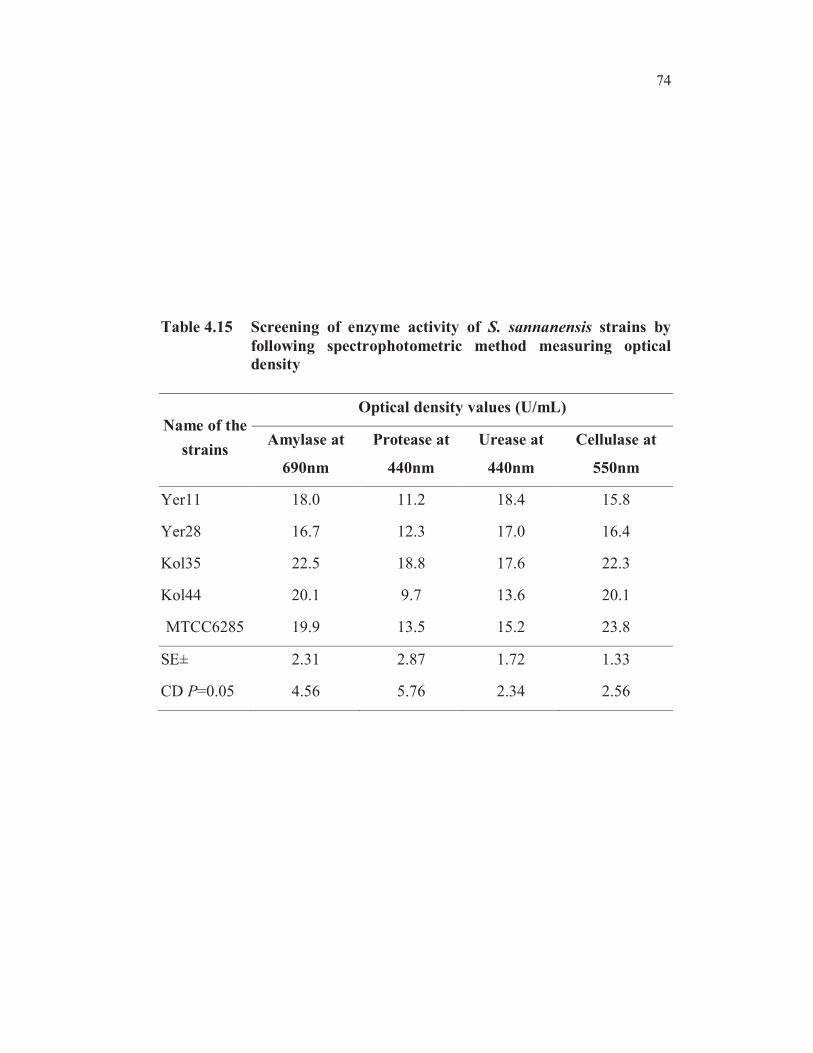
All the five strains of S. sannanensis were subjected to the
secondary screening process through colorimetric analysis. The secondary
screening technique was not performed for the chitinase activity as it showed
negative result by all the five strains used. In the case of amylase, the activity
was found to be 18.0, 16.7, 22.5, 20.1 and 19.9 U/ mL by Yer11, Yer28,
Kol35, Kol44 and MTCC6285 strains; respectively. The maximum activity
was observed with Kol35 strain and minimum with Yer28 strain. Similarly,
the maximum activity of protease was observed to be 18.8 U/ mL by Kol35
strain and minimum was recorded as 9.7 U/ mL by Kol44 strain. In the case
of urease activity, 18.4 U/ mL was noted by Yer11 strain and the lowest
activity was observed as 13.6 U/ mL by Kol44 strain (Table 4.16).
72
The absorbance range of cellulase activity was totally different
when compared with the other three enzymes assayed with respect to various
S. sannanensis strains. Because the maximum activity was possessed by
MTCC6285 (23.8) strain followed by indigenous Kol35 (22.3) strain. Among
the four enzymes, the activity was found to be good with Kol35 followed by
MTCC6285 strains. The assay for the lipase activity was carried out through
titration method which showed the maximum activity was observed at 0.49,
0.38, 0.35, 0.28 and 0.31 U/ mL by Kol35, Yer11, MTCC, Kol44 and Yer28
strains; respectively (Table 4.16).
73
Table 4.14 List of enzymes involved in the enzyme screening technique by various strains of S. sannanensis
Name of the
enzymes and
substrates
Media used
Name of the strains of S. sannanensis
ObservationsYer11 Yer28 Kol35 Kol44 MTCC 6285
Amylase
(Starch)Starch casein agar ++ ++ ++ ++ ++
Clear zone against dark
blue background
Protease
(Casein)Skim milk agar ++ ++ ++ -- ++ Clear zone
Urease
(Urea)Christenson’s agar ++ -- ++ ++ ++ Appearance of pink colour
Cellulase
(CMC)
Czepeck mineral salt
agar-- ++ ++ + ++
Clear zone in dark brown
plate
Lipase
(Gingili oil) Rhodamine B agar ++ + ++ - +Appearance of orange
fluorescent colonies
Chitinase
(Chitin)Colloidal chitin agar -- --- --- -- --
No change in the medium
++Fully utilized
+Moderately utilized
--Unutilized
74
Table 4.15 Screening of enzyme activity of S. sannanensis strains by
following spectrophotometric method measuring optical
density
Name of the
strains
Optical density values (U/mL)
Amylase at
690nm
Protease at
440nm
Urease at
440nm
Cellulase at
550nm
Yer11 18.0 11.2 18.4 15.8
Yer28 16.7 12.3 17.0 16.4
Kol35 22.5 18.8 17.6 22.3
Kol44 20.1 9.7 13.6 20.1
MTCC6285 19.9 13.5 15.2 23.8
SE± 2.31 2.87 1.72 1.33
CD P=0.05 4.56 5.76 2.34 2.56
75
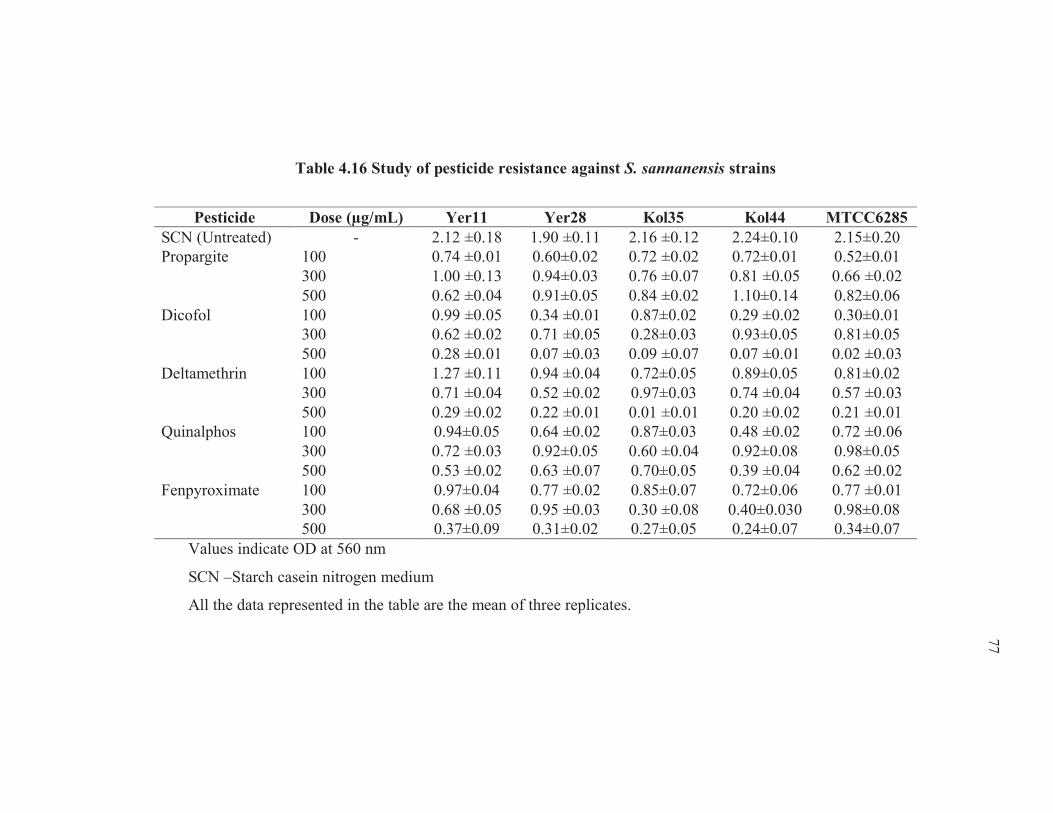
4.2.7 Effect of pesticide, fungicide and weedicide agrochemicals on
the growth of S. sannanensis strains
The soils are being received a huge amount of pesticides,
fungicides and weedicides in order to control a wide variety of pests and
phytopathogens under natural conditions. Various types of weedicides are
being applied in soils to control a broad spectrum of weeds covering both
monocot and dicot plants. To know the resistance behavior of S. sannanensis
strains against these agrochemicals, the present study was undertaken. The
basal medium was incorporated with various doses of these agrochemicals
and subsequently inoculated with S. sannanensis strains.
The results indicated that all the tested pesticide concentrations
inhibited the growth of S. sannanensis strains significantly when compared to
untreated control. But Yer11 strain was inhibited by propargite pesticide at
the concentration of 500 µg/mL. Other strains were not affected by this
concentration. In contrast, dicofol at 100 µg/mL concentration, Yer11 and
Kol35 strains were supporting the growth moderately. The results clearly
revealed that when concentration was increased the growth of all
S. sannanensis strains was inhibited (Table 4.16). Quinolphos was adversely
affecting the growth of S. sannanensis (0.39 OD) strains. A least resistance of
S. sannanensis strains towards pesticides (Dicofol) was recorded with
MTCC6285 strain. Among the five strains, Yer11 and Kol35 strains were
tolerated the concentration of pesticides used.
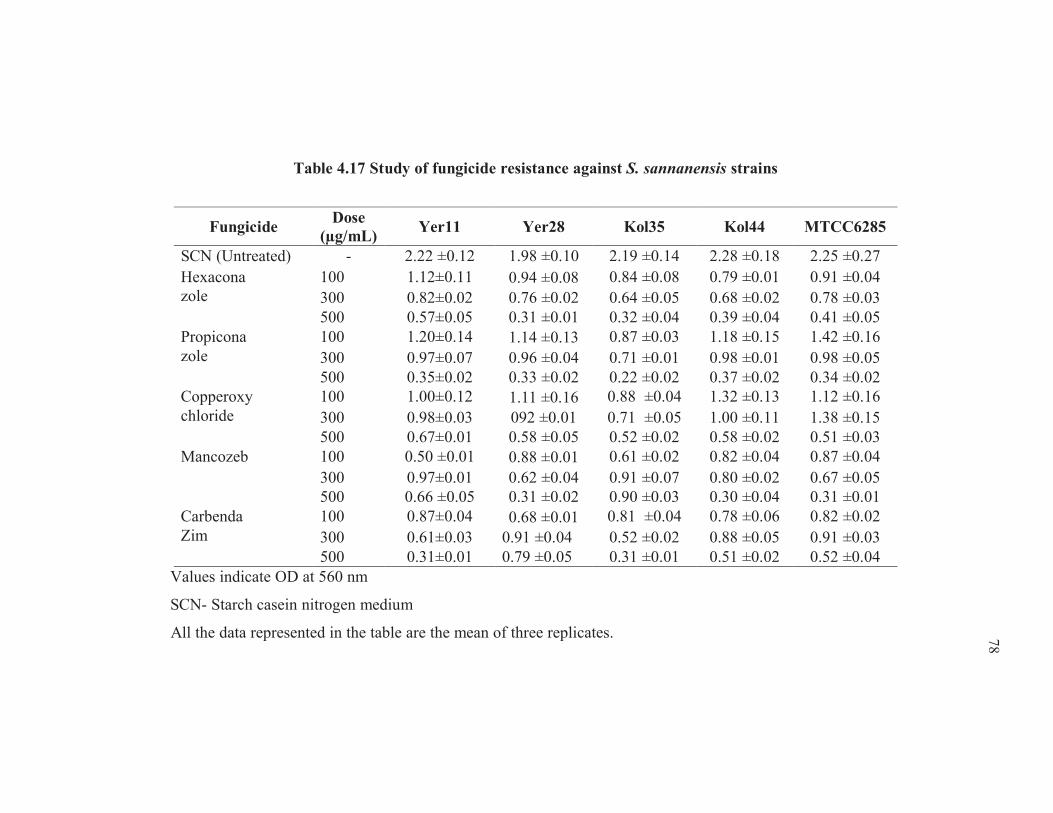
The growth of S. sannanensis strains were found to be least with
fungicides incorporated medium when compared to that of untreated control.
When the concentration of hexaconazole, copper oxychloride and
carbendazim fungicides increased, the growth of S. sannanensis strains were
decreased. The results further revealed that propioconazole was adversely
76
affected the growth (0.22 OD) of Kol35 strain. Other fungicides such as
carbendazim, mancozeb and hexaconazole at higher concentrations partially
influenced the growth of S. sannanensis strains which impart the
compatibility behaviour of S. sannanensis strains with chemical fungicides
(Table 4.17).
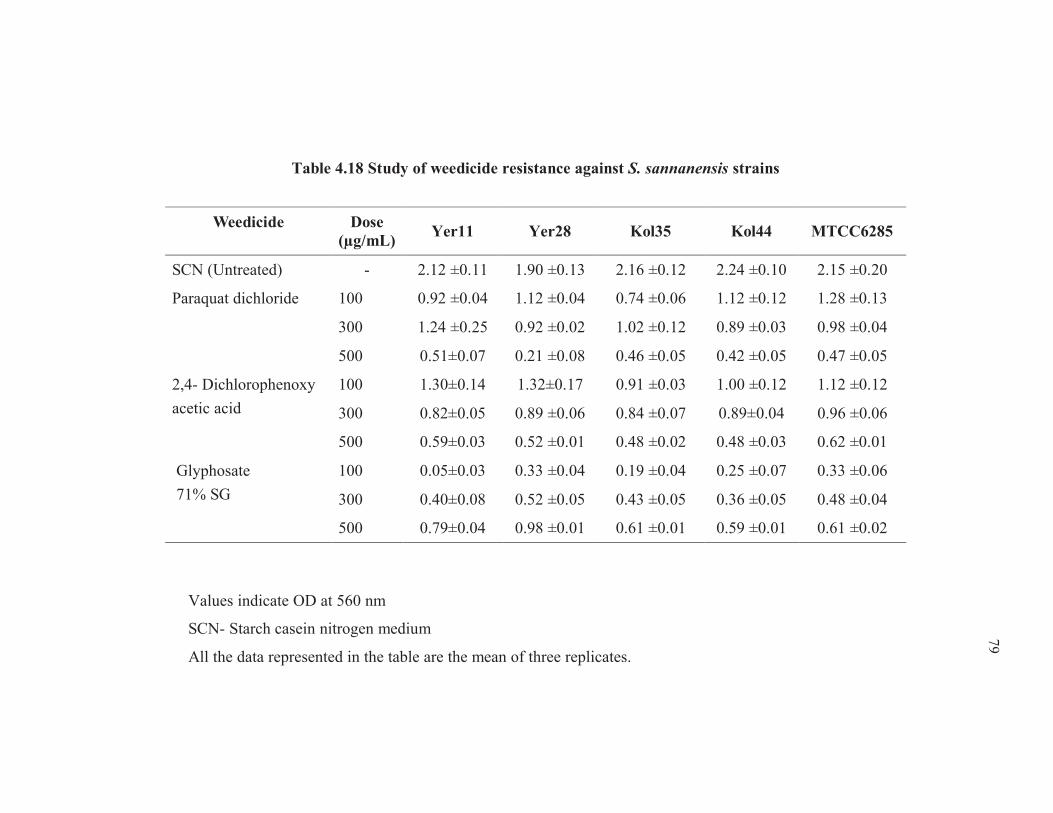
In order to test the resistance nature of S. sannanensis strains to
various weedicides, the basal medium was incorporated with different kinds
of weedicide at various doses and inoculated with specific strains. The results
indicated that when the concentration of Paraquat dichloride increased, the
growth of S. sannanensis strains decreased. Except Yer11 strain, other strains
were well supported at the concentration of 100 µg/mL in terms of growth.
Similar kind of results were observed in the case of 2,4-Dichlorophenoxy
acetic acid too. The maximum growth was observed with Yer28 strain (1.32
OD) at 100 µg/ mL of 2,4-Dichlorophenoxy acetic acid (Table 4.18).
77
Table 4.16 Study of pesticide resistance against S. sannanensis strains
Pesticide Dose (µg/mL) Yer11 Yer28 Kol35 Kol44 MTCC6285
SCN (Untreated) - 2.12 ±0.18 1.90 ±0.11 2.16 ±0.12 2.24±0.10 2.15±0.20
Propargite 100 0.74 ±0.01 0.60±0.02 0.72 ±0.02 0.72±0.01 0.52±0.01
300 1.00 ±0.13 0.94±0.03 0.76 ±0.07 0.81 ±0.05 0.66 ±0.02
500 0.62 ±0.04 0.91±0.05 0.84 ±0.02 1.10±0.14 0.82±0.06
Dicofol 100 0.99 ±0.05 0.34 ±0.01 0.87±0.02 0.29 ±0.02 0.30±0.01
300 0.62 ±0.02 0.71 ±0.05 0.28±0.03 0.93±0.05 0.81±0.05
500 0.28 ±0.01 0.07 ±0.03 0.09 ±0.07 0.07 ±0.01 0.02 ±0.03
Deltamethrin 100 1.27 ±0.11 0.94 ±0.04 0.72±0.05 0.89±0.05 0.81±0.02
300 0.71 ±0.04 0.52 ±0.02 0.97±0.03 0.74 ±0.04 0.57 ±0.03
500 0.29 ±0.02 0.22 ±0.01 0.01 ±0.01 0.20 ±0.02 0.21 ±0.01
Quinalphos 100 0.94±0.05 0.64 ±0.02 0.87±0.03 0.48 ±0.02 0.72 ±0.06
300 0.72 ±0.03 0.92±0.05 0.60 ±0.04 0.92±0.08 0.98±0.05
500 0.53 ±0.02 0.63 ±0.07 0.70±0.05 0.39 ±0.04 0.62 ±0.02
Fenpyroximate 100 0.97±0.04 0.77 ±0.02 0.85±0.07 0.72±0.06 0.77 ±0.01
300 0.68 ±0.05 0.95 ±0.03 0.30 ±0.08 0.40±0.030 0.98±0.08
500 0.37±0.09 0.31±0.02 0.27±0.05 0.24±0.07 0.34±0.07
Values indicate OD at 560 nm
SCN –Starch casein nitrogen medium
All the data represented in the table are the mean of three replicates.
78
Table 4.17 Study of fungicide resistance against S. sannanensis strains
FungicideDose
(µg/mL)Yer11 Yer28 Kol35 Kol44 MTCC6285
SCN (Untreated) - 2.22 ±0.12 1.98 ±0.10 2.19 ±0.14 2.28 ±0.18 2.25 ±0.27
Hexacona
zole
100 1.12±0.11 0.94 ±0.08 0.84 ±0.08 0.79 ±0.01 0.91 ±0.04
300 0.82±0.02 0.76 ±0.02 0.64 ±0.05 0.68 ±0.02 0.78 ±0.03
500 0.57±0.05 0.31 ±0.01 0.32 ±0.04 0.39 ±0.04 0.41 ±0.05
Propicona
zole
100 1.20±0.14 1.14 ±0.13 0.87 ±0.03 1.18 ±0.15 1.42 ±0.16
300 0.97±0.07 0.96 ±0.04 0.71 ±0.01 0.98 ±0.01 0.98 ±0.05
500 0.35±0.02 0.33 ±0.02 0.22 ±0.02 0.37 ±0.02 0.34 ±0.02
Copperoxy
chloride
100 1.00±0.12 1.11 ±0.16 0.88 ±0.04 1.32 ±0.13 1.12 ±0.16
300 0.98±0.03 092 ±0.01 0.71 ±0.05 1.00 ±0.11 1.38 ±0.15
500 0.67±0.01 0.58 ±0.05 0.52 ±0.02 0.58 ±0.02 0.51 ±0.03
Mancozeb 100 0.50 ±0.01 0.88 ±0.01 0.61 ±0.02 0.82 ±0.04 0.87 ±0.04
300 0.97±0.01 0.62 ±0.04 0.91 ±0.07 0.80 ±0.02 0.67 ±0.05
500 0.66 ±0.05 0.31 ±0.02 0.90 ±0.03 0.30 ±0.04 0.31 ±0.01
Carbenda
Zim
100 0.87±0.04 0.68 ±0.01 0.81 ±0.04 0.78 ±0.06 0.82 ±0.02
300 0.61±0.03 0.91 ±0.04 0.52 ±0.02 0.88 ±0.05 0.91 ±0.03
500 0.31±0.01 0.79 ±0.05 0.31 ±0.01 0.51 ±0.02 0.52 ±0.04
Values indicate OD at 560 nm
SCN- Starch casein nitrogen medium
All the data represented in the table are the mean of three replicates.
79
Table 4.18 Study of weedicide resistance against S. sannanensis strains
Weedicide Dose
(µg/mL)Yer11 Yer28 Kol35 Kol44 MTCC6285
SCN (Untreated) - 2.12 ±0.11 1.90 ±0.13 2.16 ±0.12 2.24 ±0.10 2.15 ±0.20
Paraquat dichloride 100 0.92 ±0.04 1.12 ±0.04 0.74 ±0.06 1.12 ±0.12 1.28 ±0.13
300 1.24 ±0.25 0.92 ±0.02 1.02 ±0.12 0.89 ±0.03 0.98 ±0.04
500 0.51±0.07 0.21 ±0.08 0.46 ±0.05 0.42 ±0.05 0.47 ±0.05
2,4- Dichlorophenoxy
acetic acid
100 1.30±0.14 1.32±0.17 0.91 ±0.03 1.00 ±0.12 1.12 ±0.12
300 0.82±0.05 0.89 ±0.06 0.84 ±0.07 0.89±0.04 0.96 ±0.06
500 0.59±0.03 0.52 ±0.01 0.48 ±0.02 0.48 ±0.03 0.62 ±0.01
Glyphosate
71% SG
100 0.05±0.03 0.33 ±0.04 0.19 ±0.04 0.25 ±0.07 0.33 ±0.06
300 0.40±0.08 0.52 ±0.05 0.43 ±0.05 0.36 ±0.05 0.48 ±0.04
500 0.79±0.04 0.98 ±0.01 0.61 ±0.01 0.59 ±0.01 0.61 ±0.02
Values indicate OD at 560 nm
SCN- Starch casein nitrogen medium
All the data represented in the table are the mean of three replicates.
80
4.3 MOLECULAR CHARACTERIZATION OF
STREPTOMYCES SANNANENSIS STRAINS
4.3.1 Isolation of genomic DNA from S. sannanensis strains
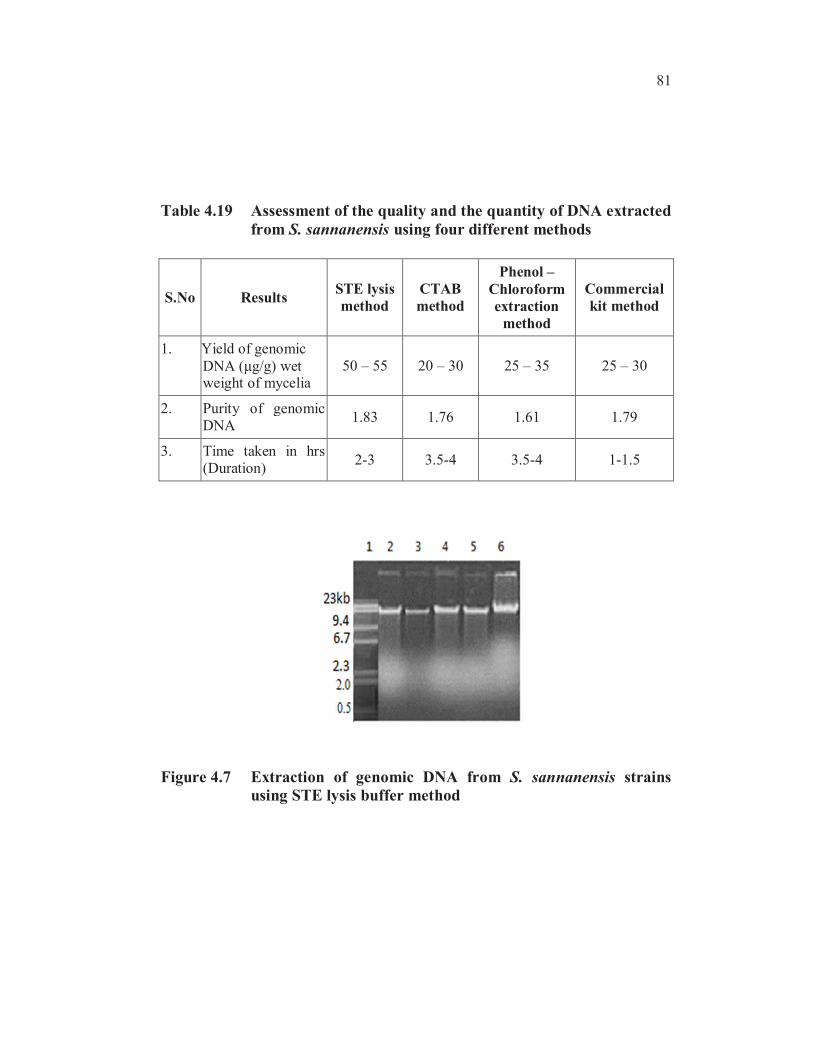
The assessment of the quality and quantity of genomic DNA
extracted from the strains of S. sannanensis was performed based on four
different protocols and the best methodology was selected and subsequently
carried out for further studies. The results were interpreted based on the yield
of the DNA ( g/g) in wet weight of the mycelia, the purity of the DNA and
the time taken to complete the entire procedure in hours. Among the four
procedures used such as an STE loss method, CTAB method, Phenol-
chloroform extraction and commercial kit methods, the STE lysis method was
observed to show the highest yield of DNA (50-55 g/g wet weight of
mycelia) with good quality (1.83) when compared to other protocols (Table
4.20). The time taken for the process was observed to be the least in the case
of commercial kit for 1-1.5 hrs duration followed by the STE lysis method
which was about 2-3 hrs period. Phenol-chloroform extraction and CTAB
methods were found to show inferior results on all these parameters. Hence
STE lysis method was shown superior results and selected for further analysis
especially for RAPD studies.
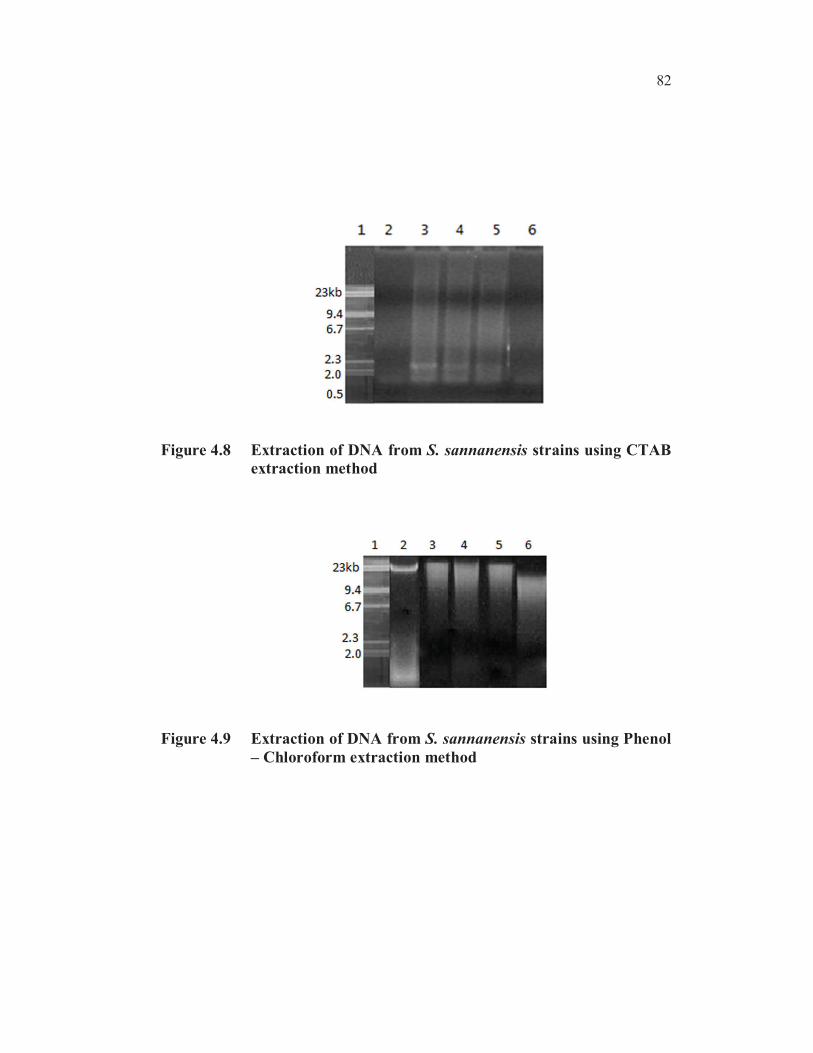
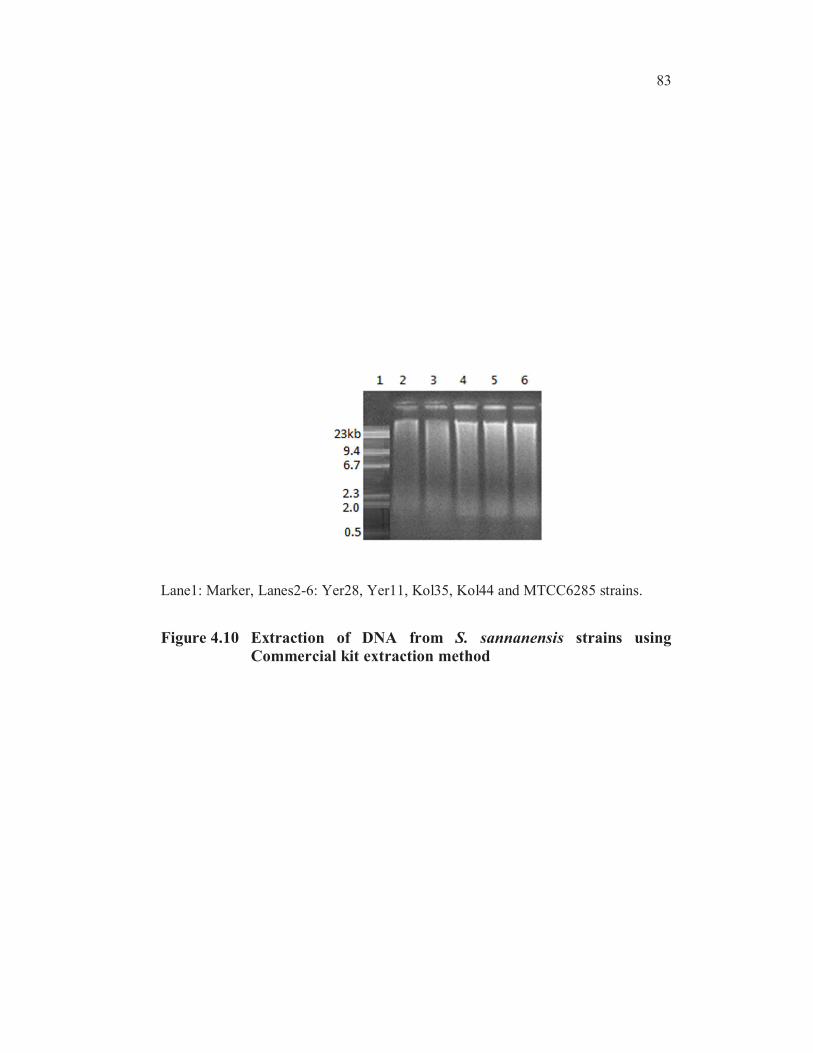
The gel pictures of the isolated genomic DNA using different
protocols were presented in Figures 4.7-4.10. Since the molecular weight of
DNA isolated from actinomycetes would be higher the molecular weight of
the marker ranges from 0.5 kb to 23kb of Hind III digest of DNA was used
as the marker. The genomic DNA isolated from all the strains of
S. sannanensis showed a similar banding pattern which was 10kb - 21kb. In
all the extraction protocol DNA which was isolated from strains of
actinomycetes namely Yer11, Yer28, Kol35 and Kol44 was compared with
the standard strain obtained from MTCC.
81
Table 4.19 Assessment of the quality and the quantity of DNA extracted
from S. sannanensis using four different methods
S.No ResultsSTE lysis
method
CTAB
method
Phenol –
Chloroform
extraction
method
Commercial
kit method
1. Yield of genomic
DNA ( g/g) wetweight of mycelia
50 – 55 20 – 30 25 – 35 25 – 30
2. Purity of genomic
DNA1.83 1.76 1.61 1.79
3. Time taken in hrs
(Duration)2-3 3.5-4 3.5-4 1-1.5
Figure 4.7 Extraction of genomic DNA from S. sannanensis strains
using STE lysis buffer method
82
Figure 4.8 Extraction of DNA from S. sannanensis strains using CTAB
extraction method
Figure 4.9 Extraction of DNA from S. sannanensis strains using Phenol
– Chloroform extraction method
83
Lane1: Marker, Lanes2-6: Yer28, Yer11, Kol35, Kol44 and MTCC6285 strains.
Figure 4.10 Extraction of DNA from S. sannanensis strains using
Commercial kit extraction method
84
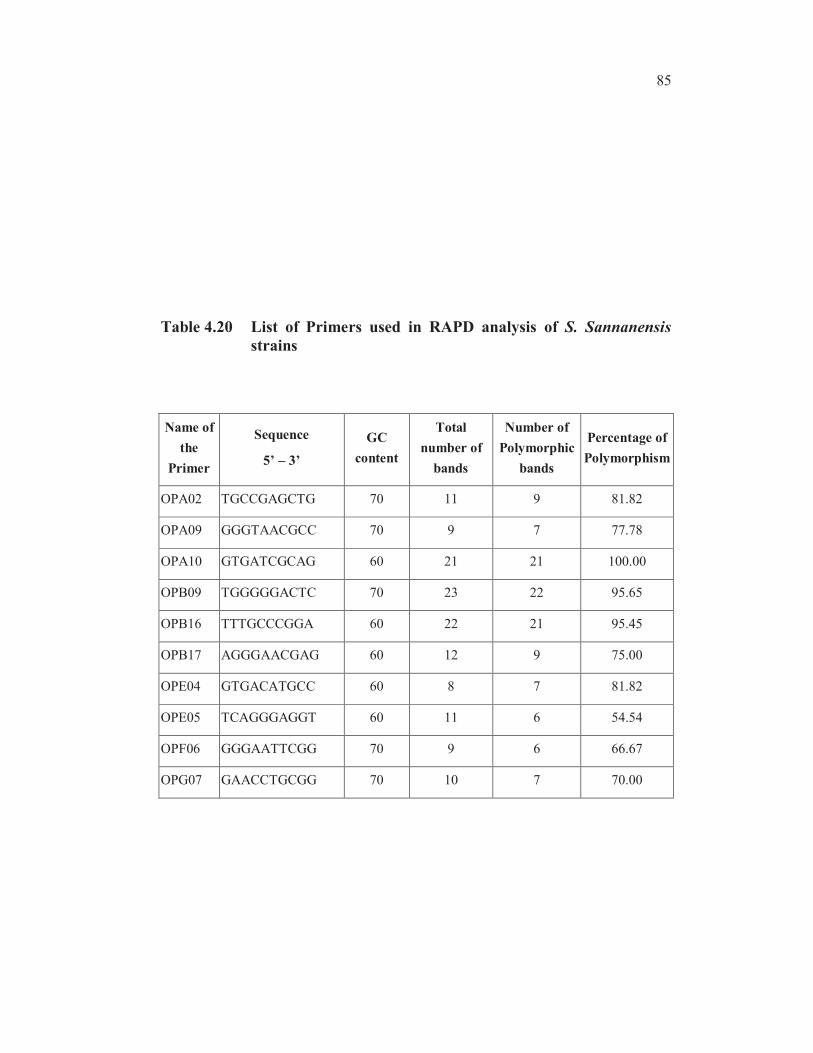
4.3.2 Random Amplified Polymorphic DNA analysis (RAPD) of
S. Sannanensis strains
The results of RAPD analysis of S. sannanensis strains performed
in order to find out the genetic relationship among the strains were tabulated
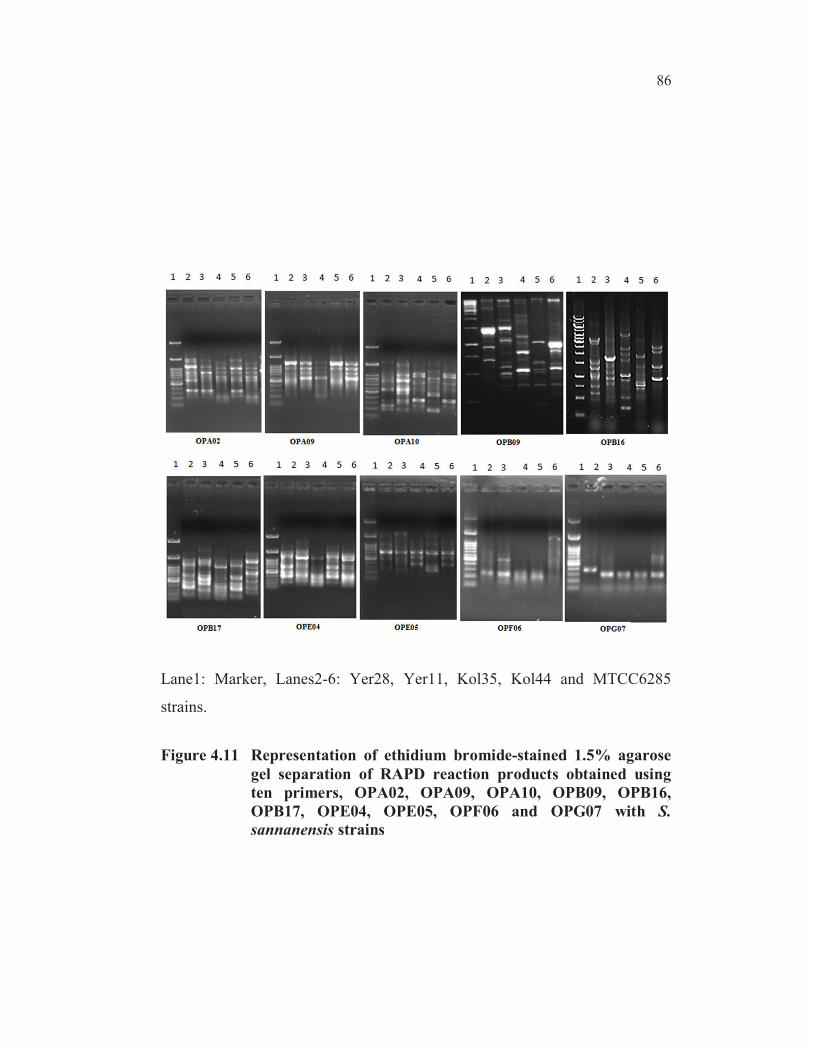
in the Table 4.21. A sum of 30 random primers was used out of which 10
primers were screened based on polymorphism. The documentation of the gel
obtained using all the 10 primers were presented in the Figure 4.11. The
results were analyzed based on the total number of bands and the percentage
polymorphism obtained by using the operon random primer. Among the
varieties of primers used, OPA10 showed 100% polymorphism followed by
the OPB09 primer which showed only 95.65% of polymorphism. The least
level of polymorphism was observed in the case of OPE05 which showed as
low as 54.54% of polymorphism. Good polymorphism was shown between all
the five strains including the standard strain obtained from MTCC,
Chandigarh, India. OPA10 and OPB09 primers were used for further
phylogenetic analysis.
Based on the presence and absence of the bands binary dataset
values were created and the Jaccard’s similarity was created. The results
showed that the similarity value between Yer11 and Kol44 strains was 0.667
which revealed that they are more similar in nature. The next similarity value
was 0.375 which showed that the Yer28 strain was similar to the standard
MTCC strain.
85
Table 4.20 List of Primers used in RAPD analysis of S. Sannanensis
strains
Name of
the
Primer
Sequence
5’ – 3’
GC
content
Total
number of
bands
Number of
Polymorphic
bands
Percentage of
Polymorphism
OPA02 TGCCGAGCTG 70 11 9 81.82
OPA09 GGGTAACGCC 70 9 7 77.78
OPA10 GTGATCGCAG 60 21 21 100.00
OPB09 TGGGGGACTC 70 23 22 95.65
OPB16 TTTGCCCGGA 60 22 21 95.45
OPB17 AGGGAACGAG 60 12 9 75.00
OPE04 GTGACATGCC 60 8 7 81.82
OPE05 TCAGGGAGGT 60 11 6 54.54
OPF06 GGGAATTCGG 70 9 6 66.67
OPG07 GAACCTGCGG 70 10 7 70.00
86
Lane1: Marker, Lanes2-6: Yer28, Yer11, Kol35, Kol44 and MTCC6285
strains.
Figure 4.11 Representation of ethidium bromide-stained 1.5% agarose
gel separation of RAPD reaction products obtained using
ten primers, OPA02, OPA09, OPA10, OPB09, OPB16,
OPB17, OPE04, OPE05, OPF06 and OPG07 with S.
sannanensis strains
87
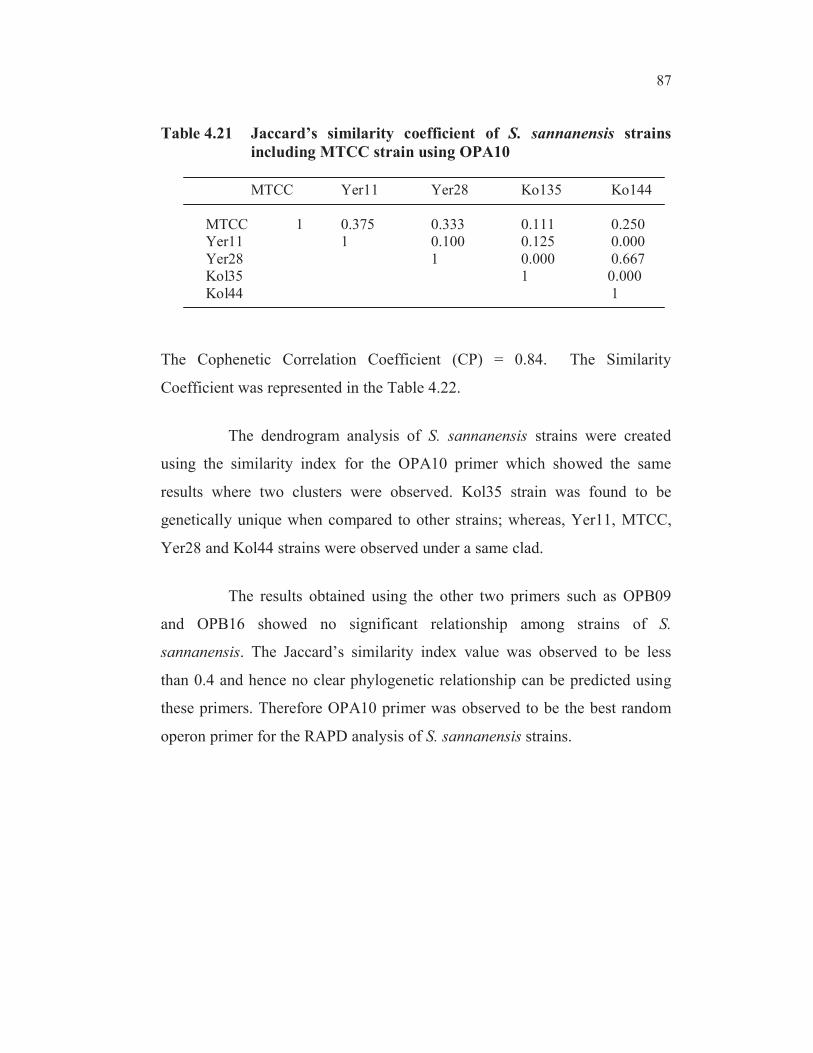
Table 4.21 Jaccard’s similarity coefficient of S. sannanensis strains
including MTCC strain using OPA10
MTCC Yer11 Yer28 Ko135 Ko144
MTCC 1 0.375 0.333 0.111 0.250
Yer11 1 0.100 0.125 0.000
Yer28 1 0.000 0.667
Kol35 1 0.000
Kol44 1
The Cophenetic Correlation Coefficient (CP) = 0.84. The Similarity
Coefficient was represented in the Table 4.22.
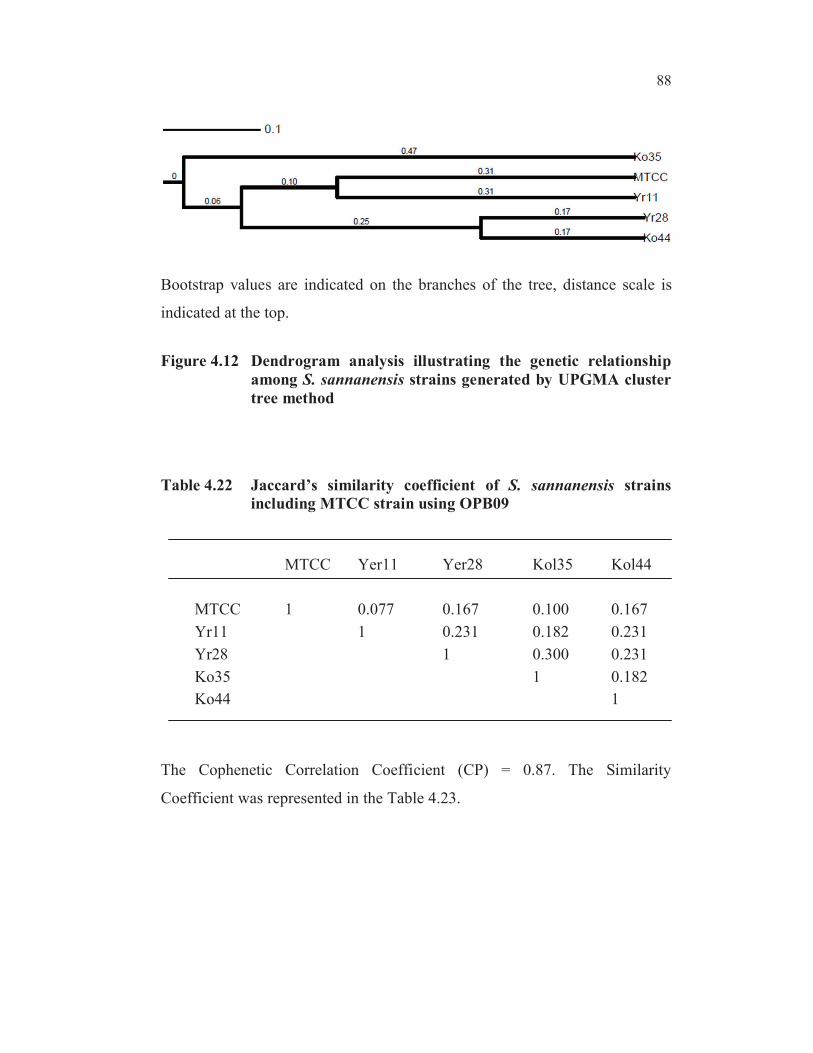
The dendrogram analysis of S. sannanensis strains were created
using the similarity index for the OPA10 primer which showed the same
results where two clusters were observed. Kol35 strain was found to be
genetically unique when compared to other strains; whereas, Yer11, MTCC,
Yer28 and Kol44 strains were observed under a same clad.
The results obtained using the other two primers such as OPB09
and OPB16 showed no significant relationship among strains of S.
sannanensis. The Jaccard’s similarity index value was observed to be less
than 0.4 and hence no clear phylogenetic relationship can be predicted using
these primers. Therefore OPA10 primer was observed to be the best random
operon primer for the RAPD analysis of S. sannanensis strains.
88
Bootstrap values are indicated on the branches of the tree, distance scale is
indicated at the top.
Figure 4.12 Dendrogram analysis illustrating the genetic relationship
among S. sannanensis strains generated by UPGMA cluster
tree method
Table 4.22 Jaccard’s similarity coefficient of S. sannanensis strains
including MTCC strain using OPB09
MTCC Yer11 Yer28 Kol35 Kol44
MTCC 1 0.077 0.167 0.100 0.167
Yr11 1 0.231 0.182 0.231
Yr28 1 0.300 0.231
Ko35 1 0.182
Ko44 1
The Cophenetic Correlation Coefficient (CP) = 0.87. The Similarity
Coefficient was represented in the Table 4.23.
89
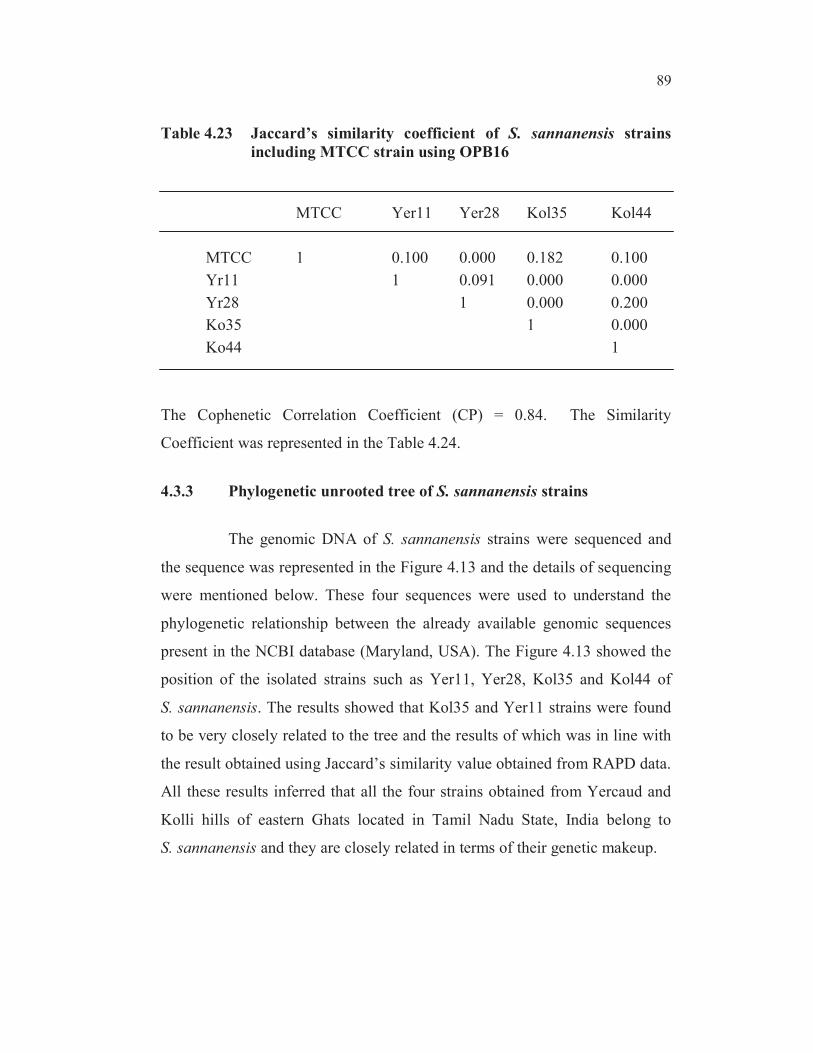
Table 4.23 Jaccard’s similarity coefficient of S. sannanensis strains
including MTCC strain using OPB16
MTCC Yer11 Yer28 Kol35 Kol44
MTCC 1 0.100 0.000 0.182 0.100
Yr11 1 0.091 0.000 0.000
Yr28 1 0.000 0.200
Ko35 1 0.000
Ko44 1
The Cophenetic Correlation Coefficient (CP) = 0.84. The Similarity
Coefficient was represented in the Table 4.24.
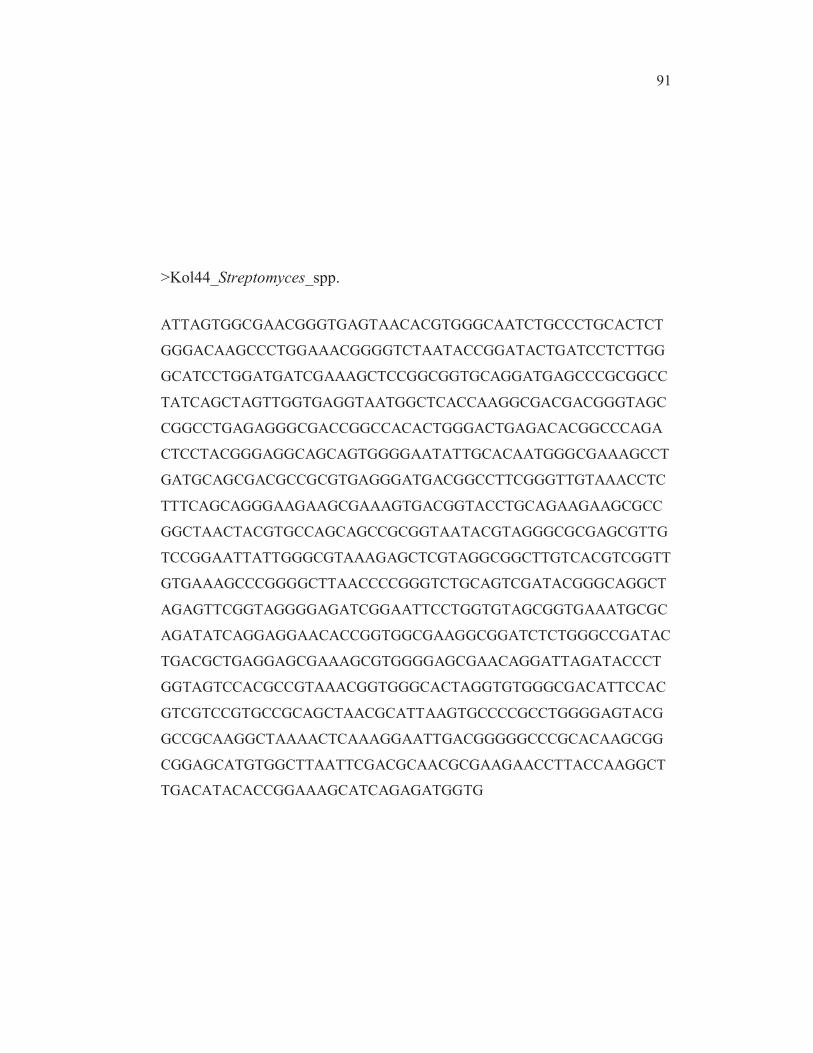
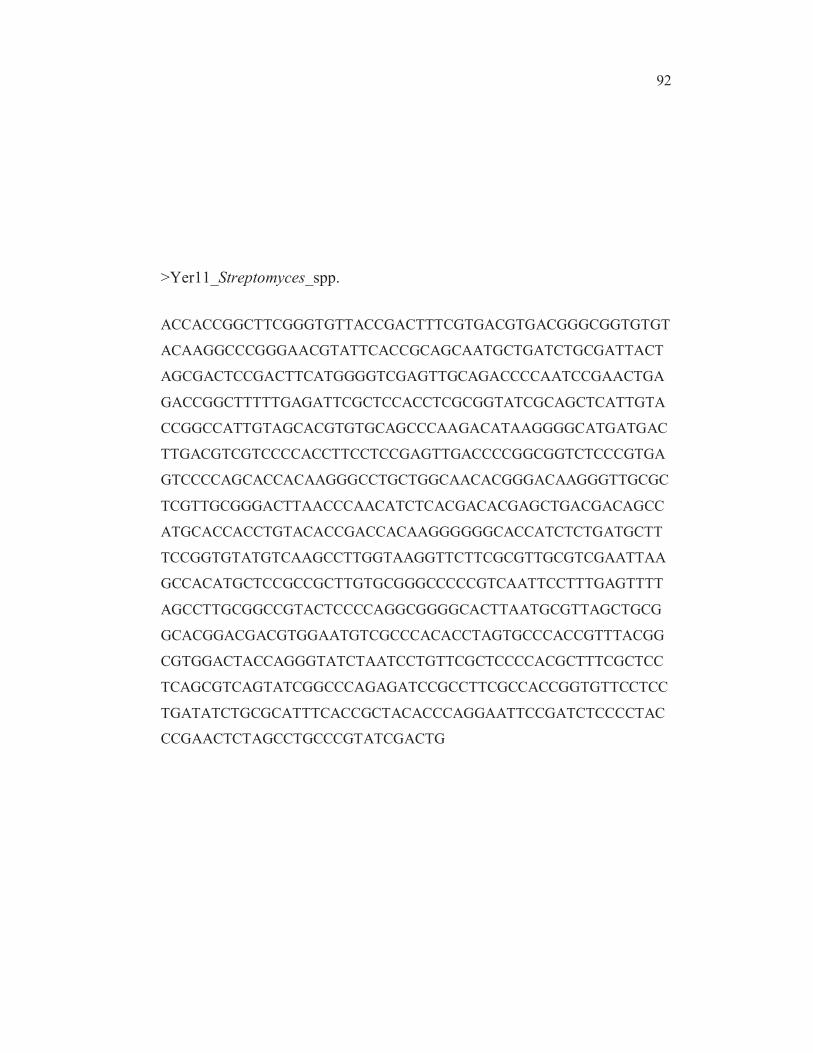
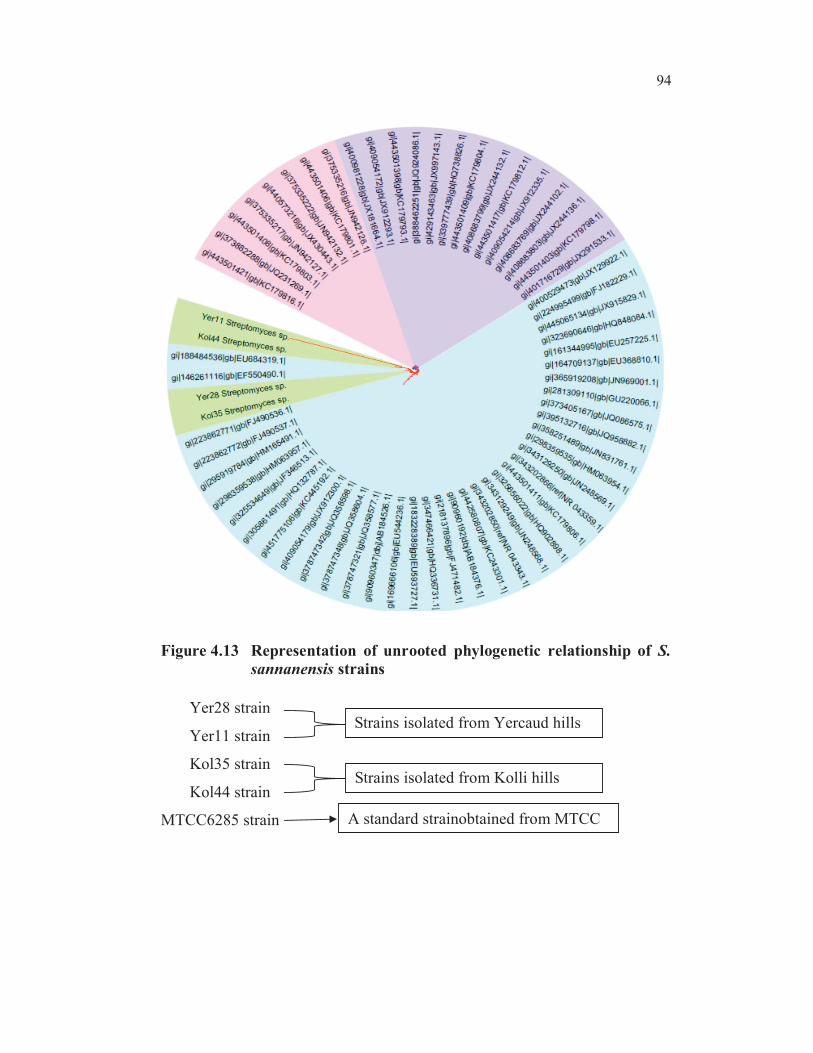
4.3.3 Phylogenetic unrooted tree of S. sannanensis strains
The genomic DNA of S. sannanensis strains were sequenced and
the sequence was represented in the Figure 4.13 and the details of sequencing
were mentioned below. These four sequences were used to understand the
phylogenetic relationship between the already available genomic sequences
present in the NCBI database (Maryland, USA). The Figure 4.13 showed the
position of the isolated strains such as Yer11, Yer28, Kol35 and Kol44 of
S. sannanensis. The results showed that Kol35 and Yer11 strains were found
to be very closely related to the tree and the results of which was in line with
the result obtained using Jaccard’s similarity value obtained from RAPD data.
All these results inferred that all the four strains obtained from Yercaud and
Kolli hills of eastern Ghats located in Tamil Nadu State, India belong to
S. sannanensis and they are closely related in terms of their genetic makeup.
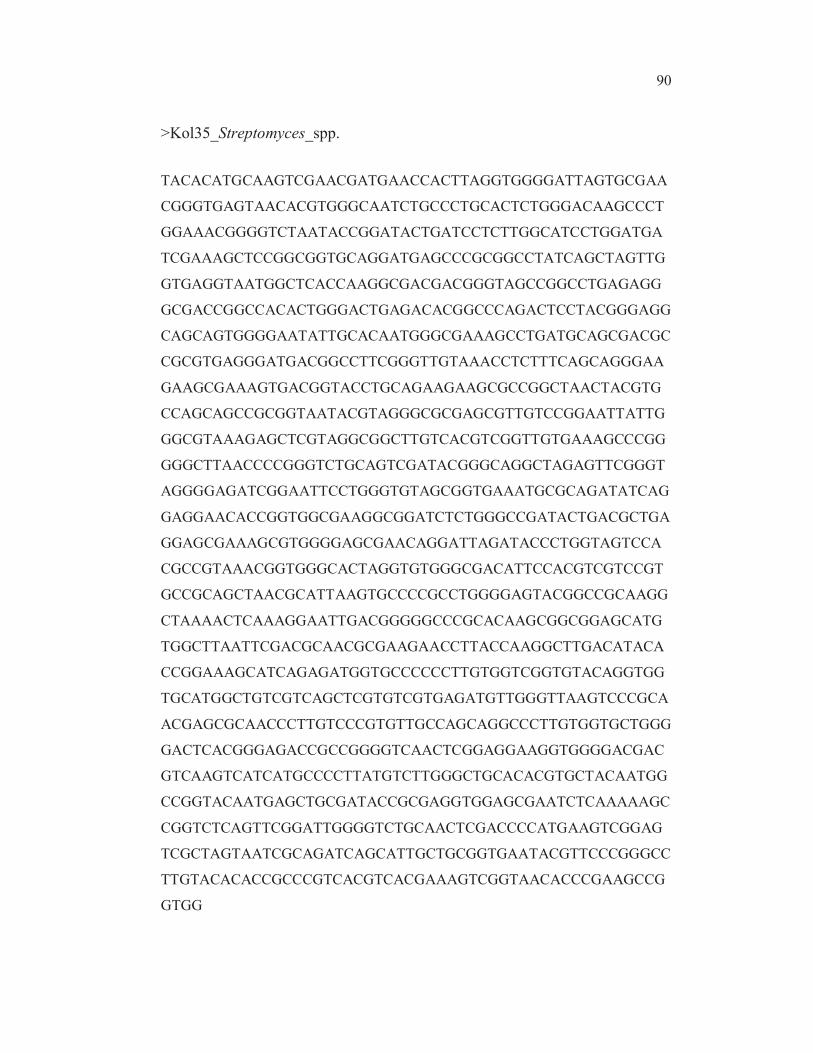
90
>Kol35_Streptomyces_spp.
TACACATGCAAGTCGAACGATGAACCACTTAGGTGGGGATTAGTGCGAA
CGGGTGAGTAACACGTGGGCAATCTGCCCTGCACTCTGGGACAAGCCCT
GGAAACGGGGTCTAATACCGGATACTGATCCTCTTGGCATCCTGGATGA
TCGAAAGCTCCGGCGGTGCAGGATGAGCCCGCGGCCTATCAGCTAGTTG
GTGAGGTAATGGCTCACCAAGGCGACGACGGGTAGCCGGCCTGAGAGG
GCGACCGGCCACACTGGGACTGAGACACGGCCCAGACTCCTACGGGAGG
CAGCAGTGGGGAATATTGCACAATGGGCGAAAGCCTGATGCAGCGACGC
CGCGTGAGGGATGACGGCCTTCGGGTTGTAAACCTCTTTCAGCAGGGAA
GAAGCGAAAGTGACGGTACCTGCAGAAGAAGCGCCGGCTAACTACGTG
CCAGCAGCCGCGGTAATACGTAGGGCGCGAGCGTTGTCCGGAATTATTG
GGCGTAAAGAGCTCGTAGGCGGCTTGTCACGTCGGTTGTGAAAGCCCGG
GGGCTTAACCCCGGGTCTGCAGTCGATACGGGCAGGCTAGAGTTCGGGT
AGGGGAGATCGGAATTCCTGGGTGTAGCGGTGAAATGCGCAGATATCAG
GAGGAACACCGGTGGCGAAGGCGGATCTCTGGGCCGATACTGACGCTGA
GGAGCGAAAGCGTGGGGAGCGAACAGGATTAGATACCCTGGTAGTCCA
CGCCGTAAACGGTGGGCACTAGGTGTGGGCGACATTCCACGTCGTCCGT
GCCGCAGCTAACGCATTAAGTGCCCCGCCTGGGGAGTACGGCCGCAAGG
CTAAAACTCAAAGGAATTGACGGGGGCCCGCACAAGCGGCGGAGCATG
TGGCTTAATTCGACGCAACGCGAAGAACCTTACCAAGGCTTGACATACA
CCGGAAAGCATCAGAGATGGTGCCCCCCTTGTGGTCGGTGTACAGGTGG
TGCATGGCTGTCGTCAGCTCGTGTCGTGAGATGTTGGGTTAAGTCCCGCA
ACGAGCGCAACCCTTGTCCCGTGTTGCCAGCAGGCCCTTGTGGTGCTGGG
GACTCACGGGAGACCGCCGGGGTCAACTCGGAGGAAGGTGGGGACGAC
GTCAAGTCATCATGCCCCTTATGTCTTGGGCTGCACACGTGCTACAATGG
CCGGTACAATGAGCTGCGATACCGCGAGGTGGAGCGAATCTCAAAAAGC
CGGTCTCAGTTCGGATTGGGGTCTGCAACTCGACCCCATGAAGTCGGAG
TCGCTAGTAATCGCAGATCAGCATTGCTGCGGTGAATACGTTCCCGGGCC
TTGTACACACCGCCCGTCACGTCACGAAAGTCGGTAACACCCGAAGCCG
GTGG
91
>Kol44_Streptomyces_spp.
ATTAGTGGCGAACGGGTGAGTAACACGTGGGCAATCTGCCCTGCACTCT
GGGACAAGCCCTGGAAACGGGGTCTAATACCGGATACTGATCCTCTTGG
GCATCCTGGATGATCGAAAGCTCCGGCGGTGCAGGATGAGCCCGCGGCC
TATCAGCTAGTTGGTGAGGTAATGGCTCACCAAGGCGACGACGGGTAGC
CGGCCTGAGAGGGCGACCGGCCACACTGGGACTGAGACACGGCCCAGA
CTCCTACGGGAGGCAGCAGTGGGGAATATTGCACAATGGGCGAAAGCCT
GATGCAGCGACGCCGCGTGAGGGATGACGGCCTTCGGGTTGTAAACCTC
TTTCAGCAGGGAAGAAGCGAAAGTGACGGTACCTGCAGAAGAAGCGCC
GGCTAACTACGTGCCAGCAGCCGCGGTAATACGTAGGGCGCGAGCGTTG
TCCGGAATTATTGGGCGTAAAGAGCTCGTAGGCGGCTTGTCACGTCGGTT
GTGAAAGCCCGGGGCTTAACCCCGGGTCTGCAGTCGATACGGGCAGGCT
AGAGTTCGGTAGGGGAGATCGGAATTCCTGGTGTAGCGGTGAAATGCGC
AGATATCAGGAGGAACACCGGTGGCGAAGGCGGATCTCTGGGCCGATAC
TGACGCTGAGGAGCGAAAGCGTGGGGAGCGAACAGGATTAGATACCCT
GGTAGTCCACGCCGTAAACGGTGGGCACTAGGTGTGGGCGACATTCCAC
GTCGTCCGTGCCGCAGCTAACGCATTAAGTGCCCCGCCTGGGGAGTACG
GCCGCAAGGCTAAAACTCAAAGGAATTGACGGGGGCCCGCACAAGCGG
CGGAGCATGTGGCTTAATTCGACGCAACGCGAAGAACCTTACCAAGGCT
TGACATACACCGGAAAGCATCAGAGATGGTG
92
>Yer11_Streptomyces_spp.
ACCACCGGCTTCGGGTGTTACCGACTTTCGTGACGTGACGGGCGGTGTGT
ACAAGGCCCGGGAACGTATTCACCGCAGCAATGCTGATCTGCGATTACT
AGCGACTCCGACTTCATGGGGTCGAGTTGCAGACCCCAATCCGAACTGA
GACCGGCTTTTTGAGATTCGCTCCACCTCGCGGTATCGCAGCTCATTGTA
CCGGCCATTGTAGCACGTGTGCAGCCCAAGACATAAGGGGCATGATGAC
TTGACGTCGTCCCCACCTTCCTCCGAGTTGACCCCGGCGGTCTCCCGTGA
GTCCCCAGCACCACAAGGGCCTGCTGGCAACACGGGACAAGGGTTGCGC
TCGTTGCGGGACTTAACCCAACATCTCACGACACGAGCTGACGACAGCC
ATGCACCACCTGTACACCGACCACAAGGGGGGCACCATCTCTGATGCTT
TCCGGTGTATGTCAAGCCTTGGTAAGGTTCTTCGCGTTGCGTCGAATTAA
GCCACATGCTCCGCCGCTTGTGCGGGCCCCCGTCAATTCCTTTGAGTTTT
AGCCTTGCGGCCGTACTCCCCAGGCGGGGCACTTAATGCGTTAGCTGCG
GCACGGACGACGTGGAATGTCGCCCACACCTAGTGCCCACCGTTTACGG
CGTGGACTACCAGGGTATCTAATCCTGTTCGCTCCCCACGCTTTCGCTCC
TCAGCGTCAGTATCGGCCCAGAGATCCGCCTTCGCCACCGGTGTTCCTCC
TGATATCTGCGCATTTCACCGCTACACCCAGGAATTCCGATCTCCCCTAC
CCGAACTCTAGCCTGCCCGTATCGACTG
93
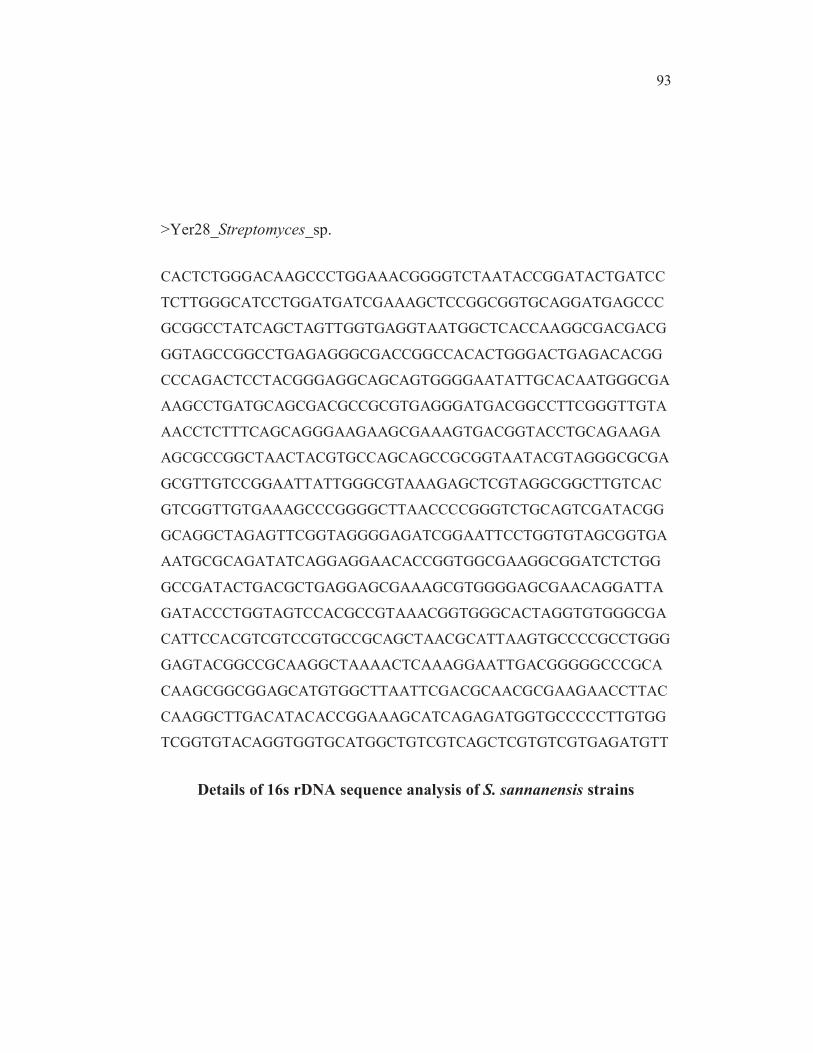
>Yer28_Streptomyces_sp.
CACTCTGGGACAAGCCCTGGAAACGGGGTCTAATACCGGATACTGATCC
TCTTGGGCATCCTGGATGATCGAAAGCTCCGGCGGTGCAGGATGAGCCC
GCGGCCTATCAGCTAGTTGGTGAGGTAATGGCTCACCAAGGCGACGACG
GGTAGCCGGCCTGAGAGGGCGACCGGCCACACTGGGACTGAGACACGG
CCCAGACTCCTACGGGAGGCAGCAGTGGGGAATATTGCACAATGGGCGA
AAGCCTGATGCAGCGACGCCGCGTGAGGGATGACGGCCTTCGGGTTGTA
AACCTCTTTCAGCAGGGAAGAAGCGAAAGTGACGGTACCTGCAGAAGA
AGCGCCGGCTAACTACGTGCCAGCAGCCGCGGTAATACGTAGGGCGCGA
GCGTTGTCCGGAATTATTGGGCGTAAAGAGCTCGTAGGCGGCTTGTCAC
GTCGGTTGTGAAAGCCCGGGGCTTAACCCCGGGTCTGCAGTCGATACGG
GCAGGCTAGAGTTCGGTAGGGGAGATCGGAATTCCTGGTGTAGCGGTGA
AATGCGCAGATATCAGGAGGAACACCGGTGGCGAAGGCGGATCTCTGG
GCCGATACTGACGCTGAGGAGCGAAAGCGTGGGGAGCGAACAGGATTA
GATACCCTGGTAGTCCACGCCGTAAACGGTGGGCACTAGGTGTGGGCGA
CATTCCACGTCGTCCGTGCCGCAGCTAACGCATTAAGTGCCCCGCCTGGG
GAGTACGGCCGCAAGGCTAAAACTCAAAGGAATTGACGGGGGCCCGCA
CAAGCGGCGGAGCATGTGGCTTAATTCGACGCAACGCGAAGAACCTTAC
CAAGGCTTGACATACACCGGAAAGCATCAGAGATGGTGCCCCCTTGTGG
TCGGTGTACAGGTGGTGCATGGCTGTCGTCAGCTCGTGTCGTGAGATGTT
Details of 16s rDNA sequence analysis of S. sannanensis strains
94
Figure 4.13 Representation of unrooted phylogenetic relationship of S.
sannanensis strains
Yer28 strain
Yer11 strain
Kol35 strain
Kol44 strain
MTCC6285 strain
Strains isolated from Yercaud hills
Strains isolated from Kolli hills
A standard strainobtained from MTCC
95
The 16Sr DNA sequence data reveals that, all the 4 strains of
actinomycetes have unique sequences which are presented in Figure 4.13.
Based on the sequence data, the strains were identified as Streptomyces sp.
Each of the strains were submitted and the accession numbers were
Table 4.24 Accession number of the four strains isolated from Yercaud
and Kolli hills of Eastern Ghats
S.No Isolate name Accession number
1. Yer 11 KF027207
2. Yer28 KF027208
3. Kol35 KF027209
4. Kol44 KF027210
4.3.4 Extraction and expression of total proteins from S. sannanensis
strains
The amount of total proteins exacted from S. sannanensis strains
were standardized using three different protein extraction protocols such as
SDS-PAGE, TCA and Urea. The quantitative determination of proteins from
all the strains of S. sannanensis was carried out by Lowry et al (1951)
method. The estimation revealed that the specific amount of proteins was
yielded at the maximum through SDS-PAGE protocol when compared to
TCA and urea protocols. The yield of proteins was found to be of 8.6 mg,
8.2 mg, 8.5 mg, 8.8 mg and 8.6 mg with SDS-PAGE extraction method
whereas the TCA extraction yielded 6.2 mg, 5.5 mg, 6.0 mg, 6.2 mg and
5.8 mg followed by 5.5 mg, 6.0 mg, 6.4 mg, 4.5 mg and 5.0 mg of proteins
with urea extraction protocol with respect to different strains of
S. sannanensis.
96
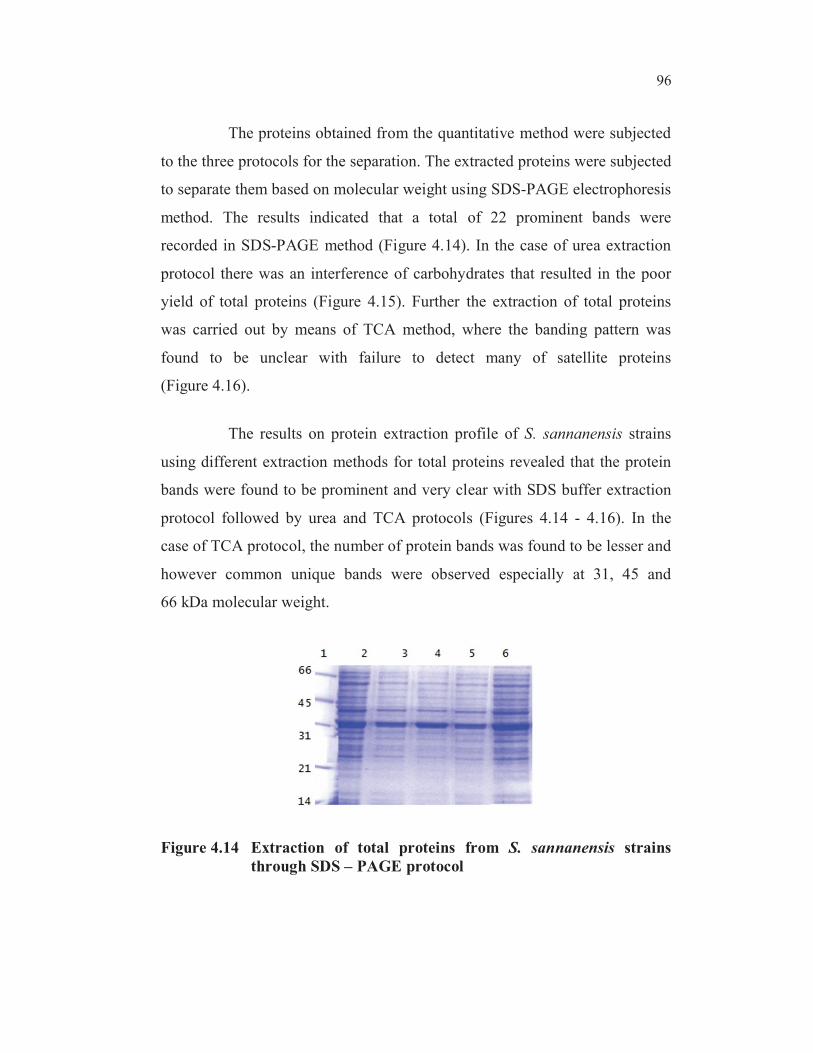
The proteins obtained from the quantitative method were subjected
to the three protocols for the separation. The extracted proteins were subjected
to separate them based on molecular weight using SDS-PAGE electrophoresis
method. The results indicated that a total of 22 prominent bands were
recorded in SDS-PAGE method (Figure 4.14). In the case of urea extraction
protocol there was an interference of carbohydrates that resulted in the poor
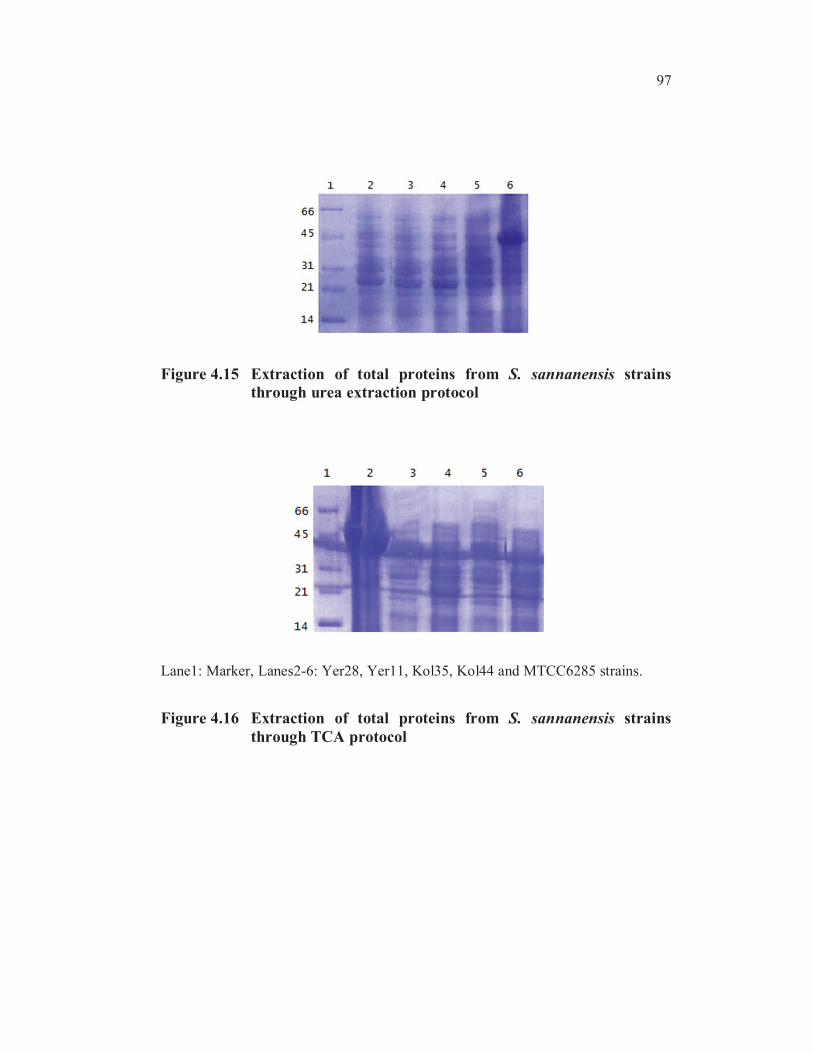
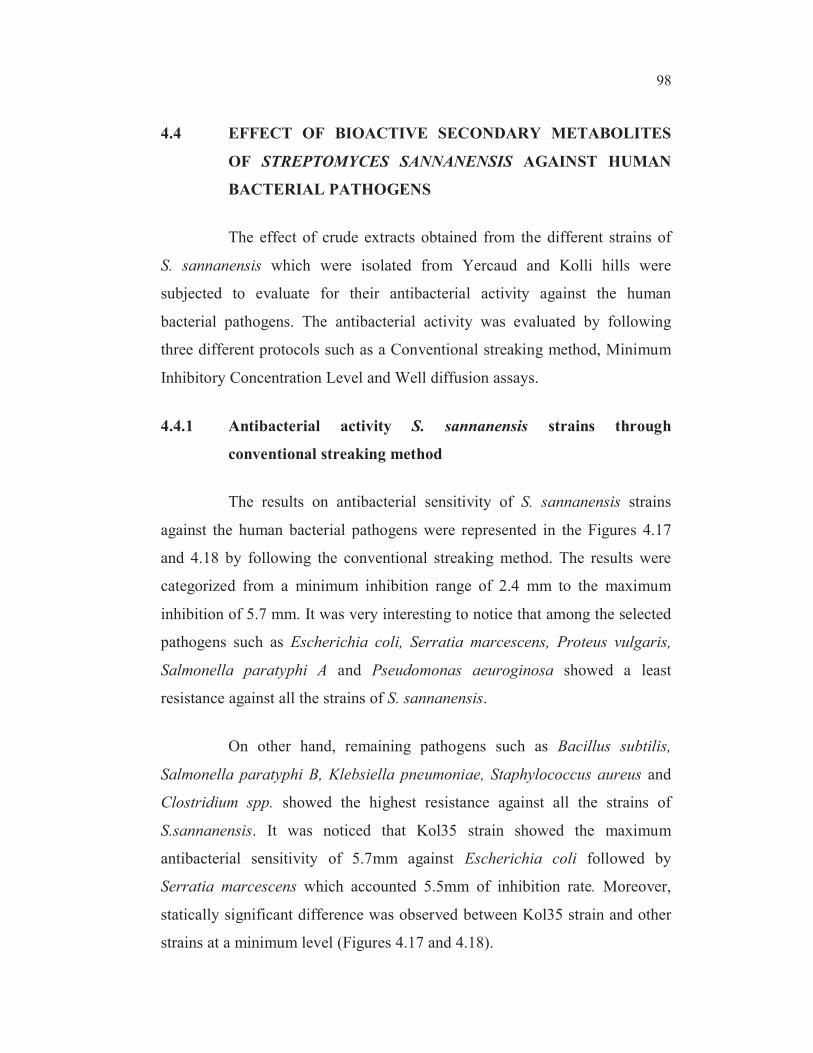
yield of total proteins (Figure 4.15). Further the extraction of total proteins
was carried out by means of TCA method, where the banding pattern was
found to be unclear with failure to detect many of satellite proteins
(Figure 4.16).
The results on protein extraction profile of S. sannanensis strains
using different extraction methods for total proteins revealed that the protein
bands were found to be prominent and very clear with SDS buffer extraction
protocol followed by urea and TCA protocols (Figures 4.14 - 4.16). In the
case of TCA protocol, the number of protein bands was found to be lesser and
however common unique bands were observed especially at 31, 45 and
66 kDa molecular weight.
Figure 4.14 Extraction of total proteins from S. sannanensis strains
through SDS – PAGE protocol
97
Figure 4.15 Extraction of total proteins from S. sannanensis strains
through urea extraction protocol
Lane1: Marker, Lanes2-6: Yer28, Yer11, Kol35, Kol44 and MTCC6285 strains.
Figure 4.16 Extraction of total proteins from S. sannanensis strains
through TCA protocol
98
4.4 EFFECT OF BIOACTIVE SECONDARY METABOLITES
OF STREPTOMYCES SANNANENSIS AGAINST HUMAN
BACTERIAL PATHOGENS
The effect of crude extracts obtained from the different strains of
S. sannanensis which were isolated from Yercaud and Kolli hills were
subjected to evaluate for their antibacterial activity against the human
bacterial pathogens. The antibacterial activity was evaluated by following
three different protocols such as a Conventional streaking method, Minimum
Inhibitory Concentration Level and Well diffusion assays.
4.4.1 Antibacterial activity S. sannanensis strains through
conventional streaking method
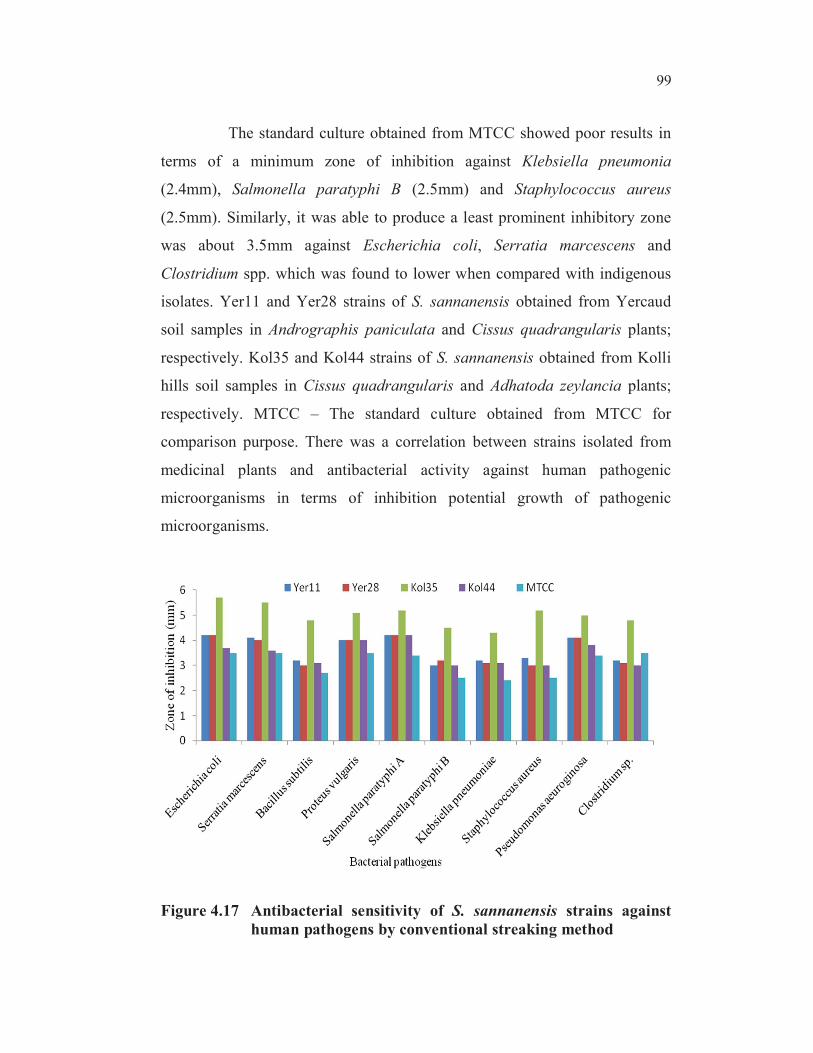
The results on antibacterial sensitivity of S. sannanensis strains
against the human bacterial pathogens were represented in the Figures 4.17
and 4.18 by following the conventional streaking method. The results were
categorized from a minimum inhibition range of 2.4 mm to the maximum
inhibition of 5.7 mm. It was very interesting to notice that among the selected
pathogens such as Escherichia coli, Serratia marcescens, Proteus vulgaris,
Salmonella paratyphi A and Pseudomonas aeuroginosa showed a least
resistance against all the strains of S. sannanensis.
On other hand, remaining pathogens such as Bacillus subtilis,
Salmonella paratyphi B, Klebsiella pneumoniae, Staphylococcus aureus and
Clostridium spp. showed the highest resistance against all the strains of
S.sannanensis. It was noticed that Kol35 strain showed the maximum
antibacterial sensitivity of 5.7mm against Escherichia coli followed by
Serratia marcescens which accounted 5.5mm of inhibition rate. Moreover,
statically significant difference was observed between Kol35 strain and other
strains at a minimum level (Figures 4.17 and 4.18).
99
The standard culture obtained from MTCC showed poor results in
terms of a minimum zone of inhibition against Klebsiella pneumonia
(2.4mm), Salmonella paratyphi B (2.5mm) and Staphylococcus aureus
(2.5mm). Similarly, it was able to produce a least prominent inhibitory zone
was about 3.5mm against Escherichia coli, Serratia marcescens and
Clostridium spp. which was found to lower when compared with indigenous
isolates. Yer11 and Yer28 strains of S. sannanensis obtained from Yercaud
soil samples in Andrographis paniculata and Cissus quadrangularis plants;
respectively. Kol35 and Kol44 strains of S. sannanensis obtained from Kolli
hills soil samples in Cissus quadrangularis and Adhatoda zeylancia plants;
respectively. MTCC – The standard culture obtained from MTCC for
comparison purpose. There was a correlation between strains isolated from
medicinal plants and antibacterial activity against human pathogenic
microorganisms in terms of inhibition potential growth of pathogenic
microorganisms.
Figure 4.17 Antibacterial sensitivity of S. sannanensis strains against
human pathogens by conventional streaking method
100
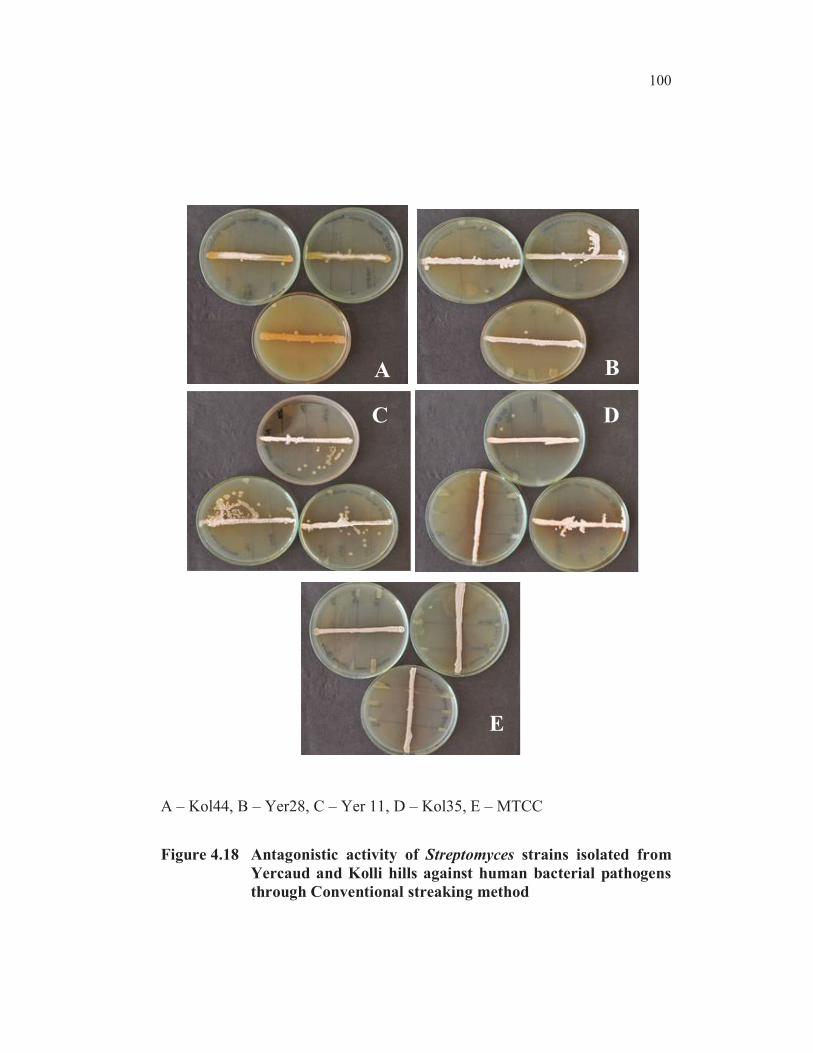
A – Kol44, B – Yer28, C – Yer 11, D – Kol35, E – MTCC
Figure 4.18 Antagonistic activity of Streptomyces strains isolated from
Yercaud and Kolli hills against human bacterial pathogens
through Conventional streaking method
A B
C D
E
101
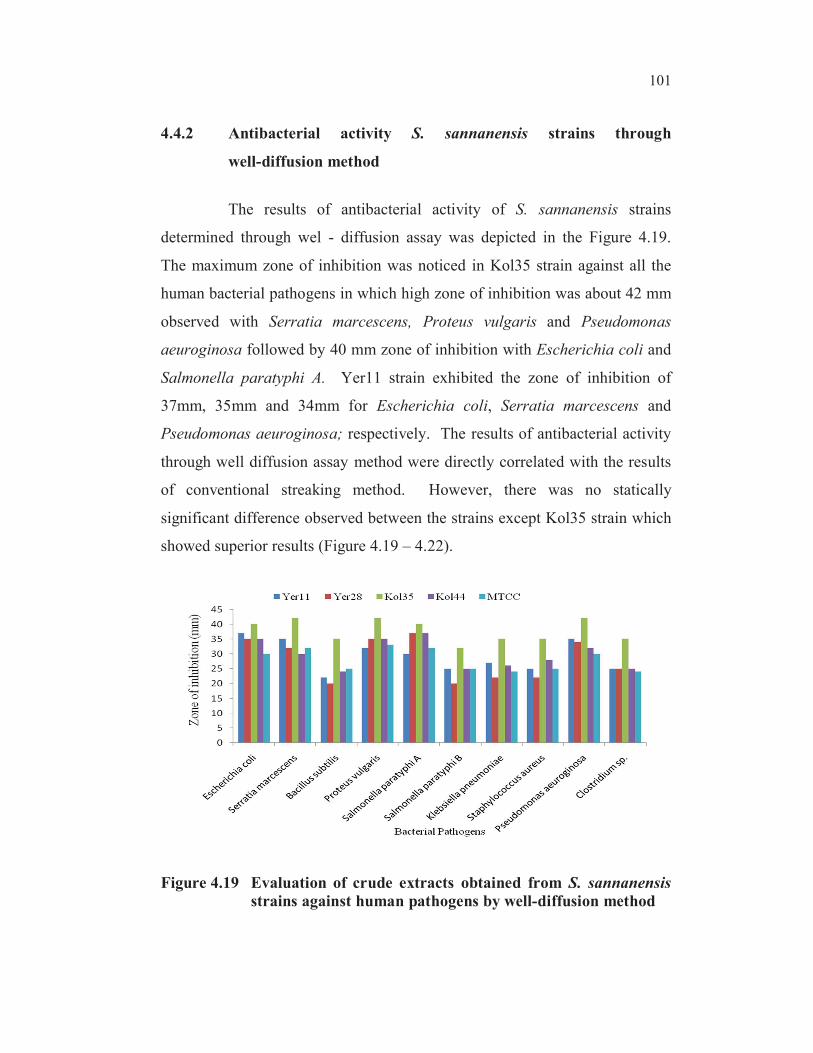
4.4.2 Antibacterial activity S. sannanensis strains through
well-diffusion method
The results of antibacterial activity of S. sannanensis strains
determined through wel - diffusion assay was depicted in the Figure 4.19.
The maximum zone of inhibition was noticed in Kol35 strain against all the
human bacterial pathogens in which high zone of inhibition was about 42 mm
observed with Serratia marcescens, Proteus vulgaris and Pseudomonas
aeuroginosa followed by 40 mm zone of inhibition with Escherichia coli and
Salmonella paratyphi A. Yer11 strain exhibited the zone of inhibition of
37mm, 35mm and 34mm for Escherichia coli, Serratia marcescens and
Pseudomonas aeuroginosa; respectively. The results of antibacterial activity
through well diffusion assay method were directly correlated with the results
of conventional streaking method. However, there was no statically
significant difference observed between the strains except Kol35 strain which
showed superior results (Figure 4.19 – 4.22).
Figure 4.19 Evaluation of crude extracts obtained from S. sannanensis
strains against human pathogens by well-diffusion method
102
A. Serratia marscens
B. Escherichia coli
C. Proteus vulgaris
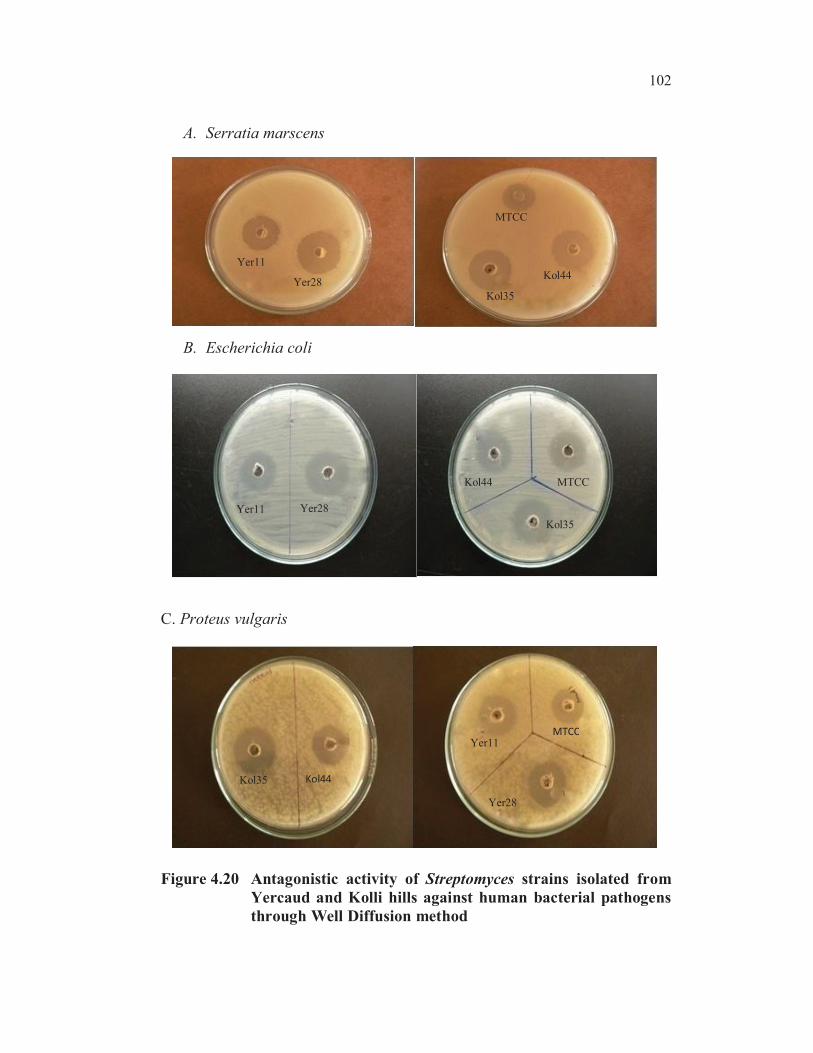
Figure 4.20 Antagonistic activity of Streptomyces strains isolated from
Yercaud and Kolli hills against human bacterial pathogens
through Well Diffusion method
Yer11
Yer28
Kol35
Kol44
MTCC
Yer11 Yer28
Kol44
Kol35
MTCC
Kol35 Kol44
Yer11
Yer28
MTCC
103
D. Salmonella paratyphi A
E. Salmonella paratyphi B
F. Pseudomonas aeruginosa
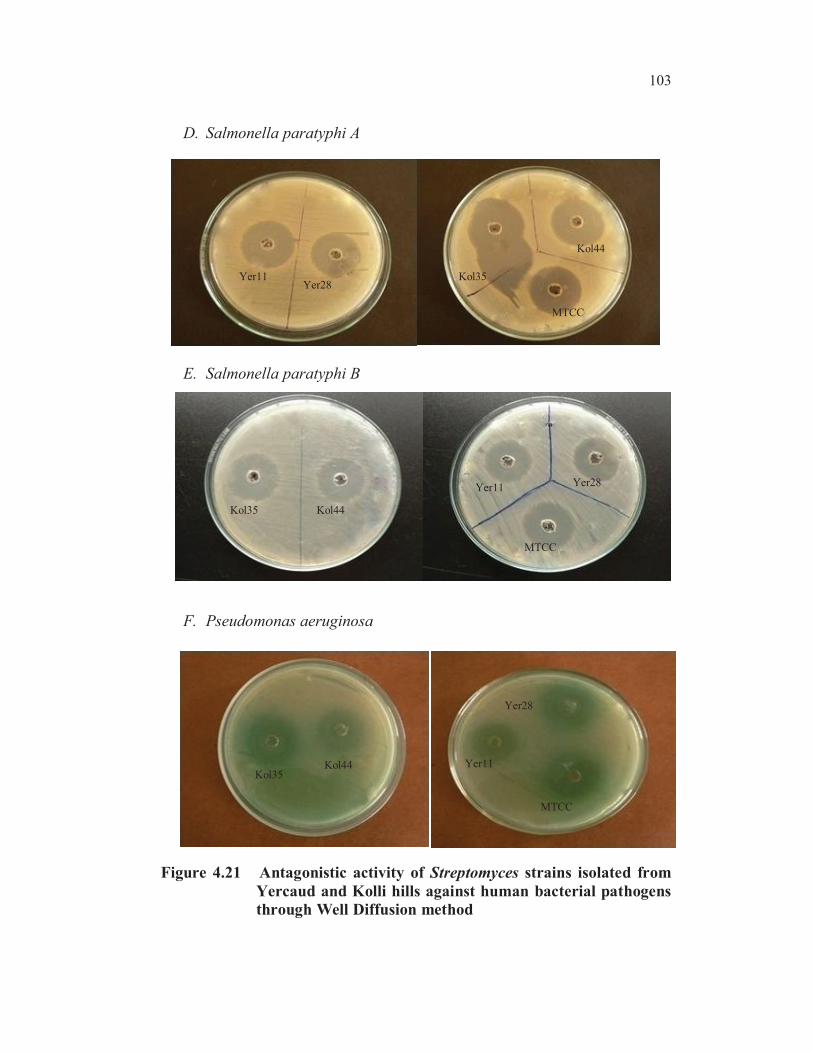
Figure 4.21 Antagonistic activity of Streptomyces strains isolated from
Yercaud and Kolli hills against human bacterial pathogens
through Well Diffusion method
Kol35
Kol44
MTCC
Yer11Yer28
Kol35 Kol44
Yer11 Yer28
MTCC
Kol35Kol44 Yer11
Yer28
MTCC
104
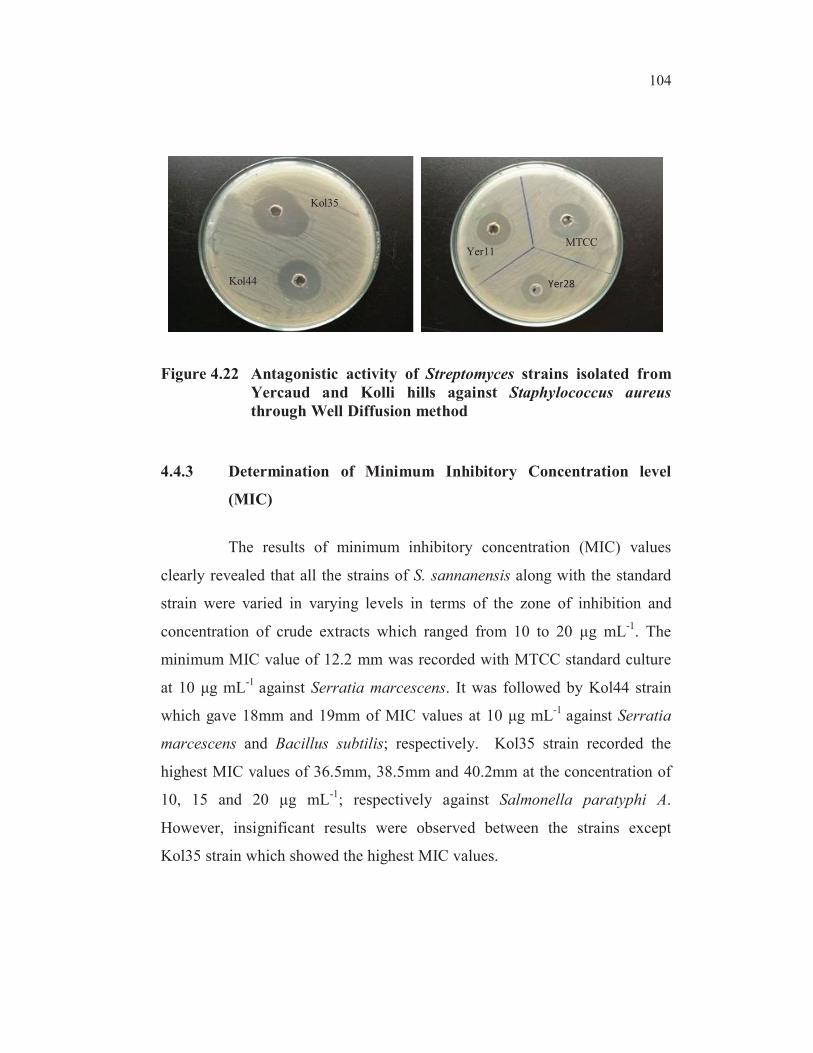
Figure 4.22 Antagonistic activity of Streptomyces strains isolated from
Yercaud and Kolli hills against Staphylococcus aureus
through Well Diffusion method
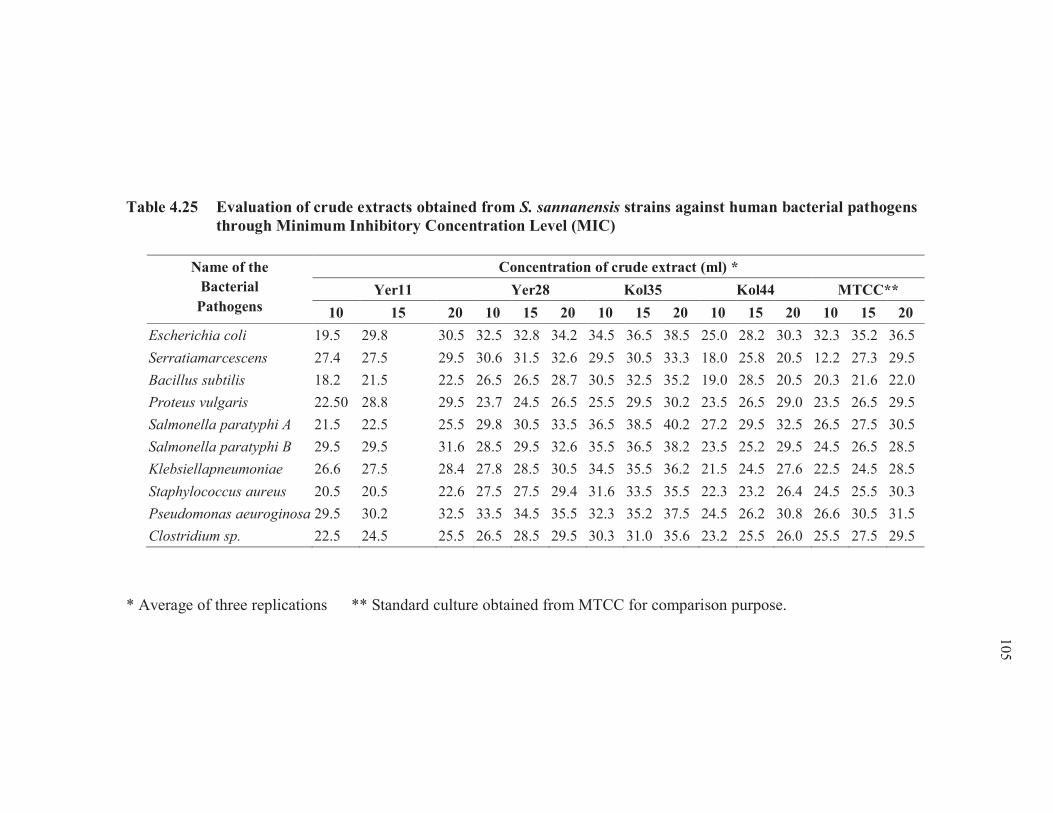
4.4.3 Determination of Minimum Inhibitory Concentration level
(MIC)
The results of minimum inhibitory concentration (MIC) values
clearly revealed that all the strains of S. sannanensis along with the standard
strain were varied in varying levels in terms of the zone of inhibition and
concentration of crude extracts which ranged from 10 to 20 g mL-1
. The
minimum MIC value of 12.2 mm was recorded with MTCC standard culture
at 10 g mL-1
against Serratia marcescens. It was followed by Kol44 strain
which gave 18mm and 19mm of MIC values at 10 g mL-1
against Serratia
marcescens and Bacillus subtilis; respectively. Kol35 strain recorded the
highest MIC values of 36.5mm, 38.5mm and 40.2mm at the concentration of
10, 15 and 20 g mL-1
; respectively against Salmonella paratyphi A.
However, insignificant results were observed between the strains except
Kol35 strain which showed the highest MIC values.
Kol35
Kol44
Yer11
Yer28
MTCC
10
5
Table 4.25 Evaluation of crude extracts obtained from S. sannanensis strains against human bacterial pathogens
through Minimum Inhibitory Concentration Level (MIC)
Name of the
Bacterial
Pathogens
Concentration of crude extract (ml) *
Yer11 Yer28 Kol35 Kol44 MTCC**
10 15 20 10 15 20 10 15 20 10 15 20 10 15 20
Escherichia coli 19.5 29.8 30.5 32.5 32.8 34.2 34.5 36.5 38.5 25.0 28.2 30.3 32.3 35.2 36.5
Serratiamarcescens 27.4 27.5 29.5 30.6 31.5 32.6 29.5 30.5 33.3 18.0 25.8 20.5 12.2 27.3 29.5
Bacillus subtilis 18.2 21.5 22.5 26.5 26.5 28.7 30.5 32.5 35.2 19.0 28.5 20.5 20.3 21.6 22.0
Proteus vulgaris 22.50 28.8 29.5 23.7 24.5 26.5 25.5 29.5 30.2 23.5 26.5 29.0 23.5 26.5 29.5
Salmonella paratyphi A 21.5 22.5 25.5 29.8 30.5 33.5 36.5 38.5 40.2 27.2 29.5 32.5 26.5 27.5 30.5
Salmonella paratyphi B 29.5 29.5 31.6 28.5 29.5 32.6 35.5 36.5 38.2 23.5 25.2 29.5 24.5 26.5 28.5
Klebsiellapneumoniae 26.6 27.5 28.4 27.8 28.5 30.5 34.5 35.5 36.2 21.5 24.5 27.6 22.5 24.5 28.5
Staphylococcus aureus 20.5 20.5 22.6 27.5 27.5 29.4 31.6 33.5 35.5 22.3 23.2 26.4 24.5 25.5 30.3
Pseudomonas aeuroginosa 29.5 30.2 32.5 33.5 34.5 35.5 32.3 35.2 37.5 24.5 26.2 30.8 26.6 30.5 31.5
Clostridium sp. 22.5 24.5 25.5 26.5 28.5 29.5 30.3 31.0 35.6 23.2 25.5 26.0 25.5 27.5 29.5
* Average of three replications ** Standard culture obtained from MTCC for comparison purpose.
106
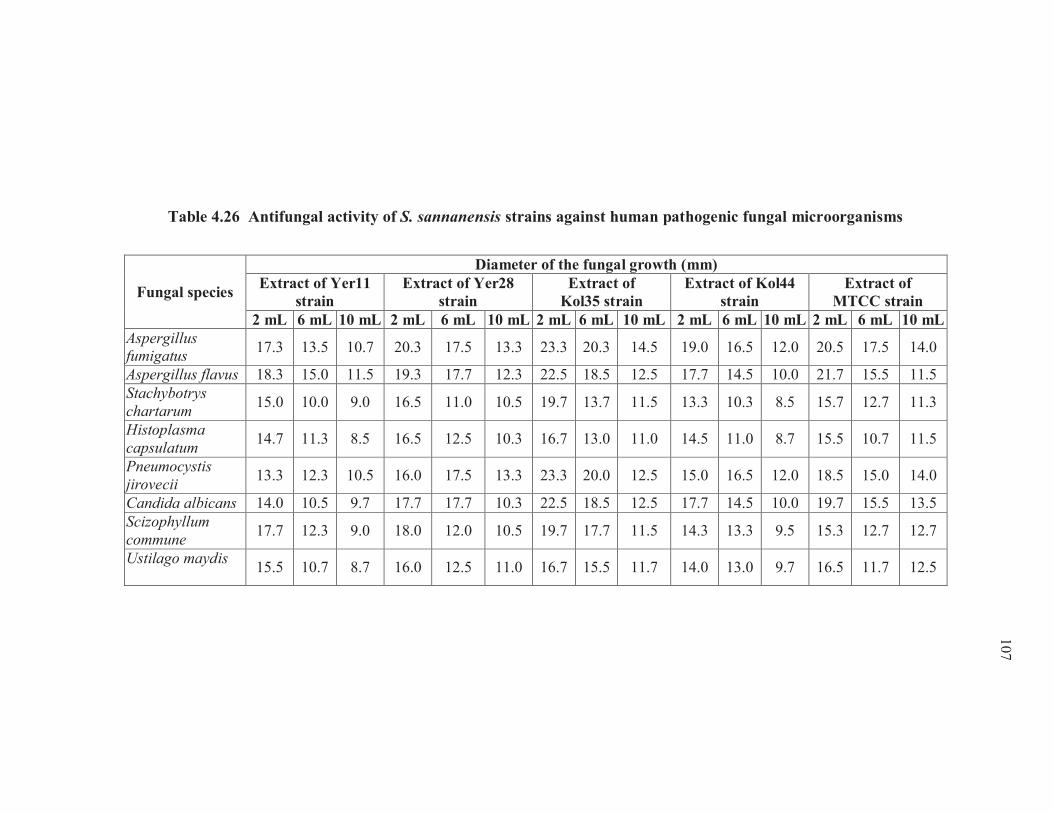
4.4.4 Effect of bioactive secondary metabolites of S. sannanensis
strains against human fungal pathogens
The crude extract containing antifungal compounds extracted from
S. sannanensis strains were tested to check the antifungal activity against
human pathogenic fungal microorganisms such as Aspergillus fumigates,
Aspergillus flavus, Stachybotrys chartarum, Histoplasma capsulatum,
Pneumocystis jirovecii, Candida albicans, Scizophyllum commune and
Ustilago maydis. Different concentrations such as 2 mL, 6 mL and 10 mL of
the extract were used to record the minimum inhibitory concentration in terms
of zone of inhibition. The results indicated that different concentrations of the
crude extract showed varying levels of minimum inhibitory concentration. In
all the cases, it’s very interesting to note that the increased in concentration of
the extract reduced the growth of the fungal pathogens (Table 4.26).
In addition to that Kol35 and Yer28 strains were observed to yield a
responsive inhibitory level when compared to Kol44 and Yer11 strains. The
maximum inhibitory concentration was found to be 23.3 mm and the
minimum was 14.0 mm using 2 mL of crude extract (Table 4.26). In the case
of 6 mL of antifungal extract concentration, the maximum and minimum
MIC values were registered as 20mm and 10mm; respectively followed by
14mm and 8mm of MIC values in 10 mL of the antifungal extract
concentration. In all the cases, MTCC strain was observed to possess a very
good antifungal activity as that of Kol35 strain.
Of all the five strains tested, Kol35 strain was found to exhibit a
reasonable antifungal activity followed by Yer28 strain. Among the human
pathogenic fungal microorganisms such as Aspergillus fumigatus Aspergillus
flavus Stachybotrys chartarum, Histoplasma capsulatum, Pneumocystis
jirovecii, Candida albicans, Scizophyllum commune and Ustilago maydis
10
7
Table 4.26 Antifungal activity of S. sannanensis strains against human pathogenic fungal microorganisms
Fungal species
Diameter of the fungal growth (mm)
Extract of Yer11
strain
Extract of Yer28
strain
Extract of
Kol35 strain
Extract of Kol44
strain
Extract of
MTCC strain
2 mL 6 mL 10 mL 2 mL 6 mL 10 mL 2 mL 6 mL 10 mL 2 mL 6 mL 10 mL 2 mL 6 mL 10 mL
Aspergillusfumigatus
17.3 13.5 10.7 20.3 17.5 13.3 23.3 20.3 14.5 19.0 16.5 12.0 20.5 17.5 14.0
Aspergillus flavus 18.3 15.0 11.5 19.3 17.7 12.3 22.5 18.5 12.5 17.7 14.5 10.0 21.7 15.5 11.5
Stachybotrys
chartarum15.0 10.0 9.0 16.5 11.0 10.5 19.7 13.7 11.5 13.3 10.3 8.5 15.7 12.7 11.3
Histoplasma
capsulatum14.7 11.3 8.5 16.5 12.5 10.3 16.7 13.0 11.0 14.5 11.0 8.7 15.5 10.7 11.5
Pneumocystis
jirovecii13.3 12.3 10.5 16.0 17.5 13.3 23.3 20.0 12.5 15.0 16.5 12.0 18.5 15.0 14.0
Candida albicans 14.0 10.5 9.7 17.7 17.7 10.3 22.5 18.5 12.5 17.7 14.5 10.0 19.7 15.5 13.5
Scizophyllum
commune17.7 12.3 9.0 18.0 12.0 10.5 19.7 17.7 11.5 14.3 13.3 9.5 15.3 12.7 12.7
Ustilago maydis15.5 10.7 8.7 16.0 12.5 11.0 16.7 15.5 11.7 14.0 13.0 9.7 16.5 11.7 12.5
108
tested, Aspergillus fumigates and Histoplasma capsulatum were registered the
highest antifungal activity at 10 mL concentration followed by 6 mL
concentration.
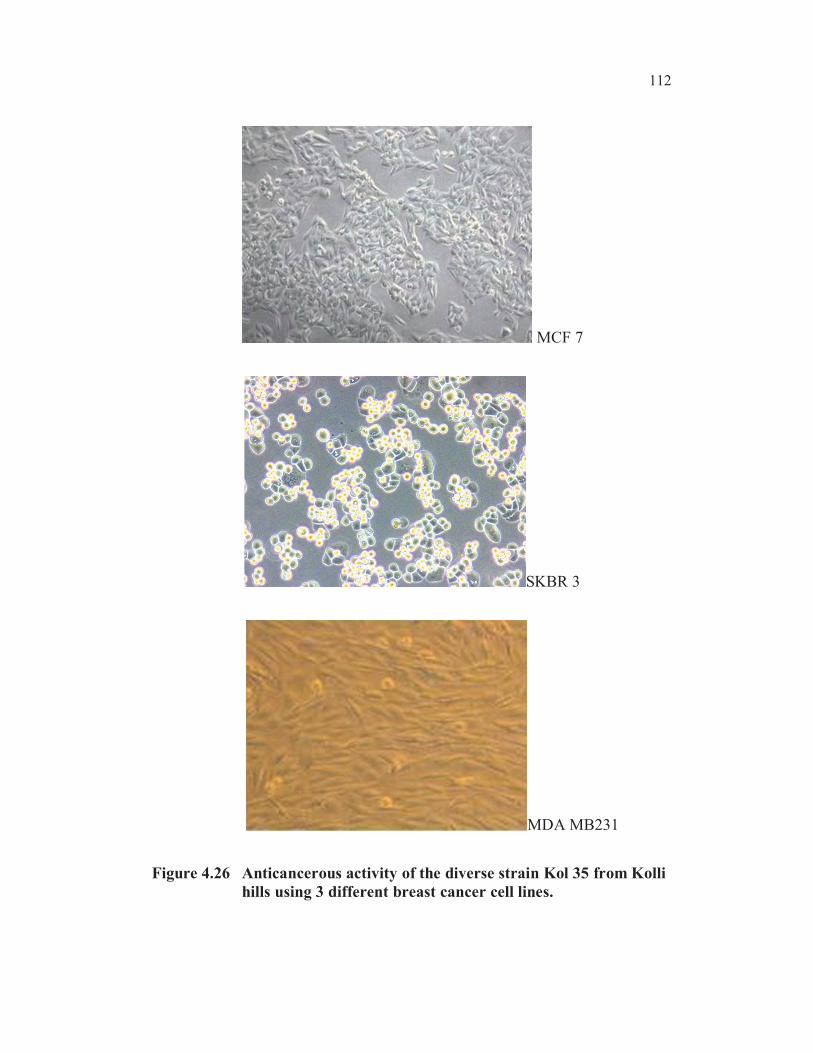
4.5 ANTICANCEROUS ACTIVITY OF BIOACTIVE
SECONDARY METABOLITES OF STREPTOMYCES
SANNANENSIS STRAINS
The crude extracts obtained from S. sannanensis strains such as
Yer11, Yer28, Kol35, Kol44 and MTCC were treated with human breast cancer
cell lines viz., SKBR3, MCF7 and MDA-MB231. The growth inhibition
percentage of all the three cell lines by the crude extract was shown in the
Figures 4.20 – 4.22. The results clearly indicated that inhibition of cell growth
of SKBR3 cell line by the bioactive metabolites from Kol35 and Yer28 strains
were found to be comparatively higher than Yer11 and Kol44 strains. It
revealed that the bioactive compounds obtained from Kol35 and Yer28 strains
was observed to be more potent in inhibiting SKBR3 cell growth when
compared to other bioactive metabolites obtained from Yer11 and Kol44
strains. However, bioactive metabolites extracted from Kol35 strain gave
average results in inhibiting the cell growth when compared with standard
Nolvadex drug.
Application of increased concentration of the crude extract had
significantly increased the percentage of cell growth inhibition of SKBR3 cell
line. The secondary metabolite concentration at 20 µL obtained from Kol35
strain showed 68% of growth inhibition and Yer28 strain showed 64% growth
inhibition (Figure 4.23). Similarly, the inhibition of cell growth at the lowest
concentration of 5 µL crude extract from Kol35 and Yer28 strains registered
only 29% inhibition, whereas, Yer11 and Kol44 strains showed the minimum
inhibition of 12% of growth. The activity of the standard MTCC strain showed
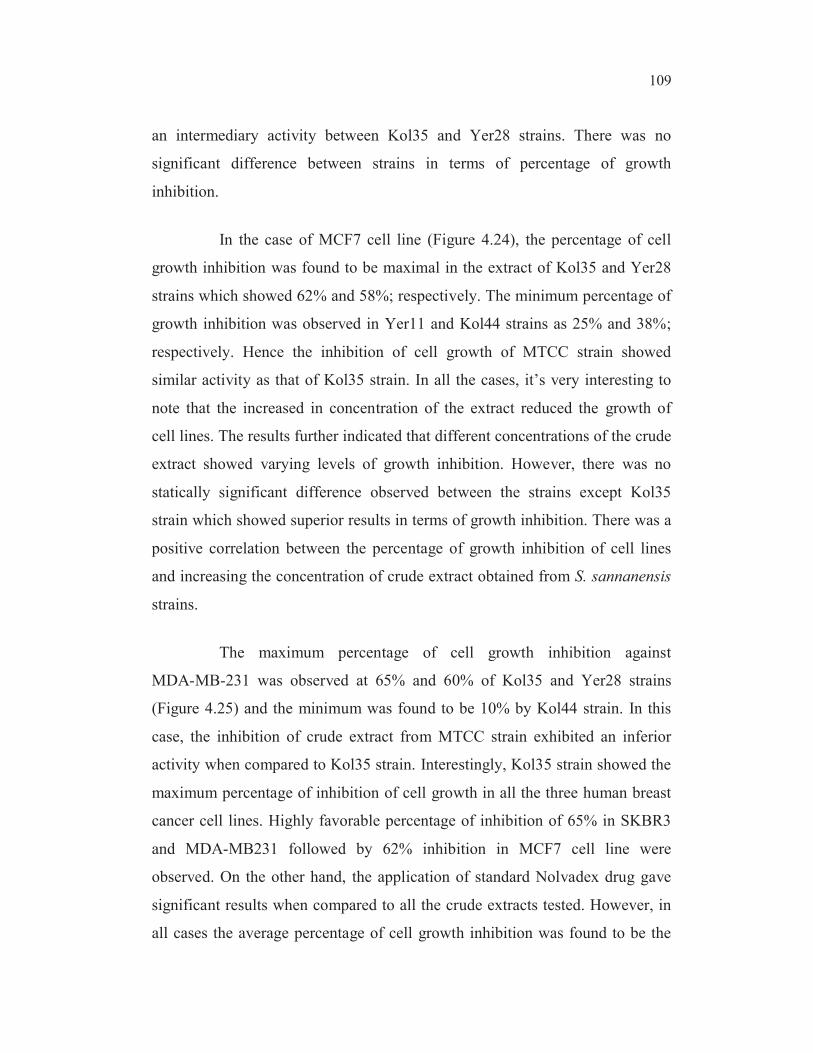
109
an intermediary activity between Kol35 and Yer28 strains. There was no
significant difference between strains in terms of percentage of growth
inhibition.
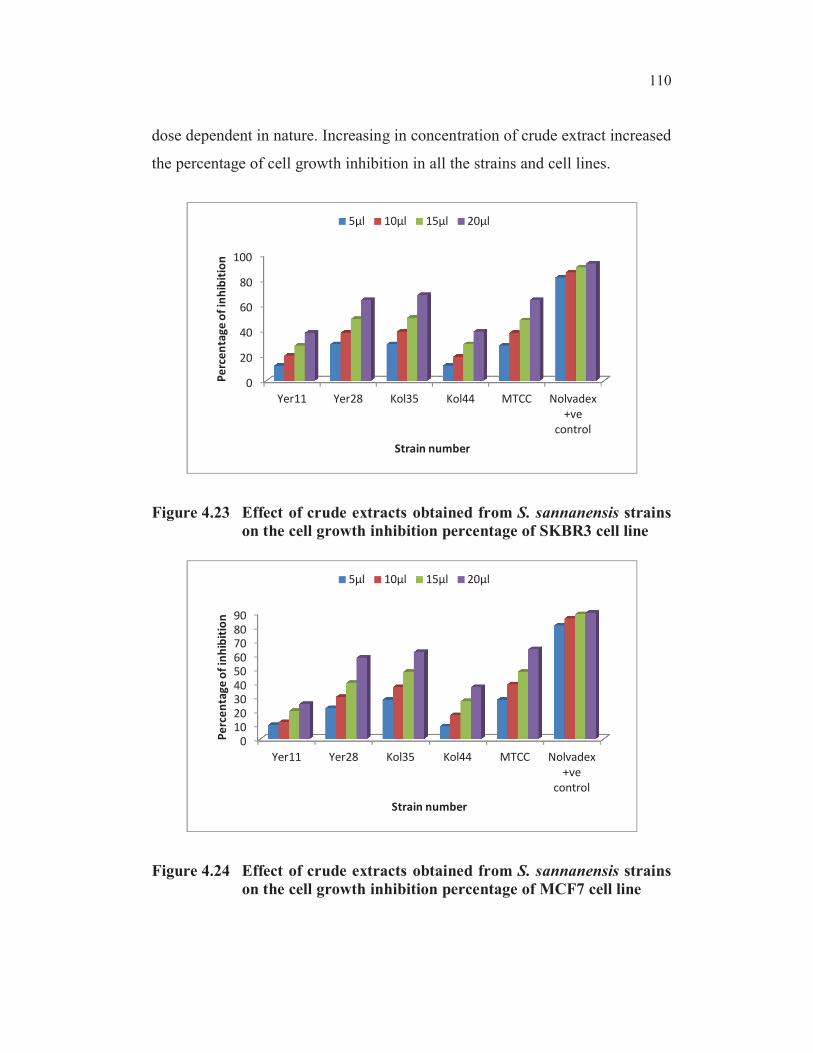
In the case of MCF7 cell line (Figure 4.24), the percentage of cell
growth inhibition was found to be maximal in the extract of Kol35 and Yer28
strains which showed 62% and 58%; respectively. The minimum percentage of
growth inhibition was observed in Yer11 and Kol44 strains as 25% and 38%;
respectively. Hence the inhibition of cell growth of MTCC strain showed
similar activity as that of Kol35 strain. In all the cases, it’s very interesting to
note that the increased in concentration of the extract reduced the growth of
cell lines. The results further indicated that different concentrations of the crude
extract showed varying levels of growth inhibition. However, there was no
statically significant difference observed between the strains except Kol35
strain which showed superior results in terms of growth inhibition. There was a
positive correlation between the percentage of growth inhibition of cell lines
and increasing the concentration of crude extract obtained from S. sannanensis
strains.
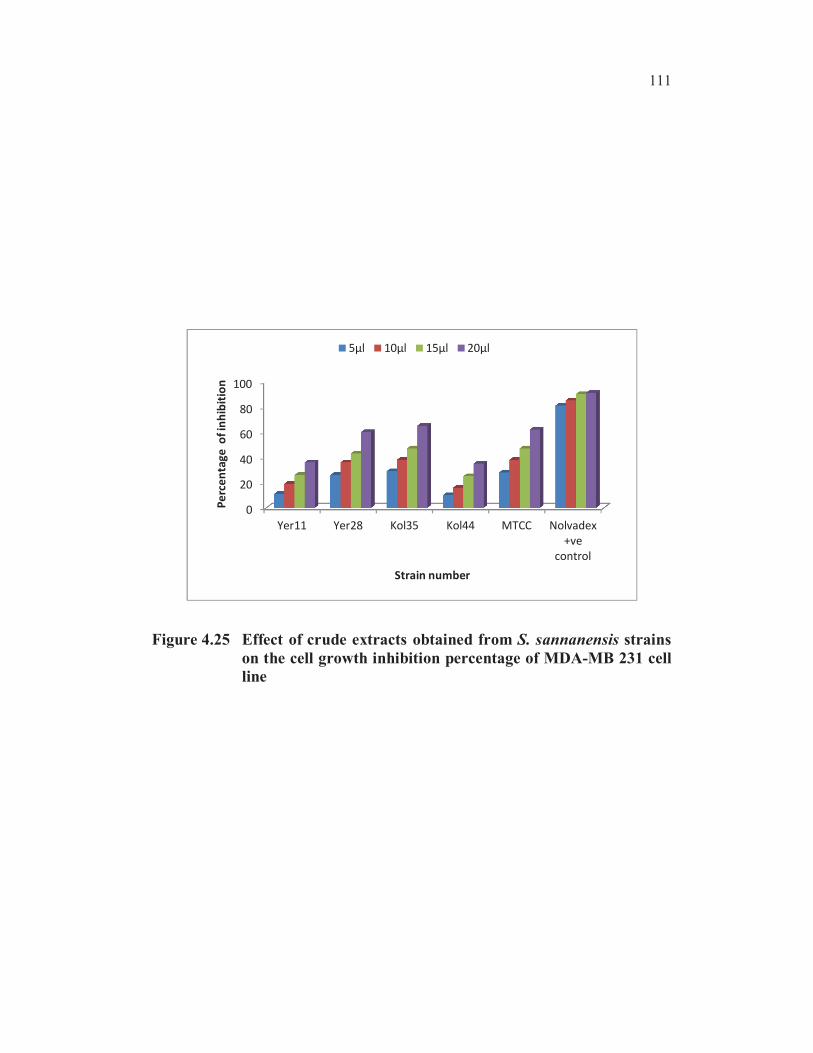
The maximum percentage of cell growth inhibition against
MDA-MB-231 was observed at 65% and 60% of Kol35 and Yer28 strains
(Figure 4.25) and the minimum was found to be 10% by Kol44 strain. In this
case, the inhibition of crude extract from MTCC strain exhibited an inferior
activity when compared to Kol35 strain. Interestingly, Kol35 strain showed the
maximum percentage of inhibition of cell growth in all the three human breast
cancer cell lines. Highly favorable percentage of inhibition of 65% in SKBR3
and MDA-MB231 followed by 62% inhibition in MCF7 cell line were
observed. On the other hand, the application of standard Nolvadex drug gave
significant results when compared to all the crude extracts tested. However, in
all cases the average percentage of cell growth inhibition was found to be the
110
dose dependent in nature. Increasing in concentration of crude extract increased
the percentage of cell growth inhibition in all the strains and cell lines.
Figure 4.23 Effect of crude extracts obtained from S. sannanensis strains
on the cell growth inhibition percentage of SKBR3 cell line
Figure 4.24 Effect of crude extracts obtained from S. sannanensis strains
on the cell growth inhibition percentage of MCF7 cell line
0
20
40
60
80
100
Yer11 Yer28 Kol35 Kol44 MTCC Nolvadex
+ve
control
Pe
rce
nta
ge
of
inh
ibit
ion
Strain number
5µl 10µl 15µl 20µl
0
10
20
30
40
50
60
70
80
90
Yer11 Yer28 Kol35 Kol44 MTCC Nolvadex
+ve
control
Pe
rce
nta
ge
of
inh
ibit
ion
Strain number
5µl 10µl 15µl 20µl
111
Figure 4.25 Effect of crude extracts obtained from S. sannanensis strains
on the cell growth inhibition percentage of MDA-MB 231 cell
line
0
20
40
60
80
100
Yer11 Yer28 Kol35 Kol44 MTCC Nolvadex
+ve
control
Pe
rce
nta
ge
of
inh
ibit
ion
Strain number
5µl 10µl 15µl 20µl
112
MCF 7
SKBR 3
MDA MB231
Figure 4.26 Anticancerous activity of the diverse strain Kol 35 from Kolli
hills using 3 different breast cancer cell lines.
113
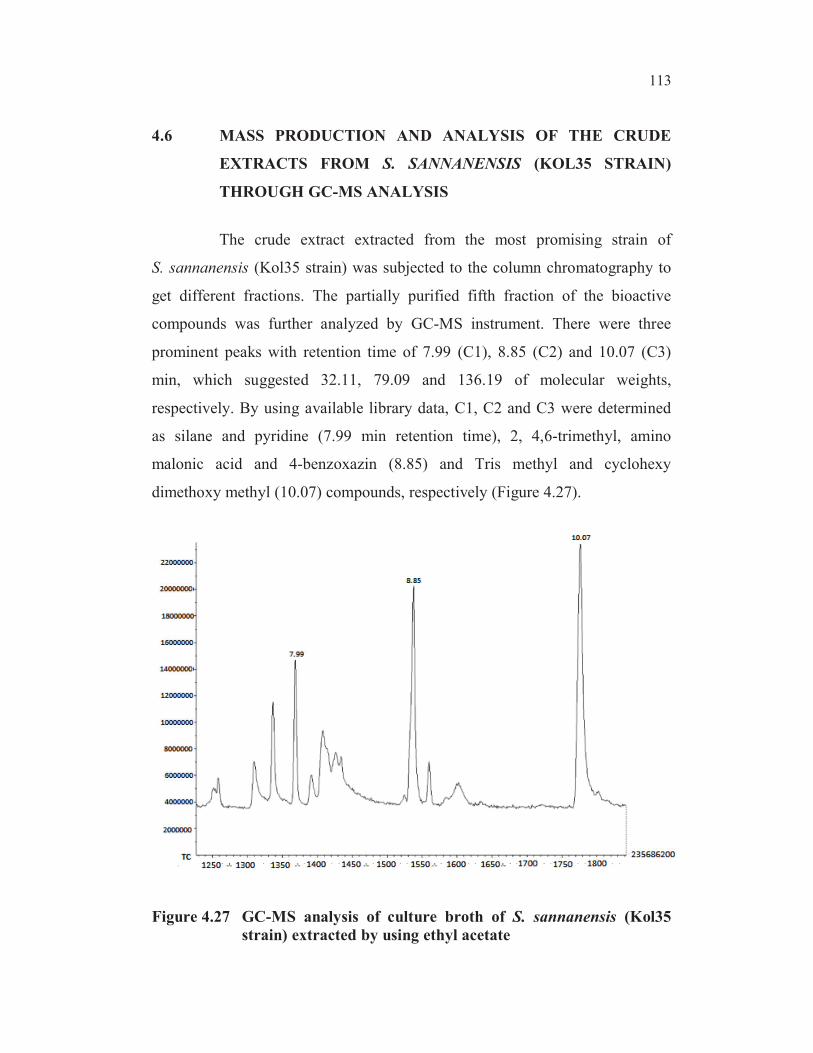
4.6 MASS PRODUCTION AND ANALYSIS OF THE CRUDE
EXTRACTS FROM S. SANNANENSIS (KOL35 STRAIN)
THROUGH GC-MS ANALYSIS
The crude extract extracted from the most promising strain of
S. sannanensis (Kol35 strain) was subjected to the column chromatography to
get different fractions. The partially purified fifth fraction of the bioactive
compounds was further analyzed by GC-MS instrument. There were three
prominent peaks with retention time of 7.99 (C1), 8.85 (C2) and 10.07 (C3)
min, which suggested 32.11, 79.09 and 136.19 of molecular weights,
respectively. By using available library data, C1, C2 and C3 were determined
as silane and pyridine (7.99 min retention time), 2, 4,6-trimethyl, amino
malonic acid and 4-benzoxazin (8.85) and Tris methyl and cyclohexy
dimethoxy methyl (10.07) compounds, respectively (Figure 4.27).
Figure 4.27 GC-MS analysis of culture broth of S. sannanensis (Kol35
strain) extracted by using ethyl acetate
114
4.7 BIOSYNTHESIS OF NANOPARTICLES USING
STREPTOMYCES SANNANENSIS ISOLATED FROM
YERCAUD AND KOLLI HILLS FOR BIOMEDICAL
APPLICATIONS
Biosynthesis of gold, silver and copper nanoparticles was performed
using the efficient strain of S. sannanensis. Kol35 strain was screened as an
efficient one based on the antagonistic activity of the crude extract studied
through antifungal, antibacterial and anticancerous bioassays. Kol35 strain was
treated with chloroauric acid (HAuCl4-), silver nitrate (AgNO3) and copper
sulphate (Cu (I) SO4.5H2O) as substrates for the biosynthesis of gold, silver and
copper nanoparticles; respectively.
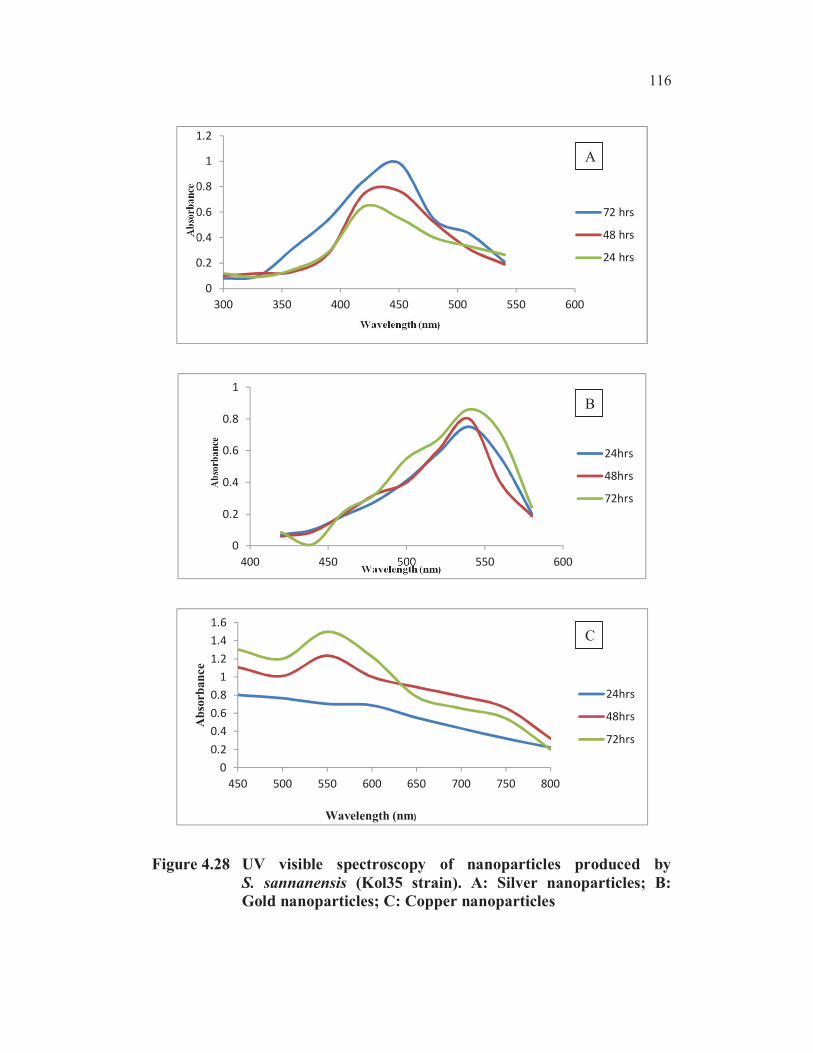
4.7.1 UV-Visible Light Spectroscopy Observation
The characterization of the silver, gold and copper nanoparticles
synthesized was initially performed using UV-Visible light spectroscopy. The
absorption was studied at various time intervals like 24, 48 and 72 hrs. The
spectral analysis of different nanoparticles synthesized was presented in the
Figure 4.24. The peak was observed at a wavelength of 410 – 440 nm in case of
AgNO3 treated samples and 520 – 550 nm in the case of HAuCl4- treated
samples. With respect to copper sulphate treated S. sannanensis the UV
absorption peak was observed in 530 – 580 nm. Moreover, the reaction
reached stability after 72 hrs of incubation which was shown in the UV-VIS
spectra of the nanoparticle produced. Peak values were observed
correspondingly for 24, 48 and 72 hours were at 420, 430 and 450 nm;
respectively in the case of silver nanoparticles. The biotransformation was
examined by visual inspection of the biomass as well as a measurement of the
UV visible spectra from the biomass. The colour of the reaction mixture and
colours of the harvested biomass of S. sannanensis Kol35 strain using AgNO3,
115
HAuCl4- and copper sulphate solutions was tabulated (Table 4.28) after the
incubation at 24hrs, 48hrs and 72hrs.
The synthesis of silver nanoparticles was confirmed by monitoring
the formation of brownish yellow colour. UV-Vis spectroscopy is an important
technique to determine the formation and stability of metal nanoparticles in
aqueous solution. It is well known that silver nanoparticles exhibit different
colours and size due to excitation of surface plasmon resonance (SPR). The
colour change from the appearance of pink to purple colour indicates the
formation of gold nanoparticle. The surface plasmon resonance (SPR) for the
gold nanoparticle was clearly visible as a peak in the range of 540 nm. The
maximum absorption range of the copper nanoparticles was also recorded at
560nm and a sharp peak was observed only after 48 hrs. The colour change
from pale yellow to brownish colour indicates the presence of copper
nanoparticles.
Table 4.27 Colour changes of the biomass and reaction solution of
nanoparticle biosynthesis by S. sannanensis (Kol35 strain)
S.NoType of the
Nanoparticle
At zero
hours
After
24hrs
After
48hrs
After
72hrs
Colour
absorbance
(nm)
1. Silver White Yellow Brownishyellow
Brownishyellow
420
2. Gold White Pink Purple Purple 540
3. Copper White Pale
yellow
Brown Brown 560
116
Figure 4.28 UV visible spectroscopy of nanoparticles produced by
S. sannanensis (Kol35 strain). A: Silver nanoparticles; B:
Gold nanoparticles; C: Copper nanoparticles
0
0.2
0.4
0.6
0.8
1
1.2
300 350 400 450 500 550 600
72 hrs
48 hrs
24 hrs
0
0.2
0.4
0.6
0.8
1
400 450 500 550 600
24hrs
48hrs
72hrs
0
0.2
0.4
0.6
0.8
1
1.2
1.4
1.6
450 500 550 600 650 700 750 800
Ab
sorb
an
ce
Wavelength (nm)
24hrs
48hrs
72hrs
A
B
C
117
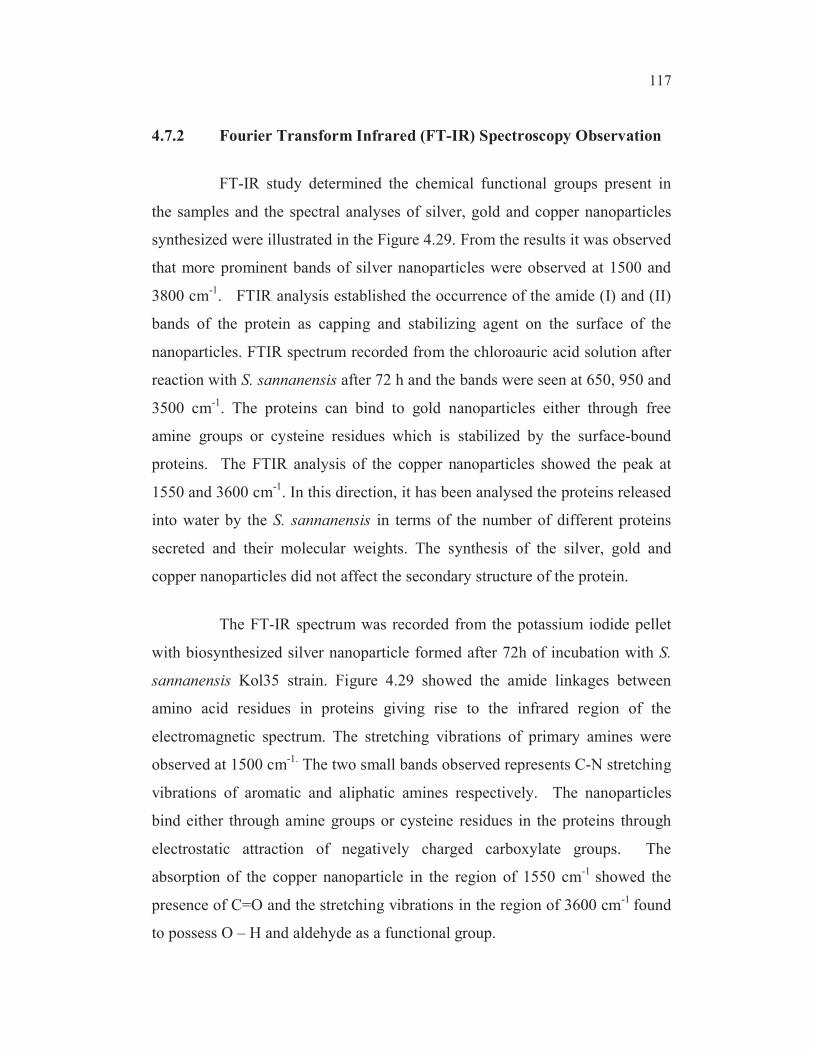
4.7.2 Fourier Transform Infrared (FT-IR) Spectroscopy Observation
FT-IR study determined the chemical functional groups present in
the samples and the spectral analyses of silver, gold and copper nanoparticles
synthesized were illustrated in the Figure 4.29. From the results it was observed
that more prominent bands of silver nanoparticles were observed at 1500 and
3800 cm-1
. FTIR analysis established the occurrence of the amide (I) and (II)
bands of the protein as capping and stabilizing agent on the surface of the
nanoparticles. FTIR spectrum recorded from the chloroauric acid solution after
reaction with S. sannanensis after 72 h and the bands were seen at 650, 950 and
3500 cm-1
. The proteins can bind to gold nanoparticles either through free
amine groups or cysteine residues which is stabilized by the surface-bound
proteins. The FTIR analysis of the copper nanoparticles showed the peak at
1550 and 3600 cm-1
. In this direction, it has been analysed the proteins released
into water by the S. sannanensis in terms of the number of different proteins
secreted and their molecular weights. The synthesis of the silver, gold and
copper nanoparticles did not affect the secondary structure of the protein.
The FT-IR spectrum was recorded from the potassium iodide pellet
with biosynthesized silver nanoparticle formed after 72h of incubation with S.
sannanensis Kol35 strain. Figure 4.29 showed the amide linkages between
amino acid residues in proteins giving rise to the infrared region of the
electromagnetic spectrum. The stretching vibrations of primary amines were
observed at 1500 cm-1.
The two small bands observed represents C-N stretching
vibrations of aromatic and aliphatic amines respectively. The nanoparticles
bind either through amine groups or cysteine residues in the proteins through
electrostatic attraction of negatively charged carboxylate groups. The
absorption of the copper nanoparticle in the region of 1550 cm-1
showed the
presence of C=O and the stretching vibrations in the region of 3600 cm-1
found
to possess O – H and aldehyde as a functional group.
118
Figure 4.29 FTIR analysis of nanoparticles produced by S. sannanensis
(Kol35 strain)A: Silver nanoparticles; B: Gold nanoparticles;
C: Copper nanoparticles
A
C
B
119
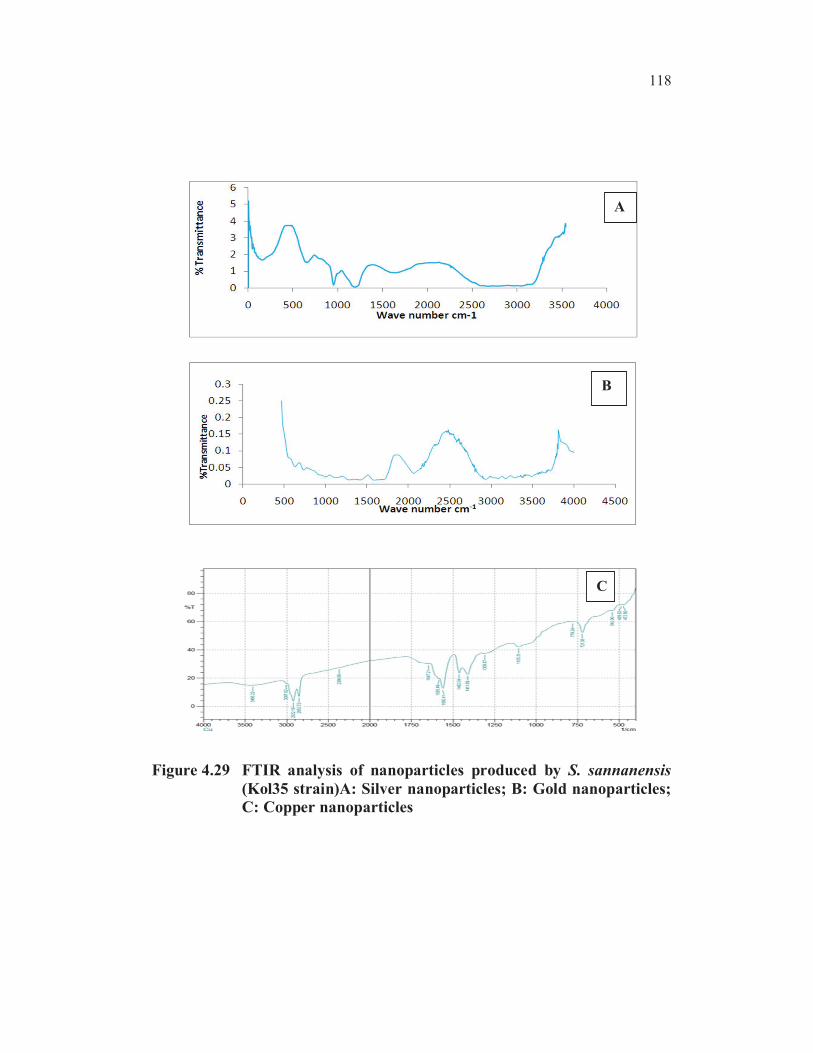
4.7.3 Transmission Electron Microscope of Silver, Gold and Copper
Nanoparticles of the S. sannanensis (Kol35 strain)
The transmission electron microscopy (TEM) image of the silver
nanoparticle synthesized was represented in Figure 4.30 and indicated well
dispersed particles which were found to be spherical. The average size of these
particles was approximately 30 nm. The approximate size of the gold
nanoparticle was observed to be 18 – 24nm. The gold nanoparticles were
deposited on the mycelial cell wall of S. sannanensis. The shape and size of the
colloidal copper particles were determined by transmission electron
microscopy. A strong aggregation of the copper nanoparticles was observed
which further enhances the electrostatic attraction between the particles. The
size was measured to be 32nm.
Figure 4.30 TEM observations of (A)Silver, (B) Gold and (C) Copper
nanoparticles produced by S. sannanensis(Kol35 strain).
A
B C
120
4.7.4 Assessment of antibacterial activity of silver, gold and copper
nanoparticles biosynthesized by S. sannanensis (Kol35 Strain)
The antibacterial activity of different nanoparticles biosynthesized S.
sannanensis by such as silver, gold and copper nanoparticles was carried out
based on the observations made in well diffusion method using the different
human bacterial pathogens. The results revealed that among the different
nanoparticles tested, silver nanoparticles was found to be the best in terms of
inhibition of growth of human pathogens followed by gold and copper
nanoparticles (Table 4.28). It was observed that Kol35 strain was found to
possess good antibacterial activity in silver nanoparticles against Salmonella
paratyphi A (40.3 mm), Salmonella paratyphi B (38.5 mm), Klebsiella
pneumonia (36.0 mm), Escherichia coli (34.5 mm), Pseudomonas aeuroginosa
(28.7 mm), Serratia marcescens (32.5 mm) and Staphylococcus aureus
(34.7 mm).
Silver nanoparticle has been well known for its antibacterial
properties. Hence it was noteworthy to determine the antibacterial activity of
silver nanoparticles against the above mentioned pathogenic organisms. The
antibacterial activity of gold nanoparticles showed a reduced level of inhibition
compared to that of the silver and copper nanoparticles. The diameter of the
zone of inhibition of gold nanoparticles against S. paratyphi A (38.0 mm),
S. paratyphi B (35.5 mm), K. pneumoniae (34.0 mm), E. coli (30.5 mm),
P. aeuroginosa (27.3 mm), S. marcescens (31.3 mm) and S. aureus (33.3 mm)
were recorded and found to be varied and varying levels. But comparatively the
stability of the gold nanoparticles was observed for a prolonged time compared
with the silver nanoparticles. In the case of the copper nanoparticle of the
extract from Kol35 strain showed the least level of antagonistic property
(Table 4.28).
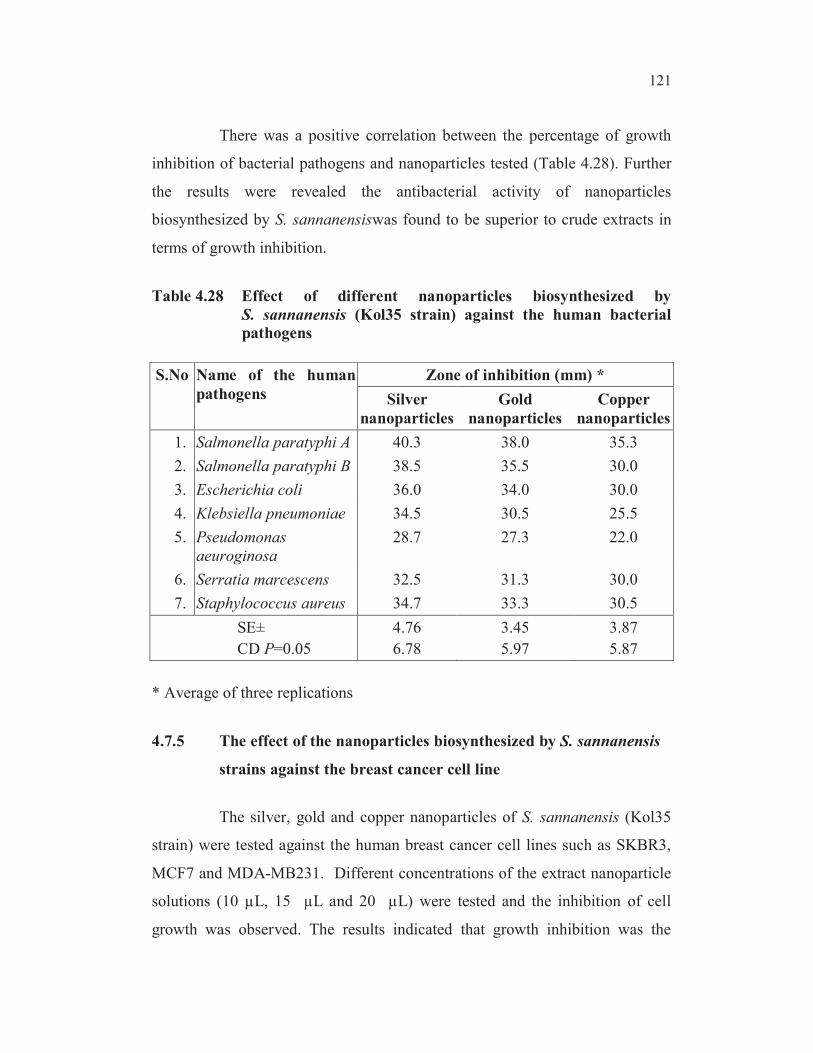
121
There was a positive correlation between the percentage of growth
inhibition of bacterial pathogens and nanoparticles tested (Table 4.28). Further
the results were revealed the antibacterial activity of nanoparticles
biosynthesized by S. sannanensiswas found to be superior to crude extracts in
terms of growth inhibition.
Table 4.28 Effect of different nanoparticles biosynthesized by
S. sannanensis (Kol35 strain) against the human bacterial
pathogens
S.No Name of the human
pathogens
Zone of inhibition (mm) *
Silver
nanoparticles
Gold
nanoparticles
Copper
nanoparticles
1. Salmonella paratyphi A 40.3 38.0 35.3
2. Salmonella paratyphi B 38.5 35.5 30.0
3. Escherichia coli 36.0 34.0 30.0
4. Klebsiella pneumoniae 34.5 30.5 25.5
5. Pseudomonas
aeuroginosa
28.7 27.3 22.0
6. Serratia marcescens 32.5 31.3 30.0
7. Staphylococcus aureus 34.7 33.3 30.5
SE±
CD P=0.05
4.76
6.78
3.45
5.97
3.87
5.87
* Average of three replications
4.7.5 The effect of the nanoparticles biosynthesized by S. sannanensis
strains against the breast cancer cell line
The silver, gold and copper nanoparticles of S. sannanensis (Kol35
strain) were tested against the human breast cancer cell lines such as SKBR3,
MCF7 and MDA-MB231. Different concentrations of the extract nanoparticle
solutions (10 µL, 15 µL and 20 µL) were tested and the inhibition of cell
growth was observed. The results indicated that growth inhibition was the
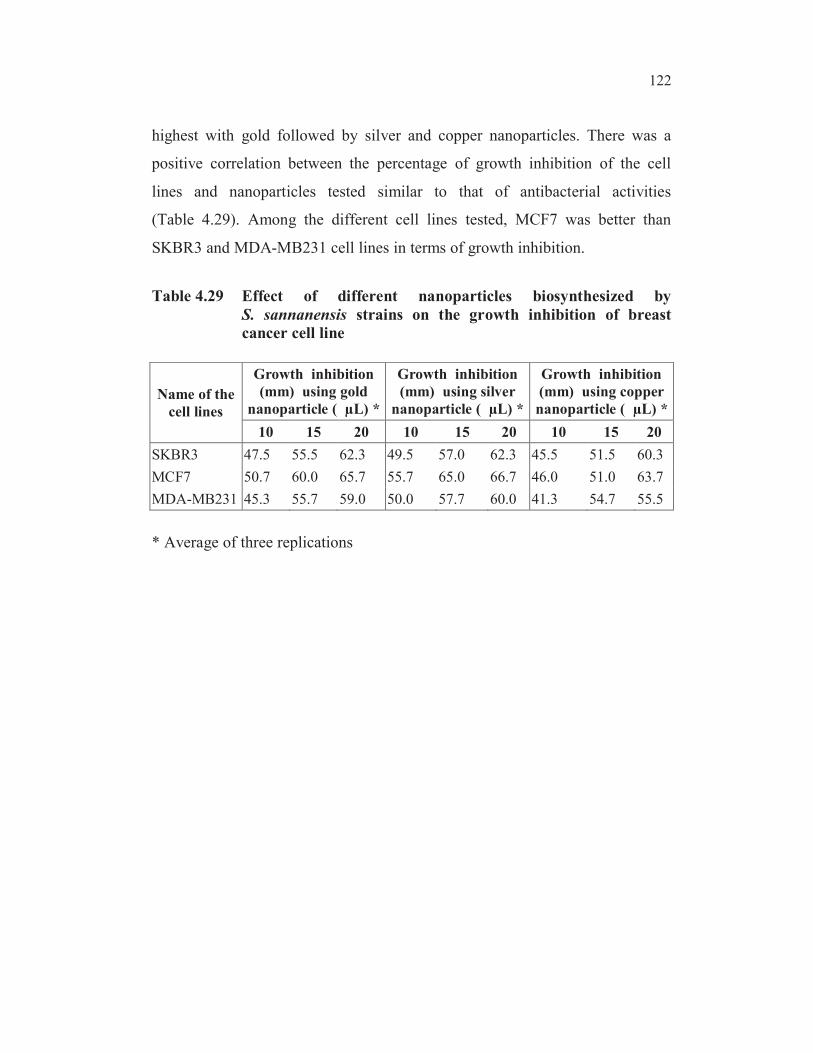
122
highest with gold followed by silver and copper nanoparticles. There was a
positive correlation between the percentage of growth inhibition of the cell
lines and nanoparticles tested similar to that of antibacterial activities
(Table 4.29). Among the different cell lines tested, MCF7 was better than
SKBR3 and MDA-MB231 cell lines in terms of growth inhibition.
Table 4.29 Effect of different nanoparticles biosynthesized by
S. sannanensis strains on the growth inhibition of breast
cancer cell line
Name of the
cell lines
Growth inhibition
(mm) using gold
nanoparticle ( µL) *
Growth inhibition
(mm) using silver
nanoparticle ( µL) *
Growth inhibition
(mm) using copper
nanoparticle ( µL) *
10 15 20 10 15 20 10 15 20
SKBR3 47.5 55.5 62.3 49.5 57.0 62.3 45.5 51.5 60.3
MCF7 50.7 60.0 65.7 55.7 65.0 66.7 46.0 51.0 63.7
MDA-MB231 45.3 55.7 59.0 50.0 57.7 60.0 41.3 54.7 55.5
* Average of three replications