04 may 2016 nigerian equity market - stanbic ibtc holdings market... · 2016-05-05 · (cap) plc...
TRANSCRIPT

IMPORTANT DISCLOSURES AND ANALYST CERTIFICATIONS ARE IN THE DISCLOSURE APPENDIX. U.S. Disclosure: SBG Securities (Pty) Limite d
does and seeks to do business with companies covered in its research reports. As a result, investors should be aware that the Firm
may have a conflict of interest that could affect the objectivity of this report. Investors should consider this report as on ly a
single factor in making their investment decision. Customers in the United States can receive independent, third party research
on the company or companies covered in this report, at no cost to them, where such research is available. Customers can call +27
(11) 415 4272 or email [email protected] to request a copy of this research.
Monthly Market Wrap
www.standardbank.com/researc
h
Research Analyst
Gbolahan Taiwo
+234 1 422 8290
04 May 2016
Nigerian Equity Market
Fairly Quiet activities amid Earnings releases
ASI partly reversed gains of the previous month: Nigeria’s All
Share Index dipped slightly by 0.96% in the month of April 2016 amid very
thin trading (in volume terms) for most of the period. Investor apathy
towards Nigerian Equities remain very apparent as major macro-economic
fundamentals are still discouraging, not to mention the continued delay of
the passage of the 2016 budget.
Oil and gas index plunges further; (-10.04%) month-on-month:
A couple of oil and gas stocks were considerably sold-off during the month.
Notably, were Forte Oil Plc (-26.90%) and Mobil Nigeria Plc (-8.76%).
However, Seplat Plc was quite resilient in that space during the period as
its share price rose by 13.33%. Oando Plc also enjoy some patronage; up
9.09% MoM. (See table 1)
Renewed interest witnessed in some banking names as the
NSE banking index surged 9.20% MoM: A number of banks still
managed to post fairly decent results despite the raving economic
headwinds prevalent in the country. Zenith Bank (+18.14%) and Guaranty
(+17.27%) led the gainers chart in that space amid renewed interest.
FBNH, as expected posted significantly weaker earnings after the bank
took N119 billion in impairments. The stock however remained resilient; up
14.29% m/m. (See table 1). We believe a part of the expected (weaker)
earnings might have been already priced in.
Consumer goods index down slightly in April amid mixed
Earnings results from Consumer names: Tigerbrands Plc
(+30.60%), enjoyed increased patronage from investors during the month
even as the company confirmed the change of her name back to Dangote
Flour Mills Plc following the re-acquisition by Aliku Dangote earlier in the
year. Also, the company’s H1:16 results were quite impressive with
115.06% surge in net earnings during the period. Fairly disappointing
results from Guinness Plc ensured its stock closed down 12.65% during
the month.
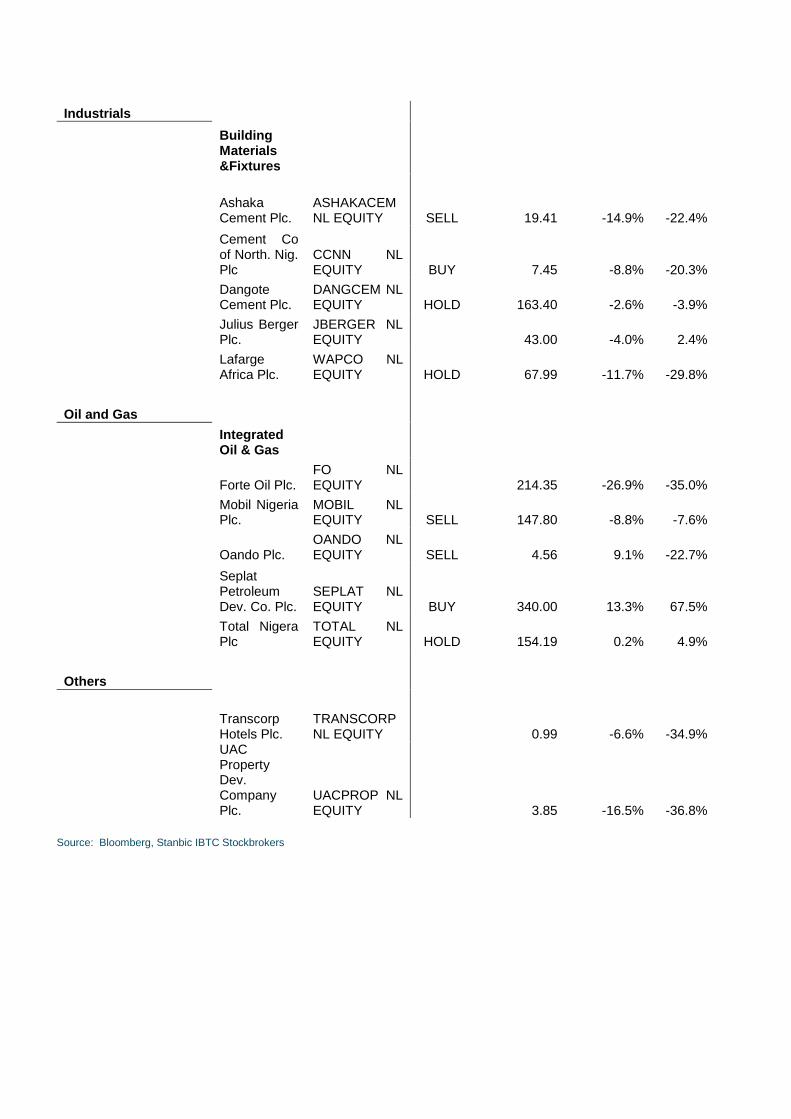
No joy in the Industrial space; index down 5.97% in April 2016:
Ashaka cement (-14.87%), Lafarge Africa (-11.70%), CCNN(-8.8%)
amongst others, drove the losses recorded in that segment.
Valuations: We reiterate our preference for quality names across all
sectors. We prefer Zenith bank and Guaranty Trust bank in banking space
while Dangcem and Lafarge are preferred ahead of others in the Industrial
space.
Outlook for May 2016: We do not see a major shift in the current
market trend going into May 2016, so long as major macro-economic
fundamentals remain disappointing. We expect the first quarter GDP
growth data to be released this month and recent indications show those
figures might come in lower than the previous. Though Nigerian equities
seem rather attractive at current levels, continued investor apathy towards
these stocks is a pointer to the fact that the overall macro-economic
fundamentals weigh much stronger than just company fundamentals at the
moment. We could see the ASI inch up slightly, though trading volumes
might still be largely depressed.
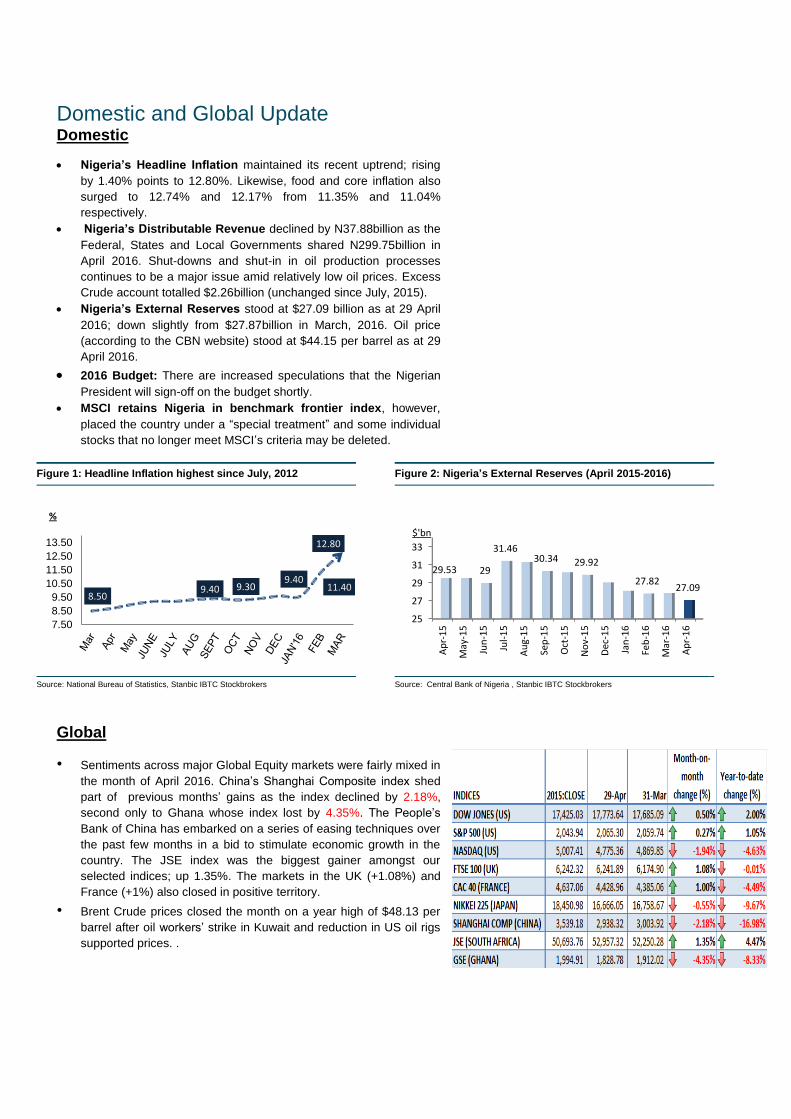
Domestic and Global Update Domestic
Nigeria’s Headline Inflation maintained its recent uptrend; rising
by 1.40% points to 12.80%. Likewise, food and core inflation also
surged to 12.74% and 12.17% from 11.35% and 11.04%
respectively.
Nigeria’s Distributable Revenue declined by N37.88billion as the
Federal, States and Local Governments shared N299.75billion in
April 2016. Shut-downs and shut-in in oil production processes
continues to be a major issue amid relatively low oil prices. Excess
Crude account totalled $2.26billion (unchanged since July, 2015).
Nigeria’s External Reserves stood at $27.09 billion as at 29 April
2016; down slightly from $27.87billion in March, 2016. Oil price
(according to the CBN website) stood at $44.15 per barrel as at 29
April 2016.
2016 Budget: There are increased speculations that the Nigerian
President will sign-off on the budget shortly. MSCI retains Nigeria in benchmark frontier index, however,
placed the country under a “special treatment” and some individual
stocks that no longer meet MSCI’s criteria may be deleted.
Global
• Sentiments across major Global Equity markets were fairly mixed in
the month of April 2016. China’s Shanghai Composite index shed
part of previous months’ gains as the index declined by 2.18%,
second only to Ghana whose index lost by 4.35%. The People’s
Bank of China has embarked on a series of easing techniques over
the past few months in a bid to stimulate economic growth in the
country. The JSE index was the biggest gainer amongst our
selected indices; up 1.35%. The markets in the UK (+1.08%) and
France (+1%) also closed in positive territory.
• Brent Crude prices closed the month on a year high of $48.13 per
barrel after oil workers’ strike in Kuwait and reduction in US oil rigs
supported prices. .
Figure 1: Headline Inflation highest since July, 2012
Source: National Bureau of Statistics, Stanbic IBTC Stockbrokers
Figure 2: Nigeria’s External Reserves (April 2015-2016)
Source: Central Bank of Nigeria , Stanbic IBTC Stockbrokers
8.50 9.40 9.30
9.40 11.40
12.80
7.50
8.50
9.50
10.50
11.50
12.50
13.50
%
25
27
29
31
33
Ap
r-1
5
May
-15
Jun
-15
Jul-
15
Au
g-1
5
Sep
-15
Oct
-15
No
v-1
5
Dec
-15
Jan
-16
Feb
-16
Mar
-16
Ap
r-1
6
29.53 29
31.46 30.34 29.92
27.82 27.09
$'bn

Earnings Update
Q1: 2016 Q1: 2015 % change
N'million N'miillion
Revenue 36,131 27,556 31.12%
Profit before Tax 8,725 3,487 150.22%
Profit After Tax 6,681 2,954 126.17%
Net Assets 44,804 38,007 17.88%
Revenue 7,644 7,456 2.52%
Profit before Tax 273 423 -35.48%
Profit After Tax 188 297 -36.70%
Net Assets 13,374 13,245 0.97%
Revenue 3,326 2,424 37.21%
Profit before Tax 1,635 1,185 37.97%
Profit After Tax 1,596 1,033 54.50%
Net Assets 13,659 12,064 13.22%
Revenue 17,518 17,729 -1.19%
Profit before Tax 1,767 2,296 -23.04%
Profit After Tax 1,317 1,680 -21.61%
Net Assets 75,459 74,142 1.78%
Revenue 1,848 1,808 2.21%
Profit before Tax 620 715 -13.29%
Profit After Tax 422 486 -13.17%
Net Assets 1,942 1,520 27.76%
Revenue 77,555 69,922 10.92%
Profit before Tax 15,008 14,438 3.95%
Profit After Tax 10,455 10,102 3.49%
Net Assets 182,843 172,322 6.11%
Revenue 16782 14911 12.55%
Profit before Tax 1419 865 64.05%
Profit After Tax 1041 590 76.44%
Net Assets 9,045 8,003 13.02%
Gross Earnings 34,356 36,364 -5.52%
Profit before Tax 4,025 4,710 -14.54%
Profit After Tax 3,583 4,003 -10.49%
Net Assets 184,029 178,081 3.34%
Gross Earnings 75,394 79,016 -4.58%
Profit before Tax 30,676 32,653 -6.05%
Profit After Tax 25,614 26,563 -3.57%
Net Assets 433,412 413,562 4.80%
Gross Earnings 114,894 100,385 14.45%
Profit before Tax 22,583 16,517 36.73%
Profit After Tax 19,419 13,668 42.08%
Net Assets 382,481 367,801 3.99%
Gross Earnings 74,134 83,098 -10.79%
Profit before Tax 18,083 18,389 -1.66%
Profit After Tax 16,986 16,956 0.18%
Net Assets 347,337 332,621 4.42%
Gross Earnings 99,435 113,322 -12.25%
Profit before Tax 32,121 33,128 -3.04%
Profit After Tax 26,573 27,680 -4.00%
Net Assets 621,073 526,430 17.98%
Gross Earnings 83,457 95,308 -12.43%
Profit before Tax 22,051 26,944 -18.16%
Profit After Tax 20,724 22,603 -8.31%
Net Assets 575,197 578,800 -0.62%
Gross Earnings 131,375 136,223 -3.56%
Profit before Tax 20,629 30,519 -32.41%
Profit After Tax 16,206 24,479 -33.80%
Net Assets 505,536 502,063 0.69%
Gross Earnings 35,709 40,487 -11.80%
Profit before Tax 6,694 8,367 -20.00%
Profit After Tax 5,760 7,168 -19.64%
Net Assets 220,411 214,609 2.70%
FBN HOLDINGS PLC
DIAMOND BANK
PLC
CHEMICAL &
ALLIED PRODUCTS
(CAP) PLC
UACN PLC
NESTLE NIGERIA
PLC
COMPANY/ RESULTS
UNILEVER NIGERIA
PLC
FIDELITY BANK PLC
ZENITH BANK PLC
GLAXOSMITHKLINE
CONSUMER
NIGERIA PLC
ACCESS BANK PLC
UNITED BANK FOR
AFRICA (UBA) PLC
GUARANTY TRUST
BANK PLC
NIGERIAN
BREWERIES PLC
OKOMU OIL PALM
PLC
ECOBANK (ETI)
GROUP PLC
Gross Earnings 34,362 39,289 -12.54%
Profit before Tax 2,207 5,769 -61.74%
Profit After Tax 1,645 5,278 -68.83%
Net Assets 162,811 162,391 0.26%
Gross Earnings 27,275 27,326 -0.19%
Profit before Tax 4,795 2,383 101.22%
Profit After Tax 4,719 2,307 104.55%
Net Assets 243,009 243,920 -0.37%
Revenue 140,521 114,738 22.47%
Profit before Tax 54,539 70,168 -22.27%
Profit After Tax 52,779 68,620 -23.09%
Net Assets 707,343 644,720 9.71%
Revenue 52,421 74,119 -29.27%
Profit before Tax -2,216 6,089 -136.39%
Profit After Tax -1,873 5,843 -132.06%
Net Assets 178,921 176,152 1.57%
Revenue 35,602 33,062 7.68%
Profit before Tax 1,301 842 54.51%
Profit After Tax 954 783 21.84%
Net Assets 45,976 46,281 -0.66%
Revenue 16,585 25,562 -35.12%
Profit before Tax (2,979) 4,826 -161.73%
Profit After Tax -4,480 4,870 -191.99%
Net Assets 276,124 280,976 -1.73%
Revenue 59,705 60,043 -0.56%
Profit before Tax 3,843 957 301.57%
Profit After Tax 2,825 448 530.58%
Net Assets 19,067 16,242 17.39%
FY: 2015 FY: 2014 % change
N'million N'miillion
Gross Earnings 506,297 481,790 5.09%
Profit Before Tax 21,512 94,056 -77.13%
Profit After Tax 15,148 84,011 -81.97%
Net Assets 578,800 524,062 10.44%
6M: 2016 6M: 2015 % change
N'million N'miillion
Revenue 26,449 21,971 20.38%
Profit Before Tax 894 -7,045 112.69%
Profit After Tax 1,021 -6,781 115.06%
Net Assets 11,924 2,827 321.79%
9M: 2016 9M: 2015 % change
N'million N'miillion
Revenue 69,619 84,750 -17.85%
Profit Before Tax 1,204 7,134 -83.12%
Profit After Tax 864 5,216 -83.44%
Net Assets 44,399 48,341 -8.15%
* Q1- Quarter 1 * 6M- Six month
* 9M- Nine month * FY- Full Year
DANGOTE CEMENT
PLC
FBN HOLDINGS PLC
FCMB PLC
FORTE OIL PLC
LAFARGE AFRICA
PLC
UNION BANK PLC
TIGER BRANDED
CONSUMER
GOODS PLC
TOTAL OIL PLC
SEPLAT
PETROLEUM
DEVELOPMENT
COMPANY PLC
GUINNESS
NIGERIA PLC

Table 1: Sectoral Stock Performance
Sector/Industry Ticker Rec Close 1MONTH CHANGE
YEAR-TO DATE
Basic Materials Naira % %
Specialty Chemicals
Chem.& Allied products Plc.
CAP NL EQUITY BUY
38.50 0.0% 2.4%
Consumer goods
7UP Plc. 7UP NL EQUITY
145.00 -6.5% -20.3%
Cadbury Plc. CADBURY NL EQUITY
15.50 4.9% -9.6%
Champion Breweries Plc.
CHAMPION NL EQUITY
2.90 -5.8% -13.9%
Tiger branded consumer goods
TIGERBRA NL EQUITY
3.03 30.6% 168.1%
Dangote Sugar Refinery
DANGSUGA NL EQUITY
5.75 -6.4% -4.6%
Flourmill Nigeria Plc.
FLOURMILL NL EQUITY
21.00 8.5% 1.0%
Guinness Nigeria Plc.
GUINNESS NL EQUITY
91.28 -12.7% -24.2%
Nigerian Breweries Plc
NB NL EQUITY
115.89 8.3% -14.8%
Nestle Nigeria Plc.
NESTLE NL EQUITY
615.26 -12.1% -28.5%
Okomu Oil OKOMUOIL NL EQUITY
29.00 -2.8% -4.3%
Presco Plc PRESCO NL EQUITY
35.76 3.4% 8.4%
PZ Cussons Plc.
PZ NL EQUITY
21.36 -5.9% -16.9%
Unilever Plc. UNILEVER NL EQUITY
30.71 5.9% -29.0%
Financials
Banks
Access Bank Plc.
ACCESS NL EQUITY BUY
4.05 6.9% -16.5%

Diamond Bank Plc.
DIAMONDBNK NL EQUITY SELL
1.39 20.9% -39.6%
ETI Bank ETI NL EQUITY SELL
14.98 3.2% -10.8%
Fidelity Bank Plc.
FIDELITY NL EQUITY HOLD
1.17 -12.7% -22.0%
First Bank Holding Plc.
FBNH NL EQUITY SELL
3.60 14.3% -29.8%
First City Monument Bank Plc.
FCMB NL EQUITY BUY
1.00 13.6% -40.8%
Guaranty Trust Bank Plc.
GUARANTY NL EQUITY BUY
16.77 17.3% -7.8%
Skye Bank Plc.
SKYEBANK NL EQUITY SELL
0.98 7.7% -38.0%
Stanbic-IBTC Bank Plc.
STANBIC NL EQUITY
13.85 -7.7% -16.2%
Sterling Bank Plc.
STERLNBANK NL EQUITY
1.41 -13.0% -23.0%
UBA Bank Plc.
UBA NL EQUITY BUY
3.40 8.3% 0.6%
Union Bank Nigeria Plc.
UBN NL EQUITY
4.60 -17.9% -33.3%
Wema Bank Plc.
WEMABANK NL EQUITY
0.80 -1.2% -20.0%
Zenith Bank Plc.
ZENITHBANK NL EQUITY BUY
12.70 18.1% -9.6%
INSURANCE
AIICO Insurance Plc.
AIICO NL EQUITY
0.77 -3.8% -15.4%
Axa-Mansard Insurance Plc.
MANSARD NL EQUITY
2.24 19.8% -16.7%
Wapic Insurance Plc.
WAPIC NL EQUITY
0.50 0.0% 0.0%
Industrials
Building Materials &Fixtures
Ashaka Cement Plc.
ASHAKACEM NL EQUITY SELL
19.41 -14.9% -22.4%
Cement Co of North. Nig. Plc
CCNN NL EQUITY BUY
7.45 -8.8% -20.3%
Dangote Cement Plc.
DANGCEM NL EQUITY HOLD
163.40 -2.6% -3.9%
Julius Berger Plc.
JBERGER NL EQUITY
43.00 -4.0% 2.4%
Lafarge Africa Plc.
WAPCO NL EQUITY HOLD
67.99 -11.7% -29.8%
Oil and Gas
Integrated Oil & Gas
Forte Oil Plc. FO NL EQUITY
214.35 -26.9% -35.0%
Mobil Nigeria Plc.
MOBIL NL EQUITY SELL
147.80 -8.8% -7.6%
Oando Plc. OANDO NL EQUITY SELL
4.56 9.1% -22.7%
Seplat Petroleum Dev. Co. Plc.
SEPLAT NL EQUITY BUY
340.00 13.3% 67.5%
Total Nigera Plc
TOTAL NL EQUITY HOLD
154.19 0.2% 4.9%
Others
Transcorp Hotels Plc.
TRANSCORP NL EQUITY
0.99 -6.6% -34.9%
UAC Property Dev. Company Plc.
UACPROP NL EQUITY
3.85 -16.5% -36.8%
Source: Bloomberg, Stanbic IBTC Stockbrokers
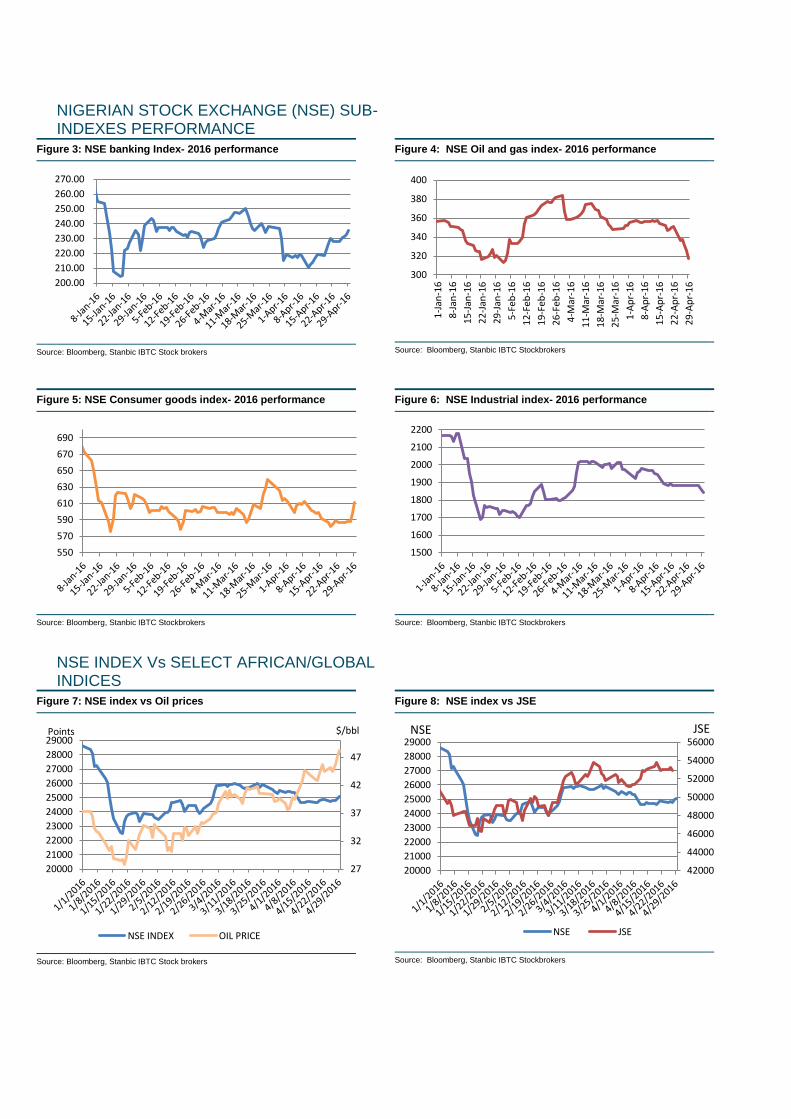
NIGERIAN STOCK EXCHANGE (NSE) SUB-INDEXES PERFORMANCE
NSE INDEX Vs SELECT AFRICAN/GLOBAL INDICES
Figure 3: NSE banking Index- 2016 performance
Source: Bloomberg, Stanbic IBTC Stock brokers
Figure 4: NSE Oil and gas index- 2016 performance
Source: Bloomberg, Stanbic IBTC Stockbrokers
Figure 5: NSE Consumer goods index- 2016 performance
Source: Bloomberg, Stanbic IBTC Stockbrokers
Figure 6: NSE Industrial index- 2016 performance
Source: Bloomberg, Stanbic IBTC Stockbrokers
Figure 7: NSE index vs Oil prices
Source: Bloomberg, Stanbic IBTC Stock brokers
Figure 8: NSE index vs JSE
Source: Bloomberg, Stanbic IBTC Stockbrokers
200.00
210.00
220.00
230.00
240.00
250.00
260.00
270.00
300
320
340
360
380
400
1-J
an-1
6
8-J
an-1
6
15
-Jan
-16
22
-Jan
-16
29
-Jan
-16
5-F
eb-1
6
12
-Feb
-16
19
-Feb
-16
26
-Feb
-16
4-M
ar-1
6
11
-Mar
-16
18
-Mar
-16
25
-Mar
-16
1-A
pr-
16
8-A
pr-
16
15
-Ap
r-1
6
22
-Ap
r-1
6
29
-Ap
r-1
6
550
570
590
610
630
650
670
690
1500
1600
1700
1800
1900
2000
2100
2200
27
32
37
42
47
20000
21000
22000
23000
24000
25000
26000
27000
28000
29000$/bbl Points
NSE INDEX OIL PRICE
42000
44000
46000
48000
50000
52000
54000
56000
20000
21000
22000
23000
24000
25000
26000
27000
28000
29000JSE NSE
NSE JSE

Disclaimer
*NOT INVESTMENT RESEARCH
The material in this document has been prepared by individual sales and/or trading personnel employed by Stanbic IBTC Stockbrokers and not by the
Equities Research department of SBGS. It is not an investment research or a research recommendation nor should it be regarded as such. The
information provided is by no means intended to provide a sufficient basis on which to make an investment decision. It is intended only to provide
observations and views of the said individual sales and/or trading personnel, which may be different from, or inconsistent with, the observations and
views of Stanbic IBTC Stockbrokers. Observations and views of the said salesperson or trader may change at any time without notice. Information and
opinions presented in this material have been obtained or derived from sources believed by Stanbic IBTC Stockbrokers to be reliable, but Stanbic IBTC
Stockbrokers make no representation as to their accuracy or completeness thereof. Stanbic IBTC Stockbrokers accept no liability whatsoever and
howsoever incurred, or suffered, resulting, or arising, from the use of information contained in this document.
The information and opinions stated in this document are of a general nature, have been prepared solely for information purposes and do not constitute
any advice or recommendation to conclude any transaction or enter into any trade or agreement. It is strongly recommended that every recipient seek
appropriate professional advice before acting on any information contained herein as the information and opinions expressed herein do not take
account of each individual’s financial situation, personal and investment objectives. Whilst every care has been taken in preparing this document, no
representation, warranty or undertaking, express or implied, is given as to the accuracy or completeness of the information or representations. All
information contained herein is subject to change after publication at any time without notice. The past performance of any investment product is not an
indication of future performance.
These views, unless expressed to the contrary, are the opinion of a trader or sales person only and necessarily do not reflect the official views of
Stanbic IBTC Stockbrokers, nor should these views be considered as investment advice. This is not a Research Report under SEC rules or Investment
Research as defined by FCA rules as it has not been prepared in accordance with legal requirements to promote the independence of investment
research and it is not subject to any prohibition on dealing ahead of the dissemination of investment research.