01830100.0000 volume ii: appendices - tucson · volume ii: appendices . december 2013 ....
TRANSCRIPT

Volume II: Appendices December 2013
01830100.0000
EXPIRES 09/30/2015

RECYLED WATER M A S T E R P L A N
TABLE OF CONTENTS Volume I (bound separately)
List of Tables, Figures, and Appendices iii
List of Acronyms v
Preface P-1
Chapter 1. Setting the Stage 1-1
Purpose 1-1
Background 1-1
Recycled Water Master Plan Goals 1-3
Geographic Setting 1-3
The Master Planning Process 1-5
Contents of the Report 1-9
Chapter 2. The Value of Reuse: Recycled Water as a Community Resource 2-1
Too Valuable to Waste: Tucson’s History of Water Reuse 2-1
Locally Made, Locally Used: Regional Stories 2-4
The Value of Tucson Water’s Recycled Water Resource 2-6
Chapter 3. Laws, Regulations and Policies 3-1
Federal Regulations 3-1
State Regulations 3-6
Local Agreements or Policies 3-11
Chapter 4. Recycled Water – a Reliable Local Resource 4-1
Groundwater as a Future Resource 4-1
Central Arizona Project Water – an Imported Supply 4-2
City’s Current Effluent Entitlement 4-4
City’s Projected Effluent Entitlements 4-5
Chapter 5. Recycled Water Supply and Demand 5-1
Existing Seasonal Reclaimed Water Usage 5-1
Tucson Water Projected Reclaimed Water Demands 5-2
Projection of Unutilized Recycled Water Resources 5-4
i

RECYLED WATER M A S T E R P L A N
Projected Seasonal Distribution of Recycled Water for New Recycled Water Programs 5-5
Chapter 6. Reclaimed Water System Evaluation 6-1
Existing Reclaimed Water System 6-1
Evaluation of Reclaimed Water System 6-5
Recommended Schedule of System Improvements and Costs 6-11
Chapter 7. Need for New Recycled Water Programs 7-1
Local Renewable Water Resource 7-2
Community Investments in Water Resources 7-3
Potential Benefits of New Recycled Water Programs 7-6
The “No Action” Alternative 7-7
Chapter 8. New Recycled Water Program Evaluation 8-1
Concepts for New Recycled Water Program 8-2
The Need for Advanced Water Treatment 8-7
Evaluation of Advanced Treatment Process Options 8-8
Evaluation of New Recycled Water Program Alternatives 8-18
Comparison of New Recycled Water Program With Other Southwest Water Supply Projects 8-23
Summary of Findings and Conclusions 8-25
Implementation Considerations 8-26
Chapter 9. Conclusions and Recommendations 9-1
Reclaimed Water System 9-1
New Recycled Water Programs 9-3
ii

RECYLED WATER M A S T E R P L A N
List of Tables
Table No. Description Page
4-1 Effluent Entitlements in Calendar Year 2012 From Metropolitan Area 4-5 Wastewater Reclamation Facilities 6-1 2010 RWS Deliveries by Customer Type 6-4
6-2 2010 Reclaimed Water Deliveries and Demands 6-5
6-3 Comparison of Existing Reclaimed Water Production and Peak Day Demands 6-6
6-4 Projected Additional Tucson Water Customer Reclaimed Water Demands 6-10
6-5 Thornydale Booster Station Upgrade for Future Oro Valley Demands 6-10
6-6 Recommended RWS Improvement and Cost Opinions 6-12
7-1 Community Investments in Water Resources 7-6
8-1 Summary of Concepts for New Recycled Water Program Alternatives 8-5
8-2 Advanced Water Treatment Water Quality Goals 8-10
8-3 Summary of Advanced Water Treatment Technologies 8-11
8-4 Summary of Treatment Process Train Alternatives 8-14
8-5 Summary of AWT Design Flows 8-15
8-6 Summary of Preferred Advanced Treatment Train Alternatives 8-18
8-7 Summary of Recycled Water Program Alternative Facility Components 8-20
8-8 Conceptual Capital Cost Opinions for Recycled Water Program Alternatives 8-21
8-9 Conceptual Annual O&M Cost Opinions for Recycled Water Program Alternatives 8-22
8-10 Conceptual Unit Costs for New Recycled Water Program Alternatives 8-23
9-1 Summary of Conceptual Costs for New Recycled Water Program Alternatives 9-5
List of Figures
Figure No. Description Page
1-1 Tucson Water Long-Range Water Planning 1-2
1-2 City/County Final Report and Action Plan 1-2
1-3 Tucson Water Service Area 1-4
1-4 Map of Reclaimed Water System 1-5
1-5 Recycled Water Master Plan Development Sequence 1-6
2-1 Land Subsidence 2-2
iii

RECYLED WATER M A S T E R P L A N
Figure No. Description Page
4-1 Tucson Water's Well-Fields 4-2
4-2 CAP Alignment to Tucson 4-3
4-3 Projection of the City's Total Effluent Entitlements 4-7
4-4 Projection of the City's Metropolitan Effluent Entitlements 4-7
5-1 2010 Seasonal Distribution of Recycled Water Resources 5-2
5-2 Projection of Unutilized Recyled Water Resources from Metropolitan Area WRFs 5-5
5-3 2020 Seasonal Distribution of Unutilized Recycled Water Supplies 5-6
5-4 2030 Seasonal Distribution of Unutilized Recycled Water Supplies 5-6
6-1 Existing Reclaimed Water System 6-2
6-2 Recommended System Improvements to Correct Existing Deficiencies 6-9
6-3 Recommended Reclaimed Water System Improvements 6-13
7-1 Tucson Water Demand and Supply 7-2
7-2 Clearwater Program Facilities 7-4
8-1 Concepts for New Recycled Water Program Alternatives 8-6
8-2 Concept for Conveyance of Recycled Water to the CAVSARP and North CAVSARP Alternatives 8-6
8-3 Concept for Conveyance of Recycled Water to the SE Tucson Alternative 8-7
8-4 Target Location for Achieving Water Quality Goals 8-9
8-5 Present Worth Cost Comparison of Advanced Treatment Train Alternatives 8-16
8-6 Comparison of Unit Costs of Southwest Water Supply Projects 8-25
List of Appendices
A. Review of Water Reuse Programs
B. Mayor and Council Water Policies
C. Effluent Projections and Entitlements
D. Reclaimed Water System Evaluation
E. New Recycled Water Program Evaluation
F. Community Investments in Water Resources
G. Cost Information for Other Southwest Water Supply Projects
iv

RECYLED WATER M A S T E R P L A N
LIST OF ACRONYMS
AACE Association for the Advancement of Cost Engineering ADD Acquisition, Development, and Delivery ADEQ Arizona Department of Environmental Quality ADWR Arizona Department of Water Resources AF acre-feet AFY acre-feet per year AMAs Active Management Areas AWBA Arizona Water Banking Authority AWS Assured Water Supply AZPDES Arizona Pollutant Discharge Elimination System BAC Biologically Activated Carbon C2E Conserve to Enhance CAP Central Arizona Project CAVSARP Central Avra Valley Recharge and Recovery Project CAWCD Central Arizona Water Conservation District CCL3 Contaminant Candidate List 3 CEP Conservation Effluent Pool CIP capital improvement program CWA Clean Water Act CWAC Citizens' Water Advisory Committee EDCs endocrine-disrupting compounds EDR Electrodialysis Reversal ENRCCI Engineering News Record Construction Cost Indices EPA Environmental Protection Agency ESA Endangered Species Act FWID Flowing Wells Irrigation District GAC Granular Activated Carbon GFRs grandfathered groundwater rights GMA Groundwater Management Act IGA Intergovernmental Agreement IPR indirect potable reuse IX Ion Exchange LEED Leadership in Energy and Environmental Design LRV log reduction value LT2 Long Term 2 Enhanced Surface Water Treatment Rule MCL Maximum Contaminant Level
v

RECYLED WATER M A S T E R P L A N
MDWID Metropolitan Domestic Water Improvement District MF Microfiltration MG million gallons mg/L milligram per liter MGD million gallons per day NF Nanofiltration ng/L nanogram per liter NTU Nephelometric Turbidity Units NWRI National Water Research Institute O&M operations and maintenance O3 Ozone OCWD Orange County Water District PCRWRD Pima County Regional Wastewater Reclamation Department PMRRP Pima Mine Road Recharge Project PPCPs pharmaceuticals and personal care products RO Reverse Osmosis ROMP Regional Optimization Master Plan RWS Reclaimed Water System RWTP Reclaimed Water Treatment Plant SAT soil aquifer treatment SAVSARP Southern Avra Valley Storage and Recovery Project SAWRSA Southern Arizona Water Rights Settlement Act SDWA Safe Drinking Water Act SE Southeast SHARP Southeast Houghton Area Recharge Project TDS total dissolved solids TOC total organic carbon US&R underground storage and recovery UV-AOP Ultraviolet/Hydrogen Peroxide Advanced Oxidation Process WISP Water and Wastewater Infrastructure, Supply and Planning Study WRDC Water Resources Development Commission WRF Wastewater Reclamation Facility
vi

APPENDIX A
REVIEW OF WATER REUSE PROGRAMS

Recycled Water Master Plan
Appendix A: Review of Water Reuse Programs
December 2013
Imagine the result

NOTES TO READER:
Appendix A, entitled “Review of Water Reuse Programs,” presents a review of several existing
and successful recycled water programs. Some of the reviews were based on site visits and
program staff interviews conducted in April 2011. Literature reviews were also conducted of
other programs that were not visited shortly thereafter in 2011. The information summarized in
the Appendix for the programs reviewed was current at the time of the site visits and interviews,
and/or when the literature reviews were conducted. To facilitate completion of the Recycled
Water Master Plan report, the Appendix was not updated with more current information. The
results of the program reviews did, however, accomplish its objective of identifying key success
factors and “lessons learned” in implementing successful recycled water programs employing
indirect potable reuse of municipal wastewater.

December 2013 01830100.0000 i
Table of Contents
1 Executive Summary 1-1
2 Identification of Programs for Review 2-1
2.1 Objectives for Review 2-1
2.2 Identification of Programs for Review 2-2
3 Summary of Programs Visited 3-1
3.1 Orange County Water District 3-1
3.2 West Basin Municipal Water District 3-2
3.3 Los Angeles Department of Water and Power 3-2
3.4 City of San Diego Public Utilities Department 3-3
4 Additional Water Reuse Programs Reviewed 4-1
4.1 Scottsdale Water Resource Department 4-1
4.2 El Paso Water Utilities 4-1
4.3 Singapore Public Utilities Board 4-2
5 References 5-1
Tables
Table 2-1. Water Reuse Projects 2-1
Table 3-1. OCWD Technical and Public Outreach Information 3-4
Table 3-2. WBMWD Technical and Public Outreach Information 3-7
Table 3-3. LADWP Technical and Public Outreach Information 3-9
Table 3-4. City of San Diego Public Utilities Department Technical and Public Outreach Information 3-12
Table 4-1. Scottsdale Water Resources Department Technical Information 4-3
Table 4-2. EPWU Technical Information 4-4
Table 4-3. Singapore Public Utilities Technical Information 4-4

December 2013 01830100.0000 1-1
Recycled Water Master Plan
Review of Water Reuse Programs
1 Executive Summary
The Recycled Water Master Plan team conducted a review of significant reuse programs in the
U.S. and other countries, selected programs for the team to personally visit and to conduct
interviews with key program staff, and reviewed literature for other programs that are relevant to
Tucson’s recycled water future. The review was completed to obtain detailed firsthand knowledge
transfer of facilities and operations, technical and public outreach advice, and to initiate cross-
utility relationships that can be leveraged throughout Tucson Water’s planning efforts and program
implementation.
The review of reuse programs resulted in the following key findings and conclusions:
Statistically valid research early in the process is critical to success. Focus groups can
help refine messages, key community influences and leaders, and other details of
approach and timing.
Orange County Water District and West Basin Water are water wholesalers and so have a
considerably different set of communication issues than Tucson Water with its customers
being direct users, although there are approaches used by these wholesalers that, in part,
would be applicable to Tucson Water outreach.
Major budget commitments have been made to water reuse public involvement and
education by all these water providers.
There is inconsistency in nomenclature regarding recycled water with some utilities
referring to potable recycled water as ‘reclaimed.’
Educate and win over civic, community, business, and government leadership first. Get
them to sign support cards if possible.
There is inconsistency between the utilities regarding the extent to which they encourage
or accept public input and comment during the planning process.
Distributing “support statement” cards to everyone who hears the water reuse story and
asking them to be signed and returned to the utilities is an excellent way for the utility to
demonstrate a broad and deep level of community support for the reuse project.

December 2013 01830100.0000 1-2
Recycled Water Master Plan
Review of Water Reuse Programs
Beware of politics and the project becoming a political issue. This has been devastating to
water reuse efforts in San Diego and other communities. Avoid election cycles when
conducting critical public outreach and participation efforts.
A systematic speakers’ bureau is still the most effective way to communicate with
stakeholder groups, although face-to-face, one-on-one communication with leadership
should take place prior to the implementation of a full-scale speakers’ bureau.
Engage third party advocates (public health, environmental, business) to the greatest
degree possible. They will bring an additional and strong level of credibility to the project.
Work to maintain high levels of trust and credibility in the implementing utility, including
ensuring customers understand the utility is the “source of water quality” as opposed to the
water resource itself.
Pilot or demonstration scale treatment facilities provide the opportunity to implement a
treatment approach on a small scale and generate site-specific information to evaluate
operability, cost, and performance.
At pilot, demonstration, or full scale treatment facilities, include interactive interfaces and
public displays for all ages related to recycled water.
The treatment approach for pilot or full scale treatment facilities was largely based on
Orange County Water District’s Groundwater Replenishment System, which includes
microfiltration, reverse osmosis, and ultraviolet light with hydrogen peroxide. The treatment
approach emphasizes redundant barriers for pathogens and “diverse” barriers for trace
organic chemicals.

December 2013 01830100.0000 2-1
Recycled Water Master Plan
Review of Water Reuse Programs
2 Identification of Programs for Review
The following sections highlight the objectives for review and the identification of programs.
2.1 Objectives for Review
Planning efforts for potential new beneficial uses of the City of Tucson’s wastewater effluent
entitlements are likely to result in large investments in new infrastructure. For aquifer
augmentation and indirect potable reuse, this may also include application of advanced
technologies for water quality control and by-product management (brine, residuals). In addition,
past experience demonstrates that programs of this scale and nature have associated risks,
beyond those of other types of water resources programs, which require significant community
outreach and support for successful outcomes.
Information exists in the literature describing reuse applications, including indirect potable reuse,
at utilities in the U.S. and other countries. While the literature provides useful summary information
on technologies evaluated and used, and public relations programs developed for both successful
and unsuccessful efforts, they do not provide the depth of information and understanding that can
be obtained through direct, focused interaction with responsible utility representatives and on-site
inspection of facilities and infrastructure.
It is prudent, therefore, to commit to due diligence early in the Recycled Water Master Plan effort
to obtain detailed firsthand information through carefully selected site visits and interviews with key
representatives of relevant reuse programs. This effort includes obtaining knowledge transfer and
advice, firsthand facility and infrastructure inspections, and initiation of cross-utility relationships
that can be leveraged throughout Tucson Water’s planning efforts and program implementation.
Specific technical and public outreach objectives of the site visits and interviews include the
following:
Obtain a time-line, associated technical and public outreach activities/phases, and financial
commitment information for each program’s development. Solicit opinions of where
improvements could have been made.
Learn why and how a utility has achieved success. What specific activities worked or didn’t
work? Find out what drawbacks occurred and how they were overcome.

December 2013 01830100.0000 2-2
Recycled Water Master Plan
Review of Water Reuse Programs
Conversely, learn why and how a utility did not achieve success. What were the activities
(or lack of activities) that contributed most to non-achievement?
Find out what organizational model for decision-making was used and whether the same
approach would be used again.
Find out what types of people were identified as champions and advisors for the program.
Would the same be chosen? At what point were they brought into the program, and how
exactly did they participate?
Understand how and when the public interacted with the utility on the program. What were
the biggest challenges and costs in this arena? What was the nature and extent of
utility/customer interface at the program’s outset, and how did it develop/change over the
course of the program?
Obtain advice/recommendations for implementing the Tucson Water program.
Observe the extent and nature of key facilities, and review public display areas and
ongoing public touring/outreach practices.
2.2 Identification of Programs for Review
Programs were identified for site visits and interviews based on collective challenges,
successes, setbacks, and demonstrated industry best practices that would be applicable to
Tucson Water’s current recycled water effort. Other programs were identified for a literature
review based on similar program characteristics, such as inland site location. Table 2-1 provides
a comprehensive list of water reuse projects that are currently in operation world-wide and water
reuse projects that are currently in development.
Four utilities were selected for site visits and onsite program interviews:
Orange County Water District
West Basin Municipal Water District
Los Angeles Department of Water and Power
City of San Diego Public Utilities Department

December 2013 01830100.0000 2-3
Recycled Water Master Plan
Review of Water Reuse Programs
Additional utilities and programs were selected for a literature review and include:
Scottsdale Water Resources Department
El Paso Water Utilities
Singapore Public Utilities Board
Summaries of the site visits and onsite program interviews are presented in Section
3, while information on the additional programs is included in Section 4.

Table 2-1. Water Reuse Projects
Projects in Operation Years
Operating Production Rate (afy)
Treatment Processes Purpose Notes
AS TF LC MF RO UV GAC SR IR IPR DPR
Whittier Narrows / Montebello Forebay Project 43 44,000
South Lake Tahoe Water Reclamation Project 40 7,500
Windhoek, Namibia (Africa) Reuse Project 35 5,000
Water Factory 21 30 4,000
No longer operates
Upper Occoquan, VA Reclamation Project 25 27,000
El Paso, TX, Fred Hervey Water Reclamation Project 20 7,500 O
West Basin Recycling Project (Phase 1) 15 6,000
West Basin Recycling Project (Phase 2) 12 3,360
West Basin Mobil Boiler Feed Plant 13 3,600
Industrial
West Basin Carson Regional Water Recycling Plant 10 5,600
Industrial
West Basin Recycling Phase 3 - Chevron Boiler Feed 8 5,100
Industrial
West Basin Recycling Project (Phase 4) 4 4,000
West Basin Recycling Project (Phase 2) 12 3,360
Terminal Island Treatment Plant (Phase 1) 8 5,600
Water Replenishment District of So. Cal., Alamitos Barrier Project 7 3,500
Gwinnett County, GA, North Advanced Water Reclamation Facility 10 22,400
O
Scottsdale, Arizona, Water Campus ( Phase 1, 2 and 3) 11 13,435
Tempe, Arizona, Water Reclamation Facility 6 9,000
MBR
Mesa, Arizona, Northwest Reclamation Facility 21
Media Filters
Anthem, Arizona, Water Campus 11 5,000
MBR
Chandler, Arizona, Ocotillo WRF 12 7,000
Media Filters
Chandler, Arizona, Industrial Process Water Reclamation Facility 14 3,000
MF-RO and
NF
Avondale, Arizona, Charles M. Wolf Plant 1 17,000
Nitrification / denitrification
Glendale, Arizona, Arrowhead Ranch Water Reclamation Facility 25 5,000
Glendale, Arizona, West Area Water Reclamation Facility 10 12,900
Carlsbad, CA, Water Reclamation Plant 5 500
Irrigation
Brisbane, Qld, Australia, Bundamba Phase 1A (20 MLD) 3.3 6,000
Sulaibiya Water Reclamation Facility, Kuwait 6 112,000
Irrigation and
Industrial
Singapore NEWater Project (Bedok WRP) 7.8 6,700
Singapore NEWater Project (Kranji WRP) 7.8 10,000
Singapore NEWater Project (Seletar WRP) 6.8 5,900
Singapore NEWater Project (Ulu Pandan WRP) 3.5 35,828
Orange County Groundwater Replenishment System 3 72,000
Brisbane, Qld, Australia, Bundamba Phase 1B (30 MLD) 2 9,400
Brisbane, Qld, Australia, Gibson Island WRF (50 MLD) 2 14,700
Brisbane, Qld, Australia, Luggage Point WRF (70 MLD) 2 20,000

Table 2-1. Water Reuse Projects (continued)
Projects in Development Years
Operating Production Rate (afy)
Treatment Processes Purpose Notes
AS TF LC MF RO UV GAC SR IR IPR DPR
West Basin Recycling Project Expansion (Phase 5) - 7,500
Miami-Dade WASD, South District Water Reclamation Facility - 24,000
Miami-Dade WASD, Central Water Reclamation Facility - 3,000
Irrigation
Miami-Dade WASD, North Water Reclamation Facility - 8,000
Irrigation
Los Angeles Harbor / Dominguez Gap Project - 7,000
East Bay Municipal Utilities District, CA, RARE Project - 4,000
Oxnard, CA GREAT Project - 3,000
Santa Clara Valley Water District, CA - 5,600
Terminal Island Treatment Plant Phase 2 - 5,600
Fallbrook Recycling Project - -
LEGEND - Treatment Processes
AS - Activated Sludge Secondary Treatment
TF - Tertiary Filtration
LC - Lime Clarification
MF - Microfiltration
RO - Reverse Osmosis
UV - Ultraviolet Disinfection
GAC- Activated Carbon
O - Ozonation
LEGEND - Purpose
SR - Spreading Recharge
IR - Injection Recharge
IPR - Indirect Potable Reuse
DPR- Direct Potable Reuse

December 2013 01830100.0000 3-1
Recycled Water Master Plan
Review of Water Reuse Programs
3 Summary of Programs Visited
The Recycled Water Master Plan team conducted reuse program site visits and interviews with
key utility staff from April 6 through April 8, 2011. The program interviews were conducted by a
team comprised of Jeff Biggs, Fernando Molina, and Wally Wilson of Tucson Water, Christine
Cotton and George Maseeh of Malcolm Pirnie, the Water Division of ARCADIS (Pirnie/ARCADIS),
and Rick Kaneen of Kaneen Advertising and Public Relations. This section provides a summary
description of each program and a summary table of specific information compiled during the site
visits and interviews.
3.1 Orange County Water District
The Orange County Water District (OCWD) wholesales water to 19 cities and three water districts
in northern and central Orange County. OCWD has been using highly treated recycled water for a
seawater intrusion barrier since the 1970s with Water Factory 21, a facility that was recently
replaced by OCWD’s Groundwater Replenishment System (GWRS). The current treatment
system utilizes membrane filtration, reverse osmosis, and ultraviolet light with hydrogen peroxide.
The plant capacity is 70 million gallons per day (MGD) and OCWD has immediate plans to expand
to 100 MGD. Highly purified recycled water is currently used for the seawater intrusion barrier and
surface spreading for indirect potable reuse (IPR).
OCWD provided a detailed tour of the treatment facility and interactive public displays. The OCWD
tour concluded with the opportunity to taste the highly-purified recycled water. OCWD expressed
interest in providing guidance and support to Tucson Water as the effluent planning efforts
continue.
Specific advice for Tucson Water regarding public outreach strategies for IPR included obtaining
written endorsements from public officials and important members of the community, which can be
posted online and included in presentations to the public. Furthermore, OCWD suggested that
unsuccessful IPR projects generally did not place sufficient emphasis and resources toward public
education and outreach, and indicated that political understanding and acceptance are critical to
success. OCWD’s GWRS efforts have served as a model of success for modern IPR program
implementation, and the system continues to receive utility and media attention worldwide.
Table 3-1 provides additional information gathered during the site visit and interviews with OCWD
staff.

December 2013 01830100.0000 3-2
Recycled Water Master Plan
Review of Water Reuse Programs
3.2 West Basin Municipal Water District
The West Basin Municipal Water District (WBMWD) wholesales potable and recycled water to 17
cities, a range of private companies and the West Coast Basin Seawater Barrier Project in
southwest Los Angeles County. WBMWD produces five qualities of recycled water, including
highly purified recycled water for a seawater intrusion barrier and IPR utilizing a post-tertiary
treatment process of membrane filtration, reverse osmosis, and ultraviolet light with hydrogen
peroxide. Groundwater replenishment for the seawater intrusion barrier has been in operation for
30 years. WBMWD currently purchases secondary effluent from the City of Los Angeles at its
Hyperion Wastewater Treatment Plant for $7/acre-ft to produce the five qualities of recycled water.
As a water wholesaler, WBMWD does not perform direct public outreach with residential and
commercial customers, but considerable efforts for on-going interviews, education, and
information exchange are conducted with elected officials and community opinion leaders in the
municipalities and districts that purchase water from WBMWD. In addition, the treatment facility
has interactive public displays for adults and children, and plant tours conclude with an opportunity
to taste the highly-purified recycled water.
WBMWD is also performing a seawater desalination demonstration project that includes an
aquarium, additional public displays, and desalinated water tasting. While environmental
organizations encourage groundwater replenishment for the seawater barrier and IPR due to
benefits of reducing wastewater discharges to the ocean, implementation of the desalination
project is not yet fully committed.
Table 3-2 provides additional information gathered during the site visit and interviews with
WBMWD staff.
3.3 Los Angeles Department of Water and Power
The Los Angeles Department of Water and Power (LADWP) began planning for IPR in the 1990s.
Infrastructure to support IPR were constructed, but the project was not implemented due to
several factors, including public opposition, insufficient or ineffective public outreach and
engagement, active political opposition and absence of documented community and political
support. Furthermore, the use of tertiary treated effluent for IPR did not demonstrate a strong
commitment to water quality. The infrastructure was converted to non-potable water recycling
uses.

December 2013 01830100.0000 3-3
Recycled Water Master Plan
Review of Water Reuse Programs
LADWP is currently re-establishing an IPR program in its Recycled Water Master Plan effort,
which already includes a demonstration facility producing highly-purified recycled water and a
public outreach strategy modeled after OCWD’s GWRS success. LADWP is conducting public
forums, and geographically-based Community Leadership Action Committees have been
established to engage the public. Additionally, LADWP must consider the environmental needs of
riparian habitat in reaches of the Los Angeles River, which is similar to challenges regarding the
riparian habitat in the effluent-dominated reach of the Santa Cruz River in Pima County. LADWP’s
recycled water program also includes non-potable irrigation and industrial uses, which are being
expanded in parallel with IPR implementation efforts. LADWP has secured committed funding for
its recycled water programs via revenue from surcharges.
Table 3-3 provides additional information gathered during the site visit and interviews with LADWP
staff.
3.4 City of San Diego Public Utilities Department
The City of San Diego Public Utilities Department began IPR efforts in the 1990s in conjunction
with the San Diego County Water Authority. Public and political opposition prevented the project
from being implemented. The City of San Diego has re-committed to a program of highly-purified
recycled water for IPR in recent years and is currently constructing a demonstration treatment
facility and following the OCWD model for public outreach strategy. One significant difference of
San Diego’s planned IPR program is the use of the City’s San Vicente Reservoir for blending of
highly-purified recycled water with surface water prior to further treatment at the City’s Alvarado
Water Treatment Plant. California Department of Public Health (CDPH) draft regulations for IPR
do not provide specific requirements for replenishing a surface water reservoir with highly purified
recycled water, which presents permitting issues for San Diego. Business and environmental
groups have formed coalitions in support of the IPR project. In addition, after a long history of
negative media and political controversy, local media have recently supported the IPR project.
Table 3-4 provides additional information gathered during the site visit and interviews with City of
San Diego staff.

December 2013 01830100.0000 3-4
Recycled Water Master Plan
Review of Water Reuse Programs
Table 3-1. OCWD Technical and Public Outreach Information
Technical Information (information current as of April 2011)
Total project cost $481 million
Finding sources (including grant contributions) Project cost was shared between OCWD and Orange County Sanitation District (OCSD). $92 million in State and Federal grants were received for the project, and Metropolitan Water District provides a subsidy of $4 million per year (21 years) for operation and maintenance. In 2010, the costs were $480 per acre-ft ($850 per acre-ft without subsidies).
What kind of permit types and key conditions were required?
The Draft Regulations for Groundwater Replenishment with Recycled Water were under development and discussed (Title 22 California Code of Regulations, Division 4 Environmental Heath, Chapter 3 Recycling Criteria).
Water quality goals The Draft Regulations for Groundwater Replenishment with Recycled Water were under development and discussed (Title 22 California Code of Regulations, Division 4 Environmental Heath, Chapter 3 Recycling Criteria).
Treatment plant capacity and average flows 70 MGD
Source of wastewater treatment plant effluent OCSD provides 96 MGD of secondary treated effluent, without cost, to OCWD. OCSD and OCWD agreed to share the cost to construct GWS, which was $481 million USD. OCWD agreed to manage and fund the operations of the facility into the future.
Treatment process for producing recycled water for groundwater recharge
Microfiltration, reverse osmosis, and UVAOP.
Method of blending recycled water with other water sources before groundwater recharge
CDPH approval stipulates a blending requirement of 75% recycled water with 25% dilution water. That permit requirement for the seawater barrier was lifted in 2010. The blending requirement is still in place for the GWRS water that is pumped to the recharge basins. Recycled water is blended with Santa Ana River water and imported waters.

December 2013 01830100.0000 3-5
Recycled Water Master Plan
Review of Water Reuse Programs
Method of groundwater recharge Approximately 35 million gallons (132,500 cubic meters) per day of the GWRS water are pumped into injection wells to create a seawater intrusion barrier. Another 35 million gallons (132,500 cubic meters) are pumped daily to Orange County Water District's percolation basins in Anaheim, where the GWRS water naturally filters through sand and gravel to the deep aquifers of the groundwater basin. In 1936, OCWD began purchasing portions of the Santa Ana River channel to actively manage capture of the river water as a source of supply for the groundwater basin. Today, OCWD owns approximately 1,000 acres contained within a six-mile section of the Santa Ana River from Imperial Highway to Ball Road in Anaheim, California. There are more than two dozen recharge basins in this area that range in depth from 5 to 150 feet (1.5 to 45 meters).
Minimum and average residence time before recovery
The Draft Regulations for Groundwater Replenishment with Recycled Water were under development and discussed (Title 22 California Code of Regulations, Division 4 Environmental Heath, Chapter 3 Recycling Criteria).
Recovery and monitoring of recycled water The groundwater is pumped from over 400 wells operated by local water agencies, cities and other groundwater users. Each agency monitors for compliance with the Safe Drinking Water Act standards.
Additional treatment for recovered water before delivery to customers
Residual disinfection.
Percentage of drinking water that is recycled water GWRS contributes approximately 23% of the water supply for groundwater basin recharge.
Public Outreach Information (information current as of April 2011)
Methods used to evaluate outreach efforts Surveys and stakeholder support.
Nature of organized groups in opposition to the reuse program
No active opposition groups.
Advanced customer research, including statistically valid surveys
Two studies of representative voters within service areas in 1997 and 2000.
Mid-term or end-of-project customer research Not discussed
Selection and role of spokespeople in the organization
Very important that spokesman is enthusiastic about the project, skilled at public speaking, and represents the organization well.
Project champions and political supporters Key to successful outreach is targeted outreach to key leaders, political, business, environmental, media, community, etc. Written support is required from these leaders.

December 2013 01830100.0000 3-6
Recycled Water Master Plan
Review of Water Reuse Programs
Use of technology in public outreach (i.e., pilot plant tours)
Tours of facility included in public outreach activities.
Public outreach obstacles and their impacts on implementation and schedule
Not discussed
Project impact on customer water and wastewater bills
Project impact on customer water and wastewater bills vary by member utilities.
Public outreach best practices Proactive, face-to-face outreach with more than 1,200 presentations, 700 tours, and many news stories. Focus on leaders and gain their acceptance in writing and they communicate downward to all of their centers of influence.

December 2013 01830100.0000 3-7
Recycled Water Master Plan
Review of Water Reuse Programs
Table 3-2. WBMWD Technical and Public Outreach Information
Technical Information (information current as of April 2011)
Total project cost Average cost of 5 types of recycled water products (filtered, RO, 2 pass RO, 2 pass with UVAOP, and nitrified) is $1,650/AF.
Finding sources (including grant contributions) Not discussed
What kind of permit types and key conditions were required?
The Draft Regulations for Groundwater Replenishment with Recycled Water were under development and discussed (Title 22 California Code of Regulations, Division 4 Environmental Heath, Chapter 3 Recycling Criteria).
Water quality goals The Draft Regulations for Groundwater Replenishment with Recycled Water were under development and discussed (Title 22 California Code of Regulations, Division 4 Environmental Heath, Chapter 3 Recycling Criteria).
Treatment plant capacity and average flows Not discussed
Source of wastewater treatment plant effluent Secondary effluent from the City of Los Angeles’ Hyperion Wastewater Treatment Plant.
Treatment process for producing recycled water for groundwater recharge
The Edward C. Little Water Recycling Facility (ELWRF) produces five types of “designer waters,” including Barrier Water: secondary treated wastewater purified by micro-filtration, reverse osmosis, UVAOP, and disinfection for groundwater recharge.
Method of blending recycled water with other water sources before groundwater recharge
The Los Angeles County Department of Public Works (LACDPW) owns and maintains the West Coast Seawater Intrusion Barrier, from the Blend Stations to the injection wells. West Basin supplies stabilized RO water (Barrier Water) from ELWRF to the West Basin Blend Station, where the Barrier Water is blended with imported potable water from Metropolitan Water District of Southern California (MWD). West Basin currently supplies 12.5 MGD of Barrier Water, which is approximately 75 percent of overall supply to the Seawater Intrusion Barrier.
Method of groundwater recharge Injection wells (see above).
Minimum and average residence time before recovery
The Draft Regulations for Groundwater Replenishment with Recycled Water were under development and discussed (Title 22 California Code of Regulations, Division 4 Environmental Heath, Chapter 3 Recycling Criteria).
Recovery and monitoring of recycled water Not discussed
Additional treatment for recovered water before delivery to customers
Not discussed

December 2013 01830100.0000 3-8
Recycled Water Master Plan
Review of Water Reuse Programs
Percentage of drinking water that is recycled water Sixty years ago the average customer agency in West Basin's service area relied completely on groundwater. Today, however, it relies on a more diverse mix of water resources: 21% groundwater, 65% imported water, 7% recycled water and 7% conservation efforts.
Public Outreach Information (information current as of April 2011)
Methods used to evaluate outreach efforts Evaluate outreach efforts with formal phone surveys of high propensity and regular voters.
Nature of organized groups in opposition to the reuse program
Normally, women, pregnant women, and elderly people are more prone to oppose recycling that gets near consumption.
Advanced customer research, including statistically valid surveys
Statistically valid surveys that show 70% or higher support from registered or high propensity voter means the project will be accepted and would even win a vote on the project.
Mid-term or end-of-project customer research Formal statistically valid surveys should be completed every 3 to 4 years. Give enough time in between surveys to see if your outreach has had an impact and if not to make adjustments.
Selection and role of spokespeople in the organization
Very important that spokesman is enthusiastic about the project, skilled at public speaking, and represents the organization well.
Project champions and political supporters Key to successful outreach is targeted outreach to key leaders, political, business, environmental, media, community, etc. Written support is required from these leaders.
Use of technology in public outreach (i.e., pilot plant tours)
Visiting the plant is one of the best outreach tools. You can develop a rapport with the VIP guests.
Public outreach obstacles and their impacts on implementation and schedule
Make sure you engage all those who oppose your project and continue a dialogue with them. Try to move them from no to “I don’t support it, but will not actively oppose it.”
Project impact on customer water and wastewater bills
Water and wastewater bill impacts should be communicated as “adds a postage stamp on your bill.”
Public outreach best practices Focus on leaders and gain their acceptance in writing and they communicate downward to all of their centers of influence.

December 2013 01830100.0000 3-9
Recycled Water Master Plan
Review of Water Reuse Programs
Table 3-3. LADWP Technical and Public Outreach Information
Technical Information (information current as of April 2011)
Total project cost Groundwater Replenishment (GWR) Phase 1 o 15,000 AFY with groundwater replenishment
at the Hansen Spreading Grounds: $285M
GWR Phase 1 and 2 Without Injection Wells o 30,000 AFY with groundwater replenishment
at the Hansen and Pacoima Spreading Grounds: $379M
GWR Phase 1 and 2 With Injection Wells o 30,000 AFY with groundwater replenishment
at the Hansen and Pacoima Spreading Grounds; additional recharge through potential injection and/or surface spreading at the Strathern Wetlands Project if spreading capacity is inadequate during extreme wet years: $415M
Information updated from the 2012 LADWP Recycled Water Master Planning Executive Summary
Finding sources (including grant contributions) Sixty percent of capital expenditures are to be financed over 30 years at 5% interest, resulting in an annual amortized payment
The remaining forty percent of capital expenditures plus O&M costs are to be paid using the “pay-as-you-go” method in each future year
Source: 2012 LADWP Recycled Water Master Planning Executive Summary
What kind of permit types and key conditions were required?
The Draft Regulations for Groundwater Replenishment with Recycled Water were under development and discussed (Title 22 California Code of Regulations, Division 4 Environmental Heath, Chapter 3 Recycling Criteria).
Water quality goals Water quality results from pilot testing confirmed that all existing and draft drinking water and recycled water regulations can successfully be met using the proposed treatment processes
Treatment plant capacity and average flows Current plant 2,000 acre-ft/yr for seawater intrusion barrier
Future plant 30,000 acre-ft/yr for groundwater replenishment

December 2013 01830100.0000 3-10
Recycled Water Master Plan
Review of Water Reuse Programs
Source of wastewater treatment plant effluent Dominguez Gap Seawater Intrusion Barrier currently uses between 2,000-3,000 acre-ft/yr of effluent from the Terminal Island Water Reclamation Plant
Recycled water from Donald C. Tillman Water Reclamation Plant is expected to meet existing and planned non-potable reuse demands, both phases of GWR, as well as other current uses.
Treatment process for producing recycled water for groundwater recharge
Microfiltration and reverse osmosis for seawater intrusion barrier
Microfiltration, reverse osmosis, and advanced oxidation (UV/peroxide or ozone/peroxide) for planned advanced water purification facility
Method of blending recycled water with other water sources before groundwater recharge
Blending with non-recycled water sources, such as imported water or stormwater, depends on the level of treatment applied to the recycled water
Method of groundwater recharge Surface spreading will take place at existing spreading grounds
Minimum and average residence time before recovery
The Draft Regulations for Groundwater Replenishment with Recycled Water were under development and discussed (Title 22 California Code of Regulations, Division 4 Environmental Heath, Chapter 3 Recycling Criteria).
Recovery and monitoring of recycled water Not discussed
Additional treatment for recovered water before delivery to customers
Not discussed (customer is the seawater barrier)
Percentage of drinking water that is recycled water Not discussed (none that is purposeful)
Public Outreach Information (information current as of April 2011)
Methods used to evaluate outreach efforts Not discussed
Nature of organized groups in opposition to the reuse program
Opponents to the East Valley project in the 1990’s included formal opposition by residents and politicians. The environmental community (e.g., Sierra Club) supported the project.
Advanced customer research, including statistically valid surveys
Not discussed
Mid-term or end-of-project customer research Not discussed
Selection and role of spokespeople in the organization
LADWP has a speakers bureau, but it is not specifically geared towards recycled water (i.e., mostly recycled water staff did presentations on recycled water)
Project champions and political supporters Current project champions and political supporters:
Written letters of support from city council district offices
Neighborhood leaders
Individual community groups

December 2013 01830100.0000 3-11
Recycled Water Master Plan
Review of Water Reuse Programs
Use of technology in public outreach (i.e., pilot plant tours)
Recycled water advisory group did tour pilot and other full-scale recycled water treatment plants
Public outreach obstacles and their impacts on implementation and schedule
East Valley project in 1990’s was stopped due to several factors, including:
Initial outreach was not sustained
Support was not provided in writing
Political issues
Yuck factor
Media coverage
Project impact on customer water and wastewater bills
Rate impacts have been evaluated, but the information is not included in the LADWP recycled water master plan
Public outreach best practices Current project best practices:
Recycled Water Advisory Group (RWAG) provides input on recycled water expansion and groundwater replenishment
RWAG members represent a diverse cross-section of demographics, geography, and interests
Recycled Water Forums provide the opportunity for the general public to learn about LADWP’s recycled water program and offer comments and concerns before the completion of the master planning process

December 2013 01830100.0000 3-12
Recycled Water Master Plan
Review of Water Reuse Programs
Table 3-4. City of San Diego Public Utilities Department Technical and Public Outreach Information
Technical Information (information current as of April 2011)
Total project cost Average gross cost of $1,700 to $1,900 per acre-foot depending on the Integrated Reuse Alternative
Source: 2012 San Diego Recycled Water Study final draft
Finding sources (including grant contributions) To be determined for full scale facility, but the Demonstration Project was funded by a temporary water rate increase (3.08%).
What kind of permit types and key conditions were required?
The Draft Regulations for Groundwater Replenishment with Recycled Water were under development and discussed (Title 22 California Code of Regulations, Division 4 Environmental Heath, Chapter 3 Recycling Criteria).
Water quality goals Ocean water quality and imported water quality improvements were taken into consideration in establishing the water reuse targets.
Treatment plant capacity and average flows Variable depending on the Integrated Reuse Alternative and the start of operations (6.8-52.8 MGD).
Source of wastewater treatment plant effluent Integrated Reuse Alternatives include:
North City Plant, Harbor Drive Plant, and new Mission Gorge Plant for the San Vicente Reservoir
South Bay Plant for the Otay Lakes
Treatment process for producing recycled water for groundwater recharge
Ultrafiltration, reverse osmosis, and UVAOP.
Method of blending recycled water with other water sources before groundwater recharge
Colorado River and Bay Delta water are used for blending.
Method of groundwater recharge Not applicable. Purified water is to be conveyed to the San Vicente Reservoir.
Minimum and average residence time before recovery
Blending and residence time in San Vicente Reservoir has been subject of advanced modeling.
Recovery and monitoring of recycled water Not discussed
Additional treatment for recovered water from the San Vicente Reservoir before delivery to customers
Coagulation, filtration, and disinfection (ozone and chlorine) at the Alvarado Water Treatment Plant.
Percentage of drinking water that is recycled water Not discussed
Public Outreach Information (information current as of April 2011)
Methods used to evaluate outreach efforts Surveys and stakeholder support.
Nature of organized groups in opposition to the reuse program
Not discussed
Advanced customer research, including statistically valid surveys
Not discussed

December 2013 01830100.0000 3-13
Recycled Water Master Plan
Review of Water Reuse Programs
Mid-term or end-of-project customer research Not discussed
Selection and role of spokespeople in the organization
Not discussed
Project champions and political supporters Not discussed
Use of technology in public outreach (i.e., pilot plant tours)
Periodic emails to a self-selective listserv
Public outreach obstacles and their impacts on implementation and schedule
In the 1990’s, public and political opposition prevented an IPR project from being implemented.
Project impact on customer water and wastewater bills
Not discussed
Public outreach best practices Current project best practices:
The Urban Water Cycle Tour consists of three facility tours, including drinking water treatment and distribution, wastewater treatment and management, and demonstration of the water purification process. The Water Purification Demonstration Project facility was intentionally built for tours.

December 2013 01830100.0000 4-1
Recycled Water Master Plan
Review of Water Reuse Programs
4 Additional Water Reuse Programs Reviewed
This section presents a summary of additional water reuse programs in the U.S. and other
countries that are relevant to Tucson Water’s recycled water future. The summaries below were
compiled based on available information in the literature.
4.1 Scottsdale Water Resource Department
The Scottsdale Water Resources Department’s reuse program includes two treatment facilities at
its Water Campus: a water reclamation plant (WRP) and an advanced water treatment (AWT)
plant. The WRP has a capacity of 20 MGD for reclaiming water for irrigation of golf courses
through a reclaimed water distribution system. The 12 MGD AWT plant consists of a 16 MGD
microfiltration (MF) system and a 12 MGD reverse osmosis (RO) system for purifying the WRP
tertiary effluent for subsequent vadose zone injection. During low effluent flow periods, the MF
system also is used to treat Central Arizona Project (CAP) surface water for subsequent injection
recharge. The AWT is currently undergoing improvements, including upgrades to the MF and RO
membranes and addition of ultraviolet light (UV)-peroxide advanced oxidation processes (AOPs)
for the removal of microconstituents. Additionally, ozonation will be utilized at Reservoir B, which
stores tertiary treated effluent from the WRP prior to treatment at the AWT. The AWT upgrades
are scheduled to be completed in 2011. Initial construction costs for Phase I and Phase II totaled
$75 million. Phase III construction costs to convert the deep-bed filters to disc filters and to expand
capacity of the WRP were $3.2 million and $20 million, respectively. Permit requirements include
Arizona Department of Environmental Quality (ADEQ) water reuse permit and aquifer protection
permit, Arizona Department of Water Resources (ADWR) underground storage facility permit, and
Maricopa County air quality emissions permit and operating permit
Table 4-1 provides additional technical information on the Scottsdale Water Campus.
4.2 El Paso Water Utilities
The El Paso Water Utilities (EPWU) began delivering reclaimed water to customers in 1963 for
nonpotable reuse applications. Several water management strategies were implemented in the
1980’s to mitigate depletion of freshwater in the Hueco Bolson, including increased use of
reclaimed water and IPR. The Fred Hervey Water Reclamation Plant (WRP) produces reclaimed
water for multiple uses, including golf course irrigation, industrial cooling water, and groundwater
recharge by injection wells and an infiltration basin. The IPR project is called the Hueco Bolson
Recharge Project.

December 2013 01830100.0000 4-2
Recycled Water Master Plan
Review of Water Reuse Programs
The current treatment system at the Fred Hervey WRP utilizes conventional biological treatment
with powdered active carbon, high lime treatment, sand filtration, ozone disinfection, GAC
filtration, and chlorination to prevent biological growth during storage and recharge. The Fred
Hervey WRP design capacity is 10 MGD, and in 2006, the average flow was 5.2 MGD.
Approximately 40 percent of the Fred Hervey WRP effluent is used for IPR, while the remaining
effluent is used for nonpotable applications, including golf course irrigation and industrial cooling
water. The facility has 10 injection wells and an infiltration basin, which was constructed as a pilot
facility in 2000. Future expansion will likely utilize infiltration basins as the preferred method of
groundwater replenishment. Four of the 10 injection wells have been replaced with PVC casings
and screens due to corrosion of steel casings and screens. The Texas Department of Health
requires a minimum two year residence time to ensure inactivation of viruses prior to extraction of
the recycled water. Additionally, recovered water is blended with other well water and chlorinated
prior to distribution as potable water. The project cost was $33 million and funding was provided
by a 65% grant from the U.S. Environmental Protection Agency, while the remainder of the cost
was provided through wastewater user rates.
In addition to the IPR project, EPWU also operates the largest inland desalination plant for
municipal drinking water use (a joint project with Fort Bliss). The Joint Desalination Facility
produces 27.5 MGD of drinking water and will increase El Paso’s water supply by approximately
25% of the annual demand.
Table 4-2 provides additional technical information on the Hueco Bolson Recharge Project.
4.3 Singapore Public Utilities Board
The Singapore Public Utilities Board (PUB) developed the Four National Taps initiative in the
1990’s to improve the robustness and resilience of the country’s water supply. The four sources of
water include local catchment water, imported water, desalinated water, and highly-purified
recycled water known as NEWater. The NEWater Study began in 1998 to construct and operate
an advanced water treatment plant to purify secondary effluent to better than World Health
Organization (WHO) drinking water guidelines and U.S. Environmental Protection Agency
(USEPA) drinking water standards. The NEWater Study also included a comprehensive sampling
and monitoring plan and a health effects testing program, and routine testing includes constituents
on the USEPA’s Priority List of Contaminants. Currently, there are 5 NEWater plants in Singapore.
NEWater is blended with imported raw water, rainwater, and desalinated water before being
discharged to potable water reservoirs. Singapore’s PUB recovers and treats the water from the
reservoirs prior to distribution as potable water. The drinking water treatment process includes
coagulation, flocculation, sand filters, ozonation, and disinfection.

December 2013 01830100.0000 4-3
Recycled Water Master Plan
Review of Water Reuse Programs
A NEWater Visitor Centre was built as part of the PUB public education program to increase public
awareness and acceptance of IPR. The 24,000 square-foot facility opened in 2003 and is located
at the Bedok NEWater production plant. The Visitor Centre includes multimedia interactive
displays and guided tours to educate the public. Additionally, the facility’s product water is bottled
and given to visitors and others in Singapore to demonstrate the high water quality.
Table 4-3 provides additional technical information on the NEWater Project.
Table 4-1. Scottsdale Water Resources Department Technical Information
Treatment plant capacity and average flows The AWT has a capacity of 12 MGD.
Source of wastewater treatment plant effluent Tertiary effluent from the WRP is further treated at the AWT.
Treatment process for producing recycled water for groundwater recharge
Microfiltration, reverse osmosis, UVAOP
Method of blending recycled water with other water sources before groundwater recharge
AWT product water is blended with CAP water that receives microfiltration treatment for vadose zone injection. The ratio of AWT product water to CAP water depends on irrigation demand. Generally, more CAP water is used in summer months during high irrigation demand.
Method of groundwater recharge Vadose zone injection wells

December 2013 01830100.0000 4-4
Recycled Water Master Plan
Review of Water Reuse Programs
Table 4-2. EPWU Technical Information
Treatment plant capacity and average flows Design capacity of 10 MGD and average flow of 5.2 MGD in 2006
Source of wastewater treatment plant effluent The Fred Hervey Water Reclamation Plant produces reclaimed water for multiple uses, including golf course irrigation, industrial cooling water, and groundwater recharge. The indirect potable reuse project is called the Hueco Bolson Recharge Project.
Treatment process for producing recycled water for groundwater recharge
Secondary treatment combines conventional biological treatment with powdered active carbon process that provides organics removal, nitrification, and denitrification
High lime treatment for the removal of phosphorus and heavy metals
Sand filtration
Ozone disinfection
GAC filtration
Chlorination to prevent biological growth during storage and recharge
Method of blending recycled water with other water sources before groundwater recharge
Recycled water is not blended prior to groundwater recharge
Method of groundwater recharge Injection wells and an infiltration basin
Table 4-3. Singapore Public Utilities Technical Information
Treatment plant capacity and average flows Bedok and Kranji Water Factories have capacities of 11 MGD and 15 MGD, respectively. Both plants are undergoing expansion. Seletar and Ulu Pandan Water Factories have capacities of 6.3 MGD and 39 MGD, respectively. The newest facility, Changi, opened in 2010 with a capacity of 50 MGD.
Source of wastewater treatment plant effluent Secondary effluent at various water reclamation plants.
Treatment process for producing recycled water for groundwater recharge
Microfiltration, reverse osmosis, and UV disinfection.
Method of blending recycled water with other water sources before groundwater recharge
NEWater is blended with imported raw water, rainwater, and desalinated water before being discharged to the potable water reservoirs.
Method of groundwater recharge Not applicable.

December 2013 01830100.0000 5-1
Recycled Water Master Plan
Review of Water Reuse Programs
5 References
City of San Diego Water Reuse website: http://www.sandiego.gov/water/waterreuse/
Crook, James. Innovative Applications in Water Reuse and Desalination: Case Studies 2.
WateReuse Association: 2007.
Los Angeles Department of Water and Power Water Recycling website:
http://www.ladwp.com/ladwp/cms/ladwp001294.jsp
NEWater website: http://www.pub.gov.sg/water/newater/Pages/default.aspx
Orange County Water District’s Groundwater Replenishment Program website:
http://www.gwrsystem.com/
West Basin Municipal Water District’s Water Reliability 2020 website:
http://www.westbasin.org/water-reliability-2020

APPENDIX B
MAYOR AND COUNCIL WATER POLICIES


TABLE OF CONTENTSPAGE
I. DEFINITIONS ..................................................•...... 2
II. ASSUMPTIONS ...................................................•... 3
III. POLICIES ,...... 3
A. Finance .......................................................•. 3
1. Enterprise Basis 3
2. Water Rates and Charges .............................•....... 3
a. cost-of-service basis. . . . . . . . . . . . . . . . . . . . . . . . . . . . . . • . .. 3
b. water rate design elements " ...........•. , 4
3. System Development Requirements .......................•..... 5
4. Service Area Expansion ..................................•.... 6
5. Capital Improvements ...................................••... 6
B. Acquisitions 6
C. Water Supply, Management and Development ........•..•........... 7
1. Water Quality 7
2. Contingency Plans 8
3. Service Area Management 8
4. Non-Potable Water 9
5. Recharge 12
6. Wholesale Water Service 12
7. Design Standards 13
8. Avra Valley Land 13
9. Protection ofHydraulically-Connected Riparian Areas ...........•.. 14
a. identification of areas 14
b. drilling of new wells 14
c. operation and evaluation of existing wells .......•...... 15
d. preservation through conservation 15
D. Conservation 15
E. Policy Review Process 15
1

A. ADEQ
B. ADWR
C. AMA
D. Applicant
E. CAP
F. City
G. Cost of Service
H. CWAC
I. Effluent
J. EPA
K. GWMA
L. Hydraulically
Connected
Riparian Area
M. IGA
N. Non-potable water
O. Potable water
p. Reclaimed
Q. Utility
R. Water Provider
S. Tucson Water
Department
T. Tucson Water
Service Area
U. Waste water
V. Water revenue
W. Emergency
Supply
I. DEFINITIONS
Arizona Department of Environmental Quality
Arizona Department of Water Resources
Active Management Area
Owner, authorized representative, or corporation requesting service,
use and/or construction of Tucson Water facilities
Central Arizona Project
City of Tucson
Charges for water service shall be made in direct proportion
to the cost of securing, developing and delivering water
to the Utility's various customer classes.
Citizens' Water Advisory Committee
The product of a treatment plant, having received primary
and/or secondary treatment.
U.s. Environmental Protection Agency
1980 Groundwater Management Act
An aquatic or terrestrial ecosystem that relies,
at least in part, on subsurface water flows.
Intergovernmental Agreement
Water not fit for human consumption, such as effluent,
reclaimed water and untreated CAP water.
Water which meets EPA and ADEQ water drinking water standards
Effluent receiving post-secondary water treatment.
The Tucson Water Department
Private water companies, districts, or municipalities
that provide water service.
The City Of Tucson's municipally-owned water utility
The lands represented on the service area maps filed annually
with the Arizona Department of Water Resources
Water which carries waste to a treatment facility
through a conveyance system.
Revenue derived from the operations of Tucson Water.
A temporary water supply provided by Tucson Water
to local private water companies for equipment or system failures
and not for the purpose of resolving deficiencies in the system
requesting the emergency supply
2

II. ASSUMPTIONS
A. All financing shall be done in accordance with all city, stateand federal requirements.
B. To the extent that conservation programs succeed in reducing demand,capital improvement programs may be deferred and rate increasesadjusted accordingly.
III. POLICIESA. Finance
1. Enterprise Basis
a. The Utility shall be a self-supporting enterprise with all costs associatedwith the Utility to be funded from revenues derived from the sale of waterand other water-related income sources.
b. An annual average debt service coverage of 1.75 shall be maintained.
c. Revenues collected in excess of operating needs of the Utility shallbe carried forward for future capital bond funding requirementsand shall not be transferred to the City's General Fund.
d. The Utility shall maintain cash reserves adequate for known futureobligations plus an allowance for unbudgeted contingencies setat five percent (5%) of revenues from water sales.
e. Low-income water users living within the City may be supplieda minimum amount of water at reduced rates or other form of subsidizedwater service at the discretion of Mayor and Council. The cost of thissubsidy will be funded from the general fund of the City and not fromwater rates.
2. Water Rates and Charges
a. cost-of-service basis
(1) Insofar as possible charges for water utility service shall be madeon a cost-of-service basis.
(2) Marginal cost aspects of the water utility will be continually studiedby staff and considered as a factor in the making of rates.
3

(3) The substitution of effluent and reclaimed water for potable wateris an important element in achieving safe yield in the Tucson Basin.Rate setting for effluent shall be in accordance with the followingprecepts:
(a) charges for effluent and reclaimed water shall be basedon the cost of service whenever possible;
(b) to the extent that charges for effluent and reclaimed waterbased on cost of service do not provide an adequate priceincentive, the price of reclaimed water shall be basedon a market value which encourages its use;
(c) CWAC shall review and make recommendations and theMayor and Council shall hold a duly advertised publichearing prior to entering into any agreement to sell reclaimedwater to any customer at a rate other than that rate establishedby ordinance and contained in the Tucson Code.
(4) In the event that Tucson Water enters into contract with other waterproviders for treatment and delivery of CAP allocations, the Cityshall recover its total cost of providing this service.
b. water rate design elements
(1) Commodity charges shall reflect the costs of service across customerclasses and seasons, using rate structure features such as: seasonal rates;isolated areas service charge and reserve fund surcharge.
(2) Customers shall be charged for fixed and recurring costs of servicesuch as:
(a) new connections
(b) re-eonnections
(c) meter reading
(d) billing
(3) Rate structures shall be designed so as to encourage water conservationand to control peak demand.
(4) Water rates and charges shall be reviewed annually and changesin the rate structure shall be implemented so as to avoid suddenand large-scale shifts in water rates.
4

(5) Water rates for customers inside and outside the City limits shall bethe same within each customer class unless there is reasonablejustification based on cost-of-service rate differentials.
(6) The City shall provide an open process for determination of competitivewholesale water service rates. This process shall include formalparticipation by the governing bodies of other cities and towns withinwhich wholesale water service may occur.
(7) The City shall work cooperatively with wholesale water customersto develop rate structures which avoid excessive retail water rateincreases in any given year, with appropriate consideration for Citypolicy regarding full cost recovery.
(8) The City shall work cooperatively with wholesale water customersto establish rate structures which comply with Arizona CorporationCommission requirements.
(9) With regard to existing agreements for wholesale water service,the City will develop rates consistent with the provisionsof the agreements.
3. System Development Requirements
a. All costs of water system facilities necessary to serve a new applicant shallbe paid by that applicant.
b. A provision shall be made to refund that portion of the costs not directlyattributable to the development as follows:
(1) the cost differential of any oversizing of mains beyond whatis required for the applicant shall be refunded by Tucson Water; and
(2) properties not financially participating in the construction of certainTucson Water facilities shall be assessed a charge upon connection.Funds collected shall be reimbursed to the party that financed theoriginal facility installation. The charge shall be updated annuallyto reflect current construction costs.
c. Area-specific charges shall be assessed to developments within TucsonWater Service Area where significant capital investment for the importationand distribution of water solely to serve the specific area is required.
5

4. Service Area Expansion
a. The City shall not expand its water utility service area into areas notpresently served by other providers unless:
(1) Costs to existing rate-payers are considered;
(2) Water supply factors are considered; and
(3) Regional plans are considered.
5. Capital Improvements
a. Various combinations of revenue, general obligation bonds, tax-securedbonds and water revenues shall be used to finance water capitalimprovements.
b. Repayment of the bonds shall be made from water system revenues.
c. The type of bond financing to be used shall result in the least total costto rate-payers based on present value.
d. The term of repayment of debt shall not exceed the useful lifeof the improvement funded by such debt.
e. Capital requirements for relocations or other modifications to the watersystem required to accommodate other public works shall be derivedfrom sources other than the water utility.
f. Revenues accumulated in any reserve fund shall be set aside for specificpurposes, such as water augmentation or water quality projects.
B. Acquisitions
1. Systems Acquisitions
a. The City shall purchase other water delivery systems only if such purchaseis beneficial to the customers of Tucson Water. Delivery systems whosepurchase may contribute to the achievement of Tucson Water's aims should:
(1) possess water resources that might have a significant effect on waterquality, availability, and supply;
(2) be located adjacent to or near the Utility's existing service area; and
(3) not raise the cost of providing water to existing customersof the Utility.
6

b. The CWAC shall review all potential water system acquisitions and makerecommendations to the Mayor and Council.
c. Whenever Tucson Water supplies water to another water provider,the contract or agreement governing this transaction shall encouragethe water provider to implement a program that includes conservationincentives.
2. Water Rights Acquisitions & Sales
a. The City may purchase or sell grandfathered water rights or stored watercredits when the Mayor and Council determine the transaction is consistentwith short and long-term goals and policies of the City.
b. Water rights and stored water credits may be considered in pricenegotiations for reclaimed water and CAP water.
C. Water Supply, Management and Development
1. Water Quality
a. Tucson Water shall provide all customers water which is safe and palatable,and which meets all primary Federal and State standards, including thatall water shall:
(1) contain no substance naturally occurring or man-made in amountsthat exceed the maximum contaminant level established by the EPAlnterim Drinking Water Standards, the Arizona Department ofEnvironmental Quality or the Arizona Department of Health Services
(2) meet local standards to protect health and safety in the absenceof national or state standards
(3) contain no pathogens
(4) be tested for contaminants at representative locations throughoutthe distribution system as appropriate or required by regulatoryagencies to apprehend possible health, economic,or environmental threats
b. All non-potable water use shall be consistent with all local, state,and federal regulations.
7

c. Tucson Water shall be responsive and responsible to concerns regardingwater quality and will provide the public with timely and accurateinformation on matters relating to water quality issues.
d. Tucson Water will fund remediation of groundwater contaminationcommensurate with its responsibility for the problem.
2. Contingency Plans
a. The Utility shall develop and maintain contingency plans to manage awater loss, shortage, delivery interruption, contamination, severe landsubsidence or other water emergency. Any emergency demand reductionstrategy will not be based solely on an across-the-board-percentagereduction on historic, residential, commercial or industrial water usage.The emergency conservation measure shall focus on the reduction orelimination of water intensive uses that don't affect public health or safety.
b. Emergency water supplies shall be provided to local private watercompanies subject to Tucson Water's ability to meet the demandsof its customers.
3. Service Area Management
a. The City shall maintain the right of control of effluent in accordancewith adopted IGA's.
b. Tucson Water shall maintain a IOO-year assured water supply in accordancewith ADWR assured water supply rules.
c. The City shall encourage other water providers to participate financiallyin the regional management of water.
d. The City shall continue to work cooperatively with all potential CAP waterusers in Pima County and with all agencies of government to facilitateimplementation of the CAP in Pima County.
e. The City may enter into agreements to treat and deliver CAP water to otherwater providers to ensure that their CAP allocations are utilizedin the Tucson AMA.
f. The City shall cooperate fully with the ADWR to develop augmentationprograms that may include water importation and storage and/ or artificialgroundwater recharge.
g. Tucson Water shall cooperate in the planning and implementationof regional recharge programs.
8

h. The City shall continue to seek Tucson AMA wide groundwatermanagement through cooperation between water users and agenciesof government, including ADWR.
i. In considering funding projects which are sponsored by entities other thanthe Tucson Water Department, CWAC shall review the rate impacts andpolicy implications of participation in the project.
j. The City of Tucson shall strive to become the sole retail water providerwithin its corporate boundaries, as they may exist, now or in the future.
k. The City shall offer to negotiate intergovernmental agreements with othercities and towns governing the provision of new retail water service withinthe boundaries of those jurisdictions in order to clarify the relationshipamong the City, the other cities and towns and the affected retailcustomers.
I. Where legally and physically feasible, ownership and control of existingTucson Water retail service facilities within the boundaries of other citiesand towns shall be negotiated with those entities. The Cityshall work incooperation with those entities to determine fair market valueof the facilities.
4. Non-Potable Water
Priority shall be given to the development of treatment capacity and deliverysystems for non-potable water. Wherever possible, the use of non-potable waterin place of potable water shall be required for landscape irrigationand industrial uses.
a. The following shall be considered for potential uses of non-potable water:
(1) Landscape irrigation and industrial uses
(2) Direct recharge
(3) Agricultural irrigation and livestock watering
b. The following priorities, from highest to lowest, are establishedfor utilization of non-potable water:
(1) Direct use to replace an existing use of potable water
(2) Storage and recovery within the ar~a of hydrologic impact to replacean existing use of potable water
(3) Direct use to replace a new use of potable water
9

(4) Storage and recovery within the area of hydrologic impact to servea new use that otherwise would use potable water
(5) Storage and recovery outside the area of hydrologic impact to replaceeither an existing or a new use of potable water
c. Since contractual rights to the use of effluent may result in added value to auser's property, contracts shall recognize that possibility and requirewaiver by the owner of any such added value in the event of purchase orcondemnation of the property by the City through negotiation.
d. The City shall monitor effluent sales and deliveries by the Pima CountyWastewater Management Department to ensure compliance with the sewersystem transfer IGA and shall take steps to correct any failure to soconform when necessary.
e. The potential for using reclaimed water shall be evaluated and included inali new and existing water and land use plans.
f. Tucson Water shall actively work with new and existing large water users,including golf courses, parks, schools, cemeteries, industrial and multifamily complexes, to provide practical and economic service by thereclaimed water system.
g. New turf facilities and golf course development shall use effluent orreclaimed water for irrigation purposes.
h. Any conditions of interim use of potable water shall be made a part ofwater service agreements and other appropriate contracts to assure promptaction converting to the maximum use of effluent or reclaimed water forirrigation purposes. These conditions shall include, but not be limited to:
(1) the date by which the City is required to have its portion of the systemin place;
(2) requirements for financial participation by the developerin the construction of the project;
(3) penalties for non-compliance; and
(4) a surcharge equaling 50% of the potable water rate in addition to theregular rates and charges. This surcharge shall not apply when the
continued use of potable water is required solely due to deficienciesin the City's system or delays in City construction.
10

i. When private development requires reclaimed water service in advance ofthe City's construction schedule, developers shall work with Tucson Waterto formulate a plan of service to be implemented at the sole expense of thedeveloper with facilities to be dedicated to Tucson Water upon completion.
J. When funding is available, the City will finance or participate in theconstruction of reclaimed water pipelines in the Tucson Water service areato serve customers whose estimated reclaimed water usage is sufficient tojustify pipeline construction on the basis of economic feasibility.
k. effluent control (ICA)
(1) Effluent use shall be controlled as follows:
(a) The use of all effluent derived from water developed by the City,including the City's allocation of CAP water, shall be directlycontrolled by the City.
(b) Effluent from any County treatment plant derived from waterdeveloped by entities other than the City may be controlled by theCity on a case-by-case basis through contracts between the City andothers subject to applicable conditions to include:
i) conditions requested by Pima County in the development of theirwaste water systems that are consistent with the watermanagement plans and goals of the Tucson AMA.
ii) that the use of effluent shall reduce the amount of groundwaterwhich the other party could otherwise lawfully have pumped.
iii) that the terms of the contract shall be sufficient to amortizethe cost of system improvements.
(2) The City may only enter a contract with the County under the terms ofwhich the County would control the effluent under conditions mutuallyagreed upon, with no payment by the County to the City, except for
sharing net profits as provided in the Sewer Transfer ICA, when the City:
(a) is not using the effluent;
(b) has no plans to use the effluent;
(c) has no contract with another party for use of effluent;
(d) has no plans for entering into a contract with another for the useof the effluent;
(e) has no existing or proposed projects which could be negativelyimpacted.
11
5. Recharge
a. Groundwater recharge shall be used as a strategy for augmentingthe groundwater and for providing long-term operational flexibilityto Tucson Water's supply system.
b. Tucson Water shall develop demonstration projects as required to assessthe feasibility of recharging various water sources for operationaland long-term storage.
c. Tucson Water shall fully participate with other agencies to developprograms for water supply augmentation within the Tucson AMA.
d. The City may provide recharge water only to entities which have the legalauthority to store water.
6. Wholesale Water Service
a. Tucson Water shall offer to provide wholesale water service to other retailwater providers in the region.
b. Tucson Water shall offer both interruptible and non-interruptible waterservice to wholesale customers.
c. Tucson Water shall be responsible for delivering a specified flow rate at aspecified pressure range to the point of delivery to wholesale customers.
d. Each wholesale customer shall be responsible for all necessary storage andtransmission facilities beyond the point of wholesale delivery, unlessotherwise provided for in separately negotiated agreements.
e. Tucson Water shall be responsible for delivering wholesale water inaccordance with the primary water quality standards established pursuantto the Federal Safe Drinking Water Act (42 United States Code Sections300F et seq.) at the point of delivery to the retail water service provider.
f. Each wholesale customer shall be solely responsible for maintaining waterquality within its own retail water distribution system.
g. Tucson Water shall deliver to a wholesale customer only water which isnot debited against a City of Tucson groundwater account establishedby the Arizona Department of Water Resources.
h. Central Arizona Project water held under subcontract by any wholesalewater customer may be treated and directly delivered or may be storedunderground by Tucson Water on behalf of the wholesale customer.
i. Agreements to treat and deliver or to recharge wholesale customers' CAPwater shall be separately negotiated.
12

7. Design Standards
a. Tucson Water shall utilize its published design criteria for thedevelopment of all utility facilities, except when rezoning, neighborhoodplans, or other Mayor and Council actions set aesthetic standards for thearea that differ from Tucson Water's standard. In these cases, Tucson Watershall work with the City Planning Department, the developer and theneighborhood to design facilities that are consistent with the architecturaltheme or prevailing landscape type of the area.
8. Avra Valley Land
a. Ground water use, storage, and recovery
(1) No lands with appurtenant water rights shall be sold.
(2) City staff shall take all necessary actions to establish, maximize andpreserve water rights on lands.
(3) No users other than Tucson Water shall export any ground waterextracted from Tucson Water Avra Valley properties.
(4) Facilities to store and recover imported water may be constructedon Avra Valley lands.
(5) Imported water, including CAP and effluent, which is rechargedon Avra Valley lands, may be recovered within the areaof hydrologic impact.
b. Land use
(1) Land use shall:
(a) Benefit the Tucson Water Department rate payers
(b) Be consistent with all land use requirements and environmentalregulations
(c) Be undertaken only in conjunction with notice to adjoining propertyowners and/Or a public process to inform area residents of the use
(d) To the extent possible, preserve those lands having abundantvegetative cover in their natural state
(e) In conjunction with on-site construction, vegetation shall be replacedor restored as part of the project.
13

c. Leases
(1) Use shall include all economically reasonable water-saving designs,techniques and equipment.
(2) The quantity of water to be used as well as other non-monetary benefitsto Tucson Water rate payers shall be considered
(3) Any use shall result in reduction or elimination of the City'smaintenance costs.
(4) Use shall produce significant income to Tucson Water and/or value inexcess of the City's cost of contract administration benefiting TucsonWater rate payers.
(5) In flood-prone areas, uses shall conform to flood plain regulations.
(6) Lessees shall be responsible for all necessary licenses, permits and allapplicable fees and taxes.
(7) User shall be required to post a bond at the beginning of the leaseguaranteeing reclamation and revegetation of the land at lease
expiration.
(8) Where appropriate users shall be required in the lease to constructand/or maintain appropriate fencing.
(9) Leases shall contain provisions to protect against risk of environmentaldamage, including groundwater pollution.
(10) Where appropriate all users shall be required to construct and/ormaintain all necessary on-site flood control structures.
9. Protection of Hydraulically-Connected fuparian Areas
a. identification of areas
(1) the areas on the City's Environmental Resource Zone and Pima CountyFlood Control District maps shall be subject to the policies describedin this section.
b. drilling of new wells
(1) except under circumstances involving special conditions in which nohydrologic impacts can be identified, Tucson Water shall not drill anynew wells inside or within one (1) mile of designated hydraulicallyconnected riparian areas.
14
c. operation and evaluation of existing wells
(1) Tucson Water wells located inside or within one (1) mile of designatedhydraulically-connected riparian areas shall be operated so as topreserve these riparian areas
(2) the feasibility of CAP recharge inside or within one (1) mile ofdesignated hydraulically-connected riparian areas shall be evaluated.
d. preservation through conservation
(1) Tucson Water shall utilize conservation as a mechanism to reduce theneed for local pumping in areas having designated hydraulicallyconnected riparian habitats.
(2) Tucson Water shall work with private water companies and privatewell owners to develop conservation programs to reduce localgroundwater pumping in areas having designated hydraulicallyconnected riparian habitats.
D. Conservation
1. The City of Tucson is required to meet conservation targets as established by theArizona Department of Water Resources. Conservation program elements,such as public information and education, incentives and ordinances, will bedeveloped and implemented to achieve conservation targets.
2. The City of Tucson will "Lead by Example" by promoting water conservationand environmental aesthetics by applying the principles of Xeriscape to publicprojects and following adopted regulations.
E. Policy Review Process
1. Policies review
a. Mayor and Council policies shall be reviewed annually or more frequentlyas warranted.
2. Long-range plan
a. The long-range plan, including a comprehensive water conservationprogram, shall be annually reviewed and revised.
15


AUG4-10-379
August 4, 2010
Subject: Adoption of Tucson Water Service Area Policy
(City-Wide and Outside City)
Page: 1 of 3
Issue – Adoption of Tucson Water Service Area Policy as directed by the Governing Body at the
June 15, 2010, Study Session.
City Manager's Office Recommendation – The Mayor and Council is respectfully requested to
adopt the attached resolution establishing the refined Water Service Area policy.
Background – In December 2007, the City enacted an Interim Water Service policy that
restricted extension of water service to areas in which the City was legally obligated to serve.
That interim policy was intended to limit expansion of the water service area until the Mayor and
Council could adopt a rational policy integrating planning for water resources and growth.
Shortly thereafter, in the Spring of 2008 the Mayor and Council and the Pima County Board of
Supervisors created the City/County Water & Wastewater Study Committee, composed of
representatives of the Citizens’ Water Advisory Committee, the Pima County Regional
Wastewater Reclamation Advisory Committee, and the citizen planning committees from both
the City and the County. The City Manager and County Administrator proposed a scope of work
for the Study Committee that was subsequently refined to incorporate feedback from the Mayor
and Council and the Board of Supervisors.
The title of the overall study, the Water Infrastructure, Supply, and Planning Study, reflects its
purpose, to help the regional entities integrate planning for water resources and growth.
The Study Committee’s Phase 1 report was endorsed by the Mayor and Council in April 2009,
and its Phase 2 report endorsed by the Council in February 2010. These two reports examine the
water resources, system capacities, and growth issues impacting Tucson Water and the Pima
County Regional Wastewater Reclamation Department.
The Phase 2 Report recommended that the City maintain a water service area boundary but
consider expansions to the current obligated area based on a set of economic and environmental
factors. After discussing the Phase 2 report on February 17, 2010, the Council directed staff to
return within 45 days with proposed refinements to Tucson Water’s service area.
On April 13, 2010, staff brought forward a discussion of refinements to the Tucson Water
service area, and a proposed service area policy. The Mayor and Council directed that an
additional 30 days be provided to allow for more public input on the proposed policy.
The 30-day comment period resulted in a variety of feedback about the proposed service area
policy; a number of comments recommended that the service area be expanded more than was
MAYOR & COUNCIL COMMUNICATION

MAYOR AND COUNCIL COMMUNICATION
Adoption of Tucson Water Service Area Policy
(City-Wide and Outside City)
Page 2 of 3
proposed by staff, while other comments recommended a smaller service area than proposed by
staff.
On June 2, 2010, staff briefed the Citizens’ Water Advisory Committee (CWAC) on the
proposed Tucson Water Service Area Policy and discussed the comments received. After the
briefing and question and answer period, CWAC voted 8-0 (with one abstention) to support the
proposed Tucson Water Service Area Policy.
On June 15, 2010, staff provided all of the comments received during the 30 day period to the
Mayor and Council, and summarized the results. After the staff presentation, the Mayor and
Council concurred with staff’s recommended Service Area Policy and directed staff to return
with a resolution to formally adopt the policy. The Mayor and Council also directed that the
resolution include several related provisions, discussed below.
Present Considerations – The attached resolution incorporates the June 15th
motion from Council
Member Uhlich below, as amended, to adopt the proposed water service area policy and related
provisions, which the Mayor and Council passed by a vote of 7 to 0:
Council Member Uhlich moved to direct staff to return within 30 days with a
resolution for the adoption of the proposed Tucson Water Service Area Policy,
with the exception of the pink-shaded areas on the map abutting the Painted Hills
area in the Tucson Mountains. The resolution should formalize the policy and
include a review of the policy when the Water Checkbook Balance is updated.
The resolution should note the continuation of the existing appeals board to hear
appeals from property owners whose land is not within the approved expansion
area.
It was further moved that the resolution should direct staff to work with other
jurisdictions and water providers on comprehensive, collaborative water planning
recommendations by sub-regions, including the possibilities of wheeling and
water credit agreements. These discussions should include Metro Water, the
Pasqua Yaqui Tribe, Oro Valley, Marana, the Vail Water Company, Pima County,
the Tohono O’odham Nation and others. This direction coincides with
recommendation 3.1 and 3.2 in the comprehensive planning section of the
City/County Water and Wastewater Study.
Council Member Romero requested a friendly amendment to the motion, accepted
by the maker, to reference in the resolution the City’s continued policies for rain
water and gray water harvesting.
Staff notes that Exhibit A to the attached resolution is a service area map that generally depicts
the current Tucson Water service area as well as the current obligated area (e.g., within the City
limits or contracted service areas), and expansion areas (where agreement to annex into the City
may or may not be required, depending on the specific location). As explained in the resolution,
AUG4-10-379

MAYOR AND COUNCIL COMMUNICATION
Adoption of Tucson Water Service Area Policy
(City-Wide and Outside City)
Page 3 of 3
the Exhibit A map is for illustration only. Tucson Water will maintain a service area map of
record that is updated regularly to reflect both water service extensions as they occur as well as
approved annexations and pre-annexation agreements.
Finally, the Water Department’s existing administrative review procedures will remain in place.
In cases where the Water Department denies a water system extension and the applicant
administratively appeals that determination, a staff review committee composed of the City
Attorney, the Director of Housing and Community Development, and a representative of the City
Manager’s Office (currently, Nicole Ewing-Gavin) will continue to review the denial to assure
that the Water Department has followed the City’s adopted Water Service Area policy.
Financial Considerations – Adoption of the proposed Tucson Water Service Area will have no
immediate financial impact. Once adopted, the service area policy will establish planning
parameters related to system growth, which will facilitate Tucson Water’s long term
infrastructure planning and budgeting, as well as planning for long term water resource
requirements.
Legal Considerations – The attached resolution has been prepared by the City Attorney’s Office
to incorporate the Mayor and Council direction as discussed above.
Respectfully submitted,
for
Mike Letcher
City Manager
ML/jt/Jeff B. Biggs
Tucson Water Director
Attachment: Resolution
AUG4-10-379

APPENDIX C
EFFLUENT PROJECTIONS AND ENTITLEMENTS

Recycled Water Master Plan
Appendix C: Effluent Projections and Entitlements
December 2013
Imagine the result

NOTES TO READER:
Appendix C, entitled “Effluent Projections and Entitlements,” presents the details of how Tucson
Water’s effluent entitlements were projected through 2030 and extrapolated to 2050. The
Appendix also presents the details of how the availability of unutilized recycled water would vary
annually based on seasonal demands within the Tucson Water Reclaimed Water System and
other reclaimed water uses.
The initial effluent entitlement projections were completed in October 2011 and were based on
the most recent “official” regional wastewater flow projections prepared by Pima County
Regional Wastewater Reclamation Department in 2006 and 2008. No further wastewater flow
projections have been made by Pima County since that time. The wastewater flow projections
were compared to actual 2010 wastewater flows to determine a range of entitlement projections
for use in the Recycled Water Master Plan evaluations. To facilitate completion of the Recycled
Water Master Plan report, the actual wastewater flows presented in the Appendix were not
updated to include data through 2012.
The Recycled Water Master Plan report does, however (in Chapters 4 and 5), present updated
wastewater flows and effluent entitlements through 2012 and discusses how the range of
entitlements presented in the Appendix does account for the observed recent decreasing trends
in wastewater flows and effluent entitlements. Based on the updated comparison, the Recycled
Water Master Plan report also provides justification for use of the range of effluent entitlement
projections presented in the Appendix.

December 2013 01830100.0000 i
Table of Contents
1 Introduction 1-1
2 Wastewater Flow Projections 2-1
3 Effluent Entitlement Projections 3-1
4 Tucson Water Effluent Entitlement Projections 4-1
5 Effluent Availability for Other Recycled Water Programs 5-1
5.1 Seasonal Distribution of Effluent Entitlement Usage 5-1
5.2 Reclaimed Water Demand Projections 5-2
5.3 Projections of Effluent Entitlements Available for other Recycled Water Programs 5-3
6 References 6-1
Tables
Table 2-1. Wastewater Flow Projections 2-3
Table 3-1. Projected Wastewater Flows and Effluent Entitlements 3-1
Table 5-1. Reclaimed Water Demand Projections 5-3
Table 5-2. Summary of Unutilized Effluent Entitlements Available for Other Recycled Water Programs 5-6

December 2013 01830100.0000 ii
Table of Contents
Figures
Figure 2-1. Existing and Planned PCRWRD WRFs ....................................................................................... 2-2
Figure 2-2. Comparison of Historic and Projected Wastewater Flows ............................................................. 2-4
Figure 4-1. Tucson Water’s Effluent Entitlement Projections .......................................................................... 4-1
Figure 5-1. 2010 Seasonal Distribution of Recycled Water Resources ............................................................ 5-2
Figure 5-2. 2020 Seasonal Distribution of Recycled Water Resources ............................................................ 5-4
Figure 5-3. 2030 Seasonal Distribution of Recycled Water Resources ............................................................ 5-5
Figure 5-4. 2050 Seasonal Distribution of Recycled Water Resources ............................................................ 5-6
Attachments
A. Effluent Flow and Entitlement Projections

December 2013 01830100.0000 1-1
Recycled Water Master Plan
Effluent Projections and
Entitlements
1 Introduction
This technical memorandum describes the projection of Tucson Water’s recycled water
entitlement through 2030 (and extrapolated to 2050). In Chapter 3 of the Recycled Water Master
Plan, the principal agreements between Tucson Water, Pima County, and several other local
communities were described that form the basis for water and wastewater management in the
Tucson area for the next thirty years. The agreements, or series of intergovernmental agreements
(IGAs), specify how the wastewater that is generated within the Tucson Water service area would
be apportioned into effluent entitlements for each entity. The entitlements that remain after all
entities have received their allocations, and after Tucson Water has satisfied its reclaimed water
demands, are currently discharged to the Santa Cruz River. An objective of the Recycled Water
Master Plan is to investigate how the effluent entitlements currently being discharged can be put
to beneficial use via groundwater replenishment and eventual recovery of the water to supplement
future drinking water supplies.
Updated projections of wastewater generation through 2030 were developed in consultation with
the Pima County Regional Wastewater Reclamation Department (PCRWRD). The updated
projections were based on population growth projections and assumptions regarding per capita
potable water usage, sewer return flow rates, septic tank usage, and so on. Projections of effluent
entitlements were then developed based the apportionments specified in the IGAs. Finally, the
portion of Tucson Water’s effluent entitlements that could be available for a future recycled water
program (e.g., groundwater replenishment) was determined by considering existing and future
demands in the Reclaimed Water System (RWS), as well as other existing consumptive uses of
reclaimed water.

December 2013 01830100.0000 2-1
Recycled Water Master Plan
Effluent Projections and
Entitlements
2 Wastewater Flow Projections
Wastewater flow projections were updated based on consultation with the PCRWRD and Tucson
Water. The most recent wastewater flow projections for the region are contained within the
following regional planning efforts:
The 2006 PCRWRD Facility Plan Update contains projections based on the Pima
Association of Governments (PAG) traffic analysis zone (TAZ) population data from 2005
(Brown and Caldwell, 2006).
A November 29, 2005 joint memorandum between Pima County and Tucson Water that
developed common population and wastewater flow projections for regional planning
purposes (reference). Both entities agreed to develop projections based on the PAG TAZ
population data (2005 dataset), a common per capita wastewater generation rate (85
gpcd), and common assumptions of sewered and unsewered populations.
Similar to the 2006 Facility Plan Update, the 2007 PCWRD Regional Optimization
Master Plan (ROMP) utilized updated wastewater flow projections for regional treatment
facility capacity evaluations (Greeley and Hanson, 2007). The projections for the
“metropolitan” treatment facilities in ROMP are identical to those developed in the 2006
Facility Plan Update. The projections for the “outlying” treatment facilities were
developed based on the November 29, 2005 joint memorandum assumptions.
PCRWRD develops wastewater flow projections for areas served by metropolitan treatment
facilities, outlying treatment facilities, and for undeveloped areas. The metropolitan facilities
include: Roger Road Wastewater Reclamation Facility (WRF) which is now called the Water
Campus, Ina Road WRF, and Randolph Park WRF. The outlying facilities include Avra Valley
WRF, Marana WRF, Corona de Tucson WRF, Green Valley WRF, and Mt. Lemmon WRF. The
undeveloped areas include Southlands and the Southeast Area. Since the Southeast Area is
tributary to the metropolitan facilities, flows for this area were not projected separately, but are
included in the metropolitan facility projections. Figure 2-1 shows the locations of the metropolitan,
outlying, and planned facilities.
The location of the planned Southlands WRF is based on the Verano Offsite Sewer Basin Study
(Westland Resources, Inc., 2009). The location of the planned Southeast Area WRF is based on
the Southeast Area Sub-regional Wastewater Reclamation Study (Pirnie/ARCADIS, 2011). Table
2-1 shows the most recent wastewater flow projections for the region that were utilized to project
Tucson Water effluent entitlements. The flow projections for the metropolitan facilities are from the

December 2013 01830100.0000 2-2
Recycled Water Master Plan
Effluent Projections and
Entitlements
Figure 2-1. Existing and Planned PCRWRD WRFs
2006 Facility Plan Update, while the flow projections for Southlands and the outlying facilities
are from the 2007 ROMP.
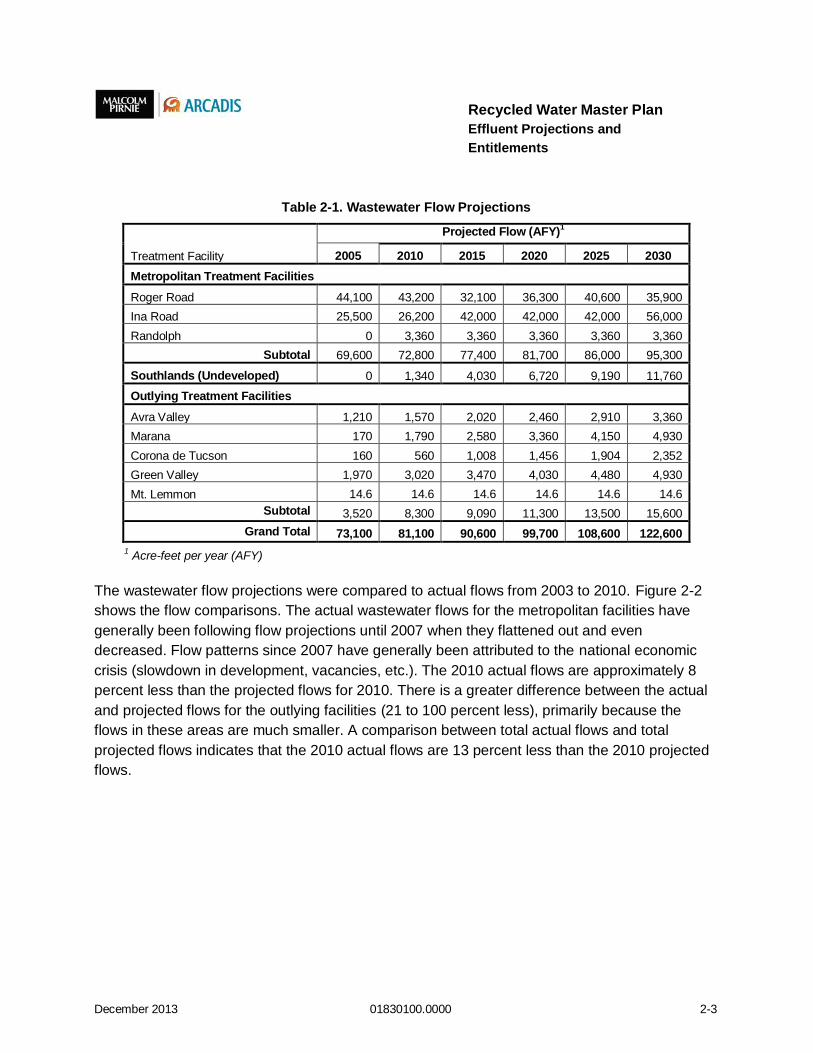
December 2013 01830100.0000 2-3
Recycled Water Master Plan
Effluent Projections and
Entitlements
Table 2-1. Wastewater Flow Projections
Treatment Facility
Projected Flow (AFY)1
2005 2010 2015 2020 2025 2030
Metropolitan Treatment Facilities
Roger Road 44,100 43,200 32,100 36,300 40,600 35,900
Ina Road 25,500 26,200 42,000 42,000 42,000 56,000
Randolph 0 3,360 3,360 3,360 3,360 3,360
Subtotal 69,600 72,800 77,400 81,700 86,000 95,300
Southlands (Undeveloped) 0 1,340 4,030 6,720 9,190 11,760
Outlying Treatment Facilities
Avra Valley 1,210 1,570 2,020 2,460 2,910 3,360
Marana 170 1,790 2,580 3,360 4,150 4,930
Corona de Tucson 160 560 1,008 1,456 1,904 2,352
Green Valley 1,970 3,020 3,470 4,030 4,480 4,930
Mt. Lemmon 14.6 14.6 14.6 14.6 14.6 14.6
Subtotal 3,520 8,300 9,090 11,300 13,500 15,600
Grand Total 73,100 81,100 90,600 99,700 108,600 122,600
1 Acre-feet per year (AFY)
The wastewater flow projections were compared to actual flows from 2003 to 2010. Figure 2-2
shows the flow comparisons. The actual wastewater flows for the metropolitan facilities have
generally been following flow projections until 2007 when they flattened out and even
decreased. Flow patterns since 2007 have generally been attributed to the national economic
crisis (slowdown in development, vacancies, etc.). The 2010 actual flows are approximately 8
percent less than the projected flows for 2010. There is a greater difference between the actual
and projected flows for the outlying facilities (21 to 100 percent less), primarily because the
flows in these areas are much smaller. A comparison between total actual flows and total
projected flows indicates that the 2010 actual flows are 13 percent less than the 2010 projected
flows.

December 2013 01830100.0000 2-4
Recycled Water Master Plan
Effluent Projections and
Entitlements
Figure 2-2. Comparison of Historic and Projected Wastewater Flows
Given the uncertainty in the assumptions and basis for the flow projections and the
continued impacts of the economy, a range of wastewater flow projections was
developed for purposes of the Recycled Water Master Plan evaluations:
A “High” range based on the most recent regional wastewater flow
projections.
Based on the comparison of actual and projected wastewater flows, a “Low”
range based on 90 percent of the regional wastewater flow projections.
0
25,000
50,000
75,000
100,000
125,000
2000 2005 2010 2015 2020 2025 2030
Wa
ste
wa
ter
Flo
ws
(A
FY
)
Total Historic Total Projected
Metropolitan Facilities Historic Metropolitan Facilities Projected
Southlands & Outlying Facilities Historic Southlands & Outlying Facilities Projected

December 2013 01830100.0000 3-1
Recycled Water Master Plan
Effluent Projections and
Entitlements
3 Effluent Entitlement Projections
The series of IGAs between Tucson Water, the County, and several other local entities specify
how the wastewater that is generated within the Tucson Water service area is to be apportioned
into effluent entitlements for each entity. The IGAs are described in Chapter 3 of the Recycled
Water Master Plan. The key agreements and stipulations that formed the basis of effluent
entitlement projections herein are listed below:
The City of Tucson and Pima County 1979 IGA transferred the City’s sewer system to the
County and allocated 90 percent of the effluent generated from metropolitan facilities to the
City and 10 percent to the County (City of Tucson and Pima County, 1979).
In 1983, the Southern Arizona Water Rights Settlement Act (SAWRSA) resolved litigation
between the City and the Tohono O’Odham Nation by delegating 28,200 AFY of the City’s
annual effluent entitlement to the Secretary of Interior to hold for the benefit of the Nation
(SAWRSA, 1983). The SAWRSA effluent is deducted from the total effluent prior to
calculating the entitlements for the City, County, and other water providers.
The City of Tucson and Pima County 2000 Supplemental IGA defined the metropolitan
and non-metropolitan facilities and stipulated that up to 10,000 AFY of effluent known as
the Conservation Effluent Pool (CEP) shall be made available for riparian projects that are
a part of a habitat conservation plan, or that are mutually agreed upon by the City and
County (City of Tucson and Pima County, 2000). Similar to SAWRSA, the CEP effluent is
deducted from the total effluent prior to calculating the entitlements for the City, County,
and other water providers. To date, none of the CEP has been designated for any projects.
The City of Tucson and Pima County 2003 Wheeling IGA was related to treatment of the
County’s effluent and delivery of reclaimed water to the County through the City’s RWS
(City of Tucson and Pima County, 2003). Based on the 2000 Supplemental IGA and the
2003 Wheeling Agreement, effluent generated at outlying facilities belongs to the County
up to the capacities of the facilities as of March 14, 2000. Any future effluent produced that
is greater than the March 14, 2000 capacities is split between City and County, 90 percent
and 10 percent, respectively.
The City of Tucson and Town of Oro Valley 2001 IGA established relationships between
the City and Oro Valley regarding effluent derived from the Oro Valley service area (City of
Tucson and Town of Oro Valley, 2001). This IGA established the Effluent Allocation
Formula that reflects the water provider’s control of the effluent generated from within its

December 2013 01830100.0000 3-2
Recycled Water Master Plan
Effluent Projections and
Entitlements
water service area. The Effluent Allocation Formula has since been used in all IGAs
between the City and other water providers.
The City of Tucson and Metropolitan Domestic Water Improvement District (MDWID) 2001
IGA established relationships between the City and MDWID regarding effluent derived
from the MDWID service area (City of Tucson and Metropolitan Domestic Water
Improvement District, 2001).
The City of Tucson and Flowing Wells Irrigation District (FWID) 2009 IGA established
relationships between the City and FWID regarding effluent derived from the FWID service
area (City of Tucson and Flowing Wells Irrigation District, 2009).
The City of Tucson and Spanish Trail 2009 IGA established relationships between the City
and Spanish Trail regarding effluent derived from the Spanish Trail service area (City of
Tucson and Spanish Trail, 2009).
Tucson Water’s share of effluent influent to the metropolitan facilities is allotted to the other water
providers (MDWID, Oro Valley, FWID, and Spanish Trail) based on wastewater contributions from
their service areas, and after their share of contributions to SAWRSA, CEP, and Pima County
effluent. The water providers’ projected wastewater contributions are based on their projected
non-turf potable water deliveries within their service areas, and an agreed upon water to
wastewater factor (0.62 of non-turf potable water deliveries become wastewater). Contributions to
SAWRSA, CEP, and Pima County are based on the water providers’ pro rata contribution of
wastewater to total wastewater influent to the metropolitan facilities.
A final consideration is that effluent production must account for losses within the facility treatment
processes (solids, sludge, evaporation, etc.). Based on data from 2003 to 2010, facility losses
have ranged from 1 to 6 percent for the metropolitan facilities. Treatment process losses at the
outlying facilities should be similar due to similar treatment processes. The flow-weighted average
plant loss for the metropolitan facilities from 2003 to 2010 was 3.4 percent. Based on the data, a
single plant loss factor of 5 percent of influent flows was assumed for the effluent entitlement
projections herein.
Table 3-1 summarizes the projected effluent entitlements for the Low and High range wastewater
flow projections through 2030. Actual wastewater flows are shown for 2010. The resulting Tucson
Water effluent entitlements are shown for two cases: 1) the full CEP is utilized for non-Tucson
Water uses (Without CEP), and 2) the full CEP is not utilized for non-Tucson Water uses and the
CEP is reverted back to the contributing entities (With CEP). The detailed calculations for the
wastewater flow and effluent entitlement projections are provided in Attachment A.

December 2013 01830100.0000 3-1
Table 3-1. Projected Wastewater Flows and Effluent Entitlements
Flows / Entitlements (AFY)
20101 2015 2020 2025 2030
Actual Flows
Low Range
High Range
Low Range
High Range
Low Range
High Range
Low Range
High Range
Metropolitan Facilities Total Effluent Production2 63,700 66,200 73,600 69,800 77,600 73,500 81,700 81,500 90,500
SAWRSA Allotment 28,200 28,200 28,200 28,200 28,200 28,200 28,200 28,200 28,200
CEP Allotment 10,000 10,000 10,000 10,000 10,000 10,000 10,000 10,000 10,000
Tucson Water Entitlement 19,200 20,600 26,600 23,200 29,500 25,400 32,100 31,000 38,400
Pima County Entitlement 2,550 2,800 3,540 3,160 3,940 3,530 4,350 4,330 5,230
Oro Valley Entitlement 1,490 1,910 2,170 2,310 2,590 2,930 3,250 3,850 4,200
MDWID Entitlement 1,740 2,170 2,460 2,460 2,760 2,850 3,160 3,450 3,760
FWID Entitlement 441 467 531 500 560 530 587 586 638
Spanish Trail Entitlement 34 36 41 39 43 41 45 45 49
Southlands WRF Effluent Production2 0 3,450 3,830 5,750 6,390 7,850 8,730 10,060 11,170
Tucson Water Entitlement 0 3,100 3,450 5,170 5,750 7,070 7,850 9,050 10,060
Pima County Entitlement 0 350 380 580 640 790 870 1,010 1,120
Outlying Facilities Total Effluent Production2 399 4,100 4,960 6,010 7,090 7,830 9,110 9,650 11,130
Tucson Water Entitlement 359 3,690 4,460 5,410 6,380 7,050 8,200 8,690 10,020
Pima County Entitlement 40 410 496 601 709 783 911 965 1,113
Total Tucson Water Entitlement (Without CEP) 19,600 27,400 34,500 33,700 41,600 39,500 48,100 48,700 58,500
Tucson Water CEP Contribution 7,380 7,180 7,370 7,140 7,320 7,000 7,200 6,960 7,170
Total Tucson Water Entitlement (With CEP) 26,900 34,600 41,900 40,900 49,000 46,500 55,300 55,700 65,700
1 Actual flows are used for 2010.
2 Influent flows less 5% for treatment plant losses.

December 2013 01830100.0000 4-1
Recycled Water Master Plan
Effluent Projections and
Entitlements
4 Tucson Water Effluent Entitlement Projections
All Recycled Water Master Plan evaluations are based on wastewater flow and effluent
entitlement projections through 2030. For the purposes of the Tucson Water 2012 Update to
Water Plan: 2000-2050, wastewater flow and effluent entitlement projections were extrapolated to
2050. The extrapolation to 2050 was developed based on the shape of the potable water demand
projections curve through 2050 (Tucson Water Resource Planning Tool, February 2010).
Attachment A includes the extrapolation information.
Figure 4-1 shows the projected Tucson Water effluent entitlements, extrapolated through 2050.
Considering the High and Low range wastewater flow projections, Tucson Water would have
access to between 28,000 and 42,000 AFY of effluent entitlement in 2015, increasing to between
49,000 and 66,000 AFY in 2030, depending on actual utilization of the City’s contribution to the
CEP. In 2050, Tucson Water would have access to between 58,000 and 78,000 AFY.
Figure 4-1. Tucson Water’s Effluent Entitlement Projections
0
20,000
40,000
60,000
80,000
2010 2015 2020 2025 2030 2035 2040 2045 2050
Tu
cso
n W
ate
r E
fflu
en
t E
nti
tlem
en
ts
(AF
Y)
Without CEP High Range Without CEP Low Range
With CEP High Range With CEP Low Range

December 2013 01830100.0000 5-1
Recycled Water Master Plan
Effluent Projections and
Entitlements
5 Effluent Availability for Other Recycled Water Programs
The previous analyses provided projected effluent entitlements on an annual average basis, and
included all entitlements available for any recycled water program purpose, including delivering to
reclaimed water customers. In order to determine how much of the projected entitlements might
be available for other purposes, such as a groundwater replenishment program, the RWS
demands and other existing consumptive uses of reclaimed water must be factored out. Also, the
seasonal nature of RWS demands and other consumptive uses must be considered in order to
determine how the excess effluent entitlements might be available on a seasonal basis. The
seasonal availability of unused entitlements would form the flow basis for sizing and evaluating
recharge, treatment and recovery facilities that might form a groundwater replenishment program
for instance. The effluent availability for other recycled water programs was determined as follows:
Only projected entitlements from the metropolitan facilities were considered since the
majority of Tucson Water’s entitlement is from these facilities. The entitlements from the
outlying facilities would be managed separately.
The seasonal distribution of effluent available for other recycled water programs was
determined by evaluating the 2010 Tucson Water effluent entitlements, RWS deliveries,
and other consumptive uses of reclaimed water during the year.
Projected demands for the RWS were determined based on information provided by
Tucson Water.
The effluent entitlement projections, seasonal distribution of effluent availability, and
RWS demand projections were combined to develop projections of seasonal effluent
availability for other recycled water programs.
5.1 Seasonal Distribution of Effluent Entitlement Usage
Figure 5-1 shows the 2010 distribution of recycled water resources, including Tucson Water’s
effluent entitlement, total reclaimed water deliveries, and consumptive uses of recycled water. The
effluent entitlement that is not utilized could be available for other recycled water programs. The
existing consumptive uses of reclaimed water include the Sweetwater Wetlands (750 AFY), flow to
maintain the mound at the Sweetwater Underground Storage and Recovery (US&R) facility (300
AFY), and the Silverbell Golf Course (152 AFY). The consumptive uses are assumed to stay
constant throughout the planning horizon. The 2010 seasonal demand curve for the RWS was
also assumed to stay constant throughout the planning period. The shape of the 2010 seasonal

December 2013 01830100.0000 5-2
Recycled Water Master Plan
Effluent Projections and
Entitlements
Figure 5-1. 2010 Seasonal Distribution of Recycled Water Resources
RWS demand curve was applied to the reclaimed water demand projections throughout the
planning horizon. The RWS demand projections are discussed in the following section.
5.2 Reclaimed Water Demand Projections
Table 5-1 summarizes Tucson Water’s reclaimed water demand projections. Reclaimed water
demand through 2016 is based on fiscal year 2012 financial and rate projections provided by
Tucson Water Financial Services. For 2020, the demand increases by 800 AFY to account for the
new University of Arizona Bio5 Institute golf course. Beyond 2020, reclaimed water demand
increases by 500 AFY every five years based on historic new connections to the RWS. The
reclaimed water demand projections include deliveries to the service areas of Tucson Water,
University of Arizona, Davis Monthan AFB, and FWID. Deliveries to Oro Valley, MDWID, and the
County are not included in the Tucson Water reclaimed water demand projections.
0
500
1,000
1,500
2,000
2,500
Jan Feb March April May June July Aug Sept Oct Nov Dec
Flo
w (
AF
)
Tucson Water Metropolitan Effluent Entitlement Total RWS Deliveries
Sweetwater Wetlands Sweetwater Mound
Silverbell Golf Course Effluent Available for Other Programs

December 2013 01830100.0000 5-3
Recycled Water Master Plan
Effluent Projections and
Entitlements
Table 5-1. Reclaimed Water Demand Projections
Projected Demand (AFY)
2010 2015 2020 2025 2030 2040 2050
Tucson Water RWS Deliveries 12,500 13,060 13,860 14,360 14,860 15,360 15,860
5.3 Projections of Effluent Entitlements Available for other Recycled Water Programs
A range of projections of seasonal availability of effluent entitlements for other recycled water
programs was developed as follows:
Low Range: based on 90 percent of the most recent wastewater flow projections, and
the assumption that the full CEP is utilized for non-Tucson Water uses.
High Range: based on 100 percent of the most recent wastewater flow projections, and
the assumption that the full CEP is not utilized for non-Tucson Water uses and Tucson
Water’s CEP contribution is reverted back to Tucson Water.
Figures 5-2, 5-3, and 5-4 illustrate the projections of monthly distribution of recycled water
resources for 2020, 2030, and 2050, respectively. The figures indicate the minimum and
maximum month availability of Tucson Water’s unutilized effluent entitlements for each time
period.
Table 5-2 summarizes Tucson Water’s unutilized effluent entitlements that could be available for
other recycled water programs, also for 2020, 2030 and 2050. The table summarizes the minimum
and maximum month availability of unutilized effluent entitlements for each time interval, as well
as the annual totals. Attachment A contains detailed calculations for the distribution of recycled
water resources.

December 2013 01830100.0000 5-4
Recycled Water Master Plan
Effluent Projections and
Entitlements
Figure 5-2. 2020 Seasonal Distribution of Recycled Water Resources
0
1,000
2,000
3,000
4,000
5,000
Jan Feb March April May June July Aug Sept Oct Nov Dec
Flo
w (
AF
)
High Tucson Water Entitlement Low Tucson Water Entitlement
High Entitlement for Other Programs Low Entitlement for Other Programs
Max Month – High
2,770 AF
(32 mgd)
Max Month – Low
1,630 AF
(19 mgd)
Min Month – High
732 AF (8 mgd)
Min Month – Low
0 AF (0 mgd)

December 2013 01830100.0000 5-5
Recycled Water Master Plan
Effluent Projections and
Entitlements
Figure 5-3. 2030 Seasonal Distribution of Recycled Water Resources
0
1,000
2,000
3,000
4,000
5,000
Jan Feb March April May June July Aug Sept Oct Nov Dec
Flo
w (
AF
)
High Tucson Water Entitlement Low Tucson Water Entitlement
High Entitlement for Other Programs Low Entitlement for Other Programs
Max Month – High
3,490 AF
(41 mgd)
Max Month – Low
2,270 AF
(26 mgd)
Min Month – High
1,310 AF
(14 mgd)
Min Month – Low
88 AF (1 mgd)

December 2013 01830100.0000 5-6
Recycled Water Master Plan
Effluent Projections and
Entitlements
Figure 5-4. 2050 Seasonal Distribution of Recycled Water Resources
Table 5-2. Summary of Unutilized Effluent Entitlements Available for Other Recycled Water Programs
Available
2020 2030 2050
Low Range High Range Low Range High Range Low Range High Range
Minimum Month 0 AF
(0 MGD) 732 AF
(8 MGD) 88 AF
(1 MGD) 1,310 AF (14 MGD)
416 AF (5 MGD)
1,860 AF (20 MGD)
Maximum Month 1,630 AF (19 MGD)
2,770 AF (32 MGD)
2,270 AF (26 MGD)
3,490 AF (41 MGD)
2,740 AF (32 MGD)
4,190 AF (49 MGD)
Annual Total 7,890 AF/YR
(7 MGD)
21,600 AF/YR
(19 MGD)
14,700 AF/YR
(13 MGD)
29,300 AF/YR
(26 MGD)
19,500 AF/YR
(17 MGD)
36,900 AF/YR
(33 MGD)
0
1,000
2,000
3,000
4,000
5,000
Jan Feb March April May June July Aug Sept Oct Nov Dec
Flo
w (
AF
)
High Tucson Water Entitlement Low Tucson Water Entitlement
High Entitlement for Other Programs Low Entitlement for Other Programs
Max Month – High
4,190 AF
(49 mgd)
Max Month – Low
2,740 AF
(32 mgd)
Min Month – High
1,860 AF
(20 mgd)
Min Month – Low
416 AF (5 mgd)

December 2013 01830100.0000 6-1
Recycled Water Master Plan
Effluent Projections and
Entitlements
6 References
Brown and Caldwell. Metropolitan Area Facility Plan Update. Pima County Regional Wastewater
Reclamation Department. February 2006.
City of Tucson and Flowing Wells Irrigation District. Intergovernmental Agreement with the Flowing
Wells Irrigation District Relating to Effluent. December 7, 2009.
City of Tucson and Metropolitan Domestic Water Improvement District. Intergovernmental
Agreement Relating to Effluent. June 11, 2001.
City of Tucson and Pima County. Intergovernmental Agreement with Pima County Providing for
the Transfer of the City Sewerage System and for the Disposition of Treated and
Reclaimed Water. June 26, 1979.
City of Tucson and Pima County. Supplemental Intergovernmental Agreement RE: Effluent.
February 7, 2000.
City of Tucson and Pima County. Intergovernmental Agreement between the City of Tucson and
Pima County for Treating Effluent and Wheeling Reclaimed Water. December 8, 2003.
City of Tucson and Pima County Joint Planning Group – Population and Effluent Projections.
Resolution of Population and Effluent Variances between the Tucson Water and Pima
County Wastewater Management Long-Range Plans. November 29, 2005.
City of Tucson and Spanish Trail. Intergovernmental Agreement with the Spanish Trail Water
Company Relating to Effluent. December 7, 2009.
City of Tucson and Town of Oro Valley. Intergovernmental Settlement Agreement with the Town
of Oro Valley Regarding Potable Water and Effluent. November 5, 2001.
Greeley and Hanson. Regional Optimization Master Plan. Pima County Regional Wastewater
Reclamation Department. November 2007.
Malcolm Pirnie/ARCADIS. Southeast Area Sub-regional Wastewater Reclamation Facility Site
Study. Pima County Regional Wastewater Reclamation Department. August 2011.
Tucson Water. 2012 Update to Water Plan: 2000-2050. 2012.

December 2013 01830100.0000 6-2
Recycled Water Master Plan
Effluent Projections and
Entitlements
Southern Arizona Water Rights Settlement Act. 1983.
WestLand Resources, Inc. Verano Offsite Sewer Basin Study. South Wilmot Land Investors, LLC.
August 2009.
ATTACHMENT A
EFFLUENT FLOW AND ENTITLEMENT PROJECTIONS

Low Range Wastewater Flow Projections
December 2013 01830100.0000 Page 1 of 11
2010 2015 2020 2025 2030Roger Road1 35,279 28,863 32,684 36,535 32,311Ina Road1 28,982 37,805 37,805 37,805 50,406Randolph1 2,739 3,024 3,024 3,024 3,024Metro Subtotal 67,000 69,692 73,513 77,364 85,741Southlands2 0 3,629 6,049 8,267 10,585Avra Valley2 1,236 1,815 2,218 2,621 3,024Marana2 292 2,319 3,024 3,730 4,436Corona de Tucson2 284 907 1,311 1,714 2,117Green Valley2 2,065 3,125 3,629 4,033 4,436Mt. Lemmon2 3.5 13.1 13.1 13.1 13.1Outlying Facilities Subtotal 3,881 11,808 16,244 20,377 24,611Total 70,881 81,500 89,757 97,741 110,353Source:1. 2006 Facility Plan Update2. 2007 Regional Optimization Master Plan
MGD acre-ft/yrAvra Valley 1.2 1,344Marana 0.023 26Corona de Tucson 0.117 131
Green Valley 2 2,352Mt. Lemmon 0.013 14.6
2010 2015 2020 2025 2030Avra Valley 0 470 874 1,277 1,680Marana 267 2,293 2,999 3,704 4,410Corona de Tucson 153 776 1,180 1,583 1,986Green Valley 0 773 1,277 1,680 2,083Mt. Lemmon 0 0 0 0 0Total 420 4,313 6,329 8,244 10,160
2006 Facility Plan Update
2006 Facility Plan Update and 1999 Green Valley Wastewater Treatment Facility Upgrade and BNROD Project Technical Design Report2006 Facility Plan Update
Non-Metropolitan WRFs - Flow Available to COT after 2000 (acre-ft/yr)
2006 Facility Plan Update
90% Wastewater Flow Projections (acre-ft/yr)
Non-Metropolitan WRFs - Treatment Capacity as of 2000 Source
2006 Facility Plan Update

Low Range Wastewater Flow Projections
December 2013 01830100.0000 Page 2 of 11
2010 2015 2020 2025 2030Roger Road 35,279 28,863 32,684 36,535 32,311Ina Road 28,982 37,805 37,805 37,805 50,406Randolph 2,739 3,024 3,024 3,024 3,024Subtotal 67,000 69,692 73,513 77,364 85,741WRF losses (5%) 3,350 3,485 3,676 3,868 4,287SAWRSA 28,200 28,200 28,200 28,200 28,200CEP 10,000 10,000 10,000 10,000 10,000Tucson 22,905 25,207 28,473 31,766 38,929Pima County 2,545 2,801 3,164 3,530 4,325Southlands 0 3,629 6,049 8,267 10,585WRF losses (5%) 0 181 302 413 529Tucson 0 3,103 5,172 7,068 9,050Pima County 0 345 575 785 1,006Outlying Facilities Subtotal 420 4,313 6,329 8,244 10,160WRF losses (5%) 21 216 316 412 508Tucson 359 3,687 5,411 7,049 8,687Pima County 40 410 601 783 965
Effluent Entitlement Projections with WRF Losses (acre-ft/yr)

Low Range Effluent Entitlement Calculations
December 2013 01830100.0000 Page 3 of 11
Effluent entitlement calculations are based on the Effluent Allocation Formula that is outlined in the 2001 City of Tucson and Metropolitan Domestic Water Improvement District Intergovernmental Agreement
Constants0.960.62
2010 2015 2020 2025 2030Oro Valley1 6,946 8,414 9,519 11,385 13,549MDWID2 8,138 9,570 10,135 11,084 12,131FWID3 2,061 2,061 2,061 2,061 2,061Spanish Trail3 159 159 159 159 159Source:1. Oro Valley Water Utility. 2010 value from Tucson Water.2. MDWID. 2010 value from Tucson Water. 3. No projected increase for potable deliveries. Based on 2010 value from Tucson Water.
2010 2015 2020 2025 2030Oro Valley 4,134 5,008 5,666 6,777 8,064MDWID 4,844 5,696 6,032 6,597 7,221FWID 1,226 1,226 1,226 1,226 1,226Spanish Trail 95 95 95 95 95
2010 2015 2020 2025 2030Tucson 20,817 20,258 20,123 19,742 19,631Pima County 2,820 2,820 2,820 2,820 2,820Oro Valley 1,832 2,133 2,288 2,600 2,792MDWID 2,146 2,426 2,436 2,531 2,500FWID 543 522 495 471 425Spanish Trail 42 40 38 36 33Total 28,200 28,200 28,200 28,200 28,200
2010 2015 2020 2025 2030Tucson 7,382 7,184 7,136 7,001 6,961Pima County 1,000 1,000 1,000 1,000 1,000Oro Valley 649 756 811 922 990MDWID 761 860 864 898 886FWID 193 185 176 167 151Spanish Trail 15 14 14 13 12Total 10,000 10,000 10,000 10,000 10,000
Loss factor, LAgreed factor, F
Water Provider Non-Turf Potable Delivery Projections (acre-ft/yr)
GAE - Gross Amount of Effluent (acre-ft/yr)
S - SAWRSA Effluent (acre-ft/yr)
CEP - Conservation Effluent Pool (acre-ft/yr)

Low Range Effluent Entitlement Calculations
December 2013 01830100.0000 Page 4 of 11
2010 2015 2020 2025 2030Oro Valley 165 212 257 325 428MDWID 194 241 273 317 383FWID 49 52 56 59 65Spanish Trail 4 4 4 5 5
2010 2015 2020 2025 2030Tucson 19,199 20,628 23,165 25,415 30,992Pima County 2,545 2,801 3,164 3,530 4,325Oro Valley 1,488 1,907 2,310 2,929 3,854MDWID 1,743 2,169 2,459 2,851 3,451FWID 441 467 500 530 586Spanish Trail 34 36 39 41 45
2010 2015 2020 2025 2030RR, IR, RP Projections (minus 5% loss) 63,650 66,207 69,837 73,496 81,454SAWRSA 28,200 28,200 28,200 28,200 28,200CEP 10,000 10,000 10,000 10,000 10,000Tucson 19,199 20,628 23,165 25,415 30,992Pima County 2,545 2,801 3,164 3,530 4,325Oro Valley 1,488 1,907 2,310 2,929 3,854MDWID 1,743 2,169 2,459 2,851 3,451FWID 441 467 500 530 586Spanish Trail 34 36 39 41 45Southlands (minus 5% loss) 0 3,448 5,746 7,853 10,056Tucson 0 3,103 5,172 7,068 9,050Pima County 0 345 575 785 1,006Outlying Facility Total (minus 5% loss) 399 4,097 6,012 7,832 9,652Tucson 359 3,687 5,411 7,049 8,687Pima County 40 410 601 783 965
2010 2015 2020 2025 2030Tucson Total without CEP 19,558 27,419 33,748 39,532 48,729Tucson CEP Contribution 7,382 7,184 7,136 7,001 6,961Tucson Total with CEP 26,940 34,602 40,884 46,532 55,691
PE - Pima County Effluent (acre-ft/yr)
Effluent Allocations (acre-ft/yr)
Effluent Projections and Allocations (acre-ft/yr)

Low Range Effluent Entitlement Calculations
December 2013 01830100.0000 Page 5 of 11
2010 2015 2020 2025 2030Reclaimed Demand Projections 12,500 13,060 13,860 14,360 14,860Source: Tucson Water
2010 2015 2020 2025 2030Tucson Total after Reclaimed Demand(without CEP) 7,058 14,359 19,888 25,172 33,869Tucson Total after Reclaimed Demand(with CEP) 14,440 21,542 27,024 32,172 40,831
2010 2015 2020 2025 2030Roger Road 10,109 8,543 10,299 12,002 11,679Ina Road 8,305 11,190 11,913 12,419 18,220Randolph 785 895 953 994 1,093Subtotal 19,199 20,628 23,165 25,415 30,992Southlands 0 3,103 5,172 7,068 9,050Avra Valley 0 402 747 1,092 1,437Marana 228 1,960 2,564 3,167 3,771Corona de Tucson 131 664 1,008 1,353 1,698Green Valley 0 661 1,092 1,437 1,781Mt. Lemmon 0 0 0 0 0Subtotal 359 6,790 10,583 14,117 17,737Total 19,558 27,419 33,748 39,532 48,729
2010 2015 2020 2025 2030Roger Road 13,996 11,518 13,472 15,308 14,302Ina Road 11,498 15,087 15,583 15,840 22,313Randolph 1,087 1,207 1,247 1,267 1,339Subtotal 26,581 27,812 30,301 32,415 37,954Southlands 0 3,103 5,172 7,068 9,050Avra Valley 0 402 747 1,092 1,437Marana 228 1,960 2,564 3,167 3,771Corona de Tucson 131 664 1,008 1,353 1,698Green Valley 0 661 1,092 1,437 1,781Mt. Lemmon 0 0 0 0 0Subtotal 359 6,790 10,583 14,117 17,737Total 26,940 34,602 40,884 46,532 55,691
City of Tucson Reclaimed System Demand Projections (acre-ft/yr)
Flow Available to COT by WRF (minus 5% losses and without CEP; acre-ft/yr)
Flow Available to COT by WRF (minus 5% losses and with CEP; acre-ft/yr)

High Range Wastewater Flow Projections
December 2013 01830100.0000 Page 6 of 11
2010 2015 2020 2025 2030Roger Road1 35,279 32,070 36,315 40,594 35,901Ina Road1 28,982 42,005 42,005 42,005 56,007Randolph1 2,739 3,360 3,360 3,360 3,360Metro Subtotal 67,000 77,436 81,681 85,960 95,268Southlands2 0 4,033 6,721 9,185 11,762Avra Valley2 1,236 2,016 2,464 2,912 3,360Marana2 292 2,576 3,360 4,145 4,929Corona de Tucson2 284 1,008 1,456 1,904 2,352Green Valley2 2,065 3,472 4,033 4,481 4,929Mt. Lemmon2 3.5 14.6 14.6 14.6 14.6Outlying Facilities Subtotal 3,881 9,088 11,328 13,456 15,585Total 70,881 90,556 99,730 108,601 122,614Source:1. 2006 Facility Plan Update2. 2007 Regional Optimization Master Plan
MGD acre-ft/yrAvra Valley 1.2 1,344Marana 0.023 26Corona de Tucson 0.117 131
Green Valley 2 2,352Mt. Lemmon 0.013 14.6
2010 2015 2020 2025 2030Avra Valley 0 672 1,120 1,568 2,016Marana 267 2,551 3,335 4,119 4,903Corona de Tucson 153 877 1,325 1,773 2,221Green Valley 0 1,120 1,680 2,128 2,576Mt. Lemmon 0 0 0 0 0Total 420 5,220 7,460 9,588 11,717
100% Wastewater Flow Projections (acre-ft/yr)
Source
2006 Facility Plan Update
2006 Facility Plan Update2006 Facility Plan Update2006 Facility Plan Update
2006 Facility Plan Update and 1999 Green Valley Wastewater Treatment Facility Upgrade and BNROD Project Technical Design Report
Non-Metropolitan WRFs - Treatment Capacity as of 2000
Non-Metropolitan WRFs - Flow Available to COT after 2000 (acre-ft/yr)

High Range Wastewater Flow Projections
December 2013 01830100.0000 Page 7 of 11
2010 2015 2020 2025 2030Roger Road 35,279 32,070 36,315 40,594 35,901Ina Road 28,982 42,005 42,005 42,005 56,007Randolph 2,739 3,360 3,360 3,360 3,360Subtotal 67,000 77,436 81,681 85,960 95,268WRF losses (5%) 3,350 3,872 4,084 4,298 4,763SAWRSA 28,200 28,200 28,200 28,200 28,200CEP 10,000 10,000 10,000 10,000 10,000Tucson 22,905 31,827 35,457 39,116 47,074Pima County 2,545 3,536 3,940 4,346 5,230Southlands 0 4,033 6,721 9,185 11,762WRF losses (5%) 0 202 336 459 588Tucson 0 3,448 5,746 7,853 10,056Pima County 0 383 638 873 1,117Outlying Facilities Subtotal 420 5,220 7,460 9,588 11,717WRF losses (5%) 21 261 373 479 586Tucson 359 4,463 6,378 8,198 10,018Pima County 40 496 709 911 1,113
Effluent Entitlement Projections with WRF Losses (acre-ft/yr)

High Range Effluent Entitlement Calculations
December 2013 01830100.0000 Page 8 of 11
Effluent entitlement calculations are based on the Effluent Allocation Formula that is outlined in the 2001 City of Tucson and Metropolitan Domestic Water Improvement District Intergovernmental Agreement
Constants0.960.62
2010 2015 2020 2025 2030Oro Valley1 6,946 8,414 9,519 11,385 13,549MDWID2 8,138 9,570 10,135 11,084 12,131FWID3 2,061 2,061 2,061 2,061 2,061Spanish Trail3 159 159 159 159 159Source:1. Oro Valley Water Utility. 2010 value from Tucson Water.2. MDWID. 2010 value from Tucson Water. 3. No projected increase for potable deliveries. Based on 2010 value from Tucson Water.
2010 2015 2020 2025 2030Oro Valley 4,134 5,008 5,666 6,777 8,064MDWID 4,844 5,696 6,032 6,597 7,221FWID 1,226 1,226 1,226 1,226 1,226Spanish Trail 95 95 95 95 95
2010 2015 2020 2025 2030Tucson 20,817 20,770 20,649 20,305 20,206Pima County 2,820 2,820 2,820 2,820 2,820Oro Valley 1,832 1,920 2,059 2,340 2,513MDWID 2,146 2,184 2,192 2,278 2,250FWID 543 470 446 424 382Spanish Trail 42 36 34 33 30Total 28,200 28,200 28,200 28,200 28,200
2010 2015 2020 2025 2030Tucson 7,382 7,365 7,322 7,201 7,165Pima County 1,000 1,000 1,000 1,000 1,000Oro Valley 649 681 730 830 891MDWID 761 774 777 808 798FWID 193 167 158 150 136Spanish Trail 15 13 12 12 10Total 10,000 10,000 10,000 10,000 10,000
Loss factor, LAgreed factor, F
GAE - Gross Amount of Effluent (acre-ft/yr)
Water Provider Non-Turf Potable Delivery Projections (acre-ft/yr)
S - SAWRSA Effluent (acre-ft/yr)
CEP - Conservation Effluent Pool (acre-ft/yr)

High Range Effluent Entitlement Calculations
December 2013 01830100.0000 Page 9 of 11
2010 2015 2020 2025 2030Oro Valley 165 241 288 361 466MDWID 194 274 306 351 417FWID 49 59 62 65 71Spanish Trail 4 5 5 5 5
2010 2015 2020 2025 2030RR, IR, RP Projections (minus 5% loss) 63,650 73,564 77,597 81,662 90,505SAWRSA 28,200 28,200 28,200 28,200 28,200CEP 10,000 10,000 10,000 10,000 10,000Tucson 19,199 26,625 29,508 32,077 38,437Pima County 2,545 3,536 3,940 4,346 5,230Oro Valley 1,488 2,167 2,589 3,246 4,195MDWID 1,743 2,464 2,756 3,160 3,756FWID 441 531 560 587 638Spanish Trail 34 41 43 45 49Southlands (minus 5% loss) 0 3,831 6,385 8,726 11,173Tucson 0 3,448 5,746 7,853 10,056Pima County 0 383 638 873 1,117Outlying Facility Total (minus 5% loss) 399 4,959 7,087 9,109 11,131Tucson 359 4,463 6,378 8,198 10,018Pima County 40 496 709 911 1,113
2010 2015 2020 2025 2030Tucson Total without CEP 19,558 34,535 41,633 48,128 58,511Tucson CEP Contribution 7,382 7,365 7,322 7,201 7,165Tucson Total with CEP 26,940 41,901 48,955 55,329 65,676
Effluent Entitlements (acre-ft/yr)
PE - Pima County Effluent (acre-ft/yr)

High Range Effluent Entitlement Calculations
December 2013 01830100.0000 Page 10 of 11
2010 2015 2020 2025 2030Reclaimed Demand Projections 12500 13060 13860 14360 14860Source: Tucson Water
2010 2015 2020 2025 2030Tucson Total after Reclaimed Demand(without CEP) 7,058 21,475 27,773 33,768 43,651Tucson Total after Reclaimed Demand(with CEP) 14,440 28,841 35,095 40,969 50,816
2010 2015 2020 2025 2030Roger Road 10,109 11,026 13,119 15,148 14,484Ina Road 8,305 14,443 15,175 15,675 22,597Randolph 785 1,155 1,214 1,254 1,356Subtotal 19,199 26,625 29,508 32,077 38,437Southlands 0 3,448 5,746 7,853 10,056Avra Valley 0 575 958 1,341 1,724Marana 228 2,181 2,851 3,522 4,192Corona de Tucson 131 750 1,133 1,516 1,899Green Valley 0 958 1,437 1,820 2,203Mt. Lemmon 0 0 0 0 0Subtotal 359 7,911 12,125 16,051 20,074Total 19,558 34,535 41,633 48,128 58,511
2010 2015 2020 2025 2030Roger Road 13,996 14,077 16,375 18,549 17,185Ina Road 11,498 18,438 18,940 19,193 26,809Randolph 1,087 1,475 1,515 1,535 1,609Subtotal 26,581 33,990 36,830 39,277 45,602Southlands 0 3,448 5,746 7,853 10,056Avra Valley 0 575 958 1,341 1,724Marana 228 2,181 2,851 3,522 4,192Corona de Tucson 131 750 1,133 1,516 1,899Green Valley 0 958 1,437 1,820 2,203Mt. Lemmon 0 0 0 0 0Subtotal 359 7,911 12,125 16,051 20,074Total 26,940 41,901 48,955 55,329 65,676
Flow Available to COT by WRF (minus 5% losses and without CEP; acre-ft/yr)
Flow Available to COT by WRF (minus 5% losses and with CEP; acre-ft/yr)
City of Tucson Reclaimed System Demand Projections (acre-ft/yr)

Effluent Entitlement ProjectionsExtrapolation to 2050
December 2013 01830100.0000 Page 11 of 11
Year
Projected Potable Demand(acre-ft)
Δ (acre-ft/yr) % Change Slope
2020 149,7482030 165,318 15,570 9% 15572040 181,795 16,477 9% 16482050 197,254 15,459 8% 1546
2010 2015 2020 2025 2030 2040 2050Tucson Total without CEP 19,558 27,419 33,748 39,532 48,729 53,115 57,895Tucson CEP Contribution 7,382 7,184 7,136 7,001 6,961 7,588 8,271Tucson Total with CEP 26,940 34,602 40,884 46,532 55,691 60,703 66,166
2010 2015 2020 2025 2030 2040 2050Tucson Total without CEP 19,558 34,535 41,633 48,128 58,511 63,777 69,517Tucson CEP Contribution 7,382 7,365 7,322 7,201 7,165 7,810 8,513Tucson Total with CEP 26,940 41,901 48,955 55,329 65,676 71,587 78,030Note: 2040 and 2050 projections based on Tucson Water potable demand projections
Tucson Water's Projected Effluent Entitlements (acre-ft/yr)Low Range (90% of Wastewater Flow Projections)
High Range (100% of Wastewater Flow Projections)
y = 1590x - 3E+06 R² = 0.9999
0
50,000
100,000
150,000
200,000
250,000
2020 2030 2040 2050
Proj
ecte
d Po
tabl
e De
man
d (a
cre-
ft/y
r)

Calculations for the Seasonal Distribution of Recycled Water Resources
December 2013 01830100.0000 Page 1 of 4
TW 80%Oro Valley 13%Pima Co 7%Source: 2010 Tucson Water Reclaimed Water Deliveries
Total Pumped to
System (MG)
Total Pumped to
System (acre-ft)
TW Pumped to System(acre-ft)
TW Reclaimed
Monthly Flow Dist.
Jan 148 454 363 3% 2,215 54 25 3 1,770Feb 76 233 186 2% 2,215 54 25 8 1,941March 190 584 467 4% 2,215 54 25 19 1,650April 440 1,350 1,080 9% 2,215 54 25 41 1,015May 651 1,998 1,598 13% 2,215 54 25 69 468June 780 2,395 1,916 16% 2,215 54 25 75 145July 667 2,046 1,637 13% 2,215 54 25 64 434Aug 456 1,398 1,119 9% 2,215 54 25 46 972Sept 519 1,592 1,273 10% 2,215 54 25 66 797Oct 534 1,638 1,311 11% 2,215 54 25 41 784Nov 324 993 794 7% 2,215 54 25 23 1,319Dec 169 520 416 3% 2,215 54 25 12 1,708Total 4,953 15,200 12,160 100% 26,581 650 300 467 13,004
2015 - Tucson Water Entitlement for Roger Road, Ina Road, and Randolph Park WRFs only
Month
Low without CEP
(acre-ft)
Low with CEP
(acre-ft)
High without CEP
(acre-ft)
High with CEP
(acre-ft)
TW Reclaimed
Monthly Flow Dist.
TW Projected Reclaimed
System Demand (acre-ft)
Flow to Wetlands (acre-ft)
Sweetwater Mound (acre-ft)
Silverbell Golf Course
(acre-ft)
Low without CEP
(acre-ft)
Low with CEP
(acre-ft)
High without CEP
(acre-ft)
High with CEP
(acre-ft)Jan 1,719 2,318 2,219 2,832 3% 390 54 25 3 1,247 1,845 1,746 2,360Feb 1,719 2,318 2,219 2,832 2% 200 54 25 8 1,431 2,030 1,931 2,545March 1,719 2,318 2,219 2,832 4% 502 54 25 19 1,119 1,718 1,619 2,233April 1,719 2,318 2,219 2,832 9% 1,160 54 25 41 439 1,038 939 1,552May 1,719 2,318 2,219 2,832 13% 1,716 54 25 69 -146 453 354 967June 1,719 2,318 2,219 2,832 16% 2,058 54 25 75 -493 106 7 621July 1,719 2,318 2,219 2,832 13% 1,758 54 25 64 -183 416 317 931Aug 1,719 2,318 2,219 2,832 9% 1,201 54 25 46 393 991 893 1,506Sept 1,719 2,318 2,219 2,832 10% 1,367 54 25 66 207 805 706 1,320Oct 1,719 2,318 2,219 2,832 11% 1,408 54 25 41 191 790 691 1,305Nov 1,719 2,318 2,219 2,832 7% 853 54 25 23 764 1,363 1,264 1,878Dec 1,719 2,318 2,219 2,832 3% 447 54 25 12 1,181 1,780 1,681 2,294Total 20,628 27,812 26,625 33,990 1 13,060 650 300 467 6,151 13,335 12,147 19,513
Flow to Wetlands (acre-ft)
Sweetwater Mound (acre-
ft)
Silverbell Golf Course
(acre-ft)
Effluent for New
Programs (acre-ft)
Effluent Available for New Programs
Percent of Reclaimed Water Deliveries
TW Entitlement Metro Only
(acre-ft)Month
Reclaimed Water Deliveries - 2010

Calculations for the Seasonal Distribution of Recycled Water Resources
December 2013 01830100.0000 Page 2 of 4
2020 - Tucson Water Entitlement for Roger Road, Ina Road, and Randolph Park WRFs only
Month
Low without CEP
(acre-ft)
Low with CEP
(acre-ft)
High without CEP
(acre-ft)
High with CEP
(acre-ft)
TW Reclaimed
Monthly Flow Dist.
TW Projected Reclaimed
System Demand (acre-ft)
Flow to Wetlands (acre-ft)
Sweetwater Mound (acre-ft)
Silverbell Golf Course
(acre-ft)
Low without CEP
(acre-ft)
Low with CEP
(acre-ft)
High without CEP
(acre-ft)
High with CEP
(acre-ft)Jan 1,930 2,525 2,459 3,069 3% 414 54 25 3 1,434 2,029 1,963 2,573Feb 1,930 2,525 2,459 3,069 2% 212 54 25 8 1,631 2,225 2,159 2,769March 1,930 2,525 2,459 3,069 4% 533 54 25 19 1,300 1,895 1,829 2,439April 1,930 2,525 2,459 3,069 9% 1,231 54 25 41 579 1,174 1,108 1,718May 1,930 2,525 2,459 3,069 13% 1,822 54 25 69 -40 555 489 1,099June 1,930 2,525 2,459 3,069 16% 2,184 54 25 75 -407 187 121 732July 1,930 2,525 2,459 3,069 13% 1,866 54 25 64 -79 516 450 1,060Aug 1,930 2,525 2,459 3,069 9% 1,275 54 25 46 531 1,125 1,059 1,669Sept 1,930 2,525 2,459 3,069 10% 1,451 54 25 66 334 929 863 1,473Oct 1,930 2,525 2,459 3,069 11% 1,494 54 25 41 316 911 845 1,455Nov 1,930 2,525 2,459 3,069 7% 905 54 25 23 923 1,518 1,452 2,062Dec 1,930 2,525 2,459 3,069 3% 474 54 25 12 1,365 1,960 1,894 2,504Total 23,165 30,301 29,508 36,830 1 13,860 650 300 467 7,888 15,024 14,231 21,553
2025 - Tucson Water Entitlement for Roger Road, Ina Road, and Randolph Park WRFs only
Month
Low without CEP
(acre-ft)
Low with CEP
(acre-ft)
High without CEP
(acre-ft)
High with CEP
(acre-ft)
TW Reclaimed
Monthly Flow Dist.
TW Projected Reclaimed
System Demand (acre-ft)
Flow to Wetlands (acre-ft)
Sweetwater Mound (acre-ft)
Silverbell Golf Course
(acre-ft)
Low without CEP
(acre-ft)
Low with CEP
(acre-ft)
High without CEP
(acre-ft)
High with CEP
(acre-ft)Jan 2,118 2,701 2,673 3,273 3% 429 54 25 3 1,607 2,190 2,162 2,762Feb 2,118 2,701 2,673 3,273 2% 220 54 25 8 1,810 2,394 2,366 2,966March 2,118 2,701 2,673 3,273 4% 552 54 25 19 1,468 2,052 2,023 2,624April 2,118 2,701 2,673 3,273 9% 1,275 54 25 41 722 1,306 1,278 1,878May 2,118 2,701 2,673 3,273 13% 1,887 54 25 69 82 665 637 1,237June 2,118 2,701 2,673 3,273 16% 2,262 54 25 75 -298 285 257 857July 2,118 2,701 2,673 3,273 13% 1,933 54 25 64 41 625 596 1,196Aug 2,118 2,701 2,673 3,273 9% 1,321 54 25 46 672 1,255 1,227 1,827Sept 2,118 2,701 2,673 3,273 10% 1,504 54 25 66 469 1,053 1,025 1,625Oct 2,118 2,701 2,673 3,273 11% 1,548 54 25 41 450 1,033 1,005 1,605Nov 2,118 2,701 2,673 3,273 7% 938 54 25 23 1,078 1,661 1,633 2,233Dec 2,118 2,701 2,673 3,273 3% 491 54 25 12 1,535 2,119 2,090 2,691Total 25,415 32,415 32,077 39,277 1 14,360 650 300 467 9,638 16,638 16,300 23,500
Effluent Available for New Programs
Effluent Available for New Programs

Calculations for the Seasonal Distribution of Recycled Water Resources
December 2013 01830100.0000 Page 3 of 4
2030 - Tucson Water Entitlement for Roger Road, Ina Road, and Randolph Park WRFs only
Month
Low without CEP
(acre-ft)
Low with CEP
(acre-ft)
High without CEP
(acre-ft)
High with CEP
(acre-ft)
TW Reclaimed
Monthly Flow Dist.
TW Projected Reclaimed
System Demand (acre-ft)
Flow to Wetlands (acre-ft)
Sweetwater Mound (acre-ft)
Silverbell Golf Course
(acre-ft)
Low without CEP
(acre-ft)
Low with CEP
(acre-ft)
High without CEP
(acre-ft)
High with CEP
(acre-ft)Jan 2,583 3,163 3,203 3,800 3% 444 54 25 3 2,057 2,637 2,677 3,274Feb 2,583 3,163 3,203 3,800 2% 228 54 25 8 2,268 2,848 2,888 3,485March 2,583 3,163 3,203 3,800 4% 571 54 25 19 1,914 2,494 2,534 3,131April 2,583 3,163 3,203 3,800 9% 1,320 54 25 41 1,143 1,723 1,763 2,360May 2,583 3,163 3,203 3,800 13% 1,953 54 25 69 481 1,061 1,102 1,699June 2,583 3,163 3,203 3,800 16% 2,341 54 25 75 88 668 708 1,305July 2,583 3,163 3,203 3,800 13% 2,000 54 25 64 439 1,019 1,059 1,656Aug 2,583 3,163 3,203 3,800 9% 1,367 54 25 46 1,091 1,671 1,711 2,308Sept 2,583 3,163 3,203 3,800 10% 1,556 54 25 66 882 1,462 1,502 2,099Oct 2,583 3,163 3,203 3,800 11% 1,602 54 25 41 861 1,441 1,481 2,078Nov 2,583 3,163 3,203 3,800 7% 971 54 25 23 1,510 2,090 2,131 2,728Dec 2,583 3,163 3,203 3,800 3% 508 54 25 12 1,983 2,563 2,603 3,200Total 30,992 37,954 38,437 45,602 1 14,860 650 300 467 14,715 21,677 22,160 29,325
2040 - Tucson Water Entitlement for Roger Road, Ina Road, and Randolph Park WRFs only
Month
Low without CEP
(acre-ft)
Low with CEP
(acre-ft)
High without CEP
(acre-ft)
High with CEP
(acre-ft)
TW Reclaimed
Monthly Flow Dist.
TW Projected Reclaimed
System Demand (acre-ft)
Flow to Wetlands (acre-ft)
Sweetwater Mound (acre-ft)
Silverbell Golf Course
(acre-ft)
Low without CEP
(acre-ft)
Low with CEP
(acre-ft)
High without CEP
(acre-ft)
High with CEP
(acre-ft)Jan 2,815 3,447 3,491 4,142 3% 474 54 25 3 2,259 2,892 2,935 3,586Feb 2,815 3,447 3,491 4,142 2% 243 54 25 8 2,485 3,117 3,161 3,812March 2,815 3,447 3,491 4,142 4% 609 54 25 19 2,108 2,740 2,784 3,435April 2,815 3,447 3,491 4,142 9% 1,408 54 25 41 1,286 1,919 1,963 2,614May 2,815 3,447 3,491 4,142 13% 2,084 54 25 69 582 1,214 1,258 1,909June 2,815 3,447 3,491 4,142 16% 2,499 54 25 75 162 795 839 1,489July 2,815 3,447 3,491 4,142 13% 2,135 54 25 64 536 1,169 1,213 1,864Aug 2,815 3,447 3,491 4,142 9% 1,459 54 25 46 1,231 1,864 1,908 2,558Sept 2,815 3,447 3,491 4,142 10% 1,661 54 25 66 1,010 1,642 1,686 2,337Oct 2,815 3,447 3,491 4,142 11% 1,709 54 25 41 986 1,618 1,662 2,313Nov 2,815 3,447 3,491 4,142 7% 1,036 54 25 23 1,677 2,310 2,354 3,004Dec 2,815 3,447 3,491 4,142 3% 543 54 25 12 2,181 2,814 2,857 3,508Total 33,782 41,369 41,896 49,706 1 15,860 650 300 467 16,505 24,092 24,619 32,429
Effluent Available for New Programs
Effluent Available for New Programs

Calculations for the Seasonal Distribution of Recycled Water Resources
December 2013 01830100.0000 Page 4 of 4
2050 - Tucson Water Entitlement for Roger Road, Ina Road, and Randolph Park WRFs only
Month
Low without CEP
(acre-ft)
Low with CEP
(acre-ft)
High without CEP
(acre-ft)
High with CEP
(acre-ft)
TW Reclaimed
Monthly Flow Dist.
TW Projected Reclaimed
System Demand (acre-ft)
Flow to Wetlands (acre-ft)
Sweetwater Mound (acre-ft)
Silverbell Golf Course
(acre-ft)
Low without CEP
(acre-ft)
Low with CEP
(acre-ft)
High without CEP
(acre-ft)
High with CEP
(acre-ft)Jan 3,069 3,758 3,806 4,515 3% 503 54 25 3 2,483 3,172 3,220 3,929Feb 3,069 3,758 3,806 4,515 2% 258 54 25 8 2,723 3,412 3,460 4,169March 3,069 3,758 3,806 4,515 4% 648 54 25 19 2,323 3,012 3,060 3,769April 3,069 3,758 3,806 4,515 9% 1,497 54 25 41 1,451 2,140 2,188 2,898May 3,069 3,758 3,806 4,515 13% 2,216 54 25 69 704 1,393 1,441 2,151June 3,069 3,758 3,806 4,515 16% 2,656 54 25 75 258 947 995 1,705July 3,069 3,758 3,806 4,515 13% 2,270 54 25 64 655 1,344 1,392 2,102Aug 3,069 3,758 3,806 4,515 9% 1,551 54 25 46 1,393 2,082 2,130 2,839Sept 3,069 3,758 3,806 4,515 10% 1,765 54 25 66 1,158 1,848 1,895 2,605Oct 3,069 3,758 3,806 4,515 11% 1,817 54 25 41 1,131 1,820 1,868 2,578Nov 3,069 3,758 3,806 4,515 7% 1,101 54 25 23 1,865 2,555 2,602 3,312Dec 3,069 3,758 3,806 4,515 3% 577 54 25 12 2,400 3,090 3,137 3,847Total 36,822 45,093 45,667 54,180 1 16,860 650 300 467 18,545 26,816 27,390 35,903
Effluent Available for New Programs

APPENDIX D
RECLAIMED WATER SYSTEM EVALUATION

Recycled Water Master Plan
Appendix D: Reclaimed Water System Evaluation
December 2013
Imagine the result

December 2013 01830100.0000 i
Table of Contents
1 Introduction 1-1
1.1 Organization of Technical Memorandum 1-1
2 Existing Reclaimed Water System Hydraulic Model 2-1
2.1 Reclaimed Water System Configuration 2-1
2.1.1 Reclaimed Water System Service Area 2-3
2.1.2 Treatment and Production Facilities 2-5
2.1.3 Distribution, Storage, and Pumping Facilities 2-8
2.2 Existing Reclaimed Water Demands 2-9
3 Evaluation of the Existing Reclaimed Water System 3-1
3.1 System Performance Criteria 3-1
3.2 Production Analysis 3-2
3.3 System Storage Analysis 3-4
3.4 RWS Model Peak Day Demand Analysis 3-4
3.5 RWS Operational Peak Day Analysis 3-8
3.6 Development and Evaluation of System Improvement Alternatives 3-10
3.6.1 North Loop Improvements 3-14
3.6.2 Dove Mountain Area Improvements 3-14
3.6.3 Northeast Loop Improvements 3-14
4 Evaluation of Future System 4-1
4.1 Southeast Houghton Area Recharge Project Analysis 4-1
4.2 Analysis of Future Tucson Water Reclaimed Water Demands 4-2
5 Evaluation of Impacts of Other Entity Future Reclaimed Water Demands 5-1
5.1 Other Entity Reclaimed Water Demand Projections 5-1
5.2 Analysis of Future Other Water Provider Reclaimed Water Demands 5-1
5.3 Analysis of Future Pima County Reclaimed Water Demands 5-2
6 Recommended Schedule of System Improvements and Costs 6-5

December 2013 01830100.0000 ii
Table of Contents
6.1 Basis of Capital Cost Opinions 6-5
6.2 Recommended Schedule of System Improvements and Costs 6-5
7 References 7-1
Tables
Table 2-1. Existing Recovery Well Capacities 2-7
Table 2-2. RWS Storage and Booster Pumping Inventory 2-9
Table 2-3. 2010 Reclaimed Water Deliveries and Demands 2-10
Table 3-1. RWS System Performance Criteria 3-2
Table 3-2. Comparison of Existing Reclaimed Water Production and Peak Day Demands 3-3
Table 4-1. Comparison of Existing Reclaimed Water Production and Peak Day Demands 4-4
Table 5-1. Other Water Providers Projected Additional Reclaimed Water Demands 5-1
Table 5-2. Thornydale Booster Station Upgrades for Future Oro Valley Reclaimed Water Demands 5-2
Table 6-1. Schedule of Recommended RWS Improvements and Cost Opinions 6-6

December 2013 01830100.0000 iii
Table of Contents
Figures
Figure 2-1. Existing System 2-2
Figure 2-2. Other Water Provider Connections to RWS 2-4
Figure 2-3. Reclaimed Water System Treatment and Production Facilities 2-6
Figure 3-1. Existing System – Peak Day Analysis Minimum Pressure 3-5
Figure 3-2. Existing System – Peak Day Analysis Maximum Velocity 3-6
Figure 3-3. Existing System – Peak Day Analysis Maximum Headloss 3-7
Figure 3-4. Existing System – Operational Peak Day Analysis Maximum Headloss 3-9
Figure 3-5. Existing System Improvement Alternatives 3-11
Figure 3-6. Recommended System Improvements to Correct Existing Deficiencies 3-13
Figure 4-1. Future Tucson Water Reclaimed Water Demands 4-3
Figure 4-2. Recommended Improvements for Future Tucson Water Demands 4-5
Figure 5-1. Potential Future Pima County Reclaimed Water Demands 5-3
Figure 5-2. Potential Improvements to Serve Future Pima County and Other Water Provider Reclaimed Water Demands 5-4
Figure 6-1. Recommended Reclaimed Water System Improvements 6-7
Attachments
Golf Course Reclaimed Water Usage Patterns
Pima County Reclaimed Water Demand Projections
Basis of Cost Opinions

December 2013 01830100.0000 1-1
Recycled Water Master Plan
Reclaimed Water System
Evaluation
1 Introduction
This technical memorandum summarizes the analysis of the Reclaimed Water System (RWS) to
identify system improvements and costs that will allow Tucson Water to continue providing reliable
reclaimed water service into the future. The analysis was conducted by utilizing the Tucson
Water’s existing hydraulic model of the RWS to assess system performance under current and
potential future peak day reclaimed water demand conditions. Various system improvement
options were identified and evaluated to address existing system deficiencies and to meet future
Tucson Water customer demands (which includes existing Pima County and Oro Valley Water
Utility demands). Once a recommended schedule of improvements and costs was identified for
Tucson Water demands, additional analyses were completed to determine the impacts of potential
future demands of Pima County and other water providers, including Oro Valley Water Utility,
Metropolitan Domestic Water Improvement District (MDWID), Flowing Wells Irrigation District
(FWID), and Spanish Trail Water Company.
1.1 Organization of Technical Memorandum
This technical memorandum is organized into the following Sections:
Section 1 – Introduction
Section 2 – Existing Reclaimed Water System Hydraulic Model
Section 3 – Evaluation of the Existing Reclaimed Water System
Section 4 – Evaluation of Future System
Section 5 – Evaluation of Impacts of Other Entity Future Reclaimed Water Demands
Section 6 – Recommended Schedule of System Improvements and Costs
Section 7 – References

December 2013 01830100.0000 2-1
Recycled Water Master Plan
Reclaimed Water System
Evaluation
2 Existing Reclaimed Water System Hydraulic Model
Tucson Water’s existing RWS hydraulic model is a Bentley 08.11.01.32 WaterGEMS, V8i
(SELECT series 1) model. The model contains attributes of the existing RWS distribution system,
and the last update of the modeled infrastructure was performed in 2010. The model also contains
peak day reclaimed water demands for each existing reclaimed water customer, which was last
updated in 2010. It is important to understand that the modeled peak day demands are calculated
demands that could be satisfied if the system had sufficient capacity. These demands are different
than the reclaimed water deliveries that are discussed in Chapter 6 of the Recycled Water Master
Plan report, which noted that the RWS, as it is configured and operated today, cannot meet the full
peak day demands of all customers under all conditions. The capacity of the RWS to meet
reclaimed water demands will be confirmed by the analyses herein.
The existing RWS model has never been formally calibrated. However, certain validation runs
have been performed by Tucson Water which demonstrated that the model is suitable for master
planning purposes. The RWS hydraulic model is an extended period simulation (EPS) model.
The following sections describe the current RWS, the RWS hydraulic model, how the model was
updated to include recent additions and changes to the system, the existing reclaimed water
demands, and modifications that were made to certain demand patterns.
2.1 Reclaimed Water System Configuration
Tucson Water’s RWS includes production facilities, distribution pipelines, storage, and booster
pumping facilities. Figure 2-1 shows the configuration of the existing reclaimed water system.
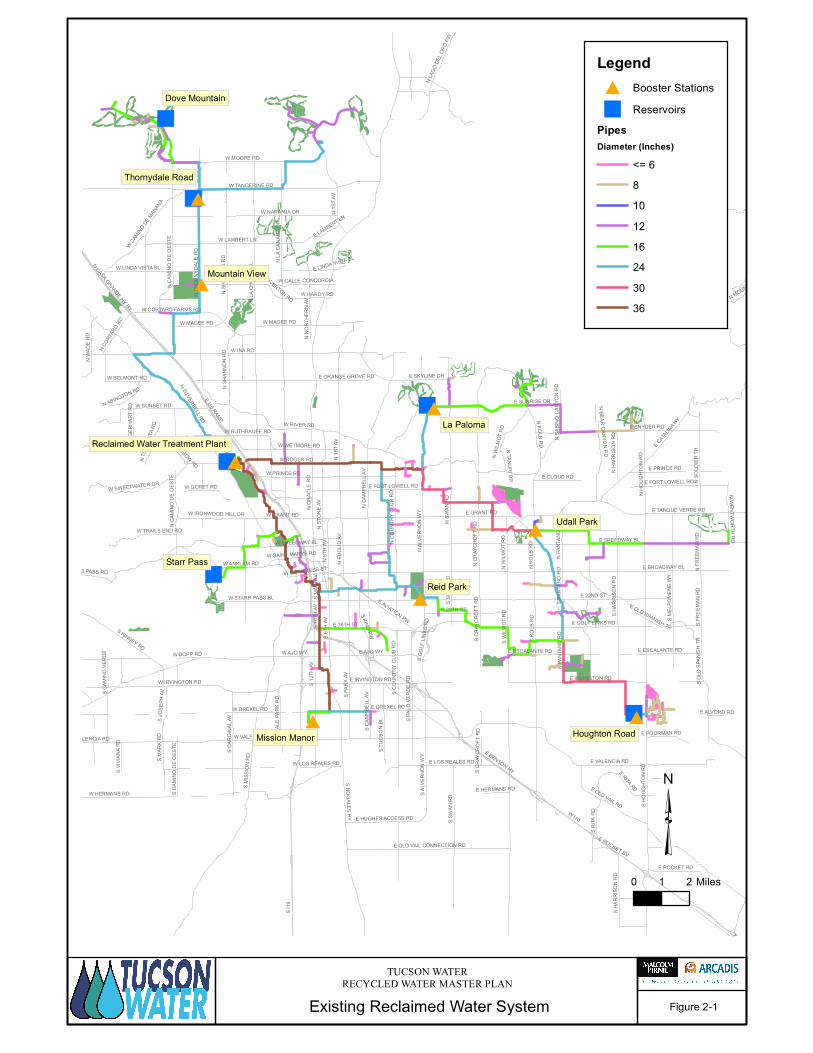
")
")
")
")
")
")#
#
#
#
#
#
#
#
E I10
W I10
S I19
S MISS
ION
RD
N OR
ACLE
RD
S HOU
GHTO
N RD
E 22ND ST
S NOGALES HY
E SPEEDWAY BL
W INA RD
E VALENCIA RD
E BROADWAY BL
S KOL
B RD
N SILVERBELL RD
N SW
AN R
D
W TANGERINE RD
S PAR
K AV
E GRANT RD
N LA
CAN
ADA D
R
S 12T
H AV
S 6TH
AV E GOLF LINKS RD
N THO
RNYD
ALE
RD
N ST
ONE A
V
S SWA
N RD
S KINNEY RD
N CR
AYCR
OFT R
D
E OLD SPANISH TR
W MOORE RD
E SUNRISE DR
N CA
MPBE
LL AV
W IRVINGTON RD
W VALENCIA RD
N MOUNT LEMMON HY
E TANQUE VERDE RD
W RIVER RD
E AJO WY
S ALV
ERNO
N W
YE SNYDER RD
N HO
UGHT
ON R
D
W SPEEDWAY BL
W PIMA MINE RD
S RITA
RD
S KINO PW
E 36TH ST
E DREXEL RD
E CATA
LINA H
YE IRVINGTON RD
W LAMBERT LN
S PAL
O VE
RDE
RD
N SH
ANNO
N RD
N SO
LDIE
R TR
W ANKLAM RD
W AJO WY
N LA
CHO
LLA B
L
W SWEETWATER DR
S CAM
INO
LOMA
ALTA
E AVIATION PW
E SKYLINE DR
S CAR
DINA
L AV
W GATES PASS RD
W NARANJA DR
E BENSON HY
W MAGEE RD
E LOS REALES RD
N 6T
H AV
E RITA RD
W STARR PASS BL
N KINNEY RD
S TUC
SON
BL
E OLD VAIL CONNECTION RD
S PAN
TANO
RD
E 29TH ST
W LINDA VISTA BL
N 1S
T AV
S 10T
H AV
W OVERTON RD
W GRANT RD
N CO
UNTR
Y CLU
B RD
E FORT LOWELL RD
N KO
LB R
D
W PRINCE RD
N BEAR CANYON RD
S FRE
EMAN
RD
S CAM
PBEL
L AV
N WA
DE R
D
S HAR
RISO
N RD
W CAMINO DE
MANAN
A
E PRINCE RD
N EU
CLID
AV
W BENSON HY
N PA
NTAN
O RD
N LAG
O DE
L ORO
PW
W PICTURE ROCKS RD
S MAR
K RD
W CORTARO FARMS RD
S OLD
SPAN
ISH TR
E CLOUD RD
E ROCKET RD
S WEN
TWOR
TH R
D
W TRAILS END RD
W ROGER RD
E HUGHES ACCESS RD
W IRONWOOD HILL DR
N CASA GRANDE HY
N CORT
ARO R
D
S MID
VALE
PARK
RD
N SA
BINO
CANY
ON R
D
E SKI RUN RD
N HA
RRISO
N RD
S JOS
EPH
AV
W BELMONT RD
W GORET RD
S COU
NTRY
CLU
B RD
W WETMORE RD
W RUTHRAUFF RD
E POORMAN RD
S CAM
INO
DE O
ESTE
N TOR
TOLIT
A RD
N FR
EEMA
N RD
S CAM
INO
VERD
E
N NO
RTHE
RN AV
W SAINT MARYS RD
N ABINGTON RD
E ORANGE GROVE RD
W CONGRESS ST
S VIV
IANA R
D
N GE
RHAR
T RD
N CASA GRANDE HY HY
E PIMA MINE RD
W CALLE CONCORDIA
E HERMANS RD
W SUNSET RD
S GOL
F LIN
KS R
D
E LAMBERT LN
E LINDA VISTA BL
E ALVORD RD
N WI
LMOT
RD
N OXBOW RD
E ESCALANTE RD
S MAIN
AV
S I19
RAM
P
N TANURI DR
E ROCKET SV
S CRA
YCRO
FT R
D
W LOS REALES RD
S PAN
TANO
RD
S CRA
YCRO
FT R
D
E I10 RAMP
N WI
LMOT
RD
E OLD SPANISH TR
E FORT LOWELL RD
E IRVINGTON RD
W PIMA MINE RD
E ESCALANTE RD
N KOLB RD
N 1S
T AV
W BOPP RD
N CA
MINO
DE O
ESTE
W MAGEE RD
N DA
VIDSO
N RD
N WENTWORTH RD
W HARDY RD
S MEL
POME
NE W
Y
S SWA
N RD
W VALENCIA RD
S WILM
OT R
D
N SH
ANNO
N RD
W DREXEL RD
E OLD VAIL RD
S HAR
RISO
N RD
N CA
MINO
DE O
ESTE
N ALV
ERNO
N W
Y
E SKI RUN RD
W HERMANS RD
Starr Pass
Dove Mountain
La Paloma
Houghton Road
Thornydale Road
Reid Park
Udall Park
Reclaimed Water Treatment Plant
Mission Manor
Mountain View
³0 1 2 Miles
Legend# Booster Stations") Reservoirs
PipesDiameter (Inches)
<= 68101216243036
Figure 2-1Existing Reclaimed Water SystemTUCSON WATER
RECYCLED WATER MASTER PLAN

December 2013 01830100.0000 2-3
Recycled Water Master Plan
Reclaimed Water System
Evaluation
2.1.1 Reclaimed Water System Service Area
Tucson Water delivers reclaimed water to customers within its potable water service area and to
the service areas of the University of Arizona, Davis-Monthan Air Force Base, Town of Marana,
and the Flowing Wells Irrigation District (FWID). These service areas are located within the
governmental jurisdictions of the City of Tucson, Town of South Tucson, Town of Marana, and in
unincorporated Pima County.
Tucson Water also treats and “wheels” (delivers) reclaimed water derived from the effluent
entitlements of Pima County and Town of Oro Valley (Oro Valley) through the RWS. The 1979
intergovernmental agreement (IGA) between the City of Tucson and Pima County gave Pima
County an effluent allocation which can be used for public use on any County property, including
on parks, golf courses, street and highway landscaping, riparian projects, to replace the existing
use of groundwater or to avoid a new use of groundwater, or for construction-related activities.
In 2000, after entering into an IGA with the City of Tucson for the ownership of effluent generated
within its service area, Oro Valley constructed a reclaimed water system which delivers reclaimed
water to its golf courses, parks, and schools. Under the terms of the IGA, Tucson Water wheels
Oro Valley’s reclaimed water to a metering station at the boundary between the Oro Valley and
Tucson Water reclaimed water systems. Under the 2000 City/Oro Valley IGA, Oro Valley’s effluent
entitlement is subtracted from Tucson Water’s entitlement granted in the 1979 City/County IGA.
The Metropolitan Domestic Water Improvement District (MDWID) and FWID are in various stages
of planning and development of reclaimed water systems. At this time, MDWID and FWID
anticipate having Tucson Water treat and deliver a portion or all of their effluent entitlement to
metering stations located at the boundaries between their systems and Tucson Water’s reclaimed
water system. From the delivery points, MDWID and FWID will be responsible for the delivery of
reclaimed water to customers in their service areas. Figure 2-2 shows the delivery point locations
for Oro Valley, MDWID, FWID, and Spanish Trail. The service areas of the University of Arizona,
Davis-Monthan Air Force Base, Town of Marana, and FWID are also shown on Figure 2-2.

")
")
")
")
")
")
#
#
#
#
#
#
#
#
E I10
W I10
S I19
S MIS
SION
RD
N OR
ACLE
RD
S HOU
GHTO
N RD
E 22ND ST
S NOGALES HY
E SPEEDWAY BL
W INA RD
E VALENCIA RD
E BROADWAY BL
S KOL
B RD
N SILVERBELL RD
N SW
AN R
D
W TANGERINE RD
S PAR
K AV
E GRANT RD
N LA
CAN
ADA D
R
S 12T
H AV
S 6TH
AV E GOLF LINKS RD
N THO
RNYD
ALE
RD
N ST
ONE A
V
S SWA
N RD
S KINNEY RD
N CR
AYCR
OFT R
D
E OLD SPANISH TR
W MOORE RD
E SUNRISE DR
N CA
MPBE
LL AV
W IRVINGTON RD
W VALENCIA RD
N MOUNT LEMMON HY
E TANQUE VERDE RD
W RIVER RD
E AJO WY
S ALV
ERNO
N W
YE SNYDER RD
N HO
UGHT
ON R
D
W SPEEDWAY BL
S RITA
RD
S KINO PW
E 36TH ST
E DREXEL RD
E CATA
LINA H
YE IRVINGTON RD
W LAMBERT LN
S PAL
O VE
RDE
RD
N SH
ANNO
N RD
N SO
LDIER
TR
W ANKLAM RD
W AJO WY
N LA
CHO
LLA B
L
W SWEETWATER DR
S CAM
INO
LOMA
ALTA
E AVIATION PW
E SKYLINE DR
W GO
LDEN
GAT
E RD
S CAR
DINA
L AV
W GATES PASS RD
W NARANJA DR
E BENSON HY
W MAGEE RD
E LOS REALES RD
N 6T
H AV
E RITA RD
W STARR PASS BL
N KINNEY RD
S TUC
SON
BL
E OLD VAIL CONNECTION RD
S PAN
TANO
RD
E 29TH ST
W LINDA VISTA BL
N 1S
T AV
S 10T
H AV
W OVERTON RD
W GRANT RD
N CO
UNTR
Y CLU
B RD
E FORT LOWELL RD
N KO
LB R
D
W PRINCE RD
N BEAR CANYON RD
S FRE
EMAN
RD
S CAM
PBEL
L AV
N WA
DE R
D
S HAR
RISO
N RD
W CAMINO DE
MANAN
A
E PRINCE RD
N EU
CLID
AV
W BENSON HY
N PA
NTAN
O RD
N LAG
O DE
L ORO
PW
W PICTURE ROCKS RD
S MAR
K RD
W CORTARO FARMS RD
S OLD
SPAN
ISH TR
E CLOUD RD
E ROCKET RD
S WEN
TWOR
TH R
D
W TRAILS END RD
W ROGER RD
E HUGHES ACCESS RD
W IRONWOOD HILL DR
N CASA GRANDE HY
N CORT
ARO R
D
S MID
VALE
PARK
RD
N SA
BINO
CAN
YON
RD
E SKI RUN RD
N HA
RRISO
N RD
S JOS
EPH A
V
W BELMONT RD
W GORET RD
S COU
NTRY
CLU
B RD
W WETMORE RD
W RUTHRAUFF RD
E POORMAN RD
S CAM
INO
DE O
ESTE
N TOR
TOLIT
A RD
N FR
EEMA
N RD
S CAM
INO
VERD
E
N NO
RTHE
RN AV
W SAINT MARYS RD
N ABINGTON RD
E ORANGE GROVE RD
W CONGRESS ST
S VIVI
ANA R
D
N GE
RHAR
T RD
N CASA GRANDE HY HY
W CALLE CONCORDIA
E HERMANS RD
W SUNSET RD
S GOL
F LIN
KS R
D
E LAMBERT LN
E LINDA VISTA BL
E ALVORD RD
N WI
LMOT
RD
N OXBOW RD
E ESCALANTE RD
S MAI
N AV
S I19
RAM
P N TANURI DR
E ROCKET SV
S CRA
YCRO
FT R
D
W LOS REALES RD
S PAN
TANO
RD
S CRA
YCRO
FT R
D
E I10 RAMP
N WI
LMOT
RD
E OLD SPANISH TR
E FORT LOWELL RD
E IRVINGTON RD
E ESCALANTE RD
N KOLB RD
N 1S
T AV
W BOPP RD
N CA
MINO
DE O
ESTE
W MAGEE RD
N DA
VIDSO
N RD
N WENTWORTH RD
W HARDY RD
S MEL
POME
NE W
Y
S SWA
N RD
W VALENCIA RD
W TANGERINE RD
S WILM
OT R
D
N SH
ANNO
N RD
W DREXEL RD
E OLD VAIL RD
S HAR
RISO
N RD
N CA
MINO
DE O
ESTE
N ALV
ERNO
N W
Y
E SKI RUN RD
W HERMANS RD
_̂
_̂
_̂_̂
_̂
Starr Pass
Dove Mountain
La Paloma
Houghton Road
Thornydale Road
Reid Park
Udall Park
Reclaimed Water Treatment Plant
Mission Manor
Mountain View
³0 1 2 Miles
Legend# Booster Stations
") ReservoirsPipesDavis-Monthan AFB Flowing Well Irrigation DistrictUniversity of ArizonaTown of Marana
Other Water Provider Connections
_̂ Flowing Wells Irrigation District
_̂ Metropolitan Domestic Water Improvement District
_̂ Oro Valley
_̂ Spanish Trail
Figure 2-2Other Water Provider Connections to RWSTUCSON WATER
RECYCLED WATER MASTER PLAN

December 2013 01830100.0000 2-5
Recycled Water Master Plan
Reclaimed Water System
Evaluation
2.1.2 Treatment and Production Facilities
The City’s reclaimed water production facilities include a tertiary filtration plant, an underground
storage and recovery facility (US&R), and a wetlands treatment system. Pima County’s
Randolph Park Water Reclamation Facility (WRF) also provides reclaimed water to the system.
Figure 2-3 provides an overview of the RWS treatment and production facilities.
Secondary effluent produced at the Roger Road WRF (now called the Water Campus) is piped
to the Tucson Water Reclaimed Water Treatment Plant (RWTP) for filtration through pressure
filters. The filtered effluent is disinfected with chlorine to ADEQ standards for Class A reuse prior
to distribution. The RWTP is designed to treat 10 million gallons per day (MGD) of secondary
effluent from Roger Road WRF, but due to hydraulic limitations, the facility currently produces
only 7 to 8 MGD. Reclaimed water is also produced at the Randolph Park WRF, which is
designed to treat 3.0 MGD, but has recently produced between 1.7 and 2.5 MGD.
Secondary effluent from the Roger Road WRF is also piped to the Sweetwater US&R Facility
located on the east and west banks of the Santa Cruz River near Sweetwater Road. The stored
water is recovered primarily for blending with the reclaimed water produced by the RWTP to
meet turbidity requirements for Class A reuse. The stored water is also recovered for use when
reclaimed water demands exceed the capacity of the RWTP. The Sweetwater US&R Facility is
permitted for annual storage of up to 13,000 acre-feet of reclaimed water. The US&R Facility
has eight surface recharge basins with a combined daily average recharge capacity of 6 MGD;
however, the recharge capacity has recently decreased to 4.2 MGD and less for unknown
reasons.
The Sweetwater US&R Facility is equipped with a combined maximum extraction capacity of
about 20.8 MGD as shown on Table 2-1. The maximum extraction capacities were determined
by a hydraulic evaluation of the extraction wells and piping completed for Tucson Water in 2007
(CH2M Hill, May 2007). The capacities presented in Table 2-1 represent the maximum individual
flow rates with all extraction wells operating, which was reportedly the best approximation of
how the extraction wells would react hydraulically to one another under actual peak day
operations.

December 2013 01830100.0000 2-6
Recycled Water Master Plan
Reclaimed Water System
Evaluation
Figure 2-3. Reclaimed Water System Treatment and Production Facilities
Recharge
Basins
Sweetwater
Wetlands
Reclaimed Water
Treatment Plant
New Recharge
Basins
Roger Road
WRF
Water
Campus

December 2013 01830100.0000 2-7
Recycled Water Master Plan
Reclaimed Water System
Evaluation
Table 2-1. Existing Recovery Well Capacities
Well
Maximum Extraction Capacity (gpm)
1
Maximum Extraction Capacity (MGD)
1
Sweetwater US&R Facility
EW-001 1,118 1.6
EW-002 949 1.4
EW-0032 2,326 3.3
EW-004 3,598 5.2
EW-005 2,258 3.3
EW-006 2,162 3.1
EW-008 2,015 2.9
Subtotal 14,426 20.8
Santa Cruz River Managed Underground Storage Facility
EW-007 2,569 3.7
Total 16,995 24.5 1Maximum individual flow rates with all extraction wells operating (CH2M Hill, 2007)
2Well pump was downsized on 4/7/10 (from 3,174 gpm) and tested at 2,326 gpm on 9/9/11.
Expansion projects at the Sweetwater US&RF include the addition of three new recharge basins
and two new extraction wells. The three new recharge basins will increase the effluent recharge
capabilities of the Sweetwater US&R Facility from 10,000 acre-feet per year to 13,000 acre-feet
per year. New extraction wells EW-009 and EW-010 are anticipated to provide an additional 6
MGD of recovery capacity for the Sweetwater US&R Facility.
Excess Tucson Water effluent entitlements are also discharged from both the Roger Road and
Ina Road WRFs to two managed in-channel recharge projects. The Santa Cruz River Managed
Underground Storage Facility (Phase I) spans from Roger Road to Ina Road and receives
effluent from the Roger Road WRF. Phase I is managed under a partnership between Tucson
Water and the U.S. Bureau of Reclamation. The Lower Santa Cruz River Managed Recharge
Project (Phase II) spans from Ina Road to Trico Road and receives effluent from both the Roger
Road WRF and the Ina Road WRF. Phase II partners include Tucson Water, the U.S. Bureau of
Reclamation, Pima County, FWID, MDWID, the Town of Marana, the Cortaro-Marana Irrigation
District, Oro Valley, and the Avra Valley Irrigation District. In order to recover some of the
recharged effluent, an additional recovery well (Well EW-007), also shown on Table 2-1, was

December 2013 01830100.0000 2-8
Recycled Water Master Plan
Reclaimed Water System
Evaluation
installed and can recover up to 3.7 MGD from the Santa Cruz River Managed Underground
Storage Facility.
Treated effluent from the RWTP and recovered water from the Sweetwater US&R Facility is sent
to the RWTP chlorine contact chamber for disinfection prior to distribution. The Sweetwater
Wetlands adjacent to the US&R facility receives backwash water from the RWTP filters and
secondary effluent during low reclaimed water demand periods. Effluent from the Wetlands is
directed into several of the Sweetwater US&R Facility recharge basins.
2.1.3 Distribution, Storage, and Pumping Facilities
The RWS hydraulic model is a skeletonized model, (i.e., the model is simplified by only including
the major distribution pipelines). The modeled distribution piping network consists of
approximately 167 miles of pipelines ranging in diameter from 6 to 36 inches. The reclaimed
water system hydraulic model was updated to include additions or modifications to the system
since the last update in 2010. The updates made to the existing RWS hydraulic model include
the following:
A new pipeline (3,000 feet, 12-inch diameter) was added near the Mountain View booster
station to provide service to the Arthur Pack golf course.
At the request of Tucson Water staff, several 4-inch, and 8-inch pipelines (30,500 feet
total) were added in the Civano neighborhood and also at West 29th Street. Demands in
this neighborhood were also added to the model based on recent metering data.
The reclaimed water system also has approximately 15.5 million gallons (MG) of total above
ground storage in reservoirs and eight booster stations. Table 2-2 presents an inventory of the
storage reservoirs, booster stations, and their capacities. The table also notes some
modifications and updates that were made to the hydraulic model data.

December 2013 01830100.0000 2-9
Recycled Water Master Plan
Reclaimed Water System
Evaluation
Table 2-2. RWS Storage and Booster Pumping Inventory
Location
Reservoir Capacity
(MG)
Booster Station
Number of Pumps
Total Capacity (MGD)
Firm Capacity
1
(MGD)
Total Head (ft)
Dove Mountain 0.1 - - - -
Thornydale Road – Dove Mountain 4.2
4 6.8 4.8 343
Thornydale Road – Oro Valley 3 4.5 3.2 315
Mountain View2 - 3 15.1 10.1 290
La Paloma 2.0 4 4.8 2.6 340
Tucson Water Reclaimed Water Plant Pumps 1-5
3.1
5 15.8 12.7 430
Tucson Water Reclaimed Water Plant Pumps 5-10 5 18.0 14.4 430
Tucson Water Reclaimed Water Plant Pumps 12-15
3 4 11.8 8.9 439
Udall Park - 4 8.4 5.8 322
Starr Pass 1.6 - - - -
Reid Park - 4 3.2 1.7 245
Mission Manor - 4 4.8 3.4 170
Houghton Road 4.5 2 1.2 0.4 265
Total 15.5 - 94.4 68 - 1Firm capacity signifies largest pump out of service
2The hydraulic model was updated by removing controls. Tucson Water indicates that the pumps are operated manually
3The hydraulic model was updated by adding new Pumps 12 through 15, along with their pump curves
In addition to the model updates and modifications described above, one additional modification
was made in the way the model simulates the RWS. The existing hydraulic model had imposed
controls on operation of the Tucson Water RWTP booster pumps based on water level in the La
Paloma reservoir. These modeled controls kept the model from converging. The RWTP booster
pump controls were removed to allow the hydraulic model to better simulate system operation.
2.2 Existing Reclaimed Water Demands
When discussing reclaimed water demands, it is important to distinguish between what has
historically been delivered by the RWS and what the actual demands might be if the RWS could
satisfy all demands at all times.
Chapter 6 of the Recycled Water Master Plan presents a summary of the existing RWS
customers and reclaimed water deliveries to the customers. The deliveries represent what the

December 2013 01830100.0000 2-10
Recycled Water Master Plan
Reclaimed Water System
Evaluation
RWS is capable of supplying under its existing configuration and operations. In 2010, the RWS
deliveries amounted to an average of 13.3 MGD over the year and approximately 30.5 MGD on
the peak day.
Tucson Water’s existing RWS hydraulic model contains all existing customers and their peak
day demands, the peak demands in the existing model were last updated in 2010. The peak day
demands were calculated by Tucson Water for all customers other than golf courses. The golf
course peak demands are the contractual peak demands for each course, being delivered
according to assigned water delivery (or water usage) patterns. The information in the model
does not include detailed customer-specific information other than golf courses, schools, and
parks because many of the individual demands are aggregate at a single node. The model
includes the following existing peak day reclaimed water demands by customer type:
Golf courses: 25.1 MGD
Parks, schools and others: 10.7 MGD
Total peak day demand: 35.8 MGD
Table 2-3 presents a comparison of actual 2010 reclaimed water deliveries and peak day
demands used in the hydraulic model. The existing RWS peak day deliveries and peak day
demands include Pima County and Oro Valley demands. The table illustrates that the RWS, as
it is configured and operated today, cannot supply the full peak day demands in the system. The
full peak day demands are not being met due to system constraints which will be identified later
in this technical memorandum with hydraulic modeling analyses.
Table 2-3. 2010 Reclaimed Water Deliveries and Demands
Actual Reclaimed Water
Deliveries (MGD) Modeled Reclaimed
Water Demands (MGD)
Average 13.3 --
Peak Day 30.5 35.8
The average reclaimed water system peak day to average day factor from 1999 to 2011 was
2.31 (based on information provided by Tucson Water). Therefore, a peak day to average day
factor of 2.31 was selected for the hydraulic analyses. This peaking factor was applied to all new
demands other than golf course demands. Currently, golf course peak day demands are
modeled as constant flow rates over a 6-hour period during the night that would equal the golf

December 2013 01830100.0000 2-11
Recycled Water Master Plan
Reclaimed Water System
Evaluation
course daily maximum allocations defined in their customer agreements with Tucson Water.
Tucson Water staff indicated that the golf course usage patterns did not match the existing
modeled usage patterns and needed to be updated based on actual usage.
The golf course water usage patterns (records of actual deliveries made to golf courses)
obtained from Tucson Water’s SCADA database were reviewed and the hydraulic model was
updated to reflect the actual golf course usage patterns. Three weeks of hourly golf course
delivery SCADA data from 2010, during the peak summer season was reviewed. The week of
June 23, 2010 was selected for a detailed analysis as this week included a total system peak
day delivery of approximately 30 MGD. The week of June 23, 2010 was used to assess usage
patterns for 15 golf courses. Good SCADA data was not available for three of the golf courses
during this week; therefore, the next best week of data, June 26 through July 2, 2010, was used
to assess usage patterns for these three golf courses. The daily water usage pattern for each
golf course was reviewed and a peak day usage pattern was selected for each golf course using
one of three methods (the selected golf course usage patterns were developed such that the
total daily volume supplied to each golf course was equal to the course’s maximum daily
allocation):
If a consistent pattern in the usage data was evident, then that pattern was selected.
If a consistent pattern in the usage data was not apparent, then an average usage pattern
was estimated using graphical techniques.
If data were unavailable or were not valid for a use site (e.g., Ventana, La Paloma, Skyline,
Arizona National, Fred Enke, and all of the Oro Valley golf courses), a standard usage
pattern was developed and applied that was based on providing a constant flow to the golf
course such that the maximum daily allocation was provided over a single day.
Attachment A contains the updated golf course reclaimed water usage patterns for each golf
course that includes:
the weekday usage patterns (Monday through Friday),
the weekend usage patterns (Saturday and Sunday), and
the selected average peak usage pattern.

December 2013 01830100.0000 3-1
Recycled Water Master Plan
Reclaimed Water System
Evaluation
3 Evaluation of the Existing Reclaimed Water System
Tucson Water’s existing RWS hydraulic model was used to simulate existing system performance
under peak day demand conditions to identify any system deficiencies, and to evaluate alternative
system improvements needed to correct the existing deficiencies.
3.1 System Performance Criteria
Tucson Water’s existing system performance criteria for the RWS was evaluated and updated
based on current industry guidance and actual system operations. The selected system
performance criteria are those that were developed and used in the 1999 Reclaimed Water
Master Plan (Malcolm Pirnie, Inc., 1999) with the following updates:
The pipeline headloss performance criteria were updated based on current American
Water Works Association (AWWA) guidance for pressurized water pipeline systems (i.e.,
establishing separate headloss criterion for pipes less than 12 inches in diameter and
equal to or greater than 12 inches in diameter).
Historically, the system storage performance criterion was based on providing one
maximum day of system storage. However, this criterion relied on using the on-site
storage at golf courses to provide a portion of the needed system storage volume.
Based on the manner in which the golf courses actually operate their on-site storage, it is
not feasible to continue to include this storage in the system storage inventory. The
current system storage reportedly performs adequately under all but peak day demand
conditions. The storage performance criterion has been updated so that system storage
will provide hydraulic equalization under peak day demand conditions. Hydraulic
equalization is the storage required to balance the supply with demands during the peak
usage days. The existing storage capacity that was used in the modeling analyses,
however, does not include the Sweetwater US&R Facility storage capacity or the RWTP
reservoir.
The selected system performance criteria for the RWS evaluations are summarized in Table 3-1.
The portions of the RWS that did not meet the criteria were determined to be deficient and
alternatives were developed and evaluated that would allow those portions of the system to meet
the performance criteria.

December 2013 01830100.0000 3-2
Recycled Water Master Plan
Reclaimed Water System
Evaluation
Table 3-1. RWS System Performance Criteria
Component Performance
Condition Performance Criteria1
Pipelines Peak hour demand
Maximum velocity: 5 feet per second Maximum head losses:
< 10 ft / 1000 ft for < 12-inch diameter < 3 ft / 1000 ft for >= 12-inch diameter
Allowable pressure range: 60 – 100 psi
Production Facilities Peak day demand Provide peak day demand, plus 10%
Storage Peak day demand Provide hydraulic equalization during peak demand day
Booster Stations Peak hour demand Meet peak hour demand with firm capacity
1Criteria used to determine deficiencies in the existing system and/or used to size new facilities to correct
deficiencies or to meet future demands.
3.2 Production Analysis
Section 2.1 of this technical memorandum indicated that the RWS can be supplied with reclaimed
water supply from the Tucson Water RWTP, seven Sweetwater US&R Facility recovery wells, one
Santa Cruz Managed Underground Storage Facility recovery well, and the Pima County Randolph
Park WRF. As noted in Section 2.1, Tucson Water staff indicated that recent operations show that
some of the production facilities do not operate at their design capacities due to a number of
operational and system constraints. The design and current operational production capacities of
the production facilities are summarized in Table 3-2 and compared against existing peak day
reclaimed water demands and the production system performance criterion.

December 2013 01830100.0000 3-3
Recycled Water Master Plan
Reclaimed Water System
Evaluation
Table 3-2. Comparison of Existing Reclaimed Water Production and Peak Day Demands
Component
Design Capacity (Maximum Extraction
Capacity for Wells) (MGD)
Current Operational Capacity
(MGD)
Tucson Water RWTP 10 7 - 8
Sweetwater US&R Facility Recovery Wells 20.8 20.8
Santa Cruz River Managed Underground Storage Facility Recovery Well 3.7 3.7
Randolph Park WRF 3.0 1.7 - 2.5
Total Production Capacity 37.5 33.2 – 35.0
Peak Day Demand 35.8
Peak Day Demand, Plus 10% 39.4
Table 3-2 indicates that if all production facilities are operating at design capacity, the RWS has
adequate production capacity to supply the peak day demand, but not enough to meet the
production system performance criteria. Under the current operational conditions, the RWS may
not be able to supply existing peak day demands. Recognizing the operational constraints,
Tucson Water has included the following new facilities in their current reclaimed water capital
improvement program (CIP) to provide additional reclaimed water production capacity:
Reclaimed extraction wells EW-009 and EW-010, scheduled to be in service in 2014 and
2015, respectively, which is anticipated to provide an additional 6 MGD of recovery
capacity at the Sweetwater US&R Facility.
Three new recharge basins will be added to the Sweetwater US&R Facility to increase the
effluent recharge capabilities from 10,000 acre-feet per year to 13,000 acre-feet per year.
The existing filters at the Tucson Water RWTP will be replaced to restore the full design
capacity of the facility (10 MGD).
The reclaimed booster pumps will be expanded from 46 MGD to 54 MGD in 2018.
If Tucson Water implements the planned construction of the new recovery wells at the Sweetwater
US&R Facility and rehabilitation of the filter plant, the RWS will have sufficient production capacity
to supply the existing peak day reclaimed water demands and to meet the production performance
criterion.

December 2013 01830100.0000 3-4
Recycled Water Master Plan
Reclaimed Water System
Evaluation
3.3 System Storage Analysis
The existing RWS was modeled with EPS simulations to determine the required amount of system
storage needed to provide hydraulic equalization (balance demands with supplies) under peak
day reclaimed water demand conditions. The modeling results indicated that a total of 25.3 MG of
RWS storage is required to balance demands and supplies under peak day demand conditions.
The existing RWS has a total operational storage volume of approximately 12 MG, which does not
include storage at the Sweetwater US&R Facility or the RWTP reservoir. Therefore, a total of 13.3
MG of additional operational storage is needed to provide adequate peak day system
equalization. This additional system storage will be included in the evaluation of system
improvement alternatives in subsequent sections of this technical memorandum.
3.4 RWS Model Peak Day Demand Analysis
The existing RWS was modeled under current peak day demand conditions to identify existing
system deficiencies. The EPS analysis included existing reclaimed water demands from Tucson
Water, Oro Valley, and Pima County. Figures 3-1, 3-2, and 3-3 show the results of the existing
system peak day analysis including minimum pressures, maximum velocities, and maximum
headlosses, respectively. The modeling identified several deficiencies in the existing system as
summarized below:
Negative pressures were identified in the portion of the system served by the Dove
Mountain and La Paloma boosters (see Figure 3-1).
High velocities and headlosses were identified in the 24-inch pipeline along Silverbell Road
and Thoryndale Road from the Tucson Water RWTP to the Thornydale Road Reservoir
and Booster station (see Figures 3-2 and 3-3).
High headlosses were identified along Alvernon Way and along Sunrise Drive and Snyder
Road, both near the La Paloma Booster Station.
These results, particularly the negative pressures, indicate that the RWS would be highly stressed during peak day demand conditions. The results confirm why the RWS is only able to deliver around 30 MGD on a peak demand day.

!
!
!
!
!!
!
!
!
! !
!
!
!
!
! !
!
!
!
!
!
!
!
!
!
!
!
!!
!
!
!!
!
!
!
!
!
!
!!
!
! !
!
!
!
!
!
!!
!
!
!!
!!
!
!
!!
!
!
!
!!
!
!
!
!
!
!
!
!
!
!!
!
!
!
!
!!!
!
!
!
!!
!
!
!
!! !
!!
!!
!!
! !
!!!
!
!!
!
!
!
!
!!
!
!
!!
!!
!!
!!
!
!! !
!
!
!
!
!
!
!!
!!
! !!
!
!!
!!
!
!
!!
!!
!
!
!
!!
!!
!
!
!!
!
!
!
!!!!!!
!
!!!
!
!
!!!!!
!!
!!!!!!!
!
!
!!
!
!!!!!!!!
!
!
!
!
!!
!!
!
!!
!
!
!
!
!!
!
!!!
!
!
!!!!!!
!
!
! !!
!
!!
!
!
!
!!
!!
!!!!
!!
!!!!
!
!
!!!
!
!
!
!
!!
!
!
!!
!!!
!!
!
!
!!
!
!!
!
!!
!
!
!!!!
!
!
! !
! !
!
!!!
!
!!
!
!
!!
!!
!
!
!
!
!
!
!!
!
!!
!
!
!
!
!
!
!
!!!!!!
!
!
!
!
!!
!!
!
!
!
! !
!
!
!!
!
!
!
!
!
!
!
!!
!!!!
!!!!
!
!!
!!
!
!!!!
!!!!!
!!
!
!!
!
!
!
!!
!
!
!
!!!
!
!!
!
!
!
!
!
! !
!
!!!!!!
!!
!!!
!!
!!!!!
!!
!!
!
!
!!
!!!!
!!
!
!!
!!
!!
!
!!
!!
!!
!!!!
!!
! !!
!!
!!
!
!!!!
!!!!
!!
!!
!!
!
!!
!
!!
!!
!!!
!!
!!!
!!!!
!!
!
!!!
!!!!
!!!
!!
! !
!
!
!!
!!
!!!!!!
!
!
!!!
!!
!!
!!
!!!
!!
!
!!!
!
!!!!
!
!!
!
!
!!
!!!!
!!
!
!
!
!!
!
!!
!
!! !!!
!
!
!
!
!
!
!!
!!
!
!
!
!!
!
!
!!!
!
!
!
!
!
!!!
!!
!
!
!!!
!
!
!
!
!
!!
!
!!
!!
!!
!
!!
!!
!!
!!!! !
!
!
!
! !!!!!!!!
!
!
!!!!!!!!!!!!!!!!!!!!!! !!
!
!
!
!!!! !
!
")
")
")
")
")
")#
#
#
#
#
#
#
#
E I10
W I10
S I19
S MIS
SION
RD
N OR
ACLE
RD
S HOU
GHTO
N RD
E 22ND ST
S NOGALES HY
E SPEEDWAY BL
W INA RD
E VALENCIA RD
E BROADWAY BL
S KOL
B RD
N SILVERBELL RD
N SW
AN R
D
W TANGERINE RD
S PAR
K AV
E GRANT RD
N LA
CAN
ADA D
R
S 12T
H AV
S 6TH
AV E GOLF LINKS RD
N THO
RNYD
ALE
RD
N ST
ONE A
V
S SWA
N RD
S KINNEY RD
N CR
AYCR
OFT R
D
E OLD SPANISH TR
W MOORE RD
E SUNRISE DR
N CA
MPBE
LL AV
W IRVINGTON RD
W VALENCIA RD
N MOUNT LEMMON HY
E TANQUE VERDE RD
W RIVER RD
E AJO WY
S ALV
ERNO
N W
YE SNYDER RD
N HO
UGHT
ON R
D
W SPEEDWAY BL
W PIMA MINE RD
S RITA
RD
S KINO PW
E 36TH ST
E DREXEL RD
E CATA
LINA H
YE IRVINGTON RD
W LAMBERT LN
S PAL
O VE
RDE
RD
N SH
ANNO
N RD
N SO
LDIER
TR
W ANKLAM RD
W AJO WY
N LA
CHO
LLA B
L
W SWEETWATER DR
W BOPP RD
S CAM
INO
LOMA
ALTA
E AVIATION PW
E SKYLINE DR
W GO
LDEN
GAT
E RD
S CAR
DINA
L AV
W GATES PASS RD
W NARANJA DR
E BENSON HY
W MAGEE RD
E LOS REALES RD
N 6T
H AV
E RITA RD
W STARR PASS BL
N KINNEY RD
S TUC
SON
BL
E OLD VAIL CONNECTION RD
S PAN
TANO
RD
E 29TH ST
W LINDA VISTA BL
N 1S
T AV
S 10T
H AV
W OVERTON RD
W GRANT RD
N CO
UNTR
Y CLU
B RD
E I10 FRONTAGE RD
E FORT LOWELL RD
N KO
LB R
D
W PRINCE RD
N BEAR CANYON RD
S FRE
EMAN
RD
S CAM
PBEL
L AV
N WA
DE R
D
S HAR
RISO
N RD
W CAMINO DE
MANAN
A
E PRINCE RD
N EU
CLID
AV
W BENSON HY
N PA
NTAN
O RD
N LAG
O DE
L ORO
PW
W PICTURE ROCKS RD
S MAR
K RD
W CORTARO FARMS RD
S OLD
SPAN
ISH TR
E CLOUD RD
E ROCKET RD
S WEN
TWOR
TH R
D
W TRAILS END RD
W ROGER RD
E HUGHES ACCESS RD
W IRONWOOD HILL DR
N CASA GRANDE HY
N CORT
ARO R
D
S MID
VALE
PARK
RD
N SA
BINO
CAN
YON
RD
E SKI RUN RD
N HA
RRISO
N RD
S JOS
EPH A
V
W BELMONT RD
W GORET RD
S COU
NTRY
CLU
B RD
W WETMORE RD
W RUTHRAUFF RD
E POORMAN RD
S CAM
INO
DE O
ESTE
N TOR
TOLIT
A RD
N FR
EEMA
N RD
S CAM
INO
VERD
E
N NO
RTHE
RN AV
W SAINT MARYS RD
N ABINGTON RD
E ORANGE GROVE RD
W CONGRESS ST
W KINNEY RD
S VIVI
ANA R
D
N GE
RHAR
T RD
N CASA GRANDE HY HY
E PIMA MINE RD
W CALLE CONCORDIA
E HERMANS RD
W SUNSET RD
S GOL
F LIN
KS R
D
E LAMBERT LN
E LINDA VISTA BL
E ALVORD RD
N WI
LMOT
RD
N OXBOW RD
E ESCALANTE RD
S MAI
N AV
S I19
RAM
P N TANURI DR
E ROCKET SV
S CRA
YCRO
FT R
D
W LOS REALES RD
S PAN
TANO
RD
S CRA
YCRO
FT R
D
E I10 RAMP
N WI
LMOT
RD
E OLD SPANISH TR
E FORT LOWELL RD
E IRVINGTON RD
W PIMA MINE RD
E ESCALANTE RD
N KOLB RD
N 1S
T AV
W BOPP RD
N CA
MINO
DE O
ESTE
W MAGEE RD
N DA
VIDSO
N RD
N WENTWORTH RD
W HARDY RD
S MEL
POME
NE W
Y
S SWA
N RD
W VALENCIA RD
W TANGERINE RD
S WILM
OT R
D
N SH
ANNO
N RD
W DREXEL RD
E OLD VAIL RD
S HAR
RISO
N RD
N CA
MINO
DE O
ESTE
N ALV
ERNO
N W
Y
E SKI RUN RD
W HERMANS RD
Starr Pass
Dove Mountain
La Paloma
Houghton Road
Thornydale Road
Reid Park
Udall Park
Reclaimed Water Treatment Plant
Mission Manor
Mountain View
³0 1 2 Miles
Legend# Booster Stations") Reservoirs
PipesMinimum Pressure (psi)! < 0 psi! 0 - 20! 20 - 60! 60 - 100! > 100
Figure 3-1Existing System - Peak Day Analysis
Minimum Pressure
TUCSON WATERRECYCLED WATER MASTER PLAN

W I10
S I19
S MIS
SION
RD
N OR
ACLE
RD
S HOU
GHTO
N RD
E 22ND ST
S NOGALES HY
E SPEEDWAY BL
W INA RD
E VALENCIA RD
E BROADWAY BL
S KOL
B RD
N SILVERBELL RD
N SW
AN R
D
W TANGERINE RD
S PAR
K AV
E GRANT RD
N LA
CAN
ADA D
R
S 12T
H AV
S 6TH
AV E GOLF LINKS RD
N THO
RNYD
ALE
RD
N ST
ONE A
V
S SWA
N RD
S KINNEY RD
N CR
AYCR
OFT R
D
W MOORE RD
E SUNRISE DR
N CA
MPBE
LL AV
W IRVINGTON RD
W VALENCIA RD
N MOUNT LEMMON HY
E TANQUE VERDE RD
W RIVER RD
E AJO WY
S ALV
ERNO
N W
YE SNYDER RD
N HO
UGHT
ON R
D
W SPEEDWAY BL
S RITA
RD
S KINO PW
E 36TH ST
E DREXEL RD
E CATA
LINA H
YE IRVINGTON RD
W LAMBERT LN
S PAL
O VE
RDE
RD
N SH
ANNO
N RD
N SO
LDIER
TR
W ANKLAM RD
W AJO WY
N LA
CHO
LLA B
L
W SWEETWATER DR
E AVIATION PW
E SKYLINE DR
S CAR
DINA
L AV
W GATES PASS RD
W NARANJA DR
E BENSON HY
W MAGEE RD
E LOS REALES RD
N 6T
H AV
E RITA RD
W STARR PASS BL
S TUC
SON
BL
E OLD VAIL CONNECTION RD
S PAN
TANO
RD
E 29TH ST
W LINDA VISTA BL
N 1S
T AV
S 10T
H AV
W OVERTON RD
W GRANT RD
N CO
UNTR
Y CLU
B RD
E FORT LOWELL RD
N KO
LB R
D
W PRINCE RD
N BEAR CANYON RD
S FRE
EMAN
RD
S CAM
PBEL
L AV
N WA
DE R
D
S HAR
RISO
N RD
W CAMINO DE
MANAN
A
E PRINCE RD
N EU
CLID
AV
N PA
NTAN
O RD
N LAG
O DE
L ORO
PW
S MAR
K RD
W CORTARO FARMS RD
S OLD
SPAN
ISH TR
E CLOUD RD
E ROCKET RD
W TRAILS END RD
W ROGER RD
E HUGHES ACCESS RD
W IRONWOOD HILL DR
N CASA GRANDE HY
N CORT
ARO R
D
S MID
VALE
PARK
RD
N SA
BINO
CAN
YON
RD
E SKI RUN RD
N HA
RRISO
N RD
S JOS
EPH A
V
W BELMONT RD
W GORET RD
S COU
NTRY
CLU
B RD
W WETMORE RD
W RUTHRAUFF RD
E POORMAN RD
S CAM
INO
DE O
ESTE
N TOR
TOLIT
A RD
N FR
EEMA
N RD
S CAM
INO
VERD
E
N NO
RTHE
RN AV
W SAINT MARYS RD
N ABINGTON RD
E ORANGE GROVE RD
W CONGRESS ST
S VIVI
ANA R
D
N GE
RHAR
T RD
N CASA GRANDE HY HY
W CALLE CONCORDIA
E HERMANS RD
W SUNSET RD
S GOL
F LIN
KS R
D
E LAMBERT LN
E LINDA VISTA BL
E ALVORD RD
N WI
LMOT
RD
N OXBOW RD
E ESCALANTE RD
S MAI
N AV
N TANURI DR
E ROCKET SV
S CRA
YCRO
FT R
D
W LOS REALES RD
S PAN
TANO
RD
S CRA
YCRO
FT R
D
E I10 RAMP
N WI
LMOT
RD
E OLD SPANISH TR
E FORT LOWELL RD
E IRVINGTON RD
E ESCALANTE RD
N KOLB RD
N 1S
T AV
W BOPP RD
N CA
MINO
DE O
ESTE
W MAGEE RD
N WENTWORTH RD
W HARDY RD
S MEL
POME
NE W
Y
S SWA
N RD
W VALENCIA RD
S WILM
OT R
D
N SH
ANNO
N RD
W DREXEL RD
E OLD VAIL RD
S HAR
RISO
N RD
N CA
MINO
DE O
ESTE
N ALV
ERNO
N W
Y
E SKI RUN RD
W HERMANS RD
")
")
")
")
")
")#
#
#
#
#
#
#
#
Starr Pass
Dove Mountain
La Paloma
Houghton Road
Thornydale Road
Reid Park
Udall Park
Reclaimed Water Treatment Plant
Mission Manor
Mountain View
³0 1 2 Miles
Legend# Booster Stations") Reservoirs
Maximum Velocity(feet/second)
0 - 33 - 5> 5
Figure 3-2Existing System - Peak Day Analysis
Maximum Velocity
TUCSON WATERRECYCLED WATER MASTER PLAN
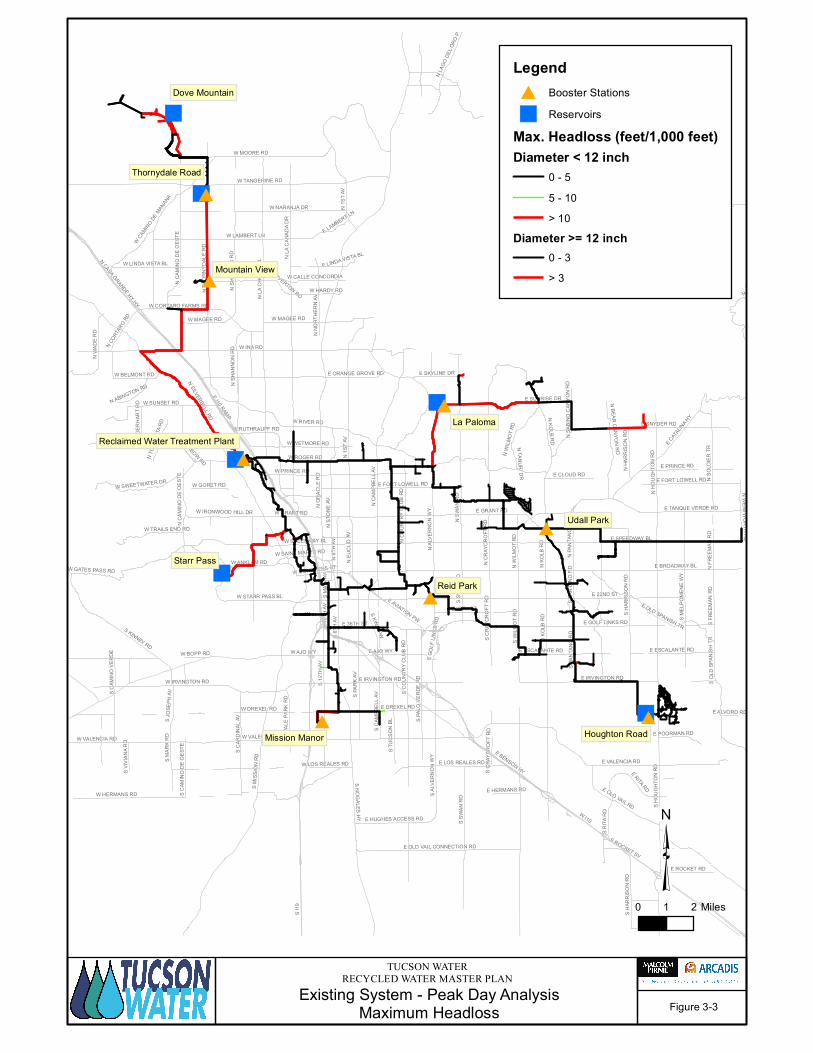
W I10
S I19
S MIS
SION
RD
N OR
ACLE
RD
S HOU
GHTO
N RD
E 22ND ST
S NOGALES HY
E SPEEDWAY BL
W INA RD
E VALENCIA RD
E BROADWAY BL
S KOL
B RD
N SILVERBELL RD
N SW
AN R
D
W TANGERINE RD
S PAR
K AV
E GRANT RD
N LA
CAN
ADA D
R
S 12T
H AV
S 6TH
AV E GOLF LINKS RD
N THO
RNYD
ALE
RD
N ST
ONE A
V
S SWA
N RD
S KINNEY RD
N CR
AYCR
OFT R
D
W MOORE RD
E SUNRISE DR
N CA
MPBE
LL AV
W IRVINGTON RD
W VALENCIA RD
N MOUNT LEMMON HY
E TANQUE VERDE RD
W RIVER RD
E AJO WY
S ALV
ERNO
N W
YE SNYDER RD
N HO
UGHT
ON R
D
W SPEEDWAY BL
S RITA
RD
S KINO PW
E 36TH ST
E DREXEL RD
E CATA
LINA H
YE IRVINGTON RD
W LAMBERT LN
S PAL
O VE
RDE
RD
N SH
ANNO
N RD
N SO
LDIER
TR
W ANKLAM RD
W AJO WY
N LA
CHO
LLA B
L
W SWEETWATER DR
E AVIATION PW
E SKYLINE DR
S CAR
DINA
L AV
W GATES PASS RD
W NARANJA DR
E BENSON HY
W MAGEE RD
E LOS REALES RD
N 6T
H AV
E RITA RD
W STARR PASS BL
S TUC
SON
BL
E OLD VAIL CONNECTION RD
S PAN
TANO
RD
E 29TH ST
W LINDA VISTA BL
N 1S
T AV
S 10T
H AV
W OVERTON RD
W GRANT RD
N CO
UNTR
Y CLU
B RD
E FORT LOWELL RD
N KO
LB R
D
W PRINCE RD
N BEAR CANYON RD
S FRE
EMAN
RD
S CAM
PBEL
L AV
N WA
DE R
D
S HAR
RISO
N RD
W CAMINO DE
MANAN
A
E PRINCE RD
N EU
CLID
AV
N PA
NTAN
O RD
N LAG
O DE
L ORO
PW
S MAR
K RD
W CORTARO FARMS RD
S OLD
SPAN
ISH TR
E CLOUD RD
E ROCKET RD
W TRAILS END RD
W ROGER RD
E HUGHES ACCESS RD
W IRONWOOD HILL DR
N CASA GRANDE HY
N CORT
ARO R
D
S MID
VALE
PARK
RD
N SA
BINO
CAN
YON
RD
E SKI RUN RD
N HA
RRISO
N RD
S JOS
EPH A
V
W BELMONT RD
W GORET RD
S COU
NTRY
CLU
B RD
W WETMORE RD
W RUTHRAUFF RD
E POORMAN RD
S CAM
INO
DE O
ESTE
N TOR
TOLIT
A RD
N FR
EEMA
N RD
S CAM
INO
VERD
E
N NO
RTHE
RN AV
W SAINT MARYS RD
N ABINGTON RD
E ORANGE GROVE RD
W CONGRESS ST
S VIVI
ANA R
D
N GE
RHAR
T RD
N CASA GRANDE HY HY
W CALLE CONCORDIA
E HERMANS RD
W SUNSET RD
S GOL
F LIN
KS R
D
E LAMBERT LN
E LINDA VISTA BL
E ALVORD RD
N WI
LMOT
RD
N OXBOW RD
E ESCALANTE RD
S MAI
N AV
N TANURI DR
E ROCKET SV
S CRA
YCRO
FT R
D
W LOS REALES RD
S PAN
TANO
RD
S CRA
YCRO
FT R
D
E I10 RAMP
N WI
LMOT
RD
E OLD SPANISH TR
E FORT LOWELL RD
E IRVINGTON RD
E ESCALANTE RD
N KOLB RD
N 1S
T AV
W BOPP RD
N CA
MINO
DE O
ESTE
W MAGEE RD
N WENTWORTH RD
W HARDY RD
S MEL
POME
NE W
Y
S SWA
N RD
W VALENCIA RD
S WILM
OT R
D
N SH
ANNO
N RD
W DREXEL RD
E OLD VAIL RD
S HAR
RISO
N RD
N CA
MINO
DE O
ESTE
N ALV
ERNO
N W
Y
E SKI RUN RD
W HERMANS RD
")
")
")
")
")
")#
#
#
#
#
#
#
#
Starr Pass
Dove Mountain
La Paloma
Houghton Road
Thornydale Road
Reid Park
Udall Park
Reclaimed Water Treatment Plant
Mission Manor
Mountain View
³0 1 2 Miles
Legend# Booster Stations") Reservoirs
Max. Headloss (feet/1,000 feet)Diameter < 12 inch
0 - 55 - 10> 10
Diameter >= 12 inch0 - 3> 3
Figure 3-3Existing System - Peak Day Analysis
Maximum Headloss
TUCSON WATERRECYCLED WATER MASTER PLAN

December 2013 01830100.0000 3-8
Recycled Water Master Plan
Reclaimed Water System
Evaluation
3.5 RWS Operational Peak Day Analysis
The existing RWS was also modeled under the maximum observed deliveries of 31 MGD. Tucson
Water staff indicated that to make these peak day deliveries, they resort to operational practices
such as staggering golf course deliveries, etc. The modeling analyses indicated no areas of
negative pressures within the system; however, high velocities and headlosses were identified in
the 24-inch pipeline along Silverbell Road and Thoryndale Road from the Tucson Water RWTP to
the Thornydale Road Reservoir and Booster Station. The modeling results (headlosses) for the
peak day operational deliveries are shown on Figure 3-4.

W I10
S I19
S MIS
SION
RD
N OR
ACLE
RD
S HOU
GHTO
N RD
E 22ND ST
S NOGALES HY
E SPEEDWAY BL
W INA RD
E VALENCIA RD
E BROADWAY BL
S KOL
B RD
N SILVERBELL RD
N SW
AN R
D
W TANGERINE RD
S PAR
K AV
E GRANT RD
N LA
CAN
ADA D
R
S 12T
H AV
S 6TH
AV E GOLF LINKS RD
N THO
RNYD
ALE
RD
N ST
ONE A
V
S SWA
N RD
S KINNEY RD
N CR
AYCR
OFT R
D
W MOORE RD
E SUNRISE DR
N CA
MPBE
LL AV
W IRVINGTON RD
W VALENCIA RD
N MOUNT LEMMON HY
E TANQUE VERDE RD
W RIVER RD
E AJO WY
S ALV
ERNO
N W
YE SNYDER RD
N HO
UGHT
ON R
D
W SPEEDWAY BL
S RITA
RD
S KINO PW
E 36TH ST
E DREXEL RD
E CATA
LINA H
YE IRVINGTON RD
W LAMBERT LN
S PAL
O VE
RDE
RD
N SH
ANNO
N RD
N SO
LDIER
TR
W ANKLAM RD
W AJO WY
N LA
CHO
LLA B
L
W SWEETWATER DR
E AVIATION PW
E SKYLINE DR
S CAR
DINA
L AV
W GATES PASS RD
W NARANJA DR
E BENSON HY
W MAGEE RD
E LOS REALES RD
N 6T
H AV
E RITA RD
W STARR PASS BL
S TUC
SON
BL
E OLD VAIL CONNECTION RD
S PAN
TANO
RD
E 29TH ST
W LINDA VISTA BL
N 1S
T AV
S 10T
H AV
W OVERTON RD
W GRANT RD
N CO
UNTR
Y CLU
B RD
E FORT LOWELL RD
N KO
LB R
D
W PRINCE RD
N BEAR CANYON RD
S FRE
EMAN
RD
S CAM
PBEL
L AV
N WA
DE R
D
S HAR
RISO
N RD
W CAMINO DE
MANAN
A
E PRINCE RD
N EU
CLID
AV
N PA
NTAN
O RD
N LAG
O DE
L ORO
PW
S MAR
K RD
W CORTARO FARMS RD
S OLD
SPAN
ISH TR
E CLOUD RD
E ROCKET RD
W TRAILS END RD
W ROGER RD
E HUGHES ACCESS RD
W IRONWOOD HILL DR
N CASA GRANDE HY
N CORT
ARO R
D
S MID
VALE
PARK
RD
N SA
BINO
CAN
YON
RD
E SKI RUN RD
N HA
RRISO
N RD
S JOS
EPH A
V
W BELMONT RD
W GORET RD
S COU
NTRY
CLU
B RD
W WETMORE RD
W RUTHRAUFF RD
E POORMAN RD
S CAM
INO
DE O
ESTE
N TOR
TOLIT
A RD
N FR
EEMA
N RD
S CAM
INO
VERD
E
N NO
RTHE
RN AV
W SAINT MARYS RD
N ABINGTON RD
E ORANGE GROVE RD
W CONGRESS ST
S VIVI
ANA R
D
N GE
RHAR
T RD
N CASA GRANDE HY HY
W CALLE CONCORDIA
E HERMANS RD
W SUNSET RD
S GOL
F LIN
KS R
D
E LAMBERT LN
E LINDA VISTA BL
E ALVORD RD
N WI
LMOT
RD
N OXBOW RD
E ESCALANTE RD
S MAI
N AV
N TANURI DR
E ROCKET SV
S CRA
YCRO
FT R
D
W LOS REALES RD
S PAN
TANO
RD
S CRA
YCRO
FT R
D
E I10 RAMP
N WI
LMOT
RD
E OLD SPANISH TR
E FORT LOWELL RD
E IRVINGTON RD
E ESCALANTE RD
N KOLB RD
N 1S
T AV
W BOPP RD
N CA
MINO
DE O
ESTE
W MAGEE RD
N WENTWORTH RD
W HARDY RD
S MEL
POME
NE W
Y
S SWA
N RD
W VALENCIA RD
S WILM
OT R
D
N SH
ANNO
N RD
W DREXEL RD
E OLD VAIL RD
S HAR
RISO
N RD
N CA
MINO
DE O
ESTE
N ALV
ERNO
N W
Y
E SKI RUN RD
W HERMANS RD
")
")
")
")
")
")#
#
#
#
#
#
#
#
Starr Pass
Dove Mountain
La Paloma
Houghton Road
Thornydale Road
Reid Park
Udall Park
Reclaimed Water Treatment Plant
Mission Manor
Mountain View
³0 1 2 Miles
Legend# Booster Stations") Reservoirs
Max. Headloss (feet/1000 feet)Diameter < 12 inch
0 - 55 - 10> 10
Diameter >= 12 inch0 - 3> 3
Figure 3-4Existing System - Operational Peak Day Analysis
Maximum Headloss
TUCSON WATERRECYCLED WATER MASTER PLAN

December 2013 01830100.0000 3-10
Recycled Water Master Plan
Reclaimed Water System
Evaluation
3.6 Development and Evaluation of System Improvement Alternatives
Various system improvement alternatives to address the existing deficiencies were developed in
consultation with Tucson Water staff. Figure 3-5 shows the improvement alternatives that were
identified and evaluated:
The North Loop Alternative was developed to relieve high velocities and headlosses in the
transmission main located in Silverbell Road and Thornydale Road.
The East Loop Alternative 1 and East Loop Alternative 2 were developed to relieve high
velocities and headlosses in the area served by the La Paloma Reservoir and Booster
Station.
The Southeast Loop would also help to relieve deficiencies in the area served by the La
Paloma Reservoir and Booster Station.
The South Loop would extend service to areas south of the Houghton Road Reservoir.
The Dove Mountain Alternative was developed to address storage deficiencies and high
velocities and headlosses in the Dove Mountain Area.

W I10
S I19
S MIS
SION
RD
N OR
ACLE
RD
S HOU
GHTO
N RD
E 22ND ST
S NOGALES HY
E SPEEDWAY BL
W INA RD
E VALENCIA RD
E BROADWAY BL
S KOL
B RD
N SILVERBELL RD
N SW
AN R
D
W TANGERINE RD
S PAR
K AV
E GRANT RD
N LA
CAN
ADA D
R
S 12T
H AV
S 6TH
AV E GOLF LINKS RD
N THO
RNYD
ALE
RD
N ST
ONE A
V
S SWA
N RD
S KINNEY RD
N CR
AYCR
OFT R
D
W MOORE RD
E SUNRISE DR
N CA
MPBE
LL AV
W IRVINGTON RD
W VALENCIA RD
N MOUNT LEMMON HY
E TANQUE VERDE RD
W RIVER RD
E AJO WY
S ALV
ERNO
N W
YE SNYDER RD
N HO
UGHT
ON R
D
W SPEEDWAY BL
S RITA
RD
S KINO PW
E 36TH ST
E DREXEL RD
E CATA
LINA H
YE IRVINGTON RD
W LAMBERT LN
S PAL
O VE
RDE
RD
N SH
ANNO
N RD
N SO
LDIER
TR
W ANKLAM RD
W AJO WY
N LA
CHO
LLA B
L
W SWEETWATER DR
E AVIATION PW
E SKYLINE DR
S CAR
DINA
L AV
W GATES PASS RD
W NARANJA DR
E BENSON HY
W MAGEE RD
E LOS REALES RD
N 6T
H AV
E RITA RD
W STARR PASS BL
S TUC
SON
BL
E OLD VAIL CONNECTION RD
S PAN
TANO
RD
E 29TH ST
W LINDA VISTA BL
N 1S
T AV
S 10T
H AV
W OVERTON RD
W GRANT RD
N CO
UNTR
Y CLU
B RD
E FORT LOWELL RD
N KO
LB R
D
W PRINCE RD
N BEAR CANYON RD
S FRE
EMAN
RD
S CAM
PBEL
L AV
N WA
DE R
D
S HAR
RISO
N RD
W CAMINO DE
MANAN
A
E PRINCE RD
N EU
CLID
AV
N PA
NTAN
O RD
N LAG
O DE
L ORO
PW
S MAR
K RD
W CORTARO FARMS RD
S OLD
SPAN
ISH TR
E CLOUD RD
E ROCKET RD
W TRAILS END RD
W ROGER RD
E HUGHES ACCESS RD
W IRONWOOD HILL DR
N CASA GRANDE HY
N CORT
ARO R
D
S MID
VALE
PARK
RD
N SA
BINO
CAN
YON
RD
E SKI RUN RD
N HA
RRISO
N RD
S JOS
EPH A
V
W BELMONT RD
W GORET RD
S COU
NTRY
CLU
B RD
W WETMORE RD
W RUTHRAUFF RD
E POORMAN RD
S CAM
INO
DE O
ESTE
N TOR
TOLIT
A RD
N FR
EEMA
N RD
S CAM
INO
VERD
E
N NO
RTHE
RN AV
W SAINT MARYS RD
N ABINGTON RD
E ORANGE GROVE RD
W CONGRESS ST
S VIVI
ANA R
D
N GE
RHAR
T RD
N CASA GRANDE HY HY
W CALLE CONCORDIA
E HERMANS RD
W SUNSET RD
S GOL
F LIN
KS R
D
E LAMBERT LN
E LINDA VISTA BL
E ALVORD RD
N WI
LMOT
RD
N OXBOW RD
E ESCALANTE RD
S MAI
N AV
N TANURI DR
E ROCKET SV
S CRA
YCRO
FT R
D
W LOS REALES RD
S PAN
TANO
RD
S CRA
YCRO
FT R
D
E I10 RAMP
N WI
LMOT
RD
E OLD SPANISH TR
E FORT LOWELL RD
E IRVINGTON RD
E ESCALANTE RD
N KOLB RD
N 1S
T AV
W BOPP RD
N CA
MINO
DE O
ESTE
W MAGEE RD
N WENTWORTH RD
W HARDY RD
S MEL
POME
NE W
Y
S SWA
N RD
W VALENCIA RD
S WILM
OT R
D
N SH
ANNO
N RD
W DREXEL RD
E OLD VAIL RD
S HAR
RISO
N RD
N CA
MINO
DE O
ESTE
N ALV
ERNO
N W
Y
E SKI RUN RD
W HERMANS RD
")
")
")
")
")
")#*
#*
#*
#*
#*
#*
#*
#*
"
""
" #*
#*
#*#*
Starr Pass
Dove Mountain
La Paloma
Houghton Road
Thornydale Road
Reid Park
Udall Park
Reclaimed Water Treatment Plant
Mission Manor
Mountain View
³0 1 2 Miles
LegendPipes
ExistingProposed
Reservoirs") Existing
" Proposed
Booster Stations#* Existing#* Proposed
Figure 3-5Existing System Improvement AlternativesTUCSON WATER
RECYCLED WATER MASTER PLAN
East Loop Alternative 2
East Loop Alternative 1
North Loop
Southeast Loop
South Loop
Dove Mountain

December 2013 01830100.0000 3-12
Recycled Water Master Plan
Reclaimed Water System
Evaluation
All system improvement alternatives were evaluated to identify the most suitable improvements to
address the existing system deficiencies. The evaluation process was iterative and involved
verification of pressures, velocities, headlosses, and storage tank levels to meet all system
performance criteria. The alternatives with the minimum required improvements and minimum
disruptions to current operational strategies were selected as preferred improvements. Based on
the EPS modeling analyses, Figure 3-6 presents the preferred improvements to address the
existing system deficiencies.
The recommended system improvements were presented to and discussed with Tucson Water
staff, including priorities based primarily on customer demands impacted. Based on the
discussions, Tucson Water staff helped to prioritize the recommended system improvements as
discussed in the following subsections.

Figure 3-6
E I10
W I10
S I19
S MIS
SION
RD
N OR
ACLE
RD
S HOU
GHTO
N RD
E 22ND ST
S NOGALES HY
E SPEEDWAY BL
W INA RD
E VALENCIA RD
E BROADWAY BL
S KOL
B RD
N SILVERBELL RD
N SW
AN R
D
W TANGERINE RD
S PAR
K AV
E GRANT RD
N LA
CAN
ADA D
R
S 12T
H AV
S 6TH
AV E GOLF LINKS RD
N THO
RNYD
ALE
RD
N ST
ONE A
V
S SWA
N RD
S KINNEY RD
N CR
AYCR
OFT R
D
W MOORE RD
E SUNRISE DR
N CA
MPBE
LL AV
W IRVINGTON RD
W VALENCIA RD
N MOUNT LEMMON HY
E TANQUE VERDE RD
W RIVER RD
E AJO WY
S ALV
ERNO
N W
YE SNYDER RD
N HO
UGHT
ON R
D
W SPEEDWAY BL
S RITA
RD
S KINO PW
E 36TH ST
E DREXEL RD
E CATA
LINA H
YE IRVINGTON RD
W LAMBERT LN
S PAL
O VE
RDE
RD
N SH
ANNO
N RD
N SO
LDIER
TR
W ANKLAM RD
W AJO WY
N LA
CHO
LLA B
L
W SWEETWATER DR
E AVIATION PW
E SKYLINE DR
S CAR
DINA
L AV
W GATES PASS RD
W NARANJA DR
E BENSON HY
W MAGEE RD
E LOS REALES RD
N 6T
H AV
E RITA RD
W STARR PASS BL
S TUC
SON
BL
E OLD VAIL CONNECTION RD
S PAN
TANO
RD
E 29TH ST
W LINDA VISTA BL
N 1S
T AV
S 10T
H AV
W OVERTON RD
W GRANT RD
N CO
UNTR
Y CLU
B RD
E FORT LOWELL RD
N KO
LB R
D
W PRINCE RD
N BEAR CANYON RD
S FRE
EMAN
RD
S CAM
PBEL
L AV
N WA
DE R
D
S HAR
RISO
N RD
W CAMINO DE
MANAN
A
E PRINCE RD
N EU
CLID
AV
N PA
NTAN
O RD
N LAG
O DE
L ORO
PW
S MAR
K RD
W CORTARO FARMS RD
S OLD
SPAN
ISH TR
E CLOUD RD
E ROCKET RD
W TRAILS END RD
W ROGER RD
E HUGHES ACCESS RD
W IRONWOOD HILL DR
N CASA GRANDE HY
N CORT
ARO R
D
S MID
VALE
PARK
RD
N SA
BINO
CAN
YON
RD
E SKI RUN RD
N HA
RRISO
N RD
S JOS
EPH A
V
W BELMONT RD
W GORET RD
S COU
NTRY
CLU
B RD
W WETMORE RD
W RUTHRAUFF RD
E POORMAN RD
S CAM
INO
DE O
ESTE
N TOR
TOLIT
A RD
N FR
EEMA
N RD
S CAM
INO
VERD
E
N NO
RTHE
RN AV
W SAINT MARYS RD
N ABINGTON RD
E ORANGE GROVE RD
W CONGRESS ST
S VIVI
ANA R
D
N GE
RHAR
T RD
N CASA GRANDE HY HY
W CALLE CONCORDIA
E HERMANS RD
W SUNSET RD
S GOL
F LIN
KS R
D
E LAMBERT LN
E LINDA VISTA BL
E ALVORD RD
N WI
LMOT
RD
N OXBOW RD
E ESCALANTE RD
S MAI
N AV
N TANURI DR
E ROCKET SV
S CRA
YCRO
FT R
D
W LOS REALES RD
S PAN
TANO
RD
S CRA
YCRO
FT R
D
E I10 RAMP
N WI
LMOT
RD
E OLD SPANISH TR
E FORT LOWELL RD
E IRVINGTON RD
E ESCALANTE RD
N KOLB RD
N 1S
T AV
W BOPP RD
N CA
MINO
DE O
ESTE
W MAGEE RD
N WENTWORTH RD
W HARDY RD
S MEL
POME
NE W
Y
S SWA
N RD
W VALENCIA RD
S WILM
OT R
D
N SH
ANNO
N RD
W DREXEL RD
E OLD VAIL RD
S HAR
RISO
N RD
N CA
MINO
DE O
ESTE
N ALV
ERNO
N W
Y
E SKI RUN RD
W HERMANS RD
")
")
")
")
")
")#*
#*
#*
#*
#*
#*
#*
#*
"
"
#*
#*
Starr Pass
Dove Mountain
La Paloma
Houghton Road
Thornydale Road
Reid Park
Udall Park
Reclaimed Water Treatment Plant
Mission Manor
Mountain View
³0 1 2 Miles
LegendPipes
ExistingRecommended
Reservoirs") Existing
" Recommended
Booster Stations#* Existing#* Recommended
Recommended System Improvements to Correct Existing Deficiencies
TUCSON WATERRECYCLED WATER MASTER PLAN
Northeast Loop
North Loop
Dove Mountain

December 2013 01830100.0000 3-14
Recycled Water Master Plan
Reclaimed Water System
Evaluation
3.6.1 North Loop Improvements
The North Loop improvements are considered the highest priority to address existing system
deficiencies, as the area represents the highest volume of reclaimed water deliveries,
approximately 10 MGD of the 35.8 MGD total peak day demand. Deliveries to the north area
(Dove Mountain and Oro Valley) represent the largest source of reclaimed water revenues to
Tucson Water. This loop would also improve service to Oro Valley, prepare the system for future
additional service to MDWID, and relieve stress on the existing 24-inch diameter pipeline along
Thornydale Road. The North Loop would add redundancy and improve reliability for reclaimed
water customers in the area. The North Loop improvements include:
11 miles of 24-inch diameter pipeline along La Cholla Boulevard from Roger Road to El
Camino del Norte Road,
A 14 MGD booster station near the intersection of Overton Road and La Cholla Road.
3.6.2 Dove Mountain Area Improvements
The Dove Mountain Area improvements are considered second highest priority as these
improvements improve service to a group of high-demand customers (6.25 MGD). Also, the
primary improvement is a new storage reservoir which will also contribute to improving service in
the entire north area. The improvements will address storage deficiencies and would help to
improve the ability to meet contractual agreements with golf courses in this area during peak day
demand periods. The Dove Mountain Area improvements include:
A 6 MG reservoir co-located with an existing potable reservoir (the existing 0.1 MG stand
pipe serving as existing storage in the area will be decommissioned). This new storage is
part of the required additional system storage to provide hydraulic equalization under peak
day demand conditions.
2,000 feet of new 16-inch diameter pipe paralleling existing pipes.
1 mile of new 12-inch diameter pipe paralleling existing pipes.
3.6.3 Northeast Loop Improvements
The Northeast Loop is considered the third priority improvements to address existing system
deficiencies. The improvements would connect the pipeline along Tanque Verde Road to the

December 2013 01830100.0000 3-15
Recycled Water Master Plan
Reclaimed Water System
Evaluation
pipeline along Synder Road east of the La Paloma reservoir. The improvements are needed to
supplement booster pumping and storage at the La Paloma reservoir, and to address high
velocities and headlosses identified in existing pipelines near the La Paloma Reservoir and along
Snyder Road. The improvements will improve reliability and the ability to meet contractual
agreements with golf courses in the La Paloma area during peak day demand periods. The
Northeast Loop improvements include:
3.5 miles of 24-inch diameter pipeline along Sabino Canyon Road from Tanque Verde
Road to Snyder Road.
1 mile of new 16-inch diameter pipe paralleling an existing pipe along Sabino Canyon
Road from Snyder Road to Surprise Drive.
1 mile of new 16-inch diameter pipe paralleling an existing pipe along Surprise Drive from
Sabino Canyon Road to Kolb Road.
A 7.3-MG storage tank and 5 MGD booster station located near the intersection of Cloud
Road and Sabino Canyon Road. The new storage is part of the required additional system
storage to provide hydraulic equalization under peak day demand conditions.

December 2013 01830100.0000 4-1
Recycled Water Master Plan
Reclaimed Water System
Evaluation
4 Evaluation of Future System
This chapter presents future system analyses which examined the impacts of future Tucson Water
reclaimed water demands (including existing Pima County and Oro Valley demands) to determine
additional future system improvements that will be required to maintain reliable service to Tucson
Water customers. A separate analysis was also conducted to determine if the RWS could supply
up to 4,000 acre-feet per year (AFY) to the proposed Tucson Water/Pima County Southeast
Houghton Area Recharge Project (SHARP).
Chapter 5 of this technical memorandum presents additional future system analyses that examine
the impact of other future demands from Pima County, Oro Valley, MDWID, FWID and Spanish
Trails to determine the magnitude of improvements that may be required should Tucson Water
choose to supply these future demands.
4.1 Southeast Houghton Area Recharge Project Analysis
SHARP is a proposed joint Tucson Water and Pima County recycled water recharge project. The
potential SHARP site is shown on Figure 4-1. The project concept involves recharging up to 4,000
AFY at the SHARP facility, with each entity contributing up to 2,000 AFY, to develop long-term
storage credits. The project concept assumes that reclaimed water would be sent to SHARP only
during periods of low reclaimed water demands in the RWS.
An analysis was performed to evaluate the ability of the existing RWS, without any improvements,
to deliver reclaimed water to the SHARP site. The current limiting factor in providing reclaimed
water to the SHARP site is the production capacity during peak demand days as discussed in
Section 3.2. However, for demonstration purposes, the analysis was based on delivering the
4,000 AF uniformly throughout the year. The modeling analysis demonstrated that the required
deliveries to SHARP could be made even under peak day demand conditions. That is, if the
reclaimed water was available, the Udall (8.4 MGD) and Reid Park (3.2 MGD) booster stations
have sufficient pumping capacity to deliver the required reclaimed water to the SHARP site on a
peak day demand condition, without imposing undesirable stresses on the southeast portion of the
RWS. This analysis demonstrates that the existing RWS would also be capable of delivering
sufficient reclaimed water to SHARP during the low demand periods as intended.
Additionally, Tucson Water staff conducted a field test during a period of low demand to determine
how much reclaimed water could actually be pumped to the Houghton Road Reservoir. The field

December 2013 01830100.0000 4-2
Recycled Water Master Plan
Reclaimed Water System
Evaluation
test showed that the Reid Park and Udall booster stations could deliver 4,000 AFY to SHARP via
the existing distribution system, further confirming the hydraulic analysis results.
4.2 Analysis of Future Tucson Water Reclaimed Water Demands
The following additional analyses of future system and demand conditions were all conducted
assuming that the recommended improvements described in Chapter 3 of this technical
memorandum are constructed and are operational. Tucson Water’s reclaimed water demand
projections are discussed in Chapter 5 of the Recycled Water Master Plan as follows:
A demand increase of 560 AFY by 2016 which is based on fiscal year 2012 financial and
rate projections provided by Tucson Water Financial Services.
Between 2016 and 2020, the demand would increase by 800 AFY to account for a
proposed University of Arizona Bio5 Institute golf course (also included in the Tucson
Water Financial Services projections).
Beyond 2020, reclaimed water demands are assumed to increase by 500 AFY every five
years, based on historic new connections to the RWS.
In providing the above reclaimed water demand projections, Tucson Water indicated that there
was a significant amount of uncertainty in identifying where the additional demands would occur
(other than the University of Arizona Bio5 golf course). In consultation with Tucson Water staff, the
future demands were allocated uniformly as described below. Figure 4-1 shows the allocation of
Tucson Water’s future reclaimed water demands.
For 2015, the 560 AFY increase in demand was distributed uniformly to the central area of
the RWS to represent potential future infill customers.
For 2020, the 800 AFY increase in demand was applied downstream of the Houghton
Road booster station to represent a new connection for the planned University of Arizona
Bio5 Institute golf course.
For 2025, the 500 AFY increase in demand was again distributed uniformly to the central
area of the reclaimed water distribution system and to the Starr Pass pipeline.
For 2030, the 500 AFY increase in demand was also applied downstream of the Houghton Road booster station to represent the projected growth in the Southeast region.

December 2013 01830100.0000 4-3
Recycled Water Master Plan
Reclaimed Water System
Evaluation
Figure 4-1. Future Tucson Water Reclaimed Water Demands
2025 - 2030
500 AFY
2015 - 2020: 800 AFY
University of Arizona
Bio5 Institute golf course
• 2010 - 2015: 560 AFY
(without Starr Pass line)
• 2020 - 2025: 500 AFY

December 2013 01830100.0000 4-4
Recycled Water Master Plan
Reclaimed Water System
Evaluation
Table 4-1 summarizes the projected increases in Tucson Water customer reclaimed water
demands.
Table 4-1. Comparison of Existing Reclaimed Water Production and Peak Day Demands
Year
Increase in Average Day
Demand (AFY)
Increase in Peak Day Demand
(MGD)1
Peak Day Demand (MGD)
2
2010 -- -- 35.8
2015 560 1.2 37.0
2020 800 1.6 38.6
2025 500 1.0 39.6
2030 500 1.0 40.6 1Based on a peaking factor of 2.31 for increases in demand
2Includes existing Pima County and Oro Valley demands
Analysis of the RWS under future Tucson Water demands did not reveal any additional
deficiencies in the 2015 and 2025 time periods. For 2020, an 8 MGD booster station expansion at
the Tucson Water RWTP is required to meet projected peak day demands. This project is already
in the Tucson Water reclaimed water CIP. For 2030 peak day demands, a 1.5 MGD booster
station upgrade at the Houghton Reservoir is required. Figure 4-2 shows the required RWS
upgrades to supply the projected Tucson Water reclaimed water demands.

E I10
W I10
S I19
S MIS
SION
RD
N OR
ACLE
RD
S HOU
GHTO
N RD
E 22ND ST
S NOGALES HY
E SPEEDWAY BL
W INA RD
E VALENCIA RD
E BROADWAY BL
S KOL
B RD
N SILVERBELL RD
N SW
AN R
D
W TANGERINE RD
S PAR
K AV
E GRANT RD
N LA
CAN
ADA D
R
S 12T
H AV
S 6TH
AV E GOLF LINKS RD
N THO
RNYD
ALE
RD
N ST
ONE A
V
S SWA
N RD
S KINNEY RD
N CR
AYCR
OFT R
D
W MOORE RD
E SUNRISE DR
N CA
MPBE
LL AV
W IRVINGTON RD
W VALENCIA RD
N MOUNT LEMMON HY
E TANQUE VERDE RD
W RIVER RD
E AJO WY
S ALV
ERNO
N W
YE SNYDER RD
N HO
UGHT
ON R
D
W SPEEDWAY BL
S RITA
RD
S KINO PW
E 36TH ST
E DREXEL RD
E CATA
LINA H
YE IRVINGTON RD
W LAMBERT LN
S PAL
O VE
RDE
RD
N SH
ANNO
N RD
N SO
LDIER
TR
W ANKLAM RD
W AJO WY
N LA
CHO
LLA B
L
W SWEETWATER DR
E AVIATION PW
E SKYLINE DR
S CAR
DINA
L AV
W GATES PASS RD
W NARANJA DR
E BENSON HY
W MAGEE RD
E LOS REALES RD
N 6T
H AV
E RITA RD
W STARR PASS BL
S TUC
SON
BL
E OLD VAIL CONNECTION RD
S PAN
TANO
RD
E 29TH ST
W LINDA VISTA BL
N 1S
T AV
S 10T
H AV
W OVERTON RD
W GRANT RD
N CO
UNTR
Y CLU
B RD
E FORT LOWELL RD
N KO
LB R
D
W PRINCE RD
N BEAR CANYON RD
S FRE
EMAN
RD
S CAM
PBEL
L AV
N WA
DE R
D
S HAR
RISO
N RD
W CAMINO DE
MANAN
A
E PRINCE RD
N EU
CLID
AV
N PA
NTAN
O RD
N LAG
O DE
L ORO
PW
S MAR
K RD
W CORTARO FARMS RD
S OLD
SPAN
ISH TR
E CLOUD RD
E ROCKET RD
W TRAILS END RD
W ROGER RD
E HUGHES ACCESS RD
W IRONWOOD HILL DR
N CASA GRANDE HY
N CORT
ARO R
D
S MID
VALE
PARK
RD
N SA
BINO
CAN
YON
RD
E SKI RUN RD
N HA
RRISO
N RD
S JOS
EPH A
V
W BELMONT RD
W GORET RD
S COU
NTRY
CLU
B RD
W WETMORE RD
W RUTHRAUFF RD
E POORMAN RD
S CAM
INO
DE O
ESTE
N TOR
TOLIT
A RD
N FR
EEMA
N RD
S CAM
INO
VERD
E
N NO
RTHE
RN AV
W SAINT MARYS RD
N ABINGTON RD
E ORANGE GROVE RD
W CONGRESS ST
S VIVI
ANA R
D
N GE
RHAR
T RD
N CASA GRANDE HY HY
W CALLE CONCORDIA
E HERMANS RD
W SUNSET RD
S GOL
F LIN
KS R
D
E LAMBERT LN
E LINDA VISTA BL
E ALVORD RD
N WI
LMOT
RD
N OXBOW RD
E ESCALANTE RD
S MAI
N AV
N TANURI DR
E ROCKET SV
S CRA
YCRO
FT R
D
W LOS REALES RD
S PAN
TANO
RD
S CRA
YCRO
FT R
D
E I10 RAMP
N WI
LMOT
RD
E OLD SPANISH TR
E FORT LOWELL RD
E IRVINGTON RD
E ESCALANTE RD
N KOLB RD
N 1S
T AV
W BOPP RD
N CA
MINO
DE O
ESTE
W MAGEE RD
N WENTWORTH RD
W HARDY RD
S MEL
POME
NE W
Y
S SWA
N RD
W VALENCIA RD
S WILM
OT R
D
N SH
ANNO
N RD
W DREXEL RD
E OLD VAIL RD
S HAR
RISO
N RD
N CA
MINO
DE O
ESTE
N ALV
ERNO
N W
Y
E SKI RUN RD
W HERMANS RD
")
"
"
"
"#*
#*
#*
#*
#*
#*
#*
#*
"
"
#*
#*
#*#*
Starr Pass
Dove Mountain
La Paloma
Houghton Road
Thornydale Road
Reid Park
Udall Park
Reclaimed Water Treatment Plant
Mission Manor
Mountain View
³0 1 2 Miles
LegendPipes
ExistingReservoirs") Existing
Booster Stations#* Existing#* Recommended
Recommended Improvements for Future Tucson Water Demands
TUCSON WATERRECYCLED WATER MASTER PLAN
Figure 4-2
ProposedSHARP Location

December 2013 01830100.0000 5-1
Recycled Water Master Plan
Reclaimed Water System
Evaluation
5 Evaluation of Impacts of Other Entity Future Reclaimed Water Demands
This chapter presents future system analyses that examine the impacts to the required existing
and future system improvements identified in Chapter 3 and 4 of this technical memorandum if
Tucson Water serves additional future demands of first, other water providers (Oro Valley,
MDWID, FWID and Spanish Trail Water Company); and second, Pima County. These analyses
determine the types and magnitude of improvements that may be required to serve these
additional future demands.
5.1 Other Entity Reclaimed Water Demand Projections
Figure 2-2 showed the locations of existing and future connections to the RWS of other water
providers, including Oro Valley, MDWID, FWID, and Spanish Trail Water Company. Table 5-1
presents a summary of the future reclaimed water demands projected by each water provider.
Table 5-1. Other Water Providers Projected Additional Reclaimed Water Demands
Year
Increase in Demand (MGD)
Oro Valley1 MDWID FWID
Spanish Trail Total
Existing - - - - -
2015 1.1 0.7 0.08 0.01 1.9
2020 1.3 0.3 0.03 0.002 1.6
2025 0.9 0.4 0.02 0.002 1.3
2030 0.9 0.5 0.05 0.003 1.5 1In addition to use of its own effluent entitlement, demand includes agreed upon use of 200 AFY of Tucson Water’s entitlement for ten years (2012 to 2021)
Figure 5-1 shows the locations of Pima County’s projected future reclaimed water demands which
total 3,267 AFY (2.92 MGD) of additional demand by 2030 (the County does not have projected
demands for intermediate time periods), which includes 2,000 AFY for the SHARP project.
Attachment B contains Pima County’s existing and projected future reclaimed water demands.
5.2 Analysis of Future Other Water Provider Reclaimed Water Demands
An initial modeling analysis was conducted to identify the impacts of the future reclaimed water
demands of Oro Valley, MDWID, FWID, and Spanish Trail Water Company. For the analysis of
peak day demand conditions, a peaking factor of 2.31 was assumed for all demands, except

December 2013 01830100.0000 5-2
Recycled Water Master Plan
Reclaimed Water System
Evaluation
MDWID demands. Tucson Water staff indicated that MDWID would be served their reclaimed
water entitlements on an “as available basis.”
The initial analysis indicated that if Tucson Water decides to serve the other water provider future
demands, booster station upgrades would be required at the Thornydale Booster Station to satisfy
the future Oro Valley demands as summarized on Table 5-2 and shown on Figure 5-2. The
existing peak day demand for Oro Valley included in the hydraulic model is approximately 3.8
MGD and the existing Thornydale Booster Station capacity for Oro Valley demands is 4.4 MGD.
The peak day demand for Oro Valley is projected to increase to about 6.3 MGD in 2015 and 13.5
MGD in 2030.
At the direction of Tucson Water, the recommended Thornydale Booster Station upgrades are
included in the recommended system improvements in Chapter 6 of this technical memorandum.
It is assumed that Oro Valley will make the necessary improvement in their reclaimed water
system to accept the additional water.
Table 5-2. Thornydale Booster Station Upgrades for Future Oro Valley Reclaimed Water Demands
Year Booster Station Upgrades
2015 4.4 MGD at 270 feet Total Dynamic Head
2025 4.4 MGD at 270 feet Total Dynamic Head
2030 1 MGD at 270 feet Total Dynamic Head
5.3 Analysis of Future Pima County Reclaimed Water Demands
The additional analysis of future Pima County reclaimed water demands included addition of all
their projected irrigation demands in 2030 (the 2,000 AFY SHARP demand was not included as
that demand would be met during off peak conditions). For the peak day analysis, a peaking factor
of 2.31 was used for all Pima County irrigation demands. The analysis indicated that if Tucson
Water decides to serve future Pima County demands, additional system improvements may be
needed. The additional system improvements to meet future Pima County demands in 2030
include a 1 MGD booster station upgrade at Sabino Canyon Road, a 1.5 MGD booster station
upgrade at Udall Park, and 1.5 miles of 8-inch diameter pipeline along Snyder Road (also shown
on Figure 5-2).
The potential additional system improvements to serve future Pima County demands are not
included in the recommended system improvements in Chapter 6 of this technical memorandum.

")
")
")
")
")
")
#
#
#
#
#
#
#
#
E I10
W I10
S I19
S MISS
ION
RD
N OR
ACLE
RD
S HOU
GHTO
N RD
E 22ND ST
S NOGALES HY
E SPEEDWAY BL
W INA RD
E VALENCIA RD
E BROADWAY BL
S KOL
B RD
N SILVERBELL RD
N SW
AN R
D
W TANGERINE RD
S PAR
K AV
E GRANT RD
N LA
CAN
ADA D
R
S 12T
H AV
S 6TH
AV E GOLF LINKS RD
N THO
RNYD
ALE
RD
N ST
ONE A
V
S SWA
N RD
S KINNEY RD
N CR
AYCR
OFT R
D
E OLD SPANISH TR
W MOORE RD
E SUNRISE DR
N CA
MPBE
LL AV
W IRVINGTON RD
W VALENCIA RD
N MOUNT LEMMON HY
E TANQUE VERDE RD
W RIVER RD
E AJO WY
S ALV
ERNO
N W
YE SNYDER RD
N HO
UGHT
ON R
D
W SPEEDWAY BL
S RITA
RD
S KINO PW
E 36TH ST
E DREXEL RD
E CATA
LINA H
YE IRVINGTON RD
W LAMBERT LN
S PAL
O VE
RDE
RD
N SH
ANNO
N RD
N SO
LDIER
TR
W ANKLAM RD
W AJO WY
N LA
CHO
LLA B
L
W SWEETWATER DR
S CAM
INO
LOMA
ALTA
E AVIATION PW
E SKYLINE DR
W GO
LDEN
GAT
E RD
S CAR
DINA
L AV
W GATES PASS RD
W NARANJA DR
E BENSON HY
W MAGEE RD
E LOS REALES RD
N 6T
H AV
E RITA RD
W STARR PASS BL
N KINNEY RD
S TUC
SON
BL
E OLD VAIL CONNECTION RD
S PAN
TANO
RD
E 29TH ST
W LINDA VISTA BL
N 1S
T AV
S 10T
H AV
W OVERTON RD
W GRANT RD
N CO
UNTR
Y CLU
B RD
E FORT LOWELL RD
N KO
LB R
D
W PRINCE RD
N BEAR CANYON RD
S FRE
EMAN
RD
S CAM
PBEL
L AV
N WA
DE R
D
S HAR
RISO
N RD
W CAMINO DE
MANAN
A
E PRINCE RD
N EU
CLID
AV
W BENSON HY
N PA
NTAN
O RD
N LAG
O DE
L ORO
PW
W PICTURE ROCKS RD
S MAR
K RD
W CORTARO FARMS RD
S OLD
SPAN
ISH TR
E CLOUD RD
E ROCKET RD
S WEN
TWOR
TH R
D
W TRAILS END RD
W ROGER RD
E HUGHES ACCESS RD
W IRONWOOD HILL DR
N CASA GRANDE HY
N CORT
ARO R
D
S MID
VALE
PARK
RD
N SA
BINO
CANY
ON R
D
E SKI RUN RD
N HA
RRISO
N RD
S JOS
EPH
AV
W BELMONT RD
W GORET RD
S COU
NTRY
CLU
B RD
W WETMORE RD
W RUTHRAUFF RD
E POORMAN RD
S CAM
INO
DE O
ESTE
N TOR
TOLIT
A RD
N FR
EEMA
N RD
S CAM
INO
VERD
E
N NO
RTHE
RN AV
W SAINT MARYS RD
N ABINGTON RD
E ORANGE GROVE RD
W CONGRESS ST
S VIV
IANA R
DN
GERH
ART R
D
N CASA GRANDE HY HY
E PIMA MINE RD
W CALLE CONCORDIA
E HERMANS RD
W SUNSET RD
S GOL
F LIN
KS R
D
E LAMBERT LN
E LINDA VISTA BL
E ALVORD RD
N WI
LMOT
RD
N OXBOW RD
E ESCALANTE RD
S MAIN
AV
S I19
RAM
P N TANURI DR
E ROCKET SV
S CRA
YCRO
FT R
D
W LOS REALES RD
S PAN
TANO
RD
S CRA
YCRO
FT R
D
E I10 RAMP
N WI
LMOT
RD
E OLD SPANISH TR
E FORT LOWELL RD
E IRVINGTON RD
E ESCALANTE RD
N KOLB RD
N 1S
T AV
W BOPP RD
N CA
MINO
DE O
ESTE
W MAGEE RD
N DA
VIDSO
N RD
N WENTWORTH RD
W HARDY RD
S MEL
POME
NE W
Y
S SWA
N RD
W VALENCIA RD
W TANGERINE RD
S WILM
OT R
D
N SH
ANNO
N RD
W DREXEL RD
E OLD VAIL RD
S HAR
RISO
N RD
N CA
MINO
DE O
ESTE
N ALV
ERNO
N WY
E SKI RUN RD
W HERMANS RD
!
!
!!
!
!
!
!
!
!!
!
!
!
!
!
!
Starr Pass
Dove Mountain
La Paloma
Houghton Road
Thornydale Road
Reid Park
Udall Park
Reclaimed Water Treatment Plant
Mission Manor
Mountain View
³0 1 2 Miles
Legend# Booster Stations") Reservoirs
PipesDemandMGD! 0.02 - 0.1! 0.1 - 0.15! 0.15 - 0.3
! 0.3 - 1.25
! 1.25 - 4.1
Figure 5-1Potential Future Pima County Reclaimed DemandsTUCSON WATER
RECYCLED WATER MASTER PLAN

E I10
W I10
S I19
S MIS
SION
RD
N OR
ACLE
RD
S HOU
GHTO
N RD
E 22ND ST
S NOGALES HY
E SPEEDWAY BL
W INA RD
E VALENCIA RD
E BROADWAY BL
S KOL
B RD
N SILVERBELL RD
N SW
AN R
D
W TANGERINE RD
S PAR
K AV
E GRANT RD
N LA
CAN
ADA D
R
S 12T
H AV
S 6TH
AV E GOLF LINKS RD
N THO
RNYD
ALE
RD
N ST
ONE A
V
S SWA
N RD
S KINNEY RD
N CR
AYCR
OFT R
D
W MOORE RD
E SUNRISE DR
N CA
MPBE
LL AV
W IRVINGTON RD
W VALENCIA RD
N MOUNT LEMMON HY
E TANQUE VERDE RD
W RIVER RD
E AJO WY
S ALV
ERNO
N W
YE SNYDER RD
N HO
UGHT
ON R
D
W SPEEDWAY BL
S RITA
RD
S KINO PW
E 36TH ST
E DREXEL RD
E CATA
LINA H
YE IRVINGTON RD
W LAMBERT LN
S PAL
O VE
RDE
RD
N SH
ANNO
N RD
N SO
LDIER
TR
W ANKLAM RD
W AJO WY
N LA
CHO
LLA B
L
W SWEETWATER DR
E AVIATION PW
E SKYLINE DR
S CAR
DINA
L AV
W GATES PASS RD
W NARANJA DR
E BENSON HY
W MAGEE RD
E LOS REALES RD
N 6T
H AV
E RITA RD
W STARR PASS BL
S TUC
SON
BL
E OLD VAIL CONNECTION RD
S PAN
TANO
RD
E 29TH ST
W LINDA VISTA BL
N 1S
T AV
S 10T
H AV
W OVERTON RD
W GRANT RD
N CO
UNTR
Y CLU
B RD
E FORT LOWELL RD
N KO
LB R
D
W PRINCE RD
N BEAR CANYON RD
S FRE
EMAN
RD
S CAM
PBEL
L AV
N WA
DE R
D
S HAR
RISO
N RD
W CAMINO DE
MANAN
A
E PRINCE RD
N EU
CLID
AV
N PA
NTAN
O RD
N LAG
O DE
L ORO
PW
S MAR
K RD
W CORTARO FARMS RD
S OLD
SPAN
ISH TR
E CLOUD RD
E ROCKET RD
W TRAILS END RD
W ROGER RD
E HUGHES ACCESS RD
W IRONWOOD HILL DR
N CASA GRANDE HY
N CORT
ARO R
D
S MID
VALE
PARK
RD
N SA
BINO
CAN
YON
RD
E SKI RUN RD
N HA
RRISO
N RD
S JOS
EPH A
V
W BELMONT RD
W GORET RD
S COU
NTRY
CLU
B RD
W WETMORE RD
W RUTHRAUFF RD
E POORMAN RD
S CAM
INO
DE O
ESTE
N TOR
TOLIT
A RD
N FR
EEMA
N RD
S CAM
INO
VERD
E
N NO
RTHE
RN AV
W SAINT MARYS RD
N ABINGTON RD
E ORANGE GROVE RD
W CONGRESS ST
S VIVI
ANA R
D
N GE
RHAR
T RD
N CASA GRANDE HY HY
W CALLE CONCORDIA
E HERMANS RD
W SUNSET RD
S GOL
F LIN
KS R
D
E LAMBERT LN
E LINDA VISTA BL
E ALVORD RD
N WI
LMOT
RD
N OXBOW RD
E ESCALANTE RD
S MAI
N AV
N TANURI DR
E ROCKET SV
S CRA
YCRO
FT R
D
W LOS REALES RD
S PAN
TANO
RD
S CRA
YCRO
FT R
D
E I10 RAMP
N WI
LMOT
RD
E OLD SPANISH TR
E FORT LOWELL RD
E IRVINGTON RD
E ESCALANTE RD
N KOLB RD
N 1S
T AV
W BOPP RD
N CA
MINO
DE O
ESTE
W MAGEE RD
N WENTWORTH RD
W HARDY RD
S MEL
POME
NE W
Y
S SWA
N RD
W VALENCIA RD
S WILM
OT R
D
N SH
ANNO
N RD
W DREXEL RD
E OLD VAIL RD
S HAR
RISO
N RD
N CA
MINO
DE O
ESTE
N ALV
ERNO
N W
Y
E SKI RUN RD
W HERMANS RD
")
"
"
"
"#*
#*
#*
#*
#*
#*
#*
#*
"
"
#*
#*#*
#*
#*
Starr Pass
Dove Mountain
La Paloma
Houghton Road
Thornydale Road
Reid Park
Udall Park
Reclaimed Water Treatment Plant
Mission Manor
Mountain View
³0 1 2 Miles
LegendPipes
ExistingRecomended
Reservoirs") Existing
Booster Stations#* Existing#* Recommended
Potential Improvements to ServeFuture Pima County and Other Water Providers
TUCSON WATERRECYCLED WATER MASTER PLAN
Figure 5-2
December 2013 01830100.0000 6-5
Recycled Water Master Plan
Reclaimed Water System
Evaluation
6 Recommended Schedule of System Improvements and Costs
This chapter presents the recommended RWS system improvements identified in Chapter 3 to
address existing system deficiencies (which includes serving existing Pima County and Oro Valley
demands), and Chapter 4 to serve future Tucson Water reclaimed water customers and Oro
Valley only. The recommended improvements do not include providing service to future Pima
County, MDWID, FWID and Spanish Trail Water Company demands described in Chapter 5.
6.1 Basis of Capital Cost Opinions
The capital cost opinions developed herein are based on available existing studies, recent projects
with similar components, manufacturers’ budget estimates, standard construction cost estimating
manuals, and engineering judgment. The level of accuracy for the cost opinions corresponds to
Class 5 as defined by the Association for the Advancement of Cost Engineering (AACE)
International. Class 4 estimates are generally prepared based on limited information and have a
typical accuracy range of -30 percent to +50 percent. This level of cost estimating is typically done
for feasibility studies and concept evaluation.
Attachment C contains the unit cost information and other assumptions used for developing cost
opinions for new RWS infrastructure. Unit capital costs include engineering and design, materials
of construction, installation, and contractor overhead and profit. Different unit cost values were
used for pipes that were located in developed and undeveloped areas. Pipes located in developed
areas have higher unit costs to account for additional costs associated with pavement resurfacing
and traffic management. All costs also include a 25 percent factor for engineering and construction
administration, and a 30 percent factor for project contingencies. All costs are in January 2012
dollars referenced to an Engineering News Record Construction Cost Index (ENR CCI) of 9,176.
6.2 Recommended Schedule of System Improvements and Costs
The recommendations resulting from the hydraulic modeling analyses of the RWS are
summarized in Table 6-1 and illustrated on Figure 6-1. Tucson Water should incorporate the
recommended system improvements and costs in the reclaimed water CIP to continue its
commitment to providing reliable reclaimed water service.

December 2013 01830100.0000 6-6
Recycled Water Master Plan
Reclaimed Water System
Evaluation
Table 6-1. Schedule of Recommended RWS Improvements and Cost Opinions
Project No.
Improvement Projected Capital Costs ($1,000)
1,2,3
FY 2013-2017
FY 2018-2022
FY 2023-Build Out
Total
IMPROVEMENTS TO ADDRESS EXISTING SYSTEM DEFICIENCIES
North Loop Improvements (Priority 1)
P-1 Pipe - 24-inch diameter, 57,500 LF $20,400 $20,400
BPS-1 Booster Station - 14 MGD @ 270 ft $2,900 $2,900
Subtotal $23,200 $23,200
Dove Mountain Area Improvements (Priority 2)
Pipe
P-2 8-inch diameter, 2,300 LF $400 $400
P-3 12-inch diameter, 5,500 LF $1,100 $1,100
P-4 16-inch diameter, 2,100 LF $600 $600
T-1 Storage - 6 MG $8,300 $8,300
Subtotal $10,200 $10,200
Northeast Loop Improvements (Priority 3)
Pipe
P-5 16-inch diameter, 10,600 LF $1,500 $1,200 $2,700
P-6 24-inch diameter, 18,800 LF $3,700 $3,000 $6,700
BPS-2 Booster Station - 5 MGD @ 340 ft $1,700 $1,400 $3,100
T-2 Storage - 7.3 MG $5,600 $4,600 $10,200
Subtotal $12,300 $10,100 $22,400
Subtotals Existing System Deficiencies $45,700 $10,100 $55,800
IMPROVEMENTS TO SERVE FUTURE TUCSON WATER DEMANDS
BPS-3 Tucson Reclaimed Water Plant Booster Station
4
8 MGD @ 440 ft $2,700 $2,700
BPS-4 Houghton Road Booster Station 1.5 MGD @ 220 ft $900 $900
BPS-5 Thornydale Booster Station
5
4.4 MGD @ 270 ft $2,600
$2,600
BPS-6 Thornydale Booster Station
5
5.4 MGD @ 270 ft
$3,200 $3,200
Subtotals Future Tucson Water Demands $2,600 $2,700 $4,100 $9,400
GRAND TOTALS $48,300 $12,800 $4,100 $65,200 1January 2012 (ENR CCI = 9176)
2Cost opinions include engineering & administration at 25% and project contingencies at 30%
3Fiscal Year ending June 30 of the year indicated
4Project included in Tucson Water's proposed 10-year CIP
5Thornydale Booster Station upgrades necessary to serve future Oro Valley reclaimed water demands. Recommended
system improvement added at request of Tucson Water staff.

Figure 6-1
E I10
W I10
S I19
S MIS
SION
RD
N OR
ACLE
RD
S HOU
GHTO
N RD
E 22ND ST
S NOGALES HY
E SPEEDWAY BL
W INA RD
E VALENCIA RD
E BROADWAY BL
S KOL
B RD
N SILVERBELL RD
N SW
AN R
D
W TANGERINE RD
S PAR
K AV
E GRANT RD
N LA
CAN
ADA D
R
S 12T
H AV
S 6TH
AV E GOLF LINKS RD
N THO
RNYD
ALE
RD
N ST
ONE A
V
S SWA
N RD
S KINNEY RD
N CR
AYCR
OFT R
D
W MOORE RD
E SUNRISE DR
N CA
MPBE
LL AV
W IRVINGTON RD
W VALENCIA RD
N MOUNT LEMMON HY
E TANQUE VERDE RD
W RIVER RD
E AJO WY
S ALV
ERNO
N W
YE SNYDER RD
N HO
UGHT
ON R
D
W SPEEDWAY BL
S RITA
RD
S KINO PW
E 36TH ST
E DREXEL RD
E CATA
LINA H
YE IRVINGTON RD
W LAMBERT LN
S PAL
O VE
RDE
RD
N SH
ANNO
N RD
N SO
LDIER
TR
W ANKLAM RD
W AJO WY
N LA
CHO
LLA B
L
W SWEETWATER DR
E AVIATION PW
E SKYLINE DR
S CAR
DINA
L AV
W GATES PASS RD
W NARANJA DR
E BENSON HY
W MAGEE RD
E LOS REALES RD
N 6T
H AV
E RITA RD
W STARR PASS BL
S TUC
SON
BL
E OLD VAIL CONNECTION RD
S PAN
TANO
RD
E 29TH ST
W LINDA VISTA BL
N 1S
T AV
S 10T
H AV
W OVERTON RD
W GRANT RD
N CO
UNTR
Y CLU
B RD
E FORT LOWELL RD
N KO
LB R
D
W PRINCE RD
N BEAR CANYON RD
S FRE
EMAN
RD
S CAM
PBEL
L AV
N WA
DE R
D
S HAR
RISO
N RD
W CAMINO DE
MANAN
A
E PRINCE RD
N EU
CLID
AV
N PA
NTAN
O RD
N LAG
O DE
L ORO
PW
S MAR
K RD
W CORTARO FARMS RD
S OLD
SPAN
ISH TR
E CLOUD RD
E ROCKET RD
W TRAILS END RD
W ROGER RD
E HUGHES ACCESS RD
W IRONWOOD HILL DR
N CASA GRANDE HY
N CORT
ARO R
D
S MID
VALE
PARK
RD
N SA
BINO
CAN
YON
RD
E SKI RUN RD
N HA
RRISO
N RD
S JOS
EPH A
V
W BELMONT RD
W GORET RD
S COU
NTRY
CLU
B RD
W WETMORE RD
W RUTHRAUFF RD
E POORMAN RD
S CAM
INO
DE O
ESTE
N TOR
TOLIT
A RD
N FR
EEMA
N RD
S CAM
INO
VERD
E
N NO
RTHE
RN AV
W SAINT MARYS RD
N ABINGTON RD
E ORANGE GROVE RD
W CONGRESS ST
S VIVI
ANA R
D
N GE
RHAR
T RD
N CASA GRANDE HY HY
W CALLE CONCORDIA
E HERMANS RD
W SUNSET RD
S GOL
F LIN
KS R
D
E LAMBERT LN
E LINDA VISTA BL
E ALVORD RD
N WI
LMOT
RD
N OXBOW RD
E ESCALANTE RD
S MAI
N AV
N TANURI DR
E ROCKET SV
S CRA
YCRO
FT R
D
W LOS REALES RD
S PAN
TANO
RD
S CRA
YCRO
FT R
D
E I10 RAMP
N WI
LMOT
RD
E OLD SPANISH TR
E FORT LOWELL RD
E IRVINGTON RD
E ESCALANTE RD
N KOLB RD
N 1S
T AV
W BOPP RD
N CA
MINO
DE O
ESTE
W MAGEE RD
N WENTWORTH RD
W HARDY RD
S MEL
POME
NE W
Y
S SWA
N RD
W VALENCIA RD
S WILM
OT R
D
N SH
ANNO
N RD
W DREXEL RD
E OLD VAIL RD
S HAR
RISO
N RD
N CA
MINO
DE O
ESTE
N ALV
ERNO
N W
Y
E SKI RUN RD
W HERMANS RD
")
")
")
")
")
")#*
#*
#*
#*
#*
#*
#*
#*
"
"
#*
#*
#*#*
#*
P-1
P-6
P-3P-2
P-5
P-4T-1
BPS-1
BPS-5BPS-6
T-2BPS-2
BPS-4
³0 1 2 Miles
LegendPipes
ExistingRecommended
Reservoirs") Existing
" Recommended
Booster Stations#* Existing#* Recommended
Recommended Reclaimed Water System ImprovementsTUCSON WATER
RECYCLED WATER MASTER PLAN

December 2013 01830100.0000 7-1
Recycled Water Master Plan
Reclaimed Water System
Evaluation
7 References
Malcolm Pirnie, Inc. Reclaimed Water System Master Plan for Tucson Water. December, 1999.
CH2M Hill. Tucson Water Reclaimed Water System, Recovery, Disinfection and Booster
Capacity: Baseline Analysis, Revised Final Technical Memorandum No. 1. May 7, 2007.

ATTACHMENT A
GOLF COURSE RECLAIMED WATER USAGE PATTERNS

Golf Course Reclaimed Water Usage Patterns
01830100.0000 Page 1 of 14 December 2013
Figure 1: Gallery North Weekday Pattern
Figure 2: Gallery North Weekend Pattern
Figure 3: Gallery North Final Peak Demand Pattern
0.0
0.2
0.4
0.6
0.8
1.0
1.2
1.4
1.6
1 2 3 4 5 6 7 8 9 10 11 12 13 14 15 16 17 18 19 20 21 22 23 24
Facto
r
Time (hours)
Monday Tuesday Wednesday
Thursday Friday Weekday
0.0
0.2
0.4
0.6
0.8
1.0
1.2
1.4
1.6
1 2 3 4 5 6 7 8 9 10 11 12 13 14 15 16 17 18 19 20 21 22 23 24
Facto
r
Time (hours)
Saturday Sunday Weekend
0.0
0.2
0.4
0.6
0.8
1.0
1.2
0 2 4 6 8 10 12 14 16 18 20 22 24
Facto
r
Time (hours)

Golf Course Reclaimed Water Usage Patterns
01830100.0000 Page 2 of 14 December 2013
Figure 4: Gallery South Weekday Pattern
Figure 5: Gallery South Weekend Pattern
Figure 6: Gallery South Final Peak Demand Pattern
0.0
0.2
0.4
0.6
0.8
1.0
1.2
1 2 3 4 5 6 7 8 9 10 11 12 13 14 15 16 17 18 19 20 21 22 23 24
Facto
r
Time (hours)
Monday Tuesday Wednesday
Thursday Friday Weekday
0.0
0.2
0.4
0.6
0.8
1.0
1.2
1 2 3 4 5 6 7 8 9 10 11 12 13 14 15 16 17 18 19 20 21 22 23 24
Facto
r
Time (hours)
Saturday Sunday Weekend
0.0
0.2
0.4
0.6
0.8
1.0
1.2
0 2 4 6 8 10 12 14 16 18 20 22 24
Facto
r
Time (hours)

Golf Course Reclaimed Water Usage Patterns
01830100.0000 Page 3 of 14 December 2013
Figure 7: Heritage Weekday Pattern
Figure 8: Heritage Weekend Pattern
Figure 9: Heritage Final Peak Demand Pattern
0.0
0.2
0.4
0.6
0.8
1.0
1.2
1.4
1.6
1.8
1 2 3 4 5 6 7 8 9 10 11 12 13 14 15 16 17 18 19 20 21 22 23 24
Facto
r
Time (hours)
Monday Tuesday Wednesday
Thursday Friday Weekday
0.0
0.2
0.4
0.6
0.8
1.0
1.2
1.4
1.6
1.8
1 2 3 4 5 6 7 8 9 10 11 12 13 14 15 16 17 18 19 20 21 22 23 24
Facto
r
Time (hours)
Saturday Sunday Weekend
0.0
0.2
0.4
0.6
0.8
1.0
1.2
1.4
1.6
0 2 4 6 8 10 12 14 16 18 20 22 24
Facto
r
Time (hours)

Golf Course Reclaimed Water Usage Patterns
01830100.0000 Page 4 of 14 December 2013
Figure 10: Dove Mountain 1 Weekday Pattern
Figure 11: Dove Mountain 1 Weekend Pattern
Figure 12: Dove Mountain 1 Final Peak Demand Pattern
0.0
0.2
0.4
0.6
0.8
1.0
1.2
1.4
1 2 3 4 5 6 7 8 9 10 11 12 13 14 15 16 17 18 19 20 21 22 23 24
Facto
r
Time (hours)
Monday Tuesday Wednesday
Thursday Friday Weekday
0.0
0.2
0.4
0.6
0.8
1.0
1.2
1.4
1 2 3 4 5 6 7 8 9 10 11 12 13 14 15 16 17 18 19 20 21 22 23 24
Facto
r
Time (hours)
Saturday Sunday Weekend
0.0
0.2
0.4
0.6
0.8
1.0
1.2
0 2 4 6 8 10 12 14 16 18 20 22 24
Facto
r
Time (hours)

Golf Course Reclaimed Water Usage Patterns
01830100.0000 Page 5 of 14 December 2013
Figure 13: Dove Mountain 2 Weekday Pattern
Figure 14: Dove Mountain 2 Weekend Pattern
Figure 15: Dove Mountain 2 Final Peak Demand Pattern
0.0
0.2
0.4
0.6
0.8
1.0
1.2
1.4
1.6
1 2 3 4 5 6 7 8 9 10 11 12 13 14 15 16 17 18 19 20 21 22 23 24
Facto
r
Time (hours)
Monday Tuesday Wednesday
Thursday Friday Weekday
0.0
0.2
0.4
0.6
0.8
1.0
1.2
1.4
1.6
1 2 3 4 5 6 7 8 9 10 11 12 13 14 15 16 17 18 19 20 21 22 23 24
Facto
r
Time (hours)
Saturday Sunday Weekend
0.0
0.2
0.4
0.6
0.8
1.0
1.2
0 2 4 6 8 10 12 14 16 18 20 22 24
Facto
r
Time (hours)

Golf Course Reclaimed Water Usage Patterns
01830100.0000 Page 6 of 14 December 2013
Figure 16: Randolph Park Weekday Pattern
Figure 17: Randolph Park Weekend Pattern
Figure 18: Randolph Park Final Peak Demand Pattern
0.0
0.5
1.0
1.5
2.0
2.5
3.0
1 2 3 4 5 6 7 8 9 10 11 12 13 14 15 16 17 18 19 20 21 22 23 24
Facto
r
Time (hours)
Monday Tuesday Wednesday
Thursday Friday Weekday
0.0
0.5
1.0
1.5
2.0
2.5
3.0
1 2 3 4 5 6 7 8 9 10 11 12 13 14 15 16 17 18 19 20 21 22 23 24
Facto
r
Time (hours)
Saturday Sunday Weekend
0.0
0.5
1.0
1.5
2.0
2.5
0 2 4 6 8 10 12 14 16 18 20 22 24
Facto
r
Time (hours)

Golf Course Reclaimed Water Usage Patterns
01830100.0000 Page 7 of 14 December 2013
Figure 19: Davis Monthan Weekday Pattern
Figure 20: Davis Monthan Weekend Pattern
Figure 21: Davis Monthan Final Peak Demand Pattern
0
1
2
3
4
5
6
1 2 3 4 5 6 7 8 9 10 11 12 13 14 15 16 17 18 19 20 21 22 23 24
Facto
r
Time (hours)
Monday Tuesday Wednesday
Thursday Friday Weekday
0
1
2
3
4
5
6
1 2 3 4 5 6 7 8 9 10 11 12 13 14 15 16 17 18 19 20 21 22 23 24
Facto
r
Time (hours)
Saturday Sunday Weekend
0.0
0.2
0.4
0.6
0.8
1.0
1.2
1.4
1.6
0 2 4 6 8 10 12 14 16 18 20 22 24
Facto
r
Time (hours)

Golf Course Reclaimed Water Usage Patterns
01830100.0000 Page 8 of 14 December 2013
Figure 22: 49ers Weekday Pattern
Figure 23: 49ers Weekend Pattern
Figure 24: 49ers Final Peak Demand Pattern
0.0
0.2
0.4
0.6
0.8
1.0
1.2
1.4
1.6
1 2 3 4 5 6 7 8 9 10 11 12 13 14 15 16 17 18 19 20 21 22 23 24
Facto
r
Time (hours)
Monday Tuesday Wednesday
Thursday Friday Weekday
0.0
0.2
0.4
0.6
0.8
1.0
1.2
1.4
1.6
1 2 3 4 5 6 7 8 9 10 11 12 13 14 15 16 17 18 19 20 21 22 23 24
Facto
r
Time (hours)
Saturday Sunday Weekend
0.0
0.2
0.4
0.6
0.8
1.0
1.2
1.4
1.6
0 2 4 6 8 10 12 14 16 18 20 22 24
Facto
r
Time (hours)

Golf Course Reclaimed Water Usage Patterns
01830100.0000 Page 9 of 14 December 2013
Figure 25: Reid Park Weekday Pattern
Figure 26: Reid Park Weekend Pattern
Figure 27: Reid Park Final Peak Demand Pattern
0.0
0.2
0.4
0.6
0.8
1.0
1.2
1 2 3 4 5 6 7 8 9 10 11 12 13 14 15 16 17 18 19 20 21 22 23 24
Facto
r
Time (hours)
Monday Tuesday Wednesday
Thursday Friday Weekday
0.0
0.2
0.4
0.6
0.8
1.0
1.2
1 2 3 4 5 6 7 8 9 10 11 12 13 14 15 16 17 18 19 20 21 22 23 24
Facto
r
Time (hours)
Saturday Sunday Weekend
0.0
0.2
0.4
0.6
0.8
1.0
1.2
0 2 4 6 8 10 12 14 16 18 20 22 24
Facto
r
Time (hours)

Golf Course Reclaimed Water Usage Patterns
01830100.0000 Page 10 of 14 December 2013
Figure 28: Starr Pass Weekday Pattern
Figure 29: Starr Pass Weekend Pattern
Figure 30: Starr Pass Final Peak Demand Pattern
0.0
0.2
0.4
0.6
0.8
1.0
1.2
1 2 3 4 5 6 7 8 9 10 11 12 13 14 15 16 17 18 19 20 21 22 23 24
Facto
r
Time (hours)
Monday Tuesday Wednesday
Thursday Friday Weekday
0.0
0.2
0.4
0.6
0.8
1.0
1.2
1 2 3 4 5 6 7 8 9 10 11 12 13 14 15 16 17 18 19 20 21 22 23 24
Facto
r
Time (hours)
Saturday Sunday Weekend
0.0
0.2
0.4
0.6
0.8
1.0
1.2
0 2 4 6 8 10 12 14 16 18 20 22 24
Facto
r
Time (hours)

Golf Course Reclaimed Water Usage Patterns
01830100.0000 Page 11 of 14 December 2013
Figure 31: El Rio Weekday Pattern
Figure 32: El Rio Weekend Pattern
Figure 33: El Rio Final Peak Demand Pattern
0.0
0.5
1.0
1.5
2.0
2.5
1 2 3 4 5 6 7 8 9 10 11 12 13 14 15 16 17 18 19 20 21 22 23 24
Facto
r
Time (hours)
Monday Tuesday Wednesday
Thursday Friday Weekday
0.0
0.5
1.0
1.5
2.0
2.5
1 2 3 4 5 6 7 8 9 10 11 12 13 14 15 16 17 18 19 20 21 22 23 24
Facto
r
Time (hours)
Saturday Sunday Weekend
0.0
0.5
1.0
1.5
2.0
2.5
0 2 4 6 8 10 12 14 16 18 20 22 24
Facto
r
Time (hours)

Golf Course Reclaimed Water Usage Patterns
01830100.0000 Page 12 of 14 December 2013
Figure 34: Kino Park Weekday Pattern
Figure 35: Kino Park Weekend Pattern
Figure 36: Kino Park Final Peak Demand Pattern
0.0
0.2
0.4
0.6
0.8
1.0
1.2
1.4
1.6
1.8
2.0
1 2 3 4 5 6 7 8 9 10 11 12 13 14 15 16 17 18 19 20 21 22 23 24
Facto
r
Time (hours)
Monday Tuesday Wednesday
Thursday Friday Weekday
0.0
0.2
0.4
0.6
0.8
1.0
1.2
1.4
1.6
1.8
2.0
1 2 3 4 5 6 7 8 9 10 11 12 13 14 15 16 17 18 19 20 21 22 23 24
Facto
r
Time (hours)
Saturday Sunday Weekend
0.0
0.2
0.4
0.6
0.8
1.0
1.2
1.4
1.6
0 2 4 6 8 10 12 14 16 18 20 22 24
Facto
r
Time (hours)

Golf Course Reclaimed Water Usage Patterns
01830100.0000 Page 13 of 14 December 2013
Figure 37: Arthur Pack Weekday Pattern
Figure 38: Arthur Pack Weekend Pattern
Figure 39: Arthur Pack Final Peak Demand Pattern
0.0
0.2
0.4
0.6
0.8
1.0
1.2
1.4
1.6
1 2 3 4 5 6 7 8 9 10 11 12 13 14 15 16 17 18 19 20 21 22 23 24
Facto
r
Time (hours)
Monday Tuesday Wednesday
Thursday Friday Weekday
0.0
0.2
0.4
0.6
0.8
1.0
1.2
1.4
1.6
1 2 3 4 5 6 7 8 9 10 11 12 13 14 15 16 17 18 19 20 21 22 23 24
Facto
r
Time (hours)
Saturday Sunday Weekend
0.0
0.2
0.4
0.6
0.8
1.0
1.2
0 2 4 6 8 10 12 14 16 18 20 22 24
Facto
r
Time (hours)

Golf Course Reclaimed Water Usage Patterns
01830100.0000 Page 14 of 14 December 2013
Figure 40: Other Golf Courses Final Peak Demand Pattern
0.0
0.2
0.4
0.6
0.8
1.0
1.2
0 2 4 6 8 10 12 14 16 18 20 22
Facto
r
Time (hours)

ATTACHMENT B
PIMA COUNTY RECLAIMED WATER DEMAND PROJECTIONS

Pima County Existing and Projected Reclaimed Water Demands
01830100.0000 Page 1 of 1 December 2013
Location2010
(acre-ft/yr)2030
(acre-ft/yr)
Kino Environmenal Restoration Project 15 15West Branch SCR 1 3Swan Wetlands (metered off of RRP & included with Rillito RP) 16 -Subtotal 32 18
Reclaimed Water to protect Cienega Creek - 700Southeast Houghton Area Recharge Project - 2,000Arroyo Chico - Park Ave Basins - 9Paseo de las Iglesias - 15Kolb Rd. Detention Basins - -Cortaro Bosque (currently on non-potable water) - -Subtotal 0 2,724
PC DOT medians and right-of-ways 40 50Alamo Wash - -Arthur Pack Golf Course 660 700Riverbend Park / Brandi Fenton - 25Children's Memorial Park 20 20Curtis Park (Metered with Rillito River Park) - -Flowing Wells District Park (Metered with Rillito River Park) - -George Mehl District Park 36 35Rillito Park 54 55Rillito River Park 110 180Santa Cruz River Park 16 50Sam Lena Park (Metered with Kino Sports Complex) - -Hildago - Willie Blake Park (Metered with Kino Sports Complex) - -Kino Sports Complex (does not include KERP; 15 af in 2010 and 20 af in 2030) 114 330Subtotal 1,050 1,445
CDO River Park - (Wheeled through Metro Water Line extension) - 40NW/YMCA - (Wheeled through Metro Water Line extension) - 15Arthur Pack (Hardy Rd Fields) - 15Arthur Pack Regional Park ballfields 1-7 - 25Rillito Park - (future fields) - 75Santa Cruz River Park - north of Grant & south of Broadway not including COT maintained sections - 75Corazon de los Rios del Norte (Includes new athletic fields and riparian restoration) - 200Manzanita Park (existing and future fields) and Manzanita/Drexal Greenway - 75Lawrence Park (existing and future fields) - 30Rillito River Park (west of La Cholla) - 25Dan Felix Park (existing & future fields) - currently on non-potable - 30NRPR Main Office & Prickly Pear Park (3500 W. River Rd) - 5Chicken Ranch - Mesquite Bosque Restoration - Camino de La Tierra @ south bank of Rillito River - 25Ted Walker Park (future and existing fields at Mike Jacob Sports park) - currently on non-potable - 75Thomas Jay (Littletown Park) - 50Los Ninos/Augie Acuna Park - 15Julian Wash (not including COT & S. Tucson maintained sections) - 75Tucson Diversion Channel - 30Harrison Greenway - 40Tanque Verde River Park - 40Pantano River Park (COT maintained at this time) - 0Agua Caliente Park & Ponds - 120Subtotal 0 1,080Total Pima County Effluent Wheeled Through TW Reclaimed System 1,082 5,267
Restoration Sites - Currently using Reclaimed Water from County's Share of Effluent
Restoration Sites - Possible Future Sites and Expansion of Existing Sites
Pima County NRPR, PC DOT, and Stadium District Existing Sites
Pima County NRPR, PC DOT, and Stadium District Future Sites

ATTACHMENT C
BASIS OF COST OPINIONS

Basis of Cost Opinions
01830100.0000 Page 1 of 1 December 2013
Item Units Cost(Jan. 2012)
Engineering and Admin3
(Jan. 2012)
Contingency4
(Jan. 2012) Total
(Jan. 2012)
6 $/LF $74 $18 $28 $1208 $/LF $91 $23 $34 $14810 $/LF $108 $27 $40 $17512 $/LF $125 $31 $47 $20314 $/LF $142 $36 $53 $23116 $/LF $160 $40 $60 $26018 $/LF $176 $44 $66 $28720 $/LF $193 $48 $72 $31424 $/LF $228 $57 $85 $37030 $/LF $279 $70 $105 $45336 $/LF $294 $74 $110 $478
0.0 to < 2.5 MG $/MG $1,426,741 $356,685 $535,028 $2,318,4532.5 to < 4.0 MG $/MG $1,156,826 $289,207 $433,810 $1,879,8424.0 to < 7.5 MG $/MG $886,911 $221,728 $332,592 $1,441,2317.5 to < 12.5 MG $/MG $616,997 $154,249 $231,374 $1,002,620
0 to < 7 mgd $/MGD $378,270 $94,567 $141,851 $614,6887 to < 13 mgd $/MGD $215,213 $53,803 $80,705 $349,72213 to < 17 mgd $/MGD $130,451 $32,613 $48,919 $211,983
NOTES:
Booster Pump Stations6
Reservoirs6
Summary of Capital Unit Costs1,2
Ductile Iron Pipe (inches)5Pipelines
(2) Unit capital costs include engineering/design, materials of construction, installation and contractor overhead and profit.(1) January 2012 Costs (ENR CCI = 9,176).
(6) Includes fencing and access gates, site paving, landscaping, earth and concrete work, electrical, mechanical, instrumentation, and SCADA.
(5) Ductile iron pipe with excavation, five feet of cover, backfill, and bedding. (4) Contingency - 30 percent.(3) Engineering & Administration Cost - 25 percent.

APPENDIX E
NEW RECYCLED WATER PROGRAM EVALUATION

Recycled Water Master Plan
Appendix E: New Recycled Water Program Evaluation
December 2013
Imagine the result

December 2013 01830100.0000 i
Table of Contents
1 Introduction 1-1
2 Process for Identifying Recycled Water Program Alternatives 2-1
3 Identification of Concepts for Recycled Water Program Alternatives 3-1
3.1 Recycled Water Sources 3-1
3.2 Recharge Locations 3-1
3.2.1 Recharge Locations for IPR Purposes 3-1
3.2.2 Recharge Locations for Non-IPR Purposes 3-3
3.3 Recovery Locations 3-3
3.4 Summary of Concepts for Recycled Water Programs 3-4
4 Additional Facility Concepts for Recycled Water Programs 4-1
4.1 Recycled Water Conveyance Concepts 4-1
4.2 Recharge and Recovery Facilities 4-3
4.3 Location of Advanced Treatment 4-4
5 Evaluation of Advanced Treatment Process Options 5-1
5.1 Existing Recycled Water Quality 5-2
5.2 Projected Recycled Water Quality 5-4
5.3 Emerging Contaminants 5-5
5.4 Water Quality Goals for Indirect Potable Reuse 5-7
5.5 Advanced Water Treatment Technologies 5-9
5.5.1 Mainstream Treatment Technologies 5-9
5.5.2 Concentrate Treatment Technologies 5-10
5.6 Selection of Advanced Water Treatment Processes 5-11
5.7 Advanced Treatment Processes and Treatment Effectiveness 5-13
5.8 Cost Evaluation of Treatment Process Alternatives 5-21
5.8.1 Conceptual Design Flows 5-21
5.8.2 Conceptual Design Criteria 5-22
5.8.3 Basis for Conceptual Cost Opinions 5-24

December 2013 01830100.0000 ii
Table of Contents
5.8.4 Conceptual Cost Opinions for Treatment Train Alternatives 5-24
5.8.5 Matrix Evaluation of Treatment Train Alternatives 5-26
6 Evaluation of Recycled Water Program Alternatives 6-1
6.1 Concept Design Flows and Design Criteria 6-1
6.2 Facility Requirements for Recycled Water Program Alternatives 6-4
6.3 Conceptual Cost Opinions for Recycled Water Program Alternatives 6-6
7 Conclusions and Recommendations 7-1
8 References 8-1
Tables
Table 3-1. Summary of Concepts for Recycled Water Program Alternatives 3-4
Table 5-1. Summary of 90th Percentile Concentrations of Water Quality Parameters 5-3
Table 5-2. Tucson Water Microconstituent Sampling Program Results 5-7
Table 5-3. Advanced Water Treatment Water Quality Goals 5-8
Table 5-4. Summary of Advanced Water Treatment Technologies 5-11
Table 5-4. Summary of Treatment Train Alternatives 5-12
Table 5-5. Summary of Unutilized Recycled Water Available for New Recycled Water Programs 5-21
Table 5-6. Summary of Design Flows 5-22
Table 5-7. Design Criteria for Conceptual Cost Opinions for Treatment Train Alternatives 5-23
Table 5-8. Comparison of Scoring and Ranking Results 5-32
Table 5-9. Comparison of Preferred Treatment Train Alternatives 5-33
Table 6-1. Summary of Design Flows 6-1
Table 6-2. Summary of Treatment and Facility Design Criteria for Recycled Water Programs 6-3
Table 6-3. Summary of Recycled Water Program Alternative Facility Components 6-5
Table 6-4. Conceptual Capital Cost Opinions for Recycled Water Program Alternatives 6-7
Table 6-5. Conceptual Annual O&M Cost Opinions for Recycled Water Program Alternatives 6-8

December 2013 01830100.0000 iii
Table of Contents
Figures
Figure 3-1. Concepts for Recycled Water Program Alternatives 3-5
Figure 4-1. Conveyance Route from Metropolitan Area Treatment Facilities to CAVSARP Area 4-2
Figure 4-2. Conveyance Route from Metropolitan Area Facilities to SE Tucson Recharge Location 4-3
Figure 5-1. Current and Projected Recycled Water Quality 5-5
Figure 5-2. Tucson Water Microconstituent Sampling Program Locations 5-6
Figure 5-3. Legend for Treatment Effectiveness Diagrams 5-14
Figure 5-4. CAVSARP-1 Process Flow Diagram and Treatment Effectiveness Table 5-14
Figure 5-5. CAVSARP-2 Process Flow Diagram and Treatment Effectiveness Table 5-15
Figure 5-6. CAVSARP-3 Process Flow Diagram and Treatment Effectiveness Table 5-15
Figure 5-7. CAVSARP-4 Process Flow Diagram and Treatment Effectiveness Table 5-16
Figure 5-8. CAVSARP-5 Process Flow Diagram and Treatment Effectiveness Table 5-17
Figure 5-9. North CAVSARP-1 Process Flow Diagram and Treatment Effectiveness Table 5-17
Figure 5-10. North CAVSARP-2 Process Flow Diagram and Treatment Effectiveness Table 5-17
Figure 5-11. North CAVSARP-3 Process Flow Diagram and Treatment Effectiveness Table 5-18
Figure 5-12. North CAVSARP-4 Process Flow Diagram and Treatment Effectiveness Table 5-18
Figure 5-13. North CAVSARP-5 Process Flow Diagram and Treatment Effectiveness Table 5-19
Figure 5-14. Concentrate Treatment-1 Process Flow Diagram and Treatment Effectiveness Table 5-19
Figure 5-15. Concentrate Treatment-2 Process Flow Diagram and Treatment Effectiveness Table 5-20
Figure 5-16. Concentrate Treatment-3 Process Flow Diagram and Treatment Effectiveness Table 5-20
Figure 5-17. Conceptual Opinion of Capital Costs for Treatment Train Alternatives 5-25
Figure 5-18. Conceptual Opinion of O&M Costs for Treatment Train Alternatives 5-25
Figure 5-19. Conceptual Opinion of Total Present Worth for Treatment Train Alternatives 5-26
Figure 5-20. Results of Decision Criteria Priorities 5-29
Figure 5-21. Scoring and Ranking Results for Consultant Team 5-31
Figure 5-22. Scoring and Ranking Results for Tucson Water Staff 5-32

December 2013 01830100.0000 iv
Table of Contents
Attachments
A. Design Criteria and Cost Estimates for the Treatment Train Alternatives
B. Criterium DecisionPlus Attributes and Scoring Results
C. Design Criteria and Cost Estimates for the Recycled Water Program Alternatives

December 2013 01830100.0000 1-1
Recycled Water Master Plan
New Recycled Water Program
Evaluation
1 Introduction
This technical memorandum summarizes the identification and evaluation of recycled water
programs that could put Tucson Water’s unutilized recycled water to beneficial use. Chapter 4 of
the Recycled Water Master Plan presents projections of Tucson Water’s total “effluent
entitlements” and Chapter 5 describes the recycled water (treated effluent entitlements) that is
unutilized after demands in the reclaimed water system (RWS) are satisfied. In concept, the
unutilized recycled water could be used to replenish groundwater and, after additional advanced
treatment, could be used to supplement future drinking water supplies.
Alternatives for potential future recycled water programs are identified by revisiting Tucson
Water’s previous scenario planning effort for water reuse. Advanced treatment processes are
identified, evaluated, and prioritized for the recycled water program alternatives. Finally, the
alternatives are developed to allow concept cost evaluations, including conveyance, pumping,
recharge and recovery, advanced treatment, and finished water transmission facilities. The
evaluations result in the identification of preferred recycled water program strategies that are
recommended to be taken forward for detailed evaluations and demonstration testing.

December 2013 01830100.0000 2-1
Recycled Water Master Plan
New Recycled Water Program
Evaluation
2 Process for Identifying Recycled Water Program Alternatives
Tucson Water initially developed the impetus for the Recycled Water Master Plan, in part, by
revisiting the Utility’s scenario planning assumptions and uncertainties for recycled water reuse
originally developed in Water Plan: 2000-2050. By extending the scenario planning process
specifically for water reuse, Tucson Water utilized the best available information and planning
assumptions to address many possible views of the future related to a potential water recycling
program. The process identified the two most significant uncertainties which will influence the
development of a new recycled water program:
1. Will the public accept indirect potable reuse of recycled water supplies?
2. Will the City treat recycled water beyond potable regulatory standards?
Recycled water program alternatives were identified which would cover the range of possibilities
imposed by the above uncertainties. The recycled water program alternatives were identified and
evaluated using the following process.
Step 1: Identify concepts for strategic sources of recycled water and recharge and
recovery locations. These concepts are described in Chapter 3 of this technical
memorandum.
Step 2: Identify additional concepts for recycled water conveyance, treatment locations
(pre-recharge and post-recovery), brine and treatment residuals management, recovery,
and purified water transmission elements. These concepts are described in Chapter 4.
Step 3: Based on alternative treatment locations (pre-recharge and post-recovery), identify
and evaluate options for advanced treatment processes to identify preferred treatment
processes. The treatment process evaluations are described in Chapter 5.
Step 4: Combine all elements of the recycled water program alternatives for a complete
evaluation of program alternatives. The program evaluations are described in Chapter 6.

December 2013 01830100.0000 3-1
Recycled Water Master Plan
New Recycled Water Program
Evaluation
3 Identification of Concepts for Recycled Water Program Alternatives
The concepts for recycled water program alternatives involve strategic sources of recycled water
and recharge and recovery locations.
3.1 Recycled Water Sources
The most obvious sources of recycled water are from the metropolitan area treatment facilities: the
future Water Reclamation Campus (WRC) at Roger Road, Ina Road Wastewater Reclamation
Facility (WRF), and Randolph Park WRF. The metropolitan area facilities are where most of the
region’s wastewater is collected. Of these locations, Tucson Water is to receive its recycled water
at the Water Reclamation Campus according to current City/County intergovernmental
agreements (IGAs). Thus, for purposes of the evaluation, it is assumed that the primary source of
recycled water from the metropolitan area will be the Water Reclamation Campus under all
alternatives.
Another existing source of recycled water could be the Reclaimed Water System (RWS); however,
the RWS is dedicated to serving existing and future reclaimed water customers. The RWS could
also deliver recycled water (up to 4,000 acre-feet per year, AFY) to the proposed Southeast
Haughton Area Recharge Project (SHARP) site within the constraints of service to other RWS
customers.
Finally, the non-metropolitan treatment facilities including the Avra Valley WRF, the future
Southeast (SE) Area WRF, and the future Southlands WRF could be sources of recycled water.
However, the current supplies are non-existent or are insignificant compared to supplies from the
metropolitan area facilities. Thus, the evaluations herein are focused on recycled water supplies
from the metropolitan area treatment facilities.
3.2 Recharge Locations
Preferred locations for recycled water recharge would depend on whether Tucson Water decides
to pursue an indirect potable reuse (IPR) project or if it elects just to recharge the water for long-
term storage credits.
3.2.1 Recharge Locations for IPR Purposes
If indirect potable reuse is pursued, recharge would be conducted with purposeful augmentation of
the potable supply. To reduce costs, recharge should occur where there is existing infrastructure
to recover the water and to get it to locations meant for distribution of large volumes of potable

December 2013 01830100.0000 3-2
Recycled Water Master Plan
New Recycled Water Program
Evaluation
water supply. Because of the potential volume of recycled water supply, recharge should also
occur where large tracts of land are available. Possible recharge locations would therefore
include the Central Avra Valley Storage and Recovery Project (CAVSARP), the Southern Avra
Valley Storage and Recovery Project (SAVSARP), and potentially SHARP.
Recharge within the Central Wellfield and/or close to the existing metropolitan water reclamation
facilities (Roger Road and Ina Road Water Reclamation Facilities) were considered but were not
considered viable:
There are no more large tracts of vacant land available within the Central Wellfield and
the area is distant from the existing major potable water distribution infrastructure
associated with the Clearwater Program (delivery of CAP water through the CAVSARP
and SAVARP facilities). Any potential cost savings would be offset by the need to
convey large volumes of water to the existing primary potable water distribution
infrastructure.
Similarly, there are no large tracts of land available near the metropolitan water
reclamation facilities (all available land is being used for water reclamation, recharge and
recovery, and other RWS facilities).
Groundwater in the vicinity of the Roger and Ina Road WRFs has elevated levels of
many wastewater and industrial contaminants.
The area in the vicinity of the metropolitan water reclamation facilities is surrounded by
three significant Arizona Water Quality Assurance Revolving Fund (WQARF) sites.
Additional significant local recharge and recovery activities would be highly constrained
by the water quality remediation objectives of these sites.
The CAVSARP and SAVSARP locations could accommodate the full unutilized Tucson Water
recycled water supplies, whereas the SHARP site could only accept up to 4,000 AFY until it is fully
demonstrated and a new agreement is developed with the County. SHARP is a joint City of
Tucson and Pima County recycled water recharge project to develop long-term water storage
credits. Thus, there is no large-scale recovery currently planned. Because recycled water
conveyance, recharge, and recovery capacities for the SHARP alternative are limited, the SHARP
alternative is considered complementary to other recycled water program alternatives and is not
included in the subsequent evaluations. The SHARP alternative could provide an opportunity for a
demonstration project that could transition to a permanent first phase of a full-scale project.
Of the CAVSARP and SAVSARP locations, the CAVSARP location has the best potential
because 1) the City has property just to the north of the CAVSARP basins, 2) it is closer to the
recycled water source, and 3) the opportunity to extend another major conveyance facility through

December 2013 01830100.0000 3-3
Recycled Water Master Plan
New Recycled Water Program
Evaluation
existing rights-of-way to SAVSARP are very limited. Thus, two categories of IPR alternatives were
identified:
The CAVSARP Alternatives would utilize the existing CAVSARP basins for recycled
water recharge (mixing with CAP water prior to recharge)
The North CAVSARP Alternatives would utilize new basins constructed north of the
CAVSARP basins.
3.2.2 Recharge Locations for Non-IPR Purposes
If IPR is not pursued, recharge would have to be conducted at substantial distance from, or
hydrologically separated from, the potable water supply. The intent would be to avoid mixing of
recharged water with native groundwater used for potable purposes. In order to maximize the
benefits to local groundwater resources, recharge should occur within the Tucson Active
Management Area (AMA) boundaries. Recharging recycled water outside of the Tucson AMA will
not contribute to Tucson Water’s long-term planning goal of achieving hydrologic sustainability. It
would also not contribute to long-term storage credits for Tucson Water. The extreme southern
boundaries of the Central Wellfield and Avra Valley basins would be the most acceptable recharge
location as vacant land is still available in these areas.
Recharge in areas to the north of Tucson Water’s service area and other developed areas were
also considered but were not considered acceptable because of jurisdictional concerns associated
with large-scale recharge facilities being located within the service/planning areas of others. In
addition, this area is downgradient of the Tucson Water service area, and the recharged water
would flow out of the drainage basin without contributing to Tucson Water’s long-term planning
goal of achieving hydrologic sustainability.
To represent the case where IPR is not pursued, a third category of alternatives was identified, the
Southeast (SE) Tucson Alternatives. The SE Tucson recharge location can be planned to
recharge the entire unutilized recycled water supplies.
3.3 Recovery Locations
For both CAVSARP and North CAVSARP Alternatives, existing infrastructure could be used to
recover and convey the recovered water to the CAVSARP reservoir and booster station. However,
since the existing recovery capacity at CAVSARP is limited, both categories of alternatives would
require that some recharge of CAP water (in an amount equal to recycled water that is recharged)
be shifted to an expanded SAVSARP.

December 2013 01830100.0000 3-4
Recycled Water Master Plan
New Recycled Water Program
Evaluation
The SE Tucson Alternative does not include any purposeful recovery. However, over many years
the recharged water is expected to eventually migrate and blend with the Central Wellfield water.
3.4 Summary of Concepts for Recycled Water Programs
Table 3-1 provides a summary of the concepts for potential recycled water program alternatives.
Figure 3-1 shows the locations of the concepts summarized in Table 3-1.
Table 3-1. Summary of Concepts for Recycled Water Program Alternatives
Alternative Category Recharge Location Recovery Location Recharge Capacity
CAVSARP Existing CAVSARP basins
Existing CAVSARP recovery facilities
All unutilized recycled water
North CAVSARP New basins North of CAVSARP
Existing and new recovery facilities north of CAVSARP
All unutilized recycled water
SE Tucson New recharge basins Southeast of Tucson
No purposeful recovery All unutilized recycled water

December 2013 01830100.0000 3-5
Recycled Water Master Plan
New Recycled Water Program
Evaluation
Figure 3-1. Concepts for Recycled Water Program Alternatives

December 2013 01830100.0000 4-1
Recycled Water Master Plan
New Recycled Water Program
Evaluation
4 Additional Facility Concepts for Recycled Water Programs
Based on the framework for recycled water sources and recharge and recovery locations,
additional concepts for recycled water conveyance, locations for treatment (pre-recharge and
post-recovery), brine and treatment residuals management, recovery, and purified water
transmission elements were identified for the recycled water program alternatives.
4.1 Recycled Water Conveyance Concepts
Both the CAVSARP and North CAVSARP alternatives would involve recycled water conveyance
from the metropolitan area treatment facilities (assumed location at the Water Reclamation
Campus per existing agreements) to these recharge locations. Figure 4-1 shows the potential
conveyance route from the metropolitan area treatment facilities to the CAVSARP and North
CAVSARP recharge areas. The conveyance alignment is approximately 25 miles long and would
require a total lift of 100 feet. The conveyance alignment is based on the proposed conceptual
alignments for conveyance facilities from the 1995 Regional Effluent Utilization Plan Phase B
(Malcolm Pirnie, June 1995), which considered existing rights-of-way and optimizing gravity flow.
The SE Tucson alternative would also involve recycled water conveyance from the metropolitan
area treatment facilities to the recharge location. Figure 4-2 shows a potential conveyance route
from the metropolitan area treatment facilities to the assumed location of the SE Tucson recharge
facility. The conveyance alignment is approximately 35 miles long and would require a total lift of
1,200 feet. The conveyance alignment to the SE Tucson alternative was based on conceptual
routing that considered open space and availability of existing rights-of-way.

December 2013 01830100.0000 4-2
Recycled Water Master Plan
New Recycled Water Program
Evaluation
Figure 4-1. Conveyance Route from Metropolitan Area Treatment Facilities to CAVSARP Area

December 2013 01830100.0000 4-3
Recycled Water Master Plan
New Recycled Water Program
Evaluation
Figure 4-2. Conveyance Route from Metropolitan Area Facilities to SE Tucson Recharge Location
4.2 Recharge and Recovery Facilities
The CAVSARP alternatives would use existing CAVSARP infrastructure for recharge and
recovery of recycled water. Recycled water would be recharged in the same basins as CAP
water which has implications from a regulatory perspective because modifications to the Aquifer
Protection Permit (APP) may be required for the CAVSARP alternatives. Another consideration
for the CAVSARP alternatives is that recycled water will displace some CAP water that would
normally be recharged at CAVSARP, resulting in the need to expand SAVSARP facilities to
accommodate the displaced CAP recharge. Expansion of SAVSARP would be the best option

December 2013 01830100.0000 4-4
Recycled Water Master Plan
New Recycled Water Program
Evaluation
as there is sufficient capacity to deliver additional CAP water to SAVSARP, space is available
for new recharge basins, and recovery capacity is available at SAVSARP.
The North CAVSARP alternatives would use new basins north of the existing CAVSARP
facilities for recharge. Existing infrastructure could be used to recover and convey the recovered
water to the CAVSARP reservoir and booster station, thus the recovery capacity would not need
to be expanded. However, since the recovered water transmission, reservoir and booster station
are limited in capacity, the North CAVSARP alternatives would also require that some CAP
water be shifted to an expanded SAVSARP.
The SE Tucson recharge location was chosen because of its substantial distance from the
current potable water supply. Figure 4-2 also illustrates the proximity of the SE Tucson recharge
location to existing potable water wells, other water providers, and the Tucson AMA boundary. It
is improbable to move the location of the SE Tucson alternative to a location further away from
the Central Wellfield because of the AMA boundary to the East and the Santa Rita mountains to
the South. The SE Tucson alternatives would include construction of new recharge basins, and
there would be no purposeful recovery of recharged water.
4.3 Location of Advanced Treatment
Potential locations for advanced water treatment in the indirect potable reuse (IPR) application
for Tucson Water include prior to recharge (pre-recharge) and after recovery (post-recovery).
Factors that impact the location for treatment include public perception, energy consumption,
and cost.
Pre-recharge treatment may reduce the perception of degrading the receiving groundwater, but
the process is potentially more costly and energy intensive as the treatment facilities would have
to be sized to accommodate the significant variations in unutilized recycled water. Examples of
treatment prior to recharge include the Orange County, CA Groundwater Replenishment System
and the West Basin Municipal Water District, CA facilities, which utilize microfiltration (MF),
reverse osmosis (RO), and UV hydrogen peroxide advanced oxidation process (AOP) to purify
recycled water prior to injection into the groundwater.
Post-recovery treatment provides the opportunity for soil aquifer treatment (SAT) as a natural
process for removal or reduction of many contaminants. It also provides pre-treatment that
benefits downstream advanced treatment steps, such as eliminating filtration prior to membrane
treatment and reducing treatment residuals production. Post-recovery treatment has the
potential to be less costly because of pre-treatment provided naturally by SAT, and because the
aquifer serves as storage and buffers the large seasonal variations in unutilized recycled water

December 2013 01830100.0000 4-5
Recycled Water Master Plan
New Recycled Water Program
Evaluation
(i.e., the treatment facilities can be sized for a smaller and constant flow rate). Thus, it might be
viewed as a more sustainable process. An example of post-recovery treatment is the Prairie
Waters Project in Aurora, CO, which uses river bank filtration, softening, UV-AOP, granular
media filtration, and GAC.

December 2013 01830100.0000 5-1
Recycled Water Master Plan
New Recycled Water Program
Evaluation
5 Evaluation of Advanced Treatment Process Options
This chapter summarizes the identification and evaluation of treatment process options for pre-
recharge and post-recovery treatment locations for the recycled water program alternatives. The
existing recycled water quality is reviewed and future water quality is projected based on planned
changes in the regional water reclamation facilities and operations. Water quality goals are then
established to provide a framework for identification of advanced treatment processes. Finally, the
preferred advanced treatment processes are identified based on cost comparisons and a
systematic application of decision criteria scoring and weighting. The preferred advanced
treatment processes are then included in Chapter 6 in the evaluation of overall recycled water
programs.
The identification and evaluation of advanced water treatment options were completed with input
and review by an Independent Advisory Panel of experts in the water reuse industry. The
Independent Advisory Panel for this effort was formed and administered by the National Water
Research Institute (NWRI). For 20 years, NWRI – a science-based 501c3 non-profit located in
Fountain Valley, California – has sponsored projects and programs to improve water quality,
protect public health and the environment, and create safe, new sources of water. NWRI
specializes in working with researchers across the country, such as laboratories at universities
and water agencies, and are guided by a Research Advisory Board (representing national
expertise in water, wastewater, and water reuse) and a six-member Board of Directors
(representing water and wastewater agencies in Southern California).
Through its research program, NWRI supports multi-disciplinary research projects with partners
and collaborators that pertain to treatment and monitoring, water quality assessment, knowledge
management, and exploratory research. NWRI also provides third-party expertise and scientific
advice in reviewing projects or policies for local and state agencies through their Independent
Advisory Panel Program.
The NRWI panel reviewed the work to identify recycled water program alternatives and helped to
shortlist advanced treatment process options for detailed evaluations (NWRI, July 2011; NWRI,
March 2012; NWRI, April 2013). The Panel evaluated topics related to: public health and safety;
public outreach and advocacy; groundwater; advanced treatment technologies (such as use of
advanced treatment technologies to reduce mineral content, attenuate contaminants of emerging
concern, etc.); and, other topics related to IPR. The Panel members for this effort were selected to
represent a broad range of disciplines and experience relevant to potable reuse (e.g., engineering,
water reuse criteria, groundwater hydrology, chemistry, and risk assessment), and included the
following:

December 2013 01830100.0000 5-2
Recycled Water Master Plan
New Recycled Water Program
Evaluation
Panel Chair: Shane Snyder, Ph.D., University of Arizona (Tucson, AZ)
Jörg E. Drewes, Dr.-Ing., Colorado School of Mines (Golden, CO)
Ian Pepper, Ph.D., University of Arizona (Tucson, AZ)
Anne Browning-Aiken, University of Arizona, Udall Center for Studies in Public Policy
(Tucson, AZ)
Michele Robertson, P.G., Montgomery & Associates (Scottsdale, AZ)
Robert Hultquist, California Department of Public Health (El Cerrito, CA)
Ron Wildermuth, West Basin Municipal Water District (Carson, CA)
5.1 Existing Recycled Water Quality
Current recycled water quality characteristics were developed using available data from Pima
County Regional Wastewater Reclamation Department (PCRWRD) and Tucson Water.
Secondary effluent water quality characteristics were determined for the existing Roger Road
WRF and the Ina Road WRF. Water quality characteristics were also determined for the
recovered water from the Sweetwater Underground Storage and Recovery (US&R) Facility and
the RWS. Reclaimed water in the RWS is a blend of the Tucson Water Reclaimed Water Plant
(RWP) tertiary filter effluent and recovered water from the Sweetwater US&R Facility extraction
wells. Table 5-1 summarizes the 90th percentile concentrations of water quality parameters for
secondary effluent from the Roger Road and Ina Road WRFs, recovered water from the
Sweetwater US&R Facility extraction wells, and RWS reclaimed water based on data from 2005 to
2010.

December 2013 01830100.0000 5-3
Recycled Water Master Plan
New Recycled Water Program
Evaluation
Table 5-1. Summary of 90th Percentile Concentrations of Water Quality Parameters
Ina Road WRF
Secondary Effluent
Roger Road WRF Secondary
Effluent
Sweetwater US&R Facility
Extraction Wells
Reclaimed Water in
RWS
Traditional Wastewater Parameters
Ammonia, mg/L as N 33 26 NS 16
TKN, mg/L as N 43 30 <0.2 17
Nitrate, mg/L as N 8 5 11 6
Nitrite, mg/L as N 1 3 <0.1 2
Total Nitrogen, mg/L as N 44 33 NS 23
BOD, mg/L 22 14 NS 5
Total Phosphorus, mg/L as P 5 4 NS NS
E. coli, MPN/100mL NA 120 <1 <1
Total coliform, MPN/100mL NA 2420 <1 7.5
Additional Parameters Important for Water Reuse
pH 7 7 7 8
Alkalinity, mg/L as CaCO3 302 237 265 238
Total Dissolved Solids, mg/L 647 721 724 750
TSS, mg/L 22 12 NS 3
Turbidity, NTU 3 12 2 4
Total Silica, mg/L NS 18 26 21
Arsenic, μg/L 3 6 7 6
Major Cations and Anions
Calcium, mg/L 61 66 90 85
Magnesium, mg/L 7 12 16 15
Sodium, mg/L 124 157 133 153
Potassium, mg/L 21 18 4 12
Barium, mg/L 59 0 0 0
Total Iron, mg/L NS 0 NS 0
Manganese, mg/L 13 <0.02 NS <0.02
Chloride, mg/L 140 153 119 147
Fluoride, mg/L 0.5 0.7 0.9 0.8
Sulfate, mg/L 131 159 166 160
DBPs and DBP Precursors
Total THMs, μg/L 22 2 2 5
TOC, mg/L 14 18 1 10
Bromide, mg/L NS 0.4 0.4 0.4
NS = Not Sampled, NA = Not Available during data collection period.

December 2013 01830100.0000 5-4
Recycled Water Master Plan
New Recycled Water Program
Evaluation
5.2 Projected Recycled Water Quality
The Regional Optimization Master Plan (ROMP) was developed by PCRWRD in conjunction with
community partners, including the City of Tucson, the Town of Oro Valley, and others. ROMP
outlines the long-term plan to meet new environmental regulatory requirements mandated by the
Arizona Department of Environmental Quality (ADEQ). The new environmental regulations require
PCRWRD to decrease the amount of nitrogen and ammonia in wastewater effluent discharged to
the Santa Cruz River. The Ina Road WRF will be upgraded and expanded, while a new water
reclamation facility will be constructed at the Water Reclamation Campus in the vicinity of the
existing Roger Road WRF. The existing Roger Road WRF will be decommissioned after the
Water Reclamation Campus is completed. The Ina Road WRF and Water Reclamation Campus
will both include nitrification and dentrification treatment processes.
The new treatment facilities at the Ina Road WRF and Water Reclamation Campus will ultimately
determine the future water quality for use in new recycled water programs. Current and projected
recycled water quality for the Ina Road WRF and Water Reclamation Campus are shown on
Figure 5-1. Projected water qualities were provided by the Compliance and Regulatory Affairs
Office of PCRWRD. The projected concentrations for nitrogen, BOD, and TSS were estimated
using removal efficiencies from existing Pima County facilities that utilize biological nitrogen
removal (BNR) and actual influent concentrations from 2010. The projected concentration for
phosphorus was estimated from the Ina Road WRF Capacity and Effluent Quality Upgrade Final
Design Report (PCRWRD, January 2011).

December 2013 01830100.0000 5-5
Recycled Water Master Plan
New Recycled Water Program
Evaluation
Figure 5-1. Current and Projected Recycled Water Quality
5.3 Emerging Contaminants
The presence of emerging contaminants in the recycled water used for IPR is important to the
planning and evaluation of advanced treatment processes. Tucson Water and the County do not
currently monitor for emerging contaminants in wastewater or recycled water. However, as part
of its Microconstituent Sampling program, Tucson Water monitors for the presence of several
pharmaceuticals, personal care products (PPCPs) and endocrine disrupting compounds (EDCs)
in drinking water sources. Established in 2008, the program monitors for PPCPs and EDCs on
an annual basis. The program water quality sampling locations are shown on Figure 5-2.
Sampling is conducted at four wells near the Santa Cruz River, which may be influenced from
the secondary treated effluent discharged to the river: W-001B, Y-001A, Y-004A, and Z-013A on
Figure 5-2. Sampling is also conducted at three combined well field locations: EPDS 129
(CAVSARP), EPDS 124 (SAVSARP), and EPDS 125 (Santa Cruz Wellfield). The results of the
Microconstituent Sampling program are presented in Table 5-2.
0
5
10
15
20
25
30
35
Nitrogen Phosphorus BOD TSS Nitrogen Phosphorus BOD TSS
Ina Road WRF Roger Road WRF/Water Reclamation Campus
Co
nc
en
tra
tio
n (
mg
/L)
2010 Water Quality Projected Water Quality

December 2013 01830100.0000 5-6
Recycled Water Master Plan
New Recycled Water Program
Evaluation
Figure 5-2. Tucson Water Microconstituent Sampling Program Locations

December 2013 01830100.0000 5-7
Recycled Water Master Plan
New Recycled Water Program
Evaluation
Table 5-2. Tucson Water Microconstituent Sampling Program Results
Sample Point
Detected Compound
1
2010 Results (ng/L)
2009 Results (ng/L)
2008 Results
2
(ng/L)
2002 Results
2
(ng/L)
Well W-001B Caffeine 3.3
Carbamazepine 11
PFOS 3.1 3.9
Well Y-001A Carbamazepine 11 79 47
Dyhydronifedipine 0.5
Fluoxetine 1.2
Iopromide 5.9
PFOS 38 42
PFOSA 79
PFOA 21
Sulfamethoxazole 8.1 11
Triclosan 7.9
Well Y-004A Carbamazepine 75 65
PFOS 16 48
PFOSA 86
PFOA 20
Well Z-013A Carbamazepine 130 120
Ibuprofen 1.3
PFOS 27 65
PFOSA 120
PFOA 29
Sulfamethoxazole 1.6 1.4
CAVSARP PFOS 0.98 0.21
SAVSARP No Constituents
Detected
No Constituents
Detected
Santa Cruz PFOS 1.1
Sulfamethoxazole 2.9 1 The analyte list for each year may not be the same and is subject to change based on results from the
previous year. 2 For 2008 and 2002, only Well Y-001A was monitored.
5.4 Water Quality Goals for Indirect Potable Reuse
Advanced water treatment will apply only to recycled water program alternatives involving IPR.
Water quality goals for advanced water treatment were developed for the point where recycled

December 2013 01830100.0000 5-8
Recycled Water Master Plan
New Recycled Water Program
Evaluation
water is introduced into the Clearwater blend produced by the CAVSARP and SAVSARP
facilities. SAT provided during the recharge step is considered part of the advanced treatment
trains. Water quality required for recycled water recharge will be provided by the County water
reclamation facilities in compliance with State Aquifer Protection Permit (APP) requirements.
Table 5-3 presents the water quality parameters, rationale, and numeric goals for advanced
water treatment that were developed from state and federal drinking water standards, quality of
existing supplies, desired quality improvements for existing supplies, and from practices of other
leaders in IPR (i.e., California). The water quality goals were also established with the
assistance of the NWRI Independent Advisory Panel, which brought to bear the experiences
and lessons learned from similar indirect potable reuse projects across the country and the
world.
Table 5-3. Advanced Water Treatment Water Quality Goals
Parameter Rationale Numeric Goals
Particulate Comply with federal/state drinking water standard
0.3 NTU (95%, 1 NTU max)
Total Organic Carbon (TOC)1 Comparable to Clearwater blend ~0.5 mg/L
Mineral content (hardness) 1. Partial stream treatment 2. Full flow treatment
1. ~250 mg/L 2. ~100 mg/L
Mineral content (TDS) 1. Partial stream treatment (meet CAP concentration)
2. Full flow treatment
1. ~650 mg/L 2. ~250 mg/L
Nutrients Comply with federal/state drinking water standard (70% of MCLs)
Nitrate < 7 mg/L as N Nitrite < 0.7 mg/L as N
Viruses California draft regulations (2011)2 12 log reduction value (LRV)
Cryptosporidium California draft regulations (2011) 10 LRV
Total Coliform, Fecal Coliform, E. coli
Meet LT23 requirements Non-detect
Giardia California draft regulations (2011) 10 LRV
Contaminant Candidate List 3 Pathogens
Meeting LT2 requirements will comply with CCL3 Pathogens
Microconstituents Removal consistent with water treatment industry practice
Nitrosamines Potential 10 ng/L future standard
Refractory Chemicals Removal consistent with water treatment industry practice 1 The concentration of TOC in the Clearwater blend may change over time, and the numeric goal for TOC may be
adjusted in the future to be comparable to the Clearwater blend
2 Draft Regulations for Groundwater Replenishment Reuse projects under Title 22 California Code of Regulations,
Div. 4 Environmental Heath, Ch. 3 Recycling Criteria (CA Dept. of Public Health 11/21/2011) 3 Long Term 2 Enhanced Surface Water Treatment Rule (LT2)

December 2013 01830100.0000 5-9
Recycled Water Master Plan
New Recycled Water Program
Evaluation
According to the Groundwater Replenishment Reuse Draft Regulation (California Department of
Public Health, November 2011), a Groundwater Replenishment Reuse Project (GRRP) must be
designed and operated such that the recycled municipal wastewater used as recharge water be
treated by at least three separate treatment processes. For each pathogen, a separate
treatment process may be credited with no more than 6-log reduction and shall achieve at least
1-log reduction. A portion of the total required pathogen log reduction value may be achieved
using SAT, including underground retention. For each month retained underground, the recycled
municipal wastewater or recharge water will be credited with 1-log virus reduction. A GRRP
meeting either the definition of filtered wastewater, or the definition of disinfected tertiary
recycled water, or providing advanced treatment complying with the regulation, that also
demonstrates at least six months retention underground, will be credited with 10-log Giardia cyst
reduction and 10-log Cryptosporidium oocyst reduction (Title 22 California Code of Regulations,
Div. 4 Environmental Health, Ch. 3 Recycling Criteria, Article 1 Definitions).
5.5 Advanced Water Treatment Technologies
Advanced water treatment processes can be employed to meet the water quality goals of a
particular water reuse program by providing multiple barriers for pathogens and diverse barriers
for trace organic contaminants. Several factors may impact the selection of a treatment
technology, including source water quality, treatment goals, operational complexity, residuals
management, operations and maintenance, and energy and chemical requirements. The following
sections summarize key treatment processes for mainstream treatment and concentrate (brine)
treatment. Table 5-4 provides an overview of the advanced water treatment technologies and the
classes of contaminants removed.
5.5.1 Mainstream Treatment Technologies
Several key treatment processes for the purification of recycled water were considered:
Microfiltration (MF) and Ultrafiltration (UF): Pressure-driven membrane processes
used to remove particulate matter, including turbidity and microorganisms. MF and UF
are effective pre-treatment processes for reverse osmosis and nanofiltration.
Reverse Osmosis (RO) and Nanofiltration (NF): Pressure driven membrane
processes in which hydraulic pressure in excess of a membrane’s osmotic pressure is
applied to push water through a dense membrane. Removal is not solely based on size
exclusion, but also on diffusive and electrostatic properties. The key difference between
NF and RO is that NF does not remove monovalent ions (i.e., sodium and chloride). RO
usually requires higher operating pressures than NF.

December 2013 01830100.0000 5-10
Recycled Water Master Plan
New Recycled Water Program
Evaluation
Soil Aquifer Treatment (SAT): A natural treatment process in which the water to be
treated is recharged in basins allowing water to percolate through the soil column where
it undergoes physical, biological, and chemical transformation. The soil column acts as a
natural filter, microorganisms break down the biodegradable organic matter, and there is
additional purification through neutralization, oxidation, precipitation, and adsorption
reactions. SAT is also effective for degradation of microconstituents. Ozonation can be
employed prior to SAT to increase the dissolved oxygen concentration and break down
organic carbon, which could improve biological reactions.
Granular Activated Carbon (GAC): GAC offers large available surface area via its porous
pore structure which contaminants can diffuse into and adsorb onto. GAC is effective for
removal of broad classes of microconstituents and also provides other water quality
benefits, such as removing taste and odor compounds. GAC is often utilized after
ozonation, which is called Biologically Activated Carbon (BAC).
Ultraviolet/Hydrogen Peroxide Advanced Oxidation Process (UV-AOP): UV
photolysis of hydrogen peroxide generates hydroxyl radicals (•OH) that have an oxidation
potential greater than other strong oxidants. Hydroxyl radicals are non-selective and
have fast reaction rates with organic and inorganic species present in natural waters.
UV-AOP is effective for disinfection and destruction of broad classes of
microconstituents. GAC can also be used for hydrogen peroxide quenching after UV-AOP.
5.5.2 Concentrate Treatment Technologies
Several key treatment processes for concentrate treatment were considered:
Ozone: Ozone is an unstable gas that is slightly soluble in water and is a very powerful
oxidant. During ozonation, the two main oxidants ozone and hydroxyl radicals are formed
during the decomposition of ozone. Ozone is very reactive with a number of common
constituents, including natural organic matter (NOM). During concentrate treatment, ozone
is an effective pre-treatment process for oxidation of TOC.
Biologically Activated Carbon (BAC): As mentioned in Section 5.5.1, GAC is often
utilized after ozonation, which is called BAC. During concentrate treatment, BAC is an
effective pre-treatment process for removal of particulates and TOC.
Ion Exchange (IX): Contaminant cations and anions can be removed from water using IX
with resins or adsorption onto granular metal oxides/hydroxides. For concentrate
treatment, IX is primarily used for the removal of nutrients and hardness.

December 2013 01830100.0000 5-11
Recycled Water Master Plan
New Recycled Water Program
Evaluation
Electrodialysis Reversal (EDR): Membrane process driven by electric potential in
which ions are transferred through ion exchange membranes by means of a direct
current voltage. EDR also has a low scaling potential and is more appropriate for
concentrate treatment since EDR does not concentrate silica.
Granular Activated Carbon (GAC): As mentioned in Section 5.5.1, GAC is effective for
removal of broad classes of microconstituents and also provides other water quality
benefits through adsorption. During concentrate treatment, GAC is used to remove
particulates, TOC, and microconstituents.
Table 5-4. Summary of Advanced Water Treatment Technologies
Advanced Treatment Process
Classes of Contaminants Removed
As a Primary Removal Mechanism As a Secondary/
Potential Removal Mechanism
Main Stream Treatment Technologies
MF/UF Particulates Pathogens, Viruses
RO/NF Particulates, TOC, Mineral Content,
Microconstituents Nutrients, Pathogens, Viruses
SAT TOC, Nutrients, Pathogens Particulates, Microconstituents,
Viruses
GAC Particulates, TOC, Microconstituents --
UV-AOP Microconstituents, Pathogens,
Viruses --
Concentrate Treatment Technologies
Ozone -- TOC, Microconstituents, Pathogens,
Viruses
BAC Particulates, TOC Pathogens, Viruses
IX Nutrients, Mineral Content --
EDR -- Mineral Content
GAC Particulates, TOC, Microconstituents --
5.6 Selection of Advanced Water Treatment Processes
The project team identified advanced treatment processes for each category of recycled water
program alternatives by holding workshops with several recycled water experts, including Dr.
Shane Snyder (University of Arizona), Dr. Paul Westerhoff (Arizona State University), and Dr.
Gary Amy (King Abdullah University of Science and Technology). These experts brought to bear
not only the experiences of successful IPR programs across the county, but also the state-of-the-
art in water treatment research. The workshops focused on emerging trends in treatment for IPR,
including different perspectives for inland versus coastal IPR projects since concentrate
management is more difficult for inland IPR projects. Several treatment train concepts and

December 2013 01830100.0000 5-12
Recycled Water Master Plan
New Recycled Water Program
Evaluation
strategies for concentrate management were also developed with input from the experts. Based
on recent research and experience, several of the experts advocated post-recovery treatment for
inland IPR projects due to the potential for flow equalization, lower costs, and lower energy
requirements. Based on the results of the workshops, a long list of alternative advanced treatment
process trains was narrowed down to a list of ten candidate treatment train alternatives. The
treatment trains are presented in Table 5-5 and include pre-recharge, post-recovery, and
concentrate treatment processes. All of the treatment train alternatives use chlorine disinfection
prior to blending with the Clearwater blend.
Table 5-5. Summary of Treatment Train Alternatives
Alternative Pre-Recharge Treatment SAT Post-Recovery Treatment Concentrate Treatment
CAVSARP-1 MF, NF, UV-AOP SAT Disinfection O3, BAC, IX, EDR
CAVSARP-2 MF, RO, UV-AOP SAT Disinfection O3, BAC, IX, EDR
CAVSARP-3 MF, RO SAT Disinfection O3, BAC, IX, EDR
CAVSARP-4 MF, RO (partial), UV-AOP SAT Disinfection O3, BAC, IX, EDR
CAVSARP-5 MF, RO (partial), O3 SAT Disinfection O3, BAC, IX, EDR
North CAVSARP-1 MF, NF, UV-AOP SAT Disinfection O3, BAC, IX, EDR
North CAVSARP-2 MF, RO, UV-AOP SAT Disinfection O3, BAC, IX, EDR
North CAVSARP-3 - SAT RO, UV-AOP, GAC (for H2O2 quenching), Disinfection EDR
North CAVSARP-4 O3 SAT RO, Disinfection EDR, GAC
North CAVSARP-5 O3 SAT
RO (partial), UV-AOP (partial), GAC (for H2O2 quenching), Disinfection EDR, GAC
As indicated previously, recycled water from the CAVSARP category of alternatives would be
recharged with CAP water in existing recharge basins at CAVSARP. Thus, all of the CAVSARP
alternatives utilize pre-recharge advanced treatment of the recycled water. Post-recovery
treatment would require treatment of recovered recycled water and CAP water, which would
dramatically increase the required design capacity.
The CAVSARP-1 and 2 treatment trains closely follow the treatment approach used at the Orange
County, CA Groundwater Replenishment System and the West Basin Municipal Water District, CA
facilities. The CAVSARP-1, 2 and 3 treatment trains include full stream membrane treatment to
provide maximum salinity control. The CAVSARP-4 and 5 treatment trains were included to
assess partial stream membrane treatment to match the mineral content of the CAP surface
water.

December 2013 01830100.0000 5-13
Recycled Water Master Plan
New Recycled Water Program
Evaluation
The North CAVSARP category of alternatives considers both pre-recharge and post-recovery
treatment since they present the opportunity to isolate the recharge and recovery operations for
recycled water. Pre-recharge treatment would be sized to accommodate the variations in
unutilized recycled water, while post-recovery treatment could be sized to take advantage of the
storage and buffering benefit of the aquifer.
5.7 Advanced Treatment Processes and Treatment Effectiveness
Process flow diagrams and treatment effectiveness tables were developed for each treatment
train alternative to graphically illustrate the treatment components and the relative effectiveness of
each component at removing classes of contaminants of concern. The graphical illustrations also
show the potential multiple barriers to each class of contaminant.
Figure 5-3 presents the legend for the treatment effectiveness tables, which illustrate the
redundant and diverse barrier treatment approach that could be used to meet water quality goals.
The primary removal mechanism is indicated with a green dot, while a potential removal
mechanism is indicated with a yellow dot. Partial removal is indicated with quarter, half, and three
quarter full circles depending on removal effectiveness. No removal is indicated with an empty
circle. Water quality parameters considered include particulates, TOC, nutrients, mineral content
(hardness and TDS), microconstituents, pathogens, and viruses.
Figures 5-4 through 5-13 illustrate the treatment trains and treatment effectiveness tables for the
advanced treatment train alternatives listed in Table 5-5. Figures 5-14 through 5-16 illustrate the
treatment trains and treatment effectiveness tables for the concentrate treatment train alternatives
listed in Table 5-5.
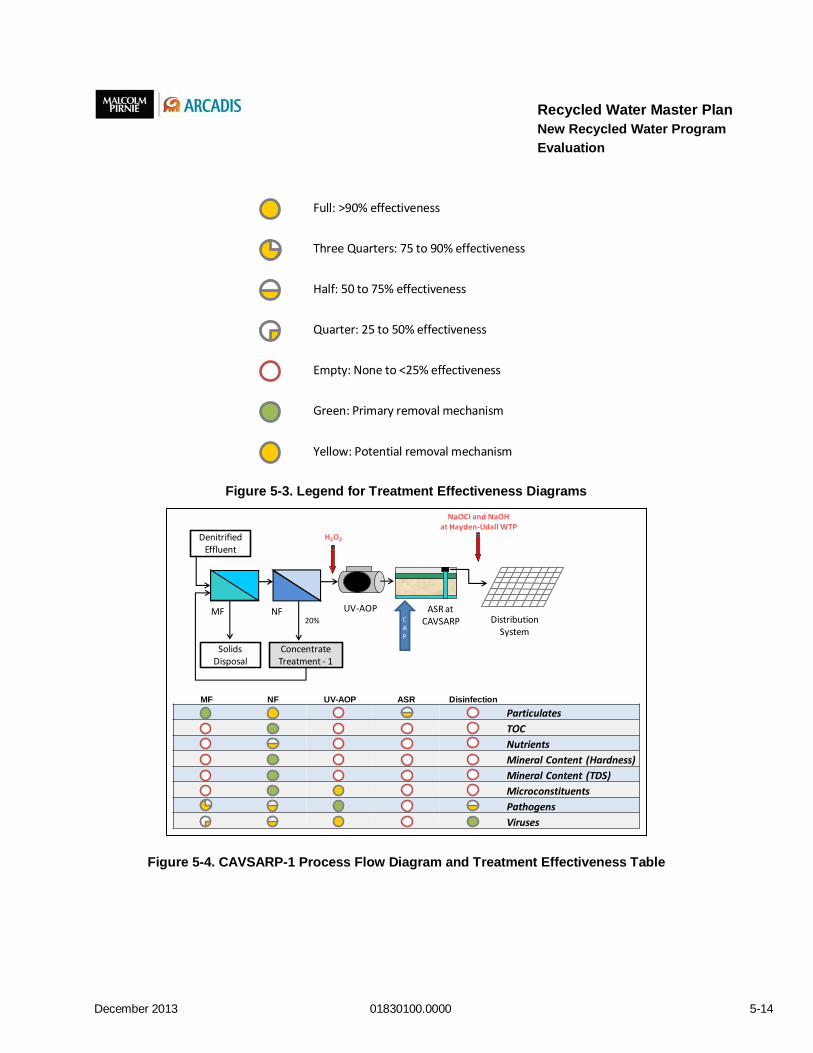
December 2013 01830100.0000 5-14
Recycled Water Master Plan
New Recycled Water Program
Evaluation
Full: >90% effectiveness
Three Quarters: 75 to 90% effectiveness
Half: 50 to 75% effectiveness
Quarter: 25 to 50% effectiveness
Empty: None to <25% effectiveness
Green: Primary removal mechanism
Yellow: Potential removal mechanism
Figure 5-3. Legend for Treatment Effectiveness Diagrams
Figure 5-4. CAVSARP-1 Process Flow Diagram and Treatment Effectiveness Table
MF NF UV-AOP
H2O2
ASR atCAVSARP
MF NF UV-AOP ASR Disinfection
Particulates
TOC
Nutrients
Mineral Content (Hardness)
Mineral Content (TDS)
Microconstituents
Pathogens
Viruses
Concentrate Treatment - 1
Solids Disposal
Denitrified Effluent
20% CAP
Distribution System
NaOCl and NaOHat Hayden-Udall WTP

December 2013 01830100.0000 5-15
Recycled Water Master Plan
New Recycled Water Program
Evaluation
Figure 5-5. CAVSARP-2 Process Flow Diagram and Treatment Effectiveness Table
Figure 5-6. CAVSARP-3 Process Flow Diagram and Treatment Effectiveness Table
MF RO UV-AOPDistribution
System
Solids Disposal
Denitrified Effluent
20%
H2O2
MF RO UV-AOP ASR Disinfection
Particulates
TOC
Nutrients
Mineral Content (Hardness)
Mineral Content (TDS)
Microconstituents
Pathogens
Viruses
NaOCl and NaOHat Hayden-Udall WTP
CAP
ASR atCAVSARP
Concentrate Treatment - 1
MF RO ASR at CAVSARP
Distribution System
MF RO ASR Disinfection
Particulates
TOC
Nutrients
Mineral Content (Hardness)
Mineral Content (TDS)
Microconstituents
Pathogens
Viruses
Solids Disposal
Denitrified Effluent
20%
Concentrate Treatment - 1
NaOCl and NaOHat Hayden-Udall WTP
CAP

December 2013 01830100.0000 5-16
Recycled Water Master Plan
New Recycled Water Program
Evaluation
Figure 5-7. CAVSARP-4 Process Flow Diagram and Treatment Effectiveness Table
MF
Partial RO
ASR at CAVSARP
UV-AOPDistribution
System
MF Partial RO UV-AOP ASR Disinfection
Particulates
TOC
Nutrients
Mineral Content (Hardness)
Mineral Content (TDS)
Microconstituents
Pathogens
Viruses
Solids Disposal
Denitrified Effluent
20% of RO Influent
H2O2
Concentrate Treatment - 1
NaOCl and NaOHat Hayden-Udall WTP
CAP
MF Partial RO Ozone ASR Disinfection
Particulates
TOC
Nutrients
Mineral Content (Hardness)
Mineral Content (TDS)
Microconstituents
Pathogens
Viruses
MF
Partial RO
ASR at CAVSARP
Ozone
O3
Distribution System
Solids Disposal
Denitrified Effluent
20% of RO Influent
Concentrate Treatment - 1
NaOCl and NaOHat Hayden-Udall WTP
CAP

December 2013 01830100.0000 5-17
Recycled Water Master Plan
New Recycled Water Program
Evaluation
Figure 5-8. CAVSARP-5 Process Flow Diagram and Treatment Effectiveness Table
Figure 5-9. North CAVSARP-1 Process Flow Diagram and Treatment Effectiveness Table
Figure 5-10. North CAVSARP-2 Process Flow Diagram and Treatment Effectiveness Table
MF NF UV-AOP ASRDistribution
System
MF NF UV-AOP ASR Disinfection
Particulates
TOC
Nutrients
Mineral Content (Hardness)
Mineral Content (TDS)
Microconstituents
Pathogens
Viruses
Solids Disposal
Denitrified Effluent
20%
H2O2
Re
cove
red
CA
PConcentrate Treatment - 1
NaOCl and NaOHat Hayden-Udall WTP
MF RO UV-AOP ASR
MF RO UV-AOP ASR Disinfection
Particulates
TOC
Nutrients
Mineral Content (Hardness)
Mineral Content (TDS)
Microconstituents
Pathogens
Viruses
Solids Disposal
Denitrified Effluent
20%
H2O2
Concentrate Treatment - 1
Distribution System
NaOCl and NaOHat Hayden-Udall WTP
Re
cove
red
CA
P

December 2013 01830100.0000 5-18
Recycled Water Master Plan
New Recycled Water Program
Evaluation
Figure 5-11. North CAVSARP-3 Process Flow Diagram and Treatment Effectiveness Table
Figure 5-12. North CAVSARP-4 Process Flow Diagram and Treatment Effectiveness Table
Evaporation
Concentrate Treatment - 2
- +
2-Stage EDR
UV-AOPSAT Distribution
System
Denitrified Effluent
SAT RO EDR UV-AOP GAC Disinfection
Particulates
TOC
Nutrients
Mineral Content (Hardness)
Mineral Content (TDS)
Microconstituents
Pathogens
Viruses
20% GACFor H202
QuenchingOnly
H2O2
NaOCl and NaOHat Hayden-Udall WTP
Re
cove
red
CA
P
BackwashTank
CartridgeFilters
RO
Ozone SAT RO EDR GAC Disinfection
Particulates
TOC
Nutrients
Mineral Content (Hardness)
Mineral Content (TDS)
Microconstituents
Pathogens
Viruses
Evaporation
Concentrate Treatment - 3
- +
2- StageEDR
SATDistribution
System
Denitrified Effluent
O3
Ozone Contactor
20%
GAC
NaOCl and NaOHat Hayden-Udall WTP
Re
cove
red
CA
P
BackwashTank
CartridgeFilters
RO

December 2013 01830100.0000 5-19
Recycled Water Master Plan
New Recycled Water Program
Evaluation
Figure 5-13. North CAVSARP-5 Process Flow Diagram and Treatment Effectiveness Table
Figure 5-14. Concentrate Treatment-1 Process Flow Diagram and Treatment Effectiveness Table
Evaporation
Concentrate Treatment - 3
- +
2- StageEDR
DistributionSystem
Denitrified Effluent
O3
Ozone Contactor
Ozone SAT Partial RO UV-AOP EDR GAC Disinfection
Particulates
TOC
Nutrients
Mineral Content (Hardness)
Mineral Content (TDS)
Microconstituents
Pathogens
Viruses
20%
GAC
NaOCl and NaOHat Hayden-Udall WTP
Re
cove
red
CA
P
H2O2
BackwashTank
CartridgeFilters
UV-AOP GAC For H202
Quenching Only
Partial RO
SAT
O3
- +
2-Stage EDR
Ozone Contactor
BAC IX
Ozone BAC IX EDR
Particulates
TOC
Nutrients
Mineral Content (Hardness)
Mineral Content (TDS)
Microconstituents
Pathogens
Viruses
Brine Influent
Evaporation
25%
Return to Headworks

December 2013 01830100.0000 5-20
Recycled Water Master Plan
New Recycled Water Program
Evaluation
Figure 5-15. Concentrate Treatment-2 Process Flow Diagram and Treatment Effectiveness Table
Figure 5-16. Concentrate Treatment-3 Process Flow Diagram and Treatment Effectiveness Table
- +
2- Stage EDR Evaporation
25%
Brine Influent
Blend with RO Permeate
EDR
Particulates
TOC
Nutrients
Mineral Content (Hardness)
Mineral Content (TDS)
Microconstituents
Pathogens
Viruses
EDR GAC
Particulates
TOC
Nutrients
Mineral Content (Hardness)
Mineral Content (TDS)
Microconstituents
Pathogens
Viruses
- +
Evaporation
GAC
Brine Influent
Blend with RO Permeate
2- Stage EDR
25%

December 2013 01830100.0000 5-21
Recycled Water Master Plan
New Recycled Water Program
Evaluation
5.8 Cost Evaluation of Treatment Process Alternatives
The treatment process trains identified in the previous section were defined in enough detail for
development of conceptual costs. Conceptual design flows, based on the seasonal availability of
unutilized recycled water described in Chapter 5 of the Recycled Water Master Plan, and
conceptual advanced water treatment design criteria were used to size treatment component
facilities and to estimate operational requirements. This information was then used to develop
conceptual opinions of capital costs, annual operations and maintenance (O&M) costs, and total
20-year present worth for each treatment process train.
5.8.1 Conceptual Design Flows
Chapter 5 of the Recycled Water Master Plan provided projections of future unutilized Tucson
Water recycled water based on the most recent wastewater flow projections, allocation of effluent
entitlements, and projections of the seasonal usage of reclaimed water. A range of unutilized
recycled water supplies were projected:
A “High Range” based on the most recent regional wastewater flow projections and
assuming that the Conservation Effluent Pool (CEP) allotment was not being utilized (the
allotment would revert back to the contributing entities).
A “Low Range” based on 90 percent of the regional wastewater flow projections and
assuming that the CEP allotment was being utilized by non-Tucson Water users.
Table 5-6 summarizes the analysis provided in the Recycled Water Master Plan.
Table 5-6. Summary of Unutilized Recycled Water Available for New Recycled Water Programs
Available 2020 2030 2050
Low Range High Range Low Range High Range Low Range High Range
Minimum Month 0 AF
(0 MGD) 732 AF
(8 MGD) 88 AF
(1 MGD) 1,310 AF (14 MGD)
416 AF (5 MGD)
1,860 AF (20 MGD)
Maximum Month 1,630 AF (19 MGD)
2,770 AF (32 MGD)
2,270 AF (26 MGD)
3,490 AF (41 MGD)
2,740 AF (32 MGD)
4,190 AF (49 MGD)
Annual Average 7,890 AF/YR
(7 MGD)
21,600 AF/YR
(19 MGD)
14,700 AF/YR
(13 MGD)
29,300 AF/YR
(26 MGD)
19,500 AF/YR
(17 MGD)
36,900 AF/YR
(33 MGD)

December 2013 01830100.0000 5-22
Recycled Water Master Plan
New Recycled Water Program
Evaluation
The information in Table 5-6 was used to develop concept design flows for sizing of advanced
treatment component facilities. The pre-recharge alternatives would have to treat the peak
recycled water availability and operate to accept the wide fluctuations throughout the year. The
post-recovery alternatives could treat the annual average availability and operate at near constant
flows throughout the year. Table 5-7 summarizes the concept design flows that were used to size
treatment processes.
Table 5-7. Summary of Design Flows
Infrastructure 2020 2030 2050
Low Range (MGD)
High Range (MGD)
Low Range (MGD)
High Range (MGD)
Low Range (MGD)
Pre-recharge Treatment Equipment
19 32 26 41 N/A
Post-recovery Treatment Equipment
7 19 13 26 N/A
5.8.2 Conceptual Design Criteria
Table 5-8 summarizes the conceptual design criteria that were utilized to size treatment
component facilities and to estimate operational requirements for the treatment train alternatives.

December 2013 01830100.0000 5-23
Recycled Water Master Plan
New Recycled Water Program
Evaluation
Table 5-8. Design Criteria for Conceptual Cost Opinions for Treatment Train Alternatives
Unit Process Design Criteria
Microfiltration Recovery 90%
Nanofiltration and Reverse Osmosis
Recovery 80%
UV-AOP Target Contaminant (Photolysis) NDMA
Log Reduction of NDMA 1.2
Target Contaminant (Oxidation) 1,4-dioxane
Log Reduction of 1,4-dioxane 0.5
Lamp Fouling Factor 0.9 to 1
UVT 95%
Peroxide dose 4 mg/L
Ozone Target Ozone: TOC Ratio (mg O3: mg TOC) 0.5
Contact Time 10 minutes
Soil Aquifer Treatment Infiltration Rate 1.5 ft/day
GAC (Hydrogen Peroxide Quenching)
Contactor Type Pressure Contactors (ASME Rated)
Contactor Configuration Parallel
Contactor Diameter 12 ft
Carbon Type Catalytic Coconut
Empty Bed Contact Time 6 minutes
Liquid Loading Rate 9 gpm/sf
GAC Changeout Frequency 2 years
GAC (Adsorption)
Contactor Type Pressure Contactors (ASME Rated)
Contactor Configuration Parallel
Contactor Diameter 12 ft
Carbon Type Coconut Shell
Empty Bed Contact Time 30 minutes
Liquid Loading Rate 4 gpm/sf
GAC Changeout Frequency 0.5 years
BAC Contactor Type Pressure Contactors (ASME Rated)
Contactor Configuration Series
Contactor Diameter 12 ft
Carbon Type Coconut Shell
Empty Bed Contact Time 20 minutes
Liquid Loading Rate 4 gpm/sf
GAC Changeout Frequency 4 years
Ion Exchange Recovery 98%
Electrodialysis Reversal Recovery / Stage 50%
Salt Removal 75%
Overall Water Recovery 75%
Evaporation Ponds Pan Evaporation Rate 107 inches
Average Precipitation 11.1 inches
Pipelines Maximum Velocity 5 feet per second

December 2013 01830100.0000 5-24
Recycled Water Master Plan
New Recycled Water Program
Evaluation
5.8.3 Basis for Conceptual Cost Opinions
The conceptual cost opinions presented in this section are for the purposes of comparing
treatment process trains and were conducted early in the project. All conceptual cost opinions
presented are for January 2012 (20 Cities Average Engineering News Record Construction Cost
Index = 9176). The level of accuracy for the cost opinions corresponds to Class 5 as defined by
the Association for the Advancement of Cost Engineering (AACE) International. Class 5 estimates
are generally prepared based on limited information and have a typical accuracy range of 30
percent to +50 percent. This level of cost estimating is typically done for project screening,
feasibility studies, and concept evaluation. The cost opinions include 25 percent for engineering
and administration and 30 percent for project contingencies. The present worth analyses are
based on a term of 20 years and an interest rate of 6 percent.
Additional cost evaluations for recycled water program alternatives in Chapter 6 were completed
after the treatment train evaluations and may have a different basis of cost as described above.
5.8.4 Conceptual Cost Opinions for Treatment Train Alternatives
Conceptual cost opinions for the treatment train alternatives were developed to provide relative
comparison of treatment costs, and for use in a matrix evaluation of treatment train alternatives.
To facilitate the comparisons, the conceptual cost opinions were based on the 2020 low range
projection of unutilized recycled water in Table 5-6.
The detailed conceptual cost opinions for treatment train alternatives are presented in Attachment
A to this technical memorandum and are summarized on Figures 5-17, 5-18 and 5-19 (capital
costs, O&M costs, and total present worth, respectively). The figures illustrate that the post-
recovery treatment trains, North CAVSARP-3, 4 and 5, have the lowest total present worth and
are approximately 65 percent less than the pre-recharge treatment train alternatives. The
alternatives with partial stream membrane treatment, CAVSARP-4 and 5, have the median total
present worth. The alternatives with pre-recharge treatment and full flow membrane treatment,
CAVSARP-1, 2, and 3 and North CAVSARP-1 and 2, had the highest total present worth.
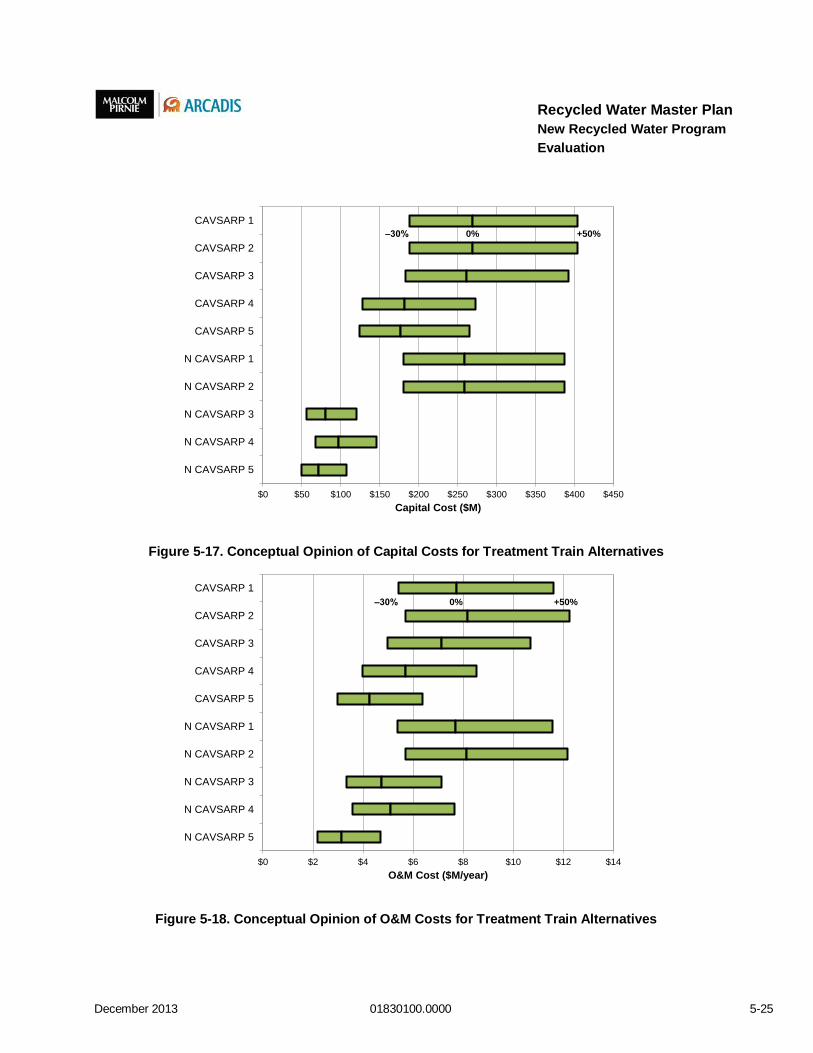
December 2013 01830100.0000 5-25
Recycled Water Master Plan
New Recycled Water Program
Evaluation
Figure 5-17. Conceptual Opinion of Capital Costs for Treatment Train Alternatives
Figure 5-18. Conceptual Opinion of O&M Costs for Treatment Train Alternatives
$0 $50 $100 $150 $200 $250 $300 $350 $400 $450
N CAVSARP 5
N CAVSARP 4
N CAVSARP 3
N CAVSARP 2
N CAVSARP 1
CAVSARP 5
CAVSARP 4
CAVSARP 3
CAVSARP 2
CAVSARP 1
Capital Cost ($M)
0% +50%‒30%
$0 $2 $4 $6 $8 $10 $12 $14
N CAVSARP 5
N CAVSARP 4
N CAVSARP 3
N CAVSARP 2
N CAVSARP 1
CAVSARP 5
CAVSARP 4
CAVSARP 3
CAVSARP 2
CAVSARP 1
O&M Cost ($M/year)
0% +50%‒30%

December 2013 01830100.0000 5-26
Recycled Water Master Plan
New Recycled Water Program
Evaluation
Figure 5-19. Conceptual Opinion of Total Present Worth for Treatment Train Alternatives
5.8.5 Matrix Evaluation of Treatment Train Alternatives
The treatment train alternatives were further analyzed using a matrix evaluation to identify the
most preferred treatment train alternatives. The matrix evaluation was based on important criteria
for decisions regarding a future Tucson Water recycled water program employing IPR. The
evaluation was accomplished by a systematic scoring and weighting of the decision criteria for
each of the treatment train alternatives. The process for the matrix evaluation included the
following steps:
1. Define decision criteria
2. Prioritize and weight criteria
3. Score alternatives against each decision criteria
4. Perform alternatives scoring and ranking analysis
5. Select preferred treatment process trains
$0 $100 $200 $300 $400 $500 $600
N CAVSARP 5
N CAVSARP 4
N CAVSARP 3
N CAVSARP 2
N CAVSARP 1
CAVSARP 5
CAVSARP 4
CAVSARP 3
CAVSARP 2
CAVSARP 1
Total Present Worth ($M)
0% +50%‒30%

December 2013 01830100.0000 5-27
Recycled Water Master Plan
New Recycled Water Program
Evaluation
Step 1 – Define Decision Criteria
The decision criteria identified as most important to Tucson Water in selecting preferred
treatment train alternatives are described below:
Public acceptance: Perceived potential for positive or negative public sentiment due to
water quality, neighborhood factors, and water rate impacts. Alternatives with the
greatest potential for public acceptance are preferable.
Cost: Relative capital costs, O&M costs and total present worth. Alternatives with lower
costs are preferable.
Multiple barrier approach: A robust approach to treatment that provides multiple
treatment technologies that remove a wide range of constituents, ensuring water quality
goals are met. Alternatives that utilize a multiple barrier approach to treatment are
preferable.
Mineral content reduction: Ability to address groundwater basin salinity issues or, at a
minimum, to meet upper mineral content goals for the Clearwater Blend from Decision
H2O (650 mg/L TDS). Alternatives that address basin salinity issues are preferable.
Proven IPR process: Treatment train utilized in successful IPR programs at other
locations. Alternatives that utilize a proven IPR process are preferable.
Refractory chemicals: Ability to remove or destroy challenging non-biodegradable
refractory chemicals. Alternatives that perform better with respect to removal or
destruction of refractory chemicals are preferable.
Microconstituent removal: Treatment effectiveness in removing or destroying broad
classes of compounds including pharmaceuticals and personal care products (PPCPs),
endocrine-disrupting compounds (EDCs), industrial and agricultural compounds, etc.
Alternatives that are more effective in removing microconstituents are preferable.
Energy usage: Power requirements for treatment operations. Alternatives that use less
energy are preferable.
Institutional and regulatory complexity: Number and complexity of required agency
approvals/permits and support, potential for regulatory scrutiny, and effects on
agreements with regional stakeholders. Alternatives that are less susceptible to

December 2013 01830100.0000 5-28
Recycled Water Master Plan
New Recycled Water Program
Evaluation
regulatory and institutional challenges and require fewer and less complex permits or
approvals are more preferable.
Operational complexity: Complexity of facility operations and need for operator
attention. Alternatives with fewer and less complex facilities to operate, requiring lower
staffing requirements, are more preferable.
Utilization of existing infrastructure: Ability to recharge and recover with existing
infrastructure or through planned improvements already anticipated in the capital
improvement program (CIP). Alternatives that maximize the use of existing infrastructure
are more preferable.
Concentrate quantity: Volume of membrane treatment process concentrate requiring
additional treatment to maximize water recovery. Alternatives that generate the least
amount of concentrate are preferable.
Step 2 – Prioritize and Weight Criteria
The next step of the matrix evaluation was to prioritize the decision criteria. The weighting, or
assigning of relative importance between criteria, was conducted separately by the consultant
team and Tucson Water staff members that are involved in the project. The weighting was
accomplished by asking each team member to assign a weight to each criterion. Figure 5-20
illustrates the resulting decision criteria priorities, or weights, calculated by averaging the
weights for each group. The consultant team provided weights prior to Tucson Water staff and
only considered ten of the criteria. Tucson Water staff provided weights for an additional three
criteria that they felt were also important to the decision. The highest weighted decision criteria
were public perception and cost for both the consultant team and Tucson Water staff.
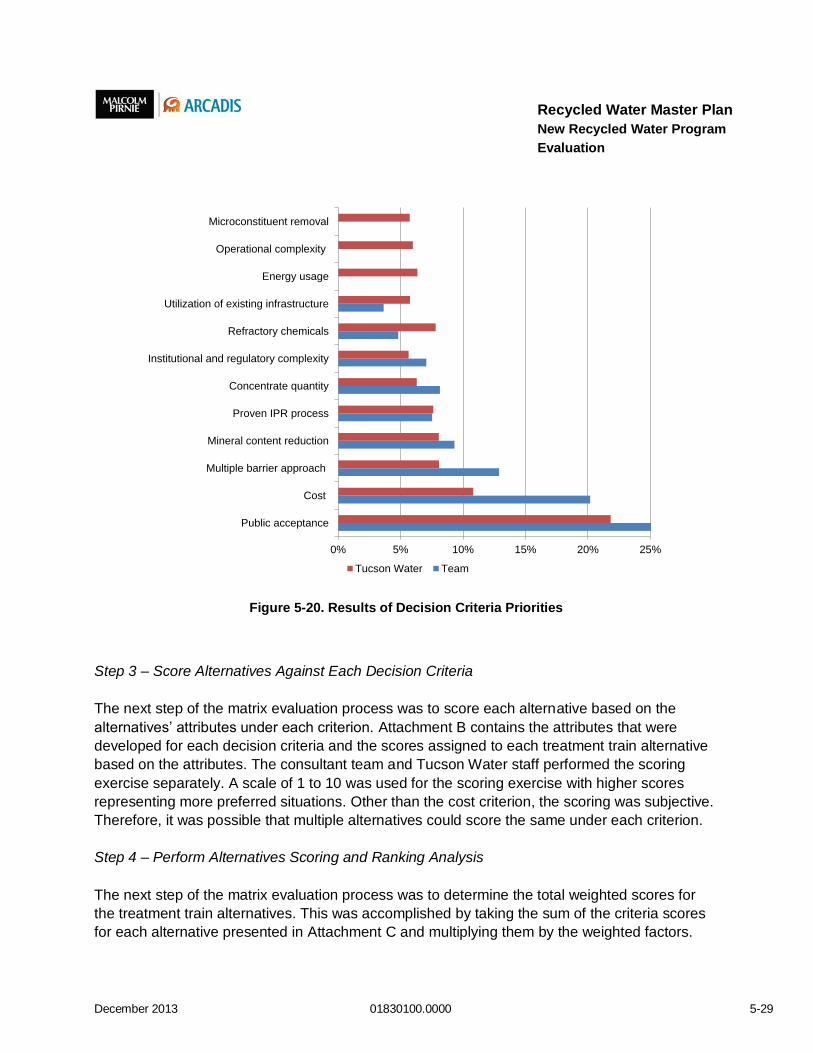
December 2013 01830100.0000 5-29
Recycled Water Master Plan
New Recycled Water Program
Evaluation
Figure 5-20. Results of Decision Criteria Priorities
Step 3 – Score Alternatives Against Each Decision Criteria
The next step of the matrix evaluation process was to score each alternative based on the
alternatives’ attributes under each criterion. Attachment B contains the attributes that were
developed for each decision criteria and the scores assigned to each treatment train alternative
based on the attributes. The consultant team and Tucson Water staff performed the scoring
exercise separately. A scale of 1 to 10 was used for the scoring exercise with higher scores
representing more preferred situations. Other than the cost criterion, the scoring was subjective.
Therefore, it was possible that multiple alternatives could score the same under each criterion.
Step 4 – Perform Alternatives Scoring and Ranking Analysis
The next step of the matrix evaluation process was to determine the total weighted scores for
the treatment train alternatives. This was accomplished by taking the sum of the criteria scores
for each alternative presented in Attachment C and multiplying them by the weighted factors.
0% 5% 10% 15% 20% 25%
Public acceptance
Cost
Multiple barrier approach
Mineral content reduction
Proven IPR process
Concentrate quantity
Institutional and regulatory complexity
Refractory chemicals
Utilization of existing infrastructure
Energy usage
Operational complexity
Microconstituent removal
Tucson Water Team

December 2013 01830100.0000 5-30
Recycled Water Master Plan
New Recycled Water Program
Evaluation
The total weighted scores for the alternatives were determined using the Criterium DecisionPlus
software which is a useful tool for facilitating matrix evaluations. The Criterium DecisionPlus
results from the scoring and ranking exercises are presented in Figure 5-21 and Figure 5-22 for
the consultant team and Tucson Water staff, respectively. Table 5-9 provides a comparison of
the scoring and ranking results.
Each team selected four treatment trains as part of their five top ranked alternatives: North
CAVSARP -1, North CAVSARP-2, North CAVSARP-3 and North CAVSARP-4. The top ranking
alternatives included both CAVSARP and North CAVSARP alternatives, but the majority of the
top alternatives were North CAVSARP alternatives. The top five ranking alternatives include
both pre-recharge and post-recovery treatment, but the majority of the alternatives were pre-
recharge treatment. All top alternatives include full-stream treatment for TDS. Tucson Water’s
strong preference for North CAVSARP alternatives was based on recharging recycled water
separately from CAP water. They felt that mixing recycled water and CAP water could result in
issues related to public concerns, impacts on the facility APP permit, and potential impacts on
agreements with other CAVSARP partners that utilize the facility.
The criteria scoring and ranking analysis resulted in the following key conclusions:
There is a preference for full-stream reverse osmosis or nanofiltration treatment as they
provide the most opportunity to begin addressing basin salinity issues.
There is a strong preference for North CAVSARP over CAVSARP for the recharge
location.
There is a strong preference for pre-recharge treatment as opposed to post-recovery
treatment, due primarily to potential public concerns with recharging recycled water
without first further treating it.
CAVSARP alternatives were less preferable because of mixing of CAP water and
recycled water during recharge.
Step 5 – Select Preferred Treatment Trains for Further Analysis
Based on the results of the scoring and ranking analysis, four treatment train alternatives were
identified as the most preferred: North CAVSARP-1 or 2 (depending on NF or RO), North
CAVSARP-3, and North CAVSARP-4. The advantages and disadvantages of the four preferred
treatment train alternatives are summarized in Table 5-10.

December 2013 01830100.0000 5-31
Recycled Water Master Plan
New Recycled Water Program
Evaluation
Figure 5-21. Scoring and Ranking Results for Consultant Team
Public Acceptance

December 2013 01830100.0000 5-32
Recycled Water Master Plan
New Recycled Water Program
Evaluation
Figure 5-22. Scoring and Ranking Results for Tucson Water Staff
Table 5-9. Comparison of Scoring and Ranking Results
Team Rank Alternatives North CAVSARP
Recharge Location Full Stream
TDS Treatment Pre-Recharge
Treatment
Consultant 1 North CAVSARP-3
Consultant 2 North CAVSARP-2
Consultant 3 North CAVSARP-1
Consultant 4 CAVSARP-2
Consultant 5 North CAVSARP-4
Tucson Water 1 North CAVSARP-2
Tucson Water 2 North CAVSARP-1
Tucson Water 3 CAVSARP-1
Tucson Water 4 CAVSARP-2
Tucson Water 5 North CAVSARP-4
Public Acceptance

December 2013 01830100.0000 5-33
Recycled Water Master Plan
New Recycled Water Program
Evaluation
Table 5-10. Comparison of Preferred Treatment Train Alternatives
Alternative Advantages Disadvantages
North CAVSARP-1 High acceptance as similar process to Orange County.
Similar to proven gold standard in Orange County (NF vs. RO).
Exceeds TDS goals and improves salinity at CAVSARP.
High cost alternative, second only to CAVSARP-2.
Less energy intensive than North CAVSARP-2 (Orange County Model) due to NF vs RO.
Highest production of treatment concentrate.
Microbial activity in SAT is not supported after MF/RO/AOP treatment; therefore, SAT will only provide pathogen and particulates removal.
North CAVSARP-2 High acceptance as proven gold standard in Orange County.
Proven gold standard in Orange County.
Exceeds TDS goals and improves salinity at CAVSARP.
Highest cost alternative.
Most energy intensive North CAVSARP alternative.
Highest production of treatment concentrate.
Microbial activity in SAT is not supported after MF/RO/AOP treatment; therefore, SAT will only provide pathogen and particulates removal.
North CAVSARP-3 Utilizes post-recovery treatment to reduce treatment capacity requirements and significantly reduce cost.
Relies on a natural process (SAT) for constituent removal.
Lower production of brine due to post-recovery treatment.
UV/AOP may result in byproduct formation (formaldehyde) in the treated water, which would be routed into the distribution system.
Potential for lower public acceptance due to complete reliance on post-recovery treatment.
North CAVSARP-4 Utilizes post-recovery treatment to reduce treatment capacity requirements and significantly reduce cost.
Relies on a natural process (SAT) for constituent removal.
Lower production of brine due to post-recovery treatment.
Potential for lower public acceptance due to complete reliance on post-recovery treatment.
The evaluation of treatment trains was presented to and discussed with the NWRI independent
advisory panel. The panel was in general agreement with the matrix evaluation results and
recommended that subsequent planning efforts should be conducted with the following changes
to the selected treatment train alternatives (NWRI, May 2012):

December 2013 01830100.0000 5-34
Recycled Water Master Plan
New Recycled Water Program
Evaluation
North CAVSARP-1 and 2
Use NF instead of RO for membrane treatment, because full-stream RO treatment in
conjunction with SAT may not be required for salt control. In IPR projects, alternative
membrane treatment systems can provide a similar level of public health protection as
conventional RO membranes. Membranes also provide the ability for proactive salinity
management that targets the sources of TDS while preserving groundwater supplies that
exhibit lower TDS levels. NF has lower energy requirements than RO.
Considering the NWRI panel’s feedback on membrane treatment, North CAVSARP-2 is
no longer a preferred treatment alternative.
North CAVSARP-3
Use NF instead of RO for membrane treatment, because full-stream RO treatment after
SAT may not be required for salt control.
Return the concentrate from the 2-stage EDR to the head of the plant, upstream of NF,
to avoid returning high concentrations of organic carbon and trace organic chemicals
immediately upstream of the UV/AOP.
North CAVSARP-4
Eliminate ozone prior to SAT. Using ozone prior to SAT may not be needed and is
usually beneficial when retention times of SAT are short (days or hours vs. weeks).
Use NF instead of RO for membrane treatment, because full-stream RO treatment after
SAT may not be required for salt control.
Return the flow from concentrate treatment (downstream of cartridge filters) to the head
of the plant, upstream of NF. The concentrate stream will likely contain persistent (after
SAT) and uncharged compounds, which could challenge the proposed treatment
sequence.
The NWRI panel also provided comments on the concentrate treatment trains. There are
challenges associated with all of the concentrate treatment trains that can be evaluated during
pilot testing. No changes to the concentrate treatment trains were made. Based on input from
the NWRI, treatment trains North CAVSARP-1, 3 and 4 will be further analyzed with overall
recycled water program alternatives in Chapter 6.

December 2013 01830100.0000 6-1
Recycled Water Master Plan
New Recycled Water Program
Evaluation
6 Evaluation of Recycled Water Program Alternatives
The preferred treatment train alternatives (North CAVSARP-1, 3, and 4) were combined with the
recycled water program components identified in Chapters 4 and 5 of this technical memorandum
to develop overall recycled water program alternatives for additional evaluation. Facility and
treatment concepts were refined and cost opinions were further developed. This stage of
evaluation included a detailed review by recycled water treatment experts on the sizing and
operational information for each advanced water treatment process. The basis for conceptual cost
opinions is the same as discussed in Chapter 5 (Section 5.8.3); however, some of the conceptual
unit costs were refined based on recent construction bid information and water industry cost
guidance, such as the EPA 2003 Drinking Water Infrastructure Needs Survey. Finally, the
alternative that does not include advanced water treatment (non-IPR alternative) was brought into
the evaluations.
Based on the identification of recycled water program concepts and the evaluation of advanced
treatment process alternatives, the recycled water program alternatives identified for evaluation
include the following:
North CAVSARP-1
North CAVSARP-3
North CAVSARP-4
SE Tucson – No Advanced Water Treatment
6.1 Concept Design Flows and Design Criteria
The evaluation of overall recycled water program alternatives were based on the same concept
design flows used for evaluation of the treatment train alternatives in Chapter 5 of this technical
memorandum. Table 6-1 summarizes the concept design flows that were used to size overall
recycled water program facility and treatment processes.
Table 6-1. Summary of Design Flows
Infrastructure 2020 2030 2050
Low Range (MGD)
High Range (MGD)
Low Range (MGD)
High Range (MGD)
Low Range (MGD)
Pre-recharge Treatment Equipment
19 32 26 41 N/A
Post-recovery Treatment Equipment
7 19 13 26 N/A
Conveyance (Piping and Pump Stations)
N/A 32

December 2013 01830100.0000 6-2
Recycled Water Master Plan
New Recycled Water Program
Evaluation
Table 6-1 has an additional concept design flow for conveyance facilities. Permitting and
construction for conveyance facilities from the metropolitan area to the CAVSARP or SE Tucson
areas would be difficult and costly. It is prudent to oversize the conveyance so that future
replacement and or new construction are avoided. Thus, the conveyance facilities were sized
based on the 2050 maximum month, low range projection of 32 MGD.
The conceptual design criteria to size treatment process trains and operational requirements are
summarized in Table 6-2. Attachment C includes additional details on the conceptual design
criteria utilized in the development of conceptual cost opinions for recycled water program
alternatives.

December 2013 01830100.0000 6-3
Recycled Water Master Plan
New Recycled Water Program
Evaluation
Table 6-2. Summary of Treatment and Facility Design Criteria for Recycled Water Programs
Unit Process Design Criteria
Microfiltration Flux Rate 25 gfd
Recovery 90%
Operating Pressure 10-20 psi
Nominal Pore Size 0.04 micron
Nanofiltration Flux Rate 10.5 gfd
Recovery 80%
Vessel Diameter 8 inches
Operating Pressure 125-200 psi
UV-AOP Target Contaminant (Photolysis) NDMA
Log Reduction of NDMA 1.2
Target Contaminant (Oxidation) 1,4-dioxane
Log Reduction of 1,4-dioxane 0.5
Lamp Fouling Factor 0.9 to 1
UVT 95%
Peroxide dose 4 mg/L
Ozone Target Ozone: TOC Ratio (mg O3: mg TOC) 0.5
Contact Time 10 minutes
Soil Aquifer Treatment Infiltration Rate 1.5 ft/day
GAC (Hydrogen Peroxide Quenching)
Contactor Type Pressure Contactors (ASME Rated)
Contactor Configuration Parallel
Contactor Diameter 12 ft
Carbon Type Catalytic Coconut
Empty Bed Contact Time 6 minutes
Liquid Loading Rate 9 gpm/sf
GAC Changeout Frequency 2 years
GAC (Adsorption)
Contactor Type Pressure Contactors (ASME Rated)
Contactor Configuration Parallel
Contactor Diameter 12 ft
Carbon Type Coconut Shell
Empty Bed Contact Time 30 minutes
Liquid Loading Rate 4 gpm/sf
GAC Changeout Frequency 0.5 years
BAC Contactor Type Pressure Contactors (ASME Rated)
Contactor Configuration Series
Contactor Diameter 12 ft
Carbon Type Coconut Shell
Empty Bed Contact Time 20 minutes
Liquid Loading Rate 4 gpm/sf
GAC Changeout Frequency 4 years
Ion Exchange Recovery 98%
Electrodialysis Reversal Recovery / Stage 50%
Salt Removal 75%
Overall Water Recovery 75%
Evaporation Ponds Pan Evaporation Rate 107 inches
Average Precipitation 11.1 inches
Pipelines Maximum Velocity 5 feet per second

December 2013 01830100.0000 6-4
Recycled Water Master Plan
New Recycled Water Program
Evaluation
6.2 Facility Requirements for Recycled Water Program Alternatives
Facility concepts were also developed for the overall recycled water program components of
each alternative. The conveyance route from the metropolitan area facilities to CAVSARP is
approximately 25 miles with a total lift of 100 feet. Pumping is assumed to take place at the
origin of the pipeline, which is assumed to be at the Water Reclamation Campus where Tucson
Water is to receive its recycled water based on current agreements. The conveyance route for
the SE Tucson alternative is approximately 35 miles long and would require three booster
stations with a total lift of 1,200 feet. In addition to source water conveyance and AWT,
additional transmission infrastructure is also required for the North CAVSARP alternatives to
convey recovered water from North CAVSARP to the existing CAVSARP reservoir and booster
pump station.
Table 6-3 summarizes the basis of facility sizing and facility requirements for each major
component of the recycled water program alternatives.

December 2013 01830100.0000 6-5
Recycled Water Master Plan
New Recycled Water Program
Evaluation
Table 6-3. Summary of Recycled Water Program Alternative Facility Components
Component North CAVSARP-1
North CAVSARP-3
North CAVSARP-4
SE Tucson
2020 Flow Basis 7 MGD (Average) and 19 MGD (Peak)
2030 Flow Basis 13 MGD (Average) and 26 MGD (Peak)
2050 Flow Basis 32 MGD (Peak) for sizing of recycled water conveyance facilities
Recycled Water Source Water Campus
Recharge Location North CAVSARP SE Tucson
Recycled Water Conveyance
Pipeline 25 miles of 48-inch DIP Pipe 35 miles of 48-inch DIP Pipe
Pumping 32 MGD Pump Station (100 ft TDH) 3-32 MGD Pump Stations (1,200 TDH)
Advanced Treatment Location Pre-Recharge Post-Recovery Post-Recovery None
Mainstream Treatment Train MF + NF + UV-AOP + Recharge
Recharge/SAT + NF + UV-AOP + GAC for H2O2
quenching
Recharge/SAT + NF
None
Mainstream Treatment Sizing
Flow Basis (Year) 2020 2030 2020 2030 2020 2030 2020 2030
MF (MGD) 22.1 30.3
NF (MGD) 17.7 24.2 6.6 12.2 6.6 12.2
UV-AOP (MGD) 19 26 7 13 7 13
GAG for H2O2 quenching (MGD) 7 13
SAT Recharge Acreage (acres) 76 104 112 153 112 153 86 117
Concentrate Treatment Train Ozone + BAC + IX +2-Stage
EDR
2-Stage EDR 2-Stage EDR + GAC
None
Concentrate Treatment Sizing
Flow Basis (Year) 2020 2030 2020 2030 2020 2030 2020 2030
Ozone (MGD) 4 5.2
BAC (MGD) 4 5.2
GAC and Cartridge Filtration (MGD) 1.6 3.1
IX (MGD) 4.4 6.1
EDR (MGD) 4.3 5.9 1.6 3.1 1.6 3.1
Solids Handling 2.5 3.4
Evaporation Pond Acreage (acres) 273 373 109 204 109 204
Recovered Water Transmission Piping 4 miles of 48-inch HDPE Pipe None

December 2013 01830100.0000 6-6
Recycled Water Master Plan
New Recycled Water Program
Evaluation
6.3 Conceptual Cost Opinions for Recycled Water Program Alternatives
Table 6-4 and Table 6-5 provide a summary of the conceptual capital and annual O&M cost
opinions for the overall recycled water program alternatives, respectively. Attachment C
provides the detailed cost evaluations.
In addition to the costs summarized in Tables 6-4 and 6-5, the CAVSARP and North CAVSARP
alternatives could also include potentially related costs of a SAVSARP expansion for the CAP
water that would be displaced by recharge of recycled water at the CAVSARP and North
CAVSARP facilities. The need for a SAVSARP expansion is unknown at this time and will
depend on the actual amounts of water recharged at CAVSARP due to actual participation of all
facility partners, actual facility operational capabilities, etc., which will only be determined after
the facilities have been operated for some time. Tables 6-4 and 6-5 do not include the potential
related costs of a SAVSARP expansion, which are conceptually estimated at $27 million capital
for 40 acres of new recharge basins (to recharge up to 10 MGD) and 3.9 miles of 60-inch
pipeline from the CAP Canal turnout to the recharge basins. The potential additional costs also
include an estimated $1.3 million in annual O&M to recharge an average of 7 MGD.

December 2013 01830100.0000 6-7
Recycled Water Master Plan
New Recycled Water Program
Evaluation
Table 6-4. Conceptual Capital Cost Opinions for Recycled Water Program Alternatives
Component North CAVSARP-1
North CAVSARP-3
North CAVSARP-4
SE Tucson
Flow Basis (Year) 2020 2030 2020 2030 2020 2030 2020 2030
CAPITAL COSTS ($ million)
Recycled Water Conveyance
Pipeline $98.4 $98.4 $98.4 $141
Pumping $10.9 $10.9 $10.9 $36.6
Mainstream Treatment
MF $44.5 $61.0
NF $50.9 $69.0 $26.4 $47.7 $26.4 $47.7
UV-AOP $11.7 $16.0 $5.3 $9.9
GAC (for H2O2 quenching) $3.5 $5.3
SAT Recharge $6.1 $8.3 $9.0 $12.3 $9.0 $12.3 $13.0 $17.7
Concentrate Treatment
Ozone $12.5 $16.3
BAC $5.6 $6.9
GAC and Cartridge Filtration $4.2 $7.1
IX $10.8 $13.6
EDR $13.4 $18.7 $10.0 $21.2 $10.0 $21.2
Solids Handling $2.9 $3.9
Evaporation Ponds $61.2 $83.1 $25.7 $46.3 $25.7 $46.3
Recovered Water Piping $13.7 $13.7
TOTAL CAPITAL $329 $406 $203 $266 $198 $256 $191 $196

December 2013 01830100.0000 6-8
Recycled Water Master Plan
New Recycled Water Program
Evaluation
Table 6-5. Conceptual Annual O&M Cost Opinions for Recycled Water Program Alternatives
Component North CAVSARP-1
North CAVSARP-3
North CAVSARP-4
SE Tucson
Flow Basis (Year) 2020 2030 2020 2030 2020 2030 2020 2030
ANNUAL O&M COSTS ($ million)
Recycled Water Conveyance
Piping and Pumping $0.2 $0.3 $0.2 $0.3 $0.2 $0.3 $1.1 $1.1
Mainstream Treatment
MF $0.6 $1.1
NF $1.7 $3.1 $1.7 $3.1 $1.7 $3.1
UV-AOP $1.0 $1.5 $0.4 $0.8
GAC (for H2O2 quenching) $0.2 $0.3
SAT Recharge $0.02 $0.03 $0.03 $0.04 $0.03 $0.04 $0.04 $0.05
Concentrate Treatment
Ozone $0.3 $0.8
BAC $0.2 $0.2
GAC and Cartridge Filtration $0.7 $1.3
IX $0.7 $1.3
EDR $0.3 $0.7 $0.4 $0.7 $0.4 $0.7
Solids Handling $0.06 $0.08
Evaporation Ponds $1.6 $2.2 $0.5 $1.0 $0.5 $1.0
Recovered Water Piping $0.02 $0.02
TOTAL ANNUAL O&M $6.7 $11.1 $3.4 $6.1 $3.6 $6.4 $1.1 $1.2
The conceptual cost opinions of recycled water program alternatives provide the following key
findings:
The North CAVSARP-1 alternative with pre-recharge treatment and full flow membrane
treatment has the highest estimated capital and O&M costs.
The North CAVSARP-3 and 4 alternatives with post-recovery treatment have similar
estimated capital and O&M costs.
The costs for the SE Tucson alternative are substantially less than alternatives with
advanced treatment. Although it would contribute to long-term storage credits, the SE

December 2013 01830100.0000 6-9
Recycled Water Master Plan
New Recycled Water Program
Evaluation
Tucson alternative would not provide water that ensures future water supply reliability for
the Tucson community.

December 2013 01830100.0000 7-1
Recycled Water Master Plan
New Recycled Water Program
Evaluation
7 Conclusions and Recommendations
The work to identify and evaluate recycled water programs found that Tucson Water has
significant unutilized recycled water supplies currently which will increase as future infill occurs
within the Tucson Water committed service area. The unutilized recycled water could be put to
beneficial use by replenishing the groundwater and, after additional advanced treatment, using it
to supplement future drinking water supplies.
The evaluations found that recharge of reclaimed water with no additional treatment at a location
that is distant from, or hydrologically separated from, Tucson Water’s groundwater basins would
have costs substantially less than IPR projects. However, this practice would not fulfill Tucson
Water’s goals and objectives for use of its valuable recycled water resource to assure future water
reliability for the community.
The preferred recycled water program alternatives that include IPR are North CAVSARP-1, 3, and
4, for the following reasons:
Inclusion of RO or NF is highly valuable to meet water quality goals for IPR, especially where groundwater basin salinity control is an important goal
The North CAVSARP recharge location allows recycled water to be efficiently recharged separately from CAP water, allowing greater control in recharge, monitoring, and recovery of recycled water and minimizing permitting impacts to the existing CAVSARP CAP water recharge operations.
From a cost and sustainability perspective, the North CAVSARP-3 and 4 alternatives (post-recovery advanced water treatment) are preferred. The smaller capacity treatment facilities and use of natural SAT treatment leads to lower overall cost and lower energy requirements.
The North CAVSARP-1 alternative is still considered competitive and may offer certain benefit. As such, it should continue to be considered in follow-up studies.
Based on the evaluation of recycled water program alternatives, it is recommended that the three
North CAVSARP alternatives be taken to the next stages of development of a Tucson Water
recycled water program for indirect potable reuse. The preferred treatment process trains should
be taken to demonstration-scale testing.

December 2013 01830100.0000 8-1
Recycled Water Master Plan
New Recycled Water Program
Evaluation
8 References
California Department of Public Health. Title 22 California Code of Regulations, Div. 4
Environmental Health, Ch. 3 Recycling Criteria, Article 1 Definitions.
National Water Research Institute. Draft Final Report of the May 12-13, 2011, Meeting of the
Independent Advisory Panel for the Tucson Water Recycled Water Master Plan.
July 2011.
National Water Research Institute. Draft Final Report of the March 7-8, 2012, Meeting of the
Independent Advisory Panel for the Tucson Water Recycled Water Master Plan.
May 2012.
National Water Research Institute. Draft Final Report of the April 24, 2013, Meeting of the
Independent Advisory Panel for the Tucson Water Recycled Water Master Plan.
April 2013.
Tucson Water. Regional Effluent Utilization Plan Phase B. Malcolm Pirnie, Inc. June 1995.
Tucson Water. 2008 Update to Water Plan 2000-2050. 2008.
Tucson Water. Water Plan: 2000-2050. November 2004.

ATTACHMENT A
DESIGN CRITERIA AND COST ESTIMATES FOR THE TREATMENT TRAIN
ALTERNATIVES

December 2013 01830100.0000 Page 1 of 1
12/20/2013FINAL
CAVSARP 1 CAVSARP 2 CAVSARP 3 CAVSARP 4 CAVSARP 5 N CAVSARP 1 N CAVSARP 2 N CAVSARP 3 N CAVSARP 4 N CAVSARP 5
Reclaimed Transmission System (Pumping & Piping)Microfiltration 65,923,000$ 65,923,000$ 65,923,000$ 62,848,000$ 62,848,000$ 65,923,000$ 65,923,000$ Nanofiltration 73,122,000$ 73,122,000$ Reverse Osmosis 73,122,000$ 73,122,000$ 35,705,000$ 35,705,000$ 73,122,000$ 30,799,000$ 30,799,000$ 14,332,000$ Soil Aquifer Treatment 4,898,000$ 4,898,000$ 6,903,000$ 6,903,000$ 6,903,000$ CAP Recharge 15,988,000$ 15,988,000$ 15,988,000$ 15,988,000$ 15,988,000$ UV-AOP 7,616,000$ 7,616,000$ 14,351,000$ 7,616,000$ 7,616,000$ 3,492,000$ 6,953,000$ Ozone 14,095,000$ 21,144,000$ 21,144,000$ GAC (includes Cartridge Filtration) 3,474,000$ 2,633,000$ Concentrate Management 102,032,000$ 102,032,000$ 102,032,000$ 48,611,000$ 43,325,000$ 102,032,000$ 102,032,000$ 35,179,000$ 38,227,000$ 19,247,000$
Ozone 17,621,000$ 17,621,000$ 17,621,000$ 12,335,000$ 7,049,000$ 17,621,000$ 17,621,000$ BAC 5,528,000$ 5,528,000$ 5,528,000$ 3,048,000$ 3,048,000$ 5,528,000$ 5,528,000$ GAC and Cartridge Filtration 3,048,000$ 2,221,000$ IX 5,801,000$ 5,801,000$ 5,801,000$ 2,626,000$ 2,626,000$ 5,801,000$ 5,801,000$ EDR 12,682,000$ 12,682,000$ 12,682,000$ 7,800,000$ 7,800,000$ 12,682,000$ 12,682,000$ 9,990,000$ 9,990,000$ 4,487,000$ Evaporation Ponds 60,400,000$ 60,400,000$ 60,400,000$ 22,802,000$ 22,802,000$ 60,400,000$ 60,400,000$ 25,189,000$ 25,189,000$ 12,539,000$
Solids Handling 4,710,000$ 4,710,000$ 4,710,000$ 4,710,000$ 4,710,000$ 4,710,000$ 4,710,000$ -$ -$ -$ Lamella Settlers 2,175,000$ 2,175,000$ 2,175,000$ 2,175,000$ 2,175,000$ 2,175,000$ 2,175,000$ Centrifuge 2,535,000$ 2,535,000$ 2,535,000$ 2,535,000$ 2,535,000$ 2,535,000$ 2,535,000$
Recovery Wells -$ -$ -$ -$ -$ -$ -$ -$ -$ -$ Recycled Water Transmission System (Pu In Progress In Progress In Progress In Progress In Progress In Progress In Progress In Progress In Progress In Progress
TOTAL CAPITAL COST 269,391,000$ 269,391,000$ 261,775,000$ 182,213,000$ 176,671,000$ 258,301,000$ 258,301,000$ 79,847,000$ 97,073,000$ 71,212,000$
Transmission System (Pumping & Piping)Microfiltration 926,000$ 926,000$ 926,000$ 890,000$ 890,000$ 926,000$ 926,000$ Nanofiltration 2,328,000$ 2,328,000$ Reverse Osmosis 2,744,000$ 2,744,000$ 1,400,000$ 1,400,000$ 2,744,000$ 3,346,000$ 3,346,000$ 1,489,000$ Soil Aquifer Treatment 15,000$ 15,000$ 21,000$ 21,000$ 21,000$ Soil Aquifer Treatment 48,000$ 48,000$ 48,000$ 48,000$ 48,000$ UV-AOP 1,024,000$ 1,024,000$ 1,745,000$ 1,024,000$ 1,024,000$ 410,000$ 378,000$ Ozone 341,000$ 468,000$ 468,000$ GAC (includes Cartridge Filtration) 151,100$ 99,100$ Concentrate Management 3,206,700$ 3,206,700$ 3,206,700$ 1,408,300$ 1,377,300$ 3,206,700$ 3,206,700$ 815,000$ 1,258,100$ 655,100$
Ozone 341,000$ 341,000$ 341,000$ 202,000$ 171,000$ 341,000$ 341,000$ BAC 152,700$ 152,700$ 152,700$ 72,300$ 72,300$ 152,700$ 152,700$ GAC and Cartridge Filtration 443,100$ 231,100$ IX 831,000$ 831,000$ 831,000$ 535,000$ 535,000$ 831,000$ 831,000$ EDR 289,000$ 289,000$ 289,000$ 119,000$ 119,000$ 289,000$ 289,000$ 280,000$ 280,000$ 167,000$ Evaporation Ponds 1,593,000$ 1,593,000$ 1,593,000$ 480,000$ 480,000$ 1,593,000$ 1,593,000$ 535,000$ 535,000$ 257,000$
Solids Handling 195,000$ 195,000$ 195,000$ 195,000$ 195,000$ 195,000$ 195,000$ -$ -$ -$ Lamella Settlers 43,000$ 43,000$ 43,000$ 43,000$ 43,000$ 43,000$ 43,000$ Centrifuge 152,000$ 152,000$ 152,000$ 152,000$ 152,000$ 152,000$ 152,000$
Recovery Wells 9,000$ 9,000$ 9,000$ 9,000$ 9,000$ 9,000$ 9,000$ 9,000$ 9,000$ 9,000$ Recycled Water Transmission System (Pu In Progress In Progress In Progress In Progress In Progress In Progress In Progress In Progress In Progress In Progress
TOTAL O&M COST 7,736,700$ 8,152,700$ 7,128,700$ 5,695,300$ 4,260,300$ 7,703,700$ 8,119,700$ 4,752,100$ 5,102,100$ 3,119,200$
CAPITAL COST
O&M COST
Recycled Water Master Plan Treatment Train Summary

ATTACHMENT B
CRITERIUM DECISION PLUS ATTRIBUTES AND SCORING RESULTS

Alternative Decision Criteria Attributes
December 2013 01830100.0000 Page 1 of 3
Rank Criteria
Consultant Team
Weight
Tucson Water Weight CAVSARP-1 CAVSARP-2 CAVSARP-3 CAVSARP-4 CAVSARP-5
1 Public Acceptance 24 22 High acceptance as simliar process to Orange County.
High acceptance as proven gold standard in Orange County.
Demonstrated technology at Scottsdale Water Campus.
Lower public acceptance due to partial stream RO.
Lower public acceptance due to partial stream RO and ozone instead of UV-AOP.
2 Cost 19 11 High cost alternative, second only to CAVSARP-2.
Highest cost alternative. Less costly than Orange County model.
Less costly than Orange County model.
Lowest cost CAVSARP alternative.
3 Multiple Barrier Approach 12 8 Provides most complete multi-barrier approach. Removes and destroys constituents prior to recharge.
Provides most complete multi-barrier approach. Removes and destroys constituents prior to recharge.
Removes constituents prior to recharge.
Removes constituents prior to recharge.
Relies on natural process (SAT) as a primary barrier.
4 TDS Removal 9 8 Exceeds TDS goals and improves salinity at CAVSARP.
Exceeds TDS goals and improves salinity at CAVSARP.
Exceeds TDS goals and improves salinity at CAVSARP.
Provides flexibility in meeting TDS goals and allows CAVSARP salinity to remain (non-degradation).
Provides flexibility in meeting TDS goals and allows CAVSARP salinity to remain (non-degradation).
5 Proven IPR Process 7 8 Similar to proven gold standard in Orange County (NF vs. RO).
Proven gold standard in Orange County.
Demonstrated technology at Scottsdale Water Campus.
Proven treatment technologies in conjunction with SAT.
Proven treatment technologies in conjunction with SAT.
6 Refractory Chemicals 4 8 UV-AOP provides barrier for refractory chemicals.
UV-AOP provides barrier for refractory chemicals.
No barrier for refractory chemicals.
UV-AOP provides barrier for refractory chemicals.
No barrier for refractory chemicals.
7 Microconstituent Removal
0 6 Provides the most barriers for microconstiuents (NF, UV-AOP, SAT).
Provides the most barriers for microconstiuents (RO, UV-AOP, SAT).
Multiple barriers for microconstiuents (RO, SAT).
Multiple barriers for microconstiuents (UV-AOP, SAT).
Single barrier for microconstiuents (SAT).
8 Energy Usage 0 6 Less energy intensive than CAVSARP-2 (Orange County Model) due to NF vs RO.
Most energy intensive CAVSARP alternative.
Less energy intensive than Orange County Model.
Less energy intensive than Orange County Model.
Least energy intensive CAVSARP alternative.
9 Institutional and Regulatory Complexity
7 6 Potentially requires an APP for CAVSARP
Potentially requires an APP for CAVSARP
Potentially requires an APP for CAVSARP
Potentially requires an APP for CAVSARP
Potentially requires an APP for CAVSARP
10 Operational Complexity 0 6 Utilizes several different unit processes.
Utilizes several different unit processes.
Utilizes the least number of unit processes.
Utilizes several different unit processes.
Operationally more complex due to ozone.
11 Utilization of Existing Infrastructure
3 6 Uses existing CAVSARP basins and plans already exist for expansion of SAVSARP.
Uses existing CAVSARP basins and plans already exist for expansion of SAVSARP.
Uses existing CAVSARP basins and plans already exist for expansion of SAVSARP.
Uses existing CAVSARP basins and plans already exist for expansion of SAVSARP.
Uses existing CAVSARP basins and plans already exist for expansion of SAVSARP.
12 Brine Quantity 8 6 Highest production of brine. Highest production of brine. Highest production of brine. Lower production of brine due to partial stream RO.
Lower production of brine due to partial stream RO.

Alternative Decision Criteria Attributes
December 2013 01830100.0000 Page 2 of 3
Rank Criteria
Consultant Team
Weight
Tucson Water Weight
1 Public Acceptance 24 22
2 Cost 19 11
3 Multiple Barrier Approach 12 8
4 TDS Removal 9 8
5 Proven IPR Process 7 8
6 Refractory Chemicals 4 8
7 Microconstituent Removal
0 6
8 Energy Usage 0 6
9 Institutional and Regulatory Complexity
7 6
10 Operational Complexity 0 6
11 Utilization of Existing Infrastructure
3 6
12 Brine Quantity 8 6
North CAVSARP-1 North CAVSARP-2 North CAVSARP-3 North CAVSARP-4 North CAVSARP-5High acceptance as simliar process to Orange County.
High acceptance as proven gold standard in Orange County.
Lower public acceptance due to complete reliance on post-recovery treatment.
Lower public acceptance due to complete reliance on post-recovery treatment.
Lower public acceptance due to most post-recovery treatment and partial streat RO.
High cost North CAVSARP alternative, second only to North CAVSARP-2.
Highest cost alternative. Less costly than Orange County model. Utilizes post-recovery treatment to reduce treatment capacity requirements and significantly reduce cost.
Less costly than Orange County model. Utilizes post-recovery treatment to reduce treatment capacity requirements and significantly reduce cost.
Lowest cost alternative. Utilizes post-recovery treatment to reduce treatment capacity requirements and significantly reduce cost.
Provides most complete multi-barrier approach. Removes and destroys constituents prior to recharge.
Provides most complete multi-barrier approach. Removes and destroys constituents prior to recharge.
Relies on natural process (SAT) as a primary barrier. Multiple barriers for post-recovery treatment (blending, RO, UV-AOP).
Relies on natural process (SAT) as a primary barrier. Multiple barriers for post-recovery treatment (blending, RO, GAC on brine).
Relies on natural process (SAT) as a primary barrier. Multiple barriers for post-recovery treatment (blending, RO or UV-AOP, GAC on brine).
Exceeds TDS goals and improves salinity at CAVSARP.
Exceeds TDS goals and improves salinity at CAVSARP.
Exceeds TDS goals with post-recovery treatment.
Exceeds TDS goals with post-recovery treatment.
Provides flexibility in meeting TDS goals.
Similar to proven gold standard in Orange County (NF vs. RO).
Proven gold standard in Orange County.
Proven treatment technologies, but after SAT.
Proven treatment technologies, but after SAT.
Proven treatment technologies, but after SAT. Does employ ozone pre-recharge.
UV-AOP provides barrier for refractory chemicals.
UV-AOP provides barrier for refractory chemicals.
UV-AOP provides barrier for refractory chemicals.
No barrier for refractory chemicals.
UV-AOP and GAC provide barrier for refractory chemicals.
Provides the most barriers for microconstiuents (NF, UV-AOP, SAT).
Provides the most barriers for microconstiuents (RO, UV-AOP, SAT).
Relies on SAT for removal during recharge, blending, and dual barrier post-recovery treatment (RO, UV-AOP).
Relies on SAT for removal during recharge, blending, and single barrier post-recovery treatment (RO and GAC on brine recycle).
Relies on SAT (enhanced with ozone) for removal during recharge, blending, and single barrier post-recovery treatment (RO or UV-AOP and GAC on brine recycle).
Less energy intensive than North CAVSARP-2 (Orange County Model) due to NF vs RO.
Most energy intensive North CAVSARP alternative.
Lower treatment capacity (therefore energy use) than CAVSARP alternatives.
Lower treatment capacity (therefore energy use) than CAVSARP alternatives.
Lower treatment capacity (therefore energy use) than CAVSARP alternatives.
Potentially would not require an APP for CAVSARP.
Potentially would not require an APP for CAVSARP.
Potentially would not require an APP for CAVSARP.
Potentially would not require an APP for CAVSARP.
Potentially would not require an APP for CAVSARP.
Utilizes several different unit processes.
Utilizes several different unit processes.
Utilizes several different unit processes.
Operationally more complex due to ozone.
Utilizes the most unit processes compared to the other treatment trains.
Requires new recharge basins and conveyance on the recovery side.
Requires new recharge basins and conveyance on the recovery side.
Requires new recharge basins and conveyance on the recovery side.
Requires new recharge basins and conveyance on the recovery side.
Requires new recharge basins and conveyance on the recovery side.
Highest production of brine. Highest production of brine. Lower production of brine due to post-recovery treatment.
Lower production of brine due to post-recovery treatment.
Lowest production of brine due to post-recovery treatment and partial stream RO.

Alternative Decision Criteria Scoring
December 2013 01830100.0000 Page 3 of 3
CriteriaTucson Water Team
Tucson Water Team
Tucson Water Team
Tucson Water Team
Tucson Water Team
Tucson Water Team
Tucson Water Team
Tucson Water Team
Tucson Water Team
Tucson Water Team
Public Acceptance 8 7 8 8 7 6 7 5 7 4 10 9 10 10 7 5 8 5 7 3Cost 5 2 4 1 4 3 6 5 6 6 7 2 6 1 9 9 9 8 9 10Multiple Barrier Approach 10 9 10 10 9 5 7 6 6 3 9 9 10 10 9 8 8 4 7 7TDS Removal 9 9 10 10 10 10 5 5 5 5 9 9 10 10 7 10 7 10 4 5Proven IPR Process 10 9 10 10 9 9 8 9 7 9 9 9 10 10 8 6 7 6 6 6Refractory Chemicals 10 10 10 10 9 5 8 9 7 5 9 10 10 10 8 10 9 7 7 9Microconstituent Removal 10 10 10 10 9 7 8 10 7 6 9 10 10 10 8 10 9 8 7 9Energy Usage 7 2 5 1 5 3 7 4 7 5 7 2 5 1 6 6 6 5 8 6Institutional and Regulatory Complexity
6 3 6 3 6 3 7 2 6 2 7 4 7 4 6 7 6 5 6 5
Operational Complexity 6 5 6 5 6 6 6 5 7 4 6 5 6 5 7 5 6 4 6 3Utilization of Existing Infrastructure
9 7 9 7 9 7 9 7 9 7 6 4 6 4 6 4 6 4 5 4
Brine Quantity 5 1 5 1 5 1 7 5 7 5 5 1 5 1 8 7 8 8 8 9
North CAVSARP-5CAVSARP-1 CAVSARP-2 CAVSARP-3 CAVSARP-4 CAVSARP-5
North CAVSARP-1
North CAVSARP-2
North CAVSARP-3
North CAVSARP-4

ATTACHMENT C
DESIGN CRITERIA AND COST ESTIMATES FOR THE RECYCLED WATER
PROGRAM ALTERNATIVES

Microfiltration Design Criteria
December 2013 01830100.0000 Page 1 of 12
2020Low Range
2030 Low Range
Conceptual Design ParametersDenitrified Effluent Supply Flow Rate (MGD) 19 26MF Feed - with BW & Conc Recycle (MGD) 24.6 33.6MF Filtrate (MGD) 22.1 30.3MF BW Recycle Flow Rate (MGD) 2.3 3.2
Filtrate turbidity (NTU) < 0.02 < 0.02Conceptual Equipment Sizing
Number of MF Units (N+1) 24 32Modules Per Unit 119 119Instantaneous Flux Rate (gfd) 25 25Solids Waste (MGD) 0.12 0.17Recovery 90% 90%Pressurized configuration yes yesOperating Pressure (psi) 10 - 20 10 - 20Nominal Pore Size (micron) 0.04 0.04
MF Design CriteriaNorth CAVSARP-1

Nanofiltration Design Criteria
December 2013 01830100.0000 Page 2 of 12
2020Low Range
2030 Low Range
2020Low Range
2030 Low Range
Conceptual Design ParametersDenitrified Effluent Supply Flow Rate (MGD) 19 26 7 13NF Feed (MGD) 22.1 30.3 8.2 15.3NF Permeate (MGD) 17.7 24.2 6.6 12.2
Target Permeate TDS (mg/L) 650 650 650 650Recovery (%) 0.8 0.8 0.8 0.8
Conceptual Equipment SizingNumber of RO Trains 10 14 4 7Flow per Train (MGD) 1.8 1.8 1.7 1.7Elements per Train 420 420 392 392Flux Rate (gfd) 10.5 10.3 10.5 10.3Vessel Diameter (in) 8 8 8 8Array Configuration 40:20 40:20 38:18 40:20Elements per Vessel 7 7 7 7Number of Stages 2 2 2 2Operating Pressure (psi) 125 - 200 125 - 200 125 - 200 125 -200
NF Design CriteriaNorth CAVSARP-1 North CAVSARP-3 &4

Ion Exchange Design Criteria
December 2013 01830100.0000 Page 3 of 12
2020Low Range
2030 Low Range
Conceptual Design ParametersDenitrified Effluent Supply Flow Rate (MGD) 19 26IX Feed (MGD) 4.4 6.1IX Product (MGD) 4.3 5.9
Recovery 98% 98%Conceptual Equipment Sizing
Number of Vessels 5 7Vessel Diamerter (ft) 6 6Vessel Height (ft) 11 11Dillution Water Tank 10' x 10' 12' x 12'Regeneration Tank 12' 12'
IX Design CriteriaNorth CAVSARP-1

Electrodialysis Reversal Design Criteria
December 2013 01830100.0000 Page 4 of 12
2020Low Range
2030 Low Range
2020Low Range
2030 Low Range
Conceptual Design ParametersDenitrified Effluent Supply Flow Rate (MGD) 19 26 7 13EDR Feed (MGD) 4.3 5.9 1.6 3.1EDR Product (MGD) 3.3 4.5 1.2 2.3
Recovery / Stage 50% 50% 50% 50%Conceptual Equipment Sizing
Salt Removal (%) 75% 75% 75% 75%Number of Stages 2 2 2 2Overall Water Recovery (%) 75% 75% 75% 75%
EDR Design CriteriaNorth CAVSARP-1 North CAVSARP-3 & 4

Evaporation Pond Design Criteria
December 2013 01830100.0000 Page 5 of 12
2020Low Range
2030 Low Range
2020Low Range
2030 Low Range
Conceptual Design ParametersDenitrified Effluent Supply Flow Rate (MGD) 19 26 7 13Average Evap Feed (MGD) 0.95 1.3 0.38 0.71
Pan Evaporation Rate (in) 107 107 107 107Average Precipitation (in) 11.1 11.1 11.1 11.1
Conceptual Equipment SizingTotal Acreage 269 368 107 199Salt Accumulation (tons per year) 38,700 52,958 12,500 23,214
Evaporation Pond Design CriteriaNorth CAVSARP-1 North CAVSARP-3 & 4

UV-AOP Design Criteria
December 2013 01830100.0000 Page 6 of 12
2020Low Range
2030 Low Range
2020Low Range
2030 Low Range
Conceptual Design ParametersFlow Rate (MGD) 19 26 7 13Target Contaminant (Photolysis) NDMA NDMA NDMA NDMA
Log Reduction 1.2 1.2 1.2 1.2Target Contaminant (Oxidation) 1,4-dioxane 1,4-dioxane 1,4-dioxane 1,4-dioxane
Log Reduction 0.5 0.5 0.5 0.5Lamp Fouling Factor 1 1 1 1UVT 95% 95% 90% 90%
Conceptual Equipment SizingNumber of UV AOP Trains 3 4 2 3Flow per Train (MGD) 6 7 4 4Vessels per Train (2 Reactors per Vessel) 3 3 2 2Lamp Technology LPHO LPHO LPHO LPHOVessel Diameter (in) 30 30 30 30Flange Connection Size (in) 18 18 18 18Peroxide Dose (mg/L) 4 4 3.5 3.5Peroxide Concentration (%) 35 35 35 35Peroxide 30-day Storage (gallons) 5,925 8,107 1,910 3,547Peroxide Residual (mg/L) 3.2 3.2 2.8 2.8Peroxide Quenching Method SAT SAT GAC GAC
North CAVSARP-3UV-AOP Design Criteria
North CAVSARP-1

Ozone Design Criteria
December 2013 01830100.0000 Page 7 of 12
2020Low Range
2030 Low Range
Max Flow Rate (MGD) 4 5.2Average Flow Rate (MGD) 1 3Number of TrainsFlow per Train (MGD)Target Ozone:TOC Ratio (mg O3: mg TOC) 0.5 0.5Max Ozone Dose (mg/L) 45 9Average Ozone Dose (mg/L) 35 7Contact Time (minutes) 10 10Design Required Production (ppd ozone) 1,500 390Average Required Production (ppd ozone) 411 175TOC - 90th Percentile (mg/L) 90 18TOC - 50th Percentile (mg/L) 70.5 14
Ozone Design CriteriaConcentrate-1
(Full Stream RO)

Soil Aquifer Treatment Design Criteria
December 2013 01830100.0000 Page 8 of 12
2020Low Range
2030 Low Range
2020Low Range
2030 Low Range
2020Low Range
2030 Low Range
Peak Recharge (MGD) 19 26 19 26 19 26Average Recharge (MGD) 7 13 7 13 7 13Infiltration Rate (ft/day)1 1.5 1.5 1.5 1.5 1.5 1.5Wet:Dry Cycle 0.50 0.5 0.5 0.5 0.33 0.33Total Area (acres) 76 104 76 104 112 153Available Existing Recharge Area (acres) 0 0 0 0 0 0Recharge Area Needed (acres) 76 104 76 104 112 1531 Infiltration rate from Tucson Water
Expansion of SAVSARP
North CAVSARP-1 (New basins North of
CAVSARP)SAT Design Criteria
North CAVSARP-3 & 4 (New basins North of
CAVSARP)

Granular Activated Carbon Design Criteria
December 2013 01830100.0000 Page 9 of 12
2020Low Range
2030 Low Range
2020Low Range
2030 Low Range
Flow Rate (MGD) 7 13 1.6 3.1
Contactor TypeContactor ConfigurationContactor Diameter (ft) 12 12 12 12Contactor Straight Side Height (ft) 8 8 8 8Bed volume (gallons) 5540 5540 5540 5540Number of Trains 5 9 3 5Number of Contactors/Train 1 1 2 2Flow Rate per Contactor (MGD) 1.4 1.4 0.5 0.6Carbon TypeEmpty Bed Contact Time (EBCT; minutes) 6 6 30 26Liquid Loading Rate (gpm/sf) 9 9 4 4GAC Changeout Frequency (yr) 2 2 0.5 0.5
Catalytic Coconut Coconut Shell
North CAVSARP-3 (Hydrogen Peroxide
Quenching)
North CAVSARP-4 (Microconstituent Removal)
GAC Design Criteria
Pressure Contactors (ASME Rated)
Series
Pressure Contactors (ASME Rated)
Parallel

Biologically Active Carbon Design Criteria
December 2013 01830100.0000 Page 10 of 12
2020Low Range
2030 Low Range
Flow Rate (MGD) 4.0 5.2
Contactor TypeContactor ConfigurationContactor Diameter (ft) 12 12Contactor Straight Side Height (ft) 8 8Bed volume (gallons) 5540 5540Number of Trains 5 8Number of Contactors/Train 2 2Flow Rate per Contactor (MGD) 0.8 0.7Carbon TypeEmpty Bed Contact Time (EBCT; minutes) 20 25Liquid Loading Rate (gpm/sf) 4 4GAC Changeout Frequency (yr) 4 4
Series
Coconut Shell
BAC Design Criteria
Concentrate-1Full Stream RO
(North CAVSARP-1)
Pressure Contactors (ASME Rated)

Solids Handling Design Criteria
December 2013 01830100.0000 Page 11 of 12
2020Low Range
2030 Low Range
Flow (mgd) 2.5 3.4Lamella Settlers
Footprint, gpd/sf 1500 1500Percent Solids, % 2 2
Centrifuge (mgd) 0.1 0.17Percent Water, % 4 4Solids, lb/day 59,875 84,823
North CAVSARP-1Solids Design Criteria

Conveyance Design Criteria
December 2013 01830100.0000 Page 12 of 12
North CAVSARPRoute #1
(Rattle Snake Pass)Pipe Length
(ft)2050 Max Month - Low 32 48 32 mgd @ 100 feet 129,380
ItemVelocityPressure at Recharge Location
Scenario Flow (mgd)Pipe Size
(inch)
Pump Size
5 feet per second
Headloss
Conveyance Design CriteriaCriteria
10 feet per 1,000 feet of pipe for distribution (less than 12”)3 feet per 1,000 feet of pipe for transmission (12” and larger)10 – 20 psi

2020 LOW RANGE FLOW PROJECTIONS
December 2013 01830100.0000 Page 1 of 1
12/20/2013FINAL
N CAVSARP 1 N CAVSARP 3 N CAVSARP 4
Conveyance Route to Avra Valley (Pumping & Piping) 109,330,000$ 109,330,000$ 109,330,000$ Microfiltration 44,486,000$ Nanofiltration 50,884,000$ 26,422,000$ 26,422,000$ Reverse OsmosisSoil Aquifer Treatment 6,101,000$ 8,970,000$ 8,970,000$ CAP RechargeUV-AOP 11,723,000$ 5,337,000$ OzoneGAC (includes Cartridge Filtration) 3,490,000$ Concentrate Management 103,544,000$ 35,649,000$ 39,864,000$
Ozone 12,503,000$ BAC 5,609,000$ GAC and Cartridge Filtration 4,215,000$ IX 10,806,000$ EDR 13,384,000$ 9,990,000$ 9,990,000$ Evaporation Ponds 61,242,000$ 25,659,000$ 25,659,000$
Solids Handling 2,868,000$ -$ -$ Lamella Settlers 2,175,000$ Centrifuge 693,000$
Recovery Wells -$ -$ -$ Recovered Water Transmission System (Piping) -$ 13,706,000$ 13,706,000$ SUBTOTAL: EQUIPMENT 219,606,000$ 93,574,000$ 88,962,000$ SUBTOTAL: CONVEYANCE 109,330,000$ 109,330,000$ 109,330,000$
TOTAL CAPITAL COST 328,936,000$ 202,904,000$ 198,292,000$
Conveyance Route to Avra Valley (Pumping & Piping) 182,000$ 182,000$ 182,000$ Microfiltration 610,000$ Nanofiltration 1,732,000$ 1,732,000$ 1,732,000$ Reverse OsmosisSoil Aquifer Treatment 19,000$ 27,000$ 27,000$ Soil Aquifer TreatmentUV-AOP 1,041,000$ 410,000$ OzoneGAC (includes Cartridge Filtration) 151,100$ Concentrate Management 3,027,700$ 892,000$ 1,589,200$
Ozone 310,000$ BAC 152,700$ GAC and Cartridge Filtration 697,200$ IX 666,000$ EDR 303,000$ 355,000$ 355,000$ Evaporation Ponds 1,596,000$ 537,000$ 537,000$
Solids Handling 61,000$ -$ -$ Lamella Settlers 47,000$ Centrifuge 14,000$
Recovery Wells -$ -$ -$ Recovered Water Transmission System (Piping) -$ 15,000$ 15,000$ SUBTOTAL: EQUIPMENT 6,490,700$ 3,227,100$ 3,363,200$ SUBTOTAL: CONVEYANCE 182,000$ 182,000$ 182,000$
TOTAL O&M COST 6,672,700$ 3,409,100$ 3,545,200$
Capital Cost 328,936,000$ 202,904,000$ 198,292,000$ Annual O&M Cost 6,672,700$ 3,409,100$ 3,545,200$ Present Worth of Annual O&M 115,384,551$ 58,950,271$ 61,303,716$ Total Present Worth 444,320,551$ 261,854,271$ 259,595,716$ Annualized Capital Cost 19,022,401$ 11,733,958$ 11,467,246$ Total Equivalent Annual Cost 25,695,101$ 15,143,058$ 15,012,446$
Rate (i) = 4%Years (n) = 30
POTENTIAL RELATED CAPITAL COSTSSAVSARP Expansion 27,193,000$ 27,193,000$ 27,193,000$
POTENTIAL RELATED O&M COSTSSAVSARP Expansion 1,252,000$ 1,252,000$ 1,252,000$
CAPITAL COST
O&M COST
Recycled Water Master Plan Treatment Train Summary

2030 LOW RANGE FLOW PROJECTIONS
December 2013 01830100.0000 Page 1 of 1
12/20/2013FINAL
N CAVSARP 1 N CAVSARP 3 N CAVSARP 4
Conveyance Route to Avra Valley (Pumping & Piping) 109,330,000$ 109,330,000$ 109,330,000$ Microfiltration 60,994,000$ Nanofiltration 68,993,000$ 47,726,000$ 47,726,000$ Reverse OsmosisSoil Aquifer Treatment 8,346,000$ 12,275,000$ 12,275,000$ CAP RechargeUV-AOP 16,039,000$ 9,912,000$ OzoneGAC (includes Cartridge Filtration) 5,332,000$ Concentrate Management 138,554,000$ 67,473,000$ 74,544,000$
Ozone 16,252,000$ BAC 6,889,000$ GAC and Cartridge Filtration 7,071,000$ IX 13,619,000$ EDR 18,705,000$ 21,213,000$ 21,213,000$ Evaporation Ponds 83,089,000$ 46,260,000$ 46,260,000$
Solids Handling 3,937,000$ -$ -$ Lamella Settlers 2,959,000$ Centrifuge 978,000$
Recovery Wells -$ -$ -$ Recovered Water Transmission System (Piping) -$ 13,706,000$ 13,706,000$ SUBTOTAL: EQUIPMENT 296,863,000$ 156,424,000$ 148,251,000$ SUBTOTAL: CONVEYANCE 109,330,000$ 109,330,000$ 109,330,000$
TOTAL CAPITAL COST 406,193,000$ 265,754,000$ 257,581,000$
Conveyance Route to Avra Valley (Pumping & Piping) 257,000$ 257,000$ 257,000$ Microfiltration 1,131,000$ Nanofiltration 3,086,000$ 3,086,000$ 3,086,000$ Reverse OsmosisSoil Aquifer Treatment 25,000$ 37,000$ 37,000$ Soil Aquifer TreatmentUV-AOP 1,452,000$ 758,000$ OzoneGAC (includes Cartridge Filtration) 264,200$ Concentrate Management 5,108,900$ 1,697,000$ 3,029,200$
Ozone 767,000$ BAC 191,900$ GAC and Cartridge Filtration 1,332,200$ IX 1,250,000$ EDR 719,000$ 700,000$ 700,000$ Evaporation Ponds 2,181,000$ 997,000$ 997,000$
Solids Handling 81,000$ -$ -$ Lamella Settlers 63,000$ Centrifuge 18,000$
Recovery Wells -$ -$ -$ Recovered Water Transmission System (Piping) -$ 15,000$ 15,000$ SUBTOTAL: EQUIPMENT 10,883,900$ 5,857,200$ 6,167,200$ SUBTOTAL: CONVEYANCE 257,000$ 257,000$ 257,000$
TOTAL O&M COST 11,140,900$ 6,114,200$ 6,424,200$
Capital Cost 406,193,000$ 265,754,000$ 257,581,000$ Annual O&M Cost 11,140,900$ 6,114,200$ 6,424,200$ Present Worth of Annual O&M 192,648,814$ 105,726,950$ 111,087,480$ Total Present Worth 598,841,814$ 371,480,950$ 368,668,480$ Annualized Capital Cost 23,490,181$ 15,368,580$ 14,895,935$ Total Equivalent Annual Cost 34,631,081$ 21,482,780$ 21,320,135$
Rate (i) = 4%Years (n) = 30
POTENTIAL RELATED CAPITAL COSTSSAVSARP Expansion 27,193,000$ 27,193,000$ 27,193,000$
POTENTIAL RELATED O&M COSTSSAVSARP Expansion 2,326,000$ 2,326,000$ 2,326,000$
CAPITAL COST
O&M COST
Recycled Water Master Plan Treatment Train Summary

APPENDIX F
COMMUNITY INVESTMENTS IN WATER RESOURCES

01830100.0000 F-1 December 2013
Appendix F: Community Investments in Water Resources
The City of Tucson has long recognized the need to reduce its historic reliance on local
groundwater to meet water demand. In order to bring renewable Colorado River water into the
community, Tucson Water has constructed the Central Avra Valley Storage and Recovery
Project (CAVSARP) and Southern Avra Valley Storage and Recovery Project (SAVSARP)
projects. Tucson Water has also constructed the Pima Mine Road Recharge Project (PMRRP) in
conjunction with the CAP to recharge Colorado River water. Through recharge and recovery,
Colorado River water mixes with native groundwater to produce a blended water supply. Potable
water deliveries from CAVSARP started in 2001 and from SAVSARP in 2008. A portion of the
water recharged at PMRRP is recovered at the Santa Cruz Wellfield. These facilities are the
primary elements of the Clearwater Program – a series of projects that bring the City’s annual
allocation of CAP water (currently 144,172 acre-feet) into use. The Clearwater Program supplies
a major portion of Tucson’s future water supply, allowing for the reduction of groundwater
pumping in the Central Wellfield. Implementing the Clearwater Program is a primary initiative
within Tucson Water’s Capital Improvement Program over the next five years and includes the
design and construction of additional recovery wells, reservoirs, boosters and transmission mains
necessary to bring renewable resources into the community.
In Tucson, the potable water that has been used for domestic and industrial purposes is
discharged to Pima County Regional Wastewater Reclamation Department’s (PCRWRD)
treatment facilities. The Tucson community has made a significant investment in PCRWRD’S
Regional Optimization Master Plan (ROMP) to meet new environmental regulatory requirements
and ultimately improve the effluent water quality. The ROMP program includes upgrading and
expanding the Ina Road Wastewater Reclamation Facility (WRF) and building a new water
reclamation facility at the Water Campus in the vicinity of the existing Roger Road WRF.
CENTRAL AVRA VALLEY STORAGE AND RECOVERY PROJECT
CAVSARP was built to effectively utilize the City of Tucson’s allocation of Colorado River
water from the CAP water and to reduce dependence on limited groundwater supplies. The
project evolved from a complex series of events and political actions related to the City of

01830100.0000 F-2 December 2013
Tucson’s initial introduction of CAP to the potable distribution system from 1992 to 1994, which
resulted in colored (red) water problems and some cases of failed plumbing in portions of the
city’s service area containing unlined steel water mains and/or galvanized home plumbing. In
November 1995, voters passed an initiative that severely limits the city’s ability to treat and
directly serve CAP water without first recharging the water. The CAVSARP concept was
developed to meet the requirements of the initiative, while also achieving compliance with state
laws that require use of renewable water resources to reduce reliance on limited groundwater
supplies.
CAVSARP has been in operation since May 2003 and is permitted to recharge 80,000 AFY.
CAVSARP facilities include a Tucson Aqueduct interconnection, a raw CAP water delivery
pipeline (54-inch to 60-inch diameter), more than 300 acres of infiltration basins, 25 deep
recovery wells, wellfield collector pipelines, a 10-MG recovered water reservoir and 54-MGD
booster station, 12.5 miles of 60-inch and 72-inch-diameter recovered water transmission main
from the CAVSARP booster station to the Hayden-Udall Water Treatment Plant.
Table 1 summarizes the project costs for CAVSARP which includes the capital costs invested to
date and the current annual O&M costs. Modifications to the chemical feed systems and water
quality monitoring facilities at the Hayden Udall Water Treatment Plant are included in the
capital costs. Annual O&M costs are based on the Santa Cruz Wellfield Water Quality
Management Evaluation Technical Memorandum (Malcolm Pirnie, 2012).

01830100.0000 F-3 December 2013
Table 1. CAVSARP Project Costs
Item Cost
CAPITAL COSTS
Recharge Basins, Raw CAP Pipeline& Monitoring Wells $11,700,000
Recovery Wellfield & Collector Pipelines $16,400,000
10-MG Reservoir & 54-MGD Booster Station $9,600,000
Raw and Recovered Water Transmission Mains $22,200,000
Utility Extensions and Relocations $300,000
Chemical Feed Modifications and Water Quality Monitoring Stations $900,000
Professional Services $17,600,000
Tucson Water Staff Costs $900,000
Miscellaneous $1,000,000
Total Capital Costs $80,600,000
ANNUAL O&M COSTS
Annual O&M1 $8,300,000
Total Annual O&M Costs $8,300,000
1 Annual O&M costs based on water produced and delivered to the B1 Water Service Area.
Annual O&M costs updated to September 2012 dollars.
SOUTHERN AVRA VALLEY STORAGE AND RECOVERY PROJECT
SAVSARP is Tucson Water’s second major CAP water recharge and recovery facility, which
became operational in 2008. This facility was constructed to allow the City of Tucson to fully
utilize its entire allocation of CAP water. SAVSARP not only increased the volume of CAP
water recharged and recovered by Tucson Water, but also provided an increased opportunity for
water banking and demonstrated access to additional renewable water supplies under the City’s
Assured Water Supply Designation. SAVSARP is located approximately two miles south of
CAVSARP and operated independently from the first facility.
The initial phase of the recharge facility includes a new CAP Aqueduct turnout structure, a
60-inch diameter raw CAP water delivery pipeline, and nine recharge basins with a total surface
area of approximately 220 acres that are currently permitted for up to 60,000 AFY
(approximately 19.6 MG) of recharge. The master site plan developed for the facility includes
provisions for future expansion with a parallel raw water pipeline and up to 14 additional
recharge basins for a total of 470 acres.

01830100.0000 F-4 December 2013
The Southern Avra Valley forebay reservoir and booster station and a 48-inch diameter pipeline
to connect SAVSARP and CAVSARP are currently under construction and will be completed by
Fiscal Year (FY) 2013. The South Avra Valley Recovered Water Collector Lines Phase I project
will install collector lines to convey water from six wells to the SAVSARP reservoir. The
Collector Lines Phase I project will take place from FY 2013-2015. The Well Equipping and
Well Drilling projects will result in sixteen new SAVSARP wells, and the projects will take
place from FY 2013-2018. Table 2 summarizes the SAVSARP project costs including capital
investments already made and planned to be made, and the current annual O&M costs.
Table 2. SAVSARP Project Costs
Item Cost
CAPITAL COSTS
Turnout/Flow Meter Vault and Raw Water Delivery Pipeline $4,400,000
Raw Water Delivery Pipeline and Recharge Facilities $21,400,000
Reservoir and Booster Station $11,800,000
48-inch Diameter SAVSARP-CAVSARP Interconnect Pipeline $5,500,000
South Avra Valley Recovered Water Collector Lines Phase I1 $7,500,000
Well Equipping2 $9,500,000
Well Drilling Costs $4,800,000
Total Capital Costs $64,900,000
ANNUAL O&M COSTS
Annual O&M3 $8,600,000
Total Annual O&M Costs $8,600,000 1 South Avra Valley Recovered Water Collector Lines planned for FY 2013-2015.
2 Well Equipping planned for FY 2013-2018.
3 Annual O&M costs based on water produced and delivered to the B1 Water Service Area.
Annual O&M costs updated to September 2012 dollars.
PIMA MINE ROAD RECHARGE PROJECT
PMRRP is a groundwater recharge project located in Pima County, approximately 15 miles south
of Tucson. PMRRP was developed by the City of Tucson and the Central Arizona Water
Conservation District (CAWCD) to recharge CAP water. The facility was constructed on the
Santa Cruz River flood plain and has two operational components: the original pilot facility
(2-mile delivery pipeline and two 7-acre infiltration basins) and an expanded facility (5,500-ft
pipeline and three new infiltration basins totaling 23 acres). The total facility has 37 acres of
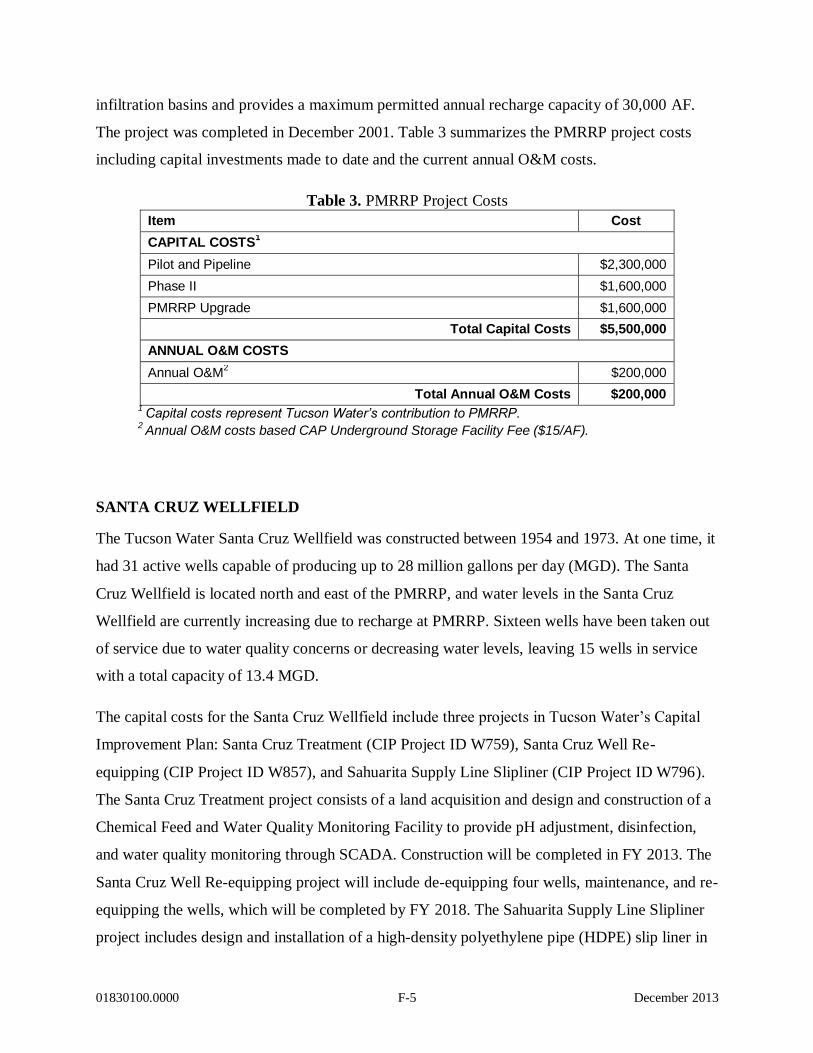
01830100.0000 F-5 December 2013
infiltration basins and provides a maximum permitted annual recharge capacity of 30,000 AF.
The project was completed in December 2001. Table 3 summarizes the PMRRP project costs
including capital investments made to date and the current annual O&M costs.
Table 3. PMRRP Project Costs
Item Cost
CAPITAL COSTS1
Pilot and Pipeline $2,300,000
Phase II $1,600,000
PMRRP Upgrade $1,600,000
Total Capital Costs $5,500,000
ANNUAL O&M COSTS
Annual O&M2 $200,000
Total Annual O&M Costs $200,000 1 Capital costs represent Tucson Water’s contribution to PMRRP.
2 Annual O&M costs based CAP Underground Storage Facility Fee ($15/AF).
SANTA CRUZ WELLFIELD
The Tucson Water Santa Cruz Wellfield was constructed between 1954 and 1973. At one time, it
had 31 active wells capable of producing up to 28 million gallons per day (MGD). The Santa
Cruz Wellfield is located north and east of the PMRRP, and water levels in the Santa Cruz
Wellfield are currently increasing due to recharge at PMRRP. Sixteen wells have been taken out
of service due to water quality concerns or decreasing water levels, leaving 15 wells in service
with a total capacity of 13.4 MGD.
The capital costs for the Santa Cruz Wellfield include three projects in Tucson Water’s Capital
Improvement Plan: Santa Cruz Treatment (CIP Project ID W759), Santa Cruz Well Re-
equipping (CIP Project ID W857), and Sahuarita Supply Line Slipliner (CIP Project ID W796).
The Santa Cruz Treatment project consists of a land acquisition and design and construction of a
Chemical Feed and Water Quality Monitoring Facility to provide pH adjustment, disinfection,
and water quality monitoring through SCADA. Construction will be completed in FY 2013. The
Santa Cruz Well Re-equipping project will include de-equipping four wells, maintenance, and re-
equipping the wells, which will be completed by FY 2018. The Sahuarita Supply Line Slipliner
project includes design and installation of a high-density polyethylene pipe (HDPE) slip liner in
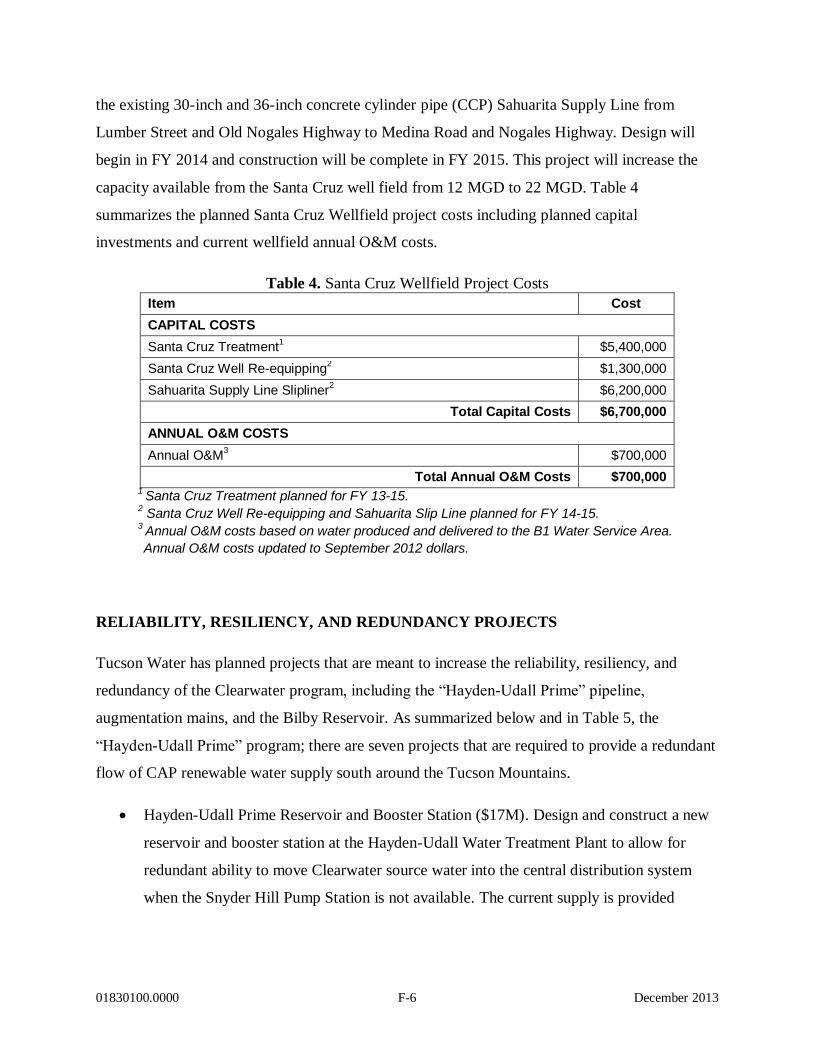
01830100.0000 F-6 December 2013
the existing 30-inch and 36-inch concrete cylinder pipe (CCP) Sahuarita Supply Line from
Lumber Street and Old Nogales Highway to Medina Road and Nogales Highway. Design will
begin in FY 2014 and construction will be complete in FY 2015. This project will increase the
capacity available from the Santa Cruz well field from 12 MGD to 22 MGD. Table 4
summarizes the planned Santa Cruz Wellfield project costs including planned capital
investments and current wellfield annual O&M costs.
Table 4. Santa Cruz Wellfield Project Costs
Item Cost
CAPITAL COSTS
Santa Cruz Treatment1 $5,400,000
Santa Cruz Well Re-equipping2 $1,300,000
Sahuarita Supply Line Slipliner2 $6,200,000
Total Capital Costs $6,700,000
ANNUAL O&M COSTS
Annual O&M3 $700,000
Total Annual O&M Costs $700,000 1 Santa Cruz Treatment planned for FY 13-15.
2 Santa Cruz Well Re-equipping and Sahuarita Slip Line planned for FY 14-15.
3 Annual O&M costs based on water produced and delivered to the B1 Water Service Area.
Annual O&M costs updated to September 2012 dollars.
RELIABILITY, RESILIENCY, AND REDUNDANCY PROJECTS
Tucson Water has planned projects that are meant to increase the reliability, resiliency, and
redundancy of the Clearwater program, including the “Hayden-Udall Prime” pipeline,
augmentation mains, and the Bilby Reservoir. As summarized below and in Table 5, the
“Hayden-Udall Prime” program; there are seven projects that are required to provide a redundant
flow of CAP renewable water supply south around the Tucson Mountains.
Hayden-Udall Prime Reservoir and Booster Station ($17M). Design and construct a new
reservoir and booster station at the Hayden-Udall Water Treatment Plant to allow for
redundant ability to move Clearwater source water into the central distribution system
when the Snyder Hill Pump Station is not available. The current supply is provided

01830100.0000 F-7 December 2013
through a single point, which includes the Hayden-Udall Plant; Snyder Hill Pump
Station; and Clearwell Reservoir.
Avra Valley Transmission Main Augmentation Phase I ($30M). This project will include
design and construction of approximately seven miles of 64-inch transmission main from
the Hayden-Udall Treatment Plant to an A-zone drop. This project will provide redundant
transmission main capacity for delivery of water to the central system and improve
reliability.
Avra Valley Transmission Main Augmentation Phase II ($20M). Design and construct
4.3 miles of 64-inch transmission main to convey water to the B-Zone to A-Zone PRV
station at Drexel Road and Calle Santa Cruz Lane, B-Zone at Bilby Road and Park
Avenue, and the proposed Bilby Reservoir.
Park Ave. B-Zone Augmentation Main ($10M). Design and construct approximately 4
miles of transmission main pipe to convey B-zone water from the Avra Valley
Augmentation main at Bilby Road to the 24th Street PRV along Park Ave. This main is
required to provide a redundant source of supply to B-zone water in the event the 96-inch
SHPS / Clearwell system fails.
Country Club C-Zone Augmentation Transmission Main ($16M). Design and construct
approximately 4.5 miles of 54-inch transmission main from the future Bilby C-Zone
Reservoir and Booster Station to the Tech Drive PRV Station. The new main will deliver
renewable water to the C-Zone. This main is parallel to an existing 48-inch main and will
provide redundant transmission capacity.
Bilby B-Zone Reservoir and C-Zone Booster ($23M). Design and construct a new 20
million gallon reservoir and booster station as part of the Avra Valley Augmentation
Program. This program will provide redundancy of supply from the Clearwater Project.
SAVSARP Recovered Water Transmission Main ($40M). Design and install
approximately 48,000 feet of 64-inch transmission main in South Avra Valley. The
pipeline will convey approximately 72,000 acre-feet of recovered, recharged Colorado
River water from the SAVSARP basins to the new Hayden-Udall Prime Reservoir and
Booster. This project increases reliability and redundancy for the Clearwater water
supply.

01830100.0000 F-8 December 2013
Table 5. Reliability, Resiliency, and Redundancy Project Costs
Item Cost
CAPITAL COSTS
Hayden-Udall Prime Reservoir and Booster Station $17,000,000
Avra Valley Transmission Main Augmentation Phase I $30,000,000
Avra Valley Transmission Main Augmentation Phase II $20,000,000
Park Ave. B-Zone Augmentation Main $10,000,000
Country Club C-Zone Augmentation Transmission Main $16,000,000
Bilby B-Zone Reservoir and C-Zone Booster $23,000,000
SAVSARP Recovered Water Transmission Main $40,000,000
Total Capital Costs $156,000,000
REGIONAL OPTIMIZATION MASTER PLAN IMPROVEMENTS
ROMP was developed by PCRWRD in conjunction with community partners, including the City
of Tucson, the Town of Oro Valley, and others. ROMP outlines the long-term plan to meet new
environmental regulatory requirements mandated by the Arizona Department of Environmental
Quality (ADEQ). The new environmental regulations require PCRWRD to decrease the amount
of nitrogen and ammonia in wastewater effluent discharged to the Santa Cruz River. The Ina
Road WRF will be upgraded and expanded, while a new water reclamation facility will be
constructed at the Water Reclamation Campus next to the existing Roger Road WRF. The
existing Roger Road WRF will be decommissioned after the Water Campus is completed. The
Ina Road WRF and Water Campus will both include nitrification and denitrification treatment
processes. Other ROMP improvements include:
Central Laboratory Complex, which will combine all laboratory services to one location.
Plant Interconnect to connect the Roger Road WRF and Ina Road WRFs and provide
flow and capacity management between the two facilities.
Central SCADA Control Center for the entire Pima County wastewater system.
Optimal biosolids processing and biogas utilization for onsite power and thermal
generation

01830100.0000 F-9 December 2013
Table 6 summarizes the ROMP project costs including planned investments and the anticipated
annual O&M costs. The regulatory compliance date for the Ina Road WRF Upgrade and
Expansion project is January 30, 2014, while the compliance date for the Water Reclamation
Campus is January 30, 2015. The capital investments made to date as of July 2012 were
$372,006,450 (Pima County Regional Wastewater Reclamation Advisory Committee, ROMP
Program Monthly Update, July 2012).
Table 6. ROMP Project Costs
Item Cost
CAPITAL COSTS1
Plant Interconnect $34,400,000
Ina Road WRF Upgrade and Expansion Project $294,400,000
Water Reclamation Campus $285,100,000
ROMP SCADA $13,500,000
Biosolids/Biogas Utilization $32,700,000
Total Capital Costs $660,100,000
ANNUAL O&M COSTS2
Annual O&M $15,000,000
Total Annual O&M Costs $15,000,000 1 Source: Draft Revised ROMP CIP Baseline Costs (Greeley and Hansen, August 2011).
2 Source: 2007 ROMP Report (Greeley and Hansen, November 2007).

APPENDIX G
COST INFORMATION FOR OTHER SOUTHWEST WATER SUPPLY PROJECTS

01830100.0000 G-1 December 2013
Appendix G: Cost Information for Other Southwest Water Supply Projects
Utility Project Category of Project Status
Annual Water
Supply (AFY)
2012 Capital Cost
2012 Annualized Capital Cost
2012 Annual
O&M Cost
2012 Total
Annual Cost
2012 Unit Cost
($/AF)
City of Phoenix Water Services Department City of Phoenix McMullen Valley Transfer Project Groundwater Importation Concept 38,000 $111,900,000 $6,500,000 $8,600,000 $15,100,000 $397
El Paso Water Utilities EPWU Kay Bailey Hutchinson Desalination Plant Brackish Water Desalination In operation 30,800 NA NA NA NA $585
El Paso Water Utilities EPWU Rio Bosque Potable Reuse Concept Potable Reuse Concept 16,000 $78,500,000 $4,600,000 $5,600,000 $10,200,000 $638
Southern Nevada Water Authority1 SNWA Groundwater Development Project Groundwater Importation Concept 340,000 $4,045,400,000 $234,000,000 NA NA $688
City of Phoenix Water Services Department City of Phoenix Agua Fria Linear Recharge Project Indirect Potable Reuse Concept 16,000 $84,100,000 $4,900,000 $6,800,000 $11,700,000 $731
Orange County Water District OCWD Groundwater Replenishment System Indirect Potable Reuse In operation 72,000 $536,900,000 $31,100,000 $31,300,000 $62,400,000 $867
Colorado River Municipal Water District Big Spring, TX Potable Reuse Direct Potable Reuse Under construction 2,240 NA NA NA NA $930
El Paso Water Utilities EPWU Import from Dell Valley Groundwater Importation Concept 20,000 $233,400,000 $13,500,000 $11,300,000 $24,800,000 $1,240
Los Angeles Department of Water and Power
LADWP Recycled Water Phase 1 and 2 With Injection Wells Indirect Potable Reuse Concept 30,000 $429,100,000 $24,900,000 $18,500,000 $43,400,000 $1,447
Tucson Water RWMP North CAVSARP-3 (2030 Flows) Indirect Potable Reuse Concept 14,560 $271,800,000 $15,800,000 $6,300,000 $22,100,000 $1,500
Tucson Water RWMP North CAVSARP-4 (2030 Flows) Indirect Potable Reuse Concept 14,560 $263,700,000 $15,300,000 $6,600,000 $21,900,000 $1,500
West Basin Municipal Water District West Basin Average Unit Cost of Recycled Water Projects Indirect Potable Reuse In operation 33,600 NA NA NA NA $1,650
Los Angeles Department of Water and Power LADWP Recycled Water Phase 1 Indirect Potable Reuse Concept 15,000 $294,700,000 $17,100,000 $9,600,000 $26,700,000 $1,780
Tucson Water RWMP North CAVSARP-3 (2020 Flows) Indirect Potable Reuse Concept 7,840 $207,500,000 $12,000,000 $3,500,000 $15,500,000 $2,000
Tucson Water RWMP North CAVSARP-4 (2020 Flows) Indirect Potable Reuse Concept 7,840 $202,400,000 $11,800,000 $3,600,000 $15,400,000 $2,000
San Diego County Water Authority SDCWA Carlsbad Desalination Project Seawater Desalination Under design 48,000 NA NA NA NA $2,299
Tucson Water RWMP North CAVSARP-1 (2030 Flows) Indirect Potable Reuse Concept 14,560 $414,900,000 $24,000,000 $11,400,000 $35,400,000 $2,400
South Central Texas Regional Water Plan South Central Texas Seawater Desalination Seawater Desalination Pilot studies 28,004 $650,000,000 $37,600,000 $30,900,000 $68,500,000 $2,446
City of San Diego Public Utilities Department San Diego Recycled Water Study Direct Potable Reuse
Demo completed 96,162 NA NA NA NA $2,646
Tucson Water RWMP North CAVSARP-1 (2020 Flows) Indirect Potable Reuse Concept 7,840 $336,200,000 $19,500,000 $6,900,000 $26,400,000 $3,300
1 Unit cost does not include annual O&M cost
