01/04/2007ecs236 winter 20071 intrusion detection ecs236 winter 2007: intrusion detection #2:...
Post on 19-Dec-2015
219 views
TRANSCRIPT
01/04/2007 ecs236 winter 2007 1
ecs236 Winter 2007:
Intrusion DetectionIntrusion Detection#2: Anomaly Detection
Dr. S. Felix Wu
Computer Science Department
University of California, Davishttp://www.cs.ucdavis.edu/~wu/
01/04/2007 ecs236 winter 2007 2
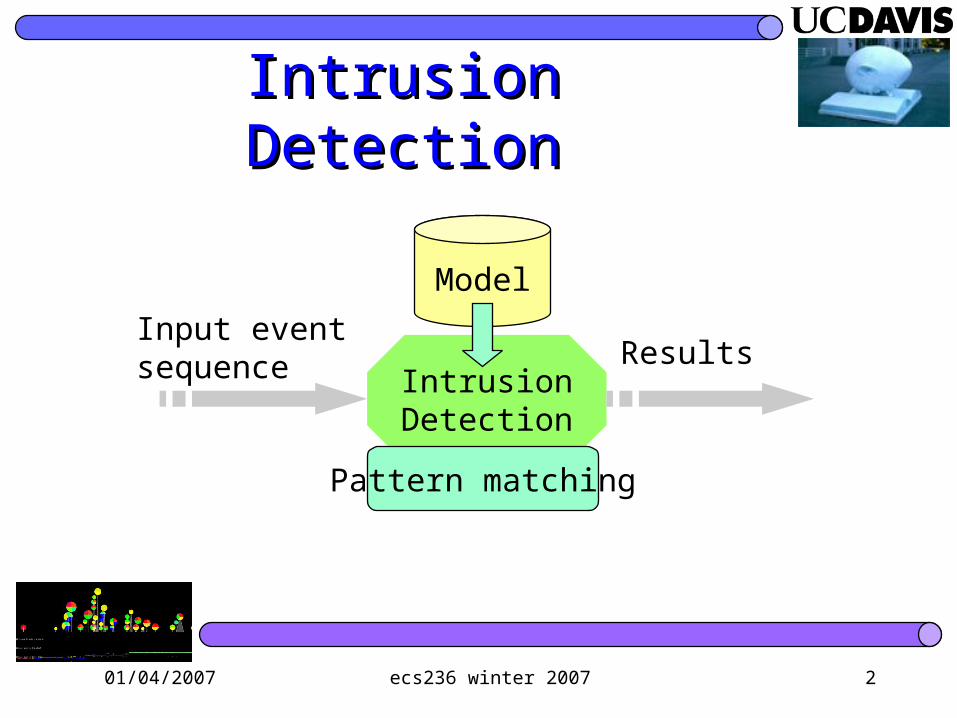
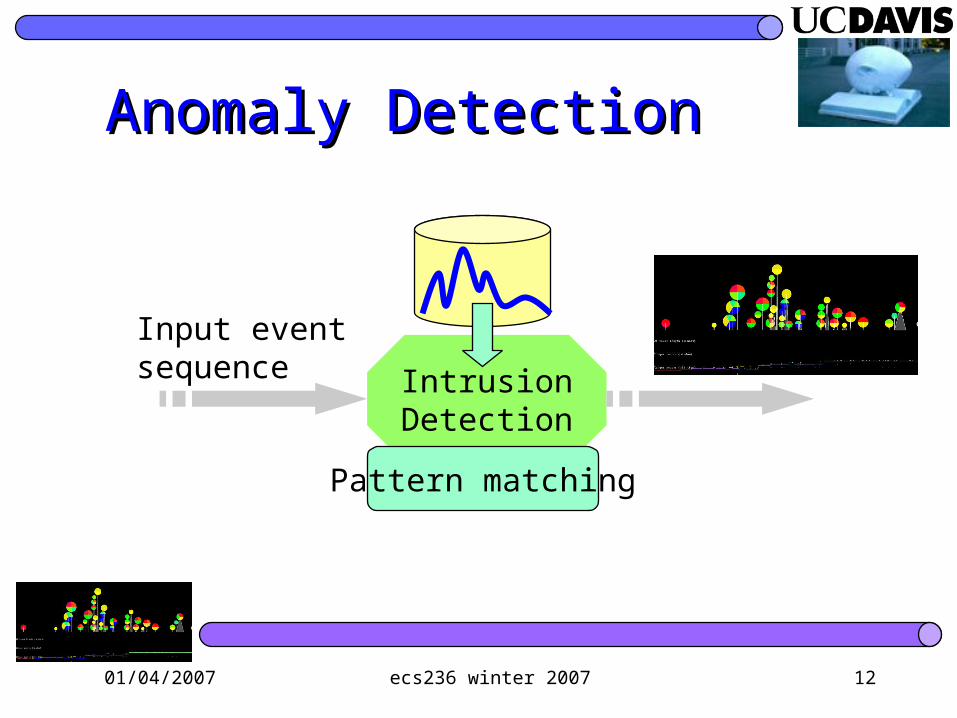
Intrusion DetectionIntrusion Detection
IntrusionDetection
Model
Input eventsequence Results
Pattern matching
01/04/2007 ecs236 winter 2007 3
Scalability of DetectionScalability of Detection
Number of signatures, amount of analysis Unknown exploits/vulnerabilities
01/04/2007 ecs236 winter 2007 4
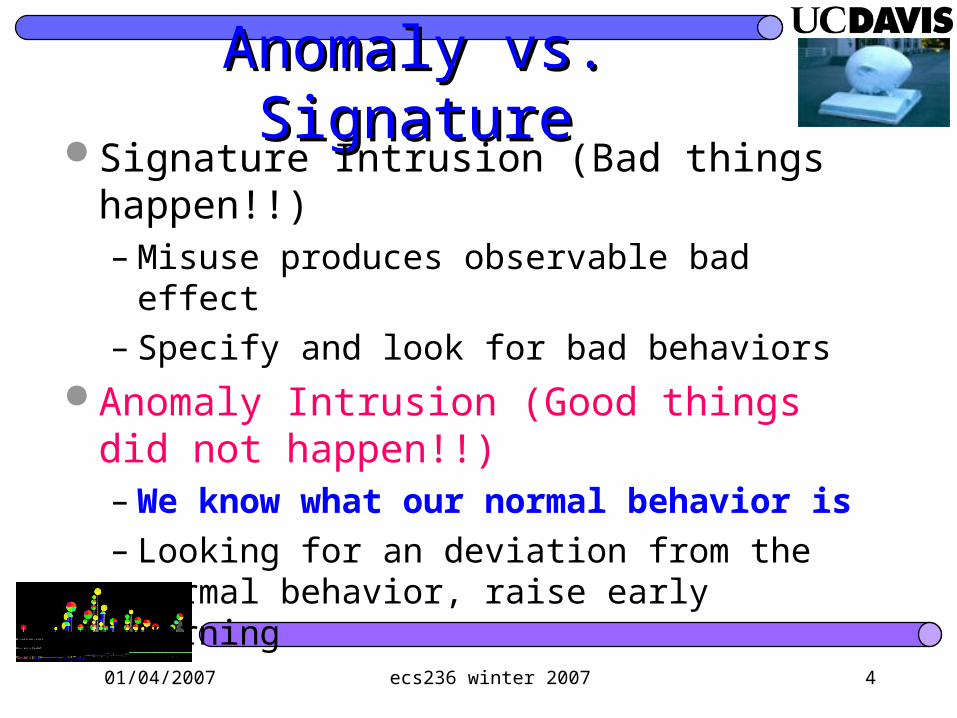
Anomaly vs. SignatureAnomaly vs. Signature Signature Intrusion (Bad things happen!!)
– Misuse produces observable bad effect– Specify and look for bad behaviors
Anomaly Intrusion (Good things did not happen!!)– We know what our normal behavior is– Looking for an deviation from the normal
behavior, raise early warning
01/04/2007 ecs236 winter 2007 5
Reasons for “AND”Reasons for “AND”
Unknown attacks (insider threat) Better scalability
– AND target/vulnerabilities– SD exploits
01/04/2007 ecs236 winter 2007 6
Another definition…Another definition… Signature-based detection
– Predefine the signatures of anomalies– Pattern matching
Statistics-based detection– Build statistics profile for expected behaviors
– Compare testing behaviors with expected behaviors
– Significant deviation
Convert our limited/partial understanding/modeling about the target system or protocol into detection heuristics (i.e., BUTTERCUP signatures)
Based on our experience, select a set of “features” that will likely to distinguish expected from unexpected behavior.
01/04/2007 ecs236 winter 2007 7
What is “vulnerability”?What is “vulnerability”?
01/04/2007 ecs236 winter 2007 8
What is “vulnerability”?What is “vulnerability”?
Signature Detectioncreate “effective/strong/scaleable” signatures
Anomaly Detectiondetect/discover “unknown vulnerabilities”
01/04/2007 ecs236 winter 2007 9
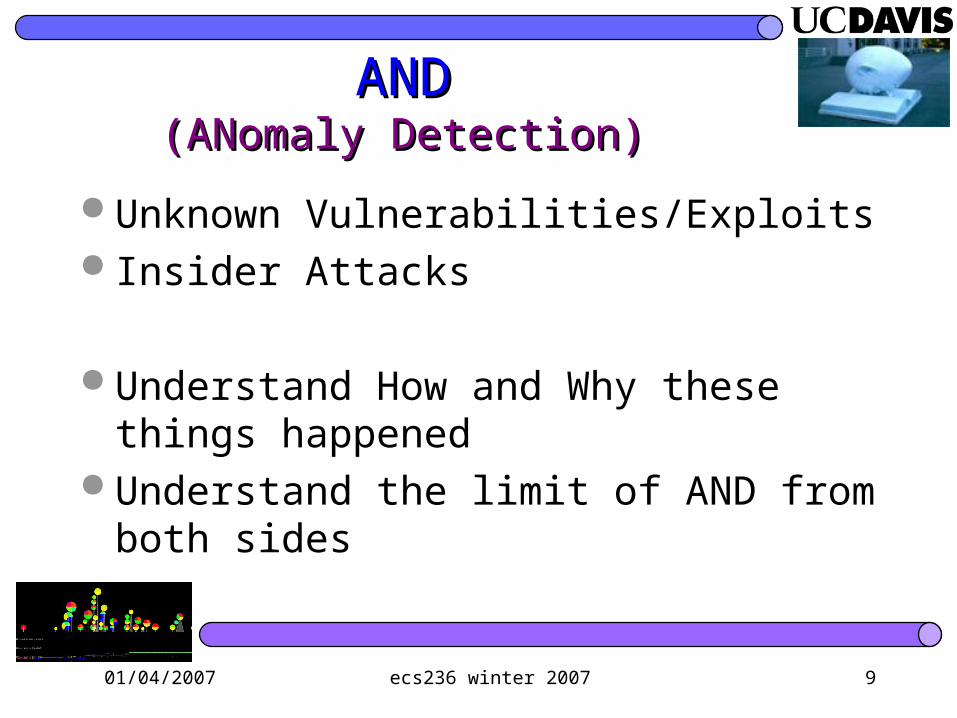
ANDAND(ANomaly Detection)(ANomaly Detection)
Unknown Vulnerabilities/Exploits Insider Attacks
Understand How and Why these things happened
Understand the limit of AND from both sides

01/04/2007 ecs236 winter 2007 10
What is an anomaly?What is an anomaly?

01/04/2007 ecs236 winter 2007 11
Intrusion DetectionIntrusion Detection
IntrusionDetection
Model
Input eventsequence Results
Pattern matching
01/04/2007 ecs236 winter 2007 12
Anomaly DetectionAnomaly Detection
IntrusionDetection
Input eventsequence
Pattern matching
01/04/2007 ecs236 winter 2007 13
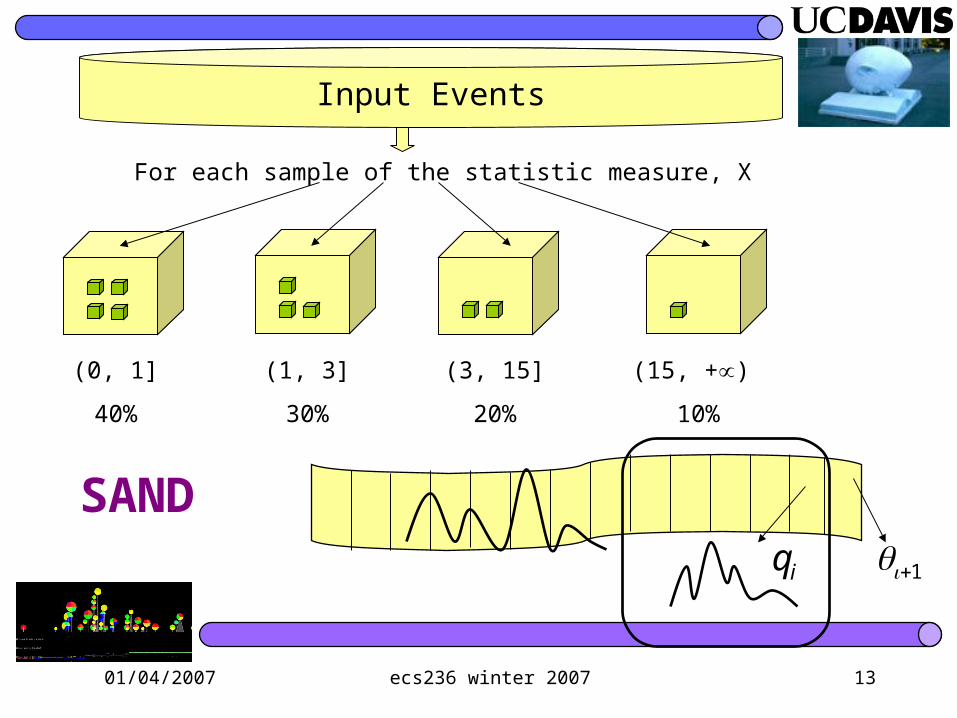
For each sample of the statistic measure, X
(0, 1]
40%
(1, 3]
30%
(3, 15]
20%
(15, +)
10%
Input Events
iq 1+iq
SAND
01/04/2007 ecs236 winter 2007 14
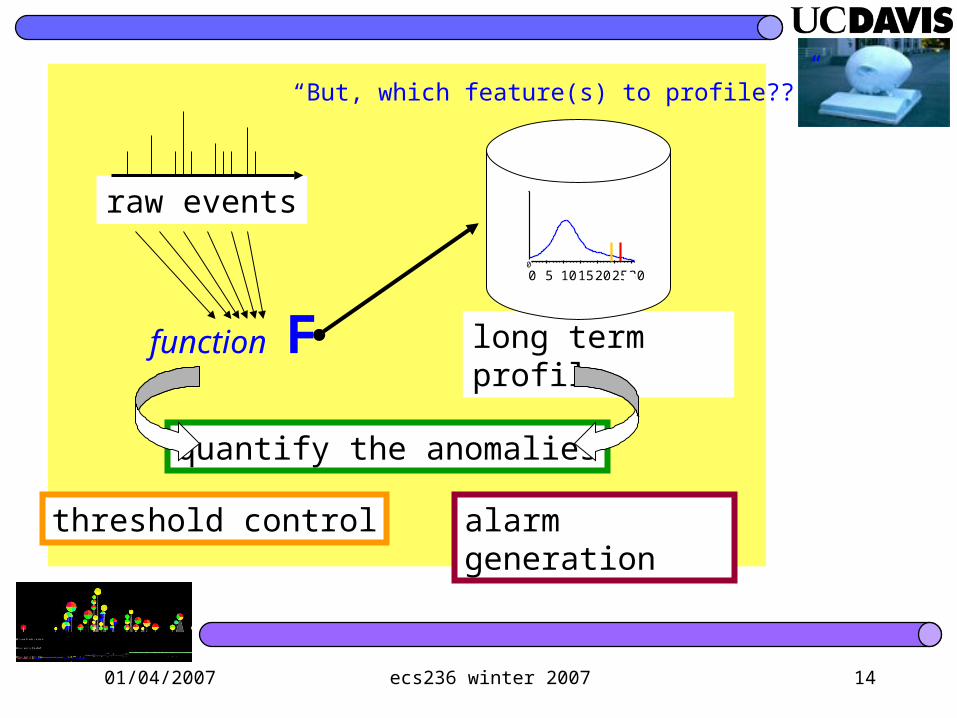
quantify the anomalies
alarm generation
threshold control
raw events
long term profile
0 5 10 15 20 25 300
“But, which feature(s) to profile??”
function F
01/04/2007 ecs236 winter 2007 15
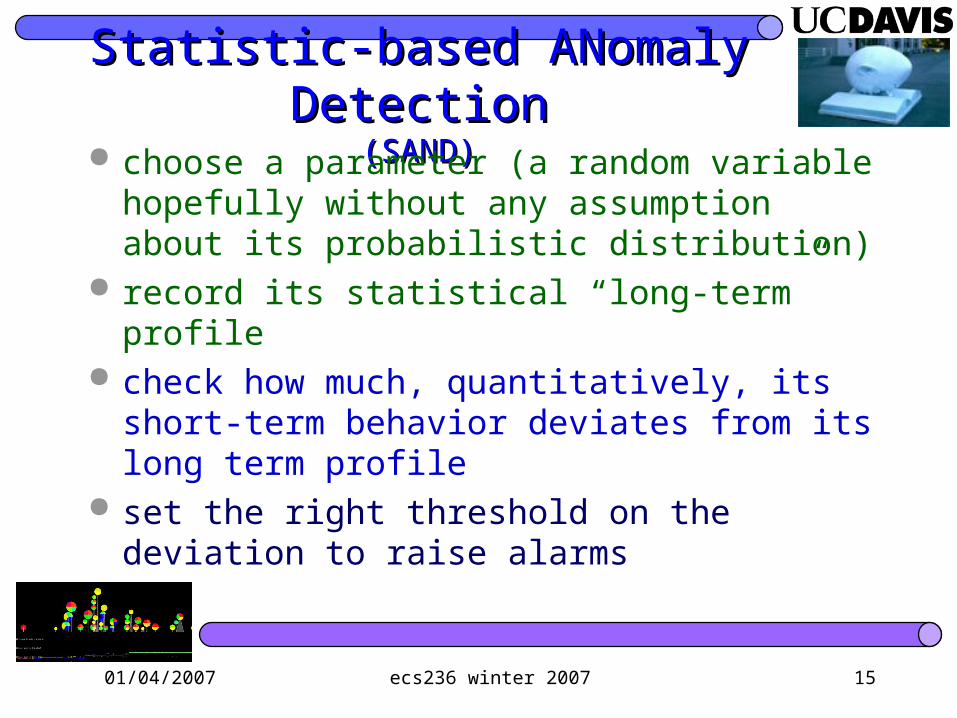
Statistic-based ANomaly DetectionStatistic-based ANomaly Detection(SAND)(SAND)
choose a parameter (a random variable hopefully without any assumption about its probabilistic distribution)
record its statistical “long-term” profile check how much, quantitatively, its short-term
behavior deviates from its long term profile set the right threshold on the deviation to raise
alarms
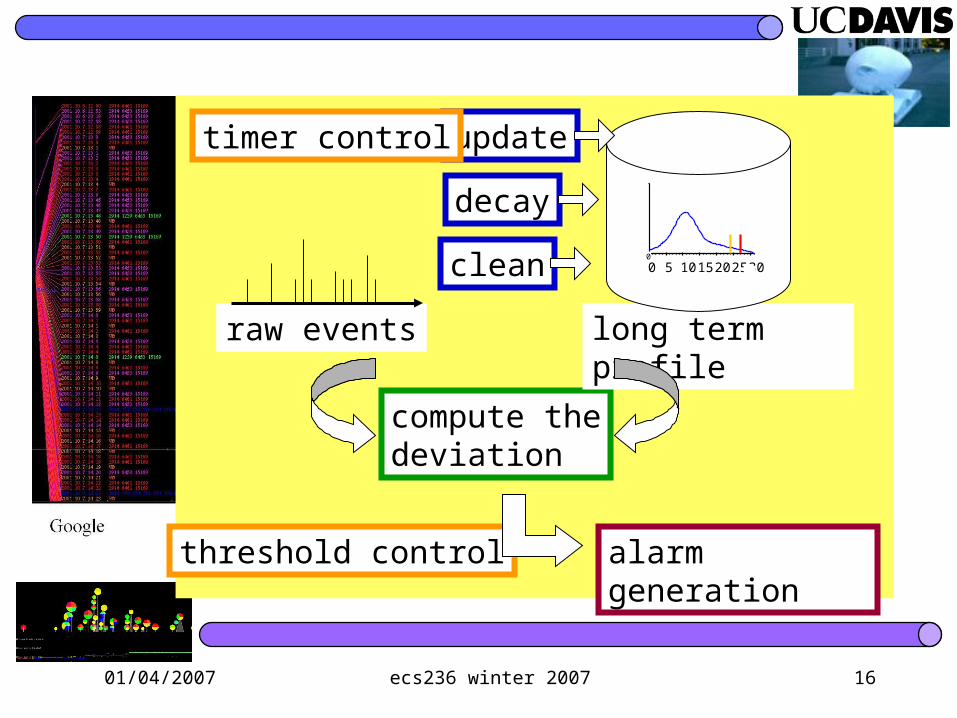
01/04/2007 ecs236 winter 2007 16
decay
update
clean
compute thedeviation
alarm generation
threshold control
timer control
raw events long term profile
0 5 10 15 20 25 300
01/04/2007 ecs236 winter 2007 17
False Positive & NegativeFalse Positive & Negative
Long term profile Quantitative measure of the deviation
between long term and target of detection Threshold-based control
01/04/2007 ecs236 winter 2007 18
Long-term ProfileLong-term Profile
Category, C-Training learn the aggregate distribution of a statistic
measure
Q Statistics, Q-Training
learn how much deviation is considered normal
Threshold
01/04/2007 ecs236 winter 2007 19
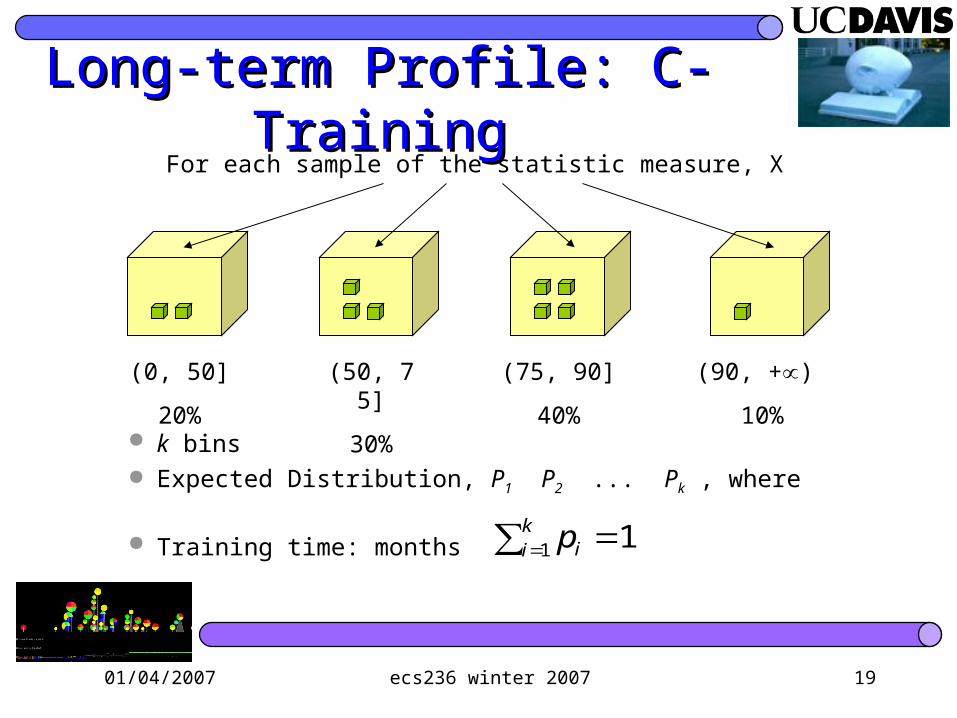
Long-term Profile: C-TrainingLong-term Profile: C-TrainingFor each sample of the statistic measure, X
(0, 50]
20%
(50, 75]
30%
(75, 90]
40%
(90, +)
10% k bins Expected Distribution, P1 P2 ... Pk , where
Training time: months ∑= =ki ip1 1
01/04/2007 ecs236 winter 2007 20
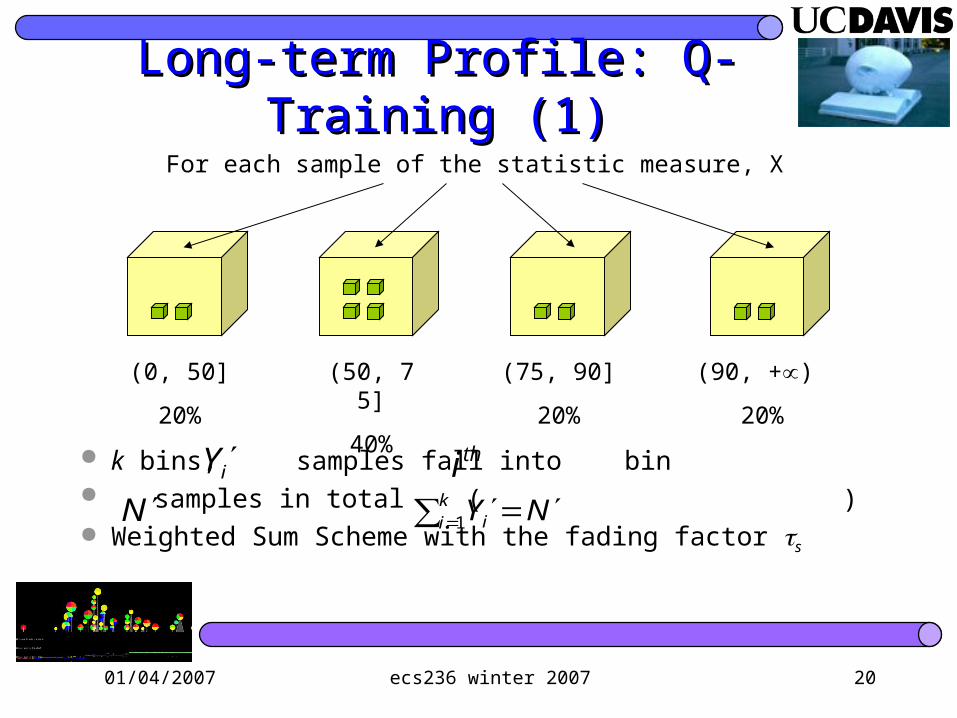
Long-term Profile: Q-Training (1)Long-term Profile: Q-Training (1)
For each sample of the statistic measure, X
(0, 50]
20%
(50, 75]
40%
(75, 90]
20%
(90, +)
20%
k bins, samples fall into bin samples in total ( ) Weighted Sum Scheme with the fading factor s
iY ′ thiN ′ ∑= ′=′k
i i NY1
01/04/2007 ecs236 winter 2007 21
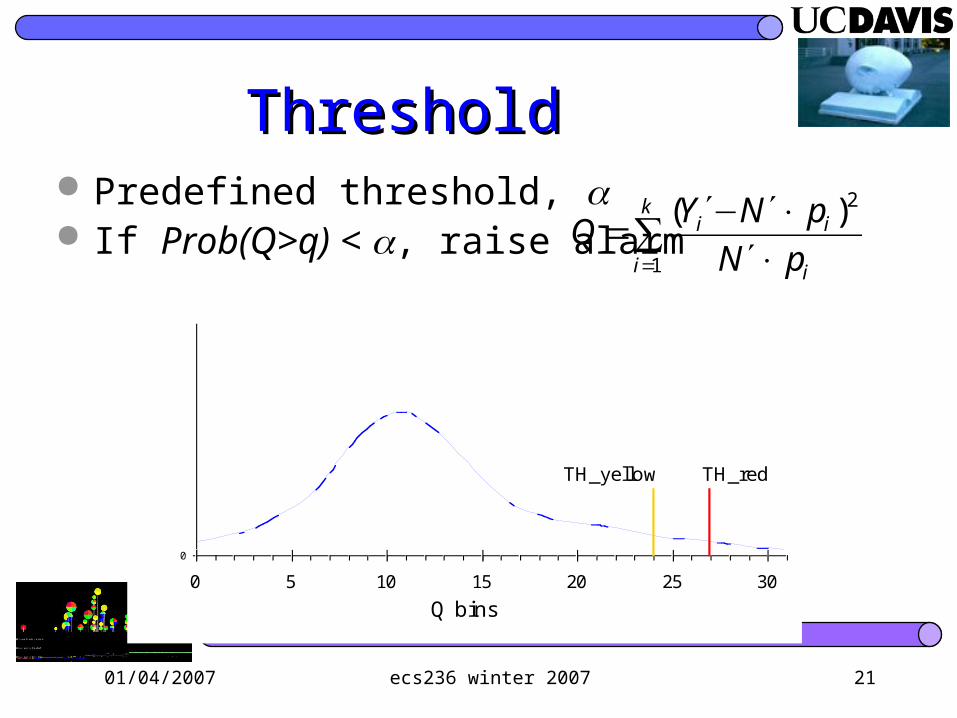
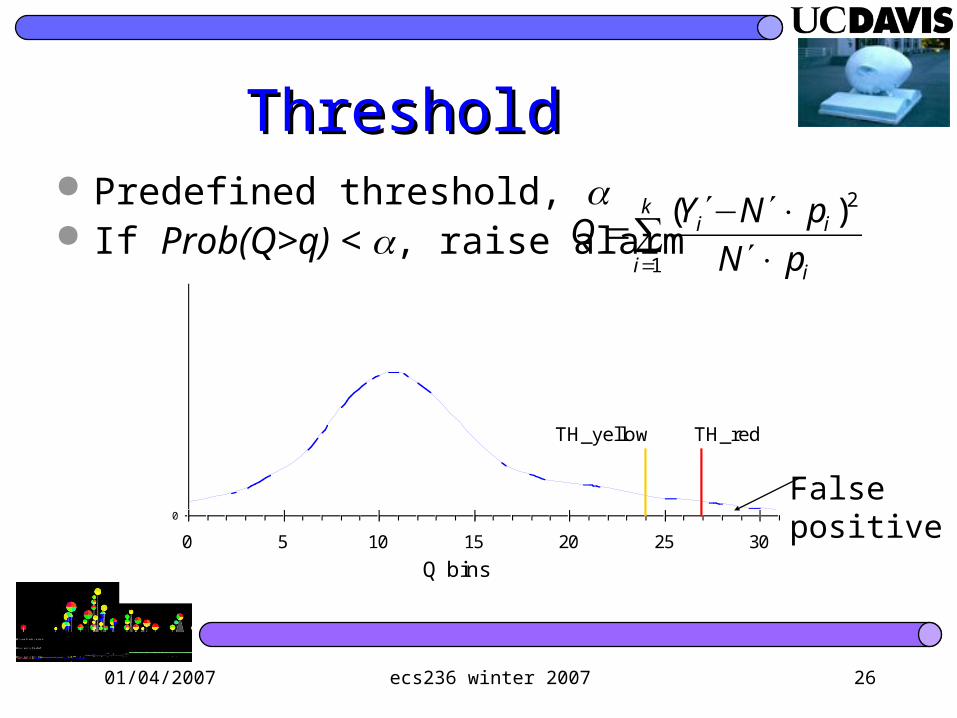
ThresholdThreshold Predefined threshold, If Prob(Q>q) < , raise alarm
0
0.08
0 5 10 15 20 25 30
Q bins
Probability TH_redTH_yellow
∑= ×′
×′−′=
k
i i
ii
pN
pNYQ
1
2)(
01/04/2007 ecs236 winter 2007 22
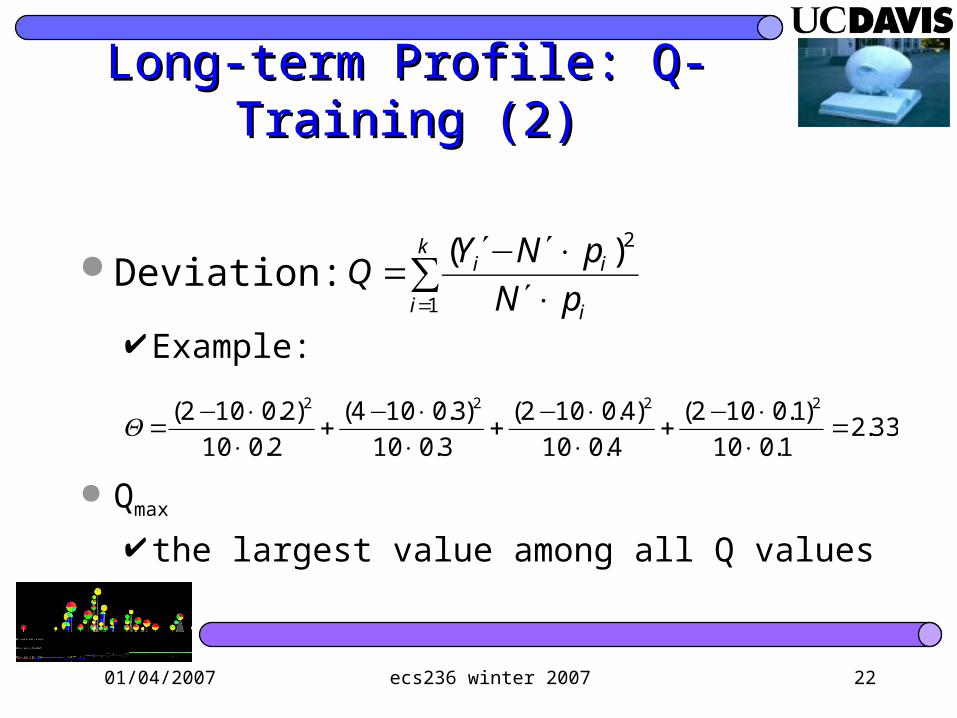
Long-term Profile: Q-Training (2)Long-term Profile: Q-Training (2)
Deviation:
Example:
Qmax
the largest value among all Q values
∑= ×′
×′−′=
k
i i
ii
pN
pNYQ
1
2)(
33.21.010
)1.0102(
4.010
)4.0102(
3.010
)3.0104(
2.010
)2.0102( 2222
=××−
+××−
+××−
+××−
=Q
01/04/2007 ecs236 winter 2007 23
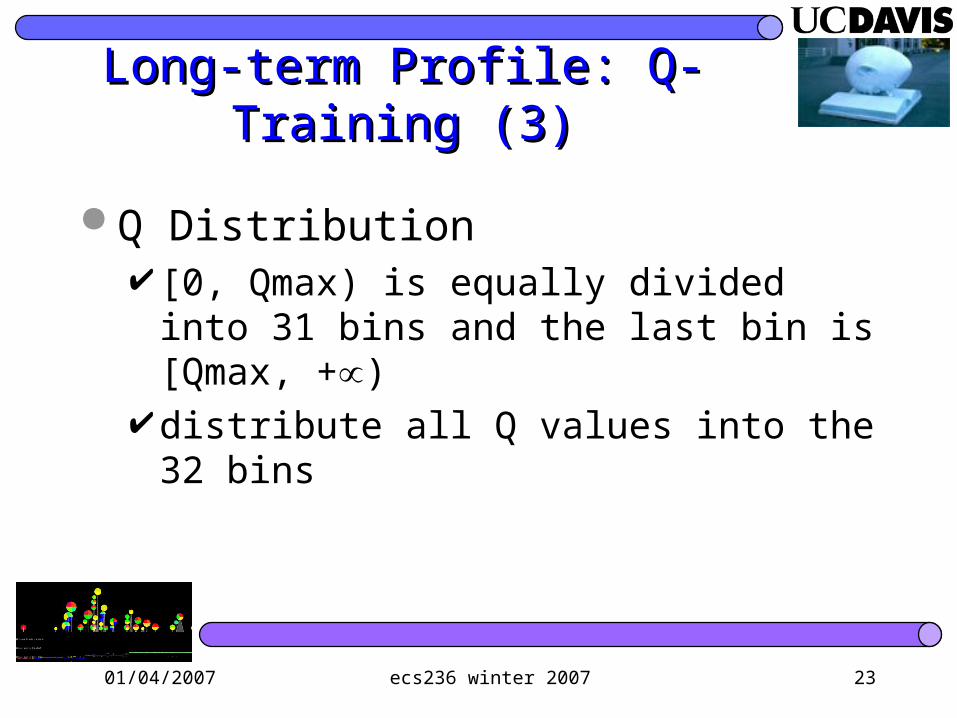
Long-term Profile: Q-Training (3)Long-term Profile: Q-Training (3)
Q Distribution [0, Qmax) is equally divided into 31 bins and
the last bin is [Qmax, +)distribute all Q values into the 32 bins

01/04/2007 ecs236 winter 2007 24
Q-MeasureQ-Measure
Deviation:
Example:
Qmax
the largest value among all Q values
∑= ×′
×′−′=
k
i i
ii
pN
pNYQ
1
2)(
33.21.010
)1.0102(
4.010
)4.0102(
3.010
)3.0104(
2.010
)2.0102( 2222
=××−
+××−
+××−
+××−
=Q
01/04/2007 ecs236 winter 2007 25
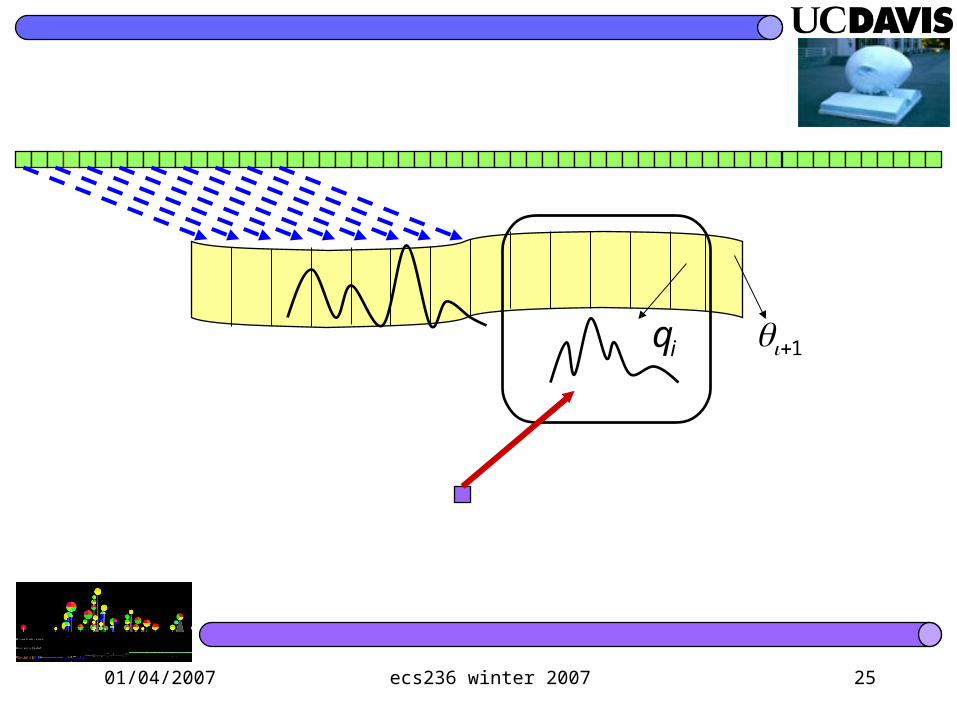
iq 1+iq
01/04/2007 ecs236 winter 2007 26
ThresholdThreshold Predefined threshold, If Prob(Q>q) < , raise alarm
0
0.08
0 5 10 15 20 25 30
Q bins
Probability TH_redTH_yellow
∑= ×′
×′−′=
k
i i
ii
pN
pNYQ
1
2)(
Falsepositive
01/04/2007 ecs236 winter 2007 27
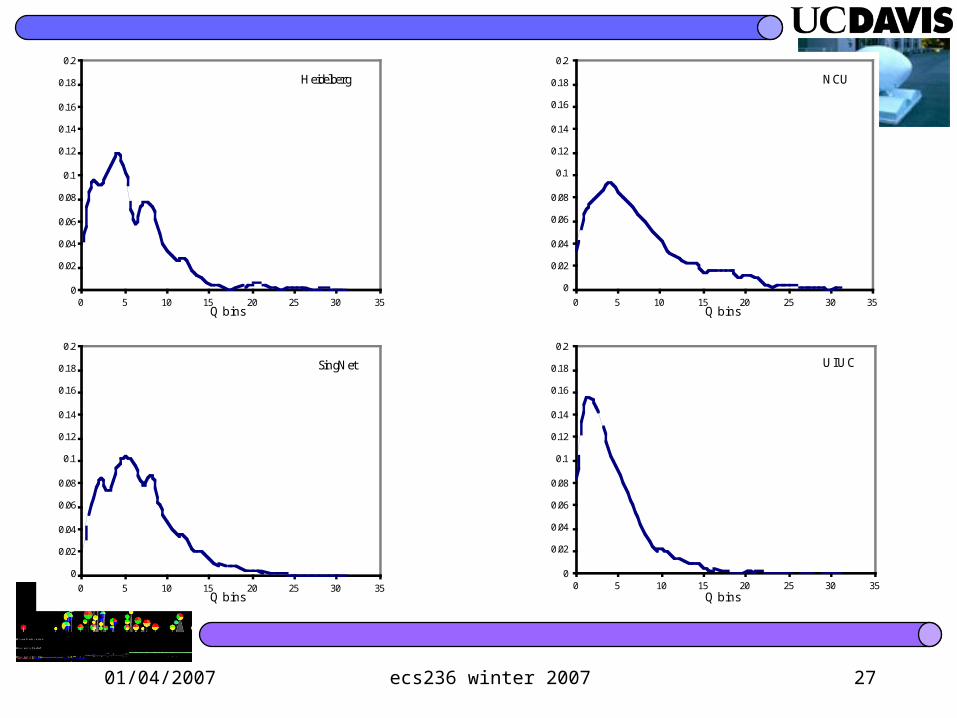
Heidelberg
0
0.02
0.04
0.06
0.08
0.1
0.12
0.14
0.16
0.18
0.2
0 5 10 15 20 25 30 35Q bins
Probability
NCU
0
0.02
0.04
0.06
0.08
0.1
0.12
0.14
0.16
0.18
0.2
0 5 10 15 20 25 30 35Q bins
Probability
SingNet
0
0.02
0.04
0.06
0.08
0.1
0.12
0.14
0.16
0.18
0.2
0 5 10 15 20 25 30 35Q bins
Probability
UIUC
0
0.02
0.04
0.06
0.08
0.1
0.12
0.14
0.16
0.18
0.2
0 5 10 15 20 25 30 35Q bins
Probability
01/04/2007 ecs236 winter 2007 28
MathematicsMathematics Many other techniques:
– Training/learning– detection
01/04/2007 ecs236 winter 2007 29
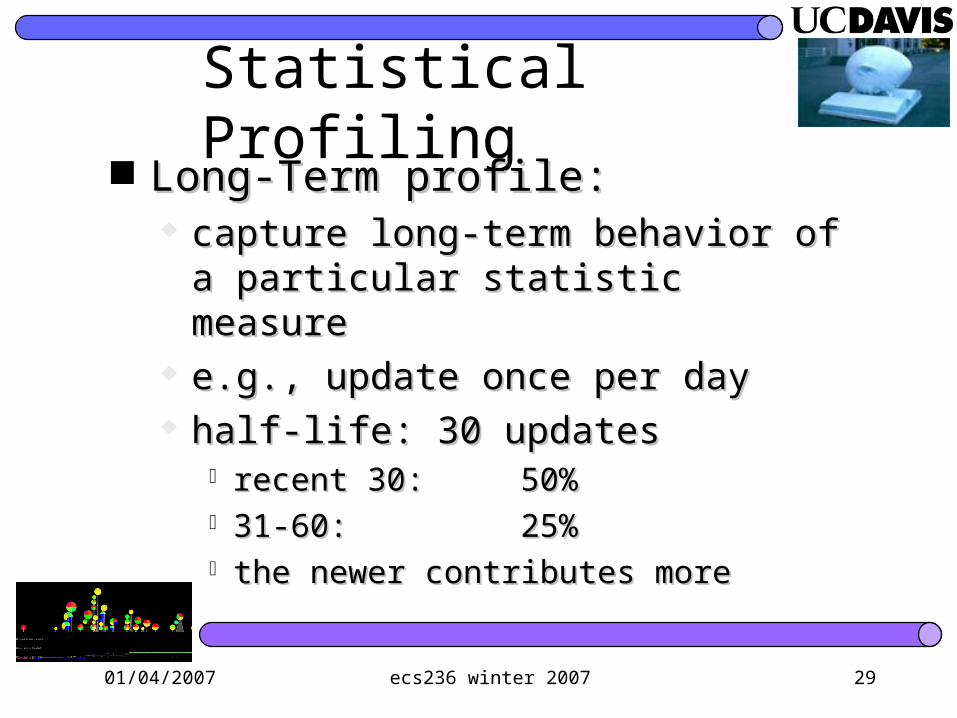
Statistical Profiling Long-Term profile:Long-Term profile:
capture long-term behavior of a particular capture long-term behavior of a particular statistic measurestatistic measure
e.g., update once per daye.g., update once per day half-life: 30 updateshalf-life: 30 updates
recent 30: recent 30: 50%50% 31-60: 31-60: 25%25% the newer contributes morethe newer contributes more
01/04/2007 ecs236 winter 2007 30
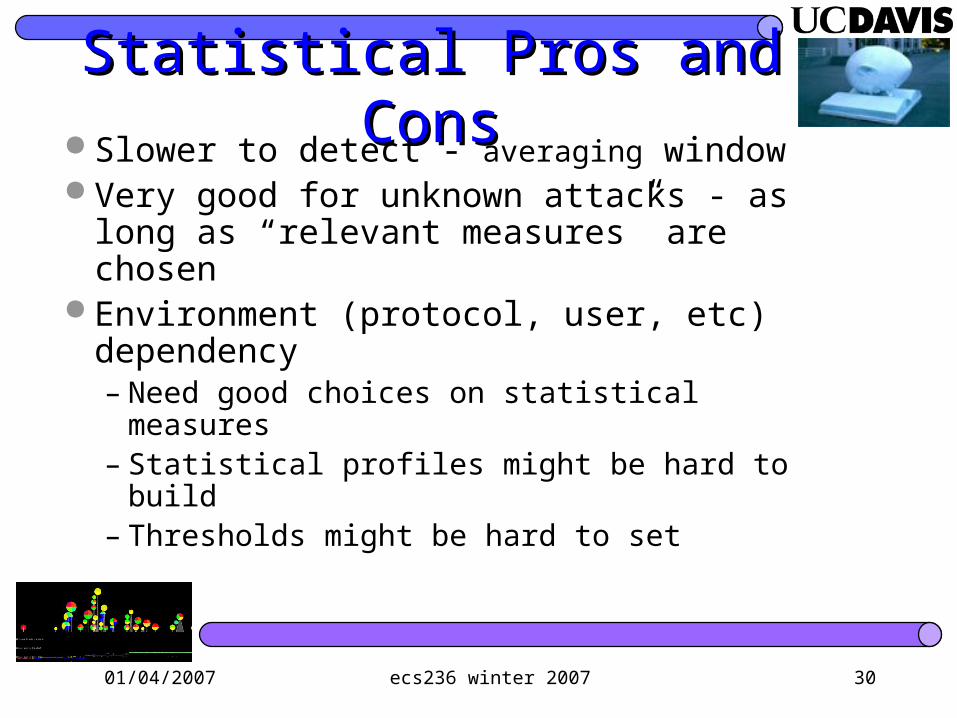
Statistical Pros and ConsStatistical Pros and Cons Slower to detect - averaging window Very good for unknown attacks - as long as
“relevant measures” are chosen Environment (protocol, user, etc)
dependency– Need good choices on statistical measures– Statistical profiles might be hard to build– Thresholds might be hard to set

01/04/2007 ecs236 winter 2007 31
decay
update
clean
compute thedeviation
alarm generation
threshold control
timer control
raw events long term profile
0 5 10 15 20 25 300

01/04/2007 ecs236 winter 2007 32
Weighted Sum SchemeWeighted Sum Scheme Problems of Sliding Window Scheme
Keep the most recent N pieces of audit records
required resource and computing time are O(N)
12
,2
12
1 +×==
≠×=
+×=
−=
−
−
∑
NYN
ijYY
YY
ki i
jj
ii
Assume K: number of bins Yi: count of audit records falls
into ith bin N: total number of audit records : fading factor
When Ei occurs, update
01/04/2007 ecs236 winter 2007 33
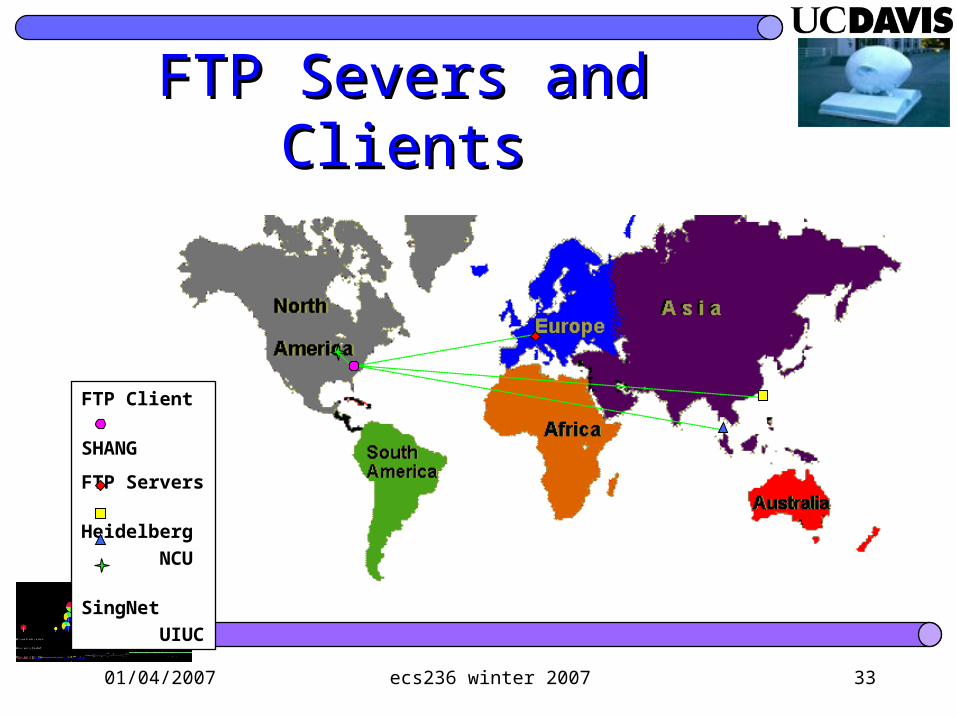
FTP Severs and ClientsFTP Severs and Clients
FTP Client
SHANG
FTP Servers
Heidelberg
NCU
SingNet
UIUC

01/04/2007 ecs236 winter 2007 34
Dropper AttacksDropper Attacks
P%P% Per (K,I,S)Ret (K,S)Ran (K)
Intentional or Unintentional??
01/04/2007 ecs236 winter 2007 35
Periodical Packet DroppingPeriodical Packet Dropping
Parameters (K, I, S) K, the total number of dropped packets in a connection I, the interval between two consecutive dropped packets S, the position of the first dropped packet.
Example (5, 10, 4) 5 packets dropped in total 1 every 10 packets start from the 4th packet The 4th, 14th, 24th, 34th and 44th packet will be dropped
01/04/2007 ecs236 winter 2007 36
Retransmission Packet DroppingRetransmission Packet Dropping
Parameters (K, S) K, the times of dropping the packet's retransmissions S, the position of the dropped packet
Example (5, 10) first, drops the 10th packet then, drops the retransmissions of the 10th packet 5
times
01/04/2007 ecs236 winter 2007 37
Random Packet DroppingRandom Packet Dropping
Parameters (K) K, the total number of packets to be dropped in a
connection
Example (5) randomly drops 5 packets in a connection
01/04/2007 ecs236 winter 2007 38
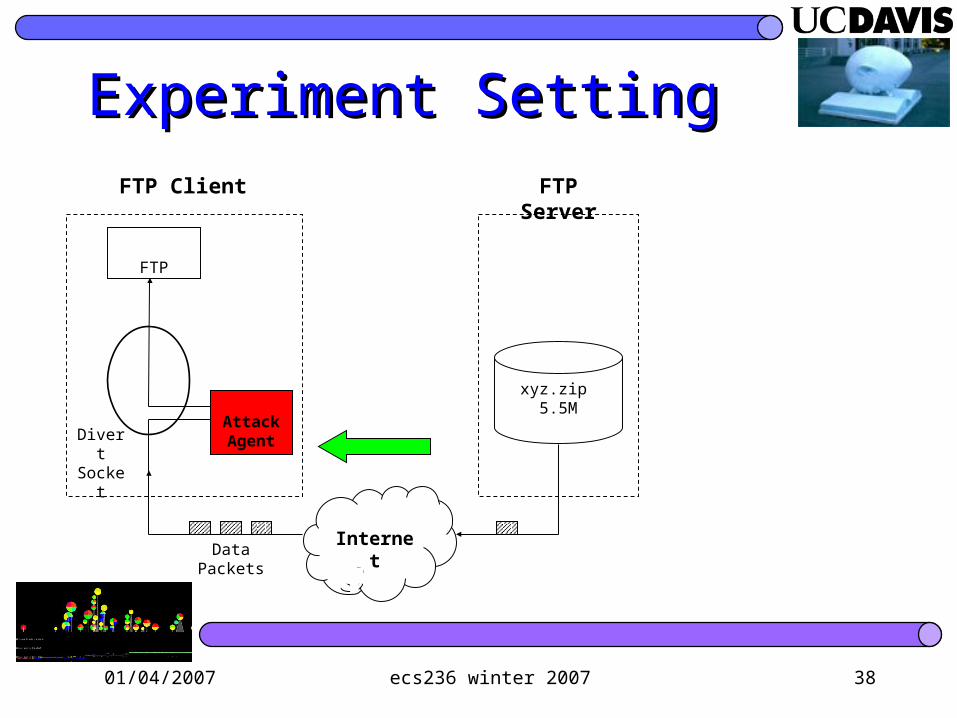
Experiment SettingExperiment Setting
FTP
Internet
Divert Socket
FTP Client
xyz.zip 5.5M
FTP Server
Attack Agent
Data Packets
01/04/2007 ecs236 winter 2007 39
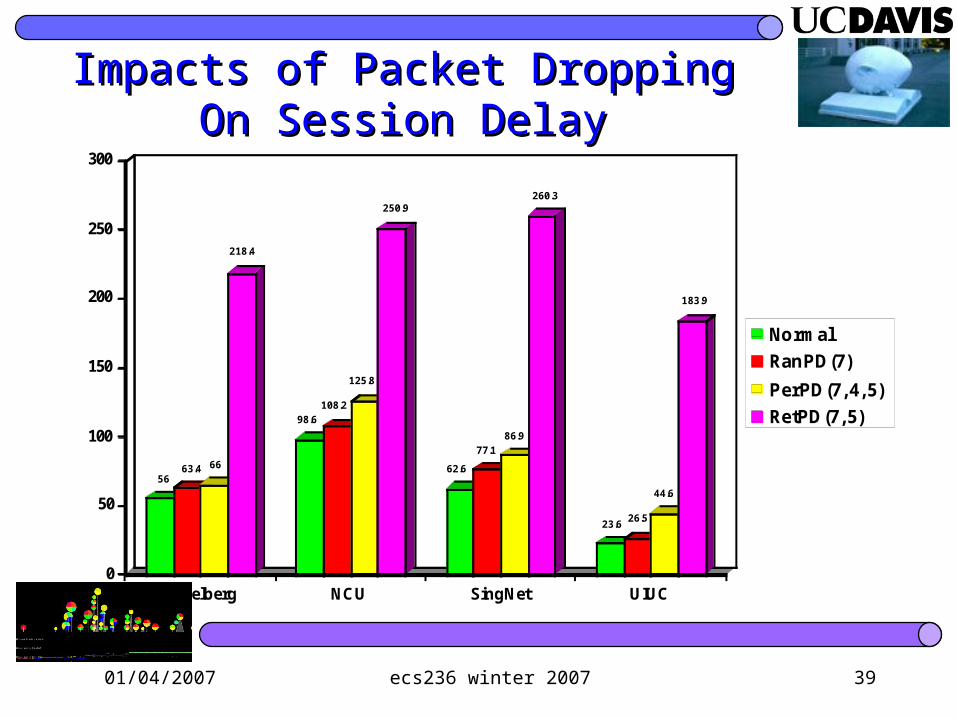
Impacts of Packet Dropping On Impacts of Packet Dropping On Session DelaySession Delay
5663.4 66
218.4
98.6
108.2
125.8
250.9
62.6
77.1
86.9
260.3
23.626.5
44.6
183.9
0
50
100
150
200
250
300
Session Delay (s)
Heidelberg NCU SingNet UIUC
Normal
RanPD(7)
PerPD(7, 4, 5)
RetPD(7, 5)
01/04/2007 ecs236 winter 2007 40
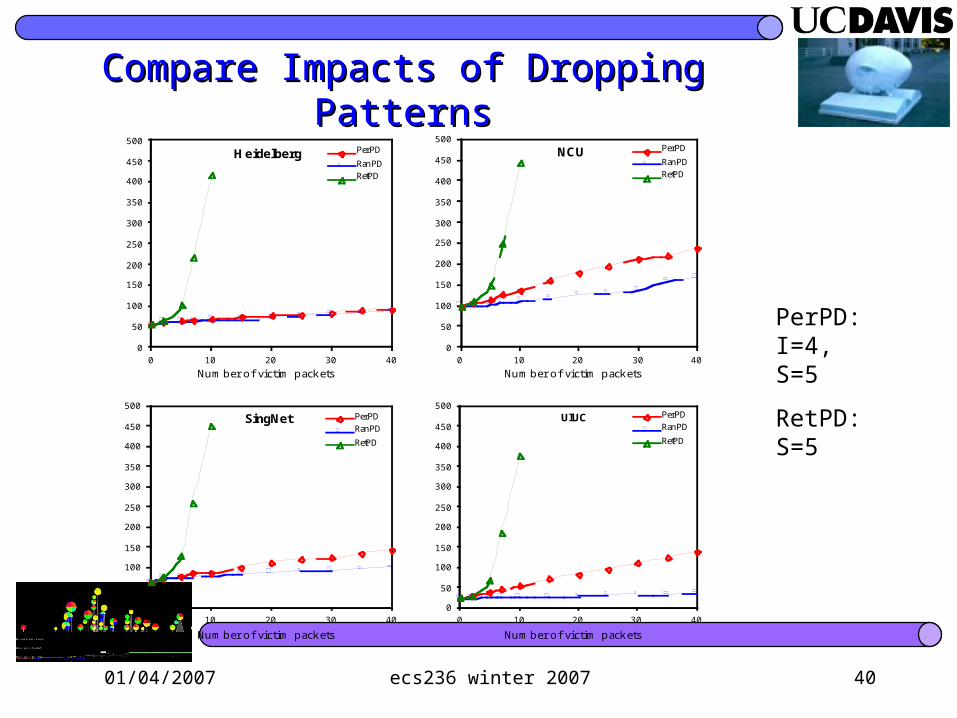
Compare Impacts of Dropping Compare Impacts of Dropping PatternsPatterns
0
50
0
-10 40
Num ber
Session
He ide lbe rg
0
50
100
150
200
250
300
350
400
450
500
0 10 20 30 40
Nu m b er o f victim p ack ets
Session delay
PerPD
RanPD
RetPD
NCU
0
50
100
150
200
250
300
350
400
450
500
0 10 20 30 40
Nu m b er o f victim p ack ets
Session delay
PerPD
RanPD
RetPD
SingNe t
0
50
100
150
200
250
300
350
400
450
500
0 10 20 30 40
Nu m b er o f victim p ack ets
Session delay
PerPD
RanPD
RetPD
UIUC
0
50
100
150
200
250
300
350
400
450
500
0 10 20 30 40
Nu m b er o f victim p ack ets
Session delay
PerPD
RanPD
RetPD
PerPD: I=4, S=5
RetPD: S=5
01/04/2007 ecs236 winter 2007 41
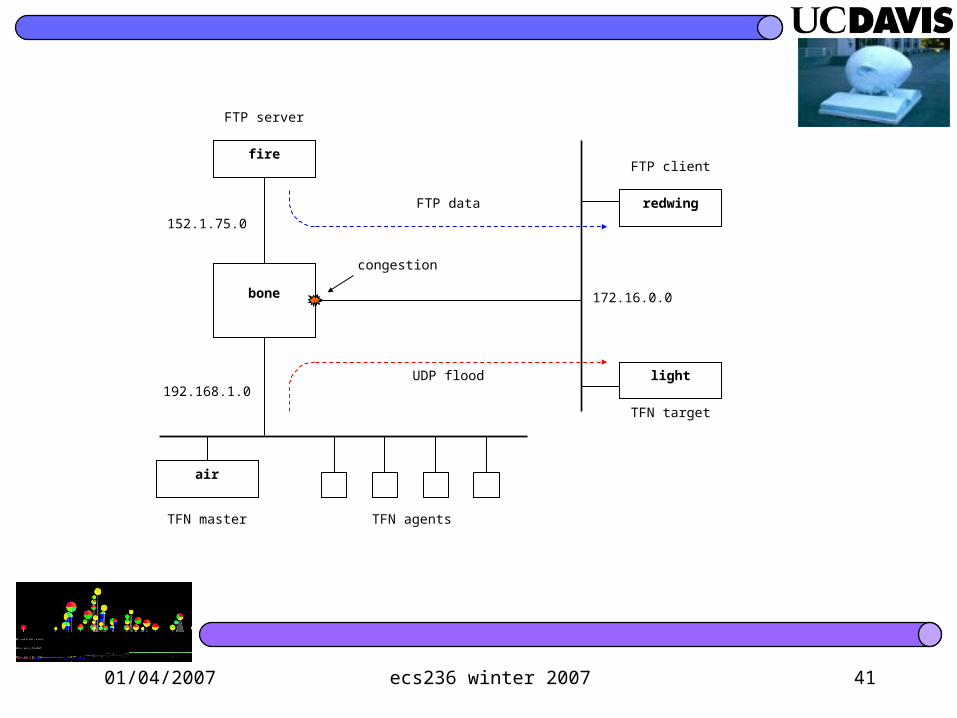
bone
fire
redwing
light
152.1.75.0
192.168.1.0
172.16.0.0
UDP flood
FTP data
TFN agents
TFN target
FTP client
FTP server
congestion
air
TFN master
01/04/2007 ecs236 winter 2007 42
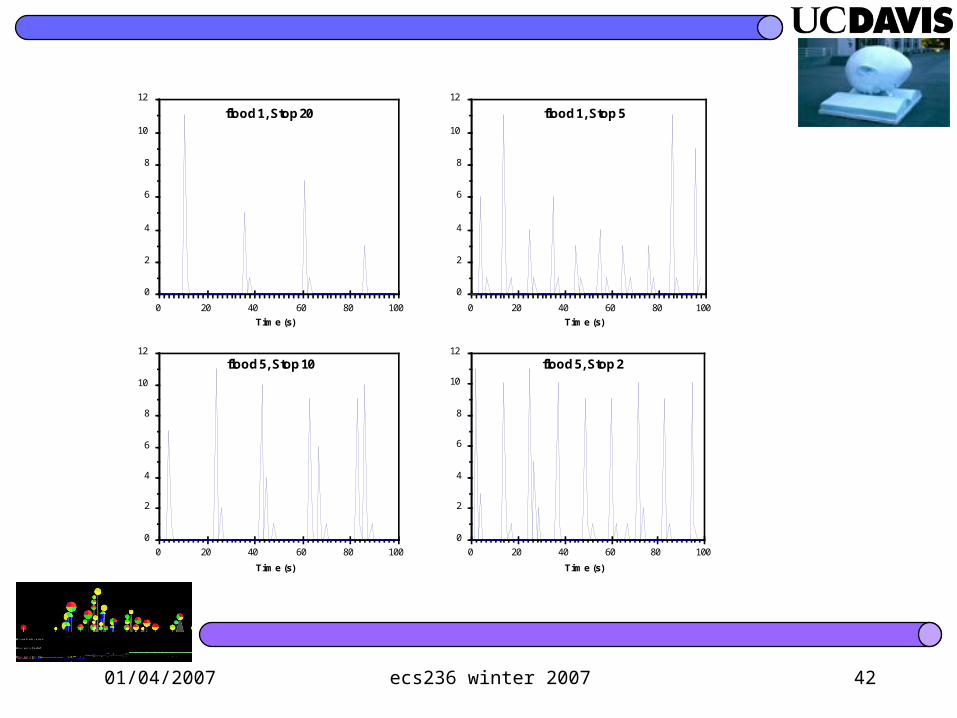
flood 1, Stop 20
0
2
4
6
8
10
12
0 20 40 60 80 100
Time (s)
Number of Lost Packets
flood 1, Stop 5
0
2
4
6
8
10
12
0 20 40 60 80 100
Time (s)
Number of Lost Packets
flood 5, Stop 10
0
2
4
6
8
10
12
0 20 40 60 80 100
Time (s)
Number of Lost Packets
flood 5, Stop 2
0
2
4
6
8
10
12
0 20 40 60 80 100
Time (s)
Number of Lost Packets
01/04/2007 ecs236 winter 2007 43
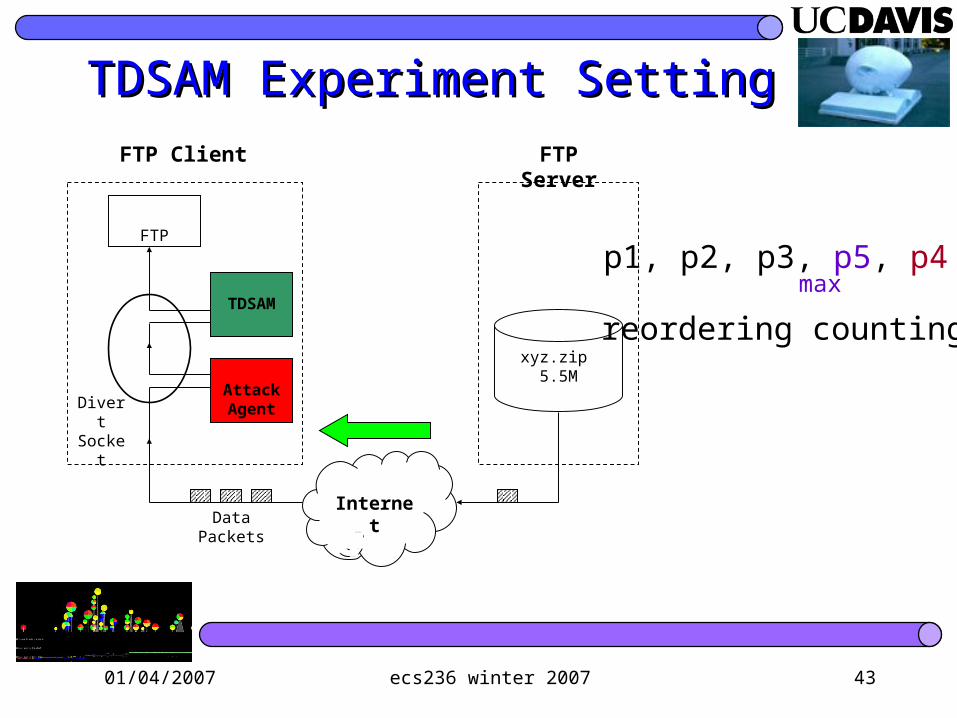
TDSAM Experiment SettingTDSAM Experiment Setting
FTP
Internet
Divert Socket
FTP Client
xyz.zip 5.5M
FTP Server
Attack Agent
TDSAM
Data Packets
p1, p2, p3, p5, p4max
reordering counting
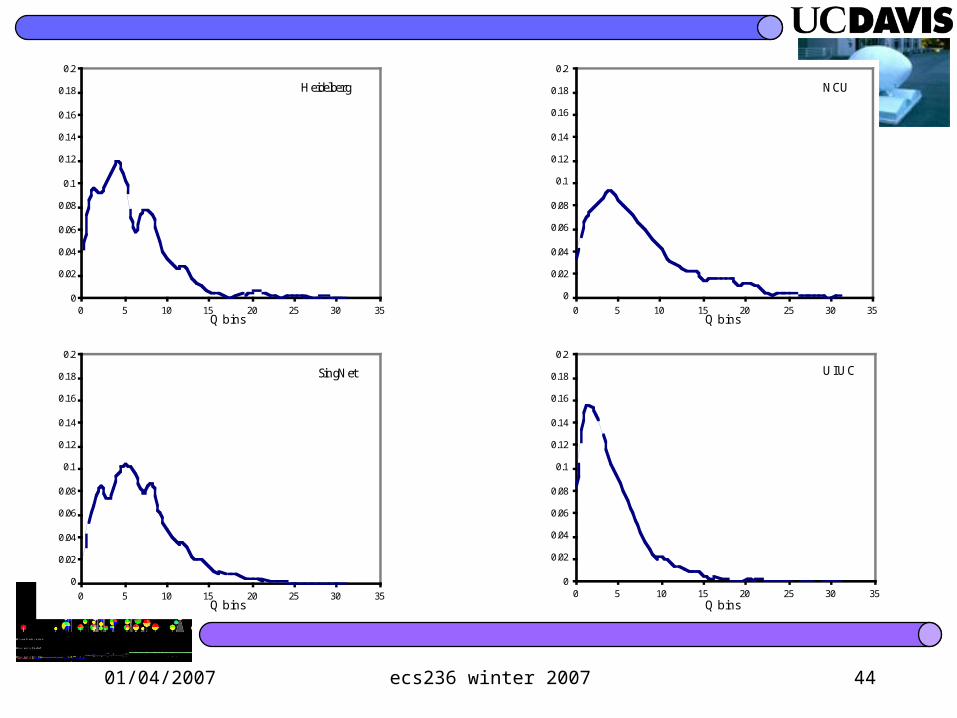
01/04/2007 ecs236 winter 2007 44
Heidelberg
0
0.02
0.04
0.06
0.08
0.1
0.12
0.14
0.16
0.18
0.2
0 5 10 15 20 25 30 35Q bins
Probability
NCU
0
0.02
0.04
0.06
0.08
0.1
0.12
0.14
0.16
0.18
0.2
0 5 10 15 20 25 30 35Q bins
Probability
SingNet
0
0.02
0.04
0.06
0.08
0.1
0.12
0.14
0.16
0.18
0.2
0 5 10 15 20 25 30 35Q bins
Probability
UIUC
0
0.02
0.04
0.06
0.08
0.1
0.12
0.14
0.16
0.18
0.2
0 5 10 15 20 25 30 35Q bins
Probability
01/04/2007 ecs236 winter 2007 45
He ide lbe rg
0
0.05
0.1
0.15
0.2
0.25
0.3
0 5 10 15 20 25 30 35
Q bins
Probability
NCU
0
0.05
0.1
0.15
0.2
0.25
0.3
0 5 10 15 20 25 30 35
Q bins
Probability
SingNet
0
0.05
0.1
0.15
0.2
0.25
0.3
0 5 10 15 20 25 30 35
Q bins
Probability
UIUC
0
0.05
0.1
0.15
0.2
0.25
0.3
0 5 10 15 20 25 30 35
Q bins
Probability
01/04/2007 ecs236 winter 2007 46
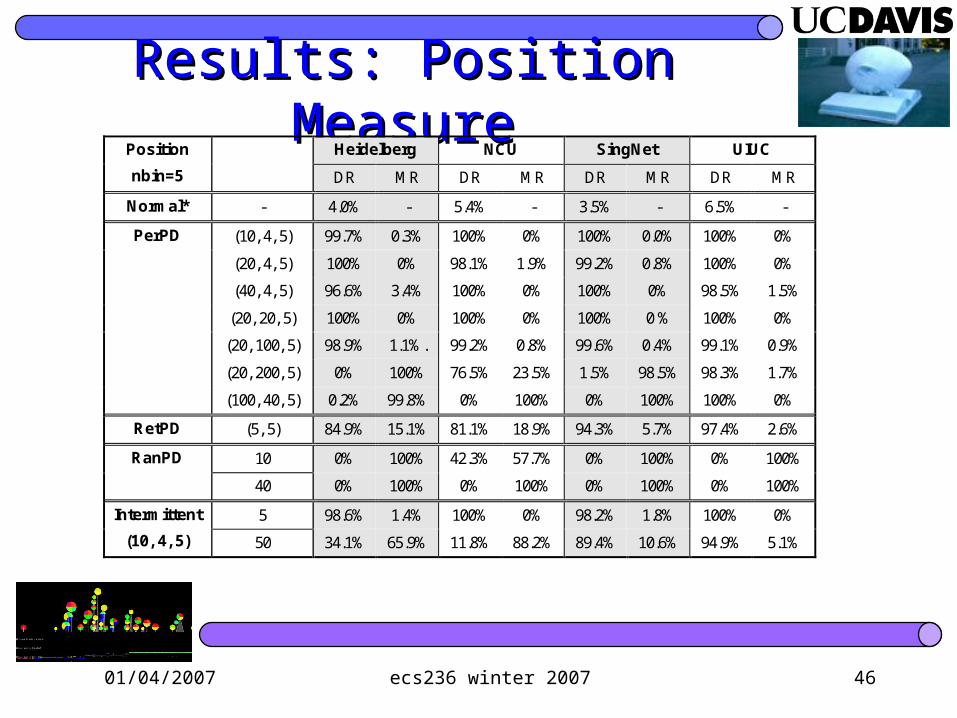
Results: Position MeasureResults: Position MeasureHeidelberg NCU SingNet UIUCPosition
nbin=5 DR MR DR MR DR MR DR MR
Normal* - 4.0% - 5.4% - 3.5% - 6.5% -
(10, 4, 5) 99.7% 0.3% 100% 0% 100% 0.0% 100% 0%
(20, 4, 5) 100% 0% 98.1% 1.9% 99.2% 0.8% 100% 0%
(40, 4, 5) 96.6% 3.4% 100% 0% 100% 0% 98.5% 1.5%
(20, 20, 5) 100% 0% 100% 0% 100% 0 % 100% 0%
(20, 100, 5) 98.9% 1.1%. 99.2% 0.8% 99.6% 0.4% 99.1% 0.9%
(20, 200, 5) 0% 100% 76.5% 23.5% 1.5% 98.5% 98.3% 1.7%
PerPD
(100, 40, 5) 0.2% 99.8% 0% 100% 0% 100% 100% 0%
RetPD (5, 5) 84.9% 15.1% 81.1% 18.9% 94.3% 5.7% 97.4% 2.6%
10 0% 100% 42.3% 57.7% 0% 100% 0% 100%RanPD
40 0% 100% 0% 100% 0% 100% 0% 100%
5 98.6% 1.4% 100% 0% 98.2% 1.8% 100% 0%Intermittent
(10, 4, 5) 50 34.1% 65.9% 11.8% 88.2% 89.4% 10.6% 94.9% 5.1%
01/04/2007 ecs236 winter 2007 47
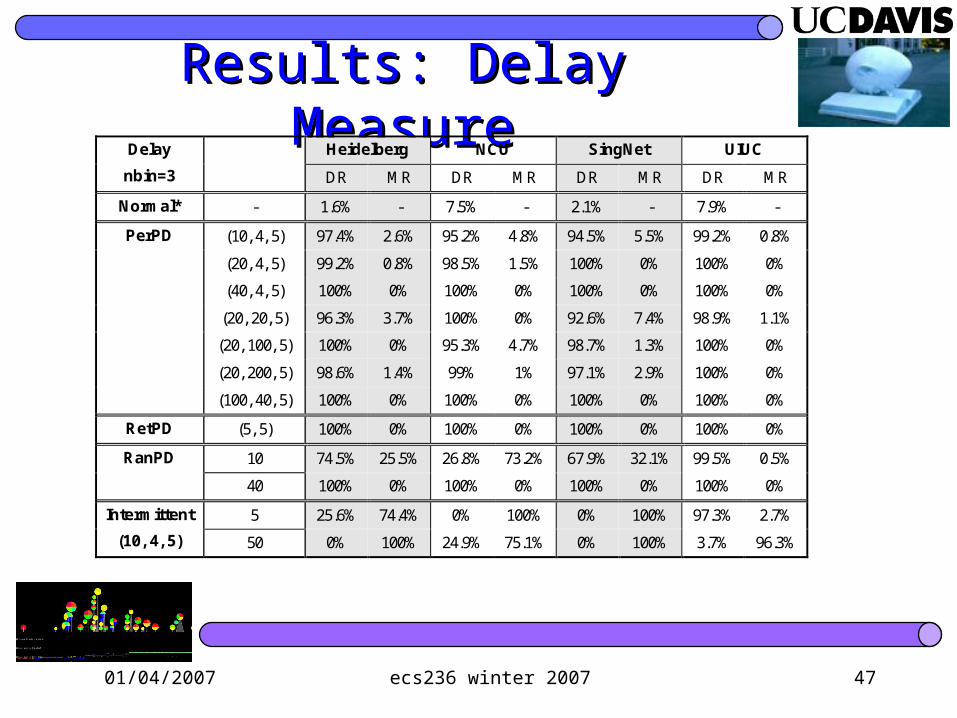
Results: Delay MeasureResults: Delay MeasureHeidelberg NCU SingNet UIUCDelay
nbin=3 DR MR DR MR DR MR DR MR
Normal* - 1.6% - 7.5% - 2.1% - 7.9% -
(10, 4, 5) 97.4% 2.6% 95.2% 4.8% 94.5% 5.5% 99.2% 0.8%
(20, 4, 5) 99.2% 0.8% 98.5% 1.5% 100% 0% 100% 0%
(40, 4, 5) 100% 0% 100% 0% 100% 0% 100% 0%
(20, 20, 5) 96.3% 3.7% 100% 0% 92.6% 7.4% 98.9% 1.1%
(20, 100, 5) 100% 0% 95.3% 4.7% 98.7% 1.3% 100% 0%
(20, 200, 5) 98.6% 1.4% 99% 1% 97.1% 2.9% 100% 0%
PerPD
(100, 40, 5) 100% 0% 100% 0% 100% 0% 100% 0%
RetPD (5, 5) 100% 0% 100% 0% 100% 0% 100% 0%
10 74.5% 25.5% 26.8% 73.2% 67.9% 32.1% 99.5% 0.5%RanPD
40 100% 0% 100% 0% 100% 0% 100% 0%
5 25.6% 74.4% 0% 100% 0% 100% 97.3% 2.7%Intermittent
(10, 4, 5) 50 0% 100% 24.9% 75.1% 0% 100% 3.7% 96.3%
01/04/2007 ecs236 winter 2007 48
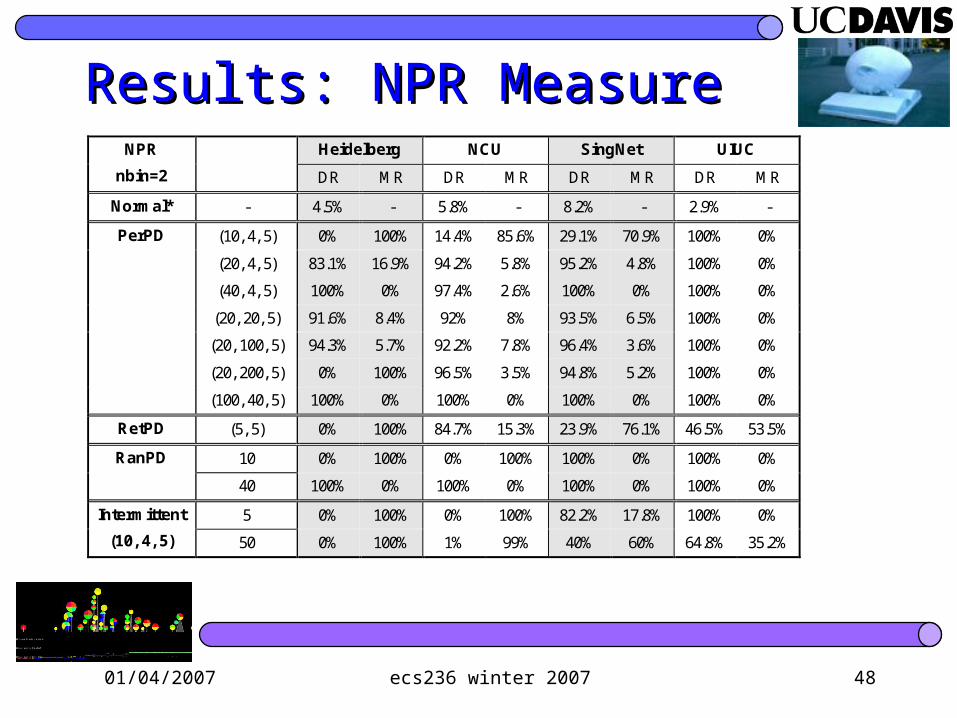
Results: NPR MeasureResults: NPR MeasureHeidelberg NCU SingNet UIUCNPR
nbin=2 DR MR DR MR DR MR DR MR
Normal* - 4.5% - 5.8% - 8.2% - 2.9% -
(10, 4, 5) 0% 100% 14.4% 85.6% 29.1% 70.9% 100% 0%
(20, 4, 5) 83.1% 16.9% 94.2% 5.8% 95.2% 4.8% 100% 0%
(40, 4, 5) 100% 0% 97.4% 2.6% 100% 0% 100% 0%
(20, 20, 5) 91.6% 8.4% 92% 8% 93.5% 6.5% 100% 0%
(20, 100, 5) 94.3% 5.7% 92.2% 7.8% 96.4% 3.6% 100% 0%
(20, 200, 5) 0% 100% 96.5% 3.5% 94.8% 5.2% 100% 0%
PerPD
(100, 40, 5) 100% 0% 100% 0% 100% 0% 100% 0%
RetPD (5, 5) 0% 100% 84.7% 15.3% 23.9% 76.1% 46.5% 53.5%
10 0% 100% 0% 100% 100% 0% 100% 0%RanPD
40 100% 0% 100% 0% 100% 0% 100% 0%
5 0% 100% 0% 100% 82.2% 17.8% 100% 0%Intermittent
(10, 4, 5) 50 0% 100% 1% 99% 40% 60% 64.8% 35.2%
01/04/2007 ecs236 winter 2007 49
Results (good and bad)Results (good and bad)
False Alarm Rate less than 10% in most cases, the highest is 17.4%
Detection Rate Position: good on RetPD and most of PerPD
at NCU, 98.7% for PerPD(20,4,5), but 0% for PerPD(100, 40, 5) in which dropped packets are evenly distributed
Delay: good on those significantly change session delay, e.g., RetPD, PerPD with a large value of K
at SingNet, 100% for RetPD(5,5), but 67.9% for RanPD(10)
NPR: good on those dropping many packets at Heidelberg, 0% for RanPD(10), but 100% for RanPD(40)
01/04/2007 ecs236 winter 2007 50
Performance AnalysisPerformance Analysis
Good sites correspond to a high detection rate. stable and small session delay or packet reordering
e.g., using Delay Measure for RanPD(10): UIUC (99.5%) >
Heidelberg(74.5%) > SingNet (67.9%) > NCU (26.8%)
How to choose the value of nbin is site-specific e.g., using Position Measure, lowest false alarm rate occurs when
nbin= 5 at Heidelberg(4.0%) and NCU(5.4%), 10 at UIUC(4.5%) and
20 at SingNet(1.6%)

01/04/2007 ecs236 winter 2007 51
decay
update
clean
compute thedeviation
alarm generation
threshold control
timer control
raw events long term profile
0 5 10 15 20 25 300
01/04/2007 ecs236 winter 2007 52
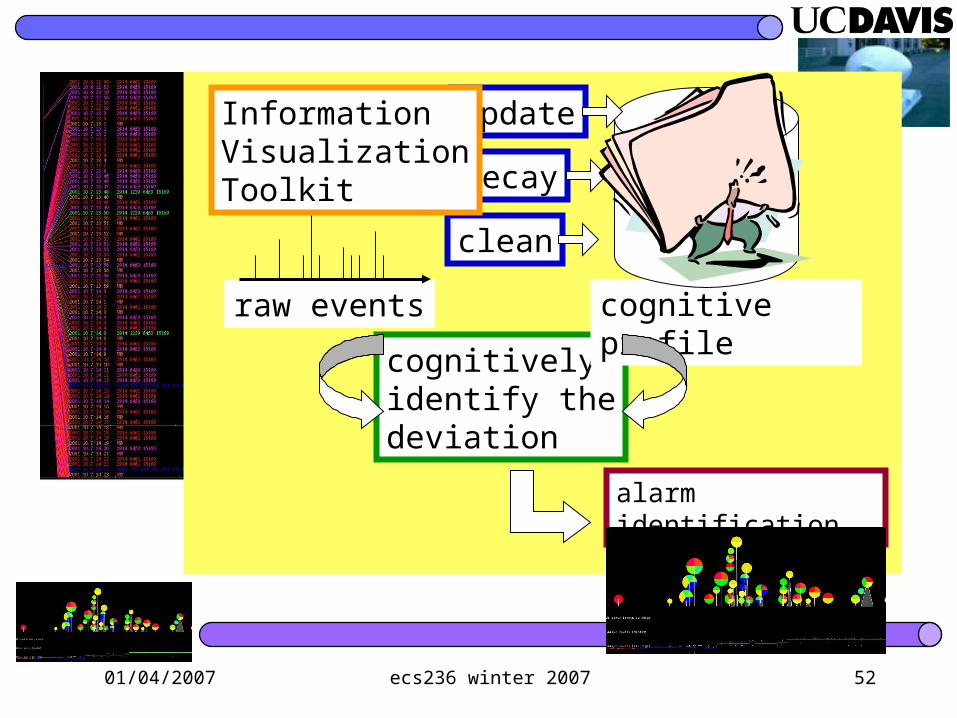
decay
update
clean
cognitivelyidentify thedeviation
alarm identification
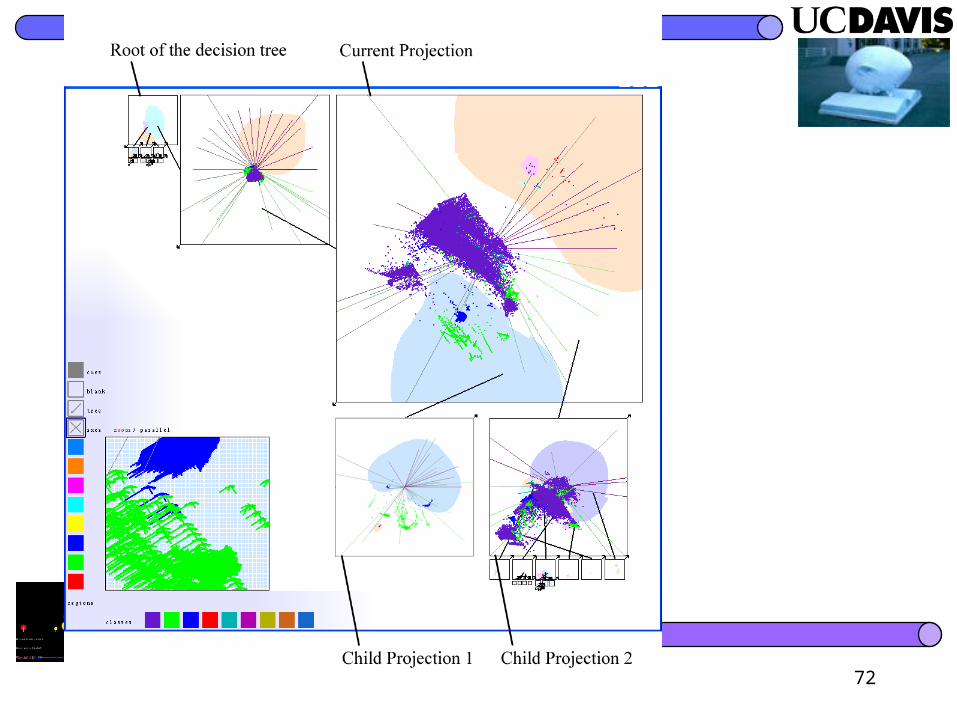
InformationVisualizationToolkit
raw events cognitive profile

01/04/2007 ecs236 winter 2007 53
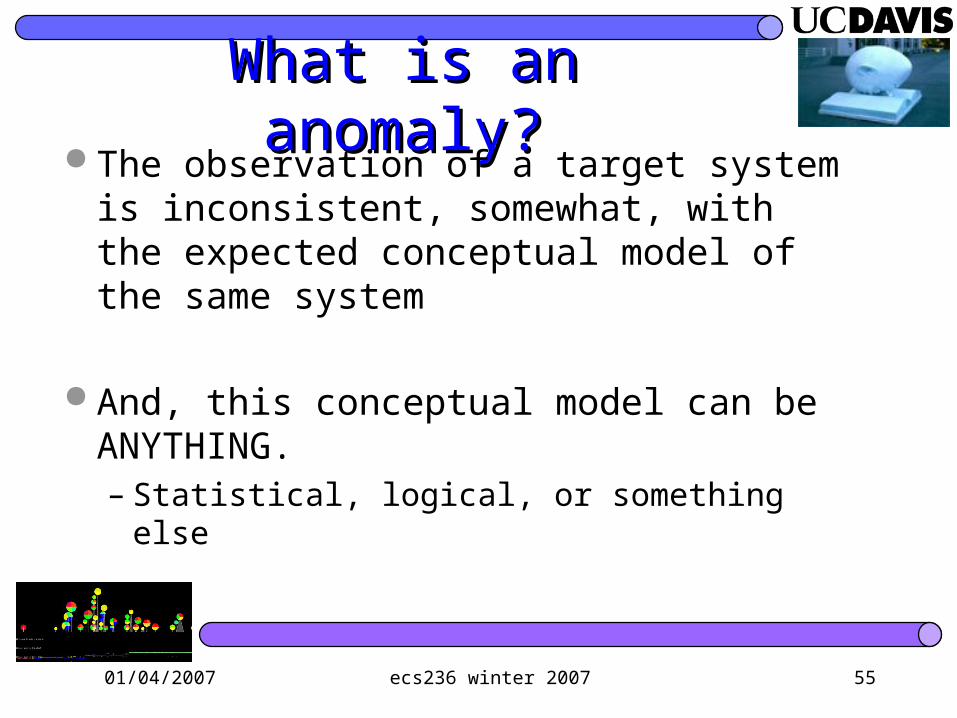
What is an anomaly?What is an anomaly?

01/04/2007 ecs236 winter 2007 54
What is an anomaly?What is an anomaly? The observation of a target system is
inconsistent, somewhat, with the expected conceptual model of the same system
01/04/2007 ecs236 winter 2007 55
What is an anomaly?What is an anomaly? The observation of a target system is
inconsistent, somewhat, with the expected conceptual model of the same system
And, this conceptual model can be ANYTHING.– Statistical, logical, or something else
01/04/2007 ecs236 winter 2007 56
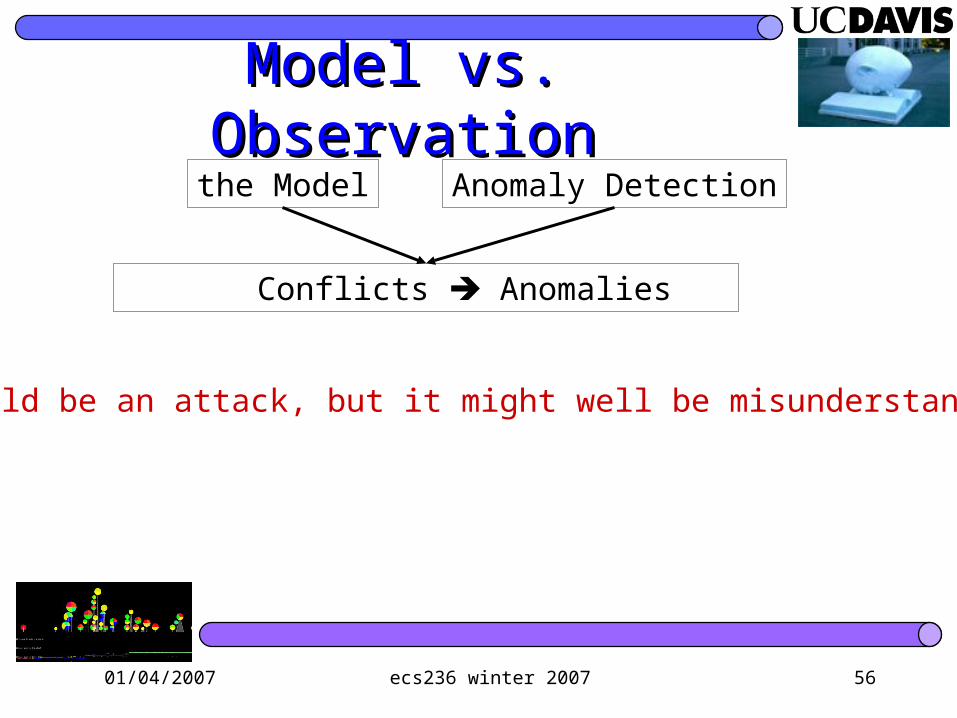
Model vs. ObservationModel vs. Observationthe Model Anomaly Detection
Conflicts Anomalies
It could be an attack, but it might well be misunderstanding!!
01/04/2007 ecs236 winter 2007 57
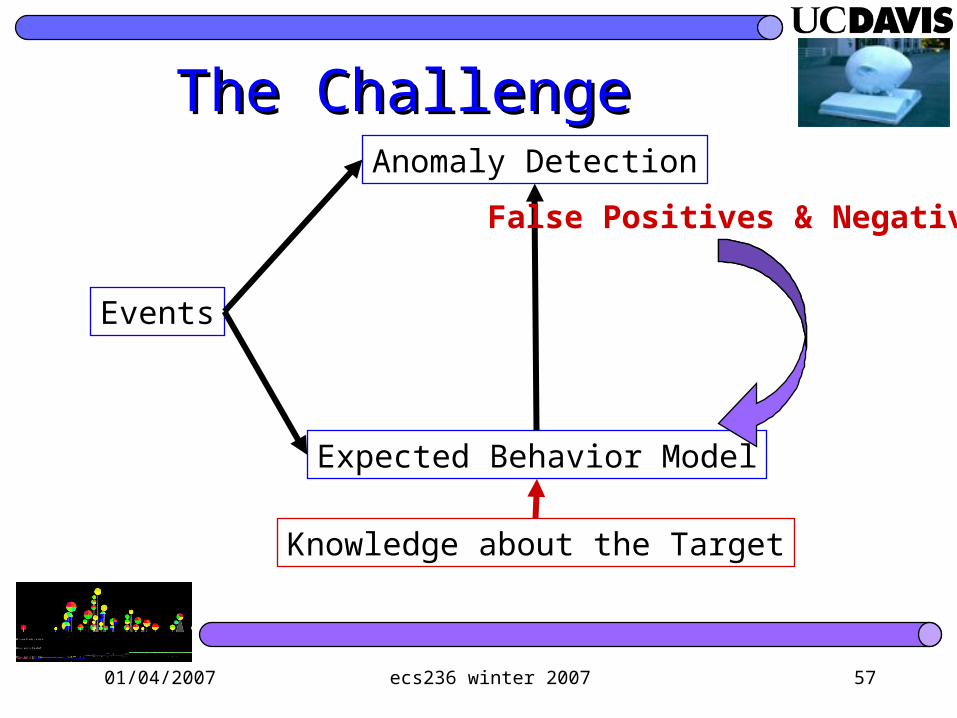
The ChallengeThe Challenge
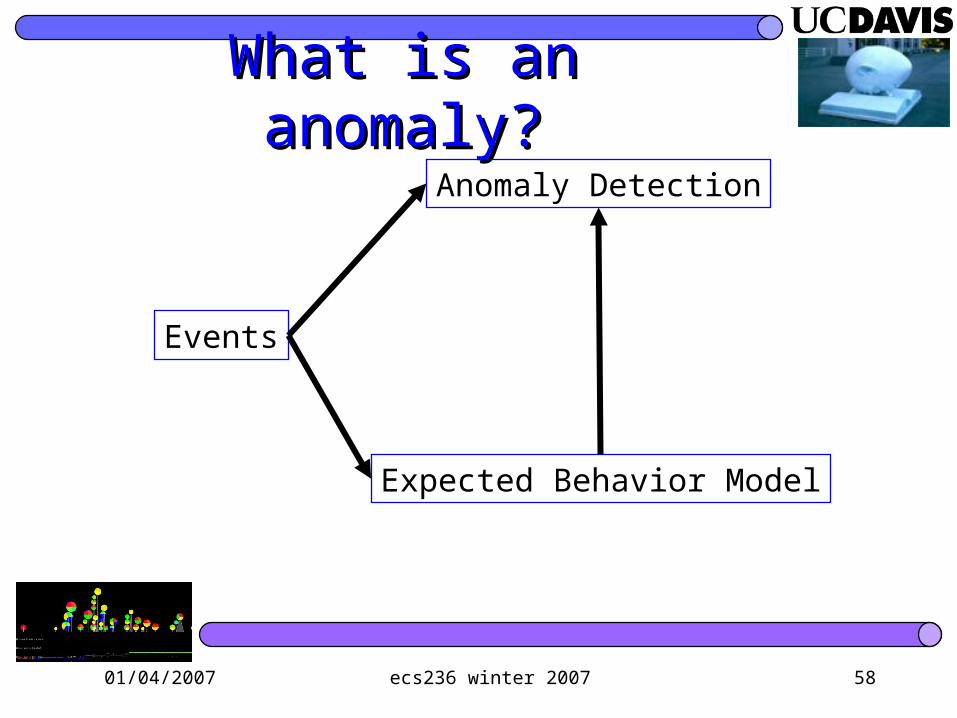
Events
Expected Behavior Model
Anomaly Detection
Knowledge about the Target
False Positives & Negatives
01/04/2007 ecs236 winter 2007 58
What is an anomaly?What is an anomaly?
Events
Expected Behavior Model
Anomaly Detection
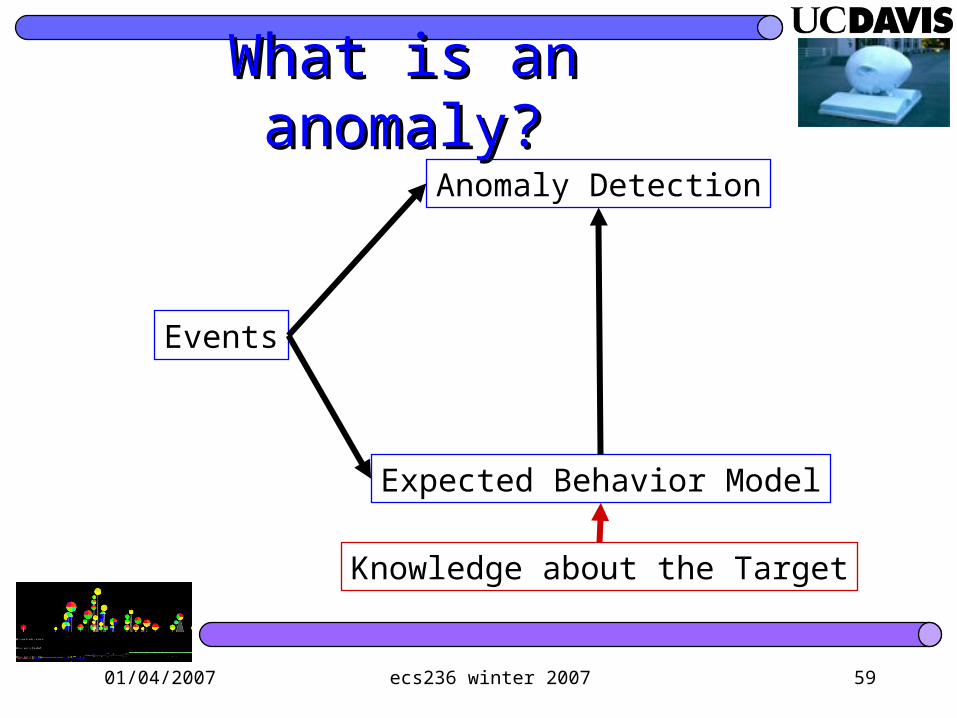
01/04/2007 ecs236 winter 2007 59
What is an anomaly?What is an anomaly?
Events
Expected Behavior Model
Anomaly Detection
Knowledge about the Target

01/04/2007 ecs236 winter 2007 60
Model vs. ObservationModel vs. Observationthe Model Anomaly Detection
Conflicts Anomalies
It could be an attack, but it might well be misunderstanding!!
01/04/2007 ecs236 winter 2007 61
ChallengeChallenge We know that the detected anomalies can
be either true-positive or false-positive. We try all our best to resolve the puzzle by
examining all information available to us. But, the “ground truth” of these anomalies
is very hard to obtain– even with human intelligence
01/04/2007 ecs236 winter 2007 62
Problems with ANDProblems with AND We are not sure about whatever we want to
detect… We are not sure either when something is
caught… We are still in the dark… at least in many
cases…

01/04/2007 ecs236 winter 2007 63
Anomaly ExplanationAnomaly Explanation How will a human resolve the conflict?
The Power of Reasoning and Explanation– We detected something we really want to detect
reducing false negative– Our model can be improved reduce false
positive
01/04/2007 ecs236 winter 2007 64
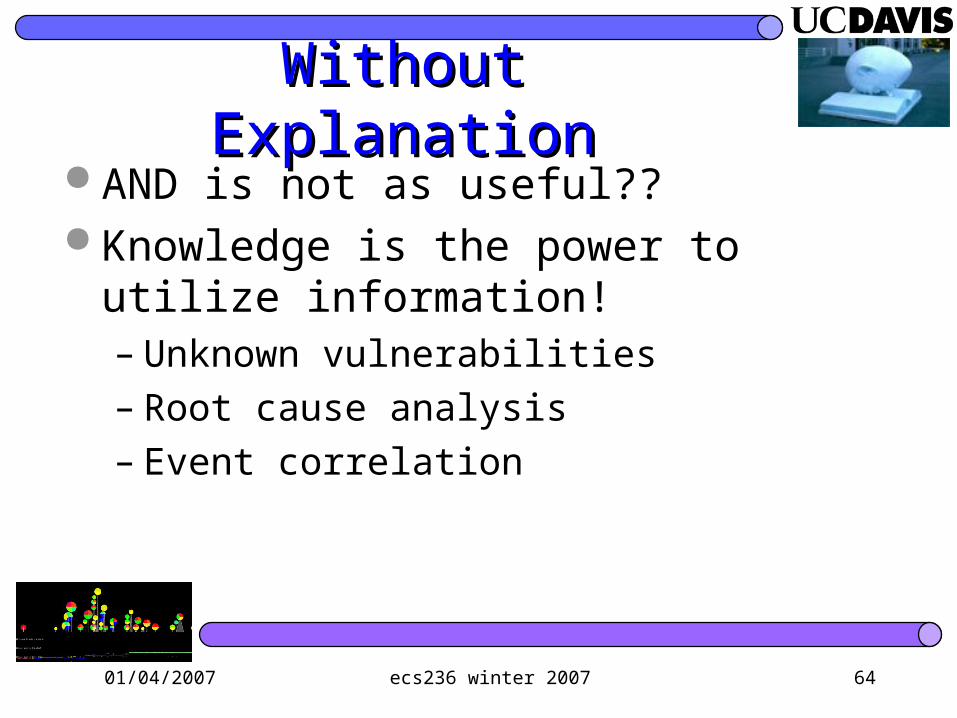
Without ExplanationWithout Explanation AND is not as useful?? Knowledge is the power to utilize
information!– Unknown vulnerabilities– Root cause analysis– Event correlation
01/04/2007 ecs236 winter 2007 65
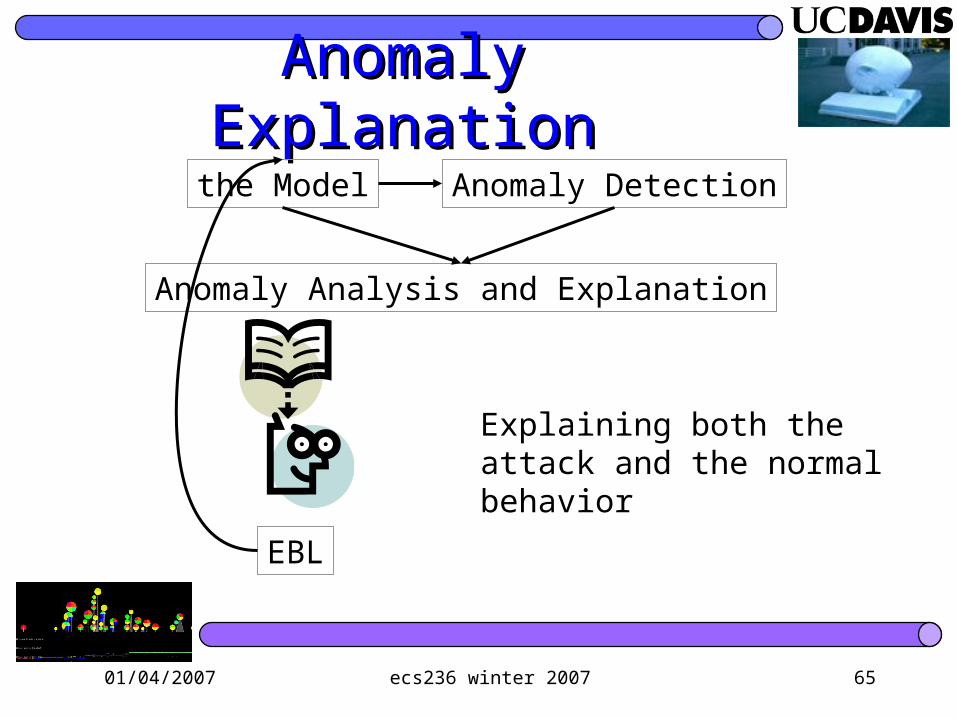
Anomaly ExplanationAnomaly Explanation
the Model Anomaly Detection
Anomaly Analysis and Explanation
EBL
Explaining both the attack and the normal behavior
01/04/2007 ecs236 winter 2007 66
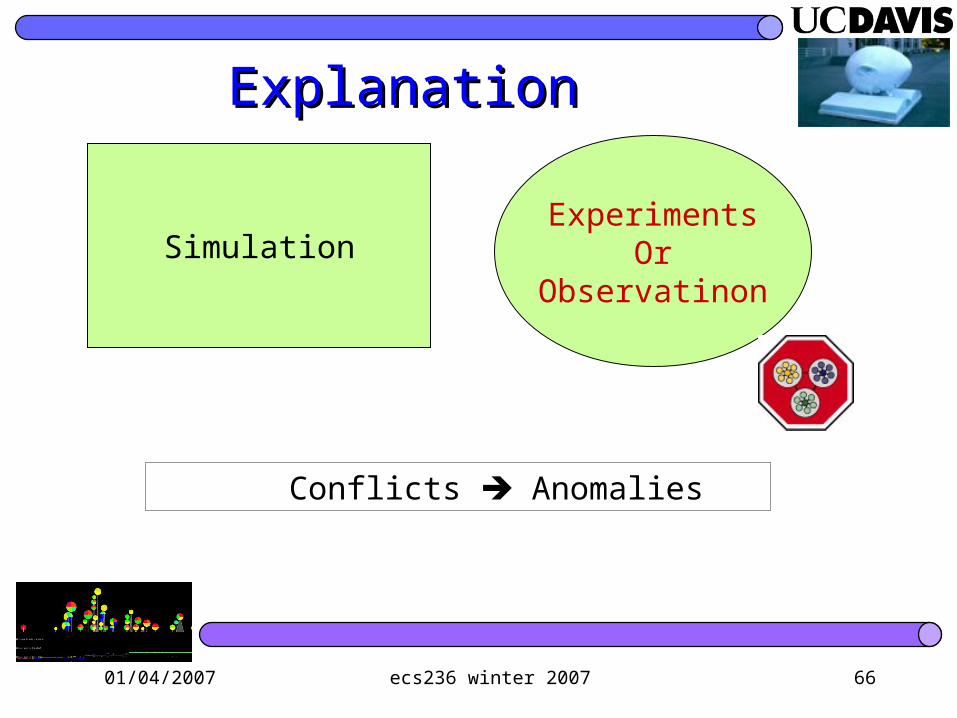
ExplanationExplanation
SimulationExperiments
OrObservatinon
Conflicts Anomalies
01/04/2007 ecs236 winter 2007 67
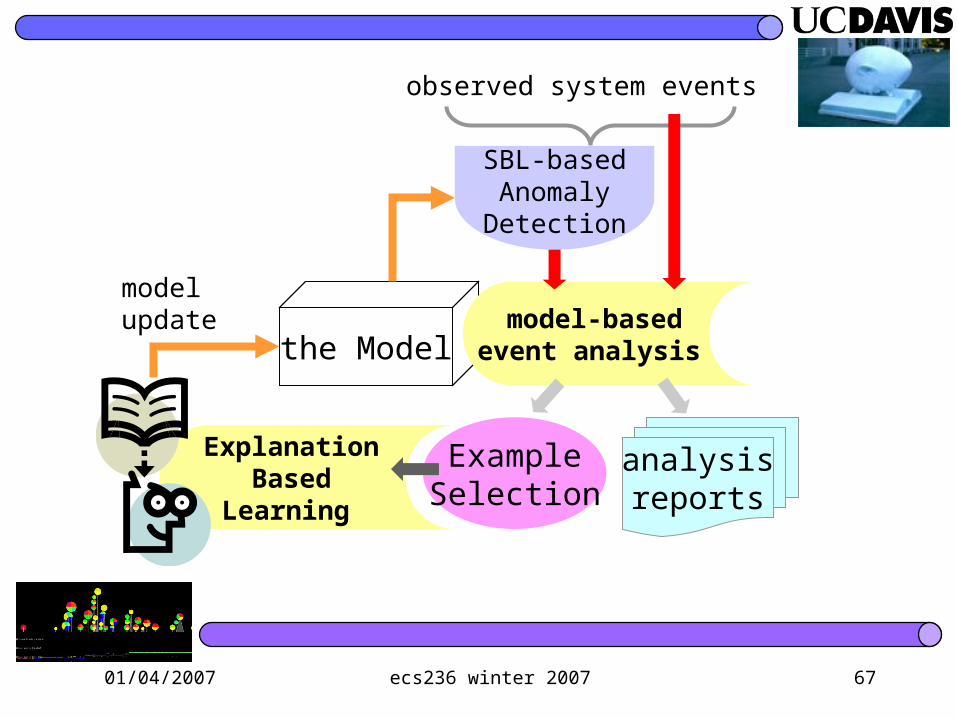
the Modelmodel-based
event analysis
observed system events
SBL-basedAnomalyDetection
analysisreports
ExampleSelection
Explanation Based
Learning
modelupdate
01/04/2007 ecs236 winter 2007 68
AND AND EXPAND EXPAND
Anomaly Detection– Detect– Analysis and Explanation– Application

01/04/2007 ecs236 winter 2007 69

01/04/2007 ecs236 winter 2007 70
01/04/2007 ecs236 winter 2007 71
01/04/2007 ecs236 winter 2007 72