… · web viewteaching enzymes to pre-service science teachers through poe (predict, observe,...
TRANSCRIPT

Teaching Enzymes to Pre-service Science Teachers through POE (Predict, Observe, Explain) Method: The Case of Catalase
Sema Nur GUNGOR1, Muhlis OZKAN2
ABSTRACT: The aim of this study is to teach enzymes, which are one of the biology subjects in understanding which students have a big difficulty, to pre-service teachers through POE method in the case of catalase, which is an oxidoreductase. Descriptive analysis method was employed in this study in which 38 second grade pre-service teachers attending Uludağ University Faculty of Education Department of Science Teaching in the spring semester of the 2014-2015 academic year and taking the “General Biology Laboratory” course participated. Four worksheets based on the POE method were used for data collection. The titles of these worksheets are “The Effect of Catalase”, “Catalase Concentration”, “Relationship between Catalase Concentration and Surface Increases in a Liver Piece”, and “Can Catalase Be Re-used?”. Frequency (f) and percentage (%) values were taken into consideration in data analysis. Certain results were obtained in the present study in regard to the effect of catalase on H2O2 (hydrogen peroxide), catalase concentration, and enzyme-substrate relationship and enzyme-surface area relationship. The averages calculated based on the answers given by the students to the questions asked to them in relevant stages indicate that success rate was 88.58% in the predict stage, 61.18% in the observe stage, and 87.72% in the explain stage3 while the overall success rate of the POE method was 79.16% for the activity entitled, “The Effect of Catalase”; 64.25% in the predict stage, 75.75% in the observe stage, and 81.58% in the explain stage while the overall success rate of the POE method was 73.86% for the activity entitled, “Catalase Concentration”; 93.86% in the predict stage, 98.68% in the observe stage, and 97.37% in the explain stage while the overall success rate of the POE method was 96.64% for the activity entitled, “Relationship between Catalase Concentration and Surface Increases in a Liver Piece”; and 83.55% in the predict stage, 88.6% in the observe stage, and 87.5% in the explain stage while the overall success rate of the POE method was 86.55% for the activity entitled “Can Catalase Be Re-used?”.
KEY WORDS: POE Method, Catalase, Pre-service Science Teachers.
INTRODUCTION
It is reported that use of laboratory in science teaching practices allows students to participate in science
education and teaching process actively, form new opinions about subjects they wonder through personal
observations, establish relationships between concepts, learn ways of reaching scientific truths, use the
theoretical knowledge they acquire in their daily lives, take part in research that involves their thoughts and
efforts, gain concrete learning experience, and develop positive attitudes towards science lessons (Atasoy, 2002;
Ayvacı and Küçük, 2005; Tekin, 2008a; MEB, 2013). Thus, laboratory practices are expected to allow
establishing a meaningful relationship between the theoretical knowledge acquired in the classroom environment
and what is observed during laboratory works, incorporate students in the process of constructing knowledge,
increase meaningful learning, assign responsibility to students for their own learning, encourage students, and
make them regard laboratory as a real learning environment.
It is reported in some studies that a lot of difficulties are faced during laboratory practices and that laboratories
are far from providing a meaningful learning environment as students mostly fail to understand the relationship
between their observations in the laboratory and theoretical knowledge (Friedler and Tamir, 1990; Erten, 1991;
1 (Corresponding Author) Uludağ University, Faculty of Education, Turkey. Email:[email protected] Uludağ University, Faculty of Education, Turkey. Email:[email protected]
1
Gürdal, 1991; Nakhleh and Krajcik, 1993; Alpaut, 1993; Ayas, Çepni and Akdeniz, 1994; Ekici, 1996; Uluçınar
et al., 2008; Akgün, 2010; Olympiou and Zacharias, 2011; Lowe, Newcombe and Stumpers, 2012).
An issue that increases problems and misconceptions more is that students do not have enough understanding of
such basic concepts of scientific research process as formulating a hypothesis, observation, and data, are
incompetent in practice, have problems in observing events, recording data, and making inferences, and do
activity and draw conclusions without considering the relationships between variables. It is thought that if
students comprehend and use these processes properly, laboratories that provide students with an efficient
learning environment will serve as quite suitable environments for science teaching. It is reported that use of
laboratory contributes to scientific knowledge bases and scientific process skills of students (Tamir, 1998;
Hofstein and Lunetta, 2004; Morgil, Güngör and Seçken, 2009; Böyük, Demir and Erol, 2010; Sarı, 2011;
Pekbay and Kaptan, 2014). When all these positive aspects are taken into consideration, the POE method
confronts us as one of the effective methods of minimizing limitations in laboratory use.
The POE method, which is based on constructive approach and effective in improving quality in learning, allows
students to apply what they learn in science laboratories or activities in the field and establish a link between
their knowledge and natural events they encounter in their daily lives. The POE method is implemented in 3
stages. The first stage involves teaching the determined subject to students theoretically and requesting them to
make predictions about the subject. In the second stage, activities are done, and students are expected to make
observations. In the third stage, students are requested to explain differences or similarities between their
predictions and their observations (Çepni, 2011).
It is stated that the POE method is an approach that activates students’ prior knowledge, leaves the resolution of
contradictions concerning their observations to them, ensures that its steps are performed without skipping any
of them, and is preferred because it is highly appropriate and easy to use (Yıldırım et al., 2004; Tekin, 2008a).
Being an effective learning approach, the POE method is very suitable for teaching certain subjects and concepts
in experimental and practical lessons. However, it is evident that there are some subjects and concepts for
teaching which the POE method is not appropriate, which is not surprising as there is no teaching method that
fits the teaching of all subject and concepts. Regarding the stages of the POE method only as experimental steps
restricts its use as a teaching method. Another problem is that it is not possible to make observations based on
assumptions in some of the experiments in which the POE method is to be employed.
Literature review shows that biology research employing the POE method focuses on osmosis (Çimer and Çakır,
2008); biological reproduction (Wu and Tsai, 2005); respiration and photosynthesis in plants (McGregor and
Hargrave, 2008; Köse et al., 2003); substance transport in plants (Bilen and Köse, 2012); use of microscope,
examination of animal and plant cells, plasmolysis and deplasmolysis, osmosis and diffusion, plant tissues,
factors influential on photosynthesis and transport in plants (Bilen and Aydoğdu, 2012); growth and
development in plants (Bilen and Köse, 2012; Tokur, 2011); substance pass through the cell membrane (Harman,
2014; 2015); circulatory system (Demirelli et al., 2008); and environmental education (Güven, 2011; 2014).
Though certain difficulties are confronted in the implementation of the POE method, the above-mentioned
studies indicate that observing after predicting is effective in learning; students learn better and correct their
existing misconceptions through POE activities; the POE method attracts the attention of students to
experiments; it helps students understand experiments better and thus promotes conceptual understanding; it may
enrich evidence-based experiments conceptually; students learning through POE activities are more successful
2

and have more positive attitudes; and the POE method creates contradictions in students’ minds while learning
new concepts and then allows them to achieve meaningful learning by comparing their predictions with their
observations.
Enzymes are one of the biology subjects in teaching and learning which individuals have difficulty (Bahar et al.,
1999a; Bahar, 2002). Two of the fundamental difficulties experienced in understanding enzymes are as follows:
enzymes have an abstract aspect; individuals fail to comprehend the integrated operation of such a high
organizational order in the living environment. It is known that misconceptions about enzymes include their
concrete aspect, conceptual framework, structural characteristics, mode of operation, functions, and types, the
factors influential on their operations, enzyme kinetics, specificity, enzyme-substrate complex, and enzyme-
metabolism relationship and mostly result from acquisitions in the daily life (Atav et al., 2004; Emre and
Yılayaz, 2006; Selvi and Yakışan, 2004; Sinan, 2007; Sinan et al., 2006; Linenberger and Bretz, 2012; Orgill and
Bodner, 2007; Marini, 2005; Kurt, 2013; González-Cruz et al., 2003; Voet et al., 2003).
Previous research has mostly focused on determining misconceptions on the subject of enzymes. Though there
are some studies dealing with the teaching of enzymes, they use V-diagrams, analogies, and word association
methodology (Atılboz and Yakışan, 2003; Şahin, 2002; Güler and Sağlam, 2002; Selvi and Yakışan, 2004; Atav
et al., 2004).
Fewness of the number of studies on the teaching of enzymes, which are one of the biology subjects students
have difficulty in understanding, (Pfundt and Duit, 2007) and lack of research dealing with the teaching of
enzymes through the POE method show the necessity of carrying out a study of this sort. In this regard, the
present study aims to teach enzymes to pre-service science teachers through the POE method. Catalase was used
for the teaching of factors influential on the operation of enzymes by use of plant and animal structures. H 2O2
was employed as a substrate.
METHODOLOGY
Descriptive research method was used in this study. Descriptive research aims to define, explain, clarify, and
evaluate a situation in detail and reveal the relationships between events. Descriptive research only handles the
existing events without changing anything in the studied environment and natural conditions (Çepni, 2007;
Sönmez and Alacapınar, 2013).
Sample
38 second grade pre-service teachers attending Uludağ University Faculty of Education Department of Science
Teaching and taking the “General Biology Laboratory” course participated in this study which was carried out in
the spring semester of the 2014-2015 academic year.
Data Collection Tool
Four worksheets prepared by the researchers based on the POE method entitled “The Effect of Catalase”,
“Catalase Concentration”, “Relationship between Catalase Concentration and Surface Increases in a Liver
Piece”, and “Can Catalase Be Re-used?” were used for data collection. The worksheets were prepared based on
literature review and target behaviors on the subject of enzymes indicated in 2013 Secondary Education Biology
Course Instructional Programme as well as Faculty of Education Department of Primary Education Science
3

Curriculum. Every worksheet consists of three parts (i.e. predict, observe, and explain) and open-ended questions
under these parts. The opinions of one biology professor and two science education experts were taken in order
to check the content validity of the worksheets and determine whether or not the questions in the worksheets
were clear, understandable, and suitable in terms of face validity and whether or not they contained any
statement whose power of representing the studied subject and content validity had to be increased or which was
unnecessary or unclear and had to be corrected.
Implementation
The students were divided into groups of 2. Three different teaching materials composed of the worksheets
prepared based on the POE method, description of how to do the experiment, and explanation of the subject were
distributed to the students before each activity. Based on these materials, the students were requested to fill in the
sections related to predict, observe, and explain stages that were provided in the worksheets in detail. In the
predict stage, the students were asked to write down their predictions about relevant subject together with their
reasons before the experiment was carried out. In the observe stage, they were asked to carry out the experiment
and record observation results. In the explain stage, they were asked to explain whether or not their predictions
were consistent with their observation results together with their reasons.
Data Analysis
Firstly, the worksheets of the participants were enumerated from 1 to 38, and their descriptive analyses were
made. The main aim in descriptive analysis is to reach concepts that can explain the data and the relationships
between concepts. Thus, the data that were similar to one another were brought together within the framework of
specific concepts and categories. Then they were put in order and interpreted.
In the observe stage, most of the pre-service teachers were able to identify the points they were expected to see.
The answers given in the predict and explain stages were evaluated and categorized. Frequency (f) and
percentage (%) values were taken into consideration during data analysis. Table 1 shows the categories related to
the predict stage and the explain stage and the contents of these categories.
Table 1 The Categories Used in Analyzing the Questions Included in the Predict and Explain Stages and Their Contents
Stage Category ContentPredict Correct prediction An answer that contains all aspects of the valid answer.
Partly correct prediction An answer that contains one aspect of the valid answer, but not all aspects.
Incorrect prediction Irrelevant or unclear answer; no answer; answer like “I do not know”, “I do not understand”.
Explain Prediction and observation are consistent.
Expectation is consistent with what is observable during the experiment or the activity.
Prediction and observation are partly consistent.
Expectation is partly consistent with what is observable during the experiment or the activity.
Prediction and observation are inconsistent.
Expectation is inconsistent with what is observable during the experiment or the activity.
No answer -
4

FINDINGS
This section deals with activities about how enzymes are influenced by various factors. In all of the activities,
catalase was used as an enzyme, and H2O2 was used as a substrate. Though H2O2 is a by-product that emerges
during the normal metabolic activity of body, it damages tissues unless it is made ineffective. Catalase is an
enzyme that breaks hydrogen peroxide into oxygen and water and exists in animal and plant cells.
This section presents frequency and percentage values concerning the answers given by the students in each
stage in the activities entitled, “The Effect of Catalase”, “Catalase Concentration”, “Relationship between
Catalase Concentration and Surface Increases in a Liver Piece”, and “Can Catalase Be Re-used?” The answers of
the students regarding the reasons for their predictions and explanations are also presented.
Activity 1: The Effect of Catalase
The effect of catalase on H2O2 was focused on in this activity. In this regard, 2 ml H202 was added into a clean
test tube. The calf lifer that had been brought beforehand was divided into small and equal pieces. Then one of
these pieces was put in the prepared test tube (Figure 1). The findings obtained from the students in regard to the
stages in the worksheet are presented below.
Predict Stage:
2 ml H202
Liver piece
Figure 1. Catalase Concentration
The students were asked to state their predictions about the gas that would come out during reaction due to
catalase. All of the students correctly predicted that gas would come out as a result of reaction. 86.8% of the
students stated that O2 would come out, and some of them supported their predictions by writing the reaction
equation. The students making an incorrect prediction (13.2%) stated that CO2 would come out.
The students were asked to state their predictions about the change of reaction rate in the course of time. All of
the students stated that reaction rate would change in the course of time; those who made correct predictions
(68.42%) stated that reaction rate would firstly increase and then decrease; and those who made a partly correct
prediction (23.68%) stated that reaction rate would firstly increase and then remain stable. The students who
made an incorrect prediction (7.9%) said that reaction rate would increase continuously.
Table 2 Answers about Whether or Not Temperature Will Increase in the Test Tube
Student predictions
f % f %
Prediction 38Correct prediction 26 86.85
100 Partly correct prediction 9 5.26Incorrect prediction 3 7.89
No prediction - - - - - Total 38 100
5

According to the Table 2, 86.85% of the students correctly predicted that temperature would increase in the test
tube. The students making a partly correct prediction (5.26%) stated that enzyme activity would decrease and
thus temperature would firstly increase and then decrease in the test tube. 2.63% of the students making an
incorrect prediction stated that temperature would not change while 5.26% of these students stated that
temperature would decrease as reaction would have to receive heat from the outside.
Observation Stage:Table 3 Student Answers Regarding Catalase Activity Based on Observations
Student Observation Results f %Foaming occurred when we added H2O2. 23 60.53Gas bubbles came out when we added H2O2. 22 57.89A very fast reaction took place. 9 23.68Reaction rate was very high initially but became lower in the course of time. 15 39.47Liver piece started to shrink during the reaction. 11 28.95Bubbles increased in quantity and went out of the test tube in the course of time.
3 7.89
Liver started to break into pieces. 8 21.05Liver piece changed color. 3 7.89Liquid accumulated in the test tube. 2 5.26
According to the Table 3, some students gave more than one answer to the same question. Of the students,
60.53% stated that foaming occurred when H2O2 was added onto the liver; 57.89% stated that gas bubbles came
out; and 39.47% sated that reaction was very fast in the beginning but slowed down gradually.
Table 4 Ranking Catalase Activity Rate in the Course of Time from 0 to 5 through Observation of the
Bubbles Coming out During the Reaction
Time (min)Reaction rate
1 2 4 6 8 10f % f % f % F % f % f %
1 (=very slow) 33 86.84 3 7.89 - - - - 12
31.58 31 81.58
2 (=slow) 3 7.89 3 7.89 - - 6 15.79 17
44.74 5 13.16
3 (=moderate) 1 2.63 7 18.42 16 42.11 5 13.16 7 18.42 1 2.634 (=fast) 1 2.63 15 39.47 10 26.32 3 7.89 1 2.63 1 2.635 (=very fast) - - 10 26.32 12 31.58 24 63.16 1 2.63 - -Average 1.21 3.68 3.89 4.18 2 1.26
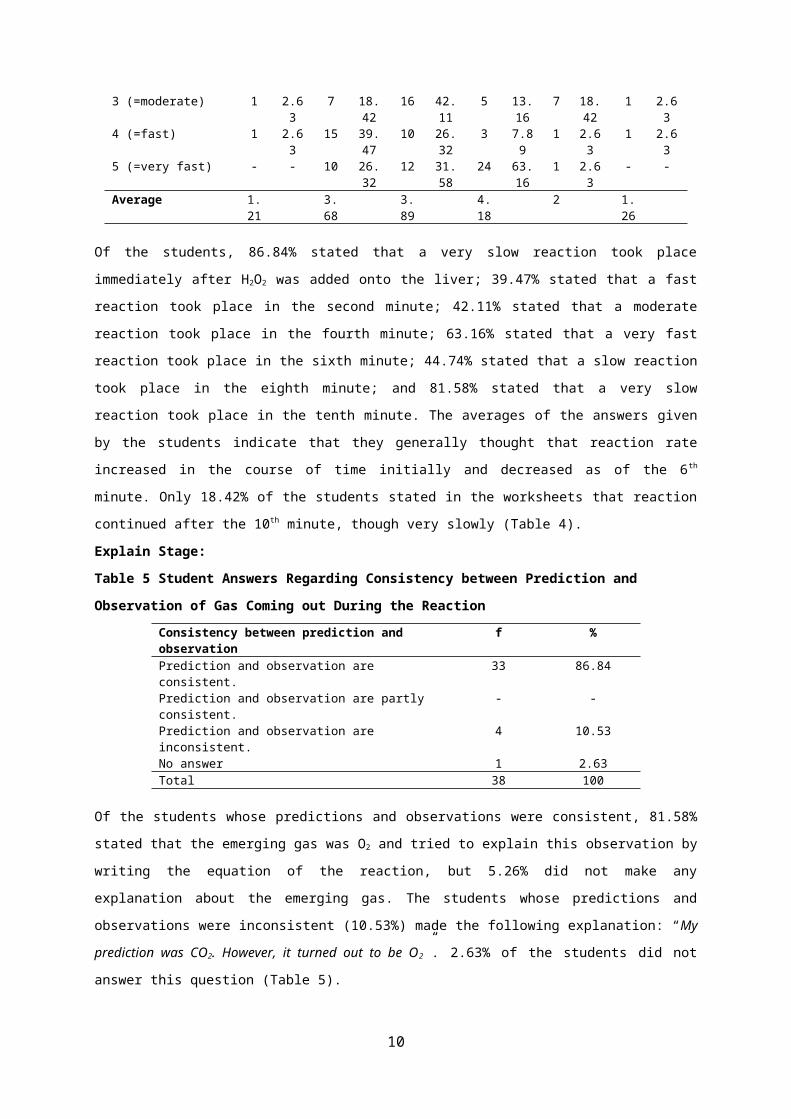
Of the students, 86.84% stated that a very slow reaction took place immediately after H2O2 was added onto the
liver; 39.47% stated that a fast reaction took place in the second minute; 42.11% stated that a moderate reaction
took place in the fourth minute; 63.16% stated that a very fast reaction took place in the sixth minute; 44.74%
stated that a slow reaction took place in the eighth minute; and 81.58% stated that a very slow reaction took
place in the tenth minute. The averages of the answers given by the students indicate that they generally thought
that reaction rate increased in the course of time initially and decreased as of the 6 th minute. Only 18.42% of the
students stated in the worksheets that reaction continued after the 10th minute, though very slowly (Table 4).
Explain Stage:
Table 5 Student Answers Regarding Consistency between Prediction and Observation of Gas Coming out
During the Reaction
Consistency between prediction and observation f %Prediction and observation are consistent. 33 86.84Prediction and observation are partly consistent. - -Prediction and observation are inconsistent. 4 10.53No answer 1 2.63Total 38 100
6

Of the students whose predictions and observations were consistent, 81.58% stated that the emerging gas was O 2
and tried to explain this observation by writing the equation of the reaction, but 5.26% did not make any
explanation about the emerging gas. The students whose predictions and observations were inconsistent
(10.53%) made the following explanation: “My prediction was CO2. However, it turned out to be O2”. 2.63% of
the students did not answer this question (Table 5).
Table 6 Student Views Regarding Consistency between Prediction and Observation of the Change in
Reaction Rate in the Course of Time
Consistency between prediction and observation f %Prediction and observation are consistent. 30 78.95Prediction and observation are partly consistent. 5 13.16Prediction and observation are inconsistent. 2 5.26No answer 1 2.63Total 38 100
All of the students (100%) predicted that reaction rate would change in the course of time. The students whose
predictions and observations were consistent (78.95%) stated that reaction rate would increase until a certain
point of time, but would decrease after that. The students whose predictions and observations were partly
consistent (13.16%) made the following explanation: “Rate decreased gradually. This is because; there was no
substance to affect it.” The students whose predictions and observations were inconsistent (5.26%) made the
following explanation: “My prediction was that reaction rate would increase continuously, but I observed that it
decreased gradually”. 2.63% of the students did not write any explanation for this question (Table 6).
The students were asked to draw a graph showing the reaction rate of catalase in the course of time based on the
data obtained from the tables they had formed through their observations. Of the students, 76.32% drew a correct
graph; 13.16% drew a partly correct graph; and 7.89% drew an incorrect graph. 2.63% of the students did not
draw the requested graph. Examples of these graphs are given below (Figure 2).
Correct Partly correct Incorrect
Figure 2 The Students’ Graphs of the Reaction Rate of Catalase in the Course of Time
Activity 2: Catalase Concentration
Calf liver, potato, chicken, and apple were used in this activity for determining the concentration of catalase in
different living being pieces. 2 ml H2O2 and equal amounts of liver, potato, chicken, and apple pieces were put in
each one of four test tubes (Figure 3). The findings obtained from the students in regard to the stages in the
worksheet are as follows:
7

Predict Stage:
I II III IV
2 ml H202 2 ml H202 2 ml H202 2 ml H202
Liver piece Potato piece Chicken piece Apple piece
Figure 3. Catalase Concentration
Table 7 Predictions Regarding the Reactions in the Test Tubes Test tubes and their contents
Student predictions f % f %
I. (liver+H2O2)
Prediction 38Correct prediction 38 100
100 Partly correct prediction - -Incorrect prediction - -
No prediction - - - - -Total 38 100 38 100
II.(potato+ H2O2)
Prediction 38Correct prediction 27 71.05
100 Partly correct prediction - -
Incorrect prediction 11 28.95No prediction - - - - -Total 38 100 38 100
III.(chicken+ H2O2)
Prediction 38Correct prediction 31 81.58
38 Partly correct prediction - -Incorrect prediction 7 18.42
No prediction - - - - -Total 38 100 38 100
IV.(apple+ H2O2)
Prediction 38Correct prediction 21 55.26
100 Partly correct prediction - -Incorrect prediction 17 44.74
No prediction - - - - -Total 38 100 38 100
For the 1st test tube, all of the students (100%) made a correct prediction and stated that reaction would take
place. 23.68% of the students wrote the reaction equation while the others supported their predictions with the
following explanations: “The catalase in the liver reacts with H2O2” (10); “We observed the existence of reaction
in our previous experiments” (4); “The liver contains catalase (15)”.
For the 2nd test tube, 71.05% of the students made a correct prediction by stating that reaction would take place
while 28.95% made an incorrect prediction by stating that reaction would not take place. While the students
making correct predictions made the following explanations “There is a small amount of catalase enzyme in it”
(12) and “The environment contains substrate and enzyme (4)”, 11 students did not make any explanation. Of the
students making incorrect predictions, 4 did not state any reason for their predictions while 7 made the following
explanations “There is no enzyme in the potato” (3); “The liver contains catalase enzyme” (1); “The potato
consists of starch, that is carbohydrate” (1); “H2O2 does not affect potato enzymes” (1); “H2O2 is acid so
reaction may take place” (1).
8

For the 3rd test tube, 81.58% of the students made a correct prediction by stating that reaction would take place
while 18.42% made an incorrect prediction by stating that reaction would not take place. While 18 of the
students making a correct prediction did not make any explanation, 13 made the following explanation: “The
chicken contains a small amount of catalase enzyme”. Some students making an incorrect prediction made the
following explanations: “The chicken does not contain any enzyme (1)”; “It contains protein” (4). On the other
hand, 2 students did not state any reason.
For the 4th test tube, 55.26% of the students made a correct prediction by stating that reaction would take place
and made the following explanation: “It contains a small amount of catalase enzyme (14)”. 7 students did not
state any reason for their predictions. 44.74% of the students made an incorrect prediction by stating that reaction
would not take place and made the following explanations: “The apple does not contain enzyme” (4); “The apple
contains acid” (3); “The apple is composed of carbohydrate” (1). 9 students did not make any explanation.
The students were asked to predict the ranking of the test tubes in terms of reaction rate. Only 42.11% of the
students were able to provide the following correct ranking: 1st Tube ˃ 3rd Tube ˃ 2nd Tube ˃ 4th Tube. In
response to this question, all of the students (100%) made a correct prediction for the 1 st test tube and stated that
the fastest reaction would take place in this tube. 84.21% of the students correctly predicted that the reaction in
the 3rd test tube would be the fastest reaction after the one involving the liver. The students making an incorrect
prediction on this subject (15.79%) made the following explanations: “The chicken contains protein” (2);
“Catalase is unique to the liver (4)”. 23 students (60.53%) correctly predicted that the third fastest reaction
would take place in the tube involving the potato while 15 students (39.47%) made an incorrect prediction.
While 11 of those students who made an incorrect prediction did not make any explanation, the others made the
following explanations: “No reaction takes place as the potato contains starch” (1); “I predict that no reaction
will take place in the cases of the apple and the potato because I think they do not contain enzyme” (2); “My
prediction is that the apple contains more active enzymes in comparison to the potato” (1).
16 students (42.11%) correctly predicted that the slowest reaction would take place in the tube involving the
apple while 22 students (57.89%) made an incorrect prediction. The students making a correct prediction made
the following explanations: “Enzymes have a protein structure. Therefore, reaction takes place in all test tubes”
(11); “The apple contains catalase, though in a small amount (5)”. Among the explanations made by some
students making an incorrect explanations are “The apple does not react as it is acidic” (4); “The apple does not
contain enzyme (11)”. 7 students did not state any reason for their incorrect predictions.
The students were asked to predict the tissues which contained more catalase. 73.68% of the students correctly
predicted that the liver and the chicken contained most catalase. The explanations made by them are as follows:
“The potato and the apple contain less catalase” (3); “The potato and the apple do not contain catalase” (2);
“Animal tissues contain more catalase” (4); “My prediction is that they contain more catalase because they are
meat” (1); “I think all the tissues we use have catalase, but I predict that animal tissues contain more catalase”
(1); “Enzymes mostly affect those which have protein structure” (1); “Soft tissues contain more catalase. They
break into pieces and react more easily” (1). 15 students did not write any explanation for their correct
predictions. 26.32% of the students made an incorrect prediction. Of these students, 9 did not state any reason
while 1 student made the following explanation: “Each reaction must have a different enzyme”.
9
Observe Stage:
Table 8 Student Answers Regarding the Reactions Taking Place in the Test Tubes Based on Observation Test Tube Student Observation Results f % Student Observation Results f %
1st Test Tube (Liver+H2O2)
Reaction took place. 38 100
H2O came out. 1 2.63A lot of foams emerged. 17 44.74The color of the liver changed. 1 2.63Gas came out. 7 18.42A lot of bubbles emerged. 4 10.53No explanation. 8 21.05
Reaction did not take place. - - - - -
2nd Test tube(Potato+H2O2)
Reaction took place. 94.74
Foaming occurred. 10 26.32Reaction took place due to acid. 1 2.63
36 A slow reaction took place. 10 26.32Some gas came out. 4 10.53No explanation. 11 28.95
Reaction did not take place. 2 5.26 No explanation. 2 5.26
3rd Test tube(Chicken+H2O2)
Reaction took place. 38 100The second most foaming occurred.
23 60.53
Bubbles came out. 5 13.16H2O came out. 1 2.63No explanation. 9 23.68
Reaction did not take place. - - - -
4th Test tube(Apple+H2O2)
Reaction took place. 33 86.84
The least foaming occurred. 7 18.42The apple foamed little because of its acidic nature.
2 5.26
Almost no bubble came out. 6 15.79H2O came out. 1 2.63The slowest reaction took place in this tube.
2 5.26
No explanation. 20 52.63Reaction did not take place. 5 13.16 No explanation. 5 13.16
For the 1st test tube, all of the students (100%) stated that reaction took place. Their explanations are as follows:
“A lot of foams came out” (17); “The color of the liver changed” (1); “Gas came out” (7); “A lot of bubbles
emerged” (4); “H2O came out” (1).
For the 2nd test tube, 94.74% of the students observed that reaction took place. Their explanations are as follows:
“Foaming occurred” (10); “Reaction took place due to acid” (1); “A slow reaction took place” (10); “Some gas
came out (4)”. 11 students who stated that reaction took place and 2 students who stated that reaction did not
take place in the 2nd test tube did not make any explanation to support their views.
For the 3rd test tube, all of the students (100%) stated that reaction took place. Their explanations are as follows:
“The second most foaming occurred” (23); “Bubbles came out” (5); and “H2O came out” (1).
For the 4th test tube, 86.84% of the students stated that reaction took place while 13.16% stated that reaction did
not take place. Those students who stated that reaction took place made the following explanations: “The least
foaming occurred” (7); “Apple foamed little because of its acidic nature” (2); “Almost no bubble came out” (6);
“H2O came out” (1); and “The slowest reaction took place in this tube (2)”. 20 students stating that reaction took
place in the 4th test tube did not make any explanation to support their views. None of the students who stated
that reaction did not take place made an explanation to support their views.
Table 9 Ranking the Activity Rates in the Reactions in the Test Tubes in the Course of Time from 0 to 5
through Observation of the Bubbles Coming out During the Reaction
Test tubes
Reaction rate
1st test tube(Liver+H2O2)
2nd test tube(Potato+H2O2)
3rd test tube(Chicken+H2O2)
4th test tube(Apple+H2O2)
f % f % f % f %0 (=no reaction) - - 2 5.26 - - 4 10.531 (=very slow) - - 8 21.05 - - 30 78.952 (=slow) - - 4 10.53 2 5.26 1 2.633 (=moderate) - - 9 23.68 4 10.53 2 5.264 (=fast) 4 10.53 10 26.32 13 34.21 1 2.63
10

5 (=very fast) 34 89.47 5 13.16 19 50 - -Average 4.89 2.84 4.29 1.11
Based on the average reaction rates, the fastest reaction was seen to be in the tube containing the liver (4.89),
which was followed by the one containing the chicken (4.29) and the one containing the potato (2.84)
respectively. The slowest reaction took place in the tube containing the apple (1.11). There were 2 students
stating that no reaction took place in the test tube containing the potato, and there were 4 students stating that no
reaction took place in the test tube containing the apple.
The students were asked to express their observation results concerning what living being pieces contained more
catalase among the living being pieces used in the experiment. 89.47% of the students said “liver” and “chicken”
in response to this question and made the following explanations: “The most foaming occurred in the cases of the
liver and the chicken” (1); “Animal tissues contain more catalase (living beings with a higher structure and
much metabolic waste) (8)”. 25 of these students did not make any explanation. 5.26% of the students only said
“liver” and made the following comment to justify this answer: “Only the liver contains catalase; the others do
not (catalase is unique to the liver)”. 5.26% of the students did not give any answer to this question.
Explain Stage:
Table 10 Student Answers about Consistency between Prediction and Observation of the Test Tubes in
which Reaction Would Take Place/Took Place
Consistency between prediction and observation f %Prediction and observation are consistent. 19 50Prediction and observation are partly consistent. 15 39.47Prediction and observation are inconsistent. 4 10.53No answer - -Total 38 100
50% of the students stated that their predictions and observations were consistent and made the following
explanations: “We had carried out the experiment with the liver and learned the reason before” (2); “Enzyme in
the liver reacts with H2O2” (2); “All of them contain catalase” (4); “All the food elements we use contain enzyme
(7)”. 4 of these students did not make any explanation. There was a partial consistency between the predictions
and observations of 15 students (39.47%). While 10 of these students did not make any explanation, 5 made the
following explanation “My prediction was that reaction would take place in the first three tubes, but it would not
take place in the tube involving the apple due to its acidic nature. However, reaction took place in all of them”.
4 students (10.53%) whose predictions were inconsistent with their observations made the following
explanations: “My prediction was that reaction would take place in the 1st and 3rd tubes, but it would not take
place in the other tubes because they did not contain catalase. However, I observed that reaction took place in
all of them and I learned that all of them contained catalase” (2); “I had predicted that reaction would take
place only in the tube containing the liver as the others did not contain enzyme. However, it took place in all of
them” (1); “My prediction was that catalase was only unique to the liver and did not exist in the others, and thus
reaction would not take place in the others” (1).
The students were asked to predict the ranking of the test tubes in terms of reaction rate. Table 11 presents the
explanations of the students concerning consistency between their predictions and their observations.
Table 11 Student Answers Regarding Consistency between Prediction and Observation of Reaction Rate Consistency between prediction and observation f %Prediction and observation are consistent. 16 42.11Prediction and observation are partly consistent. 7 18.42Prediction and observation are inconsistent. 15 39.47
11

No answer - -Total 38 100
16 students (42.11%) whose predictions and observations of the ranking which was expected to be 1st Tube˃ 3rd
Tube ˃ 2nd Tube ˃ 4th Tube were consistent made the following explanations: “Animal tissues contain more
catalase” (5); “Our ranking is correct though we predicted its reasons incorrectly” (2); “The liver contains
catalase” (9). The students whose predictions and observations of the ranking were partly consistent (18.42%)
made the following explanations: “I had predicted that it would take place only in the tubes containing the liver
and the chicken and I had ranked accordingly, but it took place in all of them ” (3); “I had predicted that
reaction would take place in the tubes containing the potato and the chicken because the potato had starch
structure and the chicken had protein structure, but I learned that the reason was different” (2); “I had predicted
that the apple would involve more than the potato, but just the contrary occurred” (1); “I had predicted that it
would not take place only in the case of the apple, but it took place in all of them (1)”. There was an
inconsistency between the predictions and observations of 39.47% of the students. Of these students, 13 did not
make any explanation while 2 made the following explanations: “I had predicted that reaction would take place
only in the tube involving the liver as the others did not contain enzyme, but reaction took place in all of them”
(1); “I had predicted that reaction would take place only in the test tube containing the liver as I had thought
that only the liver contained catalase (1)”.
The students were asked to deliver their answers regarding consistency between their predictions and
observations of which piece among the living being pieces used in the experiment contained more catalase.
There was a consistency between the predictions and observations of 34 students (89.47%). “Liver” and
“chicken” were given as answers. 6 students made the following explanation: “Animal tissues contain more
catalase”. 28 of 34 students did not write any explanation for their answers. The students whose predictions were
partly consistent with their observations (2) stated that catalase was unique to the liver and thus the liver
contained most catalase. In addition, one of these students made the following explanation: “H2O2 reacted with
the chicken due to its acidic nature. Its top turned white. Likewise, I think the apple and the potato reacted only
due to acid as they do not contain catalase”. None of the students gave an incorrect answer to this question. 2
students left it unanswered.
Activity 3: Relationship between Catalase Concentration and Surface Increases in a Liver Piece
In this activity, attention was focused on the enzymatic relationships of the liver piece slices containing catalase
and their mashed use in equal volumes with equal amount of substrate. 2 ml H2O2 was added into each one of
three test tubes. Three calf liver pieces were taken in equal amounts. One of the liver pieces was regularly sliced.
The second one was minced. The third one was pounded. These liver pieces were added into the test tubes
containing H2O2, and the reactions taking place in the tubes were observed at specific intervals (Figure 4). The
findings obtained from the students in regard to the stages in the worksheet are provided below.
12

Predict Stage:
I II III
2 ml H2O2 2 ml H2O2 2 ml H2O2
Regularly sliced liver Minced liver Pounded liver
Figure 4 Relationship between Catalase Concentration and Surface Increases in a Liver Piece
This section deals with the analysis of predictions concerning the reactions in the test tubes. All of the students
(100%) correctly predicted that reaction would take place in all of the three test tubes. For the 1 st tube, the
students made the following explanations: “Catalase involves enzyme” (16); “Some gas comes out” (2); “The
slowest reaction takes place in this tube” (1); “Catalase reacts with H2O2” (7); “There is a relationship between
substrate and enzyme” (6).
For the 2nd tube, the students made the following explanations: “The fastest reaction takes place in this test tube”
(1); “Reaction takes place at moderate rate” (9); “Catalase involves enzyme” (14); “Surface area increased” (3);
“More gas comes out from the first tube (2)”.
For the 3rd tube, the students made the following explanations: “A fast reaction takes place” (10); “Contact
surface increased” (2); “Catalase involves enzyme” (13); “Surface area is the least and thus the fastest reaction
takes place in this tube” (1); “Most gas comes out in this tube (2)”.
15.79% of the students for the 1st tube, 23.68% of the students for the 2nd tube, and 26.32% of the students for the
3rd tube did not write any reason for their predictions.
In regard to the tubes in which the fastest reaction and the slowest reaction would take place, all of the students
(100%) correctly predicted that the slowest reaction would take place in the 1st test tube and made the following
explanations: “The contacted surface area decreases” (32); “Substrate surface decreases” (5); “As the surface is
large, enzyme activity decreases (1)”. 94.74% of the students correctly predicted that the fastest reaction would
take place in the 3rd test tube and made the following explanations: “Substrate surface increases” (5); “Enzyme
activity increases” (2); “The contacted surface area is the largest” (26); “The surface area contacted by
substrate increases” (3); “Enzyme amount increases (2)”.
5.26% of the students made an incorrect prediction by stating that the fastest reaction would take place in the 2 nd
tube, which would be followed by the 3rd tube.
In regard to the change occurring in the contact surface as the liver is mashed, 84.21% of the students made a
correct prediction and made the following explanations: “The amount of enzyme increases as surface area
increases” (32); “A fast reaction takes place” (8); “Contact surface increases as liver is smashed” (2); “Enzyme
activity increases” (2); “A fast reaction takes place just like the faster melting of granulated sugar in comparison
to cube sugar (1)”. The students wrote more than one explanation for this question.
13

6 students (15.79%) who made an incorrect prediction made the following explanations: “It does not affect
enzyme amount” (4); “Increase in surface area only increases reaction rate” (1); and “Enzyme amount decreases
as contact surface increases” (1).
Observe Stage:
In regard to the reactions in the test tubes, all of the students observed that reaction took place in all of the three
test tubes.
For the 1st test tube, the students made the following explanations: “Catalase and H2O2 reacted” (12); “The liver
contains catalase” (9); “A slow reaction took place” (5); “The surface area is too large (1)”.
For the 2nd test tube, the students made the following explanations: “Contact surface increased” (2); “Reaction
took place at moderate rate” (6); “Catalase and H2O2 reacted” (9); “Catalase did not lose its activity” (1).
For the 3rd test tube, the students made the following explanations: “A very fast reaction took place” (6);
“Surface area is the smallest” (1); “Contact surface increased a lot” (2); “Catalase and H2O2 reacted”.
In their predictions, 28.95% of the students did not write any reason for the 1st test tube, and 52.63% of the
students did not write any reason for the 2nd and 3rd test tubes.
Table 12 Ranking the Activity Rates in the Reactions in the Test Tubes in the Course of Time from 0 to 5
through Observation of the Bubbles Coming out During the Reaction
Test tubes
Reaction rate
1st test tube(regularly sliced liver)
2nd test tube(minced liver)
3rd test tube(mashed liver)
f % f % f %0 (=reaction yok) - - - - - -1 (=very slow) - - - - - -2 (=slow) 38 100 - - - -3 (=moderate) - - 36 94.74 2 5.264 (=fast) - - - - - -5 (=very fast) - - 2 5.26 36 94.74Average 2 3.11 4.89
All of the students (100%) observed that the slowest reaction took place in the 1 st test tube while 94.74% of the
students observed that the fastest reaction took place in the 3rd test tube. 2 students (5.26%) observed that the
fastest reaction took place in the 2nd test tube and reaction at a moderate rate took place in the 3 rd test tube. The
students who wrote more than one observation result for this question made the following explanations: “The
amount of enzyme increased as surface area increased”(27); “Reaction rate increased” (16); “It did not affect
the amount of enzyme” (4); “As contact surface increased, H2O2 affected more” (2); “Enzyme activity increased
(5)”.
Explain Stage:
The students were asked to deliver their answers regarding consistency between their predictions and
observations of the changes occurring in the test tubes. All of the students predicted that reaction would take
place in all test tubes and thus achieved one hundred percent consistency between their predictions and
observations. As a reason, 50% of the students made the following explanation: “Reaction took place because
each tube contained catalase”. The explanation of 26.32% of the students is as follows: “Catalase reacts with
H2O2”. 9 students (23.68%) did not make any explanation for their answers.
The students were asked to state the consistency between their predictions and observations of the tubes in which
the fastest reaction and the slowest reaction would take place/took place. 94.74% of the students stated that there
was a consistency between their predictions and observations and made the following general explanation:
“Enzyme activity and rate increase as the contacted surface area increases”.
14

One of the students whose predictions and observations were inconsistent made the following explanation: “My
prediction was that as contact surface decreased, reaction rate would increase and so the fastest reaction would
take place in the 2nd tube. However, it was the 3rd tube”. Another student made the following explanation: “I
learned that contact surface is directly proportional to reaction rate”.
The students were asked to state the consistency between their predictions and observations of the change
occurring in the contact surface as the liver was mashed. 97.37% of the students stated that their predictions and
observations were consistent. They made more than one explanation. Their explanations are as follows: “As the
liver was mashed, the amount of enzyme increased” (12); “It did not affect the amount of enzyme. It just
increased reaction rate” (8); “Reaction rate increased as contact surface increased” (16); “The amount of
enzyme increased as contact surface increased” (14); “The amount of enzyme increased. However, reaction rate
remained the same as the amount of substrate did not change.” (2); “Enzyme activity increased (5)”. 1 student
(2.63%) who stated that there was a partial consistency between his prediction and observation made the
following explanation: “I had predicted that as the liver was mashed, the amount of enzyme and reaction rate
would increase, but reaction rate did not change because the amount of substrate did not change”. No student
answered this question incorrectly.
Activity 4: Can Catalase Be Reused?
This activity focused on the reusability of enzymes. In this regard, 2 ml H2O2 solution and a piece of liver were
added into a clean test tube. The initial liquid was poured into the first test tube, and it was assumed that the
reaction was completed. The students were asked to observe the changes occurring and the gas bubbles coming
out when the liver was added to this liquid and 2 ml H2O2 was added onto the liver remaining in the second test
tube (Figure 5). The findings obtained from the students in regard to the stages included in the worksheet in
detail are provided below.
Predict Stage:
I I
A new liver piece is added.
II II
2 ml H2O2 is added.
15
2 ml H2O2
Liver piece
Liquid
Liver piece

Figure 5 Can Catalase Be Reused?
The students were asked to predict whether enzymes can be reused. 2.63% of the students made an incorrect
prediction by stating that enzymes cannot be reused and did not make any explanation for their predictions.
97.37% of the students made a correct prediction by stating that enzymes can be reused. 37.9% of these students
did not make any explanation for their predictions. Other students made the following explanations: “Enzymes
can be reused as long as conditions are appropriate” (37.84%); “Enzymes can be reused as they do not change
through the reaction” (16.22%); “The structure of enzyme does not change as it is used” (5.41%).
Whether or not the liquid poured into the first test tube contained catalase was asked to the students. They were
asked to write their predictions together with their reasons. 71.05% of the students correctly predicted that the
liquid poured into the first test tube contained catalase, but they did not state any reason for it.
The answers of the students making an incorrect prediction (28.95%) were protein, CO2, O2+H2O, only H2O, and
H2O2. The students making the prediction “O2+H2O” wrote the reaction equation as a reason while the students
making the prediction “H2O2” made the following explanation: “The liquid is composed of H2O2 as it reacted
with the new liver put in the first test tube again”.
The students were asked to state their predictions about the reactions to take place when the liver was added onto
the liquid in the first test tube again. 86.84% of the students made a correct prediction by stating that reaction
would take place in the first test tube. 52.63% of these students did not make any explanation for their
predictions. The explanations made by other students in regard to this question are as follows: “Enzymes can be
used again and again” (18.42%); “The added liver contains a new enzyme” (15.79%).
The students making an incorrect prediction (13.16%) stated that reaction would not take place in the first test
tube and stated their reasons as follows: “As H2O2 is a substrate, it cannot be used again and again” (2.63%);
“The tube only contains water” (5.27%); “The substrate turned into product” (2.63%); “The structure of the
substrate was destroyed” (2.63%).
The students were asked to make a prediction regarding the reactions to take place when H2O2 was added again
to the liver remaining in the second test tube. 78.95% of the students stated that a reaction would take place
when H2O2 was added again to the liver remaining in the second test tube. 28.95% of these students did not make
explanation for their predictions. The explanations made by other students for this question are as follows; “ The
liver is used again and again as it functions as an enzyme” (34.21%); “A slow reaction takes place”(15.79%).
21.05% of the students made an incorrect prediction. 5.27% of these students did not make any explanation for
their predictions. Other students stated the following reasons for their predictions: “The enzyme in the liver
turned into product” (7.89%); “The liver lost its property” (5.26%); “The substrate and the enzyme combined
and the reaction was completed” (2.63%).
16

Observe Stage:
Table 13 Student Answers Regarding the Changes Occurring in the 1 st and 2nd Test Tubes Based on Observation Test tube Student Observation Results f % Student Observation Results f %
I. Reaction took place. 100
H2O and O2 came out. 1 2.63Foaming occurred. 25 65.79
38 The color of the liver changed very little. 3 7.89Gas came out. 9 23.68
Reaction did not take place. - - - -
II.
Reaction took place. 92.11
Foaming occurred little. 3 7.9Bubbles came out. 7 18.42
35 A very slow reaction took place. 8 21.05Many bubbles came out. 2 5.26Gas came out. 18 39.48
Reaction did not take place. 7.89The enzyme in the liver turned into product. 2 5.26
3 Reaction did not take place as the liver lost its enzymes and so no gas came out.
1 2.63
According to the Table 13, all of the students observed that reaction took place in the 1st test tube. For the 2nd test
tube, 92.11% of the students stated that reaction took place while 7.89% stated that no reaction took place.
Explain Stage:
In regard to the consistency between predictions and observations of reusability of enzymes, 97.37% of the
students stated that there was a consistency between their predictions and observations and the enzymes were
reused and made the following explanations: “Reaction took place in both test tubes” (5.26%); “Another reaction
took place in the case of the liver used for the second time” (44.74%); and “Enzymes do not lose their activity
(31.56%)”. 15.81% of the students stated that there was a consistency between their predictions and observations
but made no explanation.
The predictions and observations of 2.63% of the students were inconsistent, and they made the following
explanation: “I had predicted that there would be no enzyme remaining inside for the second use of the liver, but
I saw that the enzymes went unchanged through the reaction and did not disappear”.
In regard to the consistency between predictions and observations of whether or not the liquid poured into the
first test tube contained catalase, 76.32% of the students wrote the reaction equation and stated that their
predictions and observations were consistent by saying that the enzymes could be used again.
5.26% of the students whose predictions and observations were inconsistent made the following explanation:
“My prediction was that it contained only water. However, the fact that reaction took place indicates that some
H2O2 had remained from the reaction taking place in the first tube”. 18.42%, however, did not make any
explanation.
The students whose predictions and observations of the reactions taking place in the 1 st test tube were consistent
made the following explanations; “Reaction took place” (39.48%); “We saw that the enzymes were used again
and again” (23.68%); “Gas came out” (5.26%); and “Test tube got heated (13.16%)”.
2.63% of the students whose predictions and observations were inconsistent made the following explanation: “I
had predicted that reaction would not take place as I thought that the liquid was only composed of water.
However, it took place”. 15.79% of the students, on the other hand, left this question unanswered.
78.95% of the students stated that their predictions and observations were consistent by saying that reaction took
place again in the 2nd test tube and made the following explanations: “Foaming occurred” (22.56%);
17

“Temperature rose” (11.28%); “My prediction was that a slower reaction would take place, but a fast reaction
took place” (30.08%); “We observed that the enzymes were used again and again” (15.03%).
5.26% of the students wrote that they had made an incorrect prediction by stating that reaction would not take
place and thus their predictions and observations were inconsistent. 15.79% of the students did not answer this
question.
At observe stage, some students allegedly observed some points that were indeed impossible to observe. Some
mistakes of the students at observe and explain stages are indicated in Table 14 below.
Table 14 Some Mistakes Found in the Study Mistakes at Observe Stage f %A rise took place in temperature. 13 34.21Temperature firstly increased and then gradually decreased in the test tube. 7 18.42Heat came out. 9 23.68Product came out. 5 13.16 *The liquid in the first test tube contains protein. 1 2.63Mistakes at Explain Stage f %Reaction takes place in all of the other three tubes as the substance used is acid. 3 7.89H2O2 reacts with the potato and the apple because of their acidic nature just like it harms our skin. They do not contain catalase.
2 5.26
Meat and soft food contain more enzymes. 3 7.89More reaction takes places in the cases of the liver and the chicken because they are meat. 1 2.63The potato and the apple are carbohydrates. 3 7.89The potato and the apple are vitamins. 1 2.63The potato contains starch. 7 18.42The apple and the potato do not contain enzyme. 1 2.63Catalase is unique to the liver. 9 23.68Enzymes have protein structure. The liver and the chicken are also proteins. 3 7.89The liver and the chicken contain more catalase as they have a more intense protein structure. 10 26.32High-structure living beings must contain more catalase. 1 2.63The mashed liver has the smallest surface area and thus the fastest reaction takes place in this tube. 2 5.26The regularly sliced liver has the largest surface area. 2 5.26*The activity entitled “Can Catalase Be Reused?”
DISCUSSION and CONCLUSIONIn the activity entitled “The Effect of Catalase”, all of the students (100%) correctly predicted that gas would
come out as a result of reaction while 86.85% correctly predicted that temperature would increase in the test
tube. Of the students; 86.8% correctly predicted that the gas to come out was O2 while 68.42% correctly
predicted and 23.68% partly correctly predicted that reaction rate would change in the course of time.
The students gave different answers to the questions asked in regard to their observations in the experiment. Of
the students, 60.53% stated that foaming occurred when H2O2 was added onto the liver; 57.89% stated that gas
bubbles came out; 39.47% associated the intensity of the emerging gas bubbles with reaction rate and stated that
reaction was very fast initially but slowed down in the course of time; and 7.89% stated that they observed
change of color in the liver piece. 86.84% of the students stated that reactions started immediately after H2O2 was
added onto the liver while the rest of the students stated that reaction started after a while.
In this activity, the explanations of 81.58% of the students regarding the features that were observable during the
experiment were adequate and consistent with their predictions. 78.95% of the students made adequate
explanations and 13.16% of the students made partly adequate explanations in response to the question about the
change of reaction rate in the course of time. The table values based on the observation results indicate that
76.32% of the students drew correct graphs while 13.16% drew partly correct graphs. Only few students drew
incorrect graphs. It is thought that incorrect drawing (7.89%) resulted from incorrect predictions about the gas
bubbles coming out during the reaction.
18

The averages of the answers given by the students to the questions asked in predict (88.58%), observe (61.18%),
and explain (87.72%) stages were taken. In this activity, the overall success rate of the POE was found to be
79.16%.
In the activity entitled “Catalase Concentration”, all of the students made a correct prediction for the liver;
71.05% made a correct prediction for the potato; 81.58% made a correct prediction for the chicken; and 55.26%
made a correct prediction for the apple (they all stated that reaction would take place in the tubes involving these
substances). 73.68% of the students correctly predicted that the liver and the chicken would contain most
catalase. Based on the theoretical knowledge, reaction rate ranking was expected to be liver ˃ chicken ˃ potato ˃
apple. Only 42.11% of the students were able to come up with this ranking correctly. It is thought that the linear
relationship between enzyme concentration and reaction rate was not understood by the students, which is most
probably because enzymes have certain features that are abstract and difficult to understand because of their
nature and functions (Lazarowitz and Penso, 1992; Bahar et al., 1999a; Bahar, 2002; González-Cruz et al., 2003;
Voet et al., 2003).
In response to the questions asked about their observations during the experiment, all of the students (100%)
stated that reaction took place in the tubes containing the liver and the chicken; 94.74% stated that reaction took
place in the tube containing the potato; and 86.84% stated that reaction took place in the tube containing the
apple considering the foams or bubbles coming out during the experiment. Foam occurring was stated by
44.74% of the students in the case of the liver, by 26.32% in the case of the potato, by 60.53% in the case of the
chicken, and by 23.68% in the case of the apple. Based on the student answers in average, the ranking of the test
tubes in terms of reaction rate was seen to be as follows: the test tube with the liver (4.89), the test tube with the
chicken (4.29), the test tube with the potato (2.84), and the test tube with the apple (1.11).
The explanations of 50% of the students regarding the features that were observable during the experiment were
adequate and consistent with their predictions of the occurrence of reaction in the test tubes. The explanations of
39.47% of the students were partly adequate while those of 10.53% of the students were inadequate. 42.1% of
the students made adequate explanations and predictions of the expected reaction rate ranking. 18.42% of the
students, on the other hand, made partly adequate explanations. 89.47% of the students made adequate
explanations in regard to which living being pieces among the living being pieces used in the study contained
more catalase. The students who made partly adequate explanations (5.26%) stated that catalase was unique to
the liver and thus the liver contained most catalase.
The averages of the answers given by the students to the questions asked in predict (64.25%), observe (75.75%),
and explain (81.58%) stages were taken. In this activity, the overall success rate of the POE was found to be
73.86%.
In the activity entitled, “Relationship between Catalase Concentration and Surface Increases in a Liver Piece”,
all of the students (100%) correctly predicted that reaction would take place in all of the three test tubes; 94.74%
correctly predicted that the fastest reaction would take place in the case of the mashed liver; all of the students
(100%) predicted that the slowest reaction would take place in the case of the regularly sliced liver; and 84.21%
correctly predicted that the amount of enzyme would increase depending on the change in the contact surface as
the liver was mashed. High correct prediction percentages in this activity imply that they correctly understood
the relationship between concentration and surface increase.
19

In response to the questions asked to them about their observations during the experiment, all of the students
stated that reaction took place in all of the three test tubes considering the foaming occurring in them; 94.74% of
the students stated that the fastest reaction took place in the mashed liver; and all of the students stated that the
slowest reaction took place in the regularly sliced liver.
The explanations of all of the students regarding the features that were observable during the experiment were
adequate and consistent with their predictions of the occurrence of reaction in the test tubes. 94.74% of the
students made adequate predictions and explanations of the ranking of the test tubes in terms of reaction rate (i.e.
the test tube in which the fastest reaction would take place and the test tube in which the slowest reaction would
take place). One of the students whose explanations were not adequate made the following explanation: “My
prediction was that as contact surface decreased, reaction rate would increase and so the fastest reaction would
take place in the 2nd tube. However, it was the 3rd tube”. Another student made the following explanation: “I
learned that contact surface is directly proportional to reaction rate”. 97.37% of the students made an adequate
prediction that as the liver was mashed, the contact surface would increase and made adequate explanations
about the features that were observable during the experiment. The percentage of adequate explanations was
high in this stage, as in predict stage.
The averages of the answers given by the students to the questions asked in predict (93.86%), observe (98.68%),
and explain (97.37%) stages were taken. In this activity, the overall success rate of the POE was found to be
96.64%.
In response to the questions asked in the activity entitled, “Can Catalase Be Reused?” 97.37% of the students
correctly predicted that enzymes could be used again; 86.84% correctly predicted that reaction would take place
in the first test tube; and 78.95% correctly predicted that reaction would take place if H202 was added onto the
liver remaining in the second test tube again. 71.05% of the students correctly predicted that the fluid poured into
the first test tube would contain catalase. The students making an incorrect prediction (28.95%) said “protein”,
“CO2”, “O2+H2O”, “only H2O”, and “H2O2” as an answer. The students making the prediction “O2+H2O” wrote
the reaction equation as a reason. The student making the prediction “H2O2”, on the other hand, made the
following explanation: “The liquid is composed of H2O2 as it reacted with the new liver put in the first test tube
again”. These answers indicate that the students had misconceptions on the subject of enzymes.
In response to the questions regarding their observations during the experiment, 65.79% of the students stated
the foams coming out during the experiment for the 1st tube and 7.9% of the student stated the foams coming out
during the experiment for the 2nd tube. Considering these foams, all of the students (100%) for the first test tube
and 92.11% of the students for the second test tube stated that reaction would take place.
The observation-based explanations of 97.37% of the students were adequate and consistent with their
predictions on the subject of reusability of enzymes; those of 76.32% of the students were adequate and
consistent with their predictions on the subject of the existence of catalase in the liquid poured; those of 97.37%
of the students were adequate and consistent with their predictions of the occurrence of reaction in the 1 st tube;
and those of 78.95% of the students were adequate and consistent with their predictions of the occurrence of
reaction in the 2nd tube.
The averages of the answers given by the students to the questions asked in predict (83.55%), observe (88.6%),
and explain (87.5%) stages were taken. In this activity, the overall success rate of the POE was found to be
86.55%.
20

The students took part in predict stage in all of the activities carried out in this study. It was seen in the predict
stage that the pre-service teachers had imperfect or incorrect knowledge and misconceptions on some subjects
(Tekkaya et al., 2000a; 2000b; Sungur et al., 2000; Dikmenli et al, 2002; Tekkaya and Balcı, 2003; Yıldırım et
al., 2004; Konuk and Kılıç, 2002; Çepni et al., 2006; Köse, 2007).
In the predict stage of the activities based on the POE method, the students realized that their prior knowledge
was not enough to explain new events. They corrected such imperfect knowledge in the explain stage following
the observe stage. Consistently with the results of this study, previous experimental research shows that the POE
method is effective in creating a conceptual change (Kearney, 2002a; 2002b; Kearney and Treagust, 2000a;
2000b; Köseoğlu et al. 2002; Wandersee et al., 1994; McGregor and Hargrave, 2008; Liew and Treagust, 1995;
1998).
The following conflicts indicate the existence of an inconsistency between their predictions and their
observations: prediction was that enzyme had run out in the liver while the observation result was that reaction
took place in both tubes and thus enzymes could be used again and again as long as substrate was available in the
environment; prediction was that the gas to come out as a result of reaction was CO 2 while the observation result
was O2; prediction was that reaction would take place in all of the test tubes because the potato had protein
structure and the apple was acidic, but the reason was different though the observation result was the same as the
prediction; prediction was that reaction would take place only in the tubes containing the liver and the chicken
because the others did not contain catalase, but the observation result was that reaction took place in all of them,
and indeed all of them contained catalase; prediction was that reaction would take place only in the tube
containing the liver as the others did not contain enzyme, but the observation result was that reaction took place
in all of them; prediction was that catalase was unique only to the liver and did not exist in the others and thus
reaction would not take place in the tubes containing the others, but the observation result did not prove that to
be true; prediction was that as the contact surface decreased, reaction rate would increase, and the fastest reaction
would take place in the 2nd tube, but the observation result was that the fastest reaction took place in the 3 rd tube.
It can be said that this improved learning in a different dimension. Thus, it is thought that the method has self-
control within itself and thus reduces the amount of mistakes made by students and provides permanent learning
through doing, observing, and reinforcing with explanations. Though the students had difficulty in predicting in
the present study, it is thought that the observe stage of the POE method helped students reconstruct their prior
knowledge. Some previous studies (Mthembu, 2001; Liew and Treagust, 1995; 1998) explored the effect of the
POE method on understanding science subjects and concluded that it improves students’ levels of understanding
subjects and enriches the process of using knowledge. It is also possible to say that the POE method makes a
positive contribution to students’ levels of understanding experiments (Tekin, 2006; 2008b; Wu and Tsai, 2005;
Bilen, 2009).
Literature does not contain any other study dealing with the use of the POE method in teaching enzymes. There
is no general attempt in which each stage of the method is evaluated separately and then its success is explored
as a whole. The related studies in literature generally report that activities carried out by use of the POE method
improve success (Tao and Gunstone 1997; Windschitl and Andre, 1998; Kearney and Treagust, 2001; Kearney,
Treagust, Yeo and Zadnik, 2001; Kearney, 2004; Küçüközer, 2008; Bilen and Aydoğdu, 2010; Bilen and Köse,
2012a; 2012b; Akgün, Tokur and Özkara, 2013; Yavuz and Çelik, 2013; Harman, 2014; 2015). Likewise; it is
reported that the method improves student success (Karatekin and Öztürk, 2012; Mısır and Saka, 2012a; 2012b)
21

and has a positive effect on understanding subjects (Tekin, 2008a; 2008b) and opinions about scientific
knowledge (Akgün, Tokur and Özkara, 2013).
The overall success rate of the POE was found to be 79.16% for the activity entitled, “The Effect of Catalase”,
73.86% for the activity entitled, “Catalase Concentration”, 96.64% for the activity entitled, “Relationship
between Catalase Concentration and Surface Increases in a Liver Piece”, and 86.55% for the activity entitled,
“Can Catalase Be Reused?”.
The method was seen to have a lower overall success rate for the activity entitled, “Catalase Concentration” in
comparison to the other activities. The problems resulting from the prior knowledge of the students about
enzyme concentration still continued. Literature contains no study about enzyme concentration in living being
pieces but involves studies dealing with general misconceptions about enzymes (Atav et al., 2004; Selvi and
Yakışan, 2004; Marini, 2005; Emre and Yılayaz, 2006; Sinan, 2007; Orgill and Bodner, 2007; Linenberger and
Bretz, 2012). It was also determined in the present study that the students had learning difficulties on the subject
of enzymes and some students had misconceptions in this matter.
The high success rate achieved in the activity entitled, “Relationship between Catalase Concentration and
Surface Increases in a Liver Piece” is supported by research reporting that experiments carried out based on the
POE method have positive effects on understanding a subject (Tekin, 2008a; 2008b); the POE method supports
the experiments carried out for proving purposes in terms of conceptual understanding (Tekin, 2008b); the
method increases students’ interest in and willingness and curiosity about experiments (Karaer, 2007) as well as
their motivation; the method is interesting (Tekin, 2008b; Mısır and Saka, 2012a; 2012b); and the method
ensures active participation in lessons and has positive effects on socialization (Mısır and Saka, 2012a; 2012b).
Literature contains studies whose results are parallel with the results of the present study. Such studies report that
the POE method is an effective method for construction of concepts and for meaningful and permanent learning
(Bilen and Aydoğdu, 2010; Özdemir, Köse and Bilen, 2012; Yavuz and Çelik, 2013); allows teaching a lesson
effectively and makes students notice their mistakes personally (Bilen and Köse, 2012b); improves problem-
solving, conceptual understanding, and application skills (Mısır and Saka, 2012a; 2012b); and contributes to the
elimination of misconceptions (Bilen and Köse, 2012a; Mısır and Saka, 2012a; Özdemir, Köse and Bilen, 2012;
Öner-Sünkür, İlhan and Sünkür, 2013; Yavuz and Çelik, 2013).
All in all, it is thought that the POE method is quite appropriate for teaching experimental activities in science
lessons. The POE method is not appropriate for teaching all subjects and concepts in the curriculum, which is
also true for other teaching methods, but is very effective for covering experimental and practical subjects.
Though it activates students’ prior knowledge, leaves the resolution of conflicts to students, makes students
implement its stages without skipping any, and can be defined as a more constructive method in comparison to
other concept teaching strategies, certain difficulties are confronted during its implementation. Especially in
crowded classroom environments, problems are faced in monitoring students, class management, making correct
observations during the experiment, evaluating student performance, making a proper use of prior knowledge,
ensuring students’ active participation, reaching the information, and interpreting the events correctly.
Researchers should take into consideration these difficulties or problems before implementing the method and
take necessary measures for more effective educational activities.
22

REFERENCES
Akgün, Ö. (2010). Öğretmen adaylarının fen ve teknoloji laboratuarına ilişkin görüşleri ve bilim okur-yazarlığı (Yayımlanmamış yüksek lisans tezi). Fırat Üniversitesi Sosyal Bilimler Enstitüsü, Elazığ.
Akgün, A., Tokur, F. and Özkara, D. (2013). TGA stratejisinin basınç konusunun öğretimine olan etkisinin incelenmesi. Amasya Üniversitesi Eğitim Fakültesi Dergisi, 2(2), 348-369.
Alpaut, O. (1993). Fen öğretiminin verimli ve işlevsel hale getirilmesi. Ortaöğretim Kurumlarında Fen Öğretimi ve Sorunları Sempozyumu, Ankara: TED 12-13 Haziran.
Atasoy, B. (2002). Fen öğrenimi ve öğretimi. Gündüz Yayıncılık, Ankara.Atav, E., Erdem, E., Yılmaz, A. and Gücüm, B. (2004). The effect of developing analogies for meaningful
learning of the subject of enzymes. Hacettepe Üniversitesi Eğitim Fakültesi Dergisi, 27, 21-29.Atılboz, N. G. and Yakışan, M. (2003). V-diyagramlarının genel biyoloji laboratuarı konularını öğrenme başarısı
üzerine etkisi: Canlı dokularda enzimler ve enzim aktivitesini etkileyen faktörler. Hacettepe Üniversitesi Eğitim Fakültesi Dergisi, 25, 8-13.Ayas, A., Çepni, S. and Akdeniz, A.R. (1994). Fen bilimleri eğitiminde laboratuarın yeri ve önemi (I): Tarihsel
Bir Bakış. Çağdaş Eğitim. 204,21-25.Ayvacı, H. Ş. and Küçük, M. (2005). İlköğretim okulu müdürlerinin fen bilgisi laboratuarlarının kullanımı
üzerindeki etkileri. Milli Eğitim Dergisi, 165.Bahar, M., Johnstone, A. H., and Hansell, M. H. (1999a). Revisiting learning difficulties in biology. Journal of
Biological Education, 33, 84–86.Bahar, M. (2002). Students’ learning difficulties in biology: Reasons and solutions Kastamonu Eğitim Fakültesi
Dergisi, 10, 73–82.Bilen, K. (2009). Tahmin et-gözle-açıkla yöntemine dayalı laboratuar uygulamalarının öğretmen adaylarının
kavramsal başarılarına, bilimsel süreç becerilerine, tutumlarına ve bilimin doğası hakkındaki görüşlerine etkisi. Doktora tezi (basılmamış). Gazi Üniversitesi, 169s, Ankara.
Bilen, K. and Aydoğdu, M. (2010). Fen bilgisi öğretmen adaylarına bitkilerde fotosentez ve solunum kavramlarını öğretmede TGA (Tahmin Et-Gözle-Açıkla) stratejisinin kullanımı. Mustafa Kemal Üniversitesi Sosyal Bilimler Enstitüsü Dergisi, 7(14);179–194.
Bilen, K. and Aydoğdu, M. (2012). TGA (tahmin et-gözle-açıkla) stratejisine dayalı laboratuar uygulamalarının öğrencilerin bilimsel süreç becerileri ve bilimin doğası hakkındaki düşünceleri üzerine etkisi. Gaziantep Üniversitesi Sosyal Bilimler Dergisi 11(1), 49-69.
Bilen, K. and Köse, S. (2012a). Kavram öğretiminde etkili bir strateji TGA (tahmin et-gözle-açıkla) “Bitkilerde Madde Taşınımı”. Mehmet Akif Ersoy Üniversitesi Eğitim Fakültesi Dergisi, 12(24), 21-42.
Bilen, K. and Köse, S. (2012b). Yapılandırmacı öğrenme teorisine dayalı etkili bir strateji: Tahmin-gözlem-açıklama (TGA) “Bitkilerde Büyüme ve Gelişme”. Pamukkale Üniversitesi Eğitim Fakültesi Dergisi, 31(1), 123-136.
Böyük, U., Demir, S. and Erol, M. (2010). Fen ve teknoloji dersi öğretmenlerinin laboratuar çalışmalarına yönelik yeterlik görüşlerinin farklı değişkenlere göre incelenmesi. Türk Bilim Araştırma Vakfı Bilim Dergisi, 3 (4), 342-349.
Çepni, S. Taş, E., and Köse, S. (2006). The Effects of Computer-Assisted Material on Students’ Cognitive Levels, Misconceptions and Attitudes towards Science. Computers & Education 46(2): 192–205.
Çepni, S. (2007). Araştırma ve proje çalışmalarına giriş (3. Baskı). Trabzon: Celepler Matbaacılık.Çepni, S. (Ed.). (2011). Kuramdan uygulamaya fen ve teknoloji öğretimi, (9. Baskı). Pegem A Akademi: Ankara.Çimer, O. S.and Çakır, İ. (2008). Using the predict-observe-explain (POE) strategy to teach the concept of
osmosis. XIII. IOSTE SYMPOSIUM 21-26 September- IZMIR.Demirelli, H., Özkaya, A., Demir, M., Altınkaynak, Ö., Akgül, P. and Başkurt, P. (2008). “6. sınıf fen ve
teknoloji dersinde ‘dolaşım sistemi’ konusunun analoji ve tahmin et- gözle- açıkla (TGA) yöntemleri ile işlenmesinin öğrenci başarısına ve tutumuna etkisi,” VIII.Ulusal Fen Bilimleri ve Matematik Eğitimi Kongresi, Özetler, 27-29 Ağustos, Bolu.
Dikmenli, M., Türkmen L. and Çardak O. (2002). Üniversite öğrencilerinin biyoloji laboratuarlarında mikroskop çalışmaları ile ilgili alternatif kavramları. V. Ulusal Fen Bilimleri ve Matematik Eğitimi Kongresi, ODTU, 16-18 Eylül, Ankara.
Ekici, G. (1996). Biyoloji öğretmenlerinin öğretimde kullandıkları yöntemler ve karşılaştıkları sorunlar.
23

Yayınlanmamış Yüksek Lisans Tezi, Ankara Üniversitesi, Ankara.Emre, İ. and Yılayaz, Ö. (2006). Fen bilgisi öğretmen adaylarının enzimlerle ilgili kavram yanılgıları. Doğu
Anadolu Bölgesi Araştırmaları (DAUM) Dergisi, 4 (3), 65-69.Erten, S. (1991). Biyoloji laboratuarının önemi ve laboratuarda karşılaşılan güçlükler. Yayınlanmamış Yüksek
Lisans Tezi, Gazi Üniversitesi, Ankara. Friedler Y. and Tamir P. (1990). “In the student laboratory and the science cirriculum”, Hegarty-Hazel.E.Ed.,
Routledge: London.González-Cruz, J., Rogelio Rodríguez-Sotres, R., and Rodríguez-Penagos, M. (2003). On the convenience of
using a computer simulation to teach enzyme kinetics to undergraduate students with biological chemistry-related curricula. Biochemistry and Molecular Biology Education, 31 (2), 93–101.
Güler, M. H. and Sağlam, N. (2002). Biyoloji öğretiminde bilgisayar destekli öğretimin ve çalışma yapraklarının öğrencilerin başarısı ve bilgisayara karşı tutumlarına etkileri. Hacettepe Üniversitesi Eğitim Fakültesi Dergisi, 23: 117-126.
Gürdal, A. (1991). Fen öğretiminde laboratuar etkinliğinin başarıya etkisi. İstanbul: Özel kültür okulları eğitim araştırma geliştirme merkezi eğitimde yeni arayışlar i. Sempozyumu, Eğitimde Nitelik Geliştirme. 13-14 Nisan 1991.
Güven, E. (2011). Çevre eğitiminde tahmin-gözlem-açıklama destekli proje tabanlı öğrenme yönteminin farklı değişkenler üzerine etkisi ve yönteme ilişkin öğrenci görüşleri. Gazi Üniversitesi, Eğitim Bilimleri Enstitüsü, Doktora Tezi.
Güven, E. (2014). Tahmin-gözlem-açıklama destekli proje tabanlı öğrenme yönteminin çevre sorunlarına yönelik tutum ve davranışlara etkisi. Eğitim ve Bilim, Cilt:39, Sayı:173.
Harman, G. (2014). Hücre zarından madde geçişi ile ilgili kavram yanılgılarının tahmin-gözlem-açıklama yöntemiyle belirlenmesi. Journal of Turkish Science Education. 11(4),81-106.
Harman, G. (2015). Tahmin gözlem açıklama (TGA) yöntemine dayalı bir laboratuar etkinliği: hücre zarından madde geçişi. International Journal of New Trends in Arts, Sports &ScienceEducation - 2015, volume 4, issue 1.
Hofstein, A., and Lunetta, V.N. (2004). The laboratory in science education: Foundations for the twenty-first century. Science Education, 88 (1), 28-54.
Karaer, H. (2007). Yapılandırıcı öğrenme teorisine dayalı bir laboratuvar aktivitesi (kromotografi yöntemi ile mürekkebin bileşenlerine ayrılması). Amasya Ü. Kastamonu Eğitim Dergisi, 15(2), 591-602.
Karatekin, P. and Öztürk, M. (2012). Fen ve teknoloji öğretmen adaylarının genel biyoloji laboratuarında TGA tekniğiyle işlenmiş “Hücre ve Dokular” ünitesinin öğrencilerin başarı ve bilimsel süreç becerileri üzerine etkisi. Celal Bayar Üniversitesi Eğitim Fakültesi Dergisi, 2(1-2), 111-136.
Kearney, M., and Treagust, D.F. (2000a). An investigation of the classroom use of prediction-observation-explanation computer tasks designed to elicit and promote discussion of students' conceptions of force and motion. Paper Presented At The Annual Meeting of The National Association For Research in Science Teaching, New Orleans, USA
Kearney, M., and Treagust, D.F. (2000b). Constructivism as a referent in the design and development of a computer program which uses interactive digital video to enhance learning in physics. In R. Sims, M. O’Reilly & S. Sawkins (Eds.), Proceedings of The 17th Annual Conference of The Australasian Society For Computers in Learning in Tertiary Education (Pp. 57–68). Coffs Harbour: Southern Cross University.
Kearney M. and Treagust, D.F. (2001).”Constructivism as a referent in the design and development of a computer program using interactive digital video to enhance learning in physics”. Australian Journal of Educational Technology, 17(1), 64-79.
Kearney, M., Treagust, D., Yeo, S., and Zadnik, M. (2001). Student and teacher perceptions of the use of multimedia supported predict-observe-explain tasks to probe understanding. Research in Science Education, 31(4), 589-615.
Kearney, M. (2002a). Description of Predict-observe-explain strategy supported by the use of multimedia. Retrieved September 30, 2015, from Learning Designs Web site: http://www.learningdesigns.uow.edu.au/exemplars/info/LD44/index.html
Kearney, M. (2002b). Classroom use of multimedia-supported predict-observe-explain tasks to elicit and
24

promote discussion about students' physics conceptions. Unpublished PhD Dissertation, Perth: Curtin University of Technology.
Kearney, M. (2004). Classroom use of multimedia supported predict-observe- explain tasks in a social constructivist learning environment. Research in Science Education, 34(4), 427-453.
Konuk, M. and Kılıç, S. (2002). Konya ili lise öğrencilerinin osmoz ve difuzyon konusundaki kavram yanılgıları. V. Ulusal Fen Bilimleri ve Matematik Eğitimi Kongresi Bildirileri, Orta Doğu Teknik Üniversitesi, 16-18 Eylül, Ankara.
Köse, S., Coştu, B. and Keser, Ö.F. (2003). Fen konularındaki kavram yanılgılarının belirlenmesi: TGA yöntemi ve örnek etkinlikler. Pamukkale Üniv. Eğitim Fakültesi Dergisi, 1 (13),43-53.
Köse, S. (2007). The effects of concept mapping instruction on overcoming 9th grade students’ misconception about diffusion and osmosis. Journal of Baltic Science Education, 6(2): 16-25.
Köseoğlu, F., Tümay, H. and Kavak, N. (2002). Yapılandırıcı öğrenme teorisine dayanan etkili bir öğretim yöntemi –tahmin et, gözle, açıkla- buz ile su kaynatılabilir mi? V. Fen Bilimleri ve Matematik Eğitimi Kongresi Bildiriler Kitabı, Orta Doğu Teknik Üniversitesi, 16-18 Eylül, Ankara.
Kurt, H. (2013). Biyoloji öğretmen adaylarının “enzim” konusundaki bilişsel yapılarının belirlenmesi. GEFAD / GUJGEF 33(2): 211-243.
Küçüközer, H. (2008). The effects of 3D computer modelling on conceptual change about seasons and phases of the moon. Physics Education. (43), 632-636.
Lazarowitz, R. and Penso, S. (1992). High school student’s difficulties in learning biology concepts. Journal of Biological Education, 26(3), 215-223.
Liew, C.-W. and Treagust, D. F. (1995). A predict-observe-explain teaching sequence for learning about students’ understanding of heat and expansion of liquids. Australian Science Teachers’ Journal, 41(1), 68-71.
Liew, C. and Treagust, D. F. (1998). The effectiveness of predict-observe-explain tasks in diagnosing students’ understanding of science and in identifying their levels of achievement, Paper Presented At The Annual Meeting of The American Educational Research Association (San Diego, CA, April 13-17, 1998), 22.
Linenberger, K. J. and Bretz, S. L. (2012). Generating cognitive dissonance in student interviews through multiple representations. Chemistry Education Research and Practice, 13, 172–178.
Lowe, D., Newcombe, P. and Stumpers, B. (2012). Evaluation of the use of remote laboratories for secondary school science education. Research Science Education.
Marini, I. (2005). Discovering an accessible enzyme: Salivary α-amylase. Biochemistry and Molecular Biology Education, 33 (2), 112–116.
McGregor, L. and Hargrave, C. (2008). The use of “predict-observe-explain” with on-line discussion boards to promote conceptual change in the science laboratory learning environment. In K. McFerrin et al. (Eds.), Proceedings of Society for Information Technology and Teacher Education International Conference (pp. 4735-4740). Chesapeake, VA: AACE.
MEB. (2013). İlköğretim kurumları (ilkokullar ve ortaokullar) fen bilimleri dersi (3, 4, 5, 6,7 ve 8. sınıflar) fen bilimleri öğretim programı. Ankara.
Mısır, N. and Saka, A.Z. (2012a). Fizik öğretiminde elektriksel iş ve ısı konusunda tahmin et–gözle–açıkla yöntemine dayalı olarak geliştirilen etkinlik uygulaması. X. Ulusal Fen Bilimleri ve Matematik Eğitimi Kongresi, Niğde, 27-30 Haziran 2012.
Mısır, N. and Saka, A.Z. (2012b). Fizik öğretiminde iletkenin sığası konusunda TGA yöntemine dayalı olarak geliştirilen etkinliklerin uygulanması. Eğitim ve Öğretim Araştırmaları Dergisi, 1(3), 305-313.
Morgil, İ. Güngör, S. and Seçken, N. (2009). Proje destekli kimya laboratuarı uygulamalarının bazı bilişsel ve duyuşsal alan bileşenlerine etkisi. Türk Fen Eğitimi Dergisi, 6 (1), 89-107.
Mthembu, Z.P. (2001). Using predict, observe and explain technique to enhance students’ understanding of chemical reactions. Unpublished Paper (ongoing research). University of Natal King George V Natal.
Nakhleh, M. B. and Krajcik, J. S. (1993). A protocol analysis of the influence of technology on students actions, verbal commentary, and thought process during the performance of acid-base titration. Journal of Research in Science Teaching, 30, 1147-1168.
Olympiou, G. and Zacharias, Z.C. (2011). Blending physical and virtual manipulatives: an effort to improve students’ conceptual understanding through science laboratory experimentation. Science Education, 96
25

(1), 21-47.Orgill, M., and Bodner, G. (2007). Locks and keys: An analysis of biochemistry students‘use of analogies.
Biochemical Molecular and Biology Education, 35(4), 244-254.Öner-Sünkür, M., Arıbaş, S., İlhan, M. and Sünkür, M. (2013). Tahmin et–gözle–açıkla stratejisi ile
desteklenmiş yansıtıcı düşünmeye dayalı etkinliklerin 7. sınıf öğrencilerinin fen ve teknoloji dersine yönelik tutumlarına etkisi. Buca Eğitim Fakültesi Dergisi, 36.
Özdemir, H., Köse, S. and Bilen, K. (2012). Fen bilgisi öğretmen adaylarının kavram yanılgılarını gidermede tahmin et-gözle-açıkla stratejisinin etkisi: Asit - baz örneği. X. Ulusal Fen ve Matematik Eğitimi Kongresi, 27-30 Haziran 2012, Niğde.
Pekbay, C. and Kaptan, F. (2014). Fen eğitiminde laboratuar yönteminin etkililiği ile ilgili fen bilgisi öğretmen adaylarının farkındalıklarının artırılması: Nitel bir çalışma. Karaelmas Journal of Educational Sciences 2 (2014) 1-11.
Pfundt, H. and Duit, R. (2007). Bibliography: Students' alternative frameworks and science education, Kiel, Germany: Institute for Science Education at the University of Kiel.
Sarı, M. (2011). İlköğretim fen ve teknoloji derslerinin öğretiminde laboratuarın yeri ve basit araç gereçlerle yapılan fen deneyleri konusunda öğretmen adaylarının görüşlerinin değerlendirilmesi. 2nd International Conference on New Trends in Education and Their Implications (www.iconte.org), Antalya.
Selvi, M. and Yakışan, M. (2004). Üniversite birinci sınıf öğrencilerinin enzimler konusu ile ilgili kavram yanılgıları. Gazi Eğitim Fakültesi Dergisi, 24 (2), 173-182.
Sinan, O., Yıldırım, O., Kocakülah, M. S. and Aydın, H. (2006). Fen bilgisi öğretmen adaylarının proteinler, enzimler ve protein sentezi ile ilgili kavram yanılgıları. Gazi Eğitim Fakültesi Dergisi, 26 (1), 1-16
Sinan, O. (2007). Fen bilgisi öğretmen adaylarının enzimlerle ilgili kavramsal anlama düzeyleri. Necatibey Eğitim Fakültesi Elektronik Fen ve Matematik Eğitimi Dergisi, 1 (1), 1-22.
Sönmez, V. and Alacapınar, F. G. (2013). Örneklendirilmiş bilimsel araştırma yöntemleri (2. Baskı). Ankara: Anı Yayıncılık.
Sungur, S., Tekkaya, C. and Geban, O. (2000). Lise öğrencilerinin insanda dolaşım sistemi konusundaki kavram yanılgılarının belirlenmesi. IV. Fen Bilimleri Eğitimi Sempozyumu Hacettepe Üniversitesi, 23-25Haziran, Ankara.
Şahin, F. (2002). Kavram haritalarının değerlendirme aracı olarak kullanılması ile ilgili bir araştırma. Pamukkale Üniversitesi Eğitim Fakültesi Dergisi, 11(1), 18–33.
Tamir, P. (1998). Assessment and evaluation in science education: Opportunities to learn and outcomes. In Fraser, B.J. ve Tobin K.G. (Eds.), International handbook of science education (pp. 761-789).Dordrecht, The Netherlands: Kluwer Academic.
Tao, P. and Gunstone, R. (1997). The process of conceptual change in ‘Force and motion’, ERIC Document, ED 407 259.
Tekin, S. (2006). “Tahmin-gözlem-açıklama stratejisine dayalı fen bilgisi laboratuar deneyleri tasarlanması ve bunların öğrenci kazanımlarına katkılarının irdelenmesi”. VII. Fen Bilimleri Ve Matematik EğitimiKongresi Bildiriler Kitabı. Gazi Üniversitesi. 07-09 Eylül 2006 Ankara.
Tekin, S. (2008a). Kimya laboratuarının etkililiğinin aksiyon araştırması yaklaşımıyla geliştirilmesi. Kastamonu Eğitim Dergisi, 16(2), 567-576.
Tekin, S. (2008b). Tahmin-gözlem-açıklama stratejisinin fen laboratuarında kullanımı: Kükürdün molekül kütlesi nedir? Erzincan Eğitim Fakültesi Dergisi, 10(2), 173-184.
Tekkaya, C., Capa, Y. and Yılmaz, O. (2000a). Biyoloji öğretmen adaylarının genel biyoloji konularındaki kavram yanılgıları. Hacettepe Eğitim Fakültesi Dergisi,18: 37-44.
Tekkaya, C., Özkan, O., and Uzuntiryaki, E. (2000b). Öğrencilerin biyoloji konularındaki anlama zorlukları. IV. Fen Bilimleri Eğitimi Sempozyumu Hacettepe Üniversitesi, 23-25 Haziran, Ankara.
Tekkaya, C. and Balcı, S. (2003). Öğrencilerin fotosentez ve bitkilerde solunum konularındaki kavram yanılgılarının saptanması. Hacettepe Üniversitesi Eğitim Fakültesi Dergisi. 24, 101-107.
Tokur, F. (2011). TGA stratejisinin fen bilgisi öğretmen adaylarının bitkilerde büyüme gelişme konusunu anlamalarına etkisi. Yayınlanmamış yüksek lisans tezi. Adıyaman Üniversitesi, 94 s., Adıyaman.
Uluçınar, Ş., Doğan, A. and Kaya, O. N. (2008). Sınıf öğretmenlerinin fen öğretimi ve laboratuar uygulamalarına ilişkin görüşleri. Kastamonu Eğitim Dergisi, 16 (2), 485-494.
26

Voet, J.G., Bell, E., Boyer, R., Boyle, J., O'Leary, M., and Zimmerman, J.K. (2003). Recommended curriculum for a program in biochemistry and molecular biology. Biochemistry and Molecular Biology Education, 31, 161-162.
Wandersee, J. H., Mintzes, J. J., and Novak, J. D. (1994). Research on alternative conceptions in science. In D.L. Gabel (Ed.), Handbook of Research on Science Teaching and Learning (pp.177-210). New York: Simon & Schuster Macmillan.
Windschitl, M. and Andre, T. (1998). Using computer simulations to enhance conceptual change: The roles of constructivist instruction and student epistemological beliefs. Journal of Research in Science Teaching, 35(2), 145-160.
Wu, Y.T. and Tsai, C. (2005). Effects of constructivist-oriented instruction on elementary school students’ cognitive structures. Journal of Biological Education, 39 (3), 113-120.
Yavuz, S. and Çelik, G. (2013). Sınıf öğretmenliği öğrencilerinin gazlar konusundaki kavram yanılgılarına tahmin et-gözle-açıkla tekniğinin etkisi. Karaelmas Journal of Educational Sciences, 1, 1-20.
Yıldırım, O., Nakiboğlu, C. and Sinan, O. (2004). Fen bilgisi öğretmen adaylarının difuzyon ile ilgili kavram yanılgıları. BAU-Fen Bilimleri Enstitüsü Dergisi, 6, (1), 79-99.
27