oracleboss.files.wordpress.com … · web viewprogram global area - pgathe program global area, or...
TRANSCRIPT

Oracle Internal ArchitectureOracle Internal ArchitectureConsiderations for Oracle 10gOracle Background ProcessesLatch ContentionInitialization Parameters Affecting Memory UsageSub_Divisions of the SGA
ORACLE Internal Architecture
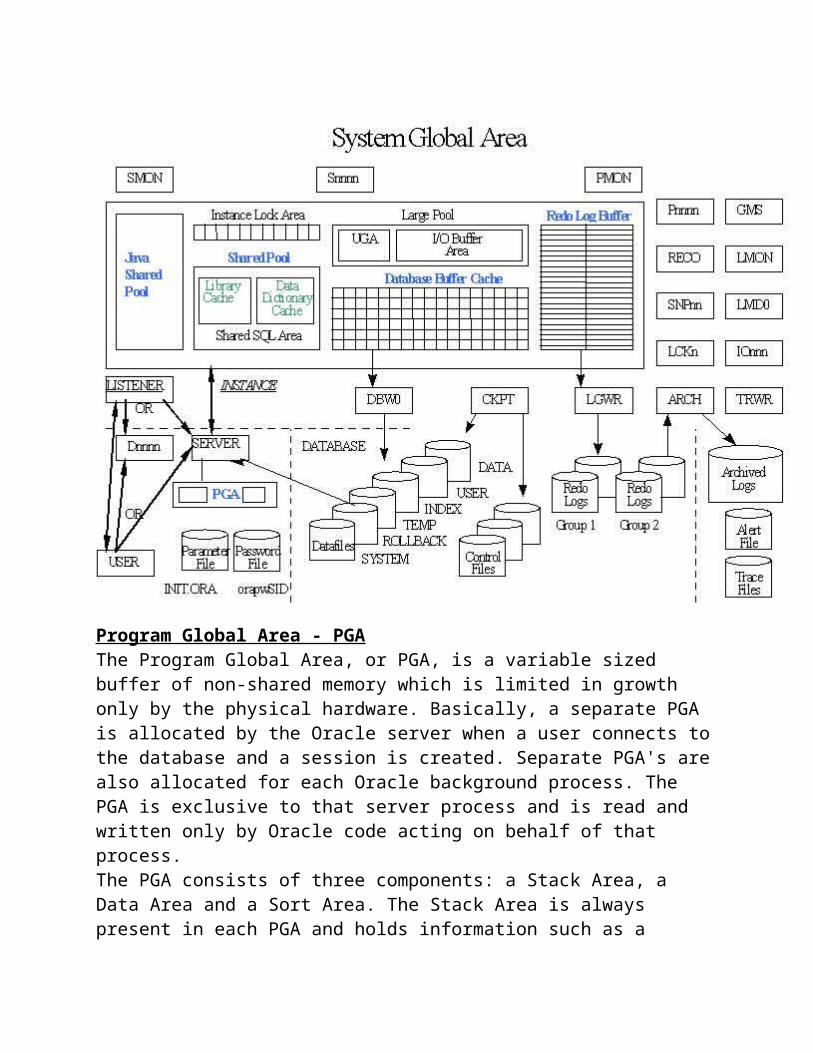
Program Global Area - PGAThe Program Global Area, or PGA, is a variable sized buffer of non-shared memory which is limited in growth only by the physical hardware. Basically, a separate PGA is allocated by the Oracle server when a user connects to the database and a session is created. Separate PGA's are also allocated for each Oracle background process. The PGA is exclusive to that server process and is read and written only by Oracle code acting on behalf of that process.The PGA consists of three components: a Stack Area, a Data Area and a Sort Area. The Stack Area is always present in each PGA and holds information such as a session's variables and arrays. The Data Area, as its name suggests, is used to store data at a session level. The Sort Area is memory allocated to store data being sorted.The initial size of the PGA is fixed depending on the operating system and the database initialization parameter settings. However the size of the PGA is variable once users start connecting. If sufficient PGA memory is not available when a user attempts to connect to an Oracle database their connection will be rejected with an Oracle error message. However, if a user connection is successful, they can never run out of PGA space. The overall size of the PGA can be affected by using Multi Threaded Server, as well as by Oracle initialization parameters such as open_links, db_files and sort_area_size. As the use of Multi Threaded Server (MTS) has the biggest impact on the sizing of the PGA, please refer to that section for more detailed information regarding PGA sizing including information on the initialization parameters as well as MTS is covered in the relevant sections of this paper.
MULTI THREADED SERVER
An Oracle database can be configured in either a dedicated server mode or in a Multi Threaded Server (or MTS) mode. Using Multi Threaded Server gives an Oracle database the ability to support tens of thousands of concurrent users. Oracle is able to accomplish this by moving user processes and memory components from the individual user processes into the SGA. This added overhead does require an increase in total SGA sizing but this is minimal compared to the overall memory reductions from the would-be dedicated user processes. Also, growth of the database memory is in a linear fashion and not exponential as would be the case in a dedicated server mode. In an MTS configuration the SGA is split into an additional segment of memory called the User Global Area (or UGA). Instead of having a dedicated process for each client request there is only one process per shared server. Also, the number of shared servers can be controlled and the number of processes is much less than with a dedicated server configuration. The process space previously used by each dedicated

server process is no longer required as there are now fewer processes. As a result, there is substantial resource saving. Parameters to setup:
- mts_dispatchers- mts_servers- mts_max_dispatchers- mts_max_servers
System Global Area - SGAAlso referred to as the Shared Global Area, the System Global Area, or SGA is a dynamically allocated segment of memory which is allocated when a database starts up. Conversely, it is de-allocated when a database instance is shut down. Unlike the PGA there is only one SGA per database instance.The SGA consists of several memory structures each of which can independently have a major impact on overall system performance. It is because of this that a majority of tuning information concentrates on the components of the SGA. Some basic rules of thumb to consider when configuring the SGA for performance are:
It is usually best to keep the entire SGA in real memory (or non-virtual memory).
On platforms which support it, you should lock the SGA into real memory using the LOCK_SGA parameter.
The size of the SGA should typically be sized so as to occupy around 60% of the total available memory.
To approximate size of the SGA (Shared Global Area), use following formula:
DB_CACHE_SIZE + DB_KEEP_CACHE_SIZE + DB_RECYCLE_CACHE_SIZE + DB_nk_CACHE_SIZE + SHARED_POOL_SIZE + LARGE_POOL_SIZE + JAVA_POOL_SIZE + LOG_BUFFERS + 1MB
Components of the SGA:
a) REDO LOG BUFFER (controlled by LOG_BUFFER)The Redo Log Buffer is an area of allocated memory within the SGA for buffering redo information prior to being written to the redo log files. The redo buffers are a crucial component of the Oracle recoverability process and are accessed for almost every database process and transaction. Even uncommitted transactions access the

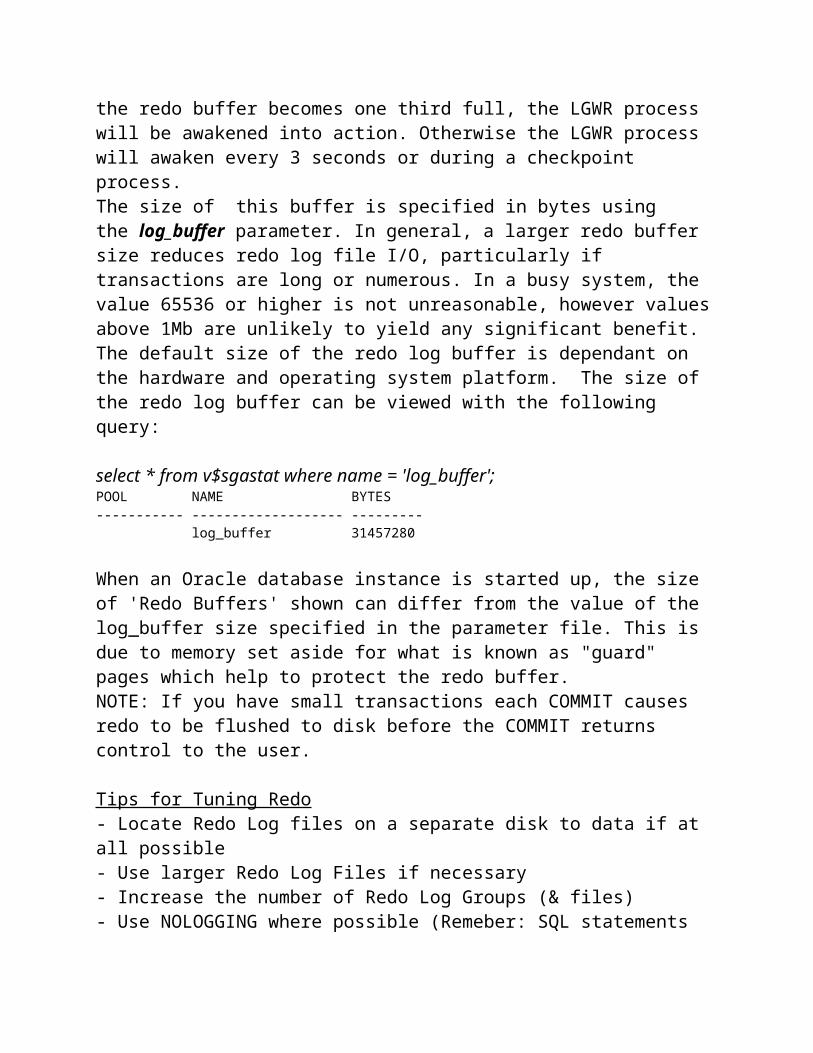
Redo Log Buffer.The Redo Log Buffer helps to absorb processing spikes caused by the memory to memory transfer of data (SGA to Redo Buffer) verses the memory to disk transfer of data (Redo Buffer to Redo Log). As the buffer fills up, the output process (LGWR) is awakened to empty the buffer to the redo log files. The LGWR process requires some lead time, since it is possible that a large transaction could generate redo faster than the LGWR process can write to disk. To help alleviate this possible bottleneck, once the redo buffer becomes one third full, the LGWR process will be awakened into action. Otherwise the LGWR process will awaken every 3 seconds or during a checkpoint process.The size of this buffer is specified in bytes using the log_buffer parameter. In general, a larger redo buffer size reduces redo log file I/O, particularly if transactions are long or numerous. In a busy system, the value 65536 or higher is not unreasonable, however values above 1Mb are unlikely to yield any significant benefit. The default size of the redo log buffer is dependant on the hardware and operating system platform. The size of the redo log buffer can be viewed with the following query:
select * from v$sgastat where name = 'log_buffer';POOL NAME BYTES----------- ------------------- --------- log_buffer 31457280
When an Oracle database instance is started up, the size of 'Redo Buffers' shown can differ from the value of the log_buffer size specified in the parameter file. This is due to memory set aside for what is known as "guard" pages which help to protect the redo buffer.NOTE: If you have small transactions each COMMIT causes redo to be flushed to disk before the COMMIT returns control to the user.
Tips for Tuning Redo- Locate Redo Log files on a separate disk to data if at all possible- Use larger Redo Log Files if necessary- Increase the number of Redo Log Groups (& files)- Use NOLOGGING where possible (Remeber: SQL statements such as UPDATE, DELETE, conventional path INSERT, and various DDL statements not listed above) are unaffected by the NOLOGGING attribute)- It is more effective to size Redo Logs larger and set LOG_CHECKPOINT_INTERVAL to a higher number (ie. 9999999 - 7x9).- Init Parameters: - LOG_BUFFER - (Increase - Evaluate)

- CHECKPOINT_INTERVAL - (Increase) - DB_BLOCK_MAX_DIRTY_TARGET - (Increase)
b) JAVA POOL (controlled by JAVA_POOL_SIZE)The Java Pool is a fixed piece of memory allocated to the Java Virtual Machine (or JVM). It is used to store the shared part of each Java class actually used per session. These are basically the read-only parts (vectors, methods, etc) and are typically about 4KB to 8KB per class. The default size of the Java Pool is 20MB. On a dedicated server only using Java stored procedures, it is possible to size the Java Pool as low as 10m as none of the per session Java states are stored in the Java Pool, for dedicated servers, it is stored in the User Global Area within the PGA. However in an Multi-Threaded Server (or MTS) environment, which is required for CORBA and EJB's, the Java Pool could be very large. CORBA and EJB's require more memory, and a large Java-intensive application could quite possibly require up to 1 gigabyte of Java Pool memory.On MTS servers, some of the User Global Area (or UGA) used for per session Java states are stored in the Java Pool. Also, because the size of the Java Pool is fixed, the total requirement for your application must be estimated and then multiplied by the number of concurrent sessions created. All UGA's must be able to fit in the Java pool. As a general guideline, the Java Pool should be sized to 50MB or higher for large applications. While the default of 20MB is adequate for most typical Java stored procedure usage. The following query can determine how much Java pool memory is being used:SELECT * FROM V$SGASTAT WHERE pool = 'java pool';
c) DATABASE BUFFER CACHE (controlled by DB_CACHE_SIZE, DB_KEEP_CACHE_SIZE, DB_RECYCLE_CACHE_SIZE and DB_xxK_CACHE_SIZE)Before explaining the purpose and operation of the database buffer cache it is important to clarify the concept of database blocks. All data stored in an Oracle database is stored on disk as blocks. A block is a fixed number of bytes in the range of 2KB to 32KB which is defined during database creation. Determining a suitable block size can have a major impact on database performance and overall disk and memory usage. Typically a data warehousing database should have a relatively large block size (around 16K) where as an OLTP intensive database will perform better with a smaller block size (around 8K).The database buffer cache is a statically sized memory cache allocated during database instance startup. It is used as a temporary memory store for blocks of data as
they are read from and written to disk. Each buffer contains a single Oracle block, which in turn could contain several rows of data. The buffer cache contains three main list structures: The Least Recently Used (or LRU) List, the Dirty Buffer (or LRUW) and the Hashed Chain List. The Dirty Buffer holds blocks that have been modified or updated and need to be written to disk. The LRU list holds free and pinned buffers which are either empty and therefore free for reuse, or blocks of data that are being accessed but not modified. The Hashed Chain List holds the same buffers as the other two lists but its buffers are arranged depending on their data block addresses. When a buffer and therefore a block are held in the Hashed Chain List it can only be in one of the two other lists at any given time.Both the Dirty Buffer and the LRU are list memory structures, meaning that blocks are always inserted on one end of the list (the most recently used end - MRU) and gradually moved to the LRU end as new blocks are inserted behind them. If a data block is never required again it will eventually be aged out of the list.When a user reads information from a table, the database first queries the Hashed Chain List to see if the required rows are already loaded into memory, if so the Hashed Chain List will determine which buffer list the block has been loaded into. This enables Oracle to return these rows without ever requiring a disk I/O operation. Otherwise if the rows are not already present in the Hashed Chain List, the blocks and their associated rows will be retrieved from the relevant database object from disk and inserted into both the Hash Chained list as well as the LRU list within the buffer cache prior to any user seeing them. Once a block is loaded into the buffer cache it is available for use by all database users.The size of the database buffer cache is controlled by the instance startup parameter: db_cache_size (previously db_block_buffers). To determine the total size of the database buffer cache simply multiply this number by the database block size -as each represents a single database block. For example: db_block_size * db_cache_size (or db_block_buffers) = data buffer cache size
In many cases simply increasing this parameter can improve system performance as use of the buffer cache can eliminate a large volume of disk i/o as many data operations can be satisfied by pure memory operations thus improving performance in orders of magnitude. However sizing the database buffer cache too large can have two drawbacks; firstly, the larger the buffer cache the larger the LRU is to be scanned to determine if a block is in memory or not and secondly, if the buffer cache is sized too large it could possibly induce unnecessary memory swapping. This must be considered when sizing the buffer cache and must not be disregarded. On many production databases it is not uncommon for the database buffer cache to occupy over two-thirds of the total SGA space.NOTE: The Oracle initialization parameter - USE_INDIRECT_DATA_BUFFERS

enables an extended buffer cache mechanism for 32-bit platforms that can support more than 4 GB of physical memory. (Not supported in Windows NT)
d) SHARED POOL (controlled by SHARED_POOL_SIZE )The Shared Pool is the area in memory allocated to Oracle for holding shared memory constructs including the data dictionary cache, library cache and the execution plans for the corresponding SQL statements. Shared SQL areas are required to process every unique SQL statement submitted to a database, however a single shared SQL area can be "shared" by multiple sessions if the same identical statement is issued. The total size of the shared pool is specified using the shared_pool_size parameter. It is specified in bytes and should not be set too low. If this parameter is set too low, you will not be able to take advantage of the memory allocated to the Database Buffer Cache, even if the database buffer cache has been set to a reasonably large size. Conversely, the size of the shared pool should not be set too high either, as too high a value can result in a waste of memory with possible adverse performance effects. Querying v$sgastat will show available free memory. It will also show how much memory is being wasted. For example:
select substr(name,1,25), value/1024/1024 "Size MB" from v$parameter where name = 'shared_pool_size';SUBSTR(NAME,1,25) Size MB------------------------- ----------shared_pool_size 90
select pool, name, round(bytes/1024/1024,2) "Size (MB)" from v$sgastat;POOL NAME Size (MB)----------- -------------------------- ----------shared pool free memory 61large pool free memory 12.25java pool free memory 26.5585938
In this example the first statement displays how large the shared pool is: 90 MB. The second statement then displays how much of the memory in the shared pool is free: 61MB. This indicates that the shared pool is being under utilized. Almost two-thirds is not being utilized. This memory could be allocated elsewhere. NOTE: The size of the shared pool (shared_pool_size) can be monitored through the data dictionary cache and the library cache. Both should be continuously monitored for an appropriate hit ratio.Inside the Sared Pool Size he also have:

1.Data Dictionary Cache2.Library Cache3.Shared SQL Area:
1. DATA DICTIONARY CACHEThe Data Dictionary Cache is where information from the data dictionary for shared access is stored. These includes information about the database, it's structures and it's users (columns definitions, tables names, users, password, privileges, etc). When a user processes a SQL statement, the data dictionary is referenced by Oracle several times. Reducing physical disk I/O is very important, hence the more information that is stored in memory, the less needs to be read from disk. The data dictionary cache is very important in this respect because this is where the data dictionary components are buffered. The only means of tuning the data dictionary is by increasing the shared pool (or shared_pool_size parameter). The data dictionary component can be monitored via V$ROWCACHE using the following select statement:select sum(gets) "Gets", sum(getmisses) "Get Misses", (1-(sum(getmisses)/sum(gets))) * 100 "Hit Ratio" from v$rowcache;Gets Get Misses Hit Ratio--------- ---------- ---------509234 272 96.946586
This value should generally be over 90%, however whenever the database instance is first started, this value will be somewhere around 85%.
2. LIBRARY CACHEThe library cache consists of shared SQL and PL/SQL areas. When SQL is executed, the statement has to be parsed. The library cache reduces the overhead of this by maintaining parsed SQL and PL/SQL in the library cache. Whenever a statement is re-executed, there is no need to re-parse the statement if the statement exists in the Library Cache. In essence, this can reduce the work of the database and improve performance, especially in an OLTP environment where the same SQL statements are typically reissued. Also, the use of bind variables in the SQL statements can also help this. More information on Bind Variables is covered in a section on its own. Statistics reflecting library cache activity is stored in the dynamic performance view V$LIBRARYCACHE. These statistics reflect all library cache activity since the most recent instance startup. Like the Data Dictionary, the only means of tuning the library cache is by increasing the shared pool (or shared_pool_size parameter).
e) LARGE POOL (controlled by LARGE_POOL_SIZE )The large pool is an optional area of the SGA similar to the shared pool, but with

restrictions on its usage. Only certain types and sizes of memory can be allocated in this pool. The memory for the large pool does not come from the shared pool but instead directly out of the SGA thus adding to the amount of shared memory Oracle needs at startup.The two main uses of the large pool are:1. For the User Global Area (UGA) of sessions connected using multi-threaded server (MTS)2. Buffering for sequential file IO (e.g. used by the recovery process when multiple IO slaves are configured)The large pool is protected by the 'shared pool' latch for memory allocation and management. However, unlike the shared pool, there is no LRU mechanism in the Large Pool. So chunks of memory are never aged out of the large pool - memory must be explicitly allocated and freed by each session. If there is no free memory left when a request is made for large pool then an ORA-4031 will be signaled.The size of the large pool is specified by the large_pool_size parameter and the minimum size chunk of memory which can be allocated is determined by the large_pool_min_alloc parameter. By default the large pool is not allocated, and needs to be explicitly specified to exist. When specifying a value for the large pool it can be specified in either megabytes or kilobytes in order to accomplish this the large_pool_size parameter can be assigned a numerical value or a number followed by the suffix "K" (for Kilobytes) or "M" (for Megabytes).If large_pool_size is left unset and the pool is required by either parallel query or backup I/O slaves, then Oracle will compute a value automatically. This occurs when parallel_automatic_tuning is TRUE. The computation will add 250k per session for the MTS server if mts_dispatchers is configured.NOTE: the default computation can yield a size that is either too large to allocate or causes performance problems. In such a case, the large_pool_size should be explicitly set to a value sufficiently small enough for the database to start.
Large Pool using MTSIf there is a large pool configured, MTS will ONLY try to use this pool for a sessions UGA. When a new session is started a small amount of memory (known as the fixed UGA) is allocated in the shared pool and the rest of the session memory (UGA) is taken from the large pool. If there is insufficient space left in the large pool and ORA-4031 error will be returned. Memory is allocated from the large pool in chunks of at least large_pool_min_alloc bytes in size to help avoid memory fragmentation. This can impact the amount of memory used by each MTS session when compared to memory usage with no large pool configured. If no large pool is configured MTS will use the shared pool for the entire UGA as was the case in Oracle version 7x.

MULTIPLE DATABASE BUFFER POOLS (more information HERE ) Multiple Database Buffer Pools are, as their name suggests, separately configured pools within the database buffer cache. With multiple buffer pools we are able to segregate memory operations based on the types of objects being accessed. For example one table could contain information that is rarely accessed so storing it's blocks in memory over an extended period of time could be seen as a waste of resources. On the other hand another table could be frequently accessed and the I/O requirements to constantly reload its blocks into memory could be a time consuming process. Hence with Multiple buffer pools we are able to partition our buffer pool memory into separate areas that can be used to store different types of data objects to help overcome this issue. Oracle provides us with three separate types of buffer pools that can be configured. They are Keep, Recycle and Default.
Keep- Intended for frequently accessed objects- Lookup Tables and dimensions are good candidates for the Keep pool- When sizing the Keep pool it should be sized so it can contain the sum of all objects intended to be stored, as objects can still be aged out of this pool if there is insufficient space
Recycle- Intended for rarely accessed or large objects which could be considered a waste of space if cached- Randomly accessed large tables are good candidates for the Recycle pool- The Size of Recycle pool can be relatively small as the intention of this pool is for the buffers to be frequently overwritten
Default- Contains the data blocks that are not explicitly assigned to any buffer pool- Contains objects that are explicitly assigned to the DEFAULT pool- There is no need to define the size and number of LRU latches for the Default buffer pool as it assumes what is not explicitly assigned to the Keep or Recycle pools
The are two new initialization parameters added for configuring Multiple Buffer Pools they are buffer_pool_keep and buffer_pool_recycle. When setting these parameters the number of buffers/blocks are specified along with the number of LRU latches. In addition the db_block_lru_latches parameter must be specified.
NOTE: Multiple Buffer Pools each contain their own Dirty Buffer Cache and Hash Chain Lists in conjunction with the addition LRUs specified during their creation.

When configuring these parameters it is also important to realize that the number of latches are subtracted from the total number allocated to the instance, just like the buffers. There must be a minimum of 50 buffers per LRU latch allocated to each buffer pool.
An example of how a parameter file may look follows:DB_BLOCK_SIZE = 8192DB_BLOCK_BUFFERS (or db_cache_size) = 20000BUFFER_POOL_KEEP = (buffers:8000, lru_latches:4)BUFFER_POOL_RECYCLE = (buffers:1600, lru_latches:2)DB_BLOCK_LRU_LATCHES = 12
In this scenario our block size is 8KB and our total memory allocation is 20,000 buffers each at 8KB giving us a total buffer cache of approximately 163MB. This buffer cache is then broken down into three separate pools: Keep Pool at approximately 65MB, Recycle Pool at approximately 12MB and the remainder of 86MB and 12 latches going to the default pool. Of course in order for a database object to take advantage of this it is necessary for the object to be either created or modified with the buffer parameters specified within the storage clause. The following example demonstrates this:
CREATE TABLE Foo_Keep(nfoo number (1),vfoo varchar2(5) )STORAGE (buffer_pool KEEP)/Table created.
CREATE TABLE Foo_Default(nfoo number (1),vfoo varchar2(5) )STORAGE (buffer_pool DEFAULT)/Table created.
ALTER TABLE Foo_Recycle STORAGE (buffer_pool RECYCLE);Table altered.
SELECT table_name, buffer_poolFROM user_tables

WHERE table_name LIKE 'FOO%'/
TABLE_NAME BUFFER_POOL------------------ -----------FOO_DEFAULT DEFAULTFOO_KEEP KEEPFOO_RECYCLE RECYCLE
NOTE: When using Multiple Buffer Pools, it is important to remember that the placement of objects within a specific buffer pool is explicit. Remember that objects are not explicitly assigned a buffer pool will end up in the Default Pool. This means that the adoption of a multiple buffer pool strategy is an all or nothing approach. The benefits of using multiple pools are enormous but can be easily outweighed if configured incorrectly. Finally, the Oracle8i Tuning Guide has an excellent section that cover the steps taken to determine whether or not multiple buffer pools will be of benefit to your application.
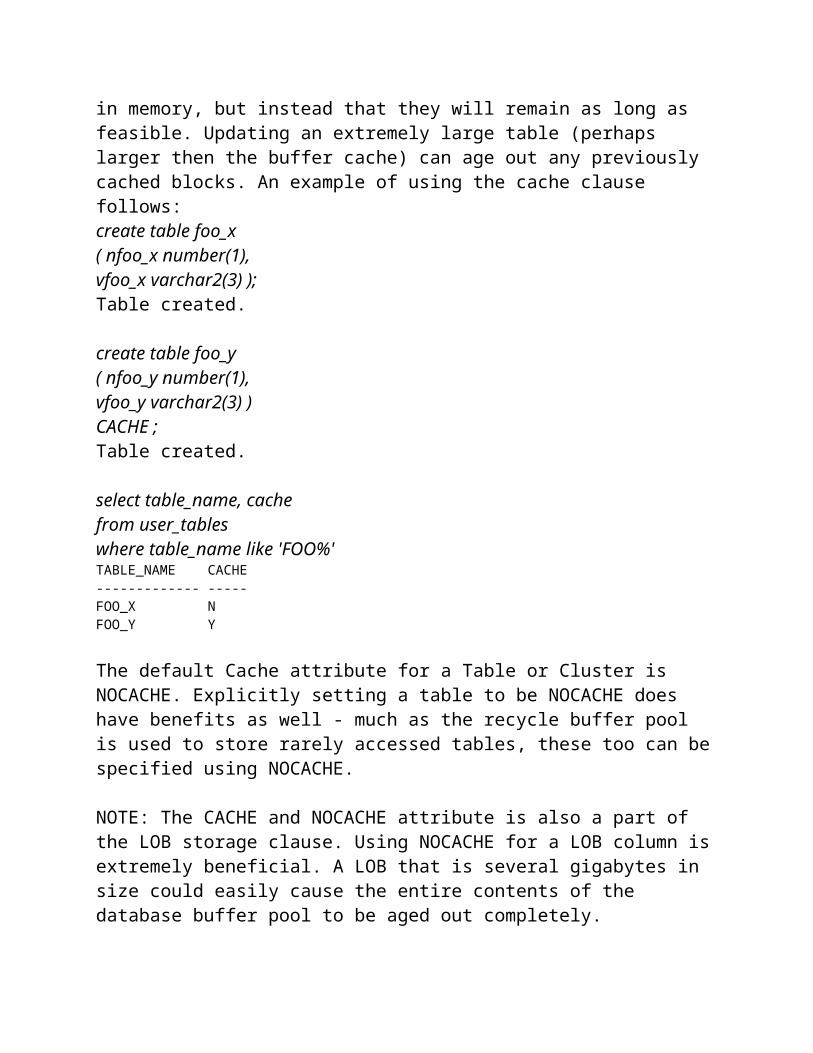
CACHING ORACLE OBJECTSIn an effort to help a table or cluster remain in memory longer, Oracle provides the CACHE command as part of a table or cluster's storage attributes. If a table or cluster has the Cache attribute set, the blocks of that object will be inserted into the MRU end of the LRU list in the Database Buffer Cache whenever they are accessed. This does not guarantee the blocks to remain permanently in memory, but instead that they will remain as long as feasible. Updating an extremely large table (perhaps larger then the buffer cache) can age out any previously cached blocks. An example of using the cache clause follows:create table foo_x( nfoo_x number(1),vfoo_x varchar2(3) );Table created.
create table foo_y( nfoo_y number(1),vfoo_y varchar2(3) )CACHE ;Table created.
select table_name, cachefrom user_tableswhere table_name like 'FOO%'TABLE_NAME CACHE

------------- -----FOO_X NFOO_Y Y
The default Cache attribute for a Table or Cluster is NOCACHE. Explicitly setting a table to be NOCACHE does have benefits as well - much as the recycle buffer pool is used to store rarely accessed tables, these too can be specified using NOCACHE.
NOTE: The CACHE and NOCACHE attribute is also a part of the LOB storage clause. Using NOCACHE for a LOB column is extremely beneficial. A LOB that is several gigabytes in size could easily cause the entire contents of the database buffer pool to be aged out completely.
Oracle also provides the following two initialization parameters to assist with caching of other objects
Cursors_Space_For_Time- Default value is FALSE- If set to TRUE, a shared SQL area cannot be aged out of the shared pool until all application cursors associated with its statement are closed. This can improve performance as each referenced cursor remains in memory. When set to TRUE this can possibly lead to more memory consumption
Session_Cached_Cursors- Default value is 0 - can be set dynamically- specifies the number of session cursors to cache. Repeated parse calls of the same SQL statement cause the session cursor for that statement to be moved into the session cursor cache. Subsequent parse calls will find the cursor in the cache and need not reopen the cursor.- An LRU list is used to maintain entries in the session cursor cache.
Considerations on ORACLE 10gUsing Oracle’s Automatic Shared Memory Tuning, you can instruct Oracle to manage a subset of the components that make up the SGA by merely telling the instance the target size of the SGA through the new SGA_TARGET parameter. Oracle will then pool from this value and dynamically distribute memory across selected components of the SGA. You don’t need to set values for SHARED_POOL_SIZE, JAVA_POOL_SIZE, LARGE_POOL_SIZE, or DB_CACHE_SIZE as Oracle will automatically size them

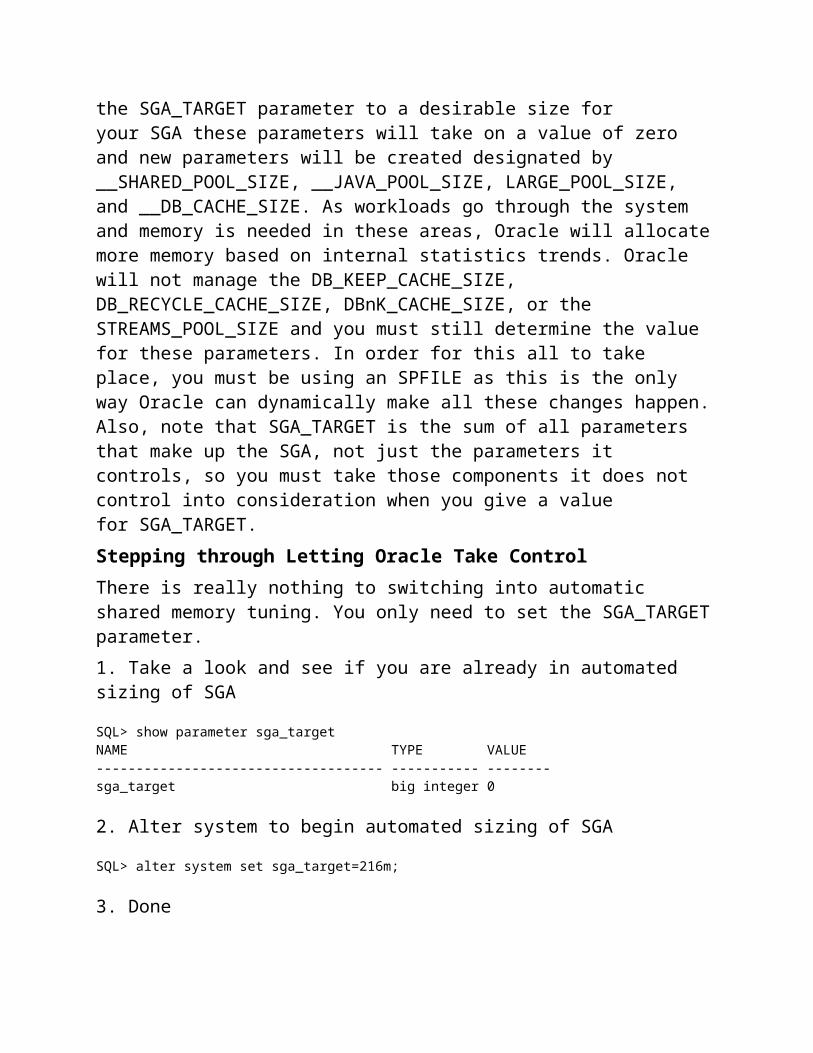
for you. Once you set the SGA_TARGET parameter to a desirable size for your SGA these parameters will take on a value of zero and new parameters will be created designated by __SHARED_POOL_SIZE, __JAVA_POOL_SIZE, LARGE_POOL_SIZE, and __DB_CACHE_SIZE. As workloads go through the system and memory is needed in these areas, Oracle will allocate more memory based on internal statistics trends. Oracle will not manage the DB_KEEP_CACHE_SIZE, DB_RECYCLE_CACHE_SIZE, DBnK_CACHE_SIZE, or the STREAMS_POOL_SIZE and you must still determine the value for these parameters. In order for this all to take place, you must be using an SPFILE as this is the only way Oracle can dynamically make all these changes happen. Also, note that SGA_TARGET is the sum of all parameters that make up the SGA, not just the parameters it controls, so you must take those components it does not control into consideration when you give a value for SGA_TARGET.Stepping through Letting Oracle Take ControlThere is really nothing to switching into automatic shared memory tuning. You only need to set the SGA_TARGET parameter.1. Take a look and see if you are already in automated sizing of SGA
SQL> show parameter sga_targetNAME TYPE VALUE------------------------------------ ----------- --------sga_target big integer 0
2. Alter system to begin automated sizing of SGA
SQL> alter system set sga_target=216m;
3. DoneWhat happens when you switch to Automatic Shared Memory Tuning is a bit interesting. After you alter SGA_TARGET parameter, your SPFILE will undergo a change and now have the following parameters defined. Note that DIEGO is my instance name and will take on whatever the instance name is.
DIEGO.__db_cache_size=25165824DIEGO.__java_pool_size=50331648DIEGO.__large_pool_size=8388608DIEGO.__shared_pool_size=83886080
ORACLE BACKGROUND PROCESSES

At startup time, Oracle creates a number of system background processes for each instance to perform system functions:
The System Monitor (SMON) performs instance recovery during startup, cleans up temporary segments that are no longer in use, recovers dead transactions skipped during crash and instance recovery because of file-read or offline errors, and coalesces small chunks of contiguous free space into larger blocks of contiguous space for easier allocation by Oracle.. It carries out a crash recovery process when an insance crashed. In a Real Application Clusters database, the SMON process of one instance can perform instance recovery for other instances that have failed. SMON also cleans up temporary segments that are no longer in use and recovers dead transactions skipped during system failure and instance recovery because of file-read or offline errors. These transactions are eventually recovered by SMON when the tablespace or file is brought back online.
The Process Monitor (PMON) performs recovery when a user process fails. PMON cleans up the cache and frees resources that the process was using. PMON also restarts failed dispatcher and shared server processes.
The Database Writer (DBWR) writes modified (dirty) data blocks from the database cache to data files on disk using a least recently used algorithm. Whenever possible, DBWR writes dirty buffers to disk using a multi-block write mechanism. DBWR manages the buffer cache so that user processes can always find free buffers. The DBWR process is signaled to write dirty buffers to disk under the following conditions:
o when the dirty list reaches a threshold length defined by the init.ora parameter DB_BLOCK_WRITE_BATCH;
o when a free buffer has not been found after n buffers have been scanned (where n is defined by DB_BLOCK_MAX_SCAN_CNT in init.ora);
o when a timeout occurs (every three seconds);o when a checkpoint occurs; ando when the Log Writer (LGWR) signals DBWR.
The LGWR is triggered during several internal events (commit, checkpoint, and log write timeout), as well as when the redo log buffer is one-third full. This process writes the redo log buffer in memory to the redo log file on disk. During each Checkpoint (CKPT), the LGWR updates file headers if a CKPT process is not configured to perform this function.
The optional CKPT process updates the headers of all data files during checkpoint processing. If the init.ora CHECKPOINT_PROCESS parameter is enabled, this process can improve system performance by freeing the LGWR to

concentrate on the redo log buffer. The CKPT process does not write data blocks to disk; this is performed by the DBWR.
The Recoverer (RECO) is started when distributed transactions are permitted and the init.ora parameter DISTRIBUTED_TRANSACTIONS is greater than zero. The Oracle distributed option uses the RECO process to automatically resolve distributed transaction failures. The recoverer process is used to resolve distributed transactions that are pending due to a network or system failure in a distributed database. At timed intervals, the local RECO attempts to connect to remote databases and automatically complete the commit or rollback of the local portion of any pending distributed transactions.
The Archiver (ARC) copies online redo log files, once they become full, to a specified storage device or location. ARC is present only when the database is started in ARCHIVELOG mode and automatic archiving is enabled.
Lock (LCKn) processes are used in conjunction with the Parallel Server option. Up to 10 LCK processes (LCK0 through LCK9) are used to control inter-instance locking.
Dispatcher (Dnnn) processes, used with the MTS configuration, allow user processes to share a limited number of shared server processes. At least one dispatcher process must be created for each network protocol used to communicate with Oracle. It is used in a shared server environment.
Parallel Query server processes (Pnnn) are used with the Parallel Query option in Oracle 7.1 or higher. With this option, a query coordinator (QC) intercepts queries, decides if they should be split into multiple smaller queries, and sends them to the pool of available query servers for processing. Query servers are also used for parallel index creation and data loads. The number of query servers automatically increases or decreases (within the upper and lower limits set by the administrator) to accommodate changing workload levels.
Snapshot (SNPn) processes are used with the Oracle distributed option to automatically refresh table snapshots. These processes “wake-up” periodically when snapshots are scheduled to be automatically refreshed.
The Lock Monitor (LMON) Meant for Parallel server setups, Lock Monitor manages global locks and resources. It handles the redistribution of instance locks whenever instances are started or shutdown. Lock Monitor also recovers instance lock information prior to the instance recovery process. Lock Monitor co-ordinates with the Process Monitor to recover dead processes that hold instance locks.
The Job Queue Processes (J000) carry out batch processing. All scheduled jobs are executed by these processes. The initialization parameter JOB_QUEUE_PROCESSES specifies the maximum job processes that can be run concurrently. If a job fails with some Oracle error, it is recorded in the alert

file and a process trace file is generated. Failure of the Job queue process will not cause the instance to fail.
The Shared Server Processes (SNNN) Intended for Shared server setups (MTS). These processes pickup requests from the call request queue, process them and then return the results to a result queue. The number of shared server processes to be created at instance startup can be specified using the initialization parameter SHARED_SERVERS.
The Managed recovery process (MRP) applies archived redo log to the standby database.
The remote file server process (RFS) on the standby database receives archived redo logs from the primary database.
AQ Time Manager (QMNn). A queue monitor process which monitors the message queues. Used by Oracle Streams Advanced Queuing.
Jnnn (10g): These are job queue processes which are spawned as needed by CJQ0 to complete scheduled jobs
The Automatic Shared Memory Management feature uses a new background process named Memory Manager (MMAN new on 10g). MMAN serves as the SGA Memory Broker and coordinates the sizing of the memory components. The SGA Memory Broker keeps track of the sizes of the components and pending resize operations
RVWR (10g) for Flashback database- Flashbacking a database means going back to a previous database state.- The Flashback Database feature provides a way to quickly revert an entire Oracle database to the state it was in at a past point in time.- This is different from traditional point in time recovery.- A new background process Recovery Writer ( RVWR) introduced which is responsible for writing flashback logs which stores pre-image(s) of data blocks - One can use Flashback Database to back out changes that:- Have resulted in logical data corruptions.- Are a result of user error.- This feature is not applicable for recovering the database in case of media failure.- The time required for flashbacking a database to a specific time in past is DIRECTLY PROPORTIONAL to the number of changes made and not on the size of the database.
CTWR (10g). This is a new process Change Tracking Writer (CTWR) which works with the new block changed tracking features in 10g for fast RMAN incremental backups.
MMNL (10g) The Memory Monitor Light (MMNL) process is a new process in 10g which works with the Automatic Workload Repository new features (AWR) to write out full statistics buffers to disk as needed.

MMON (10g) The memory monitor (MMON) process was introduced in 10g and is associated with the Automatic Workload Repository new features used for automatic problem detection and self-tuning. MMON writes out the required statistics for AWR on a scheduled basis.
CJQn (10g) This is the Job Queue monitoring process which is initiated with the job_queue_processes parameter. This is not new. More Info DOCID=222190.1
LATCH CONTENTIONA latch is a type of a lock that can be very quickly acquired and freed. Latches are typically used to prevent more than one process from executing the same piece of code at a given time. A process acquires a latch when working with a structure in the SGA. It continues to hold the latch for the period of time it works with the structure. The latch is dropped when the process is finished with the structure. Each latch protects a different set of data, identified by the name of the latch. If a required latch is busy, the process requesting it spins, tries again and if still not available, spins again. The loop is repeated up to a maximum number of times determined by the initialization parameter _SPIN_COUNT. If after this entire loop, the latch is still not available, the process must yield the CPU and go to sleep. Initially is sleeps for one centisecond. This time is doubled in every subsequent sleep. This causes a slowdown to occur and results in additional CPU usage, until a latch is available. The CPU usage is a consequence of the "spinning" of the process. "Spinning" means that the process continues to look for the availability of the latch after certain intervals of time, during which it sleeps. To increase the number of latches available to your database, increase the DB_BLOCK_LRU_LATCHES to a value of two times the number of CPUs on the server machine. The default value of this parameter is half the number of CPUs on your machine. Increasing this value make more latches available and reduce latch contentionThe main cause for Latch Contention, and therefore poor performance, is because of poorly written SQL statements, frequent context switches etc. However Oracle provides several initialization parameters which can help reduce Latch contention to a large degree, although the best solution is still to resolve poorly written SQL code where possible. Four areas which can help in addressing Latch contention and thus improve overall system performance are:- Parsed SQL statements may be aged out of the SGA if insufficient memory is allocated to shared pool. In this case the shared_pool_size parameter should beincreased.
- Use of identical SQL statements, this helps can help in sharing of SQL statements which can both overcome shared pool usage as well as parsing efficiency.- Using BIND variables wherever possible will permit sharing of SQL statements which can reduce shared pool usage while reducing parsing.- The use of the Cursor_Sharing parameter.
More information HERE
INITIALIZATION PARAMETERS AFFECTING MEMORY USAGE:DB_BLOCK_BUFFERS (or db_cache_size)Refer to the section on the Database Buffer Cache in this document for more information on this parameter.Specified as an integer value representing the number of buffers available in the database buffer cache. To determine the true size of the database buffer cache, multiply this parameter by the db_block_size. The total size of the database buffer cache should typically be sized to represent two-thirds of the SGA.NOTE: The db_block_buffer parameter is the single most significant parameter affecting performance on an Oracle database.
SHARED_POOL_SIZERefer to the section on the Shared Pool in this document for more information on this parameter.The Shared_Pool_Size is specified in bytes. The default size for this setting parameter is never adequate and can usually be multiplied by a factor of 10 on most platforms. However before haphazardly increasing the value for this parameter the steps outlined in the Shared Pool section of paper should be read und understood. This does not mean for us and the to all versions of Oracle and is measured in bytes. This is the memory that is allocated to Oracle for areas like the data dictionary, stored procedures, and statements. Comprising a large part of the SGA, the Shared_Pool_Size is comprised of the dictionary cache and library cache, and just like DB_Block_Buffers (or db_cache_size) above, should not be set too low. If this parameter is set too low, you will not be able to take advantage of the memory that has been allocated by the DB_Block_Buffers (or db_cache_size), even if the DB_Block_Buffers (or db_cache_size) has been set a reasonable value.
SORT_AREA_SIZESpecified in bytes. Oracle allocates a Sort Area sized to the value of Sort_Area_Size

to every user process for performing data sorts. The Sort Area is memory that is allocated outside of the SGA. In a dedicated server environment it is easy to monitor the effects of modifying this parameter by monitoring the size of the user processes via tools such as ps -ef. If the Sort_Area_Aize is set too small, a process will be forced to sort on disk in the user's temporary tablespace.
SORT_AREA_RETAINED_SIZESpecified in bytes. The Sort_Area_Retained_Size parameter is used in conjunction with the Sort_Area_Size parameter. It controls the size that the Sort_Area_Size will be reduced to once a user sort is complete. This parameter should be set less than or equal to the Sort_Area_Size parameter to be truly effective.
SHARED_POOL_RESERVE_SIZESpecified in bytes. The Shared_Pool_Reserve_Size parameter controls the allocation of a portion of the shared pool for storing large objects. The default setting of this parameter is 5% of the shared_pool_size setting. Setting this to a relatively low value ensures that the majority of the area within the shared pool is not being used for large objects, but rather in a "separate area".
SHARED_MEMORY_ADDRESSIt is recommended you refer to the Oracle Installation Guide which is shipped with your Oracle software if you are considering using this parameter as it is very platform specific
HI_SHARED_MEMORY_ADDRESSIt is recommended you refer to the Oracle Installation Guide which is shipped with your Oracle software if you are considering using this parameter as it is very platform specific
LOG_BUFFERRefer to the section on the Redo Log Buffer in this document for more information on this parameter.
JAVA_POOL_SIZERefer to the section on the java Pool in this document for more information on this parameter.
LARGE_POOL_SIZERefer to the section on the Large Pool in this document for more information on this parameter.
BUFFER_POOL_KEEPRefer to the section on Multiple Buffer Pools in this document for more information on this parameter.
BUFFER_POOL_RECYCLERefer to the section on Multiple Buffer Pools in this document for more information on this parameter.
DB_BLOCK_LRU_LATCHESSpecified as an integer, DB_Block_LRU_Latches indicates the maximum number of LRU latch sets. The buffers of a buffer pool are equally divided among the working LRU latch sets of the buffer pool so that each buffer is protected by one LRU latch. Normally, the more latches you specify, the less contention exists for those latches. However, too many latches may result in small LRU lists, potentially reducing the cache life of a database block. Typically you should set this parameter to the number of CPUs or a multiple of that number. The default setting for this parameter is equal to CPU_COUNT/2 , which is usually adequate. Refer to the section on Multiple Buffer Pools in this document for more information on this parameter.
Sub-divisions of the SGASample from the command SHOW SGA:
Total System Global Area 23460696 bytes Fixed Size 72536 bytes Variable Size 22900736 bytes Database Buffers 409600 bytes Redo Buffers 77824 bytes
* Total System Global Area - Total in bytes of all the sub-divisions that makes up the SGA.
* Fixed Size - Contains general information about the state of the database and the instance, which the background processes need to access. - No user data is stored here. - This area is usually less than 100k in size.
* Variable Size - This section is influenced by the following init.ora parameters

shared_pool_size large_pool_size java_pool_size - See 'Approximating Size of the SGA' below for version specific information.
* Database Buffers - Holds copies of data blocks read from datafiles. size = db_block_buffers * block size
* Redo Buffers - A circular buffer in the SGA that holds information about changes made to the database. - Enforced mininum is set to 4 times the maximum database block size for the host operating system.
Approximating size of the SGA
In Oracle9i, the SGA can be configured as in prior releases to be static, or can now be dynamically configured.The size of the dynamic SGA is determined by the values of the following database initialization parameters: DB_BLOCK_SIZE, DB_CACHE_SIZE, SHARED_POOL_SIZE, and LOG_BUFFER.
Beginning with Oracle9i, the SGA infrastructure is dynamic. This means that the following primary parameters used to size the SGA can be changed while the instance is running:- Buffer cache ( DB_CACHE_SIZE) -- the size in bytes of the cache of standard blocks- Shared pool ( SHARED _POOL_SIZE) -- the size in bytes of the area devoted to shared SQL and PL/SQL statements- Large pool (LARGE_POOL_SIZE) (default is 0 bytes) -- the size in bytes of the large pool used in shared server systems for session memory, parallel execution for message buffers, and by backup and restore processes for disk I/O buffers.
The LOG_BUFFER parameter is used when buffering redo entries to a redo log. It is a static parameter and represents a very small portion of the SGA and can be changed only by stopping and restarting the database to read the changed value for this parameter from the initialization parameter file (init.ora).
Note that even though you cannot change the MAX_SGA_SIZE parameter value dynamically, you do have the option of changing any of its three dependent primary

parameters: DB_CACHE_SIZE, SHARED_POOL_SIZE, and LARGE_POOL_SIZE to make memory tuning adjustments on the fly.
To help you specify an optimal cache value, you can use the dynamic DB_CACHE_ADVICE parameter with statistics gathering enabled to predict behavior with different cache sizes through the V$DB_CACHE_ADVICE performance view. Use the ALTER SYSTEM...SET clause... statement to enable this parameter.
Beginning with Oracle9i, there is a concept of creating tablespaces with multiple block sizes and specifying cache sizes corresponding with each block size. The SYSTEM tablespace uses a standard block size and additional tablespaces can use up to four non-standard block sizes.
The standard block size is specified by the DB_BLOCK_SIZE parameter. Its cache size is specified by the DB_CACHE_SIZE parameter. Non-standard block sizes are specified by the BLOCKSIZE clause of the CREATE TABLESPACE statement. The cache size for each corresponding non-standard block size is specified using the notation: DB_nK_CACHE_SIZE parameter, where the value n is 2, 4, 8, 16, or 32 Kbytes.
The standard block size, known as the default block size, is usually set to the same size in bytes as the operating system block size, or a multiple of this size. The DB_CACHE_SIZE parameter, known as the DEFAULT cache size, specifies the size of the cache of standard block size (default is 48M bytes). The system tablespace uses the standard block size and the DEFAULT cache size.
Either the standard block size or any of the non-standard block sizes and their associated cache sizes can be used for any of the other tablespaces. Ifyou intend to use multiple block sizes in your database storage design, you must specify at least the DB_CACHE_SIZE and one DB_nK_CACHE_SIZE parameter value. You must specify all sub-caches for all the other non-standard block sizes that you intend to use. This block size/cache sizing scheme lets you use up to four different non-standard block sizes for your tablespaces and lets you specify respective cache sizes for each corresponding block size.
Because the DB_BLOCK_SIZE parameter value can be changed only by re-creating the database, the value for this parameter must be chosen carefully and remain unchanged for the life of the database.
To approximate size of the SGA (Shared Global Area), use following formula:

DB_CACHE_SIZE + DB_KEEP_CACHE_SIZE + DB_RECYCLE_CACHE_SIZE + DB_nk_CACHE_SIZE + SHARED_POOL_SIZE + LARGE_POOL_SIZE + JAVA_POOL_SIZE + LOG_BUFFERS + 1MB
NOTE: ADD IN EACH DB_nk_CACHE_SIZE. THERE CAN BE UP TO 4 DB_nk_CACHE_SIZE (2, 4, 8, 16, 32k) DEFINED. ONE OF THE BLOCK SIZES IS THE DEFAULT BLOCK SIZE AND ITS CACHE SIZE IS DEFINED BY DB_CACHE_SIZE.
For more information see Note:61623.1
Calculating the Size of the Shared Pool (Note 61340.1)Shared pool is the amount of fixed, preallocated space in the SGA for use by multi-threaded server session PGA, shared SQL area, and other small, dynamically allocated SGA data structures.While analyzing shared pool sizing, it is helpful to first increase the shared pool to a very large value, so that the dynamically allocated SGA structures may be allowed to expand to a desirable size. Once this sizing exercise has been completed, the shared pool may be downsized to the appropriate value.
Formula Max Session Memory * No. of concurrent users + Total Shared SQL Area Usage + PLSQL Sharable Memory + Minimum 30% Free Space ---------------------------------------------- = Minimum Allowable Shared Pool
Example Find the SID for an example user session: select sid from v$process p, v$session s where p.addr=s.paddr and s.username='OPS$JSMITH'; SID ---------- 29
Get the maximum session memory for this session: select value from v$sesstat s, v$statname n where s.statistic# = n.statistic# and n.name = 'session uga memory max' and sid=29; VALUE

---------- 273877
Get the total shared SQL area: select sum(sharable_mem) from v$sqlarea; SUM(SHARAB ---------- 8936625
Get the PLSQL sharable memory area: select sum(sharable_mem) from v$db_object_cache; SUM(SHARAB ---------- 4823537
Example shared pool calculation: 274K shared memory * 400 users + 9M Shared SQL Area + 5M PLSQL Sharable Memory + 60M Free Space (30%) --------------------------------- = 184M Shared Pool
In this example, the recommended shared pool value is 184M.