contents · vii list of figures figure page figure 1.1
TRANSCRIPT

i
CONTENTS
Page
1. ENERGY, ENVIRONMENT AND ECOSYTEM
RELATIONS .................................................................. 1
1.1. Ecology as a Course ................................................ 2
1.2. Ecological Terms ..................................................... 3
1.3. Components of Ecosystem ...................................... 5
1.4. Biogeochemical Cycling ......................................... 10
1.4.1. The water cycle.............................................. 11
1.4.2. The carbon cycle ........................................... 11
1.4.3. The nitrogen cycle ......................................... 13
1.4.4. The phosphorous cycle .................................. 14
1.4.5. The sulfur cycle ............................................. 16
1.5. Pollutants in Ecosystems ......................................... 17
2. ECOLOGICAL FOOTPRINTING FOR ENERGY
SYSTEMS ...................................................................... 22
2.1. Ecological Footprint ................................................ 23
2.1.1. Need for ecological footprinting ................... 23
2.1.2. Ecological footprint and related terms........... 25
2.1.3. Use of EF values ............................................ 29
2.1.4. Components of ecological footprint .............. 31
2.2. Carbon Footprinting ................................................ 32
2.3. Ecological Footprints of Energy Production
Systems ................................................................... 35
2.3.1. Comparison of energy systems ...................... 37
2.4. Nuclear Energy ........................................................ 41
3. CONVENTIONAL ENERGY PRODUCTION
SYSTEMS AND ENVIRONMENTAL IMPACTS:
THERMAL POWER PLANTS ...................................... 48
3.1. How Does a Thermal Power Plant Work? ............... 49
3.2. Environmental Impacts of Thermal Power Plants ... 50
3.3. Global Climate Change ........................................... 56
3.3.1. Causes of climate change .............................. 57

ii
Page
3.3.2. Environmental consequences of global
warming ......................................................... 62
3.3.3. Socioeconomic consequences of global
warming ......................................................... 63
3.4. Ozone Depletion ...................................................... 63
3.5. Acid Rain ................................................................ 67
3.5.1. Environmental effects of acid rain ................ 68
3.5.2. Effect of acid rain on stone buildings and
monuments .................................................... 71
4. ECOLOGICAL AND ENVIRONMENTAL
DIMENSIONS OF NUCLEAR POWER PLANTS ...... 73
4.1. Introduction ............................................................. 74
4.2. Riskful Aspects of Nuclear Power Plants ................ 79
4.2.1. Uranium mining ............................................ 79
4.2.2. Uranium enrichment ...................................... 80
4.2.3. Operation of a reactor .................................... 80
4.2.4. Disposal of wastes ......................................... 82
4.2.5. Dismantling ................................................... 85
4.2.6. Cost ............................................................... 86
4.2.7. Nuclear plants as being a target in wars
and terrorism ................................................. 87
4.3. Evaluation of nuclear Power Plants From
Ecological Aspects .................................................. 88
5. SOLAR ENERGY SYSTEMS AND
ENVIRONMENTAL EFFECTS ................................ 96
5.1. Technological Aspects of Energy Generation in
Solar Energy Systems .......................................... 97
5.1.1. Solar thermal .............................................. 98
5.1.1.1. Components of a solar thermal
system ........................................... 98
5.1.2. Concentrated solar power (CSP) ................ 102
5.1.2.1. Components of a solar CSP ........... 103
5.1.3. Solar PV ..................................................... 106

iii
Page
5.1.3.1. Main components of a solar PV
systems ......................................... 108
5.2. Environmental Impacts from Solar Energy
Systems ............................................................... 109
5.2.1. Environmental impacts of solar thermal ...... 111
5.2.2. Environmental impacts of concentrated
solar power ................................................ 113
5.2.2.1. Photovoltaic .................................. 115
6. WIND ENERGY ............................................................ 121
6.1. Wind Energy ........................................................... 122
6.2. Wind Turbine Elements .......................................... 122
6.2.1 Rotor Blades ................................................... 123
6.2.2 Nacelle ............................................................ 126
6.2.3 Wind turbine towers ....................................... 126
6.3. Environmental Impacts from Wind Energy Use ..... 127
6.3.1. Impacts on wildlife ........................................ 128
6.3.2. Visual impacts ............................................... 128
6.3.3. Noise impacts ................................................ 130
7. WAVE, TIDAL AND HYDROGEN ENERGY ............ 133
7.1. Wave and Tidal Potential for Electricity
Production ............................................................... 134
7.2. Environmental Impact of Wave and Tidal
Energy ..................................................................... 144
7.3. Hydrogen Energy .................................................... 147
7.3.1. Hydrogen production technologies ................ 150
7.3.2. Environmental impact ................................... 154
8. GEOTHERMAL ENERGY ........................................... 158
8.1. Geothermal Power Production ......................... 162
8.2. Environmental Impact of Using Geothermal
Energy .............................................................. 173
9. HYDROPOWER ENERGY ........................................... 178
9.1. Hydropower Systems .............................................. 178
9.2. Environmental Impacts ........................................... 197
iv
Page
10. BIOMASS ENERGY SYSTEMS ................................ 201
10.1. Biomass Energy................................................... 202
10.2. Consumption of biomass energy ......................... 203
10.2.1. Global consumption ................................ 203
10.2.2. Consumption in the European Union ...... 205
10.3. Sources of biomass for energy generation .......... 206
10.3.1. Food crops ............................................... 206
10.3.2. Hydrocarbon-rich plants .......................... 207
10.3.3. Waste ....................................................... 207
10.3.4. Weeds and wild growths ......................... 207
10.3.5. Fast-growing grasses and woody species 208
10.4. Converting biomass to other forms of energy ..... 209
10.5. Technical routes for the production of different
types of energy from biomass ............................. 210
10.5.1. Thermochemical convertion of biomass . 210
10.5.2. Electricity from biomass-fired power
Plants ....................................................... 211
10.5.3. Cogeneration or ‘combined heat and
power (CHP)’ generation ........................ 212
10.5.4. Use of biomass gasifiers .......................... 214
10.6. Biochemical processing ....................................... 215
10.6.1. Fermentation to ethanol ........................... 215
10.6.2. Production of ethanol from
lignocellulosic crop ................................. 215
10.6.3. Anaerobic digestion ................................. 216
10.6.4. Esterification to biodiesel ........................ 216
10.6.5. Emerging technologies ............................ 216
10.7. Environmental impacts of biomass energy ......... 217
10.7.1. Production of biomass ............................. 217
10.7.2. Land and water resources ........................ 218
10.7.3. Soil erosion and water run-off ................. 219
10.7.4. Nutrient removal and losses .................... 219
10.7.5. Loss of natural biota, habitats and
v
wildlife ..................................................... 219
10.8. Conversion to utilizable energy ........................... 220
10.8.1. Environmental impact of thermal
processes .................................................. 220
10.8.2. Burning wood .......................................... 221
10.8.3. Use of Biomass for Power and Heat ....... 221
10.8.4. Burning municipal solid waste or wood
waste ........................................................ 222
10.8.5. Disposing ash from waste-to-energy
plants ....................................................... 223
10.8.6. Collecting landfill gas or biogas .............. 223
10.8.7. Impact of fermentation processes; liquid
biofuels: ethanol and biodiesel ................ 224
vi
LIST OF TABLES
Table Page
Table 2.1. Equivalent carbon dioxide lifecycle,
opportunity-cost emissions ................................ 38
Table 3.1. Types of impacts that can result from different
discharges .......................................................... 52
Table 3.2. A timeline of developments in climate change . 60
Table 4.1. Evaluation of features of nuclear power plants
from ecological aspect ....................................... 89
Table 5.1. Environmental impacts from small scale solar
thermal technology used for heating ................. 112
Table 5.2. Environmental impacts from concentrated
solarpower ......................................................... 113
Table 5.3. Environmental effects from PV in its life
cycle................................................................... 115
Table 5.4. Water footprint (WF) per unit electricity from
different energy sources .................................... 117
Table 6.1. Material used in wind turbine components ....... 125
Table 6.2. Environmental impacts from wind energy
plant ................................................................... 129
Table 8.1. Summary of the various categories of direct-use
of geothermal worldwide for the year 2015 ...... 169
Table 10.1. Examples of biomass and their uses for
Energy ............................................................. 210

vii
LIST OF FIGURES
Figure Page
Figure 1.1. Example of food chain ..................................... 7
Figure 1.2. Example of food web ....................................... 8
Figure 1.3. Ecological pyramids ......................................... 9
Figure 1.4. The water cycle ................................................ 12
Figure 1.5. The carbon cycle .............................................. 13
Figure 1.6. The nitrogen cycle ............................................ 14
Figure 1.7. The phosphorous cycle..................................... 15
Figure 1.8. The sulfur cycle ............................................... 16
Figure 1.9. Biomagnification .............................................. 19
Figure 1.10. Transport process of contaminants in
groundwater .................................................... 20
Figure 2.1. Ecosystem services .......................................... 24
Figure 2.2. World’s ecological footprint and biocapacity .. 28
Figure 2.3. Breakdown of ecological footprint .................. 29
Figure 2.4. Components of ecological footprint ................. 32
Figure 2.5. Global ecological footprint by component ...... 33
Figure 2.6. Comparison of footprint areas for energy
systems ............................................................. 40
Figure 3.1. Layout of thermal power plant ......................... 50
Figure 3.2. Fuel chain concept ........................................... 52
Figure 3.3. Greenhouse effect ............................................ 59
Figure 3.4. Ozone layer ...................................................... 65

viii
Figure Page
Figure 3.5. Ozone depletion mechanism ............................ 66
Figure 3.6. Effect of acid rain on Great Smoky
Mountains’Forest .............................................. 70
Figure 4.1. Fission reaction and chain reactions ................ 75
Figure 4.2. Global nuclear electricity generation ............... 76
Figure 4.3. Vertical canisters with concrete or steel
structures .......................................................... 83
Figure 4.4. Horizontal canisters.......................................... 83
Figure 5.1. Solar thermal system components, forced
circulation system ............................................. 102
Figure 5.2. Scheme of a parabolic trough collector ............ 103
Figure 5.3. Operation of a solar tower ................................ 104
Figure 5.4. Operation of a Linear Fresnel collector ........... 105
Figure 5.5. Operation of a dish collector. The dish tracks
the sun throughout the day ............................... 106
Figure 5.6. Overview of off-grid and grid-tied PV
systems ............................................................. 107
Figure 5.7. General life cycle of renewable energy
technologies ...................................................... 109
Figure 5.8. Environmental impacts from photovoltaic,
concentrated solar power and wind power ....... 119
Figure 6.1. Scheme of a wind energy turbine with
components ....................................................... 124
Figure 7.1. Tidal barrage .................................................... 137
Figure 7.2. Oscillating water column ................................. 140

ix
Figure Page
Figure 7.3. Wave capture devices....................................... 142
Figure 7.4. Ocean thermal energy conversion .................... 143
Figure 7.5. Tidal fence ....................................................... 145
Figure 7.6. Feedstocks and process technologies for
hydrogen production ......................................... 150
Figure 7.7. Principle of photo-electrolytic cell ................... 153
Figure 7.8. Principle of photo-biological hydrogen
production ........................................................ 154
Figure 8.1. Dry steam power plant ..................................... 165
Figure 8.2. Flash steam power plant ................................... 165
Figure 8.3. Binary cycle geothermal power plant .............. 166
Figure 8.4. Geothermal heat pump ..................................... 166
Figure 8.5. Comparison of worldwide direct-use
geothermal energy ............................................ 170
Figure 8.6. Europe thermal atlas......................................... 172
Figure 9.1. Reservoir-type hydropower .............................. 181
Figure 9.2. Run-of river hydropower diagram ................... 182
Figure 9.3. Pumped storage hydropower system ................ 185
Figure 9.4. Components of a hydropower scheme ............. 190
Figure 9.5. Pelton turbine .................................................. 192
Figure 9.6. Turgo turbine ................................................... 192
Figure 9.7. Francis turbine ................................................. 194
Figure 9.8. Kaplan turbine .................................................. 195
Figure 9.9. Cross flow water turbine .................................. 195
x
Figure Page
Figure 9.10. Types of small hydro-power by head height,
discharge or capacity ..................................... 196
Figure 10.1. The process of photosynthesis ....................... 202
Figure 10.2. Global final energy consumption in 2013 ...... 204
Figure 10.3. Solid biomass primary energy production and
inland consumption growth figures for the
EU .................................................................. 206
Figure 10.4. Sources of biomass for energy generation ..... 209
Figure 10.5. Sources of biomass for power generation ...... 212
Figure 10.6. Cogeneration compared to seperate power
production ...................................................... 213
Figure 10.7. Principle of combined heat and power (CHP)
plants with gas engines .................................. 214
1
CHAPTER 1
ENERGY, ENVIRONMENT AND ECOSYTEM
RELATIONS
Chapter writers: Başak TAŞELİ1 and Evren ALTIOK 2
1Giresun University, Faculty of Engineering, Environmental
Engineering Department, Giresun-Turkey
e-mail: [email protected]
2Giresun University, Faculty of Engineering, Genetics and
Bioengineering Department, Giresun-Turkey
e-mail: [email protected]
Abstract: Ecology is as old as the existence of mankind in a
sense, and one of the newest branches of science in another
sense. In this part of the book some basic concepts of ecology,
what parts of the ecosystems are made up will be discussed in
detail. We will look at how these pieces came together in the
ecosystem. Ecology, scope of ecology, ecological networks,
energy flow and nutrient flows will be presented. The concept
of food chain and energy flow in ecosystems and materials
cycle in the biosphere, food web and food chain and the effect
of human involvement on biospheres’ cycling will be
examined. At the end of this chapter, contaminant’s fate and
transport in the ecosystem will be presented.

2
Learning objectives:
At the end of this chapter, the student will be able to:
• Describe the ecology term,
• Define the components of ecosystem,
• Discuss the scopes of ecology,
• Compare the structure that contains both the abiotic and
biotic composition,
• Discuss the networks present in the ecological system has
a control of the energy flow and also in the flow of
nutrients,
• Be aware that energy from our solar system has a control
over the flow of all the nutrient and energy,
• Explain the concept of food chain and energy flow in
ecosystems,
• Explain how materials cycle in the biosphere,
• Distinguish between food chain and food web,
• Explain the effect of human involvement on biospheres’
cycling.
1.1 Ecology as a course
Ecology is part of biology by dealing with life, organism
and population. It is a multidisciplinary science that uses
the tools of other disciplines to explain natural observed
phenomena.
The word ‘Ecology’ was coined from the Greek World
‘oikos’ meaning ‘house’ or ‘a place to live’ to designate
the study of organisms in their natural homes. Specially,
it means the study of interactions of organisms with one
another and with the physical and chemical environment.
The term “logy” is to mean study (Ambelu et al., 2007).
3
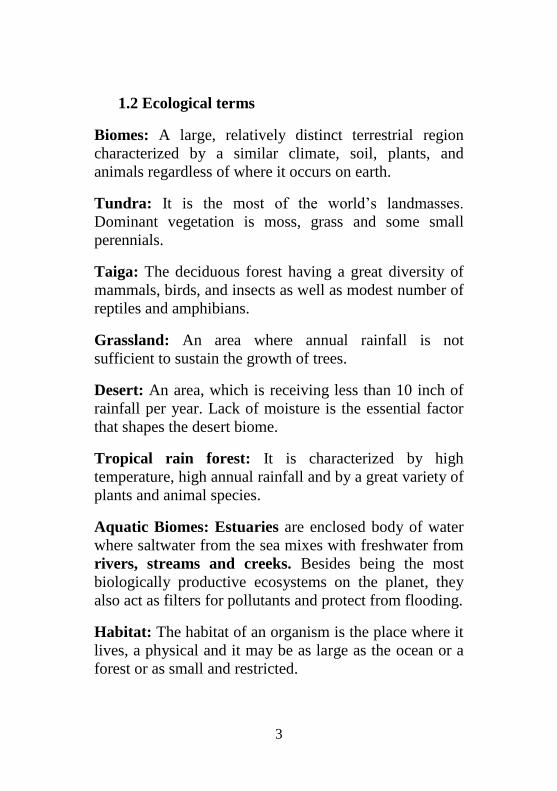
1.2 Ecological terms
Biomes: A large, relatively distinct terrestrial region
characterized by a similar climate, soil, plants, and
animals regardless of where it occurs on earth.
Tundra: It is the most of the world’s landmasses.
Dominant vegetation is moss, grass and some small
perennials.
Taiga: The deciduous forest having a great diversity of
mammals, birds, and insects as well as modest number of
reptiles and amphibians.
Grassland: An area where annual rainfall is not
sufficient to sustain the growth of trees.
Desert: An area, which is receiving less than 10 inch of
rainfall per year. Lack of moisture is the essential factor
that shapes the desert biome.
Tropical rain forest: It is characterized by high
temperature, high annual rainfall and by a great variety of
plants and animal species.
Aquatic Biomes: Estuaries are enclosed body of water
where saltwater from the sea mixes with freshwater from
rivers, streams and creeks. Besides being the most
biologically productive ecosystems on the planet, they
also act as filters for pollutants and protect from flooding.
Habitat: The habitat of an organism is the place where it
lives, a physical and it may be as large as the ocean or a
forest or as small and restricted.
4
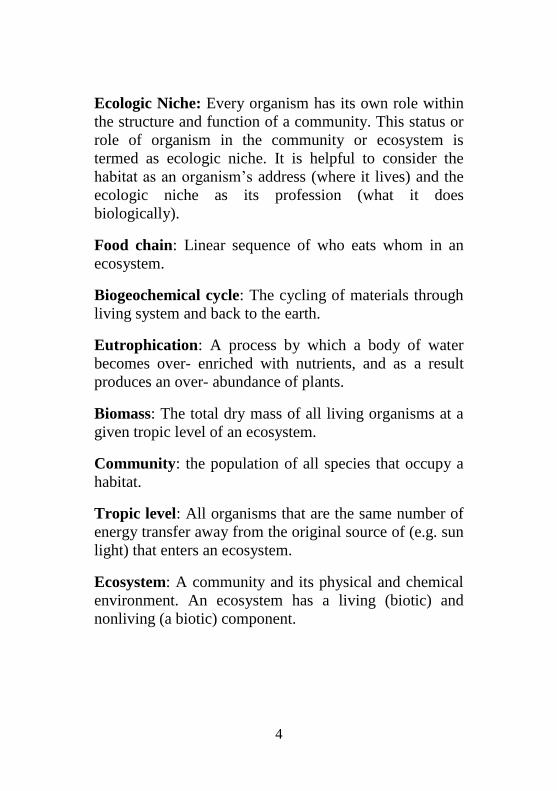
Ecologic Niche: Every organism has its own role within
the structure and function of a community. This status or
role of organism in the community or ecosystem is
termed as ecologic niche. It is helpful to consider the
habitat as an organism’s address (where it lives) and the
ecologic niche as its profession (what it does
biologically).
Food chain: Linear sequence of who eats whom in an
ecosystem.
Biogeochemical cycle: The cycling of materials through
living system and back to the earth.
Eutrophication: A process by which a body of water
becomes over- enriched with nutrients, and as a result
produces an over- abundance of plants.
Biomass: The total dry mass of all living organisms at a
given tropic level of an ecosystem.
Community: the population of all species that occupy a
habitat.
Tropic level: All organisms that are the same number of
energy transfer away from the original source of (e.g. sun
light) that enters an ecosystem.
Ecosystem: A community and its physical and chemical
environment. An ecosystem has a living (biotic) and
nonliving (a biotic) component.
5
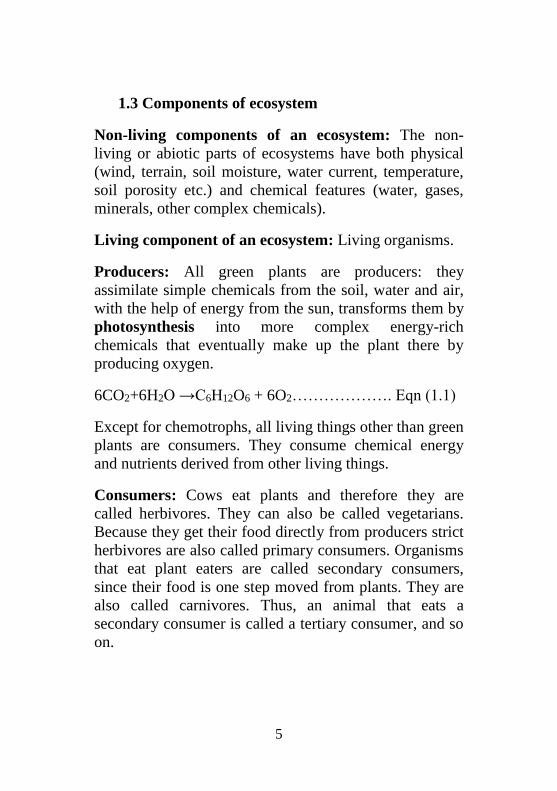
1.3 Components of ecosystem
Non-living components of an ecosystem: The non-
living or abiotic parts of ecosystems have both physical
(wind, terrain, soil moisture, water current, temperature,
soil porosity etc.) and chemical features (water, gases,
minerals, other complex chemicals).
Living component of an ecosystem: Living organisms.
Producers: All green plants are producers: they
assimilate simple chemicals from the soil, water and air,
with the help of energy from the sun, transforms them by
photosynthesis into more complex energy-rich
chemicals that eventually make up the plant there by
producing oxygen.
6CO2+6H2O →C6H12O6 + 6O2………………. Eqn (1.1)
Except for chemotrophs, all living things other than green
plants are consumers. They consume chemical energy
and nutrients derived from other living things.
Consumers: Cows eat plants and therefore they are
called herbivores. They can also be called vegetarians.
Because they get their food directly from producers strict
herbivores are also called primary consumers. Organisms
that eat plant eaters are called secondary consumers,
since their food is one step moved from plants. They are
also called carnivores. Thus, an animal that eats a
secondary consumer is called a tertiary consumer, and so
on.

6
Decomposers: Decomposers are consumers that get
energy and nutrients by digesting waste matter and dead
plant or animal material. Decomposers are the organisms
mostly bacteria and fungi-responsible for decay,
decomposition, or rotting. They are responsible for the
completion of ecosystem mineral cycles.
Nitrification: A process by which certain soil bacteria
strip ammonia or ammonium of electrons, and nitrite
(NO2) is released as a reaction product, then other soil
bacteria use nitrite for energy metabolism, yielding
nitrate (NO3-).
Ammonification: Decomposition of nitrogenous wastes
and remains of organisms by certain bacteria and fungi.
Denitrification: Reduction of nitrate or nitrite to gaseous
nitrogen (N2) and a small amount of nitrous oxide (NO2)
by soil bacteria.
Nitrogen fixation: Among some bacteria, assimilation of
gaseous nitrogen (N2) from the air; though reduction
reactions, electrons become attached to the nitrogen,
there by forming ammonia (NH3) or ammonium (NH4+).
Ecosystems are open systems and hence require
continuous energy and nutrient inputs. The functioning of
an ecosystem involves a series of cycles, like water cycle,
nutrient cycle, etc.
Trophic organization: Ecosystems have a layered
structure based on the number of times energy is
transferred from one organism to another, away from the
initial energy input into the system. Thus, all organisms
7
that are in the same number of transfer steps away from
the energy input are said to be at the same trophic level.
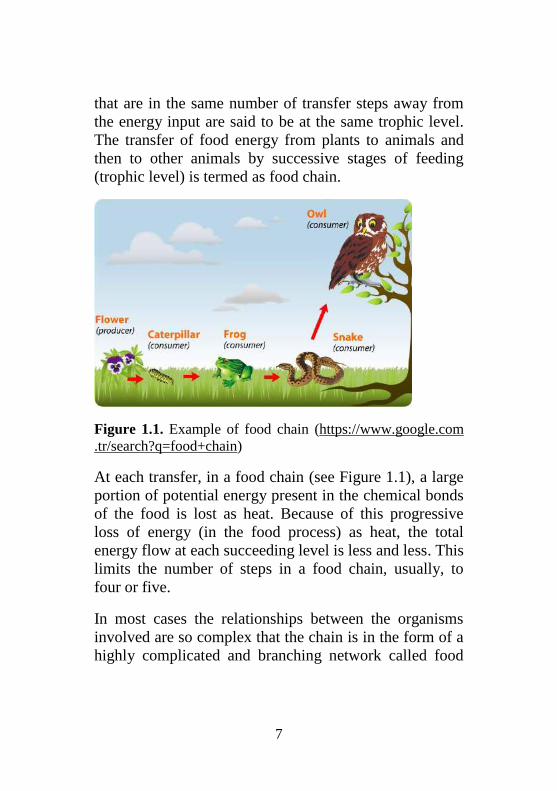
The transfer of food energy from plants to animals and
then to other animals by successive stages of feeding
(trophic level) is termed as food chain.
Figure 1.1. Example of food chain (https://www.google.com
.tr/search?q=food+chain)
At each transfer, in a food chain (see Figure 1.1), a large
portion of potential energy present in the chemical bonds
of the food is lost as heat. Because of this progressive
loss of energy (in the food process) as heat, the total
energy flow at each succeeding level is less and less. This
limits the number of steps in a food chain, usually, to
four or five.
In most cases the relationships between the organisms
involved are so complex that the chain is in the form of a
highly complicated and branching network called food

8
web (see Figure 1.2), which is actually the existing
feeding relationship in an ecosystem.
An ecosystem also can be represented by ecological
pyramids. There are three general types of pyramids (see
Figure 1.3).
Figure 1.2. Example of food web (https://www.google.com.tr
/search?q=food+web)
Pyramid of numbers: This pyramid is constructed by
counting the number of individuals involved in each
trophic level.
a) Pyramid of biomass: Pyramid of biomass is
constructed by measuring the weight of dry living
matter in each trophic level.
b) Pyramid of energy: This is made by measuring the
energy content of organisms at each trophic level.

9
c) Pyramid of productivity: Productivity pyramids
show the flow of energy through the food chain.
Figure 1.3. Ecological pyramids (https://www.google.com.tr/
search?q=food+web)
When energy is transferred to the next trophic level, only
10% of it is used to build new biomass and the rest going
to metabolic processes (10 % rule).
Function of ecosystem: The function of an ecosystem is
related to energy flow and material cycling through and
within the ecosystem.
Energy flow: Ultimately, most organisms depend on the
sun for the energy needed to create structures and carry
out life process. The transfer of energy through an
ecosystem begins when the energy of sunlight is fixed in
a green plant by photosynthesis. At each transfer of
energy with in a food chain, approximately 90% of the
chemical energy stored in the lower level is lost, and
therefore unavailable to the higher level. Since the total
amount of energy entering the food chain is fixed by

10
photosynthetic activates of plants, more usable energy is
available to organisms occupying lower position in the
food chain than to those at higher tropic level. Expressing
this concept in simpler terms, one might say for example:
Corn-Beef-Human; 10000 units of energy 1000 of energy
units 100 units of energy.
By moving man one step lower in the food chain, ten
times more energy becomes directly available. Corn –
Beef; 1000 units of energy 1000 units of energy.
1.4 Biogeochemical cycling
All living organisms are dependent not only on a source
of energy, but also on a number of inorganic materials,
which are continuously being circulated throughout the
ecosystem. When such molecules are synthesized or
broken down, changed from one form into another as
they move through the ecosystem, the degraded in the
same way in which energy moving through a food chain
is lost. The cycling of earth material through living
systems and back to the earth is called biogeochemical
cycling. Of the 92 naturally occurring chemical elements,
about 40 are essential to the existence of living organisms
and are known as nutrients. The maintenance of life on
this planet is ultimately dependent on the repeated
recycling of inorganic materials in more or less circular
paths form the abiotic environment to living things and
back to the environment again. Such cycling involves a
change in the elements from an inorganic form to an
organic molecule and back again (Kumar, 1997).

11
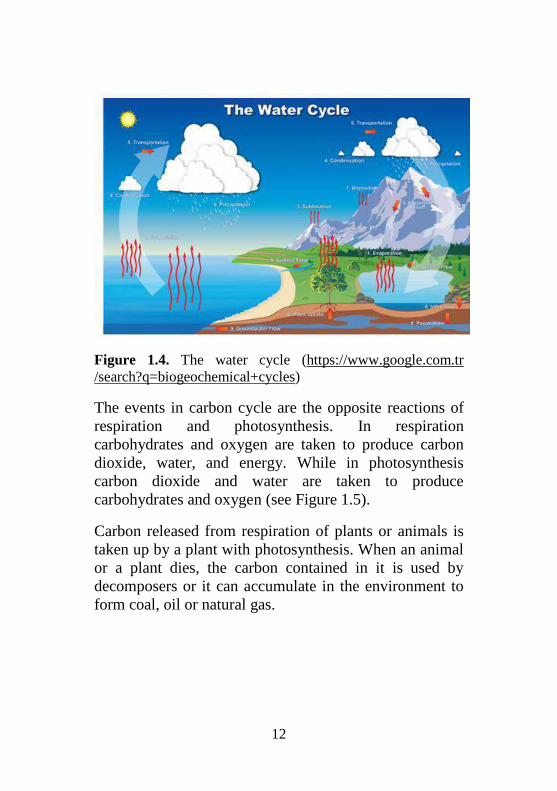
1.4.1 The water cycle
The sun directs the water cycle, warms the water in the
oceans and some of it evaporates. Ice and snow are
sublimated directly with water vapor. Rising airflow,
evaporation from the atmosphere, evaporation from the
soil and evaporation from the soil is taken from the
evapotranspiration water. Steam rises to the air and
condenses into the clouds. The air currents carry clouds
into the world; Cloud particles collide, grow and descend
into the earth as precipitation. Some precipitation falls as
snow and frozen water can accumulate as ice masses and
glaciers that can store thousands of years. Most rainfall
goes to the ocean or to the ground flowing land. Streams
and underground water leaks accumulate and are stored
as fresh water in lakes. All rivers do not flow into rivers.
Most of them are pile up as infiltration. It infiltrates
deeply into some water course and fills aquifers
(saturated underground rocks) that store freshwater for
long periods of time (see Figure 1.4).
1.4.2 The carbon cycle
Carbon is the basic constituent of living organic
compound. Since energy transfer occurs as the
consumption and storage of carbohydrates and fates,
carbon moves through the ecosystem with the flow of
energy. The source of nearly all carbon found in the
atmosphere and dissolved in waters of the earth is carbon
dioxide.
12
Figure 1.4. The water cycle (https://www.google.com.tr
/search?q=biogeochemical+cycles)
The events in carbon cycle are the opposite reactions of
respiration and photosynthesis. In respiration
carbohydrates and oxygen are taken to produce carbon
dioxide, water, and energy. While in photosynthesis
carbon dioxide and water are taken to produce
carbohydrates and oxygen (see Figure 1.5).
Carbon released from respiration of plants or animals is
taken up by a plant with photosynthesis. When an animal
or a plant dies, the carbon contained in it is used by
decomposers or it can accumulate in the environment to
form coal, oil or natural gas.

13
Figure 1.5. The carbon cycle (https://www.google.com.tr
/search?q=biogeochemical+cycles)
1.4.3 The nitrogen cycle
Nitrogen is crucial for all organisms because it is an
essential of protein and nucleic acids. The principal
reservoir of nitrogen is the atmosphere, which is about
78% of the atmosphere, the largest gaseous reservoir of
any element. Nitrogen gas is fixed from the atmosphere
by nitrogen-fixing bacteria and photosynthetic
cyanobacteria (blue-green algae). They both fix nitrogen,
either in the form of nitrate or in the form of ammonia.
When the plant or animals dies, decomposing bacteria
and fungi decays resulting ammonia acids to be broken
down, releasing ammonia gas (NH3). Nitrite bacteria then
convert the ammonia into nitrate molecules, and nitrate
bacteria in the soil produces nitrates. At this point, plants
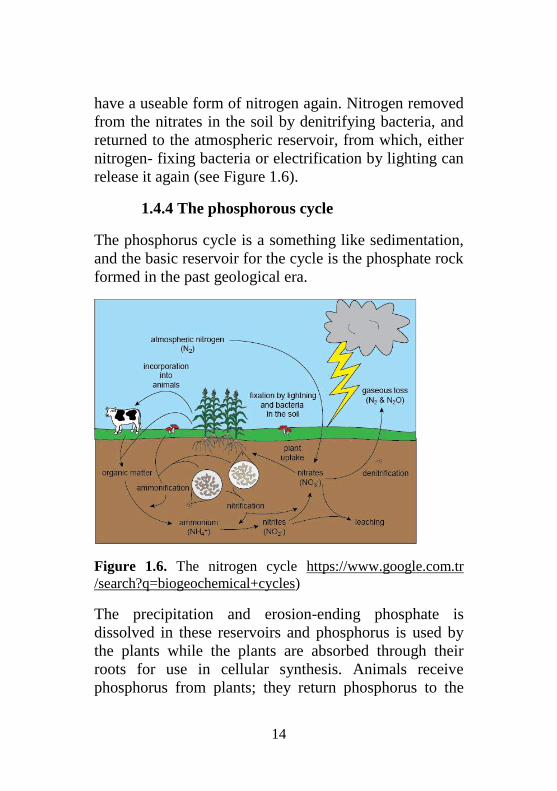
14
have a useable form of nitrogen again. Nitrogen removed
from the nitrates in the soil by denitrifying bacteria, and
returned to the atmospheric reservoir, from which, either
nitrogen- fixing bacteria or electrification by lighting can
release it again (see Figure 1.6).
1.4.4 The phosphorous cycle
The phosphorus cycle is a something like sedimentation,
and the basic reservoir for the cycle is the phosphate rock
formed in the past geological era.
Figure 1.6. The nitrogen cycle https://www.google.com.tr
/search?q=biogeochemical+cycles)
The precipitation and erosion-ending phosphate is
dissolved in these reservoirs and phosphorus is used by
the plants while the plants are absorbed through their
roots for use in cellular synthesis. Animals receive
phosphorus from plants; they return phosphorus to the
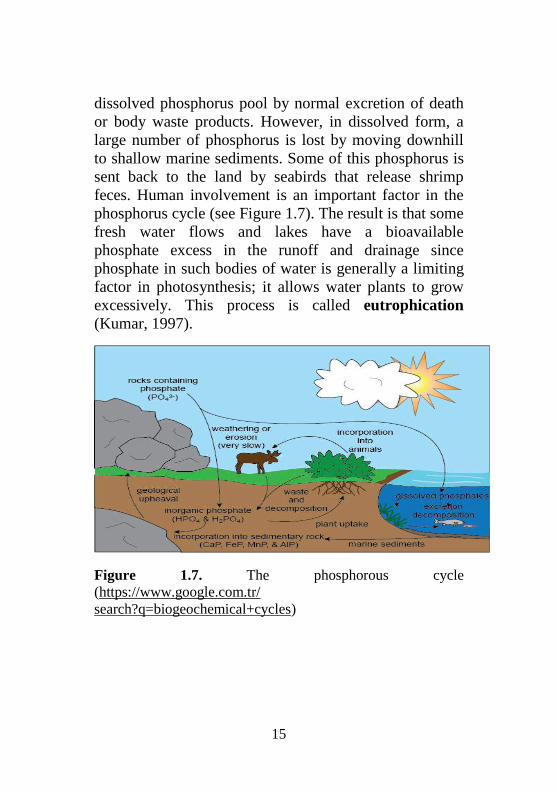
15
dissolved phosphorus pool by normal excretion of death
or body waste products. However, in dissolved form, a
large number of phosphorus is lost by moving downhill
to shallow marine sediments. Some of this phosphorus is
sent back to the land by seabirds that release shrimp
feces. Human involvement is an important factor in the
phosphorus cycle (see Figure 1.7). The result is that some
fresh water flows and lakes have a bioavailable
phosphate excess in the runoff and drainage since
phosphate in such bodies of water is generally a limiting
factor in photosynthesis; it allows water plants to grow
excessively. This process is called eutrophication
(Kumar, 1997).
Figure 1.7. The phosphorous cycle
(https://www.google.com.tr/
search?q=biogeochemical+cycles)

16
1.4.5 The sulfur cycle
Sulfur which is an essential element of biological
molecules in small quantities is mainly found on Earth as
sulfates in rocks, or as free sulfur or as a combination
with several metals such as lead and mercury. After
digestion process bacteria emit H2S, hydrogen sulfide, a
gas that has the "rotten egg" smell which is the basic
characteristic of swamps and sewage.
The largest reservoir of sulfur is in the Earth's crust as
gypsum (CaSO4) and pyrite (FeS2). Freshwater contains
sulfate, hydrogen sulfide and elemental sulfur; land
contains sulfate; atmosphere contains sulfur oxide (SO2)
and volcanic activity releases some hydrogen sulfide into
the air (see Figure 1.8).
Figure 1.8. The sulfur cycle (https://www.google.com.tr/
search?q=biogeochemical+cycles)

17
1.5 Pollutants in ecosystems
Pollutant: Any agent that adversely affects the health,
survival, or activities of living organisms or that alters
the environment in undesirable ways.
Persistent Organic Pollutants (POPs) are synthetic
organic compounds used in various products (from
electronics to automobiles) that resist environmental
degradation and have been found to adversely affect the
environment. Include PCBs and DDT.
How do pollutants enter the environment?
Point sources: Specific locations of highly concentrated
pollutant discharge, such as factories, power plants and
sewage.
Nonpoint sources: Scattered, diffuse sources of
pollutants, such as runoff from farm fields and
construction sites.
Factors influencing the movement of a pollutant through
an ecosystem:
• Solubility of the pollutant determines how, where and
when a pollutant will move through the environment.
• Water soluble pollutants move rapidly and widely
through the environment.
• Fat soluble pollutants generally need a carrier to
move through the environment and into and within
the body.
• Once inside the body, fat-soluble pollutants penetrate
readily into tissues and cells where they accumulate
18
and are stored as lipid deposits that are protected
from metabolic breakdown.
• Fat-soluble pollutants may persist for many years.
• The persistence of a pollutant is how long it takes to
breakdown and be removed from the ecosystem.
• Plastics and chlorinated hydrocarbons are resistant to
degradation.
• POPs are, by their nature, quite persistent and
therefore resistant to degradation.
Pollutants in the food chain: Bioaccumulation:
Process by which cells selectively absorb and store a
great variety of molecules by accumulating nutrients and
essential minerals, by absorbing and storing harmful
pollutants and by increasing concentration of a pollutant
from the environment to the first organism in a food
chain.
Biomagnification: Process by which the effects of
pollutants are magnified in the environment through food
chain (see Figure 1.9). Some pollutants are very stable
and resistant to metabolic degradation; they can remain
for a long time inside organism. When an organism is
consumed by a member of a higher trophic level, the
consumer is only able to assimilate roughly 10% of the
biomass of the prey (10 % Rule) while much of the
pollutant is passed on from prey to consumer due to
solubility. Therefore, as the pollutant moves up the food
chain the concentration of the pollutant in the body tissue
increases dramatically.

19
Figure 1.9. Biomagnification (https://www.google.com.tr/
search?q=biogeochemical+ cycles
Movement of pollutants: Advection, diffusion and
dispersion are main processes that transport the
contaminants away from the source (see Figure 1.10).
Advection: Moving along with air in the atmosphere or
water in a water body. Pollutant moves along at velocity
of flowing air or water.
Diffusion: Diffusion is the process through which
pollutant molecules move through air or water. What
causes (molecular) diffusion? At a given temperature
(e.g. 20oC), the molecules have a certain energy which
keeps them moving. As the molecules move, they
eventually strike other molecules. Striking another
molecule changes the path in which pollutant molecule
was initially going. Diffusion moves pollutants from high

20
concentration to low concentration, spreading them out
Best example for diffusion is; if you put a small amount
of dye into a beaker full of water by not creating currents,
the dye will slowly spread out until the water becomes
uniformly colored (dye must be of same density as water
or else it may sink or float, which is an advective
process, (adopted from https://www.coursehero.com/file
/219914/esm222-08-9-movement)
Dispersion: Buildings, rocks in river, sand grains in
aquifer causes additional spreading of pollutants. Wind
and water currents also contribute to spreading.
Retardation: A pollutant that sorbs onto soil is slowed
down with respect to the velocity of the water or air
phase. It takes longer for the pollutant to travel a given
distance than water does. Pollutants attached to moving
particles (colloids) can also sorb and desorb.
Figure 1.10. Transport process of contaminants in
groundwater
(https://www.coursehero.com/file/219914/esm222-08-9-
movement.)

21
References:
Ambelu A., Deboch B., & Lenjissa D., (2007). Lecture Notes
on Ecology, Jimma University, in collaboration with the
Ethiopia Public Health Training Initiative, The Carter Center,
the Ethiopia Ministry of Health, and the Ethiopia Ministry of
Education.
Kumar, H.D. (1997). Modern Concepts of Ecology. 8th
Edition, USA, Vikas Publication House.
Web page (2017), retrieved from https://www.
coursehero.com/file/219914/esm222-08-9-movement.
Web page (2017), retrieved from https://www.google.
com.tr/search?q=biogeochemical+cycles
22
CHAPTER 2
ECOLOGICAL FOOTPRINTING FOR ENERGY
SYSTEMS
Chapter writer: Gamze YÜCEL IŞILDAR1
1Gazi University, Institute of Science and Technology,
Environmental Sciences Dept, Ankara-Turkey
e-mail: [email protected]
Abstract: With the increase in population and increases in
consumption in many parts of the world, humanity's ecological
burden on the planet have increased and natural resources
become insufficient to serve to all our demands. Thus nature’s
capacity becomes incapable of absorbing much of the
pollution generated. There is a need for systemic, crosscutting
assessments, which can address and compare the competing
demands on the planet’s limited resources. Depending on that,
“Ecological Footprint” (EF) that identifies a specific
ecological budget – biocapacity – and the extent to which
human demands for biocapacity approach or exceed this
budget will be discussed in this chapter. A “carbon footprint”
(CF) which is the biggest component of ecological footprint
that deals with resource usage but focuses strictly on the
greenhouse gases released due to burning of fossil fuels which
is directly related to conventional energy production systems
will be explained. Finally alternative energy systems will be
compared in terms of EF and CFs.
Learning objectives:
• At the end of this chapter, the student will learn:
• Importance of ecological and carbon footprints (need
for EF and CF)

23
• Definitions of ecological and carbon footprints and
related terms
• Limitations in ecological and carbon footprints
calculations
• Components of ecological footprint
• Comparison of ecological footprints of denergy
production systems
2.1. Ecological footprint
2.1.1. Need for ecological footprinting
Soil, water, air, minerals and plants are a few of the
natural resources that make life possible on Earth. The
energy that powers our cells, provides basic needs;
clothings, nutrients that make up our bodies, the
ecosystem services that clean our water and air, regulate
climate are all provided by the natural resources. Human
wellbeing depends on the capacity of the earth’s natural
systems to provide ecosystem goods and services. The
ecosystem services are summarized in Figure 2.1 below.

24
Figure 2.1. Ecosystem Services
(http://www.unepfi.org/fileadmin/documents/bloom_or_bust_
report.pdf)
However, with the increase in population and increases in
consumption in many parts of the world, humanity's
ecological burden on the planet have increased and
natural resources become insufficient to serve all our
demands. Collapsing fisheries, carbon-induced climate
change, deforestation and the loss of cropland to erosion
and salinization are some of the most prominent
examples of pressures that threaten the ability of
ecosystems to continue producing critical renewable
resources and services. Particularly since the mid-20th
century, we are endangering a number of key
environmental systems and exceeding “carrying
capacity” of the earth. By carrying capacity, we mean the
nature’s maximum capacity to support human population
25
(in terms of food, water, habitat, energy) and it’s
activities. Unfortunately, nature’s capacity becomes
incapable of absorbing much of the pollution generated.
According to “World Footprint” report of Global
Footprint Network (November 2015), today humanity
uses the equivalent of 1.6 planets to provide the resources
we use and absorb our waste.
Along this line, it is certainly needed to observe,
understand and/or confront with the concrete impacts of
environmental problems, natural deterioraiton and
resource depletion in order to understand the importance
of the problem. “Measurability” of the human pressure
on ecosystems helps people to recognize the
environmental crisis. Empirical measurements have thus
to be sought to understand the driving forces behind these
impacts and find ways to reduce them while maintaining
economic and societal well-being (Galli A. et al., 2015).
Ecological Footprint Accounting (EFA) has been used as
a first approximation of the overall human pressure on
Earth’s ecosystems (Galli 2015; Lin D. et al., 2015;
Wackernagel M. et al., 2014). Ecological footprint (EF)
is a necessary management tool to estimate if humanity’s
rate of consumption exceeds earth’s carrying capacity or
not; the extent to which human society stays within or
exceeds the regenerative capacity of the planet.
2.1.2. Ecological footprint and related terms
The ecological footprint of a designated population is
the area of productive land and water ecosystems
required to produce the resources that the population

26
consumes and assimilate the wastes that the population
produces, wherever on Earth the land and water is
located (Wackernagel M. and Rees W., 1996). It
measures the requirements for productive areas;
croplands, grazing lands, forests, marine areas, built-up
land for housing and infrastructure. This resource
accounting is similar to life cycle analysis wherein the
consumption of energy, biomass (food, fiber), building
material, water and other resources are converted into a
normalized measure of land area called 'global hectares'
(gha). A global hectare is a biologically productive
hectare with world average biological productivity for a
given year. Global hectares are needed because different
land types have different productivity. A global hectare
of, for example, cropland, would occupy a smaller
physical area than the much less biologically productive
pasture land, as more pasture would be needed to provide
the same biocapacity as one hectare of cropland. Because
world bioproductivity varies slightly from year to year,
the value of a gha may change slightly from year to year.
(WWF, 2016). Recently, it has been shifted to measure
the land use that is required for population activities
taking place on the biosphere within a given year while
considering the prevailing technology and resource
management of that year (Borucke M. et al., 2013).
These productivity-weighted biologically productive
hectares allow researchers to report both the biocapacity
of the Earth or a region, and the demand on biocapacity
(the Ecological Footprint). The “equivalence factor” is
the key factor that allows land of different types to be
converted into the common unit of global hectares. These
equivalence factors are based on assessments of the

27
relative productivity of land under different land types in
any given year. In the most current EF accounts, an index
of suitability for agricultural production is used as a
proxy measure of the productive capacity of different
land types. Within a given land type, such as cropland,
the ability of an area to produce useful goods and
services can vary dramatically based on factors such as
climate, topography, or prevailing management. “Yield
factors” allow different areas of the same land type to be
compared based on the common denominator of yield.
National yield factors for pasture, for example, compares
the productivity of average pastures in a specific nation
to world-average pastures. These yield factors convert
one hectare of a specific land type, such as pasture,
within a given nation into an equivalent number of
world-average hectares of that same land type.
(http://www.footprintnetwork.org/faq/).
If a population’s Ecological Footprint exceeds the
region’s biocapacity, that region runs an ecological
deficit or it is called as ecological overshoot. Its demand
for the goods and services that its land and seas can
provide—fruits and vegetables, meat, fish, wood, cotton
for clothing, and carbon dioxide absorption—exceeds
what the region’s ecosystems can renew. A region in
ecological deficit meets demand by importing,
liquidating its own ecological assets (such as
overfishing), and/or emitting carbon dioxide into the
atmosphere. The consequences of “overshoot” are
already clear: habitat and species loss, and accumulation
of carbon in the atmosphere (Tittensor D.P. et al., 2014).
If a region’s biocapacity exceeds its EF, it means, it has
an ecological reserve.
28
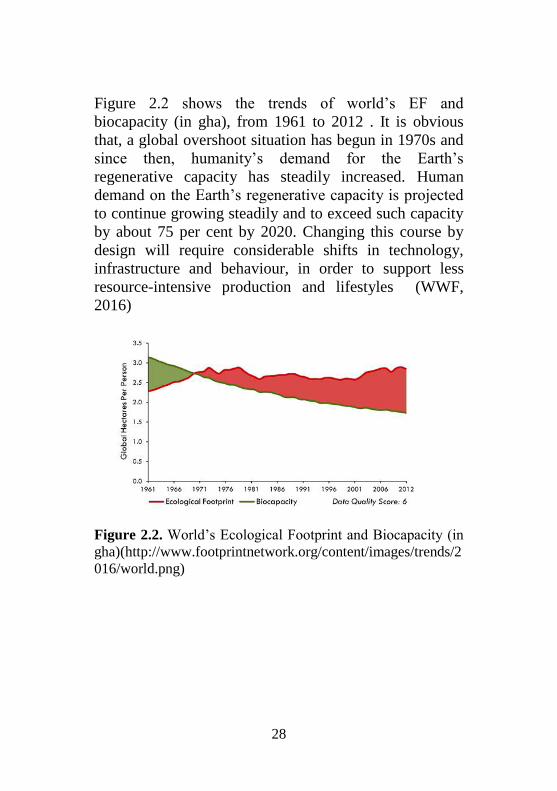
Figure 2.2 shows the trends of world’s EF and
biocapacity (in gha), from 1961 to 2012 . It is obvious
that, a global overshoot situation has begun in 1970s and
since then, humanity’s demand for the Earth’s
regenerative capacity has steadily increased. Human
demand on the Earth’s regenerative capacity is projected
to continue growing steadily and to exceed such capacity
by about 75 per cent by 2020. Changing this course by
design will require considerable shifts in technology,
infrastructure and behaviour, in order to support less
resource-intensive production and lifestyles (WWF,
2016)
Figure 2.2. World’s Ecological Footprint and Biocapacity (in
gha)(http://www.footprintnetwork.org/content/images/trends/2
016/world.png)

29
Contribution of human uses is given in Figure 2.3.
Figure 2.3. Breakdown of Ecological Footprint (in gha)
(http://info.cat.org.uk/questions/low-impact-living/what-
ecological-footprint/)
2.1.3. Use of EF values
Ecological Footprint findings show how far humanity is
from a safe and just operating space (Dearing J.A. et al.,
2014) as a result of overusing natural resources and
ecological services which has immediate relevance as an
early warning for environmental protection and
sustainability.
Ecological Footprint findings:
• Inform about to what extent a
country/city/person/facility uses more or less than its
available land
• Enable to discuss possible scenarios for the future of
human demand and ecosystem

30
• Bring humanity out of overshoot and onto a
potentially sustainable path to manage the
consumption of food, energy, and maintaining or
increasing the productivity of natural and
agricultural ecosystems
• Are they used as a useful tool to educate people
about carrying capacity and overconsumption to lead
behavioral change towards nature
• Engage public actors in transforming Footprint
diagnoses into sector-specific policy prescriptions
and economic decision-making.
The Footprint is primarily useful as a planning tool when
facing decisions concerning long-term investments.
However it should be kept in mind that; EF calculations
have some limitations (Galli A. et al., 2016). EF uses just
one lens – biocapacity – to track the human dependence
on complex and interdependent environmental systems. It
does not address all environmental pressures and
consequences that are related to human consumption,
such as pollution and loss of habitat (Galli A. et al.,
2012). It is an approach that takes a snapshot of a
community’s resource use at a particular moment,
historical ecological data is needed to allow comparisons
across space and time (Marazzi L., 2017). It provides
insight on a minimum condition for sustainability:
whether or not human consumption activities fit within
the biological threshold defined by the Earth’s
biocapacity (Lin et al., 2015). The Ecological Footprint is
not only a measure of human impact, but also is a
predictive measure of the sustainability of specific

31
management practices. It is an accounting system that
compares human demand on Earth’s ecosystems to what
these ecosystems are able to renew. Given this scope and
knowledge, Ecological Footprint accounts should be used
as a necessary but not sufficient minimum reference
framework that approximates all of humanity’s demands
on nature that compete for biologically productive area
(Galli, 2016).
2.1.4. Components of ecological footprint
In ecological footprint accounting, six footprint
components are distinguished in accordance with major
land use types. All of these are built on six ecosystem
services for human well-being: plant-based food
production, livestock-based food production, fish-based
food production, timber production, living space supply,
and energy-related CO2 absorption (Galli A. et al., 2012;
Kitzeset J. Et. al., 2009). Components are weighted with
equivalence factors before being added up to the total.
The ecological footprint, therefore, is a land-based,
composite indicator (Wackernagel and Rees, 1996;
Steen-Olsen et al., 2012). Figure 2.4 shows and explains
components of EF.

32
Figure 2.4. Components of Ecological Footprint (WWF,
2016)
2.2. Carbon footprinting
Separating the ecological footprint into its individual
components demonstrates how each one contributes to
humanity’s overall demand on the planet. Probably the
best-known component of the EF is the Carbon Footprint

33
(CF) at the global level. Because it is the largest
footprint; the increase in anthropogenic demands was
most prominent for the CF (+260% due to the growing
use of fossil fuels, electricity and energy-intensive
commodities) and the cropland Footprint (+125%)
components (WWF, 2016). The increasing interest in CF
comes as a result of growing public awareness of global
warming.
“Carbon Footprint” might be defined as; the land
required to absorb the CO2 that is released from the
burning of fossil fuels and other sources (WWF, 2016).
This is commonly used to describe the total amount of
CO2 and other greenhouse gas (GHG) emissions for
which an individual, group or organisation is responsible.
Definitions vary in terms of which activities and
greenhouse gases should be included within the scope of
a carbon footprint assessment, and the level of detail.
Some carbon footprint definitions only mention carbon
dioxide (Global Footprint Network, 2007). Other
definitions and methods include all Kyoto greenhouse
gases and measure emissions in terms of ‘carbon dioxide
equivalents’, for example Carbon Trust (2007).
Figure 2.5. Global Ecological Footprint by Component
(WWF, 2016)

34
Figure 2.5 shows “carbon” is the dominant component of
humanity’s EF (ranging from 43 per cent in 1961 to 60
per cent in 2012). Its primary cause has been the burning
of fossil fuels – coal, oil and natural gas. The green line
represents the Earth’s capacity to produce resources and
ecological services (i.e., the biocapacity). It has been
upward trending slightly, mainly due to increased
productivities in agriculture (Global Footprint Network,
2016). Data are given in global hectares (gha). (WWF,
2016)
Despite its name, the Carbon Footprint is not expressed
in terms of area. The total amount of greenhouse gases is
simply measured in mass units (kg, t, etc.) and no
conversion to an area unit (ha, m2, km2, etc.) takes place.
Any conversion into a land area would have to be based
on a variety of assumptions that would increase the
uncertainties and errors associated with a particular
Carbon Footprint estimate. When only CO2 is included,
the unit is kg CO2; if other GHGs are included the unit is
kg CO2-e, expressing the mass of CO2- equivalents.
Those are calculated by multiplying the actual mass of a
gas with the global warming potential factor for this
particular gas, making the global warming effects of
different GHGs comparable and additive.
However, within a full Ecological Footprint calculation,
data on carbon dioxide emissions are translated into the
area, in global hectares, required to absorb these carbon
emissions (Monfreda C. et al., 2004). This global
hectare-based carbon footprint can then be added to other
components of the EF, such as the cropland cootprint and
35
fishing grounds footprint, to obtain the total Ecological
Footprint of a population or activity.
It is widely accepted that the lifecycle assessment (LCA)
is a useful tool for calculating the carbonfootprint,
especially at the product level (Wiedmann T. and Minx
J., 2008). Nevertheless, criticisms toward the carbon
footprint remain. A prominent one is the view expressed
by some observers that the huge demand for detailed data
compromises the quality of outcome, especially in those
situations where extremely limited data for use at micro-
or meso-scale accounts lead to underestimation
(Chakraborty D. and Roy J., 2013; De Benedetto L. and
Klemeˇs J. , 2009). Another criticism is that the lack of
consideration of carbon sequestration land runs the risk
of disregarding the terrestrial feedback processes such as
abrupt degradation of forestor changes in the distribution
of vegetation and oceanic fluxes that further affect the
global carbon cycle, which may have sub-sequent
detrimental impacts on climate (Fang K. et al., 2013).
2.3. Ecological footprints of energy production
systems
Energy use and demand are increasing continuously due
to the population growth. All forms of energy generation
have an environmental impact on our air, water and land,
but it varies. Residential, work place, leisure, and service
sectors still use large amounts of energy and produce
large emissions of CO2. Considering that about 80% of
our current primary energy comes from fossil energies,
environmental impacts of energy producing systems
becoming more and more important. In addition to the
36
growing need for energy, the risk to the environment and
human health from climate change caused by CO2
emissions is an international scientific and policy
challenge.
To evaluate the relative burden of energy systems within
the environment, full energy supply chains need to be
considered on a lifecycle basis, including all system
components, and across all impact categories. As a
resource accounting tool, EF may help to determine
major contributors to environmental impacts from energy
production in total and to compare the impacts of
alternative energy systems; fossil fuels, renewables and
nuclear.
While doing this, it should be taken into account:
• how much physical space is required to generate
the energy,
• how this requirement changes among non-
renewable and renewable energy sources,
• what are the ecological costs of those space
needs,
• what needs to be monitored to understand the
effect of energy-generating facilities on
ecosystems, human health, and social systems.

37
In this section, environmental impacts of fossil fuels,
renewables and nuclear energy systems are discussed and
compared in terms of lifecycles, EFs and CF values.
2.3.1. Comparison of energy systems
There is a methodological challenge in comparing
different energy technologies that is caused by the fact
that they are based on widely different sources and
techniques to exploit these sources.
Conventional energy technologies are mostly based on
fossil resources like coal, crude oil and natural gas. These
technologies usually exhibit their largest pressure on the
environment during operation by emitting CO2 into the
atmosphere and thus changing the global carbon flow
systems with grave consequences for the global climate.
However renewables such as wind power, solar heat and
photovoltaic and hydropower have envionmental impacts
especially linked to the construction and installation of
the equipment like PV panels, wind turbines and solar
collectors. “Renewable resource-based energy
technologies” represent a very diverse range of
technologies with large differences in both their overall
pressure as well as the distribution of this pressure into
different impact categories.
There are several methodologies that can be used to
assess environmental impacts such as MIPS (material
input per service unit), CML-Method, CED (cumulative
energy demand) and ecological footprint. Ecological
spatial footprint of renewable energy types can be used in
conjunction with CO2 footprint models to understand the
38
real costs (and benefits) of renewable energy for societies
(Burger J. and Gochfeld M., 2012).
For a complete environmental impact assessment an
analysis tool is needed which can evaluate material
flows, energy flows and emissions. This calls for a
measure that is highly aggregated (to allow comparison)
but evaluates different impacts in a transparent
scientifically based way.
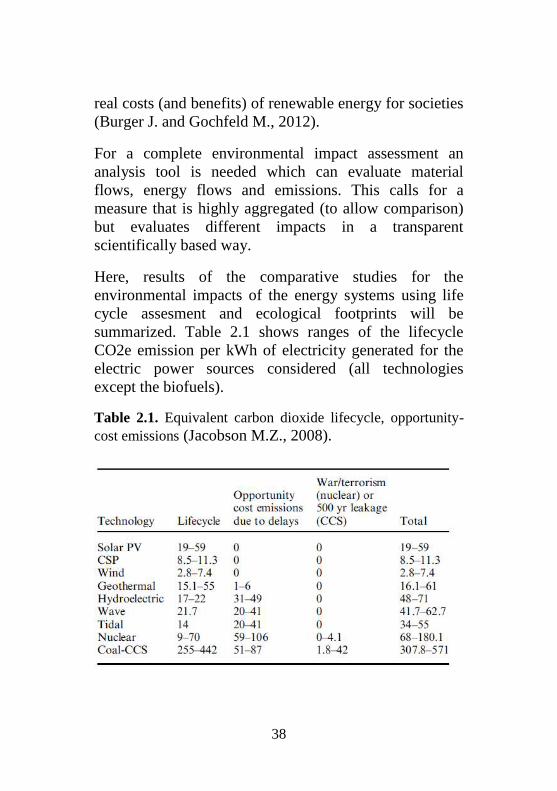
Here, results of the comparative studies for the
environmental impacts of the energy systems using life
cycle assesment and ecological footprints will be
summarized. Table 2.1 shows ranges of the lifecycle
CO2e emission per kWh of electricity generated for the
electric power sources considered (all technologies
except the biofuels).
Table 2.1. Equivalent carbon dioxide lifecycle, opportunity-
cost emissions (Jacobson M.Z., 2008).
39
Table 2.1 indicates that, coal has the highest impact
(almost 10 times of PV panels). Secondly, the impact of
solar PV is higher and very close to geothermal. The
impact range of nuclear is very wide as mentioned in
section 2.4 and diffucult to compare. The climate-
relevant lifecycle emissions occur only during the
construction, installation, maintenance, and
decommissioning of the technology. For geothermal,
emissions also occur due to evaporation of dissolved CO2
from hot water in flash- or drysteam plants, but not in
binary plants. For corn ethanol, cellulosic ethanol, coal-
CCS, and nuclear, additional emissions occur during the
mining and production of the fuel. For biofuels and coal-
CCS, emissions also occur as an exhaust component
during combustion (Jacobson, 2008).
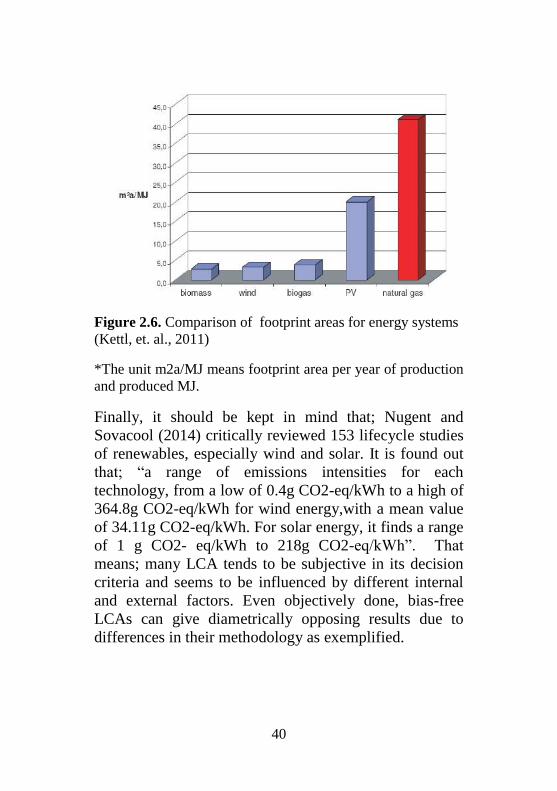
The study done by Kettl, et. al. (2011) Sustainable
Process Index (SPI) was used to solve questions about
ecological feasibility of different technologies and their
resources. He examined if renewable based systems have
indeed a lower impact to the environment compared to
fossil driven energy technologies if the whole life cycle is
considered. Results (see Figure 2.6) indicated that, even a
“clean” fossil-based technology as natural gas turbines
exert a higher pressure than all renewable resource-based
alternatives. The difference here is not only persentages
but also factors, with natural gas derived electricity (with
41.0m2a/MJ) exerting 10.8 times the impact of the
biogas technology (with 3.8m2a/MJ) and still two times
the impact of the “worst” renewable based technology
photovoltaics (PV with 19.9m2a/MJ).
40
Figure 2.6. Comparison of footprint areas for energy systems
(Kettl, et. al., 2011)
*The unit m2a/MJ means footprint area per year of production
and produced MJ.
Finally, it should be kept in mind that; Nugent and
Sovacool (2014) critically reviewed 153 lifecycle studies
of renewables, especially wind and solar. It is found out
that; “a range of emissions intensities for each
technology, from a low of 0.4g CO2-eq/kWh to a high of
364.8g CO2-eq/kWh for wind energy,with a mean value
of 34.11g CO2-eq/kWh. For solar energy, it finds a range
of 1 g CO2- eq/kWh to 218g CO2-eq/kWh”. That
means; many LCA tends to be subjective in its decision
criteria and seems to be influenced by different internal
and external factors. Even objectively done, bias-free
LCAs can give diametrically opposing results due to
differences in their methodology as exemplified.

41
2.4. Nuclear energy
Nuclear power generation has a relatively small carbon
footprint; since there is no combustion, (heat is generated
by fission of uranium or plutonium), operational CO2
emissions account for <1% of the total. Most emissions
occur during uranium mining, enrichment and fuel
fabrication. Decommissioning accounts for 35% of the
lifetime CO2 emissions, and includes emissions arising
from dismantling the nuclear plant and the construction
and maintenance of waste storage facilities. The most
energy intensive phase of the nuclear cycle is uranium
extraction, which accounts for 40% of the total CO2
emissions. (Parliamentary Office of Science and
Technology, 2006). The results of Poinssot et. al., 2014
highlight again that nuclear energy has the lowest impact
in terms of GHG emission (about 5.3 g/kWhe). This is
100 times lower than fossil energy and 8 times lower
than photovoltaic energy. When considering atmospheric
pollution (SOx and NOx), nuclear energy has higher
values than hydro and wind electricity, but still lower
than PV and obviously fossil energies. Regarding
potential impact indicators (acidification, eutrophication
and POPC), nuclear energy figures are systematically in
second best position, with impact higher than
hydroelectricity but lower than any other energy sources,
even wind-power and PV. Similarly, although mining has
a strong impact, nuclear energy land-use is anticipated to
be the lowest. Conversely, figures for water consumption
and withdrawal of nuclear energy are significantly higher
than other energy sources, in the range of fossil energies.
Finally, technological waste produced by nuclear energy
is about 1000 lower than fossil energies but still remains

42
10 times higher than renewables. This is directly related
to the large size of the infrastructures (plants.) which are
needed to operate the whole fuel cycle (in particular the
reactors).
However, catastrophic events at nuclear plants such as
Chernobyl (USSR in 1986) and Fukushima (Japan, 2011)
have the potential for high impact human and ecological
effects, both at the regional and global level. The public
generally has considerable “fear” or concern about the
potential for low probability, high consequence events.
The full life-cycle cost of operation of a nuclear facility
may be high. Life cycle costs include mining, milling,
enrichment, and fabrication (with attendant ecological
and human health effects), safe transportation corridors
requiring new infrastructure, and the unsolved problem
of waste disposal, which may entail significant
subterranean land use (Burger J. and Gochfeld M., 2012).
In fact, there is no consensus in the scientific literature as
to the carbon footprint of existing nuclear reactors. The
studies for the determination carbon footprint for nuclear
energy is a problematic area. Methodological and
contextual inconsistency between the many published
nuclear power LCAs has resulted in widely ranging
results, making direct comparison difficult and thwarting
a clear, collective understanding (Warner E. and Garvin
H., 2012). Results are uncertain and speculative. In 2012,
four years after Sovacool's (2008) paper, Ethan Warner
and Garvin Heath found 274 papers containing nuclear
LCAs . They filtered them down to 27 for further
consideration. These yielded 99 estimates of carbon
footprints which the authors describe

43
as "independent".Their data for carbon emissions ranged
from 4 to 220 gCO2/kWh. They did not report an average
but rather a median value: half the estimates were below
13 gCO2/kWh. These two reviews of the published
literature, produced conflicting results. One suggests the
carbon footprint is above the CCC limit, the other well
below (http://www.theecologist.org/News/news_analysis
/2736691/false_solution_nuclear_power_is_not_low_car
bon.html).
Nuclear power’s status as a low-carbon source of
electricity is doubtful: while it compares favourably to
traditional fossil fuels such as coal, the logistical chain
required for extracting and processing uranium, plant
construction and plant decommissioning create a carbon
footprint for nuclear power that is significantly greater
than renewable sources. (https://www.cse.org.uk/
downloads/reports-and publications/planning/renewables/
common_concerns_about_wind_power.pdf)
Decreasing or even eliminating dependence on fossil
fuels and turning towards renewable energy sources offer
a great opportunity to shrink humanity’s footprint to a
size the earth can support.
References:
Borucke, M., Moore, D., Cranston, G., Gracey, K., Iha, K.,
Larson, J., Lazarus, E., Morales,J.C., Wackernagel, M., Galli,
A. (2013). Accounting for demand and supply of
thebiosphere’s regenerative capacity: the national footprint
accounts’ underlying methodology and framework. Ecological
Indicators, (24), 518–533.

44
Galli, A., Lin, D., Wackernagel, M., Gressot, M. and Winkler,
S. (2015). Brief for GSDR – Humanity’s growing Ecological
Footprint: sustainable development implications. Global
Footprint Network.
Burger, J. and Gochfeld, M. (2012). A conceptual framework
evaluating ecological footprints and monitoring renewable
energy: wind, solar, hydro, and geothermal. Energy and
Power Engineering, (4), 303-314.
Chakraborty, D. And Roy, J. (2013). Energy and carbon
footprint: numbers matter in low energy and low carbon
choices. Current Opinion in Environmental Sustainability, (5),
1–7.
De Benedetto, and L., Klemes,ˇ J. (2009). The environmental
performance strategy map: an integrated LCA approach to
support the strategic decision making process. Journal of
Cleanar Production, (17), 900-906.
Dearing, J.A., Wang, R., Zhang, K., Dyke, J.G. and Haberl, H.
(2014). Safe and just operating spaces for regional social-
ecological systems. Global Environmental Change, (28), 227-
238.
Fang, K., Heijungs, R. and De Snoo, G. (2013). The footprint
family: comparison andinteraction of the ecological, energy,
carbon and water footprints. Revue deMétallurgie, (110), 77–
86.
Galli, A., Wiedmann, T.O., Ercin, E., Knoblauch, D., Ewing,
B.R. and Giljum, S. (2012). Integrating ecological, carbon and
water footprint into a “Footprint Family’’ of indicators:
definition and role in tracking human pressure on the planet.
Ecological Indicators, (16), 100–112.

45
Galli, A. (2015). On the rationale and policy usefulness of
ecological footprint accounting: the case of Morocco.
Environmental Science & Policy (48), 210–224.
Jacobson, M. Z. (2008). Review of solutions to global
warming, air pollution, and energy security. Energy and
Environmental Science, (2), 148–173.
Kettl, K., Niemetz, N., Sandor, N., Eder, M. and
Narodoslawsky, M. (2011), Ecological Impact of Renewable
Resource-Based Energy Technologies. Journal of
Fundamentals of Renewable Energy and Applications, (1), 1-
5.
Kitzes, J., Galli, A., Bagliani, M., Barrett, J., Dige, G., Ede, S.,
Erb, K., Giljum, S., Haberl, H. And Hails, C. (2009). A
research agenda for improving national ecological footprint
accounts. Ecological Economics, (68), 1991–2007.
Lin, D., Galli, A., Borucke, M., Lazarus, E., Grunewald, N.,
Martindill, J., Zimmerman, D., Mancini, S., Iha, K. and
Wackernagel, M. 2015. Tracking supply and demand of
biocapacity through ecological footprint accounting.
Sustainability Assessment of Renewables- Based Products:
Methods and Case Studies, 179–200.
Marazzi, L. (2017). Our Ecological Footprint, Macat
International Ltd.
Monfreda, C., Wackernagel, M. and Deumling, D. (2004).
Establishing national natural capital accounts based on
detailed ecological footprint and biological capacity accounts.
Land Use Policy, 231-246.
Nugent, D. and Sovacool, B.K. (2014). Assessing the lifecycle
greenhouse gas emissions from solar PV and wind energy: A
critical meta-survey. Energy Policy, (65), 229-244.

46
Parliamentary Office of Science and Technology, Postnote.
(2006). Carbon footprint of electricity generation. Number 268
Sovacool, B.K. (2008). Valuing the greenhousegas emissions
from nuclear power: A critical survey. Energy Policy, 36(8),
2950-2963.
Steen-Olsen, K., Weinzettel, J., Cranston, G., Ercin, A.E. and
Hertwich, E.G. (2012). Carbon, land, and water footprint
accounts for the european union: consumption, production,
and displacements through ınternational trade. Environmental
Science & Technology, (46), 10883-10891.
Tittensor, D.P., Walpole, M., Hill, S.L.L., Boyce, D.G.,
Britten, G.L., Burgess, N.D., Butchart, S.H.M., Leadley, P.W.,
Regan, E.C. and Alkemade, R. (2014). A mid-term analysis of
progress toward international biodiversity targets. Science 346
(6206): 241–244.
Wackernagel, M., Cranston, G., Morales, J. C. and Galli, A.
(2014). Ecological footprint accounts, In: Atkinson, G., Dietz,
S., Neumayer, E., Agarwala, M. (Eds.), Handbook of
Sustainable Development. second revised edition Edward
Elgar Publishing, Cheltenham,Glos, UK.
Wackernagel, M. and Rees, W. (1996). Our Ecological
Footprint: Reducing Human Impact on the Earth. New Society
Publishers.
Warner, E. and Garvin, H. (2012). Life cycle greenhouse gas
emissions of nuclear electricity generation. systematic review
and harmonization. Journal of Industrial Ecology, 16(1), S73-
S92.
Wiedmann, T. And Minx, J. (2008). A definition of ‘carbon
footprint’. In: Pertsova, C.C. (Ed.), Ecological Economics

47
Research Trends ( pp. 1–11), Hauppauge, NY,USA: Nova
Science Publishers.
WWF. 2016. Living Planet Report 2016. Risk and resilience in
a new era. WWF International, Gland, Switzerland.
Web page (2017), retrieved from http://www.footprint
network.org/ content/images /trends/2016 /world.png
Web page (2017), retrieved from http://www.footprint
network.org/faq/
Web page (2017), retrieved from http://info.cat.org.uk
/questions/low-impact-living/what-eco logical-footprint/)
Web page (2017), retrieved from http://www.unepfi.org/
fileadmin/documents/bloom_or_bust_ report.pdf
Web page (2017), retrieved from http://www.footprintnetwork
.org/our-work/ecological-foot print/
Web page (2017), retrieved from http://www.theecologist.org
/News/news_analysis/2736691/false_solution_ nuclear_power
_is_not_low_carbon.html
Web page (2017), retrieved from https://www.cse.org.
uk/downloads/reports-andpublications/ planning/renewables/
common_concerns_about_wind_power.pdf

48
CHAPTER 3
CONVENTIONAL ENERGY PRODUCTION
SYSTEMS AND ENVIRONMENTAL IMPACTS:
THERMAL POWER PLANTS
Chapter writers: Başak TAŞELİ1 and Duygu ALTIOK2
1Giresun University, Faculty of Engineering, Environmental
Engineering Department, Giresun-Turkey
e-mail: [email protected]
2Giresun University, Faculty of Engineering, Food
Engineering Department, Giresun-Turkey
e-mail: [email protected]
Abstract: Energy is mainly required to meet the needs of the
people and the sectors such as industry, housing and
transportation. But energy has also led to pollution of the
environment in a large way during production, conversion,
transport and consumption, as well as indispensable benefits in
our lives. Large-scale energy production and conversion
systems, established in parallel with population growth and
industrial development, greatly influence the ecological
balance, as well as transboundary influences. The emissions
from power plant or from other parts of its fuel chain are the
main factors yielding the environment problems. These
emissions include solid, liquid and gaseous emissions. There is
no doubt that burning of fossil fuels inevitably increases the
emission of nitrogen oxides (NOx), sulphur dioxide (SO2) and
carbon dioxide (CO2) which are clearly responsible for global
49
warming, acid rain formation and stratospheric ozone
depletion. Ecologic, economic and social impacts of climate
change, acid rain formation and ozone layer depletion will also
be presented in this chapter.
Learning Objectives:
At the end of this chapter, students will be able to:
• Discuss the scopes of environmental impacts,
• Define the impacts of thermal power plant,
• Explain how thermal power plants operate,
• Describe the terms of climate change, global warming,
ozone depletion and acid rain,
• Be aware the timeline of climate change, how serious is
acid rain and ozone depletion,
• Explain the concept of causes and impacts of climate
change, acid rain and ozone depletion,
• Be aware of the effect of human involvement on
environment.
3.1 How does a thermal power plant work?
Thermal power plants use water as a working fluid.
Conversion of the energy in the fuel into electrical energy
forms the operation of a power plant. In thermal power
stations, steam is produced by burning fuel and runs a
steam turbine. After passing through the steam turbine,
the steam is condensed in a condenser and recycled into
the boiler to become steam (see Figure 3.1). Thermal
power plants use coal, oil and natural gas as their primary
fuel (http://www.electricaleasy.com/2015/08/thermal-
power-plant.html).

50
Figure 3.1. Layout of thermal power plant (http://www.
electricaleasy.com/2015/08/thermal-power-plant.html)
3.2 Environmental impacts of thermal power
plants
The environmental effects of the thermal power plant
need to be examined both before and after the energy
production. For example, for a coal using power plant,
consideration should be given to the removal of coal
mines, the removal of ash and the removal of the plant
from final service in assessing the effects of a full fuel-
chain plant. The most significant environmental impact
of power plants and power generation is due to solid,
liquid, gas emissions from the power plant or other parts
of the fuel chain (see Figure 3.2). Gaseous emisions
include flue gases (SO2, NOx), hydrocarbons, carbon
monoxide and carbon dioxide. In thermal plants, basic
liquid emission is wastewater. Significant amounts of
water are used for cooling, cleaning and other processes.

51
The heavy metals such as Fe, Zn, Cu, Pb which are found
in the fly ash due to the fuel fraction are solid emissions.
They remain suspended in the air and transported to
groundwater and drinking water sources by washing with
rain water (www.britannica.com).
In addition to the direct emissions, there are secondary
components including ozone formed from the oxides of
nitrogen and volatile organic compounds (VOCs),
sulphur compounds formed from sulphur dioxide, and
acid rain formed from sulphur dioxide and oxides of
nitrogen. Table 3.1 summarizes the types of impacts that
can result from different discharges.
Coal fired, oil fired and natural gas fired power
plants
Occupational hazards are
• Accidents and illnesses during production of
materials, drilling, oil and gas field development, mine
and plant construction;
• Accidents in transport line construction and
transportation of coal and oil to the power plant;
• Accidents in operation of the power plant;
• Cancer arising from exposure to carcinogenic
hydrocarbons;
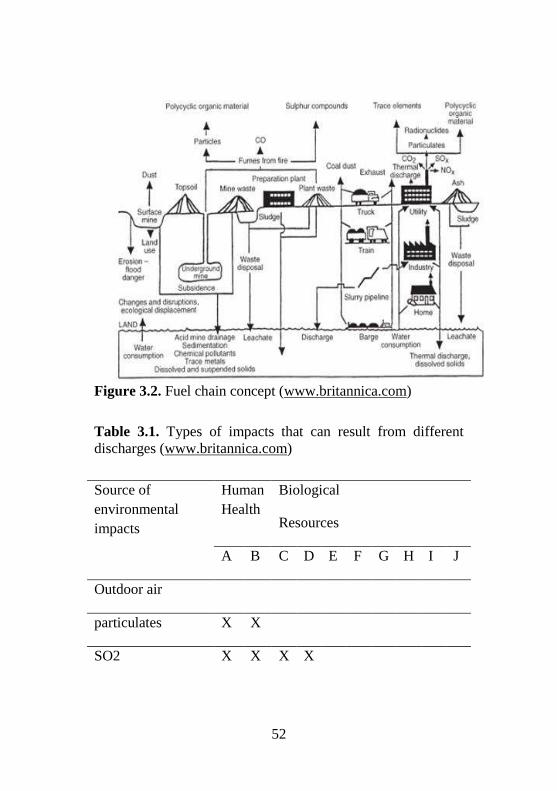
52
Figure 3.2. Fuel chain concept (www.britannica.com)
Table 3.1. Types of impacts that can result from different
discharges (www.britannica.com)
Source of
environmental
impacts
Human
Health
Biological
Resources
A B C D E F G H I J
Outdoor air
particulates X X
SO2 X X X X

53
NOx, nitrate, NO2 X X X X
toxics, lead,
mercury
X X X X X X X X
CO X X
CO2 X X X X X X X X
CFCs X X X X X X X X
steam
Secondary outdoor air
acid aerosols X X
acid deposition X X X X X
ozone (HCs,
VOCs)
X X X X
Indoor air
Surface water disposal
Chemical X X X X X X
Thermal X X X
Solid waste disposal
Transportation X X

54
Land use X X
Hazardous/PCBs X X X X X
Toxics in ash X X X X X
Construction/operation
Facility:land use X X X X
Transmission-land
use
X X X X
Explosion/accident X X X
Spills X X X X X X X X
Decommissioning X X X
Fuel acquisition
Extraction X X X X X X X X X
Processing X X X X X X X X
Transportation/
storage
X X X X X X X X
A:mortality; B:morbidity; C:vegetation; D: forests E:fisheries; F:aquatic;
G:terrestrial; H:groundwater; I:climate change; J:aesthetics

55
Public hazards
• Injuries and mortality during coal, oil and gas
transportation;
• Effects of inhalation of pollutants during the
production of materials used in mine and plant
construction and oil and gas field development;
• Effects of inhalation of pollutants from coal, oil and
gas combustion released during power plant operation;
• Toxic substances released by solid and liquid wastes.
• Fires and explosions of stored oil and gas.
Environmental impacts
• Loss of land for open pit mining, or mining damage in
underground mine areas;
• Acid rains;
• Pollution of water due to liquid effluents from mines;
• Pollution of water due to solid and liquid wastes from
the power plant;
• Loss of forests, crops and the yield of pets and in the
number of wild animals on land and water due to
absorption of pollutants from coal, oil and gas
combustion released during power plant operation;
• Spread of radioactivity around ash piles;
• Global warming due to CO2 released during plant
operation, material production and plant construction;
• Pollution of water during oil transportation and
accidents.

56
3.3 Global climate change
Climate: Climate is the average of the weather
conditions in one place over a wide range of time and
region. The elements that determine climate in a region
are temperature, wind, humidity, pressure in the air, and
how they change over the course of the day and year.
Climate change: Climate change is a change in the
climate as a result of human activities that directly or
indirectly distort the composition of the atmosphere and
the natural climate change observed in comparable time
periods.
Global warming: Global warming is the increase in the
average air temperatures near the surface of Earth which
has been discussed over the past one to two centuries.
The intense burning of fossil fuels and the increasing of
greenhouse gases in the atmosphere, especially carbon
dioxide, and thus the warming of our world are defined
as greenhouse effect (global warming).
Gaseous influent gases include carbon dioxide, methane,
carbon monoxide, hydrocarbons and
chlorofluorocarbons. It is stated that the greatest effect of
global warming is that the glaciers in the poles will cause
erosion and that the sea will rise and many countires will
flood. As the fossil fuel consumption runs at the same
rate, it shows that the temperature of our world will
increase by 5 degrees over the next 50 years, which will
lead to catastrophic disasters. In addition, with the
increase of the earth's temperature due to the greenhouse
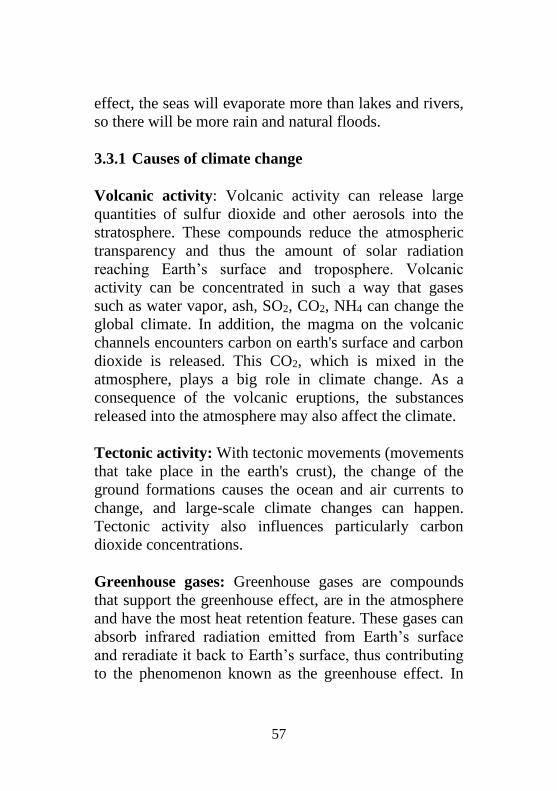
57
effect, the seas will evaporate more than lakes and rivers,
so there will be more rain and natural floods.
3.3.1 Causes of climate change
Volcanic activity: Volcanic activity can release large
quantities of sulfur dioxide and other aerosols into the
stratosphere. These compounds reduce the atmospheric
transparency and thus the amount of solar radiation
reaching Earth’s surface and troposphere. Volcanic
activity can be concentrated in such a way that gases
such as water vapor, ash, SO2, CO2, NH4 can change the
global climate. In addition, the magma on the volcanic
channels encounters carbon on earth's surface and carbon
dioxide is released. This CO2, which is mixed in the
atmosphere, plays a big role in climate change. As a
consequence of the volcanic eruptions, the substances
released into the atmosphere may also affect the climate.
Tectonic activity: With tectonic movements (movements
that take place in the earth's crust), the change of the
ground formations causes the ocean and air currents to
change, and large-scale climate changes can happen.
Tectonic activity also influences particularly carbon
dioxide concentrations.
Greenhouse gases: Greenhouse gases are compounds
that support the greenhouse effect, are in the atmosphere
and have the most heat retention feature. These gases can
absorb infrared radiation emitted from Earth’s surface
and reradiate it back to Earth’s surface, thus contributing
to the phenomenon known as the greenhouse effect. In

58
this way, greenhouse gases increase the temperature in
the atmosphere and cause global warming and therefore
climate change through greenhouse effect. Today, the
main greenhouse gases are known as carbon dioxide
(CO2), chlorofluorocarbons (CFC’s) and halons, methane
(CH4), diazotmonoxide (N2O) and ozone (O3).
Water vapour: Warming of the surface of the earth and
the lower atmosphere triggers the greater evaporation rate
of water from the surface. In the lower atmosphere,
greater concentration of water vapour absorbs high
amount of longwave radiation and emits it downward.
Carbon dioxide: CO2 is the most heat-holding gas in the
air. Amount of atmospheric CO2 depends on the
volcanoes activity, the combustion and natural decay of
organic matter, and respiration by aerobic organisms. The
increase in the amount of CO2 and other gases holding
heat causes the atmospheric heat to rise. It is worried that
this could lead to climate changes that would have
serious consequences such as the melting of the glaciers
and the rise of the oceans.
Methane: Methane (CH4) is the second most important
greenhouse gas. It is involved in atmosfere with various
human and animal activities. Methane has heat retaining
property. It has a considerably shorter residence time in
the atmosphere than CO2.
Surface-level ozone and other compounds: The amount
of ozone varies depending on latitudes and elevations in
the atmosphere. Surface ozone (O3) is a result of air
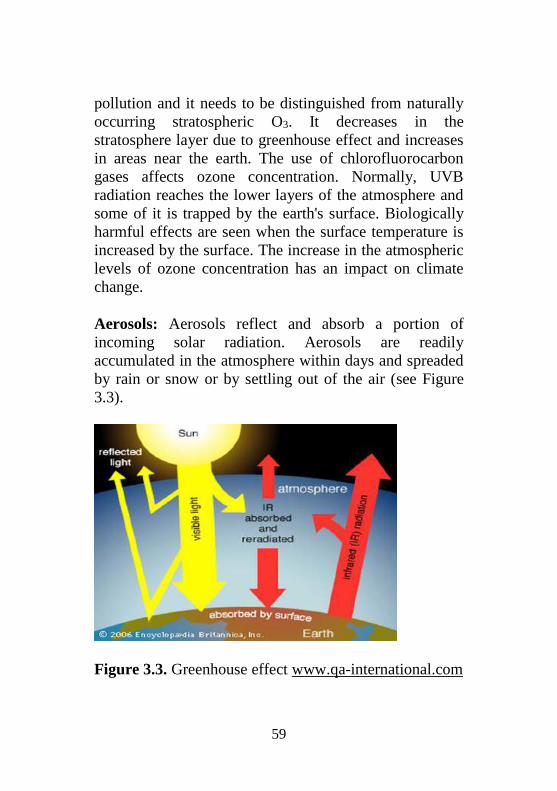
59
pollution and it needs to be distinguished from naturally
occurring stratospheric O3. It decreases in the
stratosphere layer due to greenhouse effect and increases
in areas near the earth. The use of chlorofluorocarbon
gases affects ozone concentration. Normally, UVB
radiation reaches the lower layers of the atmosphere and
some of it is trapped by the earth's surface. Biologically
harmful effects are seen when the surface temperature is
increased by the surface. The increase in the atmospheric
levels of ozone concentration has an impact on climate
change.
Aerosols: Aerosols reflect and absorb a portion of
incoming solar radiation. Aerosols are readily
accumulated in the atmosphere within days and spreaded
by rain or snow or by settling out of the air (see Figure
3.3).
Figure 3.3. Greenhouse effect www.qa-international.com

60
Table 3.2 shows the timeline of the climate change.
Table 3.2. A timeline of developments in climate change
(www.britannica.com)
Year Action
1896 Svante Arrhenius constructs the first climate change
model of the influence of atmospheric CO2
1920-
1925
Era of large-scale petroleum development begins with
the opening of Texas and Persian Gulf oil fields
1957 Roger Revelle and Hans E. Suess write that “human
beings are now carrying out a large scale geophysical
experiment” in a paper examining CO2 uptake by the
oceans.
1960 The curve developed by American climate scientist
Charles David Keeling begins to track atmospheric
CO2 concentration.
1973 First oil shock.
1974 First evidence of chlorine chemicals being involved
in ozone depletion published.
1979 Second oil shock.
1980 Keeling curve: CO2 concentration in 1980=337 ppm.
1990 First Intergovernmental Panel on Climate Change
(IPCC) report notes pattern of past warming while
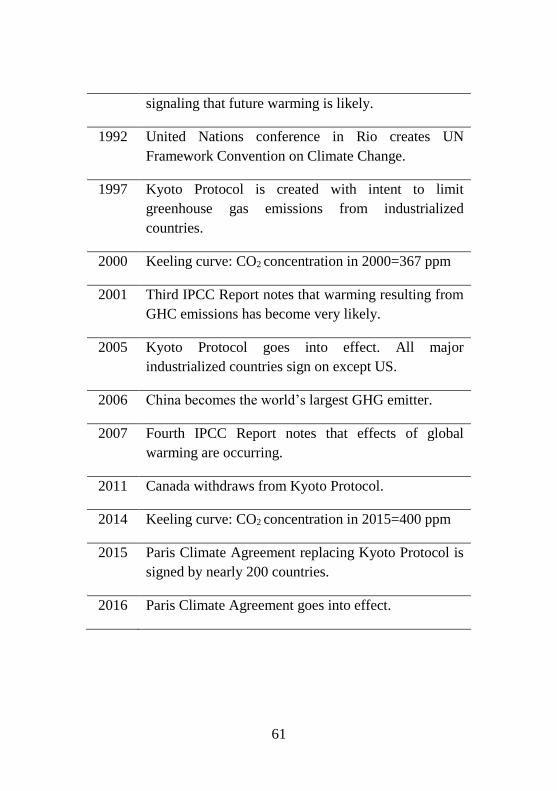
61
signaling that future warming is likely.
1992 United Nations conference in Rio creates UN
Framework Convention on Climate Change.
1997 Kyoto Protocol is created with intent to limit
greenhouse gas emissions from industrialized
countries.
2000 Keeling curve: CO2 concentration in 2000=367 ppm
2001 Third IPCC Report notes that warming resulting from
GHC emissions has become very likely.
2005 Kyoto Protocol goes into effect. All major
industrialized countries sign on except US.
2006 China becomes the world’s largest GHG emitter.
2007 Fourth IPCC Report notes that effects of global
warming are occurring.
2011 Canada withdraws from Kyoto Protocol.
2014 Keeling curve: CO2 concentration in 2015=400 ppm
2015 Paris Climate Agreement replacing Kyoto Protocol is
signed by nearly 200 countries.
2016 Paris Climate Agreement goes into effect.
62
3.3.2 Environmental consequences of global
warming
Global warming and climate change have the potential to
change the earth air temperatures that influences
ecosystem and thus the biodiversity of plants, animals,
and other forms of life. According to forecasts, in
Europe in the late 21st century the average temperature
will rise by 2.3-6.0 ° C that can poses serious risks of
extinction of a large fraction of plant and animal species
and severe human health problems (IPCC, 2007). Surface
warming in many regions can lead to uncontrolled
changes such as earlier leaf production by trees, earlier
greening of vegetation, altered timing of egg laying and
hatching, and shifts in the seasonal migration patterns of
birds, fishes, and other migratory animals. In high-
latitude ecosystems, changes in the seasonal patterns of
sea ice threaten predators such as polar bears and
walruses; both species rely on broken sea ice for their
hunting activities.
Depending on climate change, air systems will change,
resulting in water, air, product quality and quantity,
ecosystem, agriculture and infrastructural problems. The
effects of global warming can be counterproductive as
sea level rise, seasons change and ecosystems deteriorate.
Longer, severe droughts and desertification may be
effective in some regions, while the severity and
frequency of hurricanes, floods increase in some parts of
the world due to global warming. It is expected that
temperatures will increase in winter, early spring arrival,
fall delay and animal migration periods. Plant and animal

63
species that can not withstand these changes can also be
reduced or completely destroyed.
3.3.3 Socioeconomic consequences of global
warming
It is predicted that the amount of fresh water stored in
mountain glaciers and snow will decrease, and thus more
than 15 percent of the world's population will not benefit
from fresh water. In addition, temperature will have a
negative impact on water quality through the effects on
lakes and biological activities on rivers, which will lead
to even less access to safe water resources for drinking
and farming. For example, warmer waters cause
unpleasant algal blooms that can pose health risks to
humans.
3.4 Ozone depletion
Ozone is most abundantly present in the atmosphere in
two distinct tectonic plates, the troposphere and the
stratosphere. These are the stratospheric ozone in the
stratosphere, which is naturally found above 10-45 km
from the Earth’s surface and constitutes 90% of total
ozone in the atmosphere (see Figure 3.4). It is vitally
important because it keeps harmful ultraviolet radiation
from the sun. The second one is the tropospheric ozone
(industrial wastes, exhaust gas, etc.), which is human-
origin, which is about 10-15 km from the ground and
constitutes 10% of total ozone in the atmosphere.
Tropospheric ozone ranks fourth among greenhouse
gases that play a role in global climate change. Long
wavelength radiation remains in the atmosphere, causing

64
the greenhouse effect in the atmosphere to increase.
Contribution to greenhouse effect in global climate
change is 7%. It affects human health adversely. The
ozone that reacts with other molecules in the atmosphere
has various damages to living tissues of plants and
animals. Nitrogen oxides (NOX), one of the sources of
malignant ozone, are predominantly composed of motor
vehicles (49%), power plants (28%), industrial activities
(13%) and commercial activities (5%). The ozone in the
stratosphere is primarily resulted by breaking the
chemical bonds within oxygen molecules (O2) by high-
energy solar photons by the process called
photodissociation. Single oxygen atoms released due to
phodissociation later join with oxygen molecules to form
ozone.
The ozone feature in the stratosphere is absorbing
ultraviolet (UV) rays that affect all living things, natural
resources and agricultural products negatively. The
amount of ozone in the stratosphere varies naturally
throughout the year as a result of chemical processes,
winds and other transport processes that move ozone
molecules around the planet. The fact that the density of
the ozone is too low to hold the ultraviolet rays is called
the "ozone layer perforation" or “ozone depletion”. As a
result of the thinning of the ozone layer; UV-b radiation
is increasing and people's immune systems are damaged,
leading to visual impairment and skin cancer.

65
Figure 3.4. Ozone layer (https://www.google.com.tr/search ?
q=ozone+destruction+mechanism)
Human activities have substantially altered the ozone
layer for over several decades. The increase in the
amount of chlorine and bromine in the stratosphere
stimulates the ozone depletion. These chemicals destroy
ozone by stripping away single oxygen atoms from ozone

66
molecules after they removed from the
chlorofluorocarbons (CFCs) and other halocarbons
(carbon-halogen compounds) by UV radiation. Depletion
is so extensive that so-called ozone holes form over the
poles during the onset of their respective spring seasons.
The chlorine atoms then react with ozone, initiating a
process whereby a single chlorine atom can cause the
conversion of thousands of ozone molecules to oxygen
(see Figure 3.5).
Figure 3.5. Ozone depletion mechanism (https://www.
google.com.tr/search? q=ozone+destruction+mechanism)

67
3.5 Acid rain
The coal that is used in thermal power plants, heating and
industrial establishments emits atmospheric ash
(cadmium, steel, lead), CO2 and SO2. Consumption of
coal and oil is increasing all over the world. The
increased number of vehicles also increases the carbon
monoxide gas in the atmosphere due to the consumption
of oil. Volcanoes also increase the amount of gases such
as SO2 and CO2 in the atmosphere. These gases, which
cause air pollution, react with the water in the
atmosphere (H2O). The result is acidic compounds such
as H2SO4 (sulfuric acid), HNO3 and HCO3 (carbonic
acid) as the reactions are given in Equations 1and 2,
respectively. Nitric oxide (NO), which also increases the
natural acidity of rainwater, is formed during lightning
storms by the reaction of nitrogen and oxygen. In
addition to that, high-temperature air combustion occurs
in car engines and power plants produces large amounts
of NO gas. In air, NO is oxidized to nitrogen dioxide
(NO2) and reacts with water to give nitric acid (HNO3)
(Equation 3). This type of gas falls on the earth in the
form of rain, snow or fog with acidic properties and is
called as acid rain.
H2O + SO2 H2SO4 ……………………(Eqn 3.1)
H2O + CO2 H2CO3 H+ + HC…(Eqn 3.2)
H2O + 3NO2 2HNO3 + NO…………….(Eqn 3.3)
Acid deposition also includes the dry deposition of acidic
particles and gases, which can affect landscapes during
dry periods. The damage of acid rain is not limited to the

68
forests, but it affects the living beings as well as the
railways, buildings, bridges and historical remains. The
CO2 emissions leading to the atmospheric greenhouse
effect as a result of the fossil fuel combustion reaction
reached 0.6 billion tonnes/year in 1990, a significant
increase especially in the last 40 years, reaching 5.5
billion tonnes/year in 1998.
Air pollution has an adverse effect on the climate by
preventing the rays reaching to the places and spreading
to the atmosphere. The acid rain causes chlorophyll
breakdown in the leaves and causes the plant to yellow
and dry. As is known, plants consume CO2 during
photosynthesis. Acid rain is drying up the vegetation and
on the other hand it is setting the environment for the
increase of the amount of CO2 in the atmosphere.
3.5.1 Environmental effects of acid rain
Atmospheric pollutants are easily moved by wind
currents. Therefore acid rain can affect very wide region
even far from where pollutants are generated (see Figure
3.6). Acid rain is a growing environmental problem
worldwide since it triggers a number of inorganic and
biochemical reactions with deteriorius environmental
effects. Acid rain is harmful to the whole environment,
but the forests and agricultural areas are the most affected
ones. These rains wash away elements important to plant
growth such as magnesium and calcium in the soil
structure and cause them to move deeply. As a result,
trees and other plants can not benefit from the earth as
much as they could. The loss of these minerals from the
soil can kill trees and damage crops. It also causes the

69
dissolution of the aluminum in the soil and prevents the
tree roots from benefiting from the nutrients.
Acid rains cause the acidification of the cytoplasm,
which leads to water balance in the leaves, entering from
the stomata of the leaves. In leafy vegetables such as
trees and spinach, the SO2 closes the leaf surface in a
plastic cover and prevents photosynthesis. As a result of
this, water is lost and the leaf will soon die. In addition,
the upper parts of the tree that are weakened by time and
weakened by the leaves can not make the wind curtain
and can be transferred from the wind. Thus, the green
shoots of the trees do not grow and dry, their leaves spill,
they do not give flowers and fruits. As the acid rain
falling on the soil breaks the pH balance of the soil, the
soil microorganisms are negatively affected from this
situation and therefore they can not sustain their activities
and thus they can not survive (Kızıloğlu T., 1995).
Acid rains fall into the ponds and rivers, disturb the acid
balance in the water and affect the fish. In the acidic
environment fish cannot live anymore. Influence of fish
on this situation also affects us through the food chain.
Acid rain penetrates underground, surface and drinking
waters, interacts with soil heavy metals and reacts to fish
and plants. As a result of feeding with these foods,
diseases such as goitre, ulcer, chronic bronchitis, asthma
and emphysema occur in the human body due to the
storage of acid substances (Kızıloğlu T., 1995).

70
Figure 3.6. Effect of acid rain on Great Smoky Mountains’
Forest https://www.google.com.tr/search?q=Effect+of+acid+
rain+on+Great+Smoky+Mountains
Acid rain causes pollution of our drinking water sources.
If a small lake with drinking water is high and the acid
rain falls, the ascending acid ratio increases and it
becomes non-drinkable. Therefore, the environmental
damages of acid rain should not be ignored, as these rains
may cause the depletion of clean, drinkable water
resources in the future.
Harmful gases that lead to acid rain cause various
respiratory system diseases because they are in the air we
breathe. If the rainy acid rains come into contact with the
skin, it can cause discomfort such as skin cancer. Sulfate

71
in the air is taken by respiration and causes various
diseases such as bronchitis, asthma, cancer.
3.5.2 Effect of acid rain on stone buildings and
monuments
Acid rains have abrasive properties. Buildings, sculptures
and even historical artifacts in the surrounding area are
destroyed due to erosion when they come into contact
with acid rain. If the acid content in the acid rain is high,
even the hardest rocks can be eroded. Stone works such
as marble, lime and granite, which are forms of calcium
carbonate, are used in the construction of historical
works. Marble and limestone both consist of calcium
carbonate (CaCO3) differing only in their crystalline
structure. Historical works were made of stones such as
marble, limestone and calcareous sandstone. Although
these are recognized as highly durable materials,
buildings and outdoor monuments made of marble and
limestone are now being gradually eroded away by acid
rain. Since the sand particles in the sandstone coexist
with a calcareous material, it is observed that the sand
particles are poured over time due to acid rain and the
effect of air pollutants.
A chemical reaction (Equation 4) between calcium
carbonate and sulfuric acid which is the primary
component of acid rain results in the dissolution of
CaCO3 to give aqueous ions. These ions are washed
away in the water flow (www.chemistry.wustl.edu)
CaCO3 + H2SO4 Ca+SO4+ H2O+CO2…...(Eqn 3.4)

72
The pH of the rainfall, the duration of precipitation and
the temperature of the environment are also important
when historical works are affected by acid rain.
References
IPCC (2007), Climate Change 2007: Synthesis report.
Intergovernmental Panel on Climate Change, 4th Assessment
Report, ISBN 978-92-9169-143-2.
Kızıloğlu,T. (1995). Toprak Mikrobiyolojisi. Atatürk
Üniversitesi Ziraat Fakültesi, Yay. no: 180, Erzurum (in
Turkish).
Web page (2017) retrieved from http://www.
electricaleasy.com/2015/08/thermal-power-plant.html
Web page (2017) retrieved from www.britannica.com
Web page (2017) retrieved from www.qa-international. com,
created and produced by QA International
Web page (2017) retrieved from www.chemistry.wustl.edu
Web page (2017) retrieved from https://www.google.
com.tr/search?q=ozone+destruction+mechanism
Web page (2017) retrieved from https://www.google.
com.tr/search?q=Effect+of+acid+rain+on+Great+Smoky+Mo
untains

73
CHAPTER 4
ECOLOGICAL AND ENVIRONMENTAL
DIMENSIONS OF NUCLEAR POWER PLANTS
Chapter writers: Feriha YILDIRIM1 and Gamze YÜCEL
IŞILDAR2
1Gazi University, Institute of Science and Technology,
Environmental Sciences Dept, Ankara-Turkey
e-mail: [email protected]
21Gazi University, Institute of Science and Technology,
Environmental Sciences Dept, Ankara-Turkey
e-mail: [email protected]
Abstract: Nowadays, increasing energy demands make
countries use fossil fuels because they are cheap and easily
available. However, greenhouse gases (especially CO2
emissions) caused by fossil fuels have sped up climate change.
Therefore, as an alternative energy source the number of
nuclear power reactors (NPR) has increased in the last years.
Nuclear energy is having a revival as a potential alternate for
electric power generation as there has been an increased
concern about global warming. However, there have been
approximately 100 of nuclear accidents in the last 60 years
with some of them having serious impact on the environment.
Along this line, nuclear power plants need to be evaluated with
respect to their ecological impact. In this chapter; advantages
and disadvantages of NPRs are given briefly. Ecological risks
of all steps (from cradle to grave) are discussed in terms of;
uranium mining, enrichment, nuclear fuel cycle; processes in
the reactor, disposal of radioactive waste, dismantling of the

74
reactor. “Energy efficiency, climate change, public health,
ecosystems, biodiversity, future generations and public
participation” are all taken as the basic criteria to evaluate
nuclear energy, while also taking into consideration the
economic, political and social aspects.
Learning objectives:
At the end of this chapter, Students will have an idea on:
• Advantages of NPRs,
• Disadvantages of NPRs,
• Riskful aspects of NPRs,
• Evaluation of NPRs from Ecological Aspects (in terms
of climate change, the quantity of energy obtained, economical
efficiency, ecosystem, bio-diversity, safety, community health,
rights of future generations, and participation of community)
4.1. Introduction
Nowadays, majority of energy being supplied is based on
fossil fuels. Fossil resources are expected to disappear in
the near future (nearly 150 years) and as the greenhouse
gases coming out of them cause climate change, there is a
need to search for alternative energy sources. Although
people's attention focus more on renewable energy
sources, the energy in this area is not sustainable. As they
cannot be stored or they are not sufficient enough and as
these constitute restrictions, “nuclear energy” has stayed
in the agenda as being a strong alternative to fossil fuels.
Nuclear means being related with nucleus. Nuclear
energy is the energy that comes out as the chain reaction

75
of atomic particles. Energy occurs as a result of two basic
reactions such as fusion and fission. The energy that
comes out as a result of fission of heavy radioactive
substances (Uranium), due to the neutron bombardment
or during the fusion of light radioactive substances, is
significantly big. Fundamental principle that is used at
the plants to derive nuclear energy is via fission reaction
specifically uranium (see Figure 4.1).
Figure 4.1. Fission reaction and chain reactions
(http://www.electricalport.com/technical-pole-section/is
nuclear alternative-what is nuclear energy -/4173#ad-image-0)
This term was first heard during 2nd World War. Where,
the beginning of studies began as relating to the bombs
that were dropped onto the city of Hiroshima in Japan on
the 6th of August, 1945 and onto the city of Nagasaki on
the 9th of August, 1945, Rutherford, Hans, Strassman,
Oppenheimer and Einstein were the first scientists who
studied on this energy source. (Karabulut Y., 1999)
Nowadays, 10.9 % of the world’s electricity is produced
by nuclear plants. According to the “Power Reactor
Information (PRIS) data” at International Atom Energy
Agency, 441 nuclear reactors plants are being operated
currently in 31 countries. (As of 15th of November,
2015).
However, in 25 years following Chernobyl nuclear
accident, nuclear power plant construction declined while

76
the global demand for electricity more than doubled. As a
result, nuclear’s share of the total electricity supplies
peaked at a shameful number of 18% in 1996 before
falling to 11% by 2014 (see Figure
4.2)(https://www.carbonbrief.org/mapped-the-worlds-
nuclear-power-plants)
Figure 4.2. Global nuclear electricity generation (blue
area, left axis) and nuclear’s share of total world power
generation (red bars, right axis). (BP Statistical Review of
World Energy 2015 and Carbon Brief analysis. Chart by
Carbon Brief)
Advantages of nuclear energy
-Not using fossil fuels and non-formation of greenhouse
gas emissions,
-Reduction in dependency on fossil fuels, the resource of
which is being used rapidly,
-Being more efficient as compared to renewable energy
sources,

77
-Provides strategic and political power for countries (It
being used for military purposes besides as energy
source)
-It being more stable from economical aspect with
respect to the prices changes in fossil fuels
Disadvantages of nuclear energy
-High risk of radiation in case of accidents causes
negative impacts on living creatures including humans
for generations,
-Many issues are experienced when disposing of
radioactive waste
-It being an expensive energy source,
-It requires external dependence with regards to sources
and technology,
-Negative impact on the environment in cases where the
relevant location is chosen in a wrong way,
-It requires a long period of time to start operating and its
operational period is short
In fact, nuclear energy is a political choice and the real
debate occurs in the political arena. But due to human
tragedies that have occurred as a result of nuclear
disasters; it also has aspects of ethics and conscience.
(Caldicott H., 2014) Therefore, it is important and even
necessary to evaluate the advantages and disadvantages
of nuclear energy by looking at it as a relationship
between humans and nature and by making investigation

78
from ecological aspect and therefore having a more
holistic point of view.
For this purpose, first of all the research looked at the
various stages of the energy sources such as uranium
mining, uranium enrichment, operation of reactor,
disposal of wastes, and disassembly of the plant.
“Risky aspects of nuclear power plants” have been
investigated and furthermore, the topics of “costs” and
“security” have been questioned again and again, while
ecological evaluations were conducted regarding below
particulars;
a) Energy efficiency
b) Climate change
c) Human health
d) Ecosystems and bio-diversity
e) Future generations
f) Public participation
These evaluations comply with the articles below that are
required reading in order to meet the investigation of
“production of energy policies which are more rational”
as they are specified in the Extern-E Report (1995) that
was prepared by European Committee:
• Risk analysis with regards to the disposal and
recycling of used nuclear wastes
• Comparison of carbon dioxide emissions

79
• Calculation of nuclear energy risk factors so as to be
able to create a radiological risk evaluation and
other economical foresights.
4.2. Riskful aspects of nuclear power plants
Just how safe are nuclear power plants are still one of the
mostly hotly debated topics among the scientists in the
world. In order to approach the event from a holistic
point of view, while making ecological evaluation of
these plants, all the stages should be considered and all
risks should be evaluated. For this reason, discussions
will be held relating to processing and embedding the
wastes coming out as a result of uranium exploration,
storage of used fuel, processing the wastes or reusing the
used fuel by processing it again, risk factors relating to
the stages when the reactor has completed its life cycle
and when it has to be disassembled, and the plants
probable impact on the environment (being ecological).
4.2.1. Uranium mining
In order to convert uranium from raw material, rocks
containing uranium are taken and they are made subject
to various physical and chemical processes and a solution
is obtained which contains uranium element. Afterwards
this solution is precipitated in the form of uranates.
During these processes, a small quantity of gas emerges
via exhaust from the machines and due to this situation
there is “greenhouse effect”. In addition, there is small
quantity of radioactivity dispersion.

80
4.2.2. Uranium enrichment
After uranium ores are extracted, they are made subject
of an “enrichment” process so that they can be used in
the plant. But there is a risk here such that production of
“nuclear weapons” is possible during the process of
enrichment. This can give rise to a situation where some
countries become interested in nuclear armament and
proliferation of nuclear weapons can take place. In case
nuclear weapons are used, radioactive particles form and
spread not only in that region but in a much wider
geography area and they keep on existing for many years
afterwards.
4.2.3. Operation of a reactor
All of the nuclear plants in the world generally work on
the basis of nuclear fission. The heat that forms as a
result of this reaction is then transformed into energy.
The water in the system is boiled with this heat and steam
is obtained. The steam that is obtained from this is sent
into a turbine under great pressure. Then the turbine
causes the electric generator to turn and as it goes
through the turning process, energy is derived. All of
these processes take place in a system that comprises of
many mechanical parts (around 50.000) all of which have
the probability to breakdown. This is a risk factor which
can increase radiation leakage. (Kurokawa G. et al,
2011). For example, breakdown of cooling systems and
overheating that comes as a result of this (nucleus fusion)
is one of the most serious threats that could cause
radiation dispersion.

81
In various discussions regarding nuclear power plants,
“accident risk”, is considered to be low due to high
technology and the safety measures that are taken. But it
does specify that in case of an accident, its impact could
be very big. (Erdöşemeci F., 2014). When nuclear plant
accidents occur they are graded according to a scale as
per their outcomes.
They are graded from 1 (least influential) to 7 (most
influential and “major” accidents) (IAEA and
OECD/NEA, 2008). However, even if it is stated that
“risk is low”, in the 60 year history of nuclear plants
there have been 99 nuclear plant accidents 2 of them
have been “major accidents” reaching level 7; 2 of them
were “serious accidents” with level 6; 1 of them was
“offside risk (accidents comprising risks outside the
facility) that were level 5. (Kurokawa et al, 2011: 13).
The three most notorious “nucleus fusion” accident were
a largest scale accident at Fukushima in Japan in year
2011 and in Chernobyl in Ukraine in year 1986, and
Three Mile Island in Pennsylvania in year 1979. Also,
between the years of 1952-2011, nuclear fusion accidents
on large scale took place in 4 nuclear plants and smaller
scale fusions took place in 10 reactors. Plus on 8
submarines owned by Soviet army (1961-1985), nuclear
fusion and radiation leakage took place. Japanese
government closed 50 out of 54 reactors after the
accident took place in Fukushima. (But these reactors are
still listed as being operated with the assumption that
they will be opened in the near future and they are shown
with this situation the IAEA lists). Similarly, after the
accident that took place in Fukushima, Germany closed 8
of their 18 reactors and they announced that the
82
remaining ones will be closed by 2022. After the accident
in Chernobyl in year 1986, Italy closed 4 nuclear reactors
in their country, while Austria closed their newly
established plant without even using it.
4.2.4. Disposal of wastes
Radioactive waste can be classified as low, medium, or
high grade depending on the radioactivity level they
have. (IAEA, 1995). The waste that occurs in nuclear
power reactors is considered ‘high level waste’ and they
make up 3% of all of the radioactive wastes in volume
and 95% with respect to radioactivity. In addition, their
half-lives are also very long. (For example half-life of Pu
239 is 24 065 years). Nuclear waste management could
be realized in two stages;
a) Reducing its volume and radioactivity level by
reprocessing and then storing them: Reprocessing is a
highly expensive technology and it also a security threat.
For example, a 1GW reactor can produce 240 kg of
plutonium and this quantity is sufficient for 20 nuclear
weapons.
At some nuclear reactors spent fuel is kept on site, above
ground, in a system that is similar to the one shown here
in Figure 4.3. Once the spent fuel has cooled, it is loaded
into special canisters. Each canister is designed to hold
approximately 2-6 dozen spent fuel assemblies,
depending on the type of assembly. Water and air are
removed. The canister is filled with inert gas, and sealed
(welded or bolted shut).

83
Figure 4.3. Vertical canisters with concrete or steel structures
(https://www.nrc.gov/waste/spent-fuel-storage/diagram-
typical-dry-cask-system.html)
Figure 4.4. Horizontal canisters
(https://www.nrc.gov/waste/spent-fuel-storage/diagram-
typical-dry-cask-system.html)

84
Some canisters are designed to be stored horizontally in
above-ground concrete bunkers, each of which is about
the size of a one-car garage (see Figure 4.4).
b) Final storage: In countries where there are nuclear
power plants, certain national and international policies
are available for the final storage of radioactive waste
that is created as a result of production.
The important topic regarding the disposal of nuclear
wastes is that there isn’t any final storage facility in the
world which can accept “high level waste” in the
operational stage because there is an obligation that it
must be away from risk for at least 250.000 years. (Altın
S. and Kaptan H.Y., 2006). Throughout the world, the
final waste facilities that can accept “high level of waste”
are being closed. One of the last ones to close be the
facility is situated on Yucca Mountain in the Nevada in
USA. But in year 2009 the storage process was stopped
in this region and a committee has been established to
create alternative solution and as a temporary solution to
this problem, the condition for storing the radioactive
wastes within the plant for 20 years has been added to the
contracts relating to nuclear power plants. Nowadays,
high level radioactive wastes is being stored in Carlsbad-
New Mexico, while low level radioactive wastes is stored
in Barnwell-South Carolina, Richland-Washington,
Clive-Utah, and OakRidge-Tennesseeregions. (World
Nuclear Association, 2014).
All of these reveals that finding a safe place to embed
nuclear waste so that it is isolated as not to cause any
leakages still remain a very important and unsolved

85
problem worldwide. For this reason, this risk is being
transferred to the future generations.
In a world where it is very difficult to find a place for
nuclear waste, another problem has appeared and it is
related to “exportation of dangerous wastes”. Developed
countries deliver their radioactive wastes to 3rd world
countries. The outcome of the wastes that is sent to these
countries is uncertain, while they continue being
dangerous both for that country and for the other
countries in an indirect way. (Ecosystem makes up a
whole).
4.2.5. Dismantling
Nuclear power plants are generally designed to be
operated for 30-40 years. This lifespan could be
prolonged to maximum 60 years through appropriate
management programs and new technological
developments. The cost of dismantling a nuclear plant
that has completed its lifespan can reach up very high
amounts and the risk of radiation leakage also can
appear. When the economic lifespan of the plant is
completed, the cost of disassembling its parts and the
disposing of it can make up 10-15% of total cost. (For
example, the cost of dismantling a standard plant that is
1200 MW in Germany and to convert it into a green area
was around 400 million Euros which made up 20% of
first investment cost. In France, cost of dismantling a
nuclear plant of 900 MWe had a 15% of first investment
cost. (World Nuclear Association, 2014). The particular
thing that needs to be emphasized here is that this cost is

86
first reflected onto the enterprise and then it is indirectly
reflected onto the community by the enterprise.
4.2.6. Cost:
The cost of a nuclear energy system has always been
higher than shown in the figures by the politicians and
researchers till now and “the cost it has on the impact on
the community and environment” has neither been
considered as part of the calculations or it has been
neglected. Consumption costs of a nuclear plant that has
a very long construction period is such that 60% of the
costs are related with production, 20% of them are
related to fuel, whereas 20% of them are related to
maintenance and repair work. Within the cost of
electricity generated by a plant through its lifespan,
particulars such as first investment, fuel, maintenance
and repair, waste disposal, and deactivating it as it
completes its lifespan come out to the forefront.
However, the below stated costs remain hidden and are
not considered as part of the calculation;
• Costs regarding nuclear power being compared with
other energy systems as part of Research and
Development studies,
• Cost of problems that can arise in the long term as
part of nuclear waste and deactivation,
• Loss in the value of land where the power plant will
be established and the loss in tourism revenue,
• The cost that radiation can create as a result of a
nuclear accident on the people, community, and the
natural environment. (For example the expenses for
the treatment of diseases relating to radiation, loss of
87
labor force, decline in production, the damage it does
to the agricultural lands and ecosystems, and
polluting drinkable water sources
In addition to these, existence of particulars such
as first investment cost that is high, long construction
period (10-12 years), while having a very short plant life
(50-60 years) should not be forgotten as they bear
negative features. When the high costs and probability of
being subjected to radiation for generations to come is
considered, it is required people to question the
efficiency and reliability of an energy that has such a
short lifespan. (Extern-E, 1995).
4.2.7. Nuclear plants as being a target in wars and
terrorism:
If war breaks out between the two states, they can choose
nuclear power plants (if they are available) as target to
strike since it can create such negative effects.
Furthermore, in case a security deficit occurs, nuclear
power plants can become open targets for national and
international terrorism and sabotage.
As it was explained in the section regarding the
advantages of nuclear energy, nuclear reactors don’t
produce air pollution or carbon dioxide as they operate
unlike fossil fuel plants. However, despite this the
process which involves mining and purification of
uranium ore and preparing it to become reactor fuel
requires high quantity of energy. Nuclear energy plants
also require big quantities of metal and concrete. If fossil
fuels are being used for the mining and purification of

88
uranium ore or if fossil fuels are used when nuclear
plants are established, it is hard to say that it does not
cause climate changes as a result of the emissions of
nuclear power plants. Because of the carbon footprint it
leaves behind to be built.
4.3. Evaluation of nuclear power plants from
ecological aspects
On one side there is the global warming problem and the
impact which is being felt by people and the environment
and on the other side is the increasing demand for
energy; therefore, the big risks that the nuclear power
plants have (although it is asserted that they are less) are
part of this dilemma and it is needed to be discussed and
decide which values are more important for people with
respect to environmental ethics or the need for energy.
From this point forth, Table 4.1 has been formed and
values such as climate change, the quantity of energy
obtained, economical efficiency, ecosystem, bio-
diversity, safety, community health, rights of future
generations, and participation of community have
been evaluated from ethical aspect and have been
investigated on how these would influence the
ecosystems. (By also emphasizing on political, economic
and sociological dimensions).
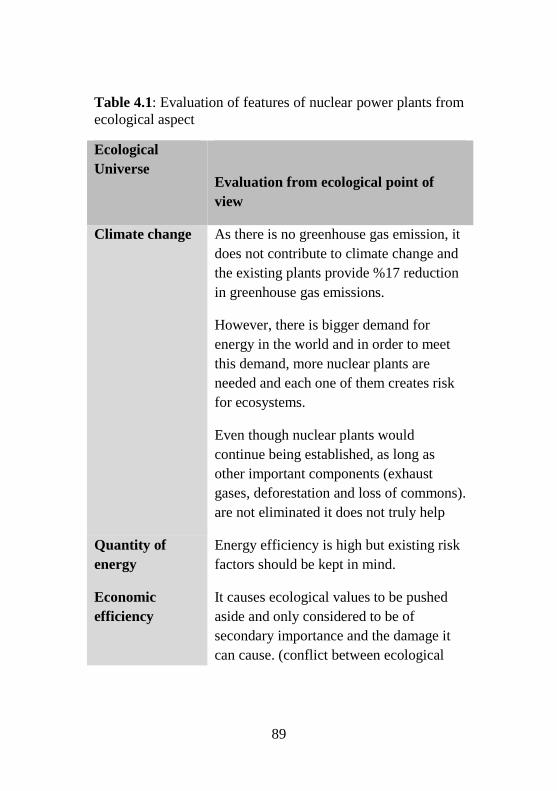
89
Table 4.1: Evaluation of features of nuclear power plants from
ecological aspect
Ecological
Universe
Evaluation from ecological point of
view
Climate change As there is no greenhouse gas emission, it
does not contribute to climate change and
the existing plants provide %17 reduction
in greenhouse gas emissions.
However, there is bigger demand for
energy in the world and in order to meet
this demand, more nuclear plants are
needed and each one of them creates risk
for ecosystems.
Even though nuclear plants would
continue being established, as long as
other important components (exhaust
gases, deforestation and loss of commons).
are not eliminated it does not truly help
Quantity of
energy
Energy efficiency is high but existing risk
factors should be kept in mind.
Economic
efficiency
It causes ecological values to be pushed
aside and only considered to be of
secondary importance and the damage it
can cause. (conflict between ecological
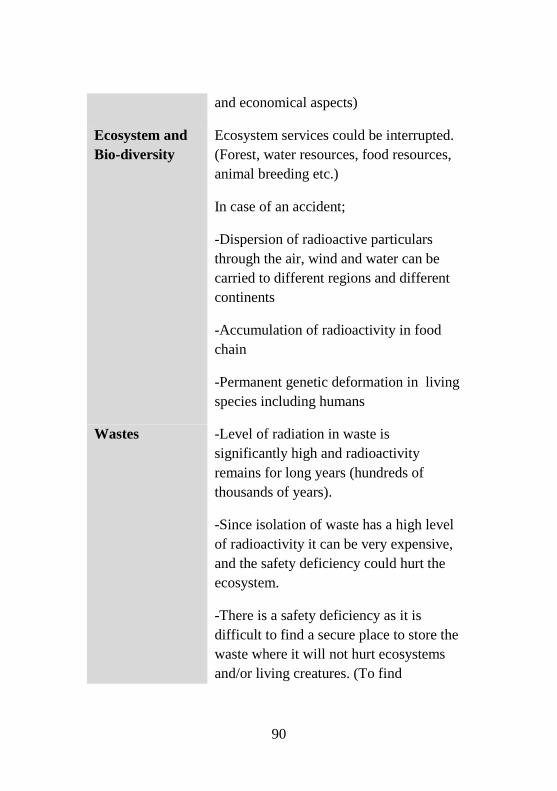
90
and economical aspects)
Ecosystem and
Bio-diversity
Ecosystem services could be interrupted.
(Forest, water resources, food resources,
animal breeding etc.)
In case of an accident;
-Dispersion of radioactive particulars
through the air, wind and water can be
carried to different regions and different
continents
-Accumulation of radioactivity in food
chain
-Permanent genetic deformation in living
species including humans
Wastes -Level of radiation in waste is
significantly high and radioactivity
remains for long years (hundreds of
thousands of years).
-Since isolation of waste has a high level
of radioactivity it can be very expensive,
and the safety deficiency could hurt the
ecosystem.
-There is a safety deficiency as it is
difficult to find a secure place to store the
waste where it will not hurt ecosystems
and/or living creatures. (To find
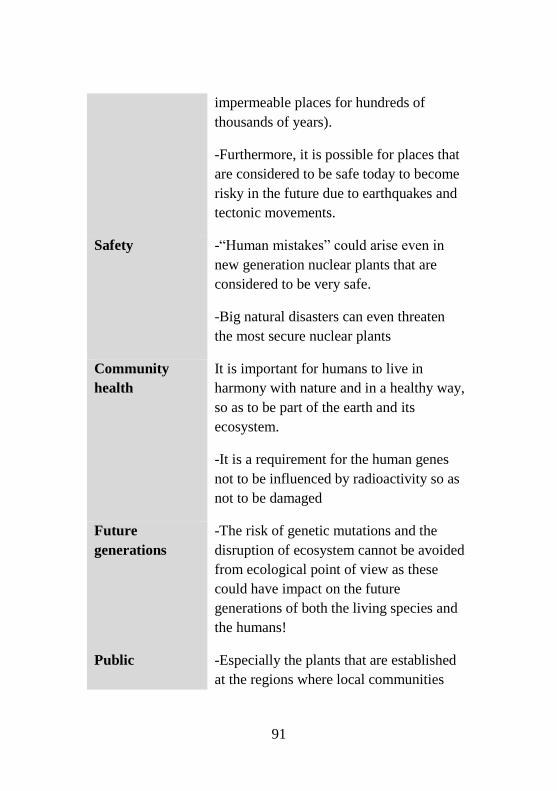
91
impermeable places for hundreds of
thousands of years).
-Furthermore, it is possible for places that
are considered to be safe today to become
risky in the future due to earthquakes and
tectonic movements.
Safety -“Human mistakes” could arise even in
new generation nuclear plants that are
considered to be very safe.
-Big natural disasters can even threaten
the most secure nuclear plants
Community
health
It is important for humans to live in
harmony with nature and in a healthy way,
so as to be part of the earth and its
ecosystem.
-It is a requirement for the human genes
not to be influenced by radioactivity so as
not to be damaged
Future
generations
-The risk of genetic mutations and the
disruption of ecosystem cannot be avoided
from ecological point of view as these
could have impact on the future
generations of both the living species and
the humans!
Public -Especially the plants that are established
at the regions where local communities

92
Participation reside or in the nearby regions can bear
the risk of disrupting the areas and also
disrupting the traditional (ecological) life
style.
-In case of an accident, traditional life
style of communities and their living areas
such as soil and water environment can
come under threat due to disruptions cause
by radiation.
While decisions are being taken to establish and operate
nuclear power plants, especially in developing
countries, it is highly important to have a look at the
benefit-cost analysis with scientific evidence and to
investigate potential impact (from ecological aspect) of
this technology. Because it would be lot more difficult
for these countries which have fragile economies to
regain strength in case of occurrence of a nuclear
accident.
The biggest advantage that those defending nuclear
power plants have is that the plants have a positive
contribution to global climate change and that they are
energy efficient. Besides, these plants are becoming more
efficient with the advances in technology and that the risk
of accidents is being significantly lowered. (Gamson
W.A. and Modigliani A., 1989) (Yıldırım M. and Örnek
İ., 2007). When the heavy pressure of climate change on
living species and the ecosystems is considered, these
features seem to be positive. According to the study

93
conducted by Pacala and Socolow (2004), nuclear energy
could be an option to reduce emission of greenhouse gas
in order to fix the global carbon dioxide emission by year
2050 (not to reduce it); there is a need for nuclear power
plants that generate energy of 700 GW. However,
according to Caldicott H., (2014) although there is a plan
to replace 10% of fossil based energy via nuclear energy
worldwide as of 2050, it also revealed that nearly 100
nuclear power plants need to be established by then. This
means that during the coming 36 years, 28 new nuclear
plants would need to be opened and operating. If the
target is to reduce the carbon dioxide emission by half by
using nuclear energy instead of keep using the carbon
dioxide emission at the current level it would require the
world to increase the number of reactors to 1400.
However, this amount of nuclear power plants would
cause new wastes to be created and thousand tons of
plutonium would be produced (as being raw material for
nuclear weapons).
83 % of the electrical energy that is used during the
enrichment stage of the fuel that is to be used in a nuclear
power plant is met by energy sources that are not nuclear.
When the energy required to extract and to carry the
uranium from the mine is also considered, this ratio gets
even higher. It means that while the nuclear power plant
is being build it requires the use of carbon and other
energy sources. In addition to this, as long as other
factors that are causing global climate change are not
eliminated (especially exhaust gases, fires occurring at
forests and grass areas etc.), increasing number of
nuclear power plants will not create a solution to this

94
problem. On the contrary, it will create more serious
problems.
Another missing point in the discussions regarding
nuclear plants (although various physical factors are
considered while decisions are taken with regards to the
disposal of radioactive wastes and while risk analysis and
modelling are realized) is that the “social” dimension is
not considered sufficiently enough.
References:
Altın, S., & Kaptan, H.Y. (2006). Radyoaktif atıkların
oluşumu, etkileri ve yönetimi. In Proceedings of 12.
Mühendislik Dekanlar Konseyi 2.Ulusal Mühendislik
Kongresi, Zonguldak.
Caldicott, H. (2014). Nuclear power is not the answer. New
York, U.S.A.: The New Press.
Dreicer, M., Tort, V., & Manen, P. (1995). ExternE:
Externalities of energy Vol 5 Nuclear (EUR--16524-EN).
International Atomic Energy Agency (IAEA).
Erdöşemeci, F. (2014). Nükleer güç santrallerinin çevre etiği
açısından irdelenmesi (Unpublished M.Sc. Thesis). Gazi
University, Ankara.
Gamson, W. & Modigliani, A. (1989). Media discourse and
public opinion on nuclear power: A constructionist approach.
American Journal of Sociology. 95(1), 1-37.
IAEA (1995). The Environmental and Ethical Basis of
Geological Disposal of Long-Lived Radioactive Wastes”
Annex I.

95
IAEA and OECD/NEA (2008). INES (The International
Nuclear and Radiological Event Scale) User’s Manuel.
Karabulut, Y. (1999). Enerji kaynakları, Ankara, Turkey:
Ankara Üniversitesi Basımevi.
Kurokawa, G., S. Iyengar, D. Macer, K. Uejima, N.
Chaipraditkul, A. Dorjderem, S. Gardini, C. Liuying, C.
Kuppuswamy, J. Rajan and S. Rao (2011). Ethics of Nuclear
Energy Technology (ECCAP WG12 Report). Ethics and
Climate Change in Asia and Pacific (ECCAP) Project, Draft 6.
Pacala, S. & Socolow, R. (2004). Stabilization wedges:
solving the climate problem fort he next 50 years with current
technologies. Science. 305(5686), 968-972.
Yıldırım, M., & Örnek, İ. (2007). Ultimate choice for energy:
The nuclear energy. Gaziantep University Journal of Social
Sciences. 6(1), 32-44.
Web page (2017), retrieved from
http://www.electricalport.com/technical-pole-section/is
nuclear alternative-what is nuclear energy -/4173#ad-image-0.
Web page (2017), retrieved from https://www.carbonbrief.
org/mapped-the-worlds-nuclear-power-plants
Web page (2017), retrieved from https://www.nrc.gov
/waste/spent-fuel-storage/diagram-typical-dry-cask-
system.html)
Web page (2017), retrieved from http://www.world-
nuclear.org/.
96
CHAPTER 5
SOLAR ENERGYSYSTEMS AND
ENVIRONMENTAL EFFECTS
Chapter writers: Uta Zähringer 1 and Krisha Sthapit2
1 Renewables Academy AG, Berlin, Germany
e-mail: [email protected]
2 Renewables Academy AG, Berlin, Germany
e-mail: [email protected]
Abstract: Solar energy is the thermal energy emitted by the
sun through nuclear fission and fusion of hydrogen atoms in
the sun’s core and on its surface. The use of solar energy can
be classified as direct (e.g. solar thermal or photovoltaics) or
indirect (e.g. wind, hydro or bioenergy). This chapter will only
cover direct use: solar thermal and solar photovoltaics
technologies. The first part of the chapter focuses on
technological aspects and the components of solar energy
applications. In comparison to conventional power plants
energy produced from renewable energy technology have less
greenhouse gas emissions and other environmental impacts.
However, there are some environmental impacts along the
value chains or solar energy projects. Some of them are
described in the second part of this chapter.

97
Learning Objectives
• Readers will be informed about various solar energy
technologies
• Readers will be able to evaluate the environmental
impacts of solar energy technologies along its
lifecycle
5.1. Technological aspects of energy generation in
solar energy systems
Solar energy is the thermal energy emitted by the sun
through nuclear fission and fusion of hydrogen atoms in
the sun’s core and on its surface. The sun provides the
earth with a tremendous amount of energy which makes
life as we know it possible. This incoming energy is
reflected, diffused, absorbed and reradiated by particles
and clusters of molecules in the atmosphere and on the
surface of the earth and the oceans. This in turn causes
winds, oceanic currents, evaporation, condensation (rain),
and regulation of the temperature of the earth’s surface.
Plants and trees convert light energy into chemical
energy via the process of photosynthesis, creating
biomass. This falls into the category of indirect use of
solar energy.
The use of solar energy can be classified as direct (e.g.
solar thermal or photovoltaics) or indirect (e.g. wind,
hydro or bioenergy). This chapter will only cover direct
use.
Technologies for direct use of solar energy are:
98
Solar thermal systems use solar energy to produce hot
water for a wide range of consumers such as private
households, hotels, hospitals, or for industrial processes.
They can also be used in space heating or cooling
applications.
Concentrated Solar Power (CSP) plants concentrate solar
energy via mirrors to generate high temperatures which
are used to produce steam to drive steam turbines to
generate electricity. It is a solar thermal technology for
generation of electricity.
Photovoltaic (PV) systems convert solar energy directly
into electricity by means of the photoelectric effect.
5.1.1.Solar thermal
The conversion of solar radiation into heat, or thermal
energy, is called "solar thermal". Solar thermal has the
highest efficiency of all the different types of solar
energy. This thermal energy can be used for domestic hot
water (DHW) provision, for space heating, for thermal
processes (process heat), or even for cooling.
5.1.1.1. Components of a solar thermal system
Absorber
The heart of every solar thermal system is the absorber. It
is made from a highly conductive metal sheet, preferably
copper. For economic reasons aluminium is increasingly
being used as it costs less than copper and is also a good
conductor. The surface is coated with the selective,
radiation absorbing layer that converts the light into heat.

99
This heat then conducts through the metal to channels in
which a heat transfer fluid is circulated. The heat is
transferred to the fluid via convection and the hot fluid is
transported either to where it is used or where it can be
stored. The heat transfer fluid is generally water or a mix
of water and antifreeze, however air can also be used (as
in air collectors) (see Figure 5.1).
Collector
If higher temperatures are required, such as for DHW
(domestic hot water) provision, space heating or process
heat, then the absorber must be covered and insulated to
hinder heat loss.
There are two types of collector, flat plate and evacuated
tube. In the flat plate collector, a glass cover is fitted a
few centimetres above the absorber which allows the
solar radiation through but reduces convection heat losses
(greenhouse effect). Thus, light penetrates through the
glass cover and is converted to heat in the absorber.
Mineral fibre or foam insulation is fitted to the back and
sides of the collector to minimise conduction and
convection losses and trap the heat inside.
Evacuated tube collectors have a high efficiency due to
the good insulating properties of the vacuum within the
tubes. A simple type of evacuated tube comprises an
evacuated glass tube into which an absorber strip with a
selective coating is inserted. A coaxial pipe (a pipe
within a pipe) runs along the length of the underside of
the absorber strip. Inside the coaxial absorber pipe, the
heat transfer fluid flows down the inner pipe and back up
100
the outer pipe where it picks up the heat from the
absorber strip. The glass tube is sealed with a metal lid.
The coaxial absorber pipe penetrates this lid and opens
into a header pipe. This is a direct flow collector.
Thermal stores
There are times when solar irradiation levels are not high
enough to meet demand, for example, at night and in the
winter. At other times, there is too much solar irradiation.
Both these situations make it desirable to have a thermal
store in the solar thermal system. Water is usually used as
the thermal store medium for several reasons: it has a
very high specific heat capacity, it does not present a
health risk and it is available almost everywhere.
Domestic hot water (DHW) stores are used for hot water
provision. They contain potable water that is drawn off
at, e.g. taps or showers.
Stores for space heating or process heat applications are
called buffer stores. These contain process water that
circulates around a closed circuit and is not consumed.
Combi stores are buffer stores with an integrated DHW
store (tank in tank) or integrated DHW heating coil.
The store itself is made from steel, enamelled steel,
stainless steel or copper depending on the application.
Unpressurised (or open vented) cylinders are increasingly
being manufactured from plastic, plastic film or glass
fibre reinforced plastic.

101
Thermal insulation around the store is very important to
reduce thermal losses as far as possible and thus to
increase the overall system efficiency.
Pump
In forced circulation systems, pumps are used to move
the heat transfer fluid around the system. The same type
of pump can be used as in a conventional heating system.
The pump specification for solar thermal systems is
however somewhat different. In conventional heating
systems, a high flow rate, low pressure loss pump is
required. For solar thermal systems a high-pressure loss,
low flow rate pump is required, i.e. a pump with a
different performance curve.
Expansion vessel
In sealed systems, an expansion vessel takes up the fluid
expansion that takes place due to changing fluid
temperature. Expansion vessels for conventional heating
systems can in principle be used in solar thermal systems.
However, if antifreeze is being used then the expansion
vessel membrane must be resilient to this. In addition,
measures must be taken to avoid the membrane being
exposed to high temperatures during periods of
stagnation.
Other components
Fluid expands when it is heated and can produce high
pressure. Therefore, a safety valve must be incorporated
into a sealed system to release pressure in the event of
system pressure rising to unsafe levels. Such a pressure

102
increase can occur when, for example, another system
component such as the expansion vessel fails. The safety
valve is sized in the same way as in a conventional sealed
system.
Figure 5.1. Solar thermal system components, forced
circulation system (Source: RENAC)
5.1.2. Concentrated solar power (CSP)
Concentrated Solar Power (CSP) technology concentrates
solar radiation to achieve high temperatures typically in
the range 290 – 1000C. This thermal energy is either
used directly in process heat applications or converted to
electricity via steam turbines.
CSP requires very high levels of direct solar radiation,
therefore the geographical locations for implementation
worldwide are limited. Parabolic trough, solar tower (or
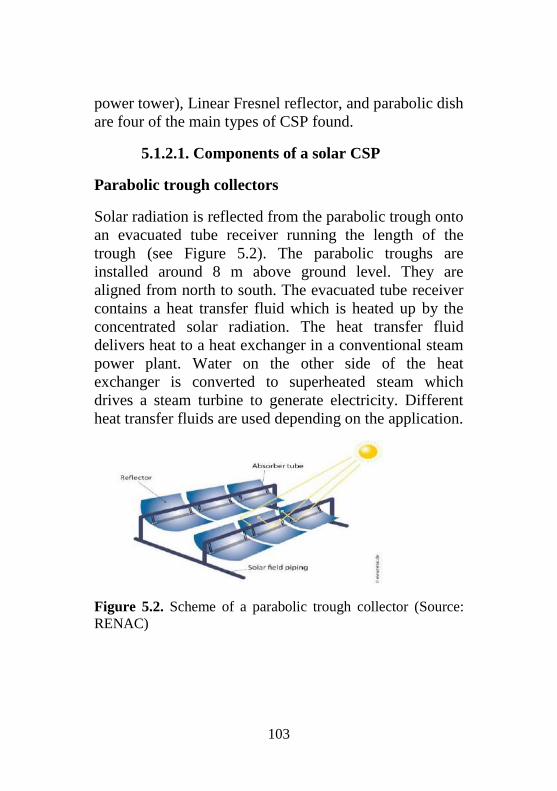
103
power tower), Linear Fresnel reflector, and parabolic dish
are four of the main types of CSP found.
5.1.2.1. Components of a solar CSP
Parabolic trough collectors
Solar radiation is reflected from the parabolic trough onto
an evacuated tube receiver running the length of the
trough (see Figure 5.2). The parabolic troughs are
installed around 8 m above ground level. They are
aligned from north to south. The evacuated tube receiver
contains a heat transfer fluid which is heated up by the
concentrated solar radiation. The heat transfer fluid
delivers heat to a heat exchanger in a conventional steam
power plant. Water on the other side of the heat
exchanger is converted to superheated steam which
drives a steam turbine to generate electricity. Different
heat transfer fluids are used depending on the application.
Figure 5.2. Scheme of a parabolic trough collector (Source:
RENAC)
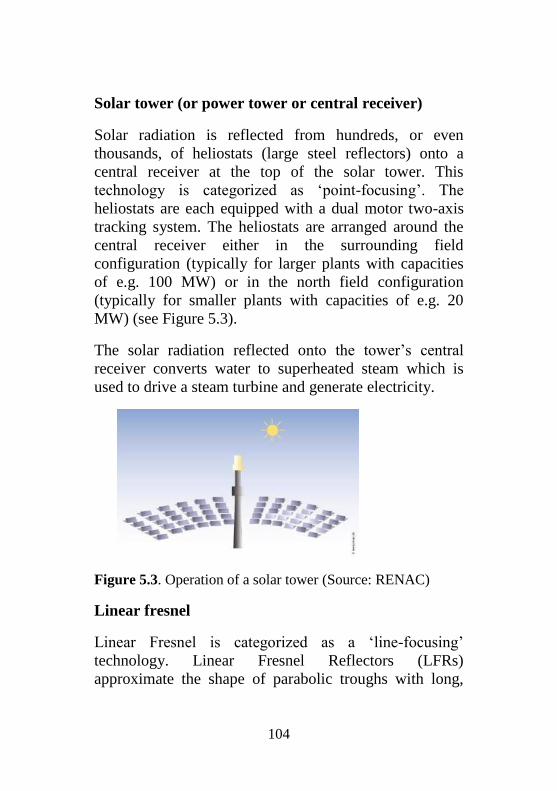
104
Solar tower (or power tower or central receiver)
Solar radiation is reflected from hundreds, or even
thousands, of heliostats (large steel reflectors) onto a
central receiver at the top of the solar tower. This
technology is categorized as ‘point-focusing’. The
heliostats are each equipped with a dual motor two-axis
tracking system. The heliostats are arranged around the
central receiver either in the surrounding field
configuration (typically for larger plants with capacities
of e.g. 100 MW) or in the north field configuration
(typically for smaller plants with capacities of e.g. 20
MW) (see Figure 5.3).
The solar radiation reflected onto the tower’s central
receiver converts water to superheated steam which is
used to drive a steam turbine and generate electricity.
Figure 5.3. Operation of a solar tower (Source: RENAC)
Linear fresnel
Linear Fresnel is categorized as a ‘line-focusing’
technology. Linear Fresnel Reflectors (LFRs)
approximate the shape of parabolic troughs with long,

105
mirrored strips which reflect the solar radiation onto a
downward-facing, fixed receiver tube running the length
of the reflector (see Figure 5.4). The reflector strips track
the sun from east to west while the receiver tube stays in
a fixed position. A secondary reflector surrounding the
receiver tube reflects any unfocused radiation back onto
the tube.
LFR systems heat water running through the receivers
directly to generate steam at around 270C (Direct Steam
Generation – DSG), thereby eliminating the need for
synthetic heat transfer fluids and heat exchangers. This,
along with the lower manufacturing and installation cost
of the mirrors make LFR systems less expensive than
parabolic trough systems.
Figure 5.4. Operation of a Linear Fresnel collector (Source:
RENAC)
Dish
The dish reflector concentrates solar radiation onto a
receiver at the focal point of the dish (‘point-focusing’

106
technology). The receiver is heated to around 750C and
drives a small piston, Stirling engine or micro turbine
attached to the receiver to generate electricity directly at
the dish (see Figure 5.5). The dish tracks the sun
throughout the day. Dish sizes typically range from 5-
25kW. The high solar concentration and operating
temperatures have allowed dish systems to achieve solar-
to-electricity conversion efficiencies of up to 30%.
Figure 5.5. Operation of a dish collector. The dish tracks the
sun throughout the day (Source: RENAC)
5.1.3. Solar PV
There are two basic system topologies for PV systems:
grid-tied systems and off-grid systems. Grid-tied PV
systems feed their power production into a centralized
electricity grid. Grid-tied systems could be applied in
large-scale (utility-scale) energy production with PV
power plants and household or industry energy supply.

107
Off-grid PV systems can be applied in many areas where
there is no grid connection, for example water pumping
for irrigation or human consumption, solar Home
Systems (SHS) for households in rural areas or
developing countries, communication antennas and
telemetry stations etc.
Figure 5. shows a basic scheme of some of the essential
components in both off-grid and grid-tied systems.
Figure 5.6. Overview of off-grid and grid-tied PV systems
Solar cells
Monocrystalline and multicrystalline c-Si cells are wafer-
based with thicknesses varying in the 100 to 250 μm
range and sizes from 4 to 6 inches. The wafers are gained
from a silicon melt by different methods, condensed into
blocks and then cut with a wire saw. Due to the need for
very high purity, a lot of energy is consumed during the
manufacturing process as high temperature processes are
necessary in order to remove defects. The electrical
contacts on both front- and back-sides are deposited by
screen printing.
108
Thin-film solar cells (amorphous Si, cadmium telluride,
copper indium gallium selenide solar cell [CIGS]) are
commonly deposited on a piece of glass. The surface is
then prepared with a laser and the electrical contacts are
deposited. The energy consumed for thin-film fabrication
is much lower than for c-Si solar cells because the
deposition is a low temperature process. Furthermore, the
fabrication process is therefore much faster and cheaper
than that of c-Si, however the efficiencies of the
technologies are lower than c-Si.
5.1.3.1. Main components of a solar PV systems
Solar modules
Solar modules are composed of a number of solar cells
connected in series and parallel in order to obtain a
desired final power output of the module. The number of
solar cells in crystalline modules varies typically between
36 and 72 cells. The solar cells are electrically connected
and sandwiched between two very thin transparent layers
of vapor-proof encapsulation material (commonly made
of Ethylene Vinyl Acetate or EVA), then placed on top of
a reflective back sheet (commonly made from polyvinyl
fluoride), and then sealed with a glass cover in an
aluminium frame.
Inverters
Inverters transform direct current (DC) into alternating
current (AC) and regulate voltage and frequency. There
are mainly two types of inverters: Single- and three-
phase inverters. Single-phase inverters deliver AC to one
phase of a power transmission line, whereas three-phase

109
inverters deliver AC to all three phases of a power
transmission line. Small systems, typically below 5 kWp,
usually use single-phase inverters because one line is
sufficient to absorb the power delivered by a PV system.
5.2. Environmental impacts from solar energy
systems
In comparison to conventional power plants energy
produced from renewable energy technology (RET) have
very less greenhouse gas (GHG) emissions. On the other
hand, if we consider the whole life cycle of a RET, the
impacts on environment cannot be overseen.
Figure 5.8 represents the inputs and outputs in the life
cycle of the renewable energy projects.
Figure 5.7. General life cycle of renewable energy
technologies (Corona, Cerrajero, López, & San Miguel, 2016)
(Fthenakis & Kim, 2011); own representation

110
A method used to determine the total environmental
impact of a product during its entire life cycle is known
as life cycle assessment (LCA). LCA is used as a tool in
Environmental Impact Assessments (EIA) to represent
the extent of environmental impacts.
An EIA is a study carried out to assess the potential
environmental impacts from a proposal. In an EIA and
LCA the impacts are categorized according to the nature
and type of emissions. The categories may also vary
depending on the country and institutions. In this chapter,
the impacts are not categorized. General potential
impacts and prevalent impacts from different literature
are presented in chapter 5 and chapter 6.1
The first two phases in a life cycle are raw material
acquisition and manufacturing. During the extraction of
raw materials, series of impacts on environment are
entailed. Different factor plays a role for the extent of the
impacts. The factors could be the art of raw material
which will be extracted, technology used for the
extraction or ecology of the area. Similarly, during the
material processing and manufacturing phase, different
impacts occur with different extent depending on the
nature of material.
For example, during the extraction of pure iron from its
ores2, different technologies are used for the separation
process. Depending on the technologies used various
1 For further knowledge please read the references used 2 An ore is a type of rock that contains minerals with important
elements including metals.
111
types and amounts of wastes are produced which could
directly or indirectly harm the environment. In the
manufacturing process, the extracted raw material is used
to sculpt new products or components of products.
Different energy intensive technologies are used which
ultimately contributes to greenhouse gas emissions and
waste production. Different impacts in the value chain
(phases) are enlisted in tables in each technologies of
interest in the following sections. Since EIA only studies
the impacts from construction, operation and
decommissioning phases, we will be going in details on
the particular impacts from only these three phases.
These impacts will be discussed according to the
technologies in the following.
5.2.1 Environmental impacts of solar thermal
Small scale solar thermal technology is mainly used to
heat water for domestic use and are mostly installed on
the roof top of a residential building.
According to the study “Environmental impacts from
energy sector”, during the operation phase two particular
environmental impacts are prevalent:
Visual impact: Solar thermal on roof tops of residential
households might cause visual impacts on building’s
aesthetics (Tsoutsos, Frantzeskaki, & Gekas, 2005). The
reflection from the glazing mirror could also be a
possible impact for the neighbours.
Waste production: Depending on the solar thermal
systems, different types of coolant liquids are used. It
could be water based or could contain anti-freeze or rust

112
inhibitors in indirect systems. Such liquids could contain
glycol, nitrates, nitrites, chromates, sulphites and
sulphates. More complex substances like aromatic
alcohols, oils, chlorofluorocarbons (CFCs) etc. are also
used in higher temperature applications. Such effluents
could pollute water and must be disposed appropriately
and handled carefully during operation, to prevent any
leakage and consequently cause water pollution.
(Tsoutsos, Frantzeskaki, & Gekas, 2005). Below gives an
overview on further possible environmental impacts from
the use of small scale solar thermal systems.
Table 5.1. Environmental impacts from small scale solar
thermal technology used for heating.
Raw material
acquisition
Manufactu
ring Construction Operation
Decommiss
ion
Biodiversity
loss
Habitat loss
Toxic-effluents
Waste
production
Depletion of
natural
resources
Water stress
Waste
Production
Waste
production
Air pollution
Visual
Impact
Waste
production
Waste
production
Air
pollution
CO2 and other GHG gas emissions
Noise Pollution (except in operation phase)

113
5.2.2 Environmental impacts of concentrated
solar power
The environmental impacts of a CSP plant are enlisted in
(Wu, et al., (2014).
Table 5.2. Environmental impacts from concentrated
solarpower.
• Water consumption: CSP consumes highest amount
of water per unit electricity in compare to
photovoltaic and wind plants. In a CSP plant which
uses the wet technology for cooling of steam from
electricity generator, more water is consumed in
Raw
material
acquisition
Manufactu
ring Construction Operation
Decommiss
ion
Biodiversity
loss
Habitat loss
Toxic-
effluents
Waste
production
Depletion
of natural
resources
Water stress
and
pollution
Waste
production
Biodiversity
loss
Erosion
Water and soil
pollution
Air pollution
Over
consumption
of water
Visual Impact
Soil
Temperature
decrease
Waste
production
Dust
production
Waste
production
CO2 and other GHG gas emissions
Noise Pollution

114
compare to dry air cooling technology. The water is
not only used for the cooling purpose but also to
clean the mirrors, because most of the CSP plants are
built on semi-arid areas where high solar radiation is
present and is prone to dust suspension. In order to
reduce the loss of water an efficient water collection
and reuse system should be implemented.
• Decrease in soil temperature: Due to the shades and
altered airflow from the mirror panels in CSP plants,
soil temperature change ranging from 0.5 – 4°C were
measured in a study from Wu, Z. et al. Such
temperature changes could affect those CSP plant
areas which are combined with growing crops. Soil
temperature change could especially effect those
plants which are sensitive to soil temperature. (Wu, et
al., 2014).
• Waste production: In a CSP plant during its
operation different hazardous and non-hazardous
wastes are produced. In a study from ACWA
POWER on specific environmental and social impact
from CSP Plant, possible hazardous waste produced
during operation of the plants are sludge from waste
water and waste oil treatment processes, waste oil,
oily sludge, oily rags, chemical, solvents from
general maintenance of site plant machinery, used
chemical and fuel drums, soil contamination by
potential spills and leaks etc. Such wastes should be
disposed appropriately, otherwise can cause harm to
human health and the environment. (ACWA Power,
2015).
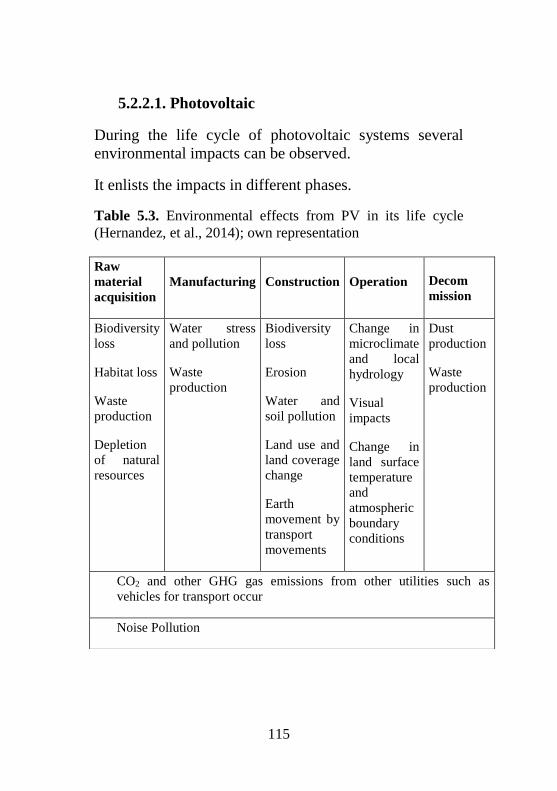
115
5.2.2.1. Photovoltaic
During the life cycle of photovoltaic systems several
environmental impacts can be observed.
It enlists the impacts in different phases.
Table 5.3. Environmental effects from PV in its life cycle
(Hernandez, et al., 2014); own representation
Raw
material
acquisition
Manufacturing Construction Operation Decom
mission
Biodiversity
loss
Habitat loss
Waste
production
Depletion
of natural
resources
Water stress
and pollution
Waste
production
Biodiversity
loss
Erosion
Water and
soil pollution
Land use and
land coverage
change
Earth
movement by
transport
movements
Change in
microclimate
and local
hydrology
Visual
impacts
Change in
land surface
temperature
and
atmospheric
boundary
conditions
Dust
production
Waste
production
CO2 and other GHG gas emissions from other utilities such as
vehicles for transport occur
Noise Pollution

116
• Biodiversity loss, soil erosion and change in land
use, and coverage: Utility-scale PV systems usually
require larger area and therefore remove vegetation
and grade the soil for their installation. Such activity
consequently lead to habitat loss, soil erosion,
fragmentation and loss in biodiversity.
• Ecological impact from transmission lines and
corridors: For a centralized utility-scale PV systems
transmission lines and corridors are built to connect
with the grid. Such constructions use extensive
energy and material. Fragmentation in the forests are
also one of the impacts.
• Waste production: In every phase of the
photovoltaic life cycle some wastes are produced. For
example, in the phase of decommissioning, it is
important that the PV systems are carefully recycled.
PV panels contain toxic materials such as cadmium,
arsenic and silica dust. Silica dust if inhaled over long
period can cause chronic obstructive pulmonary
disease (COPD) (Hnizdo & Vallathan, 2003).
• Green House Gas emissions: In the life cycle of a
PV system GHG emissions are prevalent. Either
during the raw material acquisition or during
Operation & Maintenance phase. The emissions are
contributed from energy used by different medium
such as vehicles for transport.
• Water consumption: In order to maintain the
efficiency of PV systems, during the operation and

117
maintenance phase water is used to clean the dust
deposited in the panels and suppress the dust
suspension where it is problematic. In semi-arid areas
where water is scarce, high amount of water
consumption could be put stress in the surrounding
environment and inhabitants.
Table 4 enlists the amount of water consumed per unit
electricity in two phases. We can see that PV in compare
to CSP and Wind consumes less water per TJh electricity
produced.
Table 5.4. Water footprint (WF) per unit electricity from
different energy sources. Values in bracket represent the
median (Mekonnen, Gerbens-Leenes, & Hoekstra, 2015)
Energy Source Construction Operation Total
WF (m3 TJh-1) WF (m3 TJh-1) WF (m3 TJh-1)
Concentrated
Solar Power
84 – 179 (169) 34 – 2000 (559) 118 - 2180
Photovoltaics 5.3 – 221 (86) 1.1 – 82 (19) 6.4 - 303
Wind 0.10 – 9.5(1) 0.1 – 2.1 (0.2) 0.2 - 12

118
Summary
From all three solar technologies, different types of
impacts have been discussed from the phase of
construction up-to decommissioning or also only
particular phase. This gives an overview on the factors
impacting the environment and mitigation measures to be
considered during implementation of renewable energy
projects, to avoid the impacts or to have them as low as
possible. There are many similarities and also differences
in the art of impacts on environment (see Figure 5.8). At
the end, it is the responsibility of the project developer to
seek for a low impact design of the solar technologies as
much as possible.
In Figure 5. comparison of the environmental impacts
between the three electricity generating technologies
CSP, Photovoltaic and Wind during their life cycle under
three impact categories starting from raw material
acquisition until the decommissioning are represented.
This figure provides an overview on which type of
technologies and within the particular technology which
type of materials and system used have different extent of
impacts on environment. For instance, PV made from
copper indium gallium selenide (CIGS) mounted on roof
and CIGS PV mounted on ground has different extent of
impact in all three-impact category. Comparing the
technologies regarding only these three categories, we
could see that wind energy technology has the least
impacts. In chapter 6 the wind energy technology and its
environmental impacts will be further discussed.
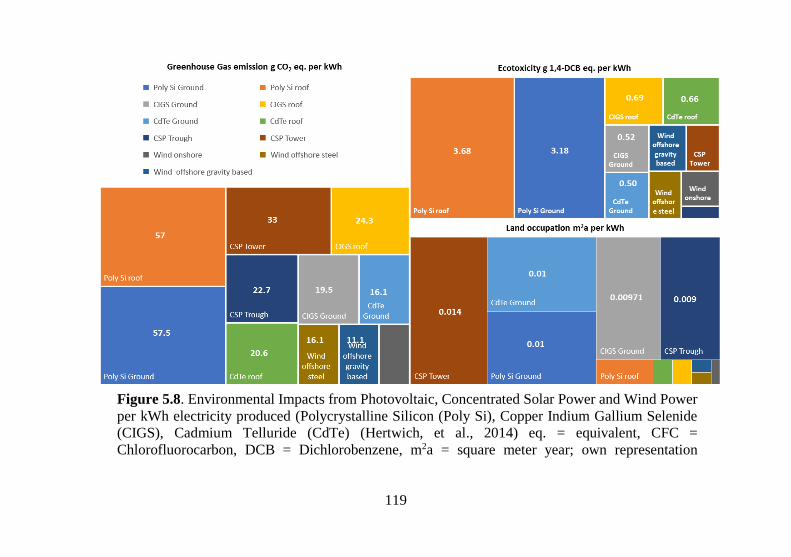
119
Figure 5.8. Environmental Impacts from Photovoltaic, Concentrated Solar Power and Wind Power
per kWh electricity produced (Polycrystalline Silicon (Poly Si), Copper Indium Gallium Selenide
(CIGS), Cadmium Telluride (CdTe) (Hertwich, et al., 2014) eq. = equivalent, CFC =
Chlorofluorocarbon, DCB = Dichlorobenzene, m2a = square meter year; own representation
119
References
ACWA Power. (2015). Specific Environment and Social
Impact Assessment. Ouarzazate Morocco. Retrieved July 14,
2017, from
http://documents.worldbank.org/curated/en/618461468274482
428/pdf/E44890V90P131200Box391417B00PUBLIC0.pdf
Corona, B., Cerrajero, E., López, D., & San Miguel, G. (2016,
June 29). Full environmental life cycle cost analysis of
concentrating solar power technology: Contribution of
externalities to overall energy costs. Elsevier, 135, pp. 758 -
768. doi:10.1016/j.solener.2016.06.059
Fthenakis, V., & Kim, H. (2011, February 23). Photovoltaics:
Life-cycle analyses. Solar Energy, 85, pp. 1609 - 1628.
doi:10.1016/j.solener.2009.10.002
Hernandez, R. R., Easter, S. B., Murphy-Mariscal, M. L.,
Maestre, F. T., Tavassoli, M., Allen, E. B., . . . Allen, M. F.
(2014, August 11). Environmental Impacts of utility-scale
solar energy. Reenwable and Sustainable Energy Reviews, 29,
pp. 766 - 779. doi:10.1016/j.rser.2013.08.041
Hnizdo, E., & Vallathan, V. (2003, April 1). Chronic
obstructive pulmonary disease due to occupational exposure to
silica dust: a review of epidemiological and pathological
evidence. Occupational and Environmental Medicine, 60, pp.
237 - 243. doi:10.1136/oem.60.4.237
Mekonnen, M., Gerbens-Leenes, P., & Hoekstra, A. (2015,
March 9). The consumptive water footprint (WF) of electricity
and heat: a global assessment. Environmental Science: Water
Research and Technology, 1, pp. 285 - 297.
doi:10.1039/c5ew00026b

120
Tsoutsos, T., Frantzeskaki, N., & Gekas, V. (2005).
Environmental impacts from the solar energy technologies.
Energy Policy(33), pp. 289 - 296. doi:10.1016/S0301-
4215(03)00241-6
Wu, Z., Hou, A., Chang, C., Huang, X., Shi, D., & Wang, Z.
(2014). Environmental impacts of large-scale CSP plants in
northwestern China. Environmental Science Processes &
Impacts, 16, pp. 2432 - 2441. doi:10.1039/C4EM00235K

121
CHAPTER 6
WIND ENERGY
Chapter writer: Uta Zaehringer
Renewables Academy AG, Schönhauser Allee 10-11,
10119 Berlin-Germany
e-mail: [email protected]
Abstract: The use of solar energy can be classified as direct
(e.g. solar thermal or photovoltaics) or indirect (e.g. wind,
hydro or bioenergy). This chapter is dealing with one of the
indirect use of solar energy: In the first part physical and
technological basics from the use of wind energy are outlined.
Despite the water footprint of a wind plant is comparably less
than a PV and CSP plant, there are various environmental
impacts during the construction, operation and
decommissioning phases of wind energy projects, which are
summarized in the second part of the chapter.
Learning objectives:
At the end of this chapter, the student will be able to:
• Readers will be informed about the wind energy
technology
• Readers are able to evaluate the environmental impacts of
wind energy use along its life cycle

122
6.1 Wind energy
Wind is used in wind turbine to produce energy. Wind
turbines as it already explains itself uses wind as source
of energy. Wind energy originates from the sun. Solar
radiation falls onto the earth and the temperature
difference between the equator and the poles drives
thermal currents – or winds – which circulate around the
globe. The atmosphere is a big thermal machine
continuously “producing” wind.
Air mass flows between areas of low and high pressure.
Up to now, winds in up to about 200 m above ground
level can be “harvested” by the wind industry. Wind
turbines can generate electricity at wind speeds of 3 m/s
to 35 m/s. Some specially designed wind turbines can
work even at lower or higher wind speeds. Hurricanes,
typhoon, tornados or thunderstorms are not useful
because they are very strong and can cause serious
damages to the wind turbine.
Wind often changes its velocity and its direction. Rapid
fluctuations are called gusts and lulls. A gust is a sudden
increase in wind speed and lulls are sudden drops in wind
speed. These gusts and lulls are caused by turbulences.
6.2 Wind turbine elements
General design
Wind turbines can be constructed to withstand strong
storms, operate under arctic or tropical weather
conditions, in the sea in front of coasts or in deserts.

123
Quite a wide range of different designs exist for special
purposes.
Wind turbines are designed with a vertical or horizontal
axis, one blade up to about 20 rotor blades, small
capacity of some watt up to some megawatt, with or
without gear box and with direct current or alternating
current generator. A general design does not exist,
although the three-bladed horizontal upwind turbines are
the most successful ones. With these turbines, the rotor
blades are facing the wind while with downwind turbines
the nacelle is facing the wind.
The primary components of a wind energy system are:
• Rotor blades
• Nacelle and controls
• Generator and electronics
• Tower components
Figure 6.1 represents the components of a wind turbine
and Table 6.1 gives an overview of materials used in the
component. In the following section, the detailed
information on the components is explained.
6.2.1 Rotor Blades
Rotor blades "capture" the wind and convert its motive
energy into the rotation of the hub (see Figure 6.1). The
hub directs the energy from the rotor blades on to the
generator. If the wind turbines have a gearbox, the hub is
connected to the slowly rotating gearbox shaft,
converting the energy from the wind into rotation energy.
If the turbine has a direct drive, the hub passes the energy
directly on to the ring generator. Each manufacturer has

124
its own rotor blade concepts and conducts research on
innovative designs; there are many variations that are
quite different. In general, though, all modern rotor
blades are constructed in a similar way to airplane wings
(World Wind Energy Association, 2011).
Figure 6.1. Scheme of a wind energy turbine with components
(RENAC, 2017)

125
Table 6.1. Material used in wind turbine components
Component Material
Foundation Concrete, steel
Tower Steel, concrete
Drive train Cast iron, steel lubricants
Generator Cast iron, copper, electronics
Electronics Cable, switchboard
Nacelle Metals, fibre components
Rotor blades Fibre components, sandwich core
Wind turbine rotor blades utilize the same "lift" principle
as airplanes or birds: because of the shape of the wing,
the stream of air below the wing is slower than on the
upper side. For this reason, it is the other way around
with the pressure. Above the wing the pressure is lower
than under the wing. This leads to a pressure difference
(lift effect). These forces make the rotor rotate.
It has been found out that the three-blade rotor is the
most efficient one for power generation by large wind
turbines. The three rotor blades allow for a better
distribution of mass, which makes rotation smoother and
also provides for a "calmer" appearance. The rotor blades
mainly consist of synthetics reinforced with fiberglass,
carbon fibres, wood and metal (lightning protection, etc.).

126
The layers are usually glued together with epoxy resin.
Aluminium and steel alloys are heavier and suffer from
material fatigue. Therefore, these materials are generally
only used for very small wind turbines. (World Wind
Energy Association, 2011)
6.2.2 Nacelle
The nacelle holds all the turbine machinery. Because it
has to be able to rotate to follow the wind direction, it is
connected to the tower via bearings. The nacelle includes
the drive train that consists of the following components:
rotor shaft with bedding, gear box (direct drive turbines
have none), brake(s), coupling, generator, power
electronics, cooling/heating and a small crane.
The details of the arrangements in the nacelle vary from
manufacturer to manufacturer.
6.2.3 Wind turbine towers
Wind turbine towers are made of concrete, metal, wood
or a combination of these materials. Most large wind
turbines are built with tubular steel towers, which are
manufactured in sections. Steel towers, concrete towers,
lattice tower, Hybrid towers and guyed tubular towers are
the types of wind towers available.
Steel towers usually consist of two to four segments.
Each has a length of 20 – 30 meters with flanges at either
end. They are bolted together on the wind farm site.
Concrete towers can be made by using specially
developed sections fastened together at wind farm site.
The tower sections themselves are manufactured entirely
127
in a pre-casting plant. It is also possible that the tower is
completely constructed on site with a climbing formwork
(called in-situ concrete).
The lattice tower construction method is based on the
principle of using material only at points where forces
have to be fed into the structure. By using this method, it
is possible to reduce the weight of the tower.
Hybrid towers combine a pre-cast concrete segmented
tower with tubular steel sections on top. The advantage is
that the segments can be easily transported via ordinary
trucks especially in those countries where the
transportation of steel towers with large diameters is
problematic and where the concrete segments can be
produced locally.
Guyed tubular towers are only used for small wind
turbines. They are light and can be set up without a crane.
6.3 Environmental impacts from wind energy
use
In a wind power plant various environmental impacts
during the construction, operation and decommissioning
phases occur. Table 6.2 enlists the potential
environmental impacts from a wind energy plant. For
instance, water footprint of a wind plant is comparably
less than a PV and CSP Plant. Impacts during operation
of the wind farm will be discussed in the following
points.

128
Table 6.2. Environmental Impacts from Wind Energy Plant
(Hernandez, et al., 2014 and Saidur, Rahim, Islam, & Solangi,
2011).
6.3.1 Impacts on wildlife
There are many studies showing the impacts on avian
species due to wind plants (H Kunz, et al., 2007) (Drewitt
& Langston, 2006) (Saidur, Rahim, Islam, & Solangi,
2011). In compare to the number of birds killed from
Raw
material
acquisition
Manufacturing Construc
tion
Opera
tion
Decom
mission
Biodiversity
loss
Habitat
loss
Toxic-
effluents
Waste
production
Depletion of
natural
resources
Water stress and
pollution
Waste
Production
Biodiversit
y loss
Water and
soil
pollution
Earth
movements
from
transport
movements
Impacts
on
wildlife
Visual
Impact
Dust
producti
on
Waste
producti
on
CO2 and other GHG gas emissions
Noise Pollution
129
hunting, the number of deaths due to wind farm is
minimal. But still such cases from wind plant can be
avoided with a proper study of the site beforehand to
have the smallest impact as possible. A study from S.
Mariò et al. titled “Predicting the trends of vertebrate
species richness as a response to wind farms installation
in mountain ecosystems of northwest Portugal” explained
that during poor weather or foggy night, the lights
emitted from wind plants attracts the birds and increase
their vulnerability from collision with wind turbine
blades (Santos, et al., 2010). Design of the tower in wind
plant is also one of the factor for bird mortality. Older
turbines with lower hub heights, shorter rotor diameters
cause the blades to spin at high RPM and consequently
higher vulnerability for bird mortality rate (Magoha,
2002).
6.3.2 Visual Impacts
Depending upon wind energy technologies, their color,
size, distance from the residences and shadow flickering,
the impacts from a wind plant may vary (Ladenburg,
Visual impact assessment of offshore wind farms and
prior experience, 2009). To reduce the visual impact the
wind turbines are colored green at the base and gradually
painted in light grey color in the top. Shadow flickering
occurs either by moving blade or the reflection of sun ray
on the wind turbine body, so called disco effect occurs
(Saidur, Rahim, Islam, & Solangi, 2011).
130
This effect does not last for long and only in certain
specific combined circumstances, e.g. when,
• the sun is shining at a low angle, and
• the turbine is directly between the sun and the
affected property, and
• the wind speed is above cut in wind speed of the
turbine (to ensure that the turbine blades are moving).
(Department of the Environment, Heritage and Local
Government of Ireland, 2006)
Shadow flicker can be influenced by careful site
selection, design and planning.
6.3.3 Noise impacts
In a wind turbine noise emitted could be categorized as
aerodynamic or mechanical type. Noise created from
movements of gear box, electrical generator and bearings
are the mechanical type and noise developed by the flow
of air over and past the blades of a turbine is
aerodynamic type. Such noise varies with the size of the
turbine, wind directions and may disturb the residents
nearby. The noise impacts are also seen as one of the
reasons for decrease in land value near a wind plant.
Mechanical noises during operation could be reduced
using insulation curtains and anti-vibration support
footings. Aerodynamic noise could be minimized by
designing the blades in such a way, that minimum noise
is created during the movement (Saidur, Rahim, Islam, &
Solangi, 2011) (Gauld, 2007). To ensure public
acceptance at noise sensitive locations such as hostel,
hospital, residential areas etc., a careful planning of wind

131
farm layout becomes essential. For instance, in a state
from Germany known as Bavaria, to avoid any impacts
from wind farms, a rule has been implemented stating the
distance between a wind turbine and residential areas to
be 10 times the height of the wind turbine.
References
Department of the Environment, Heritage and Local
Government of Ireland. (2006).
Drewitt, A., & Langston, R. (2006). Assessing the impacts of
wind farms on birds. International journal of avian science,
148, pp. 29 - 42.
Gauld, R. (2007). Wind developments: Ecological, technical
and social impact considertions. Orkney Sustainable Energy
Ltd.
H Kunz, T., Arnett, E. B., Erickson, W. P., Hoar, A. R.,
Johnson, G. D., Larkin, R. P.,Tuttle, M. D. (2007). Ecological
impacts of wind energy development on bats: questions,
research needs, and hypotheses. Frontiers in Ecology and the
Environment, 5(6), pp. 315 - 324.
Ladenburg, J. (2009). Visual impact assessment of offshore
wind farms and prior experience. Applied Energy, 86, pp. 380-
387.
Ladenburg, J. (2009). Visual impact assessment of offshore
wind farms and prior experience. Applied Energy, 86, pp. 380-
387. doi:10.1016/j.apenergy. 2008.05.005
Magoha, P. W. (2002). Footprints in the wind?: enviornmental
impacts of wind power development. Fuel and Energy
Abstracts, 3(5), pp. 30-33. doi:10.1016 /S1471-
0846(02)80083-X.

132
Mário S, B. R. (2010). Predicting the trends of vertebrate
species richness as a response to wind farms installation in
mountain ecosystems of northwest Portugal. Ecological
Indicators, 10, pp. 192 - 205.
Renewables Academy (RENAC) AG. (2017). Environmental
and social standards in renewable energy (PV, wind and
biomass) project finance. Berlin, Germany.
Saidur, R., Rahim, N., Islam, M., & Solangi, K. (2011).
Environmental impact of wind energy. Reenwable and
Sustainable Energy Reviews, 15(5), pp. 2423 - 2430.
doi:10.1016/j.rser.2011.02.024
World Wind Energy Association. (2011).
133
CHAPTER 7
WAVE, TIDAL AND HYDROGEN ENERGY
Chapter writer: Aleksandra SRETENOVIC
Faculty of Mechanical Engineering, University of Belgrade,
Belgrade, Serbia.
e-mail: [email protected]
Abstract: This chapter deals with potentials of wave and tidal
energy source for electricity production. The possibilities and
limitations of using this technology are discussed.
Technological development, covering tidal turbines, tidal
barrages and wave capturing devices is presented.
Environmental impact of wave and tidal energy is evaluated.
Industrial production of Hydrogen gas and its impact on
environment are elaborated. Once Hydrogen is produced it is
almost an excellent energy carrier. It can be used in fuel cells
for generate electricity and heat. Technological aspects of
storing, transporting and using Hydrogen gas are presented.
Reliability and economical aspects of Hydrogen gas
application are discussed.
Learning objectives:
After mastering this chapter, the student will have the ability
to:
• Understand the potentials of the wave and tidal as
renewable energy source

134
• Understand and discuss potential environmental
impacts of wave and tidal as energy sources
• Critically discuss the questions related the
advantages and disadvantages of wave and tidal
• Understand and discuss potentials of hydrogen as
energy source
• Critically discuss the different hydrogen production
technologies, advantages and disadvantages
• Critically discuss environmental impacts of hydrogen
production and use
7.1 Wave and tidal potential for electricity
production
The term ‘wet renewables’ is commonly used to refer to
offshore wind energy developments as well as tidal
barrages/fences, tidal stream and wave energy schemes
(Frid et al., 2012). Using these energy resources is
especially prominent for the countries with significant
areas of coastal waters. The World Energy Council
estimates that if less than 0.1% of the renewable energy
within the oceans could be converted into electricity it
would satisfy the present world demand for energy more
than five times over (Council, 2016). Although there is
estimation that nearly 3000 GW of tidal energy is
available worldwide, less than 3% is located in areas
suitable for power generation, according to the World
Offshore Renewable Energy Report 2002-2007 (Esteban
& Leary, 2012). Unfortunately, only a small fraction of
this ocean energy resource can be found in sites that are
economically feasible using the available technology. It
has been documented that 48% of the European tidal

135
resource is located in the UK, 42% in France, and 8% can
be found in Ireland. Wave Energy has an estimated
potential of approximately 1,000-10,000 GW, which is in
the same order of magnitude as world electrical energy
consumption. The important advantage of tidal currents
as an energy source over waves (or wind) is its
predictability, since the tides can be accurately predicted
weeks or even years in advance.
Tides
What makes the research on tidal energy so attractive is
the regularity of the tides as well as the enormous energy
potential (Pelc & Fujita, 2002). A tide is the regular rise
and fall of the surface of the ocean caused by the
gravitational force of the sun and moon on the earth and
the centrifugal force produced by the rotation of the earth
and moon about each other. Taking into account that
moon is closer to earth, its gravitational force is 2.2 times
larger than the gravitational force of the sun. Tidal
currents can be found in coastal areas and in places
where the waterflow is forced to navigate through narrow
channels. These currents flow in two directions; the flow
oriented in the direction of the coast is called the flood
current, while the one withdrawing from the coast is
known as the ebb current. Tidal energy consists of the
potential and kinetic component. Therefore, the tidal
power generating facilities can be categorized into two
main types: tidal barrages which use potential
component, and tidal current turbines, which use kinetic
energy.

136
Tidal barrages
Tidal barrage is a type of tidal power generation that
involves the construction of a low dam wall (“barrage”)
across the entrance of a tidal inlet or basin creating a tidal
reservoir (http://www.alternative-energy-tutorials.com.html )
(see Figure 7.1). This dam has underwater tunnels placed
along its width which navigate the sea waterflow through
them using “sluice gates”. Inside the tunnels there are
fixed water turbine generators that use the water kinetic
energy to generate the tidal electricity. A tidal barrage
has the same operating principle as hydro-electric power
generation, with the difference that tides flow in two
directions so the generators are designed to handle both
directional water flows.
The tidal range is the vertical difference between the high
and low tide sea level (""http://www.alternative-energy-
tutorials.com.html "). Considering that the tide is moving
in a vertical direction between low and high level, on its
way down it creates height differential where the
potential energy is stored. This head is used to create a
difference in water levels on two side of the dam, and the
electricity is produced while water passes through the
turbines. There are three main tidal energy barrage
schemes in use:
• Flood generation: the tidal power is generated as the
water enters the tidal reservoir on the incoming tide.
• Ebb generation: the tidal power is generated as the
water leaves the tidal reservoir on the ebb tide.
• Two-way generation: the tidal power is generated as
the water flows in both directions during a flood and
ebb tide.
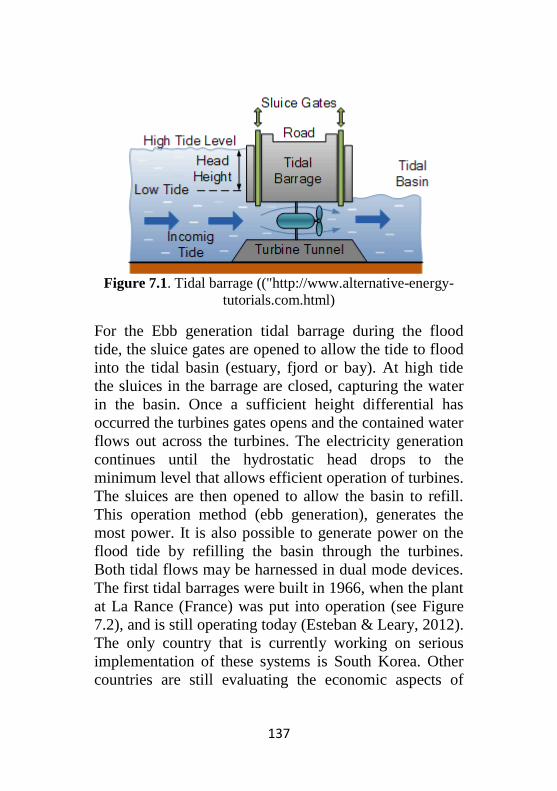
137
Figure 7.1. Tidal barrage (("http://www.alternative-energy-
tutorials.com.html)
For the Ebb generation tidal barrage during the flood
tide, the sluice gates are opened to allow the tide to flood
into the tidal basin (estuary, fjord or bay). At high tide
the sluices in the barrage are closed, capturing the water
in the basin. Once a sufficient height differential has
occurred the turbines gates opens and the contained water
flows out across the turbines. The electricity generation
continues until the hydrostatic head drops to the
minimum level that allows efficient operation of turbines.
The sluices are then opened to allow the basin to refill.
This operation method (ebb generation), generates the
most power. It is also possible to generate power on the
flood tide by refilling the basin through the turbines.
Both tidal flows may be harnessed in dual mode devices.
The first tidal barrages were built in 1966, when the plant
at La Rance (France) was put into operation (see Figure
7.2), and is still operating today (Esteban & Leary, 2012).
The only country that is currently working on serious
implementation of these systems is South Korea. Other
countries are still evaluating the economic aspects of

138
these plants, considering the significantly high
infrastructure investments that are required, as well as the
potential environmental damage. The first commercial
farms have just recently been put into operation, with the
Pelamis project (in Portugal) and SeaGen (in Northern
Ireland) which have been set up in the summer of 2008.
The tidal barrage construction requires huge amount of
materials in order to substain the enormous load coming
from dammed water (Rourke, Boyle, & Reynolds, 2010).
The greatest disadvantage of tidal barrages is their
negative environmental impact. Building a dam across an
estuary or bay may influence the natural tidal flow,
affecting the marine life within the estuary, as well as the
water quality and sediment transportation. The tidal
barrage influences fish and other marine animals, but also
maritime traffic. In case of ebb generating system, this
problem is not so significant, due to the fact that the
basin is kept at higher water level comparing to flood
generating system.
Tidal turbines
Tidal current turbines use the kinetic energy of the tidal
flow to generate electricity (Rourke et al., 2010). The
similarity with wind energy technology is evident at first
sight, since tidal stream generators resemble to
underwater wind farms. However due to the differences
in density and speed between the air and water, there are
several operational differences in the operating
conditions. The off-shore wind power generators can be
damaged by storms or sea, while tidal turbines are

139
located below the sea level, or fixed to the sea bed.
Considering that turbines are submerged in water, they
are exposed to greater force and moments comparing to
wind turbines. They are designed to endure significant
loads in the period when they are not generating
electricity, as well as to be able to produce electricity
during both direction of tide movements (flood and ebb).
There are two most common methods of tidal current
energy extraction:
• Horizontal axis tidal current turbines. The turbine
blades rotate about a horizontal axis which is parallel
to the direction of the flow of water.
• Vertical axis tidal current turbines. The turbine blades
rotate about a vertical axis which is perpendicular to
the direction of the flow of water.
The major tidal currents can be found in the following
locations: Arctic Ocean, English Channel, Irish Sea, Gulf
of Mexico, Amazon, Straits of Magellan, Gibraltar, etc.
(("http://www.alternative-energy-tutorials.com.html
"http://www.alternative-energy-tutorials.com.html ").
Wave energy utilization
The main disadvantage of wave power as an energy
source (since it is caused by the wind), is its mostly
random variability, although some seasonal patterns can
be found (Antonio, 2010). The oil crisis in 1970s led to
the significant increase of interest in energy production
from waves. The wave energy absorption is a complex
hydrodynamic process that involves considerable

140
theoretic difficulties. Therefore, the first papers related to
wave energy were mostly theoretic. Since the European
Commission in 1991 included wave energy in R&D
programme, the first projects have started to develop.
Currently, there is a wide variety of wave energy capture
technologies, resulting from the different ways in which
energy can be absorbed from the waves. The selected
technologies also depend form the water depth and the
location (shoreline, near-shore, offshore). The first
prototypes were shoreline devices which have the
advantage of easier installation and maintenance, and do
not require deep-water moorings and long underwater
electrical cables. The typical first-generation device is the
oscillating water column with air turbine. The oscillating
water column consists of partially submerged structure
opened bellow the water surface (see Figure 7.2). The
oscillating water motion produced by waves is forcing
the air to flow through the turbine that drives the electric
generator.
Figure7.2. Oscillating water column ("http://www.alternative-
energy-tutorials.com.html ,)
141
The type of wind turbine generator used in an oscillating
water column is the key element to its efficiency. The air
within the chamber is constantly changing movement
direction caused by the vertical (up and down) movement
of water, causing the sucking and blowing effect through
the turbine. To overcome this problem the type of wind
turbine used in these systems is called a Wells Turbine.
The Wells turbine has the remarkable property of rotating
in the same direction regardless of the direction of air
flow in the column. The kinetic energy is extracted from
the reversing air flow and used to drive an electrical
induction generator. This technology produces no GHG
emissions making it a non-polluting and renewable
source of energy, created by natural transfer of wind
energy through a wells turbine. The advantage of this
shoreline scheme is that the main moving part, the
turbine can be easily removed for repair or maintenance
because it is on land. The disadvantage is that, the
oscillating wave columns output is dependent on the
level of wave energy, which varies day by day according
to the season.
Off-shore devices are oscillating bodies floating on water
that are able to exploit the more powerful waves that can
be found in deep water (see Figure 7.3). The simplest
wave capture devices consist of heaving buoy reacting
against the fixed frame (sea bottom or structure that is
fixed to bottom). The pitching and heaving of the waves
causes a relative motion between an absorber and
reaction point. The linear absorber (wave attenuator)
floats on the surface of the water. It is tethered to the
ocean floor so that it can swing perpendicularly towards
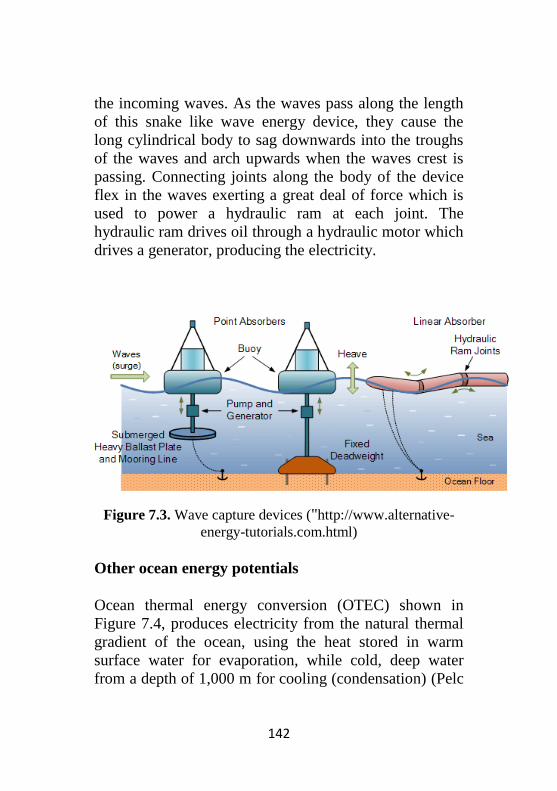
142
the incoming waves. As the waves pass along the length
of this snake like wave energy device, they cause the
long cylindrical body to sag downwards into the troughs
of the waves and arch upwards when the waves crest is
passing. Connecting joints along the body of the device
flex in the waves exerting a great deal of force which is
used to power a hydraulic ram at each joint. The
hydraulic ram drives oil through a hydraulic motor which
drives a generator, producing the electricity.
Figure 7.3. Wave capture devices ("http://www.alternative-
energy-tutorials.com.html)
Other ocean energy potentials
Ocean thermal energy conversion (OTEC) shown in
Figure 7.4, produces electricity from the natural thermal
gradient of the ocean, using the heat stored in warm
surface water for evaporation, while cold, deep water
from a depth of 1,000 m for cooling (condensation) (Pelc

143
& Fujita, 2002). In this process working fluid such as
ammonia is alternatively evaporated and condensed to
power a Rankin cycle. Usually, the energy in the
evaporated ammonia is captured with a turbine, which
turns a generator to produce electric power for a utility
grid. OTEC is possible in locations with large
temperature differences, extracting energy with a heat
engine. In total, it is estimated that about 10TW of
power, approximately equal to the current global energy
demand, could be provided by OTEC without affecting
the thermal structure of the ocean.
Figure 7.4. Ocean thermal energy conversion
("https://www.britannica.com/technology/ocean-thermal-
energy-conversion,")
Salinity gradients also can be exploited for energy
extraction through the osmotic process. The cultivation
of marine biomass can yield many useful products,
including renewable fuels for electricity generation.
However, due to technology limitations and economic
144
considerations, osmotic and thermal energy
developments are limited.
7.2 Environmental impact of wave and tidal
energy
So far, tidal fences and wave energy capture devices have
only been operated as several experimental models, so
the prediction of their environmental impacts is based on
very limited empirical data. It has been shown that the
tidal barrages by building a dam across a bay, potentially
have significant environmental impact, that is evident in
places such as bird feeding areas, nursery or spawning
areas. These impacts can be divided into three main
categories: 1) impacts on habitats and species, 2) direct
impacts on reproduction and recruitment, and 3) impacts
on water column processes and hydrology. Tidal barrage
affects the reproduction and migration of species and
influences habitats both upstream and downstream of the
facility. Wave energy collector, depending on their
configuration, can also alter maritime habitat caused by
the moving parts of the energy system (Frid et al., 2012).
Considering that the lifecycle of the barrage is greater
than 100 years, these impacts are long term and they
should be carefully investigated. The changes in the tidal
regimes and water retention have impact on bird
communities and benthic habitat availability. If the site
was on a fish migration route (salmonids, eels, shad) it is
necessary to provide adequate passage for fish, although
a certain degree of loss of the regional habitat pool is

145
inevitable (Pelc & Fujita, 2002). Changes caused by the
barrage include also reduction in intertidal area, slower
currents, reduced range of salinities and changed bottom
water characteristics. More recent innovations include
tidal fences that consist of turbines stretching entirely
across a channel where tidal flow sets up relatively fast
currents (see Figure 7.5).
Figure 7.5. Tidal fence (""http://www.alternative-energy-
tutorials.com.html ")
The turbines are designed to allow the passage of
fish, water and sediment through the channel. Tidal
plants located at the mouths of estuaries cause the same
environmental problems as large dams. By altering the
flow of saltwater through the estuaries, tidal plants could
impact the hydrology and salinity of these sensitive
environments. Estuaries serve as a nursery for many
marine organisms as well as a unique and irreplaceable
habitat for estuarine organisms, and alteration of this

146
habitat by the construction of large tidal plants should be
avoided. During the construction phase for the tidal plant
at La Rance, the estuary was entirely closed off from the
ocean for 2–3 years, and there was a long period before
the estuary reached a new ecological equilibrium. In the
future, the construction of any new tidal barrage should
not totally close off the estuary from the ocean. These
plants should not be built until detailed environmental
assessments demonstrate a minimal impact on the marine
ecosystem. Tidal fences and tidal turbines are likely to be
more environmentally benign. Tidal fences may have
some negative environmental impacts, as they block off
channels making it difficult for fish and wildlife to
migrate through those channels. Marine mammals could
be protected by a fence that would keep larger animals
away and a sonar sensor system that shuts the system
down when marine mammals are detected. Tidal turbines
could be the most environmentally friendly tidal power
option. They do not block channels or estuarine mouths,
interrupt fish migration or alter hydrology. Tidal turbines
and tidal fences both may offer considerable generating
capacity without a major impact on the ocean, while tidal
barrages are probably too damaging to the marine
ecosystem. The tidal energy projects should be sited and
built so that major migration channels are left open.
Turbines should turn slowly enough that fish mortality is
minimized and nutrient and sediment transport is largely
unaffected. Wave energy converters had only minor
direct effects on the benthic community (macrofaunal
biomass, densities, species richness and biodiversity) in
relation to natural high variability.

147
7.3 Hydrogen energy
Hydrogen is the third most abundant element in our
surroundings, but it is always bonded with other
elements, creating compounds, such as methane (CH4),
water (H2O), and ammonia (NH3). The fact that it cannot
be found freely (it has to be separated prior to the use)
has significant impact on its value as an energy source.
This extraction process requires significant amount of
energy, while the used energy source can be renewable or
fossil fuel. Hydrogen is often referred to as the „fuel of
the future”, and there are number of advantages that can
justify that title (Tabak, 2009). It burns easily, and it
releases significant amount of heat per unit mass.
Hydrogen can also be used to power energy conversion
devices called fuel cells by applying process that is more
efficient than combustion. Theoretically, hydrogen is
renewable energy source considering that water is both a
source of hydrogen and a product of its use. The
advantages of hydrogen lead to the fact that many
researchers believe that the hydrogen is the one that will
eventually replace the fossil fuels. However, currently
there are significant barriers to its widespread practical
use:
• It is expensive to produce and to transport.
• As an automotive fuel, it is difficult to store on
board in amounts large enough to provide drivers
with a practical driving range.
• Fuel cells have so far proved to be expensive to
manufacture and too prone to failure for use in
many practical applications.

148
What makes hydrogen technologies so interesting is the
potential to address two very important issues in current
stage of energy system development: energy storage for
intermittent energy sources (especially renewables) and
fuel for transportation (instead of fossil ones) (Leveque et
al., 2010). In general, the fossil fuel based hydrogen
production technologies are well developed at this
moment, although it is necessary to implement
significant improvement in order to achieve widespread
industrial production. Sustainable large-scale hydrogen
production using fossil fuels will require carbon capture
and storage technology (CCS). Using natural gas for
hydrogen production can cause some problems in supply
security in Europe. These facts, considering also
economic aspect, implicate that the hydrogen production
from coal is better alternative.
Scientists presented some issues that could affect the
development of the renewable hydrogen future. Whereas
the energy losses in an efficient electrical grid are about
10%, if hydrogen is used as storage and transport
medium, these losses become 75-80%. Therefore, this
inefficient electricity–hydrogen–electricity pathway
seems incompatible with a sustainable energy future.
Second, if hydrogen is used as storage medium for other
renewable energy sources it means that the hydrogen
should be produced only in cases of excess electricity
production. That implicates that the penetration of
renewable energy sources needs to be considerable
before hydrogen can be effectively produced. However,
this kind of very low and highly irregular production of
hydrogen has a detrimental effect on the efficiency of
electrolysers. Third, non- intermittent renewable energy
149
sources may also not be available for hydrogen
production. Biomass already has different application
purposes, while large fraction of crop must be kept for
soil fertility purposes, which affects the potential
available amount. Also electricity from large-scale
hydropower plants is not recommended, since the
environmental impact of these plants has proven to be
significant, which makes them considered as non-
renewable. There is a question of price of the required
infrastructure development, especially in cases of low
production capacities. Rather than completely turning to
the bond between hydrogen and renewables, it is
recommended to explore other hydrogen production
technologies and to carefully investigate the interaction
between hydrogen and other energy carriers. Huge costs
of current technologies for hydrogen production and
transport are raising the question of the possible end use
that can justify the investment. At this moment hydrogen
use is limited to the applications of fuel cells, where
reliable electricity generation with very low local
environmental impact is required. These applications
have stimulated significant advances in fuel cell
technologies. Use of hydrogen in transportation is viewed
by many as the real justification of a hydrogen economy.
At present, low-temperature fuel cells suitable for vehicle
use cost around €8,000/kW. It is estimated that the cost
should be decreased by two orders of magnitude in order
to be competitive. Dual fuel (hydrogen and gasoline)
engines, already developed by car manufacturers, emit
much lower levels of organic compounds and other
contaminant emissions.

150
7.3.1 Hydrogen Production Technologies
Technologies for hydrogen production can be roughly
divided into three main categories: electrolytic,
thermochemical and biological hydrogen production. An
overview of the potential sources and extraction
technologies is presented in Figure 7.6. Extracting
hydrogen from feedstock is generally low-efficient
process that can sometimes require even more energy
than it can produce.
Figure 7.6. Feedstocks and process technologies for hydrogen
production (IEA, 2006)
Hydrogen can be produced from water, biomass, natural
gas, or coal (after gasification) (Turner, 2004). Today,
hydrogen is mainly produced from natural gas via steam
methane reforming.

151
Water electrolysis
Water electrolysis is a well-known, commercially
available technology for very clean hydrogen production.
It is the process of splitting water into hydrogen and
oxygen with application of electrical energy, as in
equation
The advantage of this process is that it enables
decentralized operation, which makes infrastructure far
more simple comparing to hydrogen production from
fossil fuels or biomass. In order to this technology
becomes economically viable, it is necessary that
electrolytic equipment becomes significantly cheaper and
more efficient, or that electricity price becomes smaller
comparing to gas or coal prices. Considering that with
higher temperatures required electrical energy decreases,
for sites where there high-temperature level heat is
available, the high-temperature electrolysis systems may
be preferable.
Production from coal
Coal gasification could be technology that produces
considerable amounts of hydrogen and electricity thanks
to the significant available coal deposits. Also, because
of its relatively low cost, it is often cited as the best
resource for economically producing large quantities of
hydrogen. A typical reaction for the process in which
carbon is converted to carbon monoxide and hydrogen is
given in equation
152
The CO is further converted to CO2 and H2. However,
the energy required for the necessary sequestration of
CO2, which is a leading by-product in all fossil fuel
hydrogen production technologies, increases the coal
consumption. The hydrogen production using solar,
wind, nuclear and geothermal energy include electrolysis
of water, thermal chemical cycles using heat, and
biomass processing. Biomass can easily be converted
into a number of liquid fuels, including methanol,
ethanol, biodiesel, and pyrolysis oil, which could be
transported and used to generate hydrogen on site.
Although biomass is clearly sustainable, it cannot supply
hydrogen in the amounts required.
Thermochemical water splitting
Because the direct thermal splitting of water requires
temperatures higher than 2000°C and the product is
rapidly recombining mixture of hydrogen and oxygen,
scientists investigated different thermal chemical cycles
that can use lower temperatures and produce hydrogen
and oxygen in separate steps. One of the most common
method requires use of sulfuric acid (H2SO4) at 850°C
and hydrogen iodide (HI) at 450°C. However, it is
necessary to achieve material properties that can meet the
required stability under the operating conditions of HI
and H2SO4. For safety reasons, long heat transfer line is
required in order to keep this plant far from the reactor.
Solar thermal systems could also be used to drive such
thermal chemical cycles. Any technology that produces
electricity can drive an electrolyzer to produce hydrogen.
Because of the enormous potential of solar and wind, it
seems possible these sources can be more widely used in

153
future. The efficiency of the electrolyzers available on
the market is in range from 60 to 73%, so one often
stated issues is its low efficiency. However, although for
sure it is very important, the efficiency itself should not
be the determining factor, especially for deciding on new
technologies. The energy required to split water can be
obtained from a combination of heat and electricity. The
amount of water needed to produce hydrogen for
transportation is not great. Conversion of the 230 million
vehicles to fuel cell vehicles would require about 100
billion gallons of water/year to supply the needed
hydrogen. Sustainable hydrogen production technologies
that may affect hydrogen production in the future include
photobiological and photoelectrochemical approaches
(see Figure 7.7). These systems produce hydrogen
directly from sunlight and water, and offer the possibility
of increasing the efficiency of the solar-to-hydrogen
pathway and lowering the capital cost of the system, but
they still require land area to collect sunlight. These
systems might allow the use of seawater directly as the
feedstock instead of high-purity water (see Figure 7.8).
Figure 7.7. Principle of photo-electrolytic cell (IEA, 2006)
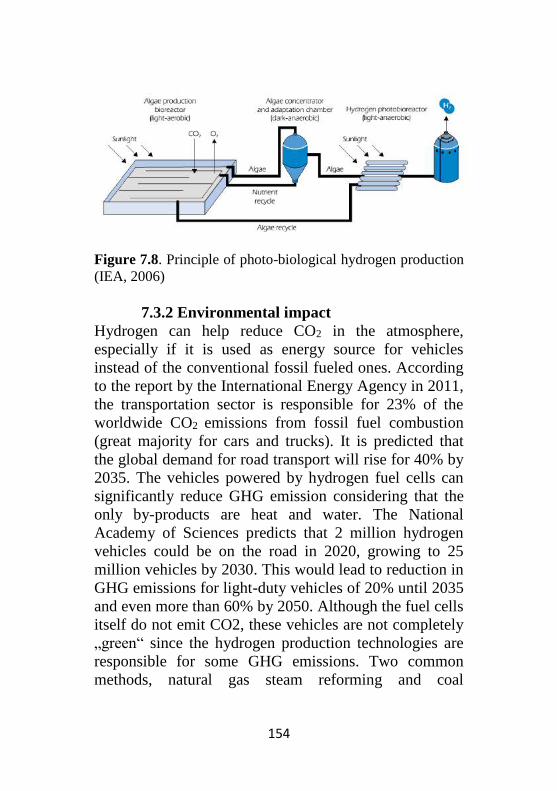
154
Figure 7.8. Principle of photo-biological hydrogen production
(IEA, 2006)
7.3.2 Environmental impact
Hydrogen can help reduce CO2 in the atmosphere,
especially if it is used as energy source for vehicles
instead of the conventional fossil fueled ones. According
to the report by the International Energy Agency in 2011,
the transportation sector is responsible for 23% of the
worldwide CO2 emissions from fossil fuel combustion
(great majority for cars and trucks). It is predicted that
the global demand for road transport will rise for 40% by
2035. The vehicles powered by hydrogen fuel cells can
significantly reduce GHG emission considering that the
only by-products are heat and water. The National
Academy of Sciences predicts that 2 million hydrogen
vehicles could be on the road in 2020, growing to 25
million vehicles by 2030. This would lead to reduction in
GHG emissions for light-duty vehicles of 20% until 2035
and even more than 60% by 2050. Although the fuel cells
itself do not emit CO2, these vehicles are not completely
„green“ since the hydrogen production technologies are
responsible for some GHG emissions. Two common
methods, natural gas steam reforming and coal

155
gasification, both release CO2 during the extraction
process. However, even when the emissions from fuel
production are taken into account, hydrogen fuel still
emit significantly less amount of GHG comparing to
fossil fuels (petroleum fueled cars).
The recently published research shows that fuel cell
vehicles using hydrogen produced from natural gas
reduce total GHG emissions by 60% compared with the
conventional gasoline-powered internal combustion
engine vehicles. Of course, this percentage is even higher
if the less carbon-intensive technology is used for
hydrogen production. When hydrogen is produced using
electrolysis technology powered by renewable sources,
there is little or no GHG emitted, making it one of the
most environmentally clean sources of fuel. When
produced with renewable energy, hydrogen’s total
greenhouse gas emissions from production to use in a
fuel cell vehicle are lower than total emissions from
traditional gasoline, biofuels, or hybrid-powered
vehicles. To reduce CO2 emissions, scientists are working
on extracting hydrogen with methods that use carbon
capture and storage (CCS) technologies, which capture,
transport, and store carbon dioxide emissions before they
are released into the air. With CCS, the CO2 produced by
hydrogen production is transported to a storage site and
then injected under high pressure into deep underground
caverns, where it cannot escape into the atmosphere and
contribute to global warming. Using these technologies
makes hydrogen production more environmentally
friendly. Combining CCS with coal gasification enables
affordable hydrogen production with low GHG emission.
156
During this process, the coal is being turned into gas that,
among other elements, contains hydrogen. The hydrogen
is then extracted in several steps. With CCS the CO2
emissions are reduced by as much as 90% comparing to
coal-fueled power plant. However, some scientists claim
that hydrogen power right now is not as clean as it
sounds. In addition to the potential GHG emission during
hydrogen production, hydrogen itself may pose a danger
to the atmosphere. It is impossible to manufacture, store,
and transport hydrogen without some escaping into the
atmosphere. As more hydrogen is used, escaped
hydrogen could accumulate in the atmosphere, depleting
the ozone layer and contributing to global warming.
Scientists have tried to develop more environmentally
friendly methods of producing hydrogen. So far, none of
these has gone beyond computer models and research
labs. For example, hydrogen produced via electrolysis
that uses renewable sources of electricity like wind or
solar power has zero or near-zero greenhouse gas
emissions and is very attractive in theory. Yet less than
5% of hydrogen today is actually produced using this
method. This does not seem likely to change in the near
future, since there are currently no commercial scale
demonstrations of zero-emission hydrogen-production
plants running.
157
References
Antonio, F de O. (2010). Wave energy utilization: A review of
the technologies. Renewable and sustainable energy reviews,
14(3), 899-918.
Council, World Energy. (2016). World Energy Resources
2016.
Esteban, Miguel, & Leary, David. (2012). Current
developments and future prospects of offshore wind and ocean
energy. Applied Energy, 90(1), 128-136.
Frid, Chris, Andonegi, Eider, Depestele, Jochen, Judd, Adrian,
Rihan, Dominic, Rogers, Stuart I, & Kenchington, Ellen.
(2012). The environmental interactions of tidal and wave
energy generation devices. Environmental Impact Assessment
Review, 32(1), 133-139.
Inernational Energy Agency (IEA), (2006), Hydrogen
Production and Storage
Web page (2017) retreived from http://www.alternative-
energy-tutorials.com/wave-energy/wave-energy-devices.html
Leveque, Francois, Glachant, Jean-Michel, Barquin, Julian,
von Hirschhausen, Christian, Holz, Franziska, & Nuttall,
William J. (2010). Security of Energy Supply in Europe.
Natural Gas, Nuclear and Hydrogen: Edward Elgar.
Pelc, Robin, & Fujita, Rod M. (2002). Renewable energy from
the ocean. Marine Policy, 26(6), 471-479.

158
Rourke, Fergal O, Boyle, Fergal, & Reynolds, Anthony.
(2010). Tidal energy update 2009. Applied Energy, 87(2), 398-
409.
Tabak, John. (2009). Natural gas and hydrogen: Infobase
Publishing.
159
CHAPTER 8
GEOTHERMAL ENERGY
Chapter writer: Aleksandra SRETENOVIC
Faculty of Mechanical Engineering, University of Belgrade,
Belgrade, Serbia.
e-mail: [email protected]
Abstract: Geothermal energy has very significant potential
and considering that the earth constantly emits heat, it can be
found all over the world. Due to the different temperature
levels available, geothermal energy can be used for power
generation and for various other heat demands. Heat sources
are contained in water (low, moderate or high temperature
levels) or in soil (hot rocks). High temperature water (or
steam) from the springs can be used for electricity production,
moderate temperature water can be directly applied for heating
or in industrial purposes, while heat from low temperature
water and soil are mainly used as a heat source for heat pumps.
Some widely used or promising technical solutions are
explained. Environmental effects of geothermal energy use are
discussed.
Learning objectives:
After mastering this chapter, the student will have the ability
to:
• Understand the potentials and availability of
geothermal energy

160
• Understand and discuss potential environmental
impacts of geothermal energy application
• Critically discuss the questions related to the possible
use applications of geothermal energy
Geothermal energy represents remnant heat derived from
the formation of the planet 4.5 billion years ago
(approximately 40%), as well as heat from the
radioactive decay of naturally occurring radioactive
isotopes (remaining 60%) (Glassley, 2014). Thermal
energy in the earth is contained in the rocks as well in the
natural fluid in its fractures and pores at different
temperature levels (Leveque et al., 2010). In history the
warm geothermal fluids have been used for cooking and
bathing, but at the beginning of 20th century this
renewable energy source found its wider industrial and
commercial application, such as electrical power
generation. The average heat flow through the Earth`s
crust is nearly 59 mW/m2. For most of the continental
areas, the heat flow is caused by two elemental
processes: the heat convection and conduction from the
Earth’s mantle and core, and heat generated by the decay
of radioactive elements (isotopes of uranium, thorium,
and potassium) in the crust. In regions with volcanic or
tectonic activities there is higher heat flow registered,
which is the reason why people usually relate geothermal
energy only with these places, such as Iceland, New
Zealand, Japan, Yellowstone National Park (recent
volcanism). It is often neglected that there are
opportunities to use geothermal energy source in many
other regions as well.
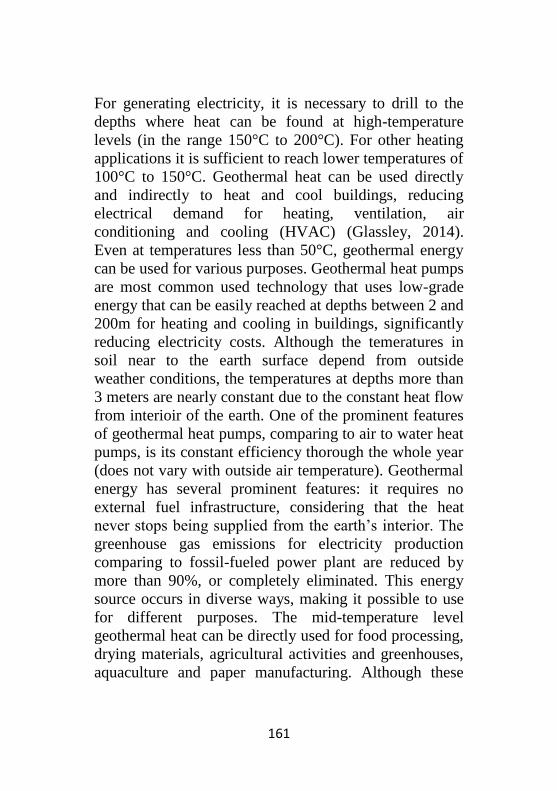
161
For generating electricity, it is necessary to drill to the
depths where heat can be found at high-temperature
levels (in the range 150°C to 200°C). For other heating
applications it is sufficient to reach lower temperatures of
100°C to 150°C. Geothermal heat can be used directly
and indirectly to heat and cool buildings, reducing
electrical demand for heating, ventilation, air
conditioning and cooling (HVAC) (Glassley, 2014).
Even at temperatures less than 50°C, geothermal energy
can be used for various purposes. Geothermal heat pumps
are most common used technology that uses low-grade
energy that can be easily reached at depths between 2 and
200m for heating and cooling in buildings, significantly
reducing electricity costs. Although the temeratures in
soil near to the earth surface depend from outside
weather conditions, the temperatures at depths more than
3 meters are nearly constant due to the constant heat flow
from interioir of the earth. One of the prominent features
of geothermal heat pumps, comparing to air to water heat
pumps, is its constant efficiency thorough the whole year
(does not vary with outside air temperature). Geothermal
energy has several prominent features: it requires no
external fuel infrastructure, considering that the heat
never stops being supplied from the earth’s interior. The
greenhouse gas emissions for electricity production
comparing to fossil-fueled power plant are reduced by
more than 90%, or completely eliminated. This energy
source occurs in diverse ways, making it possible to use
for different purposes. The mid-temperature level
geothermal heat can be directly used for food processing,
drying materials, agricultural activities and greenhouses,
aquaculture and paper manufacturing. Although these
162
direct-use applications have been developed and proven
to be very successful, they are still relatively unknown
and vastly underutilized. The most effective use of
geothermal energy can be found where available source
and technology match the needs of the observed energy
sector. Combined heat and power in cogeneration and
hybrid systems, as well as heat pump applications, are
options that offer improved energy savings (Leveque et
al., 2010). Many attributes of geothermal energy, namely
its widespread distribution, base-load dispatchability
without storage, small footprint, and low emissions, are
desirable for reaching a sustainable energy future.
Geothermal is one of the few renewable energy resources
that can provide continuous base-load power with
minimal visual and environmental impacts. These
systems have a small footprint and virtually no
emissions. Having a significant portion of the base-load
supplied by geothermal sources would provide a buffer
against the instabilities of gas price fluctuations and
supply disruptions.
8.1 Geothermal power production
The main feature of the geothermal power plants is that
they are typically designed as baseload power plants.
This differentiates them from other renewable sources,
like wind and solar, that is highly intermittent.
Consequently, due to the interrupted (and often
unpredictable) power generation form solar or wind,
these facilities cannot provide solid base-load capacity. It
is the baseload power which sustains most infrastructure
system and needs to be reliable and fueled by a consistent

163
energy source. Considering that geothermal energy never
stops being emitted from the earth`s interior makes it
great choice for energy source for the base-load power
plant. The first production of electricity from geothermal
steam was installed in Larderello, Italy, in 1904.
(Leveque et al., 2010). Since that time, other
hydrothermal developments, such as the steam field at
The Geysers, California, the hot-water systems at
Wairakei, New Zealand, Mexico, Reykjavik, Iceland,
Indonesia and the Philippines, have contributed to the
total installed electrical generating capacity of nearly
10,000 MWe at the beginning of the 21st century, while
direct-use capacity is more than 100,000 MWt (thermal
MW) (Glassley, 2014). Another important feature of
geothermal power generation is that it requires no
external fuel infrastructure. Since this energy source is
naturally occurring near the powerplant, there is no need
for fuel transportation, which makes it economically and
environmentally desirable. Recent studies have shown
that geothermal power generation can also be flexible.
For a resource to be flexible, a power generator requires
that the power output from the generating facility be able
to increase or decrease as demand for power changes
through the day and as the power input to the grid
changes. Flexible generation requires additional design
components and operational strategies that are still in the
process of being fully implemented. As currently applied,
flexible generation is accomplished by varying the
amount of hot geothermal fluid that is introduced to the
power generating equipment, either through bypassing
the generation equipment through the use of secondary
piping circuits or by throttling the rate at which
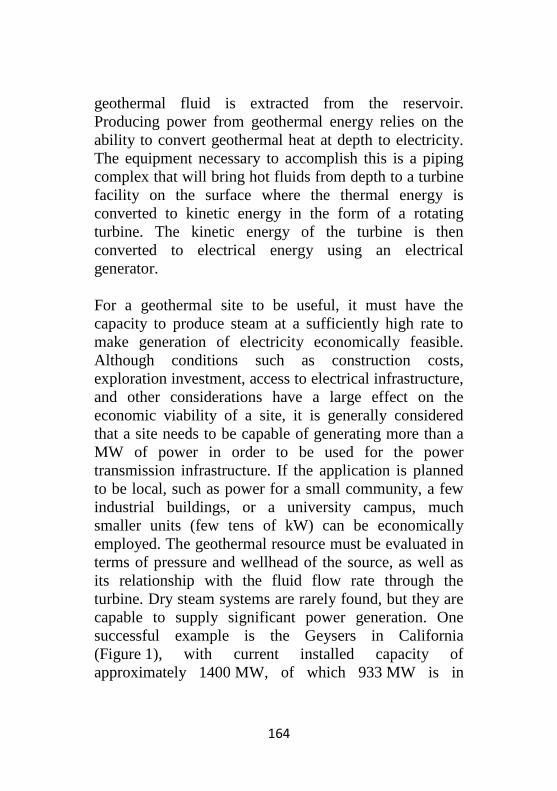
164
geothermal fluid is extracted from the reservoir.
Producing power from geothermal energy relies on the
ability to convert geothermal heat at depth to electricity.
The equipment necessary to accomplish this is a piping
complex that will bring hot fluids from depth to a turbine
facility on the surface where the thermal energy is
converted to kinetic energy in the form of a rotating
turbine. The kinetic energy of the turbine is then
converted to electrical energy using an electrical
generator.
For a geothermal site to be useful, it must have the
capacity to produce steam at a sufficiently high rate to
make generation of electricity economically feasible.
Although conditions such as construction costs,
exploration investment, access to electrical infrastructure,
and other considerations have a large effect on the
economic viability of a site, it is generally considered
that a site needs to be capable of generating more than a
MW of power in order to be used for the power
transmission infrastructure. If the application is planned
to be local, such as power for a small community, a few
industrial buildings, or a university campus, much
smaller units (few tens of kW) can be economically
employed. The geothermal resource must be evaluated in
terms of pressure and wellhead of the source, as well as
its relationship with the fluid flow rate through the
turbine. Dry steam systems are rarely found, but they are
capable to supply significant power generation. One
successful example is the Geysers in California
(Figure 1), with current installed capacity of
approximately 1400 MW, of which 933 MW is in

165
operation. That makes it the world’s largest geothermal
power generation site, with additional generating
capacity under development. Larderello, in Italy, is the
only other operating dry steam facility in the world.
This process is accomplished using production wells that
penetrate hundreds to thousands of meters into the
subsurface, providing a low path for the reservoir fluid to
ascend from depth. Injection wells are used to replenish
the reservoir by recycling condensed water,
supplementing it (if needed) with other water sources.
There are several types of reservoirs. Dry steam
reservoirs have sufficient enthalpy to vaporize all
available water. Such systems are the simplest to
engineer and have the highest energy availability of all
geothermal resources but they are geologically
uncommon (see Figure 8.1).
Figure 8.1. Dry steam power
plant (www.energy.gov)
Figure 8.2.Flash steam power
plant (www.energy.gov)
The other more common, hydrothermal systems usually
possess sufficient heat (temperatures in the range of

166
about 160°C–250°C) at elevated pressures to allow water
to flash to steam as it approaches the turbine (see Figure
8.2). When the steam cools, it condenses to water and is
injected back into the ground to be used again. Power is
generated in dry steam and hydrothermal power
generating plants by the expansion of the steam as it
expands and cools in a turbine facility designed to extract
as much energy from the fluid as efficiently as possible.
Lower temperature geothermal resources can be used to
generate power using binary plants that employ a
working fluid (usually an organic compound such as
isopentane or propane, or an ammonia–water solution)
that has a boiling temperature significantly below that of
water. In a binary plant, the geothermal water flows
through a heat exchanger, transferring its heat to the
working fluid, and is then reinjected into the reservoir
(see Figure 8.3). Binary plants are becoming the fastest
growing part of the geothermal energy market. They have
the advantage of requiring lower temperature resources,
they emit no gases to the atmosphere, and they can be
built in modular form.
(Leveque et al., 2010) Today, with nearly 10,000 MWe
of electricity generated by geothermal worldwide, there
are several energy conversion technologies commercially
available at various stages of maturity (direct steam
expansion, single and multistage steam flashing, organic
binary Rankine cycles, two-phase flow expanders). There
are inherent limitations on converting geothermal energy
to electricity, because of the lower temperature of
geothermal fluids in comparison to much higher
combustion temperatures for fossil fuels.
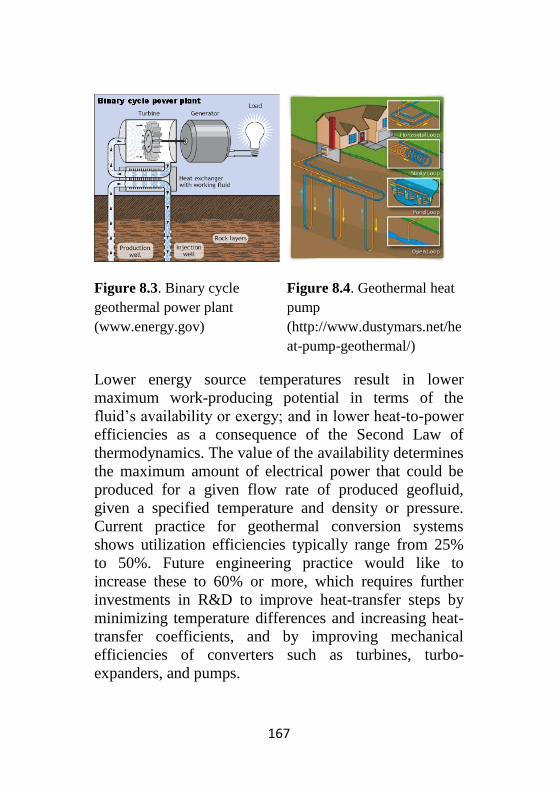
167
Figure 8.3. Binary cycle
geothermal power plant
(www.energy.gov)
Figure 8.4. Geothermal heat
pump
(http://www.dustymars.net/he
at-pump-geothermal/)
Lower energy source temperatures result in lower
maximum work-producing potential in terms of the
fluid’s availability or exergy; and in lower heat-to-power
efficiencies as a consequence of the Second Law of
thermodynamics. The value of the availability determines
the maximum amount of electrical power that could be
produced for a given flow rate of produced geofluid,
given a specified temperature and density or pressure.
Current practice for geothermal conversion systems
shows utilization efficiencies typically range from 25%
to 50%. Future engineering practice would like to
increase these to 60% or more, which requires further
investments in R&D to improve heat-transfer steps by
minimizing temperature differences and increasing heat-
transfer coefficients, and by improving mechanical
efficiencies of converters such as turbines, turbo-
expanders, and pumps.

168
Geothermal heat pumps
Geothermal heat pumps are using the low-temperature
geothermal heat that can be found in the relatively
shallow subsurface (<300 m depth). The constant heat
flux from the interior of the earth together with the solar
flux to the soil makes it energy source with relatively
constant temperature during whole year. This is very
important in terms of efficiency (heating capacity and
COP of air to water heat pumps significantly decreases
with lower ambient temperatures). The currently
available geothermal heat pump technology provides the
COP values in the range of 3–5, making them the most
energy efficient plant for HVAC purposes. The sizing
and design of these systems are well-known and
developed in practice, but it is crucial to adequately
investigate properties of the geothermal source and to
link it with the requirements of the building systems (see
Figure 8.4) .
Direct use of geothermal energy
Unlike geothermal power generation, where heat is
converted to electricity, direct-use applications involve
introducing heat energy directly in some process.
Geothermal energy with temperatures in the range of
10°C−150°C can provide the heat necessary for broad
range of industrial needs.
As of 2010, approximately 122 TWh/yr of thermal
energy was used for direct-use purposes worldwide,
which was derived from an installed capacity of 50,583
MW(Lund & Boyd, 2016). The growth in installed
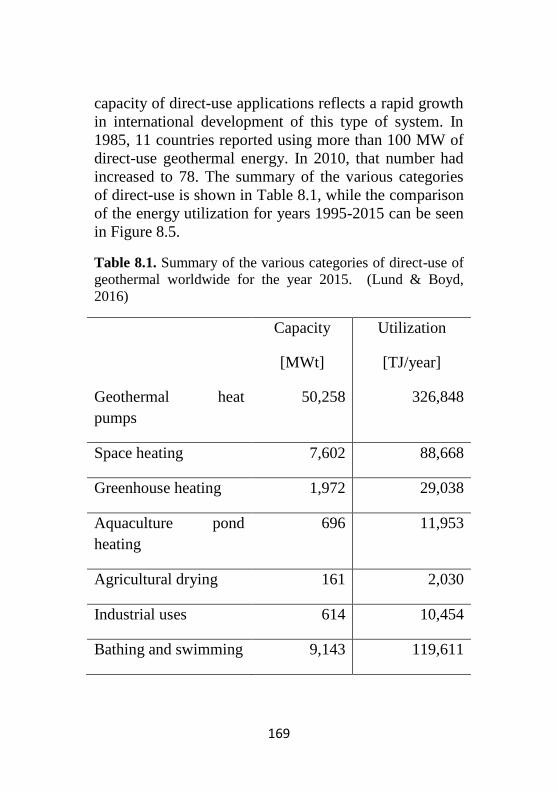
169
capacity of direct-use applications reflects a rapid growth
in international development of this type of system. In
1985, 11 countries reported using more than 100 MW of
direct-use geothermal energy. In 2010, that number had
increased to 78. The summary of the various categories
of direct-use is shown in Table 8.1, while the comparison
of the energy utilization for years 1995-2015 can be seen
in Figure 8.5.
Table 8.1. Summary of the various categories of direct-use of
geothermal worldwide for the year 2015. (Lund & Boyd,
2016)
Capacity
[MWt]
Utilization
[TJ/year]
Geothermal heat
pumps
50,258 326,848
Space heating 7,602 88,668
Greenhouse heating 1,972 29,038
Aquaculture pond
heating
696 11,953
Agricultural drying 161 2,030
Industrial uses 614 10,454
Bathing and swimming 9,143 119,611
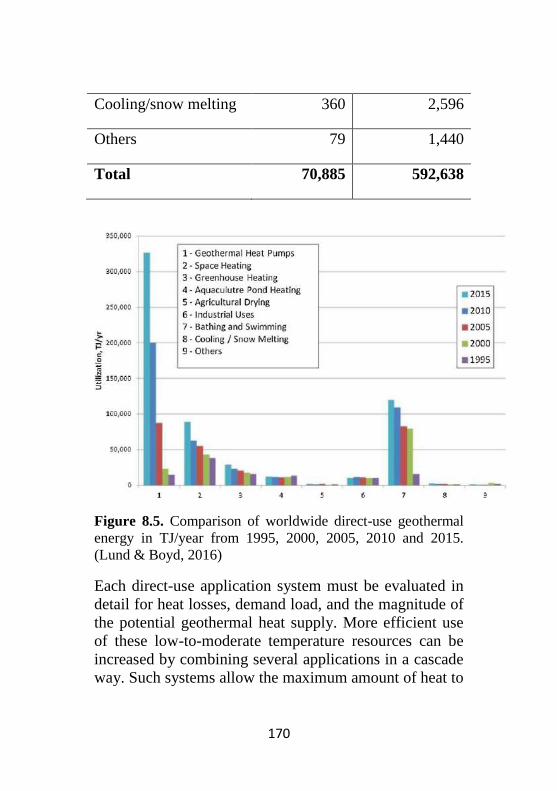
170
Cooling/snow melting 360 2,596
Others 79 1,440
Total 70,885 592,638
Figure 8.5. Comparison of worldwide direct-use geothermal
energy in TJ/year from 1995, 2000, 2005, 2010 and 2015.
(Lund & Boyd, 2016)
Each direct-use application system must be evaluated in
detail for heat losses, demand load, and the magnitude of
the potential geothermal heat supply. More efficient use
of these low-to-moderate temperature resources can be
increased by combining several applications in a cascade
way. Such systems allow the maximum amount of heat to

171
be used for useful work. One of the main advantages of
the geothermal direct-use applications is that they
significantly reduce or completely eliminate the energy
consumption usually coming from fossil fueled systems.
They also have a high capacity factor and reduce fire risk
by eliminating the need for combustion, so they can
provide significant benefits over traditional technologies.
They also significantly reduce greenhouse gas emissions.
District heating
In 2010, space heating accounted for 63,025 TJ/yr of the
total 423,830 TJ/yr energy consumed through direct-use
applications, while in 2015 it was 88,688 TJ/yr of the
total 592,638 TJ/yr. That is the third largest application
purpose of the direct-use of geothermal energy
worldwide (Figure 5). These space heating applications
usually involve district heating network that supplies the
buildings with necessary heat. The system comprises of
geothermal heat source, piping network, control system
and disposal or reinjection system. If the temperature of
the geothermal fluid is high enough (>65°C) then the hot
water extracted form shallow well or spring is directly
introduced to system, with direct disposal of the fluid. On
locations with moderate temperatures (50°C–65°C) fluid
from geothermal source is brought to the heat exchanger
that allows the heat transfer in closed loop network. For
sites with low temperatures available, using heat pumps
is recommended, while these systems require additional
energy input.
As part of a European funded study, the “Pan-European
Thermal Atlas” has been published online (see Figure

172
8.6). It shows the different heating options in Europe,
with current heat demand, potential for solar energy,
biomass and geothermal for district heating. This energy
planning tool provides basis for European governments,
businesses, consultants, academics, and planners to make
informed decisions about investments in energy
efficiency measures and use of untapped alternative
energy sources for heating and cooling.
Figure 8.6. Europe thermal atlas (Source: heatroadmap.eu)
Aquaculture
One of the simplest direct-use applications for
geothermal fluids is aquaculture. Geothermal fluids can
173
be used to raise various types of fishes and other species
such as catfish, bass, mullet, eels, salmon, trout, tropical
fish, lobsters, alligators, algae, prawns, shrimp, mussels,
scallops, etc. Geothermal heat is used to optimize the
temperature for breeding, growth, and health of the
species of interest.
Drying
Geothermal heat is often use for drying food products,
such as onions, meat, fruit, potatoes, spices, sugar, but
also materials like lumber, concrete blocks and many
other. Using geothermal heat for this purpose bring
savings in fuel comparing to the conventional fossil fuel
fired boilers. Since there is no combustion, there are no
risks of fire. In addition, combined heat and power in
cogeneration and hybrid systems, and as a heat source
and sink for heat pump applications, are options that
offer improved energy savings.
8.2 Environmental impact of using geothermal
energy
The results of analysis of full life cycle of geothermal
energy systems show that their environmental impact is
significantly lower compared to the conventional power
plants (Leveque et al., 2010). Considering that this
renewable energy source is located underground, while
the equipment of these systems is relatively compact,
their overall impact on surroundings is small. The GHG
emissions is minimal. The availability and consistency of
the geothermal energy enable it to be reliable base-load
plant source, so there is no need for any storage or back-

174
up systems. This source does not need to be produced in
one location and then distributed over great distance, so
comparing to fossil or biomass there are significant
savings. These savings refer not only to transportation
costs, but also to savings in GHG emissions emitted
during transport. There are minimal discharges of
nitrogen or sulfur oxides resulting from its use, and there
is no need to dispose radioactive materials. The general
conclusion from all recently published studies is that
emissions and other impacts from geothermal plants are
dramatically lower than other forms of electrical
generation (Tester et al., 2006). The environmental
impact of ground-source heat pumps is quite limited
because they are usually installed during building
construction and normally utilize a subsurface heat
exchanger, buried well below the frost line. However,
there are some potential impacts that should be evaluated
and analyzed prior to more widespread use of geothermal
energy. Some of the major concerns are related to
induced seismicity or subsidence, water use and
contamination. Issues of noise, safety, visual impacts,
and land use associated with drilling and production
operations are also important but fully manageable.
There are several potential environmental impacts from
any geothermal power development, and they include:
gaseous emissions, water use and pollution, solids
emissions, noise pollution, land use and subsidence,
induced seismicity and landslides, disturbance of natural
wildlife habitat and vegetation, altering natural vistas and
potential catastrophic events. Despite this long list,
current and near-term geothermal energy technologies
generally present much lower overall environmental

175
impact than the conventional fossil-fueled and nuclear
power plants.
Gaseous emissions
Geothermal steam and flash plants emit much less CO2
per MWh comparing to fossil-fueled power plants, while
binary plants practically have no CO2 emission. The
concentrations of regulated pollutants – nitrogen oxide
(NOx) and sulfur dioxide (SO2) – in the gaseous
discharge streams from geothermal steam and flash
plants are extremely small. Recently published data
indicate that geothermal plants are far more
environmentally benign than the other conventional
plants (Tester et al., 2006).
Water pollution
Fluid flows coming from drilling and production can
contain dissolved minerals. The amount increases with
fluid temperature, so for high-temperature level source
(>230°C), it is necessary to investigate it. Some elements,
such as boron and arsenic can empoison the soil and
water and induce negative impact on local habitats and
vegetation. If the system well casing is damaged, these
fluids can enter and damage the environment. Therefore,
it is necessary to monitor the site in drilling and operating
phase in order to avoid any dangerous leakages.
Generally, there is very small danger of contamination of
the environment since the all the produced fluid is being
reinjected (Tester et al., 2006).

176
Solids emissions
There is practically no chance for contamination of
surface facilities or the surrounding area by the discharge
of solids from the geofluid. The only possibly dangerous
situation could be an accident associated with a fluid
treatment or minerals recovery system that would cause
spilling of solids in the environment. To be on the safe
side, it is advisable to be cautious in cases where it is
required that the fluid is chemically treated in order to
remove solids. The chemicals used in this process may be
toxic and subject to regulated disposal (Tester et al.,
2006).
Noise pollution
Noise caused by the geothermal systems operations is nor
significantly different from other industrial facilities. The
highest noise levels are achieved in drilling, stimulation
and testing phase, where these levels are in range of 80-
115 dBA. During normal operation of the system, the
noise levels at distance of 900 m are not higher than 71-
83 dBA. These levels are significantly lower when we
move further from the source, so considering that
geothermal plants are located in large geothermal
reservoir area, there should not be evident problems with
noise.For comparison, congested urban areas typically
have noise levels of about 70-85 dBA, while living close
to a major freeway implies 90 decibels (Tester et al.,
2006).
Land use
The impact of the observed geothermal power plant on
land strongly depends on the properties of the geothermal
177
fluid and waste stream discharge. Normally, these plants
are built on the site near the reservoir, due to the losses of
pressure and temperature that can be caused by long
pipeline. In order to avoid too big influence on area and
to allow farming or other uses of land, the pipelines can
be gathered and mounted on pillars and railings.
Therefore, the total footprint of the power plant together
with the auxiliary equipment is relatively small (Tester et
al., 2006).
References
Glassley, William E. (2014). Geothermal energy: renewable
energy and the environment: CRC Press.
Leveque, Francois, Glachant, Jean-Michel, Barquin, Julian,
von Hirschhausen, Christian, Holz, Franziska, & Nuttall,
William J. (2010). Security of Energy Supply in Europe.
Natural Gas, Nuclear and Hydrogen: Edward Elgar.
Lund, John W, & Boyd, Tonya L. (2016). Direct utilization of
geothermal energy 2015 worldwide review. Geothermics, 60,
66-93.
Tester, Jefferson W, Anderson, Brian J, Batchelor, Anthony S,
Blackwell, David D, DiPippo, Ronald, Drake, E, . . . Nichols,
Kenneth. (2006). The future of geothermal energy: Impact of
enhanced geothermal systems (EGS) on the United States in
the 21st century. Massachusetts Institute of Technology, 209.
178
CHAPTER 9
HYDROPOWER ENERGY
Chapter writer: Aleksandra SRETENOVIC
University of Belgrade, Beograde, Serbia.
e-mail: [email protected]
Abstract: The potentials and current state of the hydropower
use is elaborated. There is a variety of different hydro-power
plants, while the main categories are: reservoir-type, run-of-
river systems, pumped storage and small scale hydropower
systems. The technology of different types is explained. The
mostly used turbines in hydro-power plants are: Impulse
turbine (Pelton, Cross Flow) and Reaction turbine (Propeller,
Frances, Kinetic). Environmental impact of Hydro-power
plants is elaborated, highlighting the difference between large-
scale plants, that are no longer considered „green“and small-
scale hydropower.
Learning objectives:
After mastering this chapter, the student will have the ability
to:
• Understand the potentials and availability of
hydropower energy for electricity production
• Discuss the advantages and disadvantages of
hydropower production (economic, social and
environmental aspect)

179
• Understand and discuss potential environmental
impacts of hydro-power systems (both large-scale and
small-scale)
• Critically discuss the questions related to the possible
use of hydropower (systems types, turbines used)
Hydropower is a mature technology that is currently used
in about 160 countries for producing electricity. With a
total capacity of approximately 1,060 GWe (19.4% of the
world’s electric capacity in 2011), hydropower generates
about 3,500 TWh per year, which is equivalent to 15.8%
of 2011 global electricity generation. Hydro-power plants
provide at least 50% of the total electricity supply in
more than 35 countries. One of their advantages is that
they provide flood control and irrigation. Using
hydropower to produce electricity is very cost-effective.
It offers high efficiency with low operating and
generation costs, although the initial investment cost is
significant. Another key feature is the operational
flexibility. The capacity of hydropower plants can be
varied in range 23%-95%, depending on targets and the
service (i.e. baseload, peak load) of the specific power
plant.
The global technical hydropower potential is very
significant, and it is estimated to be around 15,000 TWh
per year. Half of this total potential is available in Asia
and 20% in Latin America. Large untapped technical
potential is still available in Europe, Africa, Latin
America and Asia. Even in the most hydropower-
developed regions, Europe, there is still about 50% of the
unused potential. For small hydropower the potential is
180
estimated to be 150-200 GWe. Only about 20% of this
potential has been exploited to date.
However, large hydropower projects can encounter social
opposition because of their impact on water availability,
ecosystems and the environment, and the need to relocate
populations that may be affected by the project. Major
hydropower plants issues include public acceptance, high
initial investment costs and long payback periods, long
approval and construction cycles, and long lead times to
obtain or renew concession rights and grid connections.
These challenges are likely to limit the implementable
hydropower potential. Hydropower systems can be
categorized as follows (Egré & Milewski, 2002):
• reservoir-type systems with significant storage
capacity;
• run-of-river systems with little or no storage
capacity and river diversion systems
• pumped-storage systems;
• small, mini and micro hydropower systems.
Reservoir-type systems
Reservoir systems (see Figure 9.1) involve impounding
water behind a dam to enable flow regulation throughout
the year (on a daily or monthly basis) or even in some
cases on a multi-annual basis for very large reservoirs.
The reservoir also provides a reserve of energy to satisfy
electricity demand during dry seasons and/or periods of
peak demand.

181
Figure 9.1. Reservoir-type Hydropower
(https://en.wikipedia.org)
The environmental impacts of reservoir type systems
originate from:
• the construction activities involved in building the
dam, dikes, embankments and power plant;
• the presence of infrastructure (access roads, power
lines, substations, etc.);
• the changes in river flow patterns;
• the creation of a reservoir, possibly generating major
ecological changes from terrestrial and river
environments to a lake-type environment, but also
land use transformations, such as resettlement of
communities and of production activities.
Run-of-river hydropower systems
This type of hydropower generation utilizes the flow of
water within the natural range of the river, without
necessity of a reservoir (or with little one). They can be
designed with small head, generally on large rivers with
gentle gradients, or with high head, usually on small
rivers with steep gradients. Run-of-river projects (see
Figure 9.2) can use all the river flow or only a fraction of
it. The amount of power produced by run-of-river
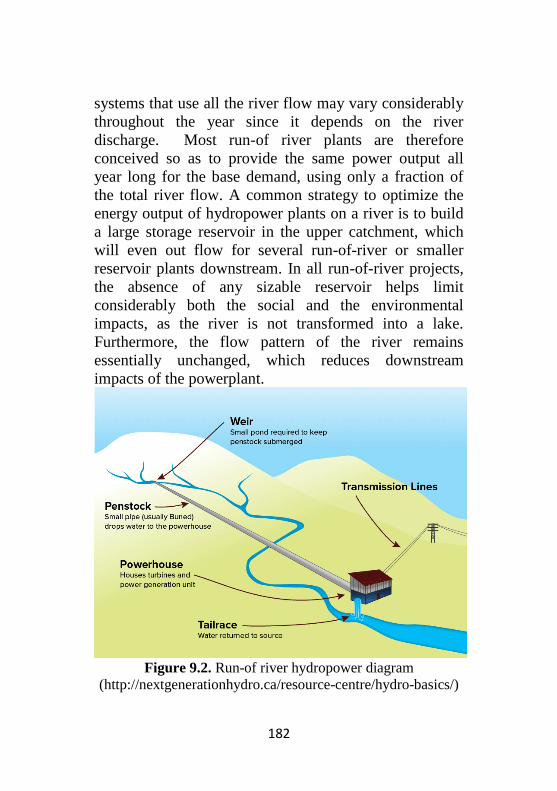
182
systems that use all the river flow may vary considerably
throughout the year since it depends on the river
discharge. Most run-of river plants are therefore
conceived so as to provide the same power output all
year long for the base demand, using only a fraction of
the total river flow. A common strategy to optimize the
energy output of hydropower plants on a river is to build
a large storage reservoir in the upper catchment, which
will even out flow for several run-of-river or smaller
reservoir plants downstream. In all run-of-river projects,
the absence of any sizable reservoir helps limit
considerably both the social and the environmental
impacts, as the river is not transformed into a lake.
Furthermore, the flow pattern of the river remains
essentially unchanged, which reduces downstream
impacts of the powerplant.
Figure 9.2. Run-of river hydropower diagram
(http://nextgenerationhydro.ca/resource-centre/hydro-basics/)
183
River diversion hydropower systems
River diversion consist of:
• In-stream diversion: A river is dammed and the
water flow is diverted through tunnels into the
mountain side to discharge further downstream
back in its riverbed.
• Cross-watershed diversion: This strategy will
increase the flow of the receiving river where the
power plant is located, and decrease the
downstream flow of the diverted river.
With in-stream diversions, the goal is to increase the
head of the power plant, thereby increasing available
power and energy. For cross-watershed diversions, the
result is an increase in energy, this time by increasing the
flow of the receiving stream where the power plant is
located. The specific environmental impact of diversion
hydropower systems is a severe or total reduction of flow
immediately downstream of the diversion. This can affect
downstream shore erosion, water temperature and water
quality. The magnitude of such impacts is a function of
ecosystems affected, particularly in terms of aquatic
biology, and the length of the river section with
diminished flow. In cross-watershed diversions, an
additional impact has to do with the increased flow in the
receiving river. There is also a risk of spreading
unwanted species, fish or plants, between catchments.
Ultimately, a new ecological equilibrium appears, with
colonization of the river edge by plants, shrubs and
terrestrial fauna in diminished flow rivers, and an
increase in water habitats in increased flow rivers. The
most effective measure is to ensure a minimum
184
ecological flow downstream of a diversion, in order to
maintain a river habitat and existing land uses
downstream (fishing, navigation, urban and industrial
water supply, etc.). The flow of most natural rivers varies
significantly from season to season, and some rivers dry
up completely during parts of the year. The ecosystem of
each river has adjusted over time to the flow pattern of
the river. The design of an ecological flow in a diverted
river may be based on the habitats of the most valued
aquatic species in the river, in order to minimize the
losses of spawning grounds, for example. In a river with
reduced flow, small weirs can be built to ensure a water
level similar to pre-diversion conditions.
Pumped-storage hydropower systems
Pumped-storage plants (see Figure 9.3) pump water into
an upper storage reservoir during off-peak hours by using
surplus electricity from base load power plants. They
reverse flow to generate electricity during the daily peak
load period. They are considered to be one of the most
efficient technologies available for energy storage. The
concept of pumping water back to the upper reservoir
during off-peak hours means that these plants are net
energy consumers: it takes more power to pump water up
to the top reservoir than is produced by the plant when
the water rushes down to the lower reservoir. Generally,
from 65% to 75% of the electricity required by the
pumping is recovered during the generation phase.

185
Figure 9.3. Pumped storage hydropower system
(http://energystoragesense.com/pumped-hydroelectric-storage-
phs/)
Developing pumped-storage plants is cost effective when
other plants in the grid produce mainly base energy with
little flexibility, such as coal power plants and/or nuclear
stations. In such cases the cost of peak electricity can be
twice as much or more than the cost of off-peak
electricity. A small upper pool which empties very
quickly on short intervals, once or twice a week,
characterizes pumped storage plants. The drawdown in
the upper reservoir is therefore very significant. These
pools are often manmade and do not develop into a stable
aquatic environment. Pumped-storage plants sometimes
can use a river, a lake or an existing reservoir as the
lower reservoir, or to create additional pool. The
environmental issues associated with pumped storage
plants are mostly related to the siting of the upper pool,
the powerhouse location (underground or above ground)
and the nature of the lower reservoir ecosystem. These
186
issues are essentially site-specific and can be addressed
during the design phase of the project.
Small, mini and micro hydropower systems
The definitions of small, mini and micro-hydropower
systems are relative and vary depending on the
circumstances of each country. Therefore, no definitions
exist which are generally accepted all over the world.
Compared to large projects, small-scale plants benefit in
terms of ease of introduction, as the period for planning
and construction is shorter, investment is smaller and
only small areas need to be acquired. Small-scale
hydropower is often used for distributed generation
applications as an alternative to, or in combination with,
diesel generators or other small-scale power plants for
rural applications.
Environmental impacts are roughly proportional to area
inundated. There are also benefits related to reduced
safety risks associated with small dams, and lesser
population. From an environmental standpoint, the
distinction between renewable small dams and non-
renewable large dams is somewhat arbitrary. It is not size
that defines whether a project is renewable and
sustainable or not, but the specific characteristics of the
project and its location. The question that rises is: What
is less damaging for the environment? One very large
power plant, on one river, with an installed capacity of
1000MW, or 200 small hydropower plants of 5MW on
100 rivers? Could the overall impact of a single 1000MW
project be less than the cumulative impact of 200 small
hydropower projects of 5MW, because of the number of
187
rivers and tributaries which will be affected? Although it
is obvious that a smaller human intervention on a specific
habitat has fewer impacts than a very large intervention
on the same habitat, one should compare hydropower
projects based on the energy and power produced. From
this standpoint, the cumulative impacts of a multitude of
small hydro projects might be larger than those of a
single project, given the diversity of ecosystems that may
be affected and the much larger cumulative surface area
to be inundated for equivalent storage volume with small
projects.
The main advantages of hydropower production (Okot,
2013):
➢ Economic aspects
• It has low operating and maintenance costs
• It has a long-lasting and robust technology:
systems can last for 50-years or more without
major new investment
• It is a reliable source of energy
• It promotes regional development, creates
employment opportunities
• It uses the proven, well-known technology with
highest efficiency
➢ Social aspects
• Improves standard of living
• Leaves water available for other uses
• Frequently provide flood protection
• May enhance navigation conditions
• Enhances accessibility of the territory and its
resources

188
➢ Environmental aspects:
• Produces no atmospheric pollutant and only very
few GHG emissions
• No waste is produced
• Avoids depleting of non-renewable fuel resources
• Slows down climate change
The main disadvantages:
➢ Economic aspects
• High capital cost
• Requires multidisciplinary involvement
• Long-term planning and long-term agreement are
required
➢ Social aspect:
• May lead to resettlement
• Damming of large area reduce public access. It
affects outdoor recreation activities
• The power lines can change the landscape
• Management of water uses is needed
➢ Environmental aspect
• Barriers for fish migration and entrainment
• Involve modification of aquatic habitats
• Requires management of water quality
• The populations may need to be monitored
• Damming areas rich in biodiverse flora results in
carbon emissions
Figure 9.4 shows components of a simplified hydropower
scheme (Okot, 2013):. The basic hydropower principle is
based on the conversion of a large part of the gross head,
189
Hg (m) into mechanical and electrical energy. Hydro
turbines convert the water pressure into mechanical
power which can then be used to drive generator or other
machine. The produced power is proportional
Water pressure is converted by hydro turbines into
mechanical shaft power. The mechanical shaft power can
be used to drive an electrical generator or other
machinery. The available power is directly proportional
to the product of pressure head and volume flow rate.
Generally, the hydraulic power Po(kW) and the
corresponding energy Eo (kWh) over an interval of time
t(h) are
Where is density of water (kg/m3) and g gravity (m/s2).
The final power P delivered to the network is given by
𝑃 = 𝜂𝑃𝑜, where η is the hydraulic efficiency of the turbo-
generator. Hydro is still the most efficient way to
generate electricity. Modern hydro turbines are capable
of converting up to 90% of the available energy into
electricity, although this reduces with size. Micro
hydropower systems tend to be in the range of 60–80%
efficiency.

190
Figure 9.4. Components of a hydropower scheme (Okot,
2013)
Water turbines
Currently, there are various designs of water turbines in
use, while each has its own advantages and disadvantages
and optimal operation range. Considering that the turbine
power output depends on combination of head, water
volume and water pressure on blades, it is necessary to
adequately select the most suitable turbine type for the
selected installation. The most use turbines can be
divided into:
• Reaction Turbine Design – the blades are enclosed in
a pressurized casing and totally submersed in water.
The pressure difference across adequately profiled
blades causes the blades to rotate fast.
• Impulse Turbine Design – the water flow hits the
turbine blades from one or more jets of water
(nozzles). The mechanical power output from an
impulse turbine is derived from the kinetic energy of
the water flow.
Besides by the type of operation, turbines can be
categorized by the design, structure and layout of the
blades. Pelton, Turgo or Kaplan Turbines are named

191
after their inventors. The difference between higher and
lower elevations of water (where the potential energy is
stored) is the head of the system. Generally, in hydro
energy and hydro-electric power systems, a low-head
means a vertical distance of less than 30m, a medium-
head means a vertical distance of between 30 to 150m,
while a high-head means a vertical distance greater than
150m.
The Pelton Water Turbine (Pelton Wheel), named after
its inventor Lester Pelton, is the most often used open
type turbine wheel design (see Figure 9.5). It is an
impulse turbine which is most suitable for high head and
low waterflow. Along the perimeter of the wheel there
are small curved cups (buckets). High speed water jet
injected through the nozzles hits these cups an induces an
impulse force which makes the turbine rotate. The most
important component of the Pelton wheel is the bucket,
that is split in two halves, where each half is turned and
deflected back. The special shape makes the jet turns
almost 180 degrees.
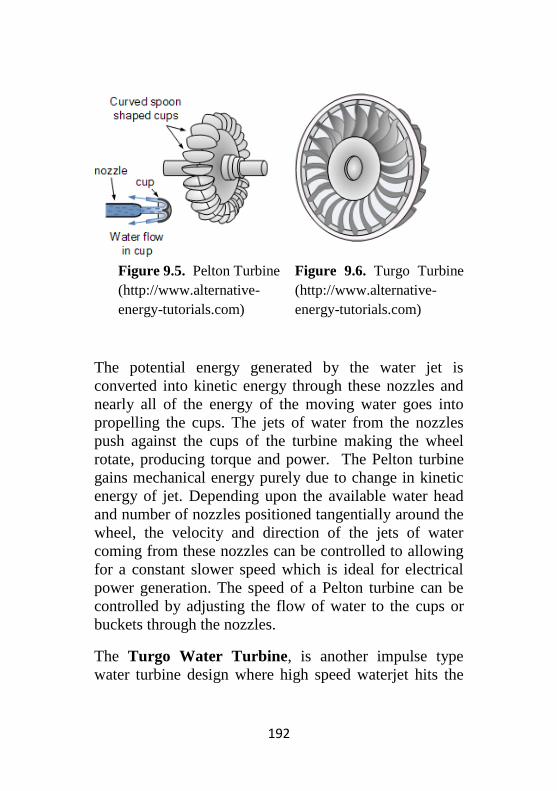
192
Figure 9.5. Pelton Turbine
(http://www.alternative-
energy-tutorials.com)
Figure 9.6. Turgo Turbine
(http://www.alternative-
energy-tutorials.com)
The potential energy generated by the water jet is
converted into kinetic energy through these nozzles and
nearly all of the energy of the moving water goes into
propelling the cups. The jets of water from the nozzles
push against the cups of the turbine making the wheel
rotate, producing torque and power. The Pelton turbine
gains mechanical energy purely due to change in kinetic
energy of jet. Depending upon the available water head
and number of nozzles positioned tangentially around the
wheel, the velocity and direction of the jets of water
coming from these nozzles can be controlled to allowing
for a constant slower speed which is ideal for electrical
power generation. The speed of a Pelton turbine can be
controlled by adjusting the flow of water to the cups or
buckets through the nozzles.
The Turgo Water Turbine, is another impulse type
water turbine design where high speed waterjet hits the

193
turbines blades (see Figure 9.6). The difference
comparing to the Pelton wheel is that the jet strikes the
plane of the bucket at an angle of about 20o. The curved
blades are catching the water and making the turbine
shaft rotate. Due to the higher flow rate, a Turgo turbine
can have a much smaller diameter wheel than an
equivalent Pelton for the same amount of power output
allowing them to rotate at higher speeds. However, the
Turgo wheel is less efficient than the Pelton wheel.
The Francis Water Turbine, named after its inventor
James Francis, is a radial flow reaction type of water
turbine design in which the entire turbine wheel assembly
is immersed in water and surrounded by a casing (see
Figure 9.7). The water enters the casing under pressure
and is guided through a set of fixed or adjustable slots
called guide vanes around the casing which direct the
flow of water to the turbines blades at the correct angle.
The water enters the turbines blades radially and emerges
axially causing it to spin.
A Francis turbine is a submerged turbine similar in
design to a propeller turbine that uses water pressure and
kinetic energy to rotate the blades. The energy from the
flow of the water is transferred to the output shaft of the
turbine in form of torque and rotation. This turbine is
suitable for low to medium head applications but requires
a relatively large quantity of water.
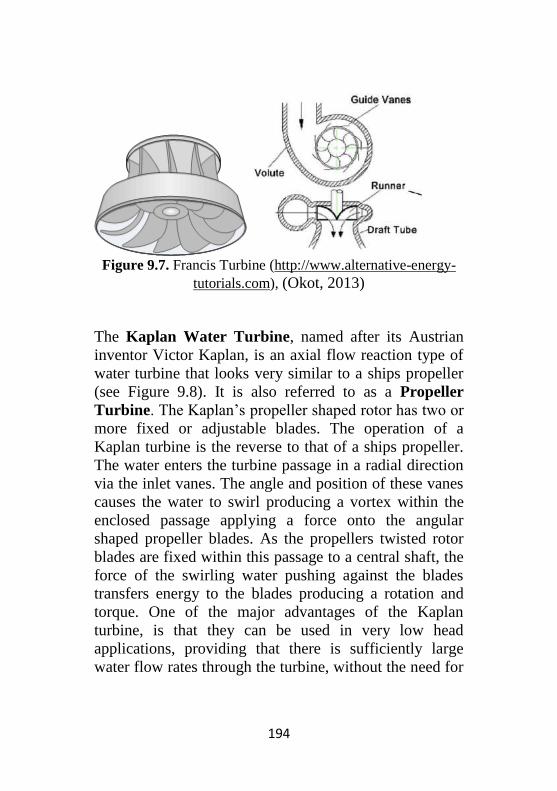
194
Figure 9.7. Francis Turbine (http://www.alternative-energy-
tutorials.com), (Okot, 2013)
The Kaplan Water Turbine, named after its Austrian
inventor Victor Kaplan, is an axial flow reaction type of
water turbine that looks very similar to a ships propeller
(see Figure 9.8). It is also referred to as a Propeller
Turbine. The Kaplan’s propeller shaped rotor has two or
more fixed or adjustable blades. The operation of a
Kaplan turbine is the reverse to that of a ships propeller.
The water enters the turbine passage in a radial direction
via the inlet vanes. The angle and position of these vanes
causes the water to swirl producing a vortex within the
enclosed passage applying a force onto the angular
shaped propeller blades. As the propellers twisted rotor
blades are fixed within this passage to a central shaft, the
force of the swirling water pushing against the blades
transfers energy to the blades producing a rotation and
torque. One of the major advantages of the Kaplan
turbine, is that they can be used in very low head
applications, providing that there is sufficiently large
water flow rates through the turbine, without the need for

195
dams and weirs resulting in a negligible impact on the
environment.
Figure 9.8. Kaplan Turbine
(http://www.alternative-
energy-tutorials.com)
Figure 9.9. Cross-flow
Turbine
(http://www.alternative-
energy-tutorials.com)
The Cross Flow Water Turbine, (Michell-Banki
turbine) is an impulse type water turbine which has a
drum-like rotor and uses an elongated, rectangular-
section nozzle which is directed against curved vanes
(slats) on a cylindrically shaped runner (see Figure 9.9).
Cross-flow turbines are less efficient than the modern-
day turbines (i.e. Pelton, Turgo, Francis and Kaplan), but
it can accommodate larger water flows and lower heads.
The water is fed to these slats through a single or double
vertical rectangular nozzle to drive a jet of water along
the full length of the runner. These nozzles direct the
water to the runners and convert the potential energy of
the water to kinetic energy. After hitting the first blade,
the water drops down through the drum and leaves on the
opposite side. Then the cross-flow turbine uses the
energy of the water twice, once from above and once

196
from below to rotate the turbine wheel around its central
axis providing additional efficiency. The main advantage
of the cross-flow turbine is that it maintains its efficiency
under varying load and water flow conditions. Also, due
to their relatively easy construction, good regulation, and
the fact that they can operate with a very low head of
water, cross-flow water turbines are ideal for use in mini
and micro hydro-power systems. Selecting the best type
of water turbine design for the specific situation often
depends on the amount of head and flow rate that is
available at your particular location and whether it is at
the side of a river or stream, or the water is to be
channeled or piped directly to the location.
Figure 9.10 gives a basic idea of which particular Water
Turbine Design works best according to the available
head height and water pressure on the site.
Figure 9.10. Types of small hydro-power by head height,
discharge or capacity (Voith, 2013)

197
9.2 Environmental impact
Large hydropower projects turned out to be controversial
because they may: significantly affect water availability
over large geographic regions; disrupt natural
ecosystems; force the relocation of population groups
against their will, require a large electricity transmission
infrastructure. These are the main reasons for some
ecologists and environmental activists to claim that the
large-scale hydropower plants are not so desirable way of
producing electricity, as well as not so „green“as it looks
like at the first glance. It is evident that hydropower
generates numerous economic and social benefits in
addition to the electricity produced, such as irrigation,
water supply, food control and recreation. Although
hydropower development has always been traditionally
considered a green energy resource, published reports
have differentiated between “small hydro” as being
renewable and sustainable, whereas “large hydro” is not
(Pang, Zhang, Ulgiati, & Wang, 2015). Since the middle
of `70s disruption of sediment transportation, fish
migration, downstream flows and estuaries have been
carefully observed in various projects. There are number
of evidences that the built dams have altered the river
waterflow, affecting water temperature, flood extent and
nutrition load, that implied consequences on feeding and
breeding habitats along the river. Some anti-dam
organizations claim that the GHG emissions are similar
to the thermal plants of equivalent power. Also, there is
inevitable socioeconomic impacts, which involves
unwanted moving people from the territory, the extensive
destruction of agricultural and forest lands, damages to
198
historical and mineral resources, and the loss of
archeological, scenic and tourist sites. Weighing the
benefits against the disadvantages is a difficult task for
decision-makers. Environmental impacts associated with
hydropower use can be summarized in four important
categories: fauna, flora, landscape and historical remains.
The flora is the most frequently mentioned in recently
published studies, due to the evident direct damage
caused by the impact of constructing dams on flora, such
as agricultural losses, forestry losses, erosion and
vegetation. The nature and extent of the impact is highly
dependent of site specific characteristics as well as on the
type and dimension of hydropower plant (Botelho,
Ferreira, Lima, Pinto, & Sousa, 2017). This implies that
impacts affecting local communities must be assessed on
a case-to case basis. Since the large-scale hydropower is
no longer accepted as a clean renewable energy source,
small-scale hydropower, whose popularity decreased
since the 1960s, can provide possible solution for raised
environmental issues and become clean substitute for
large hydropower plants. However, small-scale
hydropower plants also affect river ecosystems to some
extent. These changes of the local ecosystem mainly
involve two aspects: disturbances of original landscape
and downstream ecosystem degradation caused by
impounding and diverting water, which can lead to
periodic drying-up of the river. Although hydropower
does not consume or pollute the water, it disrupts the
natural flow. Since the water flow is the major driver of
the river ecological processes, these changes dramatically
influence the health of the river ecosystems.
199
The water sequestration and the periodic drying-up
caused by the dam provokes the degradation of the
downstream ecosystem services. If it is possible to avoid
this, then the impact of the environment is relatively
small. The problem could rise if the small-scale power
plants are being installed without order on plan in some
countries. This can cause both the unstable operation as
well as more significant drying-up. Building small
hydropower plants on couple of adequately chosen
locations may not affect the river noticeably. But
extensive application of this technology on every
possible site on rivers and waterfalls will dramatically
increase the degradation of the environment. Too
intensive use of the small-scale hydropower may repeat
the environmentally damaging history of large
hydropower projects. Significant advances in
hydropower technology promise further positive
developments. New, less-intrusive, low-head turbines are
now being developed for smaller reservoirs, which may
increase the investment cost. (Pang et al., 2015).
However, the implementation of the necessary advances
is often slow and R&D investment insufficient. This is
partially due to the misperception that hydropower is a
mature technology and offers few upgrading prospects.
References
Egré, Dominique, & Milewski, Joseph C. (2002). The
diversity of hydropower projects. Energy Policy, 30(14),
1225-1230.
200
Okot, David Kilama. (2013). Review of small hydropower
technology. Renewable and Sustainable Energy Reviews, 26,
515-520.
Pang, Mingyue, Zhang, Lixiao, Ulgiati, Sergio, & Wang,
Changbo. (2015). Ecological impacts of small hydropower in
China: Insights from an emergy analysis of a case plant.
Energy policy, 76, 112-122.
Voith (2013), “Small hydro”, Voith, Germany,
http://voith.com/en/Broschuere_SH_final_screen.pdf.

201
CHAPTER 10
BIOMASS ENERGY SYSTEMS
Chapter writer: László MAGYAR
Energiaklub Climate Policy Institute and Applied
Communications, Hungary
e-mail: [email protected]
Abstract: Biomass as an energy source is an alternative to
fossil fuels (coal, petroleum, and natural gas). In recent years
there is a resurgence of interest in biomass energy because
biomass is perceived as a carbon-neutral source of energy
unlike net carbon-emitting fossil fuels. Bioenergy is also a
versatile energy source, since it can be converted into solid,
liquid and gaseous fuels. Bioenergy can be used for heating
homes, electrifying communities and fuelling the transport
sector. In this chapter, different sources of biomass, technical
rutes of bioenergy production and environmental impacts in
connection with the processes will be discussed in detail.
Learning objectives
• Readers will be informed about different biomass
energy sources and distinguish various biomass
energy technologies
• Readers will be able to evaluate the environmental
impacts of biomass energy use

202
10.1 Biomass Energy
Biomass is the general term which includes phytomass or
plant biomass and zoomass or animal biomass. Biomass
contains stored energy from the sun. Plants absorb the
sun's energy through photosynthesis and convert it into
chemical energy (see Figure 10.1) (Abbasi et al.,2010).
Figure 10.1. The process of photosynthesis (US National
Energy Education Project)
The total incident solar energy reaching the surface is
173,000 TW (terawatt), which is 17,000 times what the
present day humans consume in fossil fuels (Goldemberg
J, Johansson TB, 2004). The energy captured by
photosynthesis is about 140 TW which is a very small
percentage of the total solar energy reaching our planet,
yet the total volume of biomass that is created, is still
very large, 10 times our present energy demand. About
203
100 billion tonnes of carbon is converted to biomass
every year (Abbasi et al., 2010).
Biomass as an energy source is an alternative to fossil
fuels (coal, petroleum, and natural gas). Burning either
fossil fuels or biomass releases carbon dioxide. However,
the plants that are the source of biomass capture a nearly
equivalent amount of CO2 through photosynthesis while
they are growing. In recent years there is a resurgence of
interest in biomass energy because biomass is perceived
as a carbon-neutral source of energy unlike net carbon-
emitting fossil fuels of which copious use has led to
global warming and ocean acidification (US National
Energy Education Project).
When biomass is burned, the chemical energy in biomass
is released as heat. Bioenergy is a versatile energy
source. In contrast to other energy sources, biomass can
be converted into solid, liquid and gaseous fuels.
Moreover, bioenergy can be used for heating homes,
electrifying communities and fuelling the transport sector
(World Energy Council, 2016).
10.2 Consumption of biomass energy
10.2.1 Global consumption
Globally, bioenergy (including waste) accounted for 14%
of the world’s energy consumption in 2012 with roughly
2.6 billion people dependent on traditional biomass for
energy needs (see Figure 10.2) (World Bioenergy
Association, 2014).

204
Figure 10.2. Global final energy consumption in 2013 (World
Bioenergy Association,2014)
USA and Brazil lead the world in production and
consumption of liquid biofuels for transport (accounting
for almost 80% of production). In the transport sector, the
production of corn ethanol in USA and sugarcane ethanol
in Brazil has increased significantly (World Energy
Council, 2016).
The use of biomass for electricity is prominent in Europe
and North America – predominantly produced from
forestry products and residues. The Europe and Americas
continent contribute more than 70% of all consumption
of biomass for electricity. In the past few years, biomass
is seeing increasing uptake in developing countries in

205
Asia and Africa where significant proportion of the
population lacks access to electricity. (World Energy
Council, 2016).
Currently, the major use of biomass is in the form of heat
in rural and developing countries. About 90% of all the
bioenergy consumption is in the traditional use. It
includes the use of fuelwood, charcoal, agricultural
residues etc. for cooking and heating. This will soon
change as rapid urbanisation, inefficient use of biomass
leading to deforestation, climate goals and increasing
energy demand will lead to a shift towards improved
conversion efficiencies and modern bioenergy sources
like biogas, pellets, liquid biofuels etc (World Energy
Council, 2016).
10.2.2 Consumption in the European Union
In the EU a new consumption record of 93.8 Mtoe was
posted in 2015 (Eurobserv’er, 2016). The increase in
prodution and consumption of solid biomass was
constant in the last two decades (see Figure 10.3).
The total biofuel consumption in EU transport in 2016
was 14,4 Mtoe. Biodiesel part in the total biofuel
consumption in EU transport in 2016 was 80,6 %. The
aim is to reduce the negative environmental impact of
GHG emissions created by producing biofuel, involving
indirect land use change. Fuel suppliers also have to
reduce the level of greenhouse gas intensity in their fuel
by 6% by 2020 (Eurobserv’er, 2017).

206
Figure 10.3. Solid biomass primary energy production and
inland consumption growth figures for the EU since 2000 (in
Mtoe) (Eurobserv’er: Solid biomass barometer 2016)
10.3 Sources of biomass for energy generation
10.3.1 Food crops
Food crops, such as sugarcane, corn, maize, soyabean,
wheat, sugar beet and vegetable oils are used to produce
biofuels: ethanol, biodiesel and petrol/diesel additives
(see Figure 10.4) (Abbasi et al., 2010).
Food crops-to-energy programmes are under increasing
scrutiny because they compete with the use of these crops
as food, thereby pushing up food prices and threatening
the existence of subsisting human beings. They also
207
seriously degrade land and water bodies (Abbasi et al.,
2010).
10.3.2 Hydrocarbon-rich plants
A large number of plants contain hydrocarbons in
concentrations significant enough to become a potential
source of a diesel like fuel. Even as great hope is pinned
by some on these plants, the negative impact of their
large-scale use is similar to that of food crops (Abbasi et
al., 2010).
10.3.3 Waste
Waste includes agricultural residues (straw,
vegetable/fruit peels and crop wastes), forestry waste,
food waste and biomass components of municipal solid
waste. Substantial energy can be produced from these
wastes, because globally several billion tonnes of
biomass is contained in them. But to actually extract the
energy in a clean and costeffective manner is a major
challenge yet to be met (Abbasi et al., 2010).
10.3.4 Weeds and wild growths
Invasive plants which outgrow their utility to humans are
called weeds. Invasive plants elbow out most other
species and have a destabilizing and degrading effect on
the areas they colonize. If such plants can be utilized as
energy source it would become economically feasible to
periodically harvest and use them, thereby controlling

208
their spread and reducing the harm they cause (Ganesh et
al., 2009).
10.3.5 Fast-growing grasses and woody species
They include:
- Woody species such as willows, poplars and
other hardwoods
- Herbaceous species such as switchgrass, big
blustem, reed canarygrass and miscanthus
Of these, switchgrass has attracted particular attention
due to its high biomass yield, broad geographic range,
efficient nutrient utilization, low erosion potential,
carbon sequestration capability, and reduced fossil fuel
input requirements relative to annual crops (McLaughlin,
Kszos, 2005).Care must be taken when selecting species
for use as biofuel crops, because the characteristics which
make some species ideal for this use, such as C4
photosynthesis, long canopy duration, lack of pests and
diseases, and rapid spring growth, are the ones also
associated with invasiveness (Raghu et al., 2006).
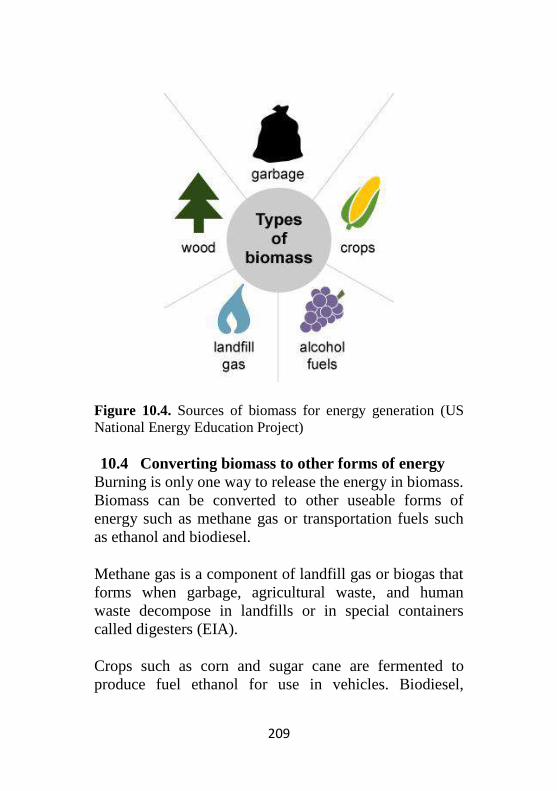
209
Figure 10.4. Sources of biomass for energy generation (US
National Energy Education Project)
10.4 Converting biomass to other forms of energy
Burning is only one way to release the energy in biomass.
Biomass can be converted to other useable forms of
energy such as methane gas or transportation fuels such
as ethanol and biodiesel.
Methane gas is a component of landfill gas or biogas that
forms when garbage, agricultural waste, and human
waste decompose in landfills or in special containers
called digesters (EIA).
Crops such as corn and sugar cane are fermented to
produce fuel ethanol for use in vehicles. Biodiesel,

210
another transportation fuel, is produced from vegetable
oils and animal fats (EIA).
Table10.1 enlists the sources of biomass and their uses
for energy production.
Table 10.1. Examples of biomass and their uses for energy
(www.eia.gov)
Source of biomass Its use for energy production
Wood and wood
processing wastes
Burned to heat buildings, to
produce process heat in industry,
and to generate electricity
Agricultural crops and
waste materials
Burned as a fuel or converted to
liquid biofuels
Food, yard, and wood
waste in garbage
Burned to generate electricity in
power plants or converted to biogas
in landfills
Animal manure and
human sewage
Converted to biogas, which can be
burned as a fuel
10.5 Technical routes for the production of different
types of energy from biomass
10.5.1 Thermochemical convertion of biomass
In thermochemical processing biomass is converted into
a range of products by thermal decay and chemical
reformation. It essentially involves heating biomass in
the presence of differing concentrations of oxygen. When
biomass is heated in total absence of oxygen, the
pyrolysis process produces various organic liquids that
can be manipulated or refined to make liquid fuels.

211
Alternatively, heating with low concentrations of oxygen
leads to gasification and the production of hydrogen and
organic gases which can also be converted into liquid
fuels (Abbasi et al., 2010).
The start-up and plant maintenance costs of
thermochemical processes are high because of the
demands of high temperature processing. In order to
operate efficiently, thermochemical processing must be
done on a large scale which necessitates the
transportation of biomass over long distances, resulting
in an increase in cost. Also, thermochemical processes
use up a lot of fossil fuels in the course of transportation
of biomass and its heating (Abbasi et al., 2010).
10.5.2 Electricity from biomass-fired power plants
Direct combustion of biomass for power generation is a
mature, commercially available technology that can be
applied on a wide range of scales from a few MW to 100
MW or more and is the most common form of biomass
power generation (see Figure 10.5). Around the globe,
over 90% of the biomass that is used for energy purposes
goes through the combustion route (IRENA, 2012).
There are two main components of a combustion–based
biomass plant: the biomass-fired boiler that produces
steam; and the steam turbine, which is then used to
generate electricity. The two most common forms of
boilers are stoker and fluidised bed. These can be fuelled
entirely by biomass or can be co-fired with a combination
of biomass and coal or other solid fuels. The steam
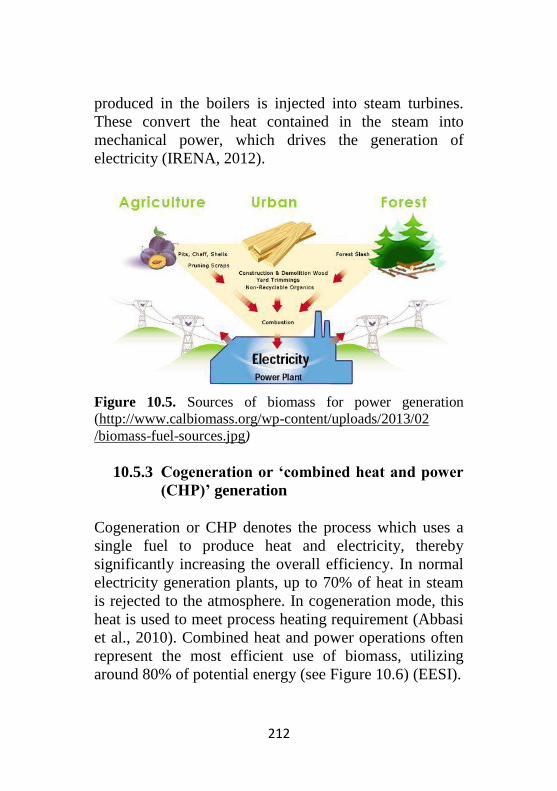
212
produced in the boilers is injected into steam turbines.
These convert the heat contained in the steam into
mechanical power, which drives the generation of
electricity (IRENA, 2012).
Figure 10.5. Sources of biomass for power generation
(http://www.calbiomass.org/wp-content/uploads/2013/02
/biomass-fuel-sources.jpg)
10.5.3 Cogeneration or ‘combined heat and power
(CHP)’ generation
Cogeneration or CHP denotes the process which uses a
single fuel to produce heat and electricity, thereby
significantly increasing the overall efficiency. In normal
electricity generation plants, up to 70% of heat in steam
is rejected to the atmosphere. In cogeneration mode, this
heat is used to meet process heating requirement (Abbasi
et al., 2010). Combined heat and power operations often
represent the most efficient use of biomass, utilizing
around 80% of potential energy (see Figure 10.6) (EESI).

213
Figure 10.6. Cogeneration compared to seperate power
production (Source: www.mwm.net)
Capacity of cogeneration projects can range from a few
kilowatts to several megawatts of electricity generation
along with simultaneous production of heat ranging from
less than a hundred kWth (kilowatts thermal) to many
MWth (megawatts thermal). CHP systems generally offer
higher carbon savings than power only systems, but have
less favourable economics mainly due to high initial
capital costs (see Figure 10.7) (Abbasi et al., 2010).
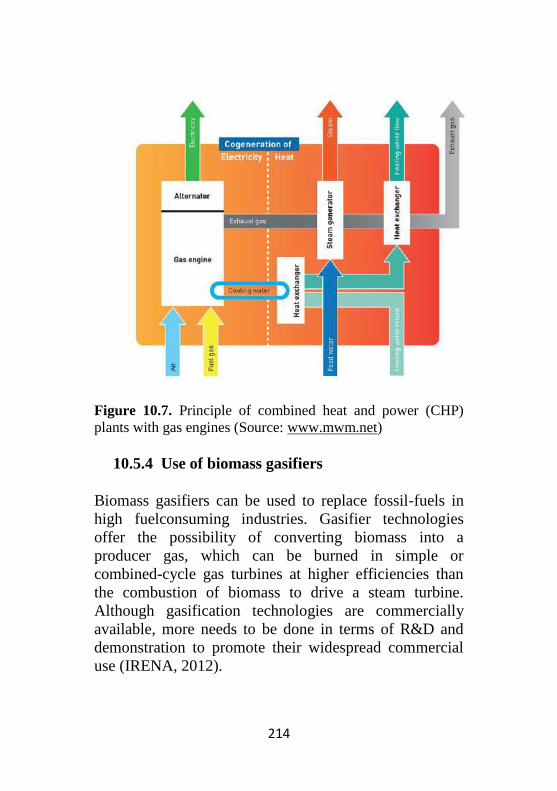
214
Figure 10.7. Principle of combined heat and power (CHP)
plants with gas engines (Source: www.mwm.net)
10.5.4 Use of biomass gasifiers
Biomass gasifiers can be used to replace fossil-fuels in
high fuelconsuming industries. Gasifier technologies
offer the possibility of converting biomass into a
producer gas, which can be burned in simple or
combined-cycle gas turbines at higher efficiencies than
the combustion of biomass to drive a steam turbine.
Although gasification technologies are commercially
available, more needs to be done in terms of R&D and
demonstration to promote their widespread commercial
use (IRENA, 2012).

215
There are three main types of gasification technology:
- Fixed bed gasifiers;
- Fluidised (circulating or bubbling) bed
gasifiers; and
- Entrained flow gasifiers
10.6 Biochemical processing
10.6.1 Fermentation to ethanol
In the food crops the sugars are in the form of starch
which has to be first converted to simpler sugars before
fermentation to ethanol can be accomplished. As the
fermentation is done in presence of water the resulting
ethanol is in a dilute form. To be usable as a fuel, ethanol
must be freed of water (Abbasi et al., 2010).
The big concern in connection with fermentation to
ethanol is the conversion process which is far from clean.
Some scientists even claim that the overall process is so
polluting, and consumes so much energy, that in the
ultimate analysis it generates more greenhouse gas
emissions than the gasoline it replaces as a transportation
fuel.
10.6.2 Production of ethanol from lignocellulosic
crop
With growing opposition to the diversion of food crops
for biofuel production, and growing acceptance of the
fact, that it is not as clean and green process as has been
projected in the past, focus is shifting towards

216
lignocellulosic biomass. Whereas the starch-rich seeds of
corn or maize constitute but a small fraction of the
biomass of the overall plant, all other parts of plants are
full of lignocellulose. Hence for every acre of land
committed to biomass for energy, much greater quantities
of lignocellulosic biomass can be produced than a food
crop (Abbasi et al., 2010).
10.6.3 Anaerobic digestion
It has been used with increasing success in processing
animal manure and wastewaters (Ramasamy et al., 2004),
but has been besieged with operational problems and low
efficiency when used to process phytomass (Ganesh et
al., 2009).
10.6.4 Esterification to biodiesel
The main challenge is to grow oil-rich plants in
sufficiently large quantities per acre of land to maximize
oil yield with minimum of environmental costs (Abbasi
et al., 2010).
10.6.5 Emerging technologies
New technologies for producing biofuels from biomass
are rapidly emerging, including the development of
engineered yeast for increased ethanol yields (Alper et
al., 2006), utilization of new microorganisms for ethanol
production (Seo et al., 2005), pretreatments for cellulosic
digestion (Mosier et al., 2005), fuel cells for converting
sugars directly to electricity (Chaudhury, Lovley, 2003)

217
and catalysts for more efficient conversion of biomass to
syngas (Salge et al., 2006).
10.7 Environmental impacts of biomass energy
10.7.1 Production of biomass
Biomass energy may be carbon neutral but it is not
nutrient neutral
Central to the advocacy of biomass energy is the
argument that it is carbon neutral; it releases only that
carbon back to the atmosphere which was earlier plucked
out form there by photosynthesis. The argument is valid,
even if we consider the fact that at least a part of the
carbon fixed by the biomass in recent years might have
been a fossil fuel origin (Abbasi et al., 2010).
But biomass is not merely a lump of carbon, it contains
nitrogen and several other essential nutrients. Any effort
to intensively cultivate biomass has implications other
than carbon capture (Miller et al., 2007)
Agricultural activities generate more than 75% of emitted
reactive nitrogen compounds (Smil, 1999). Global
atmospheric CO2 concentrations have increased by about
one-third since 1750; during the same period, a 15%
increase in atmospheric N2O concentrations has occurred,
but each molecule of N2O has 300 times greater global
warming potential than a molecule of CO2 (Fixen, West,
2002). Moreover, anthropogenic disruptions in the
nitrogen cycle have led to an estimated 1100% increase

218
in the flux of nonreactive atmospheric nitrogen to
reactive nitrogen compounds (Gitay, Suarez, 2002).
Once converted to a reactive state, nitrogen persists in the
environment, passing through the forms of NH3 N2O
NOx NO3; resulting in impacts such as the
production of ground-level ozone, acidification,
eutrophication, hypoxia, stratospheric ozone depletion,
and climate change (Galloway et al., 2003). Of these
impacts, eutrophication of surface water bodies and
contamination of underground aquifers are among the
most widespread of the environmental impacts of
agriculture. Phosphorous cycles are also effected leading
to eutrophication (Abbasi et al., 2010).
It is not possible to sustain the intensive and repetitive
production of biomass per unit land area envisaged in the
biomass-based energy production programmes on the
basis of the native nitrogen stocks in the soil as they are
insufficient to supply enough nutrients to sustain non-
nitrogen-fixing crops, such as corn. The natural levels of
nitrogen have to be augmented with additional nutrients,
generally in the form of synthetic fertilizer, but soil
organic matter, soil biota, water-holding capacity of the
soil, and numerous microneutrients can not be replaced
with fertilizers (Abbasi et al., 2010).
10.7.2 Land and water resources
Implementing a substantial biomass energy production
program requires large amounts of water resources and
land. In some regions, groundwater is being pumped 10

219
times faster than the natural recharge potential of the
aquifers. Another problem is the water pollution via the
pesticides and fertilizers that are inevitably needed in
sustaining any intensive cultivation (Pimentel et al.,
1992).
The land used for increased biomass production for
energy competes with crops, forests, and urbanization
(Chari, Abbasi, 2005). The removal of biomass from land
and water for energy production programme increases
soil and water degradation, flooding, and removal of
nutrients. It also affects wildlife and the natural biota
(Abbasi et al., 2010).
10.7.3 Soil erosion and water run-off
Biomass energy production projects are likely to
exacerbate soil erosion problems. Soil erosion contributes
significantly in hastening water run-off, thus, retarding
groundwater recharge; the nutrient-rich run-off can harm
the quality of receiving rivers, lakes or estuaries by
causing eutrophication (Abbasi, Chari, 2008).
10.7.4 Nutrient removal and losses
Significant nutrient loss is incurred by the harvesting of
crop residues for biomass energy.
10.7.5 Loss of natural biota, habitats and wildlife
Conversion of natural ecosystems into energy-crop
plantations will change both the habitat and food sources
220
of wildlife and other biota (Abbasi, Chari, 2008).
Alteration of forests and wetlands will reduce many
preferred habitats and mating areas of some mammals,
birds, and other biota. Monoculture plantations of fast-
growing trees reduce the diversity of vegetation and the
value of the areas as habitats for many wildlife species.
These monocultures are less stable than climate forests
and require increased energy inputs in the form of
pesticides and fertilizers to maintain productivity. Trees
in profitable plantations are 2–3 times as dense as those
of natural forests (Rowe at al., 2009).
10.8 Conversion to utilizable energy
Production of biomass is only one dimension of the
biomass-based energy systems; its conversion to
utilizable energy is another and equally important
dimension (Abbasi et al., 2010).
Biomass utilization is a source of not only GHG
emissions but several highly toxic air pollutants (Lewtas,
2007).
10.8.1 Environmental impact of thermal processes
The main environmental problems are:
(a) air pollution emissions of particulates, carbon
oxides, sulphur oxides, nitrogen oxides;
(b) organic emissions dioxin, hydrocarbons, toxic
irritants and carcinogenic compounds;
221
(c) generation of solid wastes bottom ash, flyash
sometimes containing toxic substances with
accompanying pollution problems;
(d) water pollution biological oxygen demand,
chemical oxygen demand, suspended solids, trace metals;
(e) pressure on land and water resources;
(f) household hazards accidental fires;
(g) occupational hazards prolonged exposure to toxic
and corrosive chemicals.
10.8.2 Burning wood
Using wood, wood pellets, and charcoal for heating and
cooking can replace fossil fuels and may result in lower
CO2 emissions overall. At the same time wood smoke
contains pollutants like carbon monoxide and particulate
matter. Modern wood-burning stoves, pellet stoves, and
fireplace inserts can reduce the amount of particulates
from burning wood. Wood and charcoal are major
cooking and heating fuels in poor countries, but if people
harvest the wood faster than trees can grow, it causes
deforestation (EIA).
10.8.3 Use of Biomass for Power and Heat
The use of wood for electricity generation and heat has
grown rapidly in recent years, but its real impact on the
climate and on forests is controversial. Just like the

222
debate around transport biofuels a few years ago, this has
become a very controversial subject with very few areas
of consensus (Chatam House).
Most current support policies for biomass for power and
heat are based on the incorrect assumption that its use is
immediately and completely carbon-neutral. This
assumption underpins many public policies, with the
result that biomass use is expanding, mostly to the
detriment of attempts to limit climate change. In reality
biomass emits more carbon per unit of energy than most
fossil fuels. Only residues that would otherwise have
been burnt as waste or would have been left in the forest
and decayed rapidly can be considered to be carbon-
neutral over the short to medium term (Chatam House).
One reason for the perception of biomass as carbon-
neutral is the fact that, under international greenhouse gas
accounting rules, its associated emissions are recorded in
the land use rather than the energy sector. However, the
different ways in which land use emissions are
accounted for means that a proportion of the emissions
from biomass may never be accounted for (Chatam
House).
10.8.4 Burning municipal solid waste or wood waste
Burning municipal solid waste to produce energy in
waste-to-energy plants means that less waste is buried in
landfills. On the other hand, burning garbage produces
air pollution and releases the chemicals and substances in
the waste into the air. Some of these chemicals can be
223
hazardous to people and the environment if they are not
properly controlled (EIA).
Scrubbers clean emissions from waste-to-energy facilities
by spraying a liquid into the combustion gases to
neutralize the acids present in the stream of emissions.
Fabric filters and electrostatic precipitators also remove
particles from the combustion gases. A waste-to-energy
furnace burns at high temperatures (1000-1100 °C),
which breaks down the chemicals in municipal solid
waste into simpler, less harmful compounds (EIA).
10.8.5 Disposing ash from waste-to-energy plants
Ash can contain high concentrations of various metals
that were present in the original waste. Batteries are the
largest source of lead and cadmium in municipal waste.
Textile dyes, printing inks, and ceramics may also
contain lead and cadmium. Florescent light bulbs contain
small amounts of mercury. Separating waste before
burning can solve part of the problem (EIA).
10.8.6 Collecting landfill gas or biogas
Biogas forms as a result of biological processes in
sewage treatment plants, waste landfills, and livestock
manure management systems. Biogas is composed
mainly of methane and CO2. Many facilities burn the
methane for heat or to generate electricity and it may
replace electricity generation from fossil fuels and can
result in a net reduction in CO2 emissions but burning
methane also produces CO2 and because methane is a

224
stronger greenhouse gas than CO2, the overall
greenhouse effect is lower.
10.8.7. Impact of fermentation processes; liquid
biofuels: ethanol and biodiesel
Biofuels may be carbon-neutral because the plants that
are used to make biofuels (such as corn and sugarcane for
ethanol and soy beans and palm oil trees for biodiesel)
absorb CO2 as they grow and may offset the CO2
emissions when biofuels are produced and burned EIA).
Nevertheless, growing plants for biofuels is
controversial, because the land, fertilizers, and energy for
growing biofuel crops could be used to grow food crops
instead. In some parts of the world, large areas of natural
vegetation and forests have been cut down to grow sugar
cane for ethanol and soybeans and palm oil trees for
biodiesel (EIA).
These activities contribute a lot more to global warming,
over a short term as well as a long term, than the savings
achieved by replacing some portions of gasoline by
ethanol in transportation fuel (Searchinger et al., 2008).
There are alternative sources of biomass that do not
compete with food crops and that use less fertilizer and
pesticides than corn and sugar cane. Ethanol can also be
made from waste paper, and biodiesel can be made from
waste grease and oils and even algae (EIA). There is
increasing advocacy for biofuel production from
lignocelluloses-based energy crops such as switchgrass,
225
willows and poplars, especially using agriculturally
marginal land (Schmer et al., 2008).
Ethanol and gasoline-ethanol blends burn cleaner and
have higher octane ratings than pure gasoline, but they
have higher evaporative emissions from fuel tanks and
dispensing equipment. These evaporative emissions
contribute to the formation of harmful, ground-level
ozone and smog. Gasoline requires extra processing to
reduce evaporative emissions before it is blended with
ethanol. Biodiesel combustion produces fewer sulfur
oxides, less particulate matter, less carbon monoxide, and
fewer unburned and other hydrocarbons, but it does
produce more nitrogen oxide than petroleum diesel
(EIA).
Eventhough life cycle assessment studies show biofuels
favourable in net energy balance (NEB) in comparison to
the fossil fuels they replace (Schmer et al., 2008),
biofuels look less and less attractive if viewed in the total
context of energy balance, GHG emissions,
environmental impact, and humanism (Abbasi et al.,
2008).
References
Abbasi, Tasneem, Abbasi, SA: Biomass energy and the
environmental impacts associated with its production and
utilization; Renewable and Sustainable Energy Reviews,
Volume 14, Issue 3, April 2010, Pages 919-937
Abbasi SA, Chari KB. Environmental management of urban
lakes. New Delhi: Discovery Publishing House; 2008.
226
Alper H, Moxley J, Nevoigt E, Fink GR, Stephanopoulos G.
Engineering yeast transcription machinery for improved
ethanol tolerance and production. Science 2006;314:1565–8.
Chari KB, Abbasi SA. A Study on the aquatic and amphibious
weeds of Oussudu Lake. Hydrology Journal
2005;28(September–December):89–98F.
Chatham House (International Affairs Think Tank)
(https://www.chathamhouse.org/about/structure/eer-
department/environmental-impact-use-biomass-power-and-
heat-project)
Chaudhuri SK, Lovley DR. Electricity generation by direct
oxidation of glucose in mediatorless microbial fuel cells.
Natural Biotechnology 2003;21:1229–32.
EESI: (http://www.eesi.org/topics/bioenergy-biofuels-
biomass/description)
EIA (U.S. Energy Information Administration) www.eia.gov
Eurobserv’er: Biofuels barometer 2017
Eurobserv’er: Solid biomass barometer 2016
Fixen PE. West FB nitrogen fertilizers, meeting contemporary
challenges. AMBIO 2002;31:169–76.
Galloway JN, Aber JD, Erisman JW, Seitzinger SP, Howarth
RW. The nitrogen cascade. BioScience 2003;53L:41–356.
Ganesh PS, Gajalakshmi S, Abbasi SA. Vermicomposting of
the leaf litter of acacia (Acacia auriculiformis): Possible roles
of reactor geometry, polyphenols, and lignin. Bioresource
Technology 2009;100:1819–27.
Gitay HA, Suarez T. In: Watson, Dokken DJ, editor. Climate
Change and Biodiversity. IPCC Technical Paper V. Geneva:
Intergovernmental Panel on Climate Change; 2002.

227
Goldemberg J, Johansson TB. World energy assessment
overview: update. New York: United Nations Development
Programme; 2004.
IRENA: Renewable Energy Technologies: Cost Analysis
Series – Biomass for Power Generation, 2012
Lewtas J. Air pollution combustion emissions: characterization
of causative agents and mechanisms associated with cancer,
reproductive, and cardiovascular effects. Mutation Research—
Reviews in Mutation Research 2007;636:95–133.
McLaughlin SB, Kszos LA. Development of switchgrass
(Panicum virgatum) as a bioenergy feedstock in the United
States. Biomass and Bioenergy 2005; 28:515–35.
Miller SA, Landis AE, Thesis TL. Environmental trade-offs of
biobased production. Environmental Science & Technology
2007;(August):5176–82.
Mosier N, Wyman C, Dale B, Elander R, Lee YY, Holtzapple
M, Ladisch M. Features of promising technologies for
pretreatment of lignocellulosic biomass. Bioresource
Technology 2005;96:673–86.
Pimentel D. Competition for land: development, food, and
fuel. In: Kaliasha MA, Zcker A, Ballew KJ, editors.
Technologies for a Greenhouse-constrained Society, Lewis,
Boca Raton, FL; 1992. p. 325–48.
Raghu S, Anderson RC, Daehler CC, Davis AS, Wiedenmann
RN, Simberloff D, et al. Adding biofuels to the invasive
species fire? Science 2006;313:1742.
Ramasamy EV, Gajalakshmi S, Sanjeevi R, Jithesh MN,
Abbasi SA. Feasibility studies on the treatment of dairy
wastewaters with upflow anaerobic sludge blanket reactors.
Bioresource Technology 2004;93:209–12.
228
Rowe L, Street R, Taylor NR. GIdetifying potential
environmental impacts of large-scale development of
dedicated bioenergy crops in the UK. Renewable and
Sustainable Energy Reviews 2009;13:271–90.
Salge JR, Dreyer BJ, Dauenhauer PJ, Schmidt LD. Renewable
hydrogen from nonvolative fuels by reactive flash
volatilization. Science 2006;314:801–5.
Scheer, Hermann: Handbook of Renewable Energies in the
European Union I-II; Frankfurt am Main, Germany, 2002
Schmer MR, Vogel KP, Mitchell RB, Perrin RK. Net energy
of cellulosic ethanol from switchgrass. USA: Proceedings of
the National Academy of Sciences 2008.
Searchinger T, Heimlich R, Houghton RA, dong F, Elobeid A,
Fabiosa J, et al. Use of croplands for biofuels increases
greenhouse gases through emissions from land-use change
10.1126/Science.1151861. Science 2008;319:1238–40.
Seo JS, Chong H, Park HS, Yoon KO, Jung C, Kim JJ. The
genome sequence of the ethanologenic bacterium Zymomonas
mobilis ZM4. Nature Biotechnology 2005;23:63–8.
Smil V. Nitrogen in crop production: an account of global
flows. Global Biogeochemical Cycles 1999;13:647–62.
US National Energy Education Project
World Bioenergy Association: Global Bioenergy Statistics
2014
World Energy Council: World Energy Resources – Bioenergy
2016.