* solar resource cuf assessment * land site assessment * pv
TRANSCRIPT

1Business Proprietary
* Solar Resource CUF Assessment
* Land Site Assessment
* PV Plant Operation Assessment
AkashFounder, INDIS, LLC
B. Tech (IIT B), MS (USA), MBA (USA)
[email protected] / +91 9718112443 (India)
Salt Lake City, UT (USA) / New Delhi (India)
www.indisllc.com // www.akashcleantech.com

2Business Proprietary
INDIS – Service Offerings* US-based; Established in 2008 in USA
* Active in USA & India (New Delhi)
• Solar Resource (CUF) Assessment
• Using Satellite-based data & GIS tools for
Land Siting & Land Identification
• Detailed Comparative Site Analysis
• Site Water Drainage Management
• Solar PV Plant – Complete Design Services
including Bill of Materials
• Solar PV Plant Operational Troubleshooting
• Solar DPRs & CER Assessment

3Business Proprietary
Questions that will be Answered in this Presentation
Slide 27What are the benefits of using Satellite-GIS tools for land identification?8
Slide 30What are the soiling & cleaning issues for a PV Plant?9
Slide 26What are the potential cheap land areas that are most suitable for solar PV plants
in the top Odisha district?
7
Slide 31What are the kWh generation issues & variations in a PV Plant?10
Slide 24What is the most effective way to identify cheap, available land in a given state or
district for solar PV projects?
6
Slide 20What are the economic consequences of setting up a solar PV plant in the wrong
district or a district chosen using NASA/RETScreen/HOMER tools?
5
Slide 20What is the estimated avg. annual kWh per MW for the top 5 districts in Odisha?4
Slide 18What is the effect of local weather conditions (temp, wind, humidity) on relative
annual CUF & relative ranking of districts in Odisha?
3
Slide 17What are the top 5 districts in Odisha with highest annual CUF?2
Slide 14Which is the most accurate Model to estimate avg. annual CUF?1
Refer to
Slide No.
QuestionNo.

4Business Proprietary
1. Solar Potential & Land Siting[ Which District ? ]

5Business Proprietary
Land Siting - Setting up Solar PV
Plants in Odisha (Orissa)
• Odisha has 30 Districts �Which district to locate Solar PV power plant?– Rank Districts in order of decreasing Annual CUF
– Choose those districts that maximize Annual CUF or Annual kWh/kW
• Using tools like NASA, HOMER, RETScreen will lead to incorrect conclusions
• Solar-CUF model developed by INDIS is more accurate and has been successfully demonstrated at 6 locations across India
6Business Proprietary
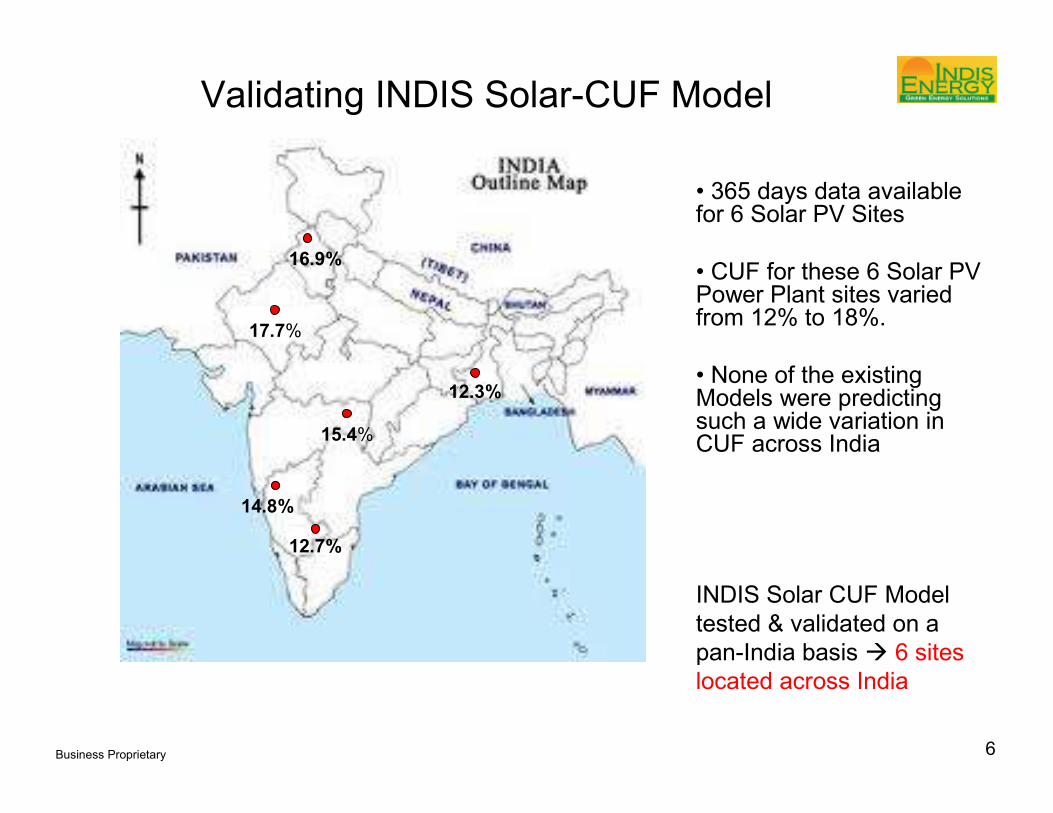
INDIS Solar CUF Model
tested & validated on a
pan-India basis � 6 sites
located across India
12.3%
16.9%
17.7%
15.4%
12.7%
14.8%
• 365 days data available for 6 Solar PV Sites
• CUF for these 6 Solar PV Power Plant sites varied from 12% to 18%.
• None of the existing Models were predicting such a wide variation in CUF across India
Validating INDIS Solar-CUF Model

7Business Proprietary
0.70 - 1.00Age
0.80 – 1.00Grid Uptime
0.95 - 1.00Sun-tracking
0.80 - 1.00Shading
0.80 - 0.995System availability
0.80 - 0.995Soiling
0.98 - 0.993AC wiring
0.97 - 0.99DC wiring
0.99 - 0.997Diodes and connections
0.97 - 0.995Mismatch
0.80 - 0.98Inverter and Transformer
0.80 - 1.00
PV module nameplate
DC rating
Range of ValueDerate Factors
Overall Derating Factor = 0.70 – 0.83
100+ PV Plants Worldwide
CUF = 12.3%
Asansol
Month-wise Generation of Actual 1 MW Plant
Model
Validation

8Business Proprietary
Measured Annual CUF in Asansol (West Bengal)
• Most Models predict higher CUF for Asansol (West Bengal) Site that what is measured
• Most Models are over predicting by 18%
• Odisha has similar radiation / weather patterns like those in Asansol / West Bengal
• A lower Annual CUF is anticipated in Odisha� But How Much Low?
• Find Land Site in Odisha with Highest Annual CUF ���� Which Model to Use?
http://www.cercind.gov.in/2011/Whats-New/PERFORMANCE%20OF%20SOLAR%20POWER%20PLANTS.pdf
WBGEDCL / Asansol 1 MW Solar PV Project - Measured (Actual) CUF vs. Predicted
CUF from various Sources [PR = 0.75]
15.0% 15.1%
16.0%15.8%
15.5%
12.39%12.29%
10%
11%
12%
13%
14%
15%
16%
17%
Measured /
Actual
INDIS CUF
Model
Model 1 -
RETScreen
Model 2 -
HOMER
NREL
Radiation
Map *
Solar GIS * 3Tier *
% CUF
* Estimates based on radiation map –
minor inaccuracies can be expected

9Business Proprietary
Actual (Measured) Data from Operational Solar PV Power Plants
1,740,480*
(total for both)
212Crystalline
Silicon
2*Amritsar,
Punjab
Azure Power #2
(Dec ‘10 – Jun ‘11)
*2nd MW added in Nov
2b
730,500242Crystalline
Silicon
1Asansol,
West
Bengal
West Bengal
WBGEDCL # 2
(Sept ‘10 – Apr ‘11)
1b
12.74%3,348,446365Crystalline
Silicon
3Kolar,
Karnataka
Karnataka Power Corp
Ltd (KPCL)
(Jan ‘10 – Dec ‘10)
6
14.83%3,897,680365Crystalline
Silicon
3Belgaum,
Karnataka
Karnataka Power Corp
Ltd (KPCL)
(Jan ‘10 – Dec ‘10)
5
17.69%7,473,378352Crystalline
Silicon, Thin
Film, CPV
5Khimsar,
Rajasthan
Reliance Industries
(July ‘10 – June ‘11)
4
15.39%1,347,840365a-Si Thin
Films
1Chandrapur,
Maharashtra
Mahagenco
(May ‘10 – Apr ‘11)
3
16.92%1,571,610
365
Crystalline
Silicon
1Amritsar,
Punjab
Azure Power #1
(Dec ‘09 – Nov ‘10)
2a
12.29%1,130,700
365
Crystalline
Silicon
1Asansol,
West
Bengal
West Bengal
WBGEDCL # 1
(Sept ‘09 – Aug ‘10)
1a
Actual
CUF %
Actual
Generation in
Units during
the Period
Days in
Operation
PV
Technology
Used
Nominal
Capacity
(MW)
Project Site
(nearest city)
Project DeveloperNo.
Source: MNRE &
CERChttp://www.mnre.gov.in/pdf/Grid-Solar-Demo-Performance.pdf
http://www.cercind.gov.in/2011/Whats-New/PERFORMANCE%20OF%20SOLAR%20POWER%20PLANTS.pdf

10Business Proprietary
INDIS Solar CUF Model (Prediction) vs. Measured
Grid / Inverter Outage
issues explains the
lower actual CUF
Grid / Inverter Outage
issues explains the
lower actual CUF
Comments
1.1%
1.2%
-0.3%
0.5%
-0.9%
0.1%
Difference
CUF %
8.39%
8.36%
-1.97%
3.49%
-5.12%
0.78%
As % of
Measured CUF
Error Margin
13.81%12.74%Kolar6. KPCL
16.07%14.83%Belagum5. KPCL
17.34%17.69%Khimsar4. Reliance
15.93%15.39%Chandrapur3. Mahagenco
16.05%16.92%Amritsar2. Azure
12.39%12.29%Asansol1. WBGEDCL
INDIS ModelMeasuredLocationDeveloper
CUF %CUF %SiteProject
Avg. Error: 2.32%
Std Dev. In Error: 5.50%
% CUF = 100 x Total kWh Generated Annually
365 * 24 * MW * 1000

11Business Proprietary
NREL Map is predicting >21% Avg. Annual
CUF for most of Orissa (at PR = 1.00)
For Asansol, at PR =0.75, NREL Map
estimates Avg. Annual CUF of ~16%
Other Solar Irradiation Data Sources: NREL Irradiation Map
Orissa
West
Bengal
* Orissa & West Bengal have very
similar solar irradiation profile
Source: NREL GHI India Radiation Map (2009)
NREL GHI Irradiation Map of Eastern India
Asansol

12Business Proprietary
SolarGIS Data is
predicting >21% Avg.
Annual CUF for most of
Orissa (at PR = 1.00)
For Asansol, at PR =0.75,
SolarGIS Data estimates
Avg. Annual CUF of ~16%
Other Solar Irradiation Data Sources: Private Party Providers [ SolarGIS ]
Source: India Solar Handbook, Bridge to India
West
Bengal
Orissa
SolarGIS Irradiation
Map of Eastern India
Orissa & West Bengal have very
similar solar radiation profile

13Business Proprietary
3 Tier Data is
predicting >21% Avg.
Annual CUF for most of
Orissa (at PR = 1.00)
For Asansol, at PR =0.75,
3Tier Data estimates Avg.
Annual CUF of ~16%
Other Solar Irradiation Data Sources: Private Party Providers [ 3Tier ]
Orissa
West
Bengal
Source: http://www.3tier.com/static/ttcms/us/documents/publications/validations/solar_india_validation.pdf
3Tier Irradiation Map of Eastern India
Orissa & West Bengal have very
similar solar irradiation profile

14Business Proprietary
INDIS Solar CUF Model more accurate than most other available models
INDIS Solar CUF Model vs. Other Models
• Orissa & West Bengal have very similar solar irradiation profile
• INDIS Solar CUF Model can be used to accurately estimate Average
Annual CUF for all 30 Districts in Odisha
WBGEDCL / Asansol 1 MW Solar PV Project - Measured (Actual) CUF vs. Predicted
CUF from various Sources [PR = 0.75**]
15.0% 15.1%
16.0% 15.8%15.5%
12.39%12.29%
10%
11%
12%
13%
14%
15%
16%
17%
Measured /
Actual
INDIS CUF
Model
Model 1 -
RETScreen
Model 2 -
HOMER
NREL
Radiation
Map *
Solar GIS * 3Tier *
% CUF
* Estimates based on radiation map –
minor inaccuracies can be expected
** PR = Performance Ratio = PV System Derating Factor

15Business Proprietary
Orissa at a Glance
* Total 30 Districts
NASA tool, RETScreen, HOMER, and INDIS
Solar-CUF Model were run on all 30 districts

16Business Proprietary
Using Conventional Tools to Rank Top 5
Districts for Solar PV Output or Annual CUF
21.88%20.75%20.73%20.75%Bolangir5
21.88%20.75%N/A20.75%Kalahandi4
21.88%20.75%N/A20.75%Sonepur3
21.98%20.85%N/A20.84%Nuapada2
22.00%20.86%20.83%20.86%Malkangiri1
NASA Tool
With Tilt
HOMER
Horizontal Surface
RETScreen
Horizontal Surface
NASA Tool
Horizontal Surface
District in
Odisha
Rank
Annual Average CUF at Performance Ratio = 1.00 for Horizontal Surface &
Tilted Surface (without any Temperature Derating)
• NASA Tool / RET Screen / HOMER � all yield the same top 5 districts
• The % difference in Avg. Annual CUF between the top 5 districts is only 0.55%; top 2
districts are virtually identical (<0.09%) (i.e. within the measurement error)
• A Project Developer might decide to put a power plant in any of these five districts given
the very narrow range of CUF values
• However, doing this will be a costly mistake since the estimated CUF values will be lower
by as much as 4% (or Rs. 1 crore in NPV Loss in Nuapada) or 20% lower (in Kalahandi),
according to the INDIS Solar CUF Model

17Business Proprietary
Top 5 Districts for Solar PV Output or Annual CUF
Using Solar-CUF Model Developed by INDIS
-3.71%
-3.08%
-1.22%
-1.22%
(baseline reference)
% Reduction in
CUF Relative to the
Top Rank
Loss of Rs 93 Lac in
NPV (25 yr)
Loss of Rs 78 Lac in
NPV (25 yr)
Loss of Rs 30 Lac in
NPV (25 yr)
Loss of Rs 30 Lac in
NPV (25 yr)
- Baseline Reference -
Impact on Revenue for
a 5 MW Plant at Rs.
7.50 / kWh bid price
17.76%
[at PR=0.81, CUF = 14.39%]
17.87%
[at PR=0.81, CUF = 14.47%]
18.22%
[at PR=0.81, CUF = 14.76%]
18.22%
[at PR=0.81, CUF = 14.76%]
18.44%
[at PR=0.81, CUF = 14.94%]
Average Annual CUF for an Actual Solar PV
Plant at Performance Ratio = 1.00 (without
any Temperature Derating)
Nuapada
Gajapati
Sundergarh
Puri
Malkangiri
District
Location
5
4
3
2
1
Rank
• Other tools like NASA, RETScreen or Homer are predicting ~22% [@ PR=1] & 17.8% [@ PR=0.81]
• 16% lower CUF predicted using INDIS Solar-CUF Model compared to other Models
• 3 new districts become a contender for the top 5 spots in the INDIS CUF Model

18Business Proprietary
Top 5 Districts for Solar PV Output or Annual CUF
Using INDIS Solar CUF Model after Temp Correction
Loss of Rs 1.2 Crore in NPV (25 yr)
Loss of Rs 1.1 Crore in NPV (25 yr)
Loss of Rs 86 Lac in NPV (25 yr)
Loss of Rs 55 Lac in NPV (25 yr)
- Baseline -
Impact on Revenue for a 5 MW
Plant at Rs. 7.50 / kWh bid
-5.0%
-4.5%
-3.5%
-2.3%
(baseline reference)
% Reduction in Avg. Annual CUF
relative to the Top Rank (after
Temp-Deration)
Rank 5: Gajapati
Rank 4: Nuapada
Rank 3: Puri
Rank 2: Sundergarh
Rank 1. Malkangiri
District
Location
Relative Rankings Change between Top 5 Districts after factoring in the Local Temperature effect
(this was calculated by factoring in typical Tmax, Tmin, Humidity, and Wind Speed trends for each District)
• % Difference in CUF between the Districts increase when local temp trend is factored
• Sundergarh moves to 2nd rank, replacing Puri to the 3rd rank, when local weather conditions are
factored into the derating calculations
• Difference between 1st Rank (Malkangiri) and 2nd Rank (Puri) widens – Loss of Rs 55 Lac in NPV
(25 yr) vs. Rs 30 Lac

19Business Proprietary
1
2
5
3
4
Top 5 Districts for Solar PV
• 1. Malkangiri
• 2. Sundargarh
• 3. Puri
• 4. Nuapada
• 5. Gajapati
Next Step: Identify Land in Malkangiri District

20Business Proprietary
Economic Consequences of Solar PV Plant
at Different District Locations
194 KW / MWRs 14.31 Lac per Year1.254991Bolangir7
194 KW / MWRs 14.31 Lac per Year1.254991Sonepur6
192 KW / MWRs 14.18 Lac per Year1.25720Gajapati5
Rs 17.44 Lac per Year
Rs 13.75 Lac per Year
Rs 13.01 Lac per Year
Rs 12.01 Lac per Year
Rs 10.27 Lac per Year
Penalty Per Year (up
to 2017) Due to
Generation Shortfall
(Bid Price: Rs
7.5/kWh) *
246 KW / MW
185 KW / MW
173 KW / MW
158 KW / MW
132 KW / MW
Additional KW per MW *that has to be Installed to
Generate the Minimum
Generation Target of
1.4976 MU/MW/Yr &
Avoid any Penalty
1.201963
1.264565
1.277086
1.294025
1.323485
At PR = 0.81, Estimated
Avg. Annual
MU/MW/Year
[Minimum Specified in
Odisha Tender: 1.4976
MU/MW/Yr] *
Kalahandi
Nuapada
Puri
Sundergarh
Malkangiri
District
13
4
3
2
1
Rank
*
Economic Consequences of Choosing the Wrong District
(using NASA/RETScreen/HOMER tools):
1. Loss in Tariff-based Revenue; and/or
2. Generation Shortfall Penalty; and/or
3. Additional KW per MW to be installed (Higher CapEx)
* Based on INDIS Solar CUF Model
Nuapada is ranked #2 in NASA, RETScreen, and HOMER.
But, as per INDIS Solar CUF Model, it is ranked #4 and will
generate 4.5% less kWh per MW or Rs 1.1 crore loss in
NPV (25 yr) + yearly penalty of Rs. 13.75 lac until 2017.

21Business Proprietary
Conclusion
• INDIS Solar CUF Model is relatively more accurate than other models �highly relevant for States which have a good Monsoon effect (Kerala, Tamil Nadu, Karnataka, A.P, M.P, U.P, Maharashtra, Goa, Chattisgarh, Orissa, Jharkhand, Bihar, Himachal Pradesh, Punjab, Haryana, Uttarakhand)
• Can be used to accurately rank the top districts to locate a Solar Project
• Variations in annual kWh generation / CUF within a District can be expected due to localized weather patterns – A more accurate estimation of CUF is required after the exact Latitude & Longitude of the actual Site is known
• Economic consequences of choosing a wrong site location: Tariff revenue + Penalty + CapEx� can be >Rs 1 crore

22Business Proprietary
2. Land Identification / Availability[ Where is the Land Available Within the Top Ranked District ? ]

23Business Proprietary
Table I: List of Individual Land-related Attributes
(included in GIS Solution)
Solar Radiation Data (kWh / m2 / day)1
Seismic Zone Map 6
Rainfall / Humidity
Temperature / Wind
Local Climate Patterns5
Grid & Substation Maps 4
Economic Activity (Agriculture / Industry)
Water Bodies
Wasteland
Village
Forest
Local Land Use Patterns3
Contours
Aspect, Orientation, Shape
Elevation
Slope
Land Topography2
List of Individual Site-related Attributes in GIS Analysis
State & District
Administrative Boundary13
Water Bodies & Accessibility12
Railway Lines11
Local Roads
State Highways
National Highways
Roads & Accessibility10
Drought & Aridity Patterns (broad level)9
Soil Map (broad level)8
Any major industrial activity
Aerosols and/or SO4
Pollution Level Map (broad level)7
List of Individual Site-related Attributes in GIS Analysis

24Business Proprietary
ContourSatellite Data Shadow Analysis Slope Aspect
Soil Map
Irradiation Data
Soiling Tendency
Pollution
Forest Fires
Land Use Pattern Water AccessRoad Grid Water Drainage
Use Satellite Data to Identify, Quantify & Rank Various Land Options by
Analyzing Over 20 Different Factors
Zone 2
Zone 3
Zone 3
Site
Seismic Zones Rainfall Patterns
CUTFILL
Cut-Fill Analysis Power Evacuation

25Business Proprietary
INDIS has developed a GIS-based Land risk assessment & Site selection tool to help identity the most optimal Solar Land Sites
within a State or a District. This tool can also be used for Site Identification, Site Planning, Site Leveling, Power Evacuation, and
Water Management.
Factors*: Road; Grid; Water; Local Land
Use Pattern; Land Topography (Slope,
Aspect, Contour); Soil Properties; Soiling
Probability, Local Climate (Temp, Rainfall,
Wind); Local Pollution Levels (industries,
aerosol, SO4); Radiation (optional)
Goa - Solar Site Favorability Index Map
Resolution: 30m
Scale: 1 cm = 400 m
* Business Proprietary
Zoom
in
Beta Version
Favorability Index
Higher (Red) is Better
Goa State MapSite Identified for 20 MW PV Plant
Using Satellite – GIS to Identify Best Land Sites Over a Very Large Area
Example Case Study in Goa

26Business Proprietary
Malkangiri District
Top District (1st Rank)
Potential Cheap Land
Areas for Solar PV Projects
Figures & Areas not to Scale
• Analysis based on preliminary analysis of Satellite-Derived Data
2. Land Identification / Availability
in Malkangiri District in Odisha
• Positive Impact on CapEx, OpEx & Tariff-based Revenue: NPV savings of Rs.
25 lac per MW – Rs 50 lac per MW is estimated by using this detailed approach

27Business Proprietary
Other Advantages of
INDIS Satellite-GIS Tool
• (i) Speed of execution – using satellite data one can quickly scan a whole State to identify the potential sites of interest for a solar project based on land usage;
• (ii) First mover advantage – by being the first buyer of the land before anyone else gets to the local Village, you will probably get land at cheaper rates;
• (iii) Cheaper land rates – by analyzing land use patterns (using satellite data), we can identify land areas that are non-agricultural or far from agricultural sites, i.e. of less economical value – and therefore lower rates.

28Business Proprietary
3. PV Plant Operational Issues[ Maximizing PV Plant Generation ? ]

29Business Proprietary
PV Plant Operational Issues
• Module Mismatch [Product / Performance]
• System Layout (# of Series vs. Parallel)
• Shading
• Soiling
• Cleaning
• Inverter tripping / Grid Outage / Electrical
Issues

30Business Proprietary
PV Plant Operational Issues:
Soiling & Cleaning
Brand New Panel Before Cleaning Bad Cleaning
Good Cleaning Even After Good Cleaning
* Generation Losses
Due to Soiling
3% to 15%
* Location Specific
* Cleaning regime
dependent

31Business Proprietary
PV Plant Operational Issues:
Monthly Generation Patterns
Comparative Generation for Feb Month of 3 PV Plants in Rajasthan
0.6
0.7
0.8
0.9
1
1.1
1.2
1.3
0 1 2 3 4 5 6 7 8 9 10 11 12 13 14 15 16 17 18 19 20 21 22 23 24 25 26 27 28 29 30 31
Day of the Month
Norm
alized Generation (kWh / kWh on
1st day of the Month)
PV Plant #1
PV Plant #2
PV Plant #3

32Business Proprietary
Solar PV Plant Design
• Complete Design Services
– DC Side / AC Side / Module / Inverter
• Bill of Materials
• Upcoming: Cleaning Solutions

33Business Proprietary
Contact us regarding
* INDIS Solar CUF Model for kWh Generation Estimation &
* INDIS GIS Tool for Site Identification & Land Assessment
for existing projects or future Solar PV Projects
* Solar PV Plant Design Services
Akash
Email: [email protected] / [email protected]
Phone: +91 9718112443
New Delhi (India)
THANK YOU
www.indisllc.com // www.akashcleantech.com