© service des relations industrielles (sri)© epfl quelques réalités des start-ups (académiques)...
TRANSCRIPT
© Service des relations industrielles (SRI)© EPFL
Quelques Réalitésdes Start-ups
(académiques)
ventureideas @ EPFL24 novembre 2005
Hervé Lebret

© Service des relations industrielles (SRI)© EPFL
EPFL spin-offs

© Service des relations industrielles (SRI)© EPFL
US University VC backed spin-offs
Source: " A STUDY OF ACADEMIC ENTREPRENEURS USING VENTURE CAPITAL DATA“ Junfu Zhang, PUBLIC POLICY INSTITUTE OF CALIFORNIA (2005)
Range: 1992-2001
These are VC backed startups
EPFL is in the 6-10 range- Snaketech- Cytion- Endoart- IR Microsystems- Dartfish- BeamExpress- Covalys- Innovative SIlicon
Number of Entrepreneurs and Spin-offs from Universities (1992-2001)
Institution Entrepreneurs Spin-offs Institution Entrepreneurs Spin-offs
Stanford 96 91 U Colorado 10 7
MIT 85 76 UIUC 10 6
Harvard 58 53 Brown 9 6
UC Berkeley 38 37 UW-Madison 9 6
CMU 24 19 U Minnesota 8 8
UCSF 20 17 Washington U 8 5
UC San Diego 17 17 Cornell 7 8
Duke 17 14 Northwestern 7 8
U Washington 16 13 Johns Hopkins 7 6
CalTech 15 15 U Arizona 7 6
Columbia 14 12 UCSB 7 6
Michigan 13 13 Princeton 6 5
Yale 13 12 U Penn 6 5
Chicago 13 10 U Pittsburgh 6 4
UT-Austin 12 14 UC Davis 5 6
Boston U 12 10 Purdue 5 5
NYU 12 10 Maryland 5 5
Georgia Tech 11 9 Wake Forest 5 5
USC 11 8 U New Mexico 5 4
UCLA 10 11 Emory 5 3
NC State 10 10

© Service des relations industrielles (SRI)© EPFL
“an academic spin-off is a new firm created to exploit commercially some knowledge, technology or research results developed within a university”from “Toward a Typology of University Spin-offs” Pinay and al. Small Business Economics, 2003
e.g.
Google is a Stanford spin-off, - basic patent belongs to Stanford - technology developed by founders during their work
Yahoo is not a Stanford spin-off: - no IP generated - founders developed it on their spare time
What is an academic spin-off?

© Service des relations industrielles (SRI)© EPFL
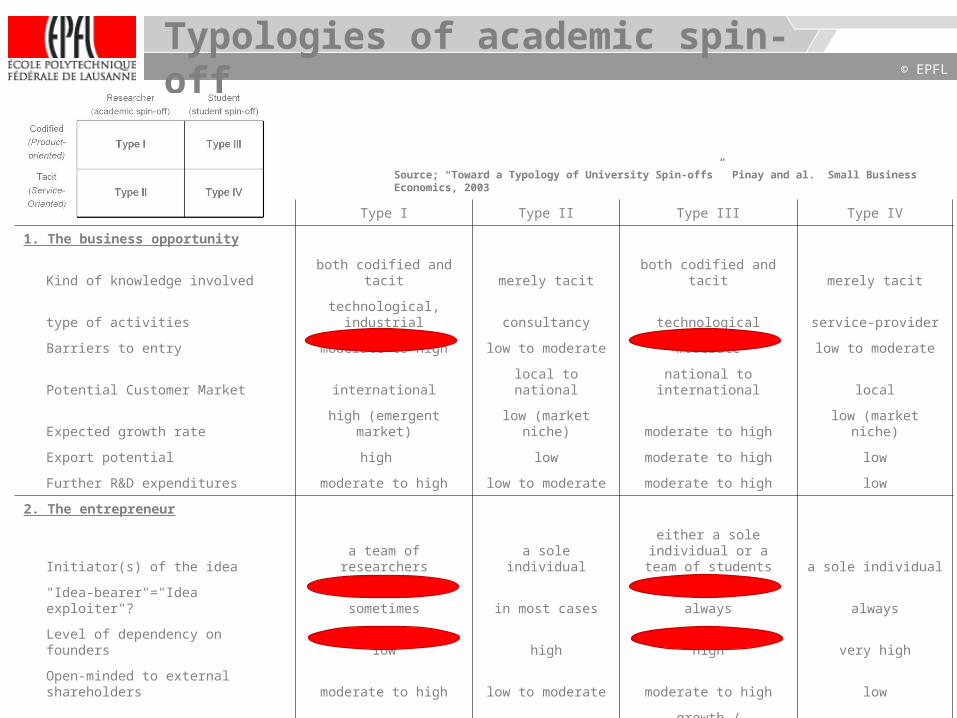
Source: “Toward a Typology of University Spin-offs” Pinay and al. Small Business Economics, 2003
Typologies of academic spin-offs
Individual Status
Researcher
(academic spin-off)
Student
(student spin-off)
Nature of knowledge transferred
Codified
(Product-
oriented)Type I Type III
Tacit
(Service-
Oriented)Type II Type IV
© Service des relations industrielles (SRI)© EPFL
Typologies of academic spin-off
Type I Type II Type III Type IV
1. The business opportunity
Kind of knowledge involved both codified and tacit merely tacit both codified and tacit merely tacit
type of activities technological, industrial consultancy technological service-provider
Barriers to entry moderate to high low to moderate moderate low to moderate
Potential Customer Market international local to national national to international local
Expected growth rate high (emergent market) low (market niche) moderate to high low (market niche)
Export potential high low moderate to high low
Further R&D expenditures moderate to high low to moderate moderate to high low
2. The entrepreneur
Initiator(s) of the idea a team of researchers a sole individualeither a sole individual or a
team of students a sole individual
"Idea-bearer"="Idea exploiter"? sometimes in most cases always always
Level of dependency on founders low high high very high
Open-minded to external shareholders moderate to high low to moderate moderate to high low
Goal pursued growth profitability growth / profitability profitability
3. The required resources
Financial needs (seed funding,…) high low to moderate moderate to high low to moderate
Material needs (equipment, …) moderate to high low moderate low
Intangible needs (networking, …) high low to moderate moderate to high low to moderate
Source; “Toward a Typology of University Spin-offs” Pinay and al. Small Business Economics, 2003

© Service des relations industrielles (SRI)© EPFL
Venture backed entrepreneurs by industry
Industry Nb of entrepreneurs Nb of academic entrepreneurs
Percentage of
academic
entrepreneurs
Materials/chemicals 39 11 28%
Biopharma 618 252 41%
Communication 1441 95 6%
Consumer / business products 71 9 13%
Consumer / business services 2470 76 3%
Electronics 280 23 8%
Energy 12 1 8%
Medical devices 346 51 15%
Semiconductor 442 44 10%
Software 2963 226 8%
Total 10530 903 8%
Industry distribution of start-ups
Source: " A STUDY OF ACADEMIC ENTREPRENEURS USING VENTURE CAPITAL DATA“ Junfu Zhang, PUBLIC POLICY INSTITUTE OF CALIFORNIA (2005)
© Service des relations industrielles (SRI)© EPFL
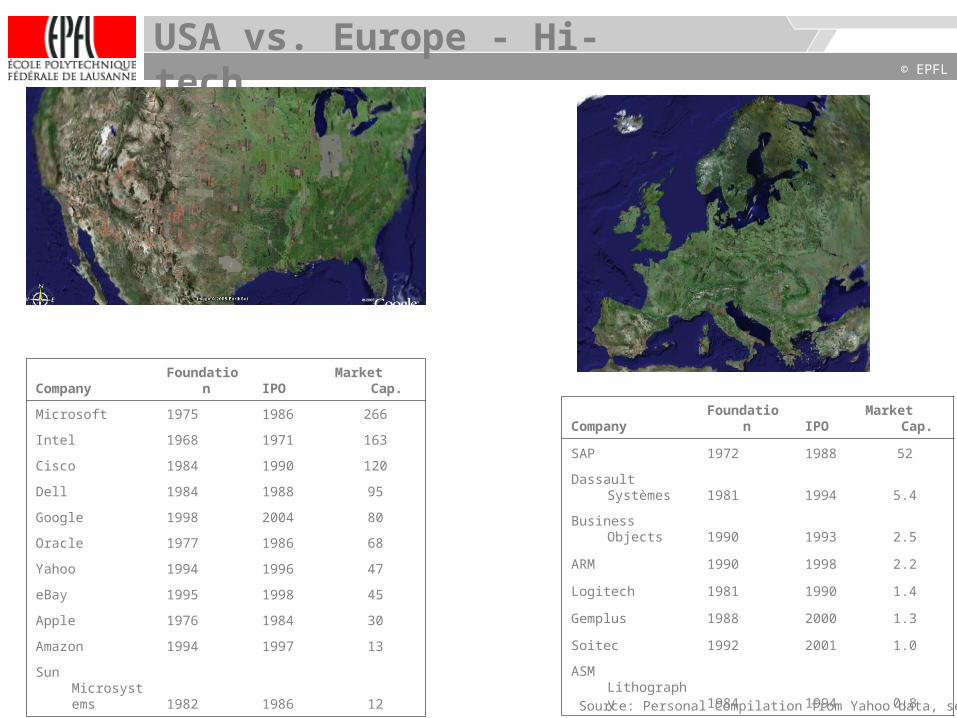
Company Foundation IPO Market Cap.
Microsoft 1975 1986 266
Intel 1968 1971 163
Cisco 1984 1990 120
Dell 1984 1988 95
Google 1998 2004 80
Oracle 1977 1986 68
Yahoo 1994 1996 47
eBay 1995 1998 45
Apple 1976 1984 30
Amazon 1994 1997 13
Sun Microsystems 1982 1986 12
Company Foundation IPO Market Cap.
SAP 1972 1988 52
Dassault Systèmes 1981 1994 5.4
Business Objects 1990 1993 2.5
ARM 1990 1998 2.2
Logitech 1981 1990 1.4
Gemplus 1988 2000 1.3
Soitec 1992 2001 1.0
ASM Lithography 1984 1994 0.8
USA vs. Europe - Hi-tech
Source: Personal Compilation from Yahoo data, sept05
© Service des relations industrielles (SRI)© EPFL
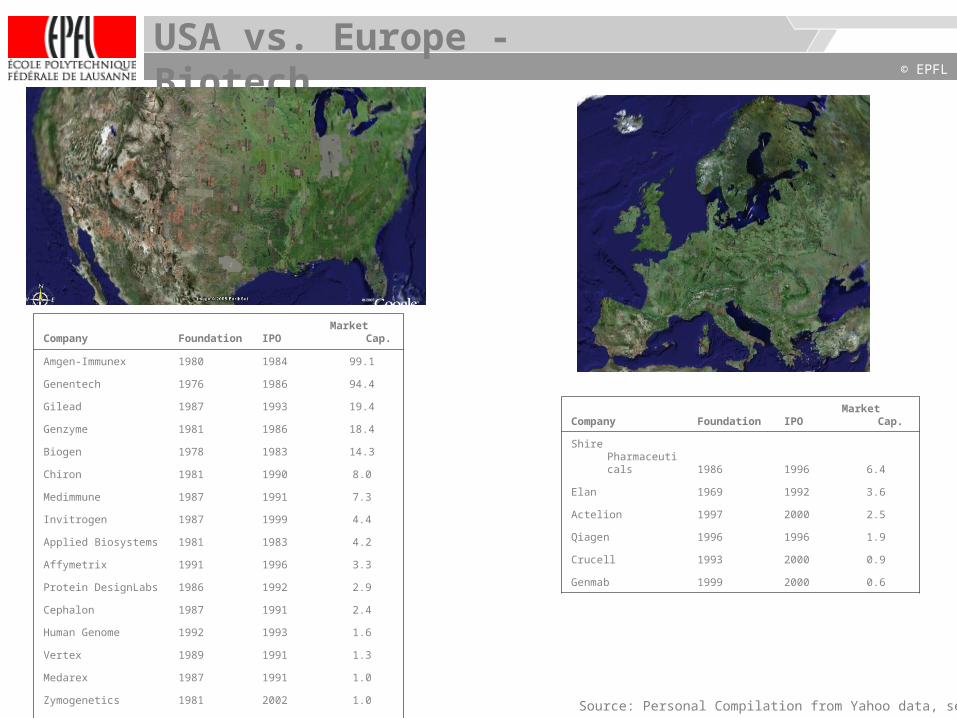
USA vs. Europe - Biotech
Company Foundation IPO Market Cap.
Amgen-Immunex 1980 1984 99.1
Genentech 1976 1986 94.4
Gilead 1987 1993 19.4
Genzyme 1981 1986 18.4
Biogen 1978 1983 14.3
Chiron 1981 1990 8.0
Medimmune 1987 1991 7.3
Invitrogen 1987 1999 4.4
Applied Biosystems 1981 1983 4.2
Affymetrix 1991 1996 3.3
Protein DesignLabs 1986 1992 2.9
Cephalon 1987 1991 2.4
Human Genome 1992 1993 1.6
Vertex 1989 1991 1.3
Medarex 1987 1991 1.0
Zymogenetics 1981 2002 1.0
Celera 1998 1998 0.9
Company Foundation IPO Market Cap.
Shire Pharmaceuticals 1986 1996 6.4
Elan 1969 1992 3.6
Actelion 1997 2000 2.5
Qiagen 1996 1996 1.9
Crucell 1993 2000 0.9
Genmab 1999 2000 0.6
Source: Personal Compilation from Yahoo data, sept05
© Service des relations industrielles (SRI)© EPFL
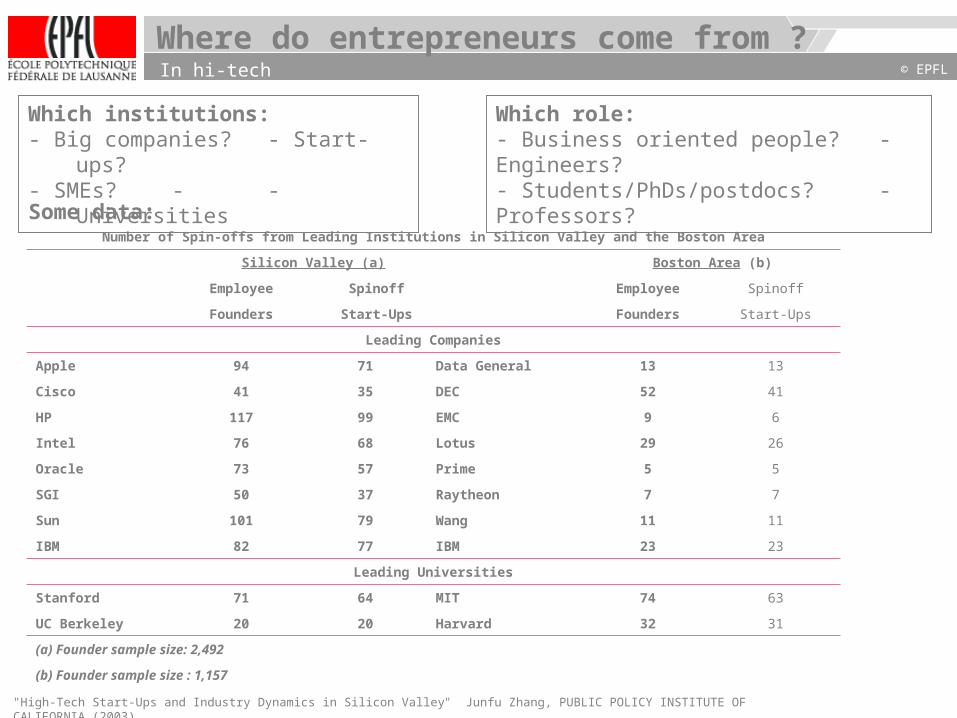
Where do entrepreneurs come from ?
Which institutions:- Big companies? - Start-ups?- SMEs? - - Universities
Which role:- Business oriented people? - Engineers?- Students/PhDs/postdocs? - Professors?
Some data:
"High-Tech Start-Ups and Industry Dynamics in Silicon Valley" Junfu Zhang, PUBLIC POLICY INSTITUTE OF CALIFORNIA (2003)
In hi-tech
Number of Spin-offs from Leading Institutions in Silicon Valley and the Boston Area
Silicon Valley (a) Boston Area (b)
Employee Spinoff Employee Spinoff
Founders Start-Ups Founders Start-Ups
Leading Companies
Apple 94 71 Data General 13 13
Cisco 41 35 DEC 52 41
HP 117 99 EMC 9 6
Intel 76 68 Lotus 29 26
Oracle 73 57 Prime 5 5
SGI 50 37 Raytheon 7 7
Sun 101 79 Wang 11 11
IBM 82 77 IBM 23 23
Leading Universities
Stanford 71 64 MIT 74 63
UC Berkeley 20 20 Harvard 32 31
(a) Founder sample size: 2,492
(b) Founder sample size : 1,157
© Service des relations industrielles (SRI)© EPFL
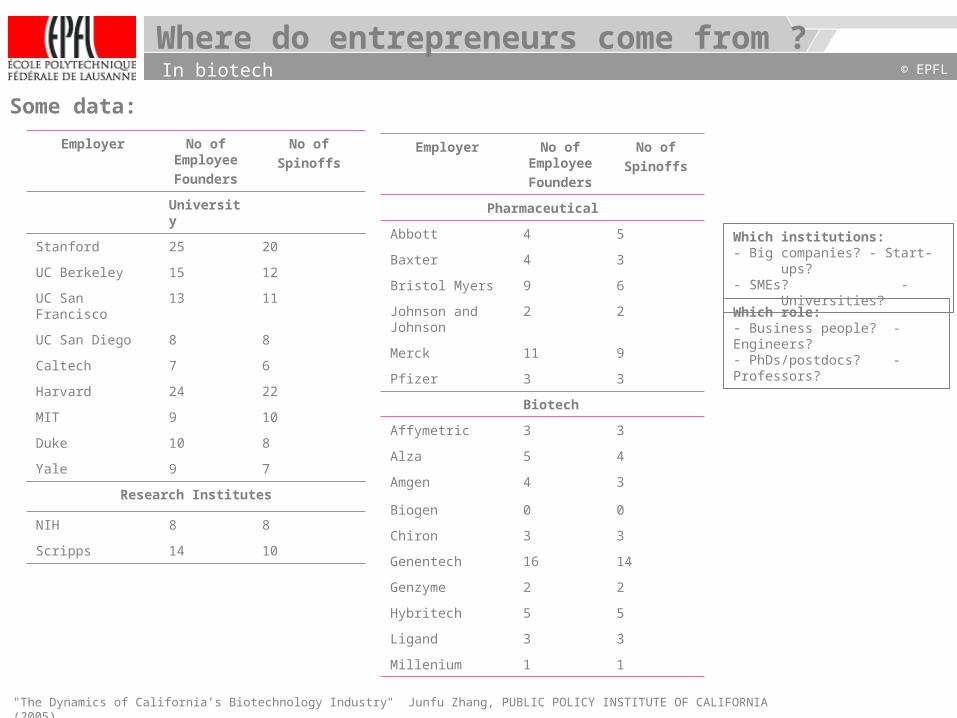
Some data:
"The Dynamics of California’s Biotechnology Industry" Junfu Zhang, PUBLIC POLICY INSTITUTE OF CALIFORNIA (2005)
Where do entrepreneurs come from ?
Employer No of Employee
Founders
No of
Spinoffs
University
Stanford 25 20
UC Berkeley 15 12
UC San Francisco 13 11
UC San Diego 8 8
Caltech 7 6
Harvard 24 22
MIT 9 10
Duke 10 8
Yale 9 7
Research Institutes
NIH 8 8
Scripps 14 10
Employer No of Employee
Founders
No of
Spinoffs
Pharmaceutical
Abbott 4 5
Baxter 4 3
Bristol Myers 9 6
Johnson and Johnson
2 2
Merck 11 9
Pfizer 3 3
Biotech
Affymetric 3 3
Alza 5 4
Amgen 4 3
Biogen 0 0
Chiron 3 3
Genentech 16 14
Genzyme 2 2
Hybritech 5 5
Ligand 3 3
Millenium 1 1
In biotech
Which institutions:- Big companies? - Start-ups?- SMEs? -
Universities?
Which role:- Business people? - Engineers?- PhDs/postdocs? - Professors?
© Service des relations industrielles (SRI)© EPFL
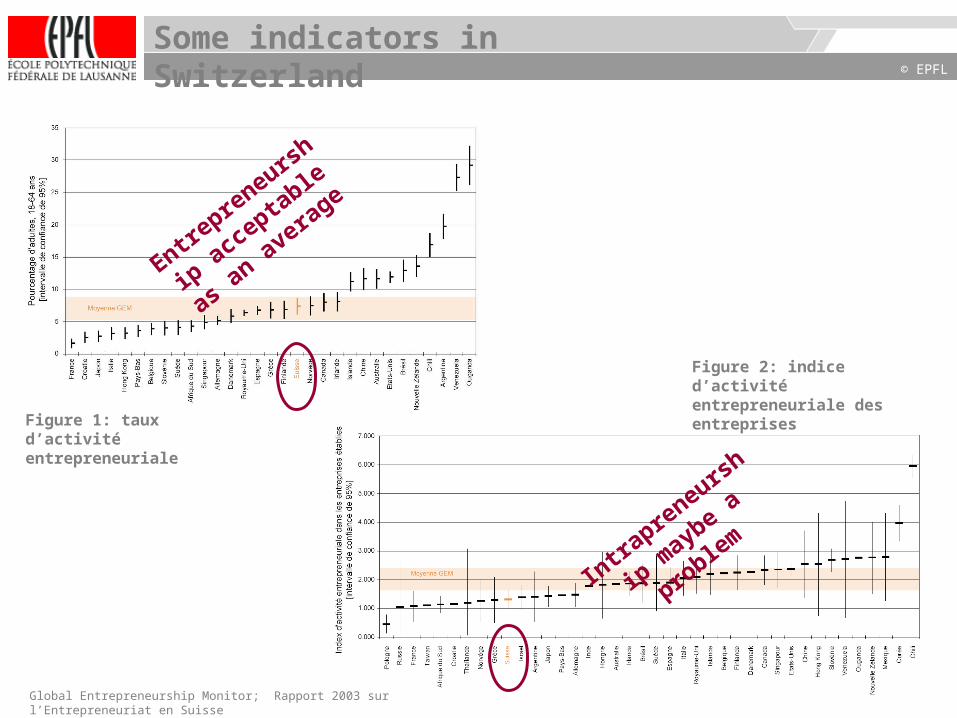
Some indicators in Switzerland
Global Entrepreneurship Monitor; Rapport 2003 sur l’Entrepreneuriat en Suisse
Figure 1: taux d’activité entrepreneuriale
Figure 2: indice d’activité entrepreneuriale des entreprises
Entrepre
neursh
ip a
ccepta
ble
as an a
vera
ge
Intr
apreneurs
hi
p mayb
e a
proble
m
© Service des relations industrielles (SRI)© EPFL
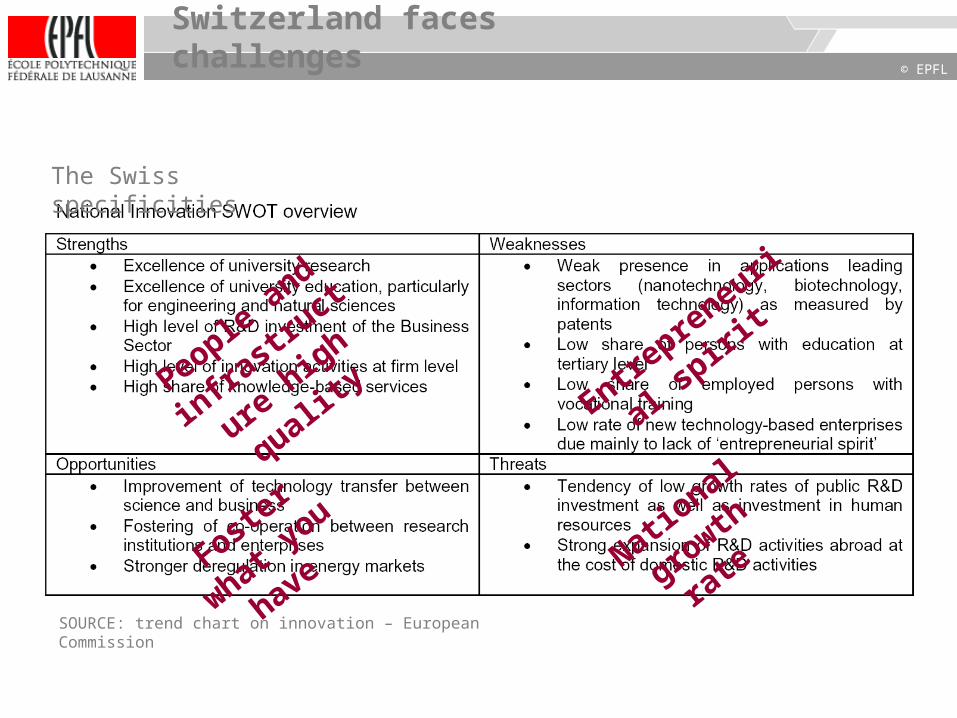
Switzerland faces challenges
SOURCE: trend chart on innovation – European Commission
People a
nd
infr
astru
ctu
re h
igh
quality
Foster
what you
have
Entrepre
neur
ial s
pirit
National
grow
th
rate
The Swiss specificities

© Service des relations industrielles (SRI)© EPFL
Employment in Switzerland
Taille Entreprises % Emplois %
0--4 229'735 75% 526'640 16%
5--9 40'007 13% 316'017 10%
10--49 30'472 10% 680'728 21%
50-99 3'589 1.2% 281'728 9%
100—249 2'004 0.7% 338'135 11%
250+ 1'064 0.3% 1'063'437 33%
Total 306'871 100% 3'206'685 100%66% of jobsSource: OFS RE 2001 et www.pmeinfo.ch
99% of companies
it is well known SMEs are an important component

© Service des relations industrielles (SRI)© EPFL
Jobs in “top100 Swiss” startups
0
5
10
15
20
25
1995 1996 1997 1998 1999 2000 2001 2002 2003
Foundation
# Co
mpa
nies
Source: http://www.inno-swiss.com/fr/rangliste.asp
0
200
400
600
800
1000
1200
1994 1995 1996 1997 1998 1999 2000 2001 2002 2003 2004
Foundation
Em
plo
ym
en
t
0
20
40
60
80
100
120
140
160
180
200
1994 1996 1998 2000 2002 2004
Foundation
Em
plo
ym
en
t
About 10-15 companies per year, creating in average 80 jobs each
© Service des relations industrielles (SRI)© EPFL
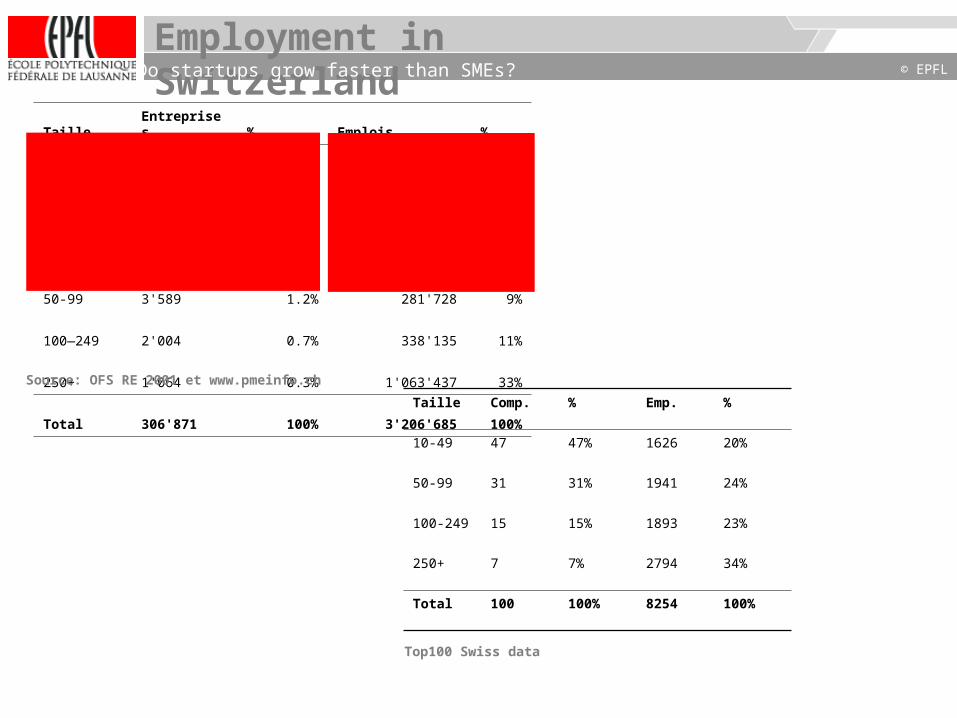
Employment in Switzerland
Taille Entreprises % Emplois %
0--4 229'735 75% 526'640 16%
5--9 40'007 13% 316'017 10%
10--49 30'472 10% 680'728 21%
50-99 3'589 1.2% 281'728 9%
100—249 2'004 0.7% 338'135 11%
250+ 1'064 0.3% 1'063'437 33%
Total 306'871 100% 3'206'685 100%
Source: OFS RE 2001 et www.pmeinfo.ch
Taille Comp. % Emp. %
10-49 47 47% 1626 20%
50-99 31 31% 1941 24%
100-249 15 15% 1893 23%
250+ 7 7% 2794 34%
Total 100 100% 8254 100%
Top100 Swiss data
Do startups grow faster than SMEs?

© Service des relations industrielles (SRI)© EPFL
Company IPO Market Cap. Employees
Microsoft 1986 266 61 000
Intel 1971 163 85 000
Cisco 1990 120 38 000
Dell 1988 95 55 000
Google 2004 80 3 000
Oracle 1986 68 50 000
Yahoo 1996 47 7 600
eBay 1998 45 8 100
Apple 1984 30 15 000
Amazon 1997 13 9 000
Sun Microsystems 1982 12 31 000
Company IPO Cap. Employees
SAP 1988 52 32 000
Dassault Systèmes 1994 5.4 4 400
Business Objects 1993 2.5 3 800
ARM 1998 2.2 1 200
Logitech 1990 1.4 6 900
Gemplus 2000 1.3 5 500
ASM Lithography 1994 0.8 8 200
USA vs. Europe - Hi-tech It’s also about jobs
Source: Personal Compilation from Yahoo data, sept05

© Service des relations industrielles (SRI)© EPFL
USA vs. Europe - Biotech
Company Foundation IPO Market Cap. Employees
Amgen-Immunex 1980 1984 99.1 14 300
Genentech 1976 1986 94.4 7 600
Gilead 1987 1993 19.4 1 600
Genzyme 1981 1986 18.4 7 100
Biogen 1978 1983 14.3 4 300
Chiron 1981 1990 8.0 5 400
Medimmune 1987 1991 7.3 1 800
Invitrogen 1987 1999 4.4 3 800
Applied Biosystems 1981 1983 4.2 4 900
Affymetrix 1991 1996 3.3 900
Protein DesignLabs 1986 1992 2.9 600
Cephalon 1987 1991 2.4 2 200
Human Genome 1992 1993 1.6 800
Vertex 1989 1991 1.3 700
Medarex 1987 1991 1.0 400
Zymogenetics 1981 2002 1.0 400
Celera 1998 1998 0.9 500
Company Foundation IPO Market Cap. Employees
Shire Pharmaceuticals 1986 1996 6.4 1 800
Elan 1969 1992 3.6 1 900
Actelion 1997 2000 2.5 1 000
Qiagen 1996 1996 1.9 1 300
Crucell 1993 2000 0.9 250
Genmab 1999 2000 0.6 200
It’s also about jobs
Source: Personal Compilation from Yahoo data, sept05
© Service des relations industrielles (SRI)© EPFL
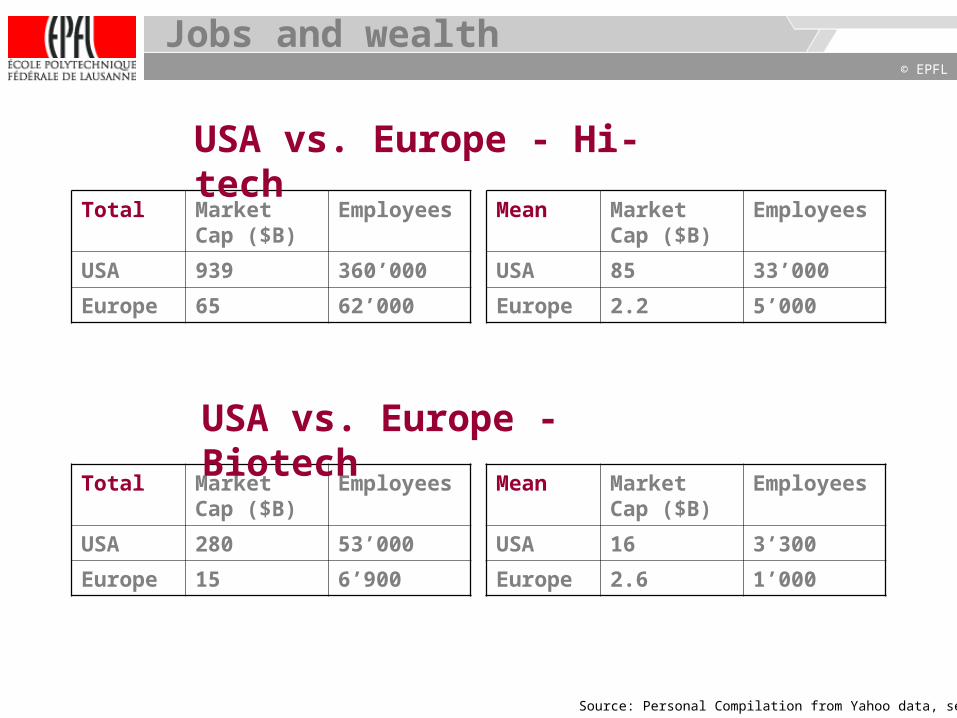
Total Market Cap ($B)
Employees
USA 939 360’000
Europe 65 62’000
Mean Market Cap ($B)
Employees
USA 85 33’000
Europe 2.2 5’000
Total Market Cap ($B)
Employees
USA 280 53’000
Europe 15 6’900
Mean Market Cap ($B)
Employees
USA 16 3’300
Europe 2.6 1’000
USA vs. Europe - Biotech
USA vs. Europe - Hi-tech
Jobs and wealth
Source: Personal Compilation from Yahoo data, sept05

© Service des relations industrielles (SRI)© EPFL
Jobs in California biotech
98% of companies"The Dynamics of California’s Biotechnology Industry" Junfu Zhang, PUBLIC POLICY INSTITUTE OF CALIFORNIA (2005)
45% of jobs
44% of companies
2.5% of jobs

© Service des relations industrielles (SRI)© EPFL
Switzerland vs. US biotech
Size Enterprises % Jobs %
0--4 229'735 75% 526'640 16%
5--9 40'007 13% 316'017 10%
10--49 30'472 10% 680'728 21%
50-99 3'589 1.2% 281'728 9%
100--249 2'004 0.7% 338'135 11%
250+ 1'064 0.3% 1'063'437 33%
Total 306'871 100% 3'206'685 100%
Many Swiss companies remain extremely small

© Service des relations industrielles (SRI)© EPFL
Jobs in tech clusters
"High-Tech Start-Ups and Industry Dynamics in Silicon Valley" Junfu Zhang, PUBLIC POLICY INSTITUTE OF CALIFORNIA (2003)
“5 or more employees” might be an interesting measure

© Service des relations industrielles (SRI)© EPFL
US VC Fund Size ($M) Date
Mayfield XII 375 2005
Battery VII 450 2004
USVP IX 600 2004
Kleiner Perkins XI 400 2004
Sequoia XI 400 2003
Eur. VC Fund Size (€M) Date
Index III 300 2005
Soffinova V 380 2004
TVM VI 240 2004
Atlas VI 600 2001
Amadeus III 345 2000
Top US and European VCs
Source: Personal data
US VCs are bigger but there is money in Europe
0.0
2.0
4.0
6.0
8.0
10.0
12.0
14.0
16.0
1994 1995 1996 1997 1998 1999 2000 2001 2002 2003 2004 2005
Year
$B
US Top 10 Eur Top 40
Some VCs among the biggest

© Service des relations industrielles (SRI)© EPFL
US and European VCs
Source: Amadeus Capital Partners (thanks P. Dutheil)
US VCs are bigger but there is money in Europe
from 2000 to Q3 - 2004
© Service des relations industrielles (SRI)© EPFL
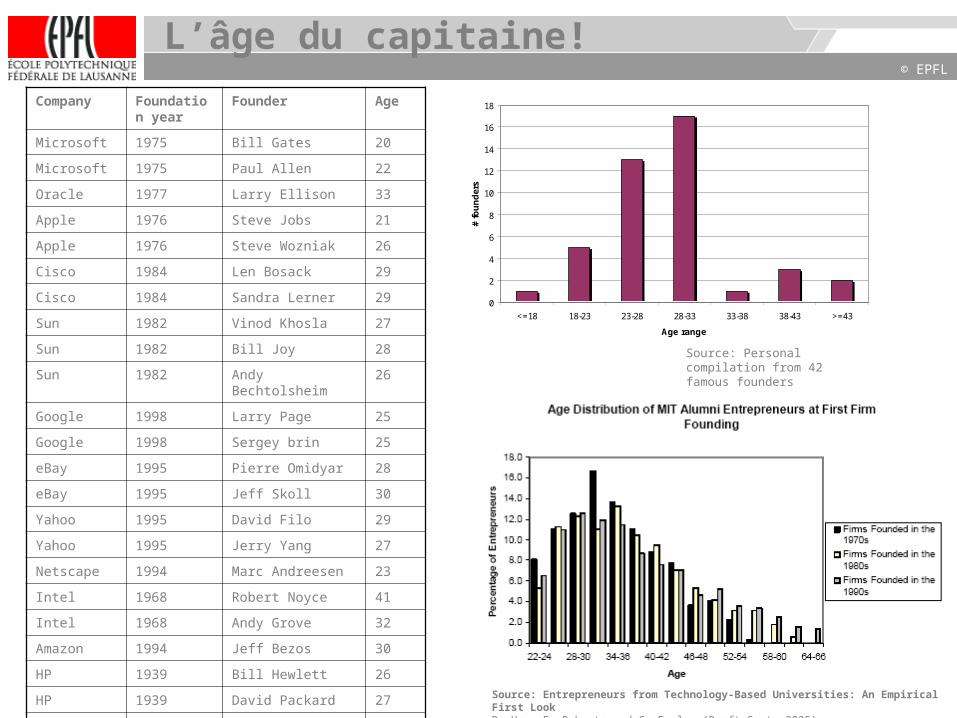
L’âge du capitaine!
Company Foundation year
Founder Age
Microsoft 1975 Bill Gates 20
Microsoft 1975 Paul Allen 22
Oracle 1977 Larry Ellison 33
Apple 1976 Steve Jobs 21
Apple 1976 Steve Wozniak 26
Cisco 1984 Len Bosack 29
Cisco 1984 Sandra Lerner 29
Sun 1982 Vinod Khosla 27
Sun 1982 Bill Joy 28
Sun 1982 Andy Bechtolsheim 26
Google 1998 Larry Page 25
Google 1998 Sergey brin 25
eBay 1995 Pierre Omidyar 28
eBay 1995 Jeff Skoll 30
Yahoo 1995 David Filo 29
Yahoo 1995 Jerry Yang 27
Netscape 1994 Marc Andreesen 23
Intel 1968 Robert Noyce 41
Intel 1968 Andy Grove 32
Amazon 1994 Jeff Bezos 30
HP 1939 Bill Hewlett 26
HP 1939 David Packard 27
Dell 1984 Michael Dell 19
Source: Personal compilation from 42 famous founders
0
2
4
6
8
10
12
14
16
18
<=18 18-23 23-28 28-33 33-38 38-43 >=43
Age range
# fo
un
der
s
Source: Entrepreneurs from Technology-Based Universities: An Empirical First LookD. Hsu, E. Roberts and C. Eesley (Draft Sept, 2005)

© Service des relations industrielles (SRI)© EPFL
Research and Innovation
There has been an going debate on the contradiction indoing quality research and spin-off activity. However:
- many studies show a correlation between number of publications and patenting, between quality research and innovation (e.g. Agrawal 2002, Shane 2000)
- in biotech, many very successful startups are linked to “Star” scientists, e.g. Genentech, Biogen, Amgen have Nobel Prize founders
- who knows Einstein had patents on refrigerators ? (and made money with them!)
- clearly Stanford, Berkeley, MIT, Harvard are among- the best for spin-offs- the best in research ranking
- “a university’ s national academy membership is the most important variable in explaining its number of academic entrepreneurs” Zhang (2005)

© Service des relations industrielles (SRI)© EPFL
A few personal thoughts
It seems there may be an advantage for founders who are- ambitious, i.e. focused on growth- young- living in the USA? (at least know how it works)
It is more difficult but possible to succeed in Europe
Wealth and job creation are the two faces of the same coin
I am not sure the lack of resources is a good explanationfor the low success rate and number in Europe
The world is global, I am not sure what a local leader is
© Service des relations industrielles (SRI)© EPFL
So what?
A few other lessons from the USA, at least from the Silicon Valley…
- Public funding is huge (e.g. $3B for Stem Cell research in California)
- Innovation should be opened (e.g. Saxenian’s work)
- Ambitious projects/people more visible and likely to succeed?
- People keep trying and risk taking is a value
- It may be easier when you are young

© Service des relations industrielles (SRI)© EPFL
“Success is going from one failure to another, without losing your enthusiasm”
Winston Churchill
“Ever tried, ever failed? keep trying! fail better!” Samuel Beckett
“If I am in total control, I am not going fast enough”
Mario Andretti
About failure and risk