鉄鋼・非鉄金属・金属製品統計年報 - meti.go.jp · 平 成 23 年 ―― 2 0 1 1...
TRANSCRIPT

平 成 23 年
―― 2 0 1 1 ――
鉄鋼・非鉄金属・金属製品統計年報
YEARBOOK OF
IRON AND STEEL , NON-FERROUS METALS ,
AND FABR ICATED METALS STATISTICS
経済産業省大臣官房調査統計グループ
Research and Statistics Department
Minister’s Secretariat
Ministry of Economy, Trade and Industry(METI)

序
経済産業省は、我が国鉱工業の生産活動の動向を明らかにする
ため、毎月、生産動態統計調査を実施し、調査結果を公表してお
ります。
本年報は、平成23年に実施した生産動態統計調査のうち、鉄鋼、
非鉄金属及び金属製品に関する調査結果について取りまとめたも
のです。本年報が、各方面で広く活用されることを期待しており
ます。
本年報の発行に当たり、毎月の統計調査に御協力を頂いており
ます皆様に対し厚く御礼申し上げます。
平成24年6月
経済産業省大臣官房調査統計審議官
喜多見 淳一

目 次
序 <非鉄金属編>目次 1. 製品 ……………………………………………………… 109
利用上の注意 (1)非鉄金属 ……………………………………………… 109
(2)アルミニウム …………………………………………… 115
Ⅰ. 概況 (3)非鉄金属製品(伸銅製品) …………………………… 121
1. 一般概況 ………………………………………… 13 (4)非鉄金属製品(アルミニウム圧延製品) ……………… 129
2. 鉄鋼業 …………………………………………… 14 (5)非鉄金属製品(電線・ケーブル) ………………………134
(1)概況 …………………………………………… 14 (6)非鉄金属製品(高純度多結晶シリコン、シリコンウエハ、
(2)業種別動向 …………………………………… 15 はんだ、銅合金塊)…………………… 140
3. 非鉄金属工業 …………………………………… 18 (7)光ファイバ製品 …………………………………………147
(1)概況 …………………………………………… 18 (8)軽金属板製品 ………………………………………… 152
(2)業種別動向 …………………………………… 19 2. 原材料 …………………………………………………… 157
4. 金属製品工業 …………………………………… 22 (1)アルミニウム …………………………………………… 157
(1)概況 …………………………………………… 22 (2)非鉄金属製品(伸銅製品) …………………………… 157
(2)業種別動向 …………………………………… 23 (3)非鉄金属製品(アルミニウム圧延製品) ……………… 158
(4)非鉄金属製品(電線・ケーブル) ………………………159
(5)非鉄金属製品(高純度多結晶シリコン、シリコンウエハ、
Ⅱ. 指数 はんだ、銅合金塊)……………………… 159
1. 生産指数(付加価値額ウェイト)………………… 26 3. 生産能力 ………………………………………………… 160
(1)原指数 ………………………………………… 26 (1)非鉄金属 ……………………………………………… 160
(2)季節調整済指数 ……………………………… 26 (2)非鉄金属製品(伸銅製品)………………………………160
2. 生産者出荷指数 ………………………………… 28 (3)非鉄金属製品(アルミニウム圧延製品) ……………… 160
(1)原指数 ………………………………………… 28 (4)非鉄金属製品(電線・ケーブル) ………………………161
(2)季節調整済指数 ……………………………… 28 (5)光ファイバ製品 …………………………………………161
3. 生産者製品在庫指数 …………………………… 30 (6)軽金属板製品 ………………………………………… 161
(1)原指数 ………………………………………… 30 4. 労務 ……………………………………………………… 162
(2)季節調整済指数 ……………………………… 30 (1)非鉄金属…………………………………………………162
(2)アルミニウム …………………………………………… 162(2)アルミニウム …………………………………………… 162
(3)非鉄金属製品(伸銅製品) …………………………… 162
Ⅲ. 時系列表 (4)非鉄金属製品(アルミニウム圧延製品) ……………… 163
<鉄鋼編> (5)非鉄金属製品(電線・ケーブル)、光ファイバ製品…… 163
1. 製品 ……………………………………………… 32 (6)非鉄金属製品(高純度多結晶シリコン、シリコンウエハ、
(1)銑鉄 …………………………………………… 32 はんだ、銅合金塊)……………………… 163
(2)フェロアロイ …………………………………… 34 (7)軽金属板製品 ………………………………………… 163
(3)粗鋼 …………………………………………… 44
(4)鋼半製品 ……………………………………… 49
(5)鍛鋼品(打放) ………………………………… 51 <金属製品編>(6)鋳鋼品(鋳放) ………………………………… 52 1. 製品 ……………………………………………………… 164
(7)普通鋼熱間圧延鋼材 ………………………… 54 (1)鉄構物及び架線金物 ………………………………… 164
(8)普通鋼冷間仕上鋼材 ………………………… 68 (2)ばね …………………………………………………… 166
(9)めっき鋼材、冷間ロール成型形鋼 …………… 71 (3)弁及び管継手 ………………………………………… 170
(10)特殊鋼熱間圧延鋼材 ……………………… 76 (4)空気動工具、作業工具、のこ刃及び機械刃物 ……… 175
(11)鋼管 ………………………………………… 83 (5)ガス機器、石油機器及び太陽熱温水器 …………… 181
(12)特殊鋼冷間仕上鋼材及び鋳鉄管 ………… 88 (6)粉末や金製品(超硬チップを除く) …………………… 191
(13)鉄鋼加工製品 ……………………………… 92 (7)鍛工品 ………………………………………………… 193
(14)最終鋼材 …………………………………… 96 (8)銑鉄鋳物 ……………………………………………… 197
2. 原材料 ……………………………………………103 (9)可鍛鋳鉄及び精密鋳造品 …………………………… 203
(1)鉄くず ………………………………………… 103 (10)非鉄金属鋳物 ……………………………………… 205
3. 生産能力 …………………………………………107 (11)ダイカスト …………………………………………… 207
4. 労務 ………………………………………………108 2. 原材料 …………………………………………………… 209
(1)月末従事者数 …………………………………108 3. 労務 ……………………………………………………… 210
(2)業態別月末従事者数 …………………………108

Ⅳ. 単年表 11. 鉄鋼加工製品 …………………………………………… 219
<鉄鋼編> (1)受払 …………………………………………………… 219
1. 銑鉄 ………………………………………………211 (2)鋳鉄管用原材料 ……………………………………… 219
(1)生産者分受払 …………………………………211 12. 銑鉄・フェロアロイ・粗鋼・鋼半製品・鍛鋼品・鋳鋼品用
(2)消費者分(鉄鋼業)受払 ………………………211 原材料 …………………………………………………… 220
(3)製鋼用消費内訳 ………………………………211 (1)受払 …………………………………………………… 220
2. フェロアロイ ………………………………………212 (2)鉄鋼部門消費内訳 …………………………………… 220
(1)生産者分受払 …………………………………212
(2)製鋼業者分受払 ………………………………212
3. 粗鋼 ………………………………………………213 <非鉄金属編>(1)受払 ……………………………………………213 1. 非鉄金属 ………………………………………………… 221
(2)生産内訳 ………………………………………213 (1)製品 …………………………………………………… 221
4. 鋼半製品 …………………………………………213 (2)用途別原材料消費・在庫 …………………………… 221
5. 鍛鋼品及び鋳鋼品 ………………………………213 (3)労務 …………………………………………………… 223
6. 普通鋼熱間圧延鋼材 ……………………………214 (4)生産能力・稼働率 …………………………………… 223
(1)生産者分受払 …………………………………214 2. アルミニウム ………………………………………………224
(2)消費内訳(品目別)…………………………… 214 (1)製品 …………………………………………………… 224
(3)圧延鋼材用原材料受払……………………… 214 (2)原材料 ………………………………………………… 224
(4)再生鋼材用原材料(鋼くず、発生品) (3)労務 …………………………………………………… 224
受払 ………………………………………… 214 3. 非鉄金属製品(伸銅製品) ……………………………… 225
7. 普通鋼冷間仕上鋼材、めっき鋼材、冷間 (1)製品 …………………………………………………… 225
ロール成型形鋼(磨棒鋼・線類を除く) ………… 215 (2)原材料 ………………………………………………… 226
(1)受払 ……………………………………………215 (3)労務 …………………………………………………… 226
(2)消費内訳(品目別・用途別)……………………215 (4)生産能力・稼働率 …………………………………… 226
(3)消費内訳(品目別)…………………………… 215 4. 非鉄金属製品(アルミニウム圧延製品) …………………227
(4)原材料(専業者分)…………………………… 215 (1)製品 …………………………………………………… 227
(5)普通鋼圧延鋼材消費内訳 (2)原材料 ………………………………………………… 227(5)普通鋼圧延鋼材消費内訳 (2)原材料 227
(品目別・用途別) …………………………… 215 (3)労務 …………………………………………………… 227
8. 特殊鋼圧延鋼材 …………………………………216 (4)生産能力・稼働率 …………………………………… 227
(1)受払 ……………………………………………216 5. 非鉄金属製品(電線・ケーブル)、光ファイバ製品 ……… 228
(2)熱間圧延鋼材の生産・消費・在庫内訳 (1)-1 製品 …………………………………………………228
(鋼種別・形状別) …………………………… 216 (1)-2 光ファイバ製品販売先内訳 …………………………228
(3)冷間仕上鋼材の生産・消費内訳 (2)電線・ケーブル原材料 …………………………………229
(鋼種別・形状別) …………………………… 217 (3)労務 …………………………………………………… 229
(4)特殊鋼熱間圧延鋼材消費内訳 (4)生産能力・稼働率 …………………………………… 229
(品目別・用途別) …………………………… 217 6. 非鉄金属製品(高純度多結晶シリコン、シリコンウエハ、
(5)特殊鋼冷間仕上鋼材消費内訳 はんだ、銅合金塊)…………………………… 230
(品目別・用途別) …………………………… 217 (1)製品 …………………………………………………… 230
(6)特殊鋼熱間圧延鋼材用原材料……………… 217 (2)原材料 ………………………………………………… 230
9. 鋼管 ………………………………………………218 (3)労務 …………………………………………………… 230
(1)受払 ……………………………………………218 7. 軽金属板製品 …………………………………………… 231
(2)普通鋼熱間鋼管製法別生産内訳 ……………218 (1)製品 …………………………………………………… 231
(3)特殊鋼鋼管生産内訳(製法別・鋼種別) (2)労務 …………………………………………………… 231
及び消費内訳(鋼種別) ………………………218 (3)生産能力 ……………………………………………… 231
(4)原材料(鋼管専業者分) ………………………218
(5)特殊鋼鋼管用原材料の鋼種別消費内訳
(鋼管専業者分) …………………………… 218
10. 磨棒鋼、線類、鋳鉄管 ………………………… 219
(1)受払 ……………………………………………219

<金属製品編> Ⅴ. 参考統計1. 鉄構物及び架線金物 ……………………………232 1. 鉄鋼需給統計 …………………………………………… 244
(1)製品 ……………………………………………232 (1)普通鋼鋼材品目別出荷 ……………………………… 244
(2)労務 ……………………………………………232 (2)普通鋼鋼材部門別出荷 ……………………………… 246
2. ばね ………………………………………………233 (3)普通鋼鋼材部門別、品目別出荷
(1)製品 ……………………………………………233 (平成23年)…………………………………………… 248
(2)労務 ……………………………………………233 (4)普通鋼鋼材部門別、品目別出荷
3. 弁及び管継手 ……………………………………234 (平成22年度)………………………………………… 252
(1)製品 ……………………………………………234 (5)普通鋼鋼材在庫 ……………………………………… 256
(2)労務 ……………………………………………234 (6)特殊鋼鋼材受払(平成23年) …………………………262
4. 空気動工具、作業工具、のこ刃及び機械刃物… 235 2. 鉄鋼生産内訳統計 ……………………………………… 263
(1)製品 ……………………………………………235 (1)鍛鋼品及び鋳鋼品 …………………………………… 263
(2)労務 ……………………………………………235 (2)鋼管 …………………………………………………… 265
5. ガス機器、石油機器及び太陽熱温水器………… 236 3. 非鉄金属需給統計 ……………………………………… 268
(1)製品 ……………………………………………236 (1)品目別需給 …………………………………………… 268
(2)労務 ……………………………………………236 (2)生産業者の品目別受払 ……………………………… 290
6. 粉末や金製品(超硬チップを除く) ………………237 (3)販売業者の出荷 ……………………………………… 292
(1)製品 ……………………………………………237 (4)消費者品目別受払 …………………………………… 294
(2)労務 ……………………………………………237 4. 金属加工統計 …………………………………………… 295
7. 鍛工品 ……………………………………………238 (1)金属熱処理加工 ……………………………………… 295
(1)製品 ……………………………………………238 (2)金属プレス加工 ……………………………………… 296
(2)労務 ……………………………………………238
8. 銑鉄鋳物 …………………………………………239
(1)製品 ……………………………………………239 Ⅵ. 調査票の改正及び品目別接続係数について(2)原材料 …………………………………………239 1. 調査票の改正について ………………………………… 297
(3)労務 ……………………………………………239 2. 品目別接続係数について ……………………………… 299
9. 可鍛鋳鉄及び精密鋳造品……………………… 2409. 可鍛鋳鉄及び精密鋳造品 240
(1)-1 製品 ……………………………………… 240
(1)-2 材質別生産内訳 ……………………………240 Ⅶ. 公表値の修正について …………………………… 305
(2)原材料 …………………………………………240
(3)労務 ……………………………………………240
10. 非鉄金属鋳物 ……………………………………241
(1)製品 ……………………………………………241
(2)原材料 …………………………………………241
(3)労務 ……………………………………………241
11. ダイカスト …………………………………………242
(1)製品 ……………………………………………242
(2)原材料 …………………………………………242
(3)労務 ……………………………………………242

Contents
Introduction <Non-ferrous metals>Contents 1. Products …………………………………………………………109
Notes for Utilization (1) Non-ferrous metals ………………………………………… 109
(2) Aluminum …………………………………………………… 115
Ⅰ. Annual review (3) Non-ferrous metal products (Elongated copper products) …121
1. General conditions …………………………………………… 13 (4) Non-ferrous metal products (Aluminum mill products) ……129
2. Iron and steel industry ……………………………………… 14 (5) Non-ferrous metal products (Electric wires/cables) ……… 134
(1) Annual review ………………………………………………14 (6) Non-ferrous metal products (High-purity polycrystal silicon,
(2) Trends by industrial category……………………………… 15 silicon wafers, solders and copper alloy ingots)… 140
3. Non-ferrous metals industry ………………………………… 18 (7) Optical fiber products ……………………………………… 147
(1) Annual review ………………………………………………18 (8) Light metal plate products ………………………………… 152
(2) Trends by industrial category……………………………… 19 2. Raw materials ……………………………………………………157
4. Fabricated metals industry …………………………………… 22 (1) Aluminum …………………………………………………… 157
(1) Annual review ………………………………………………22 (2) Non-ferrous metal products (Elongated copper products) …157
(2) Trends by industrial category……………………………… 23 (3) Non-ferrous metal products (Aluminum mill products) ……158
(4) Non-ferrous metal products (Electric wires/cables) ……… 159
(5) Non-ferrous metal products (High-purity polycrystal silicon,
Ⅱ. Indices silicon wafers, solders and copper alloy ingots)… 159
1. Indices of Industrial Production (Value Added Weights)…… 26 3. Production capacity …………………………………………… 160
(1) Original Index ………………………………………………26 (1) Non-ferrous metals ………………………………………… 160
(2) Seasonal Adjustment Index ……………………………… 26 (2) Non-ferrous metal products (Elongated copper products) …160
2. Indices of Producer's Shipments …………………………… 28 (3) Non-ferrous metal products (Aluminum mill products) ……160
(1) Original Index ………………………………………………28 (4) Non-ferrous metal products (Electric wires/cables) ……… 161
(2) Seasonal Adjustment Index ……………………………… 28 (5) Optical fiber products ……………………………………… 161
3. Indices of Producer's Inventory ……………………………… 30 (6) Light metal plate products ………………………………… 161
(1) Original Index ………………………………………………30 4. Labor …………………………………………………………… 162
(2) Seasonal Adjustment Index ……………………………… 30 (1) Non-ferrous metals ………………………………………… 162
(2) Aluminum …………………………………………………… 162
(3) Non-ferrous metal products (Elongated copper products) …162(3) Non ferrous metal products (Elongated copper products) 162
Ⅲ. Historical data (4) Non-ferrous metal products (Aluminum mill products) ……163
<Iron and steel> (5) Non-ferrous metal products (Electric wires/cables),
1. Products ……………………………………………………… 32 and optical fiber products ………………………… 163
(1) Pig iron …………………………………………………… 32 (6) Non-ferrous metal products (High-purity polycrystal silicon,
(2) Ferro-alloys ……………………………………………… 34 silicon wafers, solders and copper alloy ingots)……163
(3) Crude steel …………………………………………………44 (7) Light metal plate products ………………………………… 163
(4) Semi-finished steel …………………………………………49
(5) Steel forgings ……………………………………………… 51
(6) Steel castings ……………………………………………… 52 <Fabricated metals>(7) Ordinary hot-rolled steel ………………………………… 54 1. Products …………………………………………………………164
(8) Ordinary cold-finished steel ……………………………… 68 (1) Steel structures and transmission line hardware ……………164
(9) Coated steel and cold-formed steel shapes ……………… 71 (2) Springs ……………………………………………………… 166
(10) Special hot-rolled steel ………………………………… 76 (3) Valves and pipe fittings ………………………………………170
(11) Steel pipes and tubes …………………………………… 83 (4) Pneumatic tools, machinist hand tools, saw blades
(12) Special cold-finished steel, and and knives for machines …………………………………… 175
cast iron pipes and tubes …………………………………88 (5) Gas and oil equipment for cooking, boiling and heating,
(13) Secondary steel products ……………………………… 92 and solar water heaters …………………………………… 181
(14) Finished steel ………………………………………………96 (6) Sintered products (excluding cemented carbide tips)……… 191
2. Raw materials …………………………………………………103 (7) Forgings from billets and bars ………………………………193
(1) Iron and steel scrap ……………………………………… 103 (8) Iron castings …………………………………………………197
3. Production capacity ………………………………………… 107 (9) Malleable iron castings and precision castings …………… 203
4. Labor ………………………………………………………… 108 (10) Non-ferrous metal castings …………………………………205
(1) Number of persons engaged at the end of month ……… 108 (11) Die castings …………………………………………………207
(2) Number of persons engaged at the end of month 2. Raw materials ……………………………………………………209
by business …………………………………………………108 3. Labor …………………………………………………………… 210

Ⅳ. Annual commodities 11. Secondary steel products ……………………………………… 219
<Iron and Steel> (1) Receipts and shipments ………………………………………219
1. Pig iron …………………………………………………………211 (2) Raw materials for cast iron pipes and tubes ……………… 219
(1) Receipts and shipments by producers ……………………211 12. Raw materials for pig iron, ferro-alloys, crude steel,
(2) Receipts and shipments by consumers semi-finished steel, steel forgings, and steel castings …………220
(steel manufacturers) ………………………………………211 (1) Receipts and shipments ………………………………………220
(3) Consumption for steel-making ……………………………211 (2) Consumption of iron and steel sections …………………… 220
2. Ferro-alloys ……………………………………………………212
(1) Receipts and shipments by producers ……………………212
(2) Receipts and shipments by steel manufacturers …………212 <Non-ferrous metals>3. Crude steel ……………………………………………………213 1. Non-ferrous metals …………………………………………… 221
(1) Receipts and shipments ……………………………………213 (1) Products ………………………………………………………221
(2) Breakdown of production …………………………………213 (2) Raw materials …………………………………………………221
4. Semi-finished steel ……………………………………………213 (3) Labor …………………………………………………………223
5. Steel forgings and castings ……………………………………213 (4) Production capacity/Operating ratio ……………………… 223
6. Ordinary hot-rolled steel …………………………………… 214 2. Aluminum …………………………………………………………224
(1) Receipts and shipments by producers ……………………214 (1) Products ………………………………………………………224
(2) Consumption (by commodity) …………………………… 214 (2) Raw materials …………………………………………………224
(3) Raw materials for rolled steel …………………………… 214 (3) Labor …………………………………………………………224
(4) Raw materials for reclaimed steel …………………………214 3. Non-ferrous metal products (Elongated copper products) ……225
7. Ordinary cold-finished, metallic-coated, cold-formed (1) Products ………………………………………………………225
steel sheets and shapes ………………………………………215 (2) Raw materials …………………………………………………226
(1) Receipts and shipments ……………………………………215 (3) Labor …………………………………………………………226
(2) Consumption (by commodity/use) ……………………… 215 (4) Production capacity/Operating ratio ……………………… 226
(3) Consumption (by commodity) …………………………… 215 4. Non-ferrous metal products (Aluminum mill products) ……… 227
(4) Raw materials (by specialized manufacturers) ……………215 (1) Products ………………………………………………………227
(5) Consumption of ordinary rolled steel (2) Raw materials …………………………………………………227
(by commodity/use) ………………………………………215 (3) Labor …………………………………………………………227
8. Special rolled steel ……………………………………………216 (4) Production capacity/Operating ratio ……………………… 227
(1) Receipts and shipments 216 5 Non ferrous metal products (Electric wires/cables)(1) Receipts and shipments ……………………………………216 5. Non-ferrous metal products (Electric wires/cables),
(2) Production/consumption/inventory of hot-rolled steel and optical fiber products ……………………… 228
(by kind of steel/configuration) ………………………… 216 (1)-1 Products ……………………………………………………228
(3) Production/consumption of cold-finished steels (1)-2 Sales breakdown by industrial sector of optical products …228
(by kind of steel/configuration) ………………………… 217 (2) Raw materials of electric wires/cables ………………………229
(4) Consumption of special hot-rolled steel (3) Labor …………………………………………………………229
(by commodity/use) ………………………………………217 (4) Production capacity/Operating ratio ……………………… 229
(5) Consumption of special cold-finished steel 6. Non-ferrous metal products (High-purity polycrystal silicon,
(by commodity/use) ………………………………………217 silicon wafers, solders and copper alloy ingots) ………230
(6) Inventory of raw materials for special hot-rolled steel……217 (1) Products ………………………………………………………230
9. Steel pipes and tubes …………………………………………218 (2) Raw materials …………………………………………………230
(1) Receipts and shipments ……………………………………218 (3) Labor …………………………………………………………230
(2) Production of ordinary hot steel pipes and 7. Light metal plate products ………………………………………231
tubes (by production process) ……………………………218 (1) Products ………………………………………………………231
(3) Production (by production process/kind of steel) (2) Labor …………………………………………………………231
and consumption (by kind of steel) of special steel (3) Production capacity ………………………………………… 231
pipes and tubes………………………………………………218
(4) Raw materials (by manufacturers specializing in
steel pipes and tubes) …………………………………… 218 <Fabricated metals>(5) Consumption of raw materials for special steel pipes and 1. Steel structures and transmission line hardware ………………232
tubes by kind of steel (by manufacturers specializing in (1) Products ………………………………………………………232
steel pipes and tubes) …………………………………… 218 (2) Labor …………………………………………………………232
10. Cold-finished steel bars, wires, and cast iron pipes 2. Springs ……………………………………………………………233
and tubes ………………………………………………………219 (1) Products ………………………………………………………233
(1) Receipts and shipments ……………………………………219 (2) Labor …………………………………………………………233

3. Valves and pipe fittings ………………………………………234 Ⅴ. Reference tables(1) Products ……………………………………………………234 1. Iron and steel supply and demand statistics ……………………244
(2) Labor ………………………………………………………234 (1) Shipments of ordinary rolled steel products by
4. Pneumatic tools, machinist hand tools, saw blades commodity ……………………………………………………244
and knives for machines ………………………………………235 (2) Shipments of ordinary rolled steel products by
(1) Products ……………………………………………………235 industrial sections ……………………………………………246
(2) Labor ………………………………………………………235 (3) Shipments of ordinary rolled steel products by
5. Gas and oil equipment for cooking, boiling and heating, industrial sections and by commodity (CY2011) …………… 248
and solar water heaters…………………………………………236 (4) Shipments of ordinary rolled steel products by industrial
(1) Products ……………………………………………………236 sections and by commodity (FY2010) ……………………… 252
(2) Labor ………………………………………………………236 (5) Inventory of ordinary rolled steel products …………………256
6. Sintered products (excluding cemented carbide tips) ………237 (6) Receipts and shipments of special steel products (CY2011) …262
(1) Products ……………………………………………………237 2. Production by kind of iron and steel …………………………… 263
(2) Labor ………………………………………………………237 (1) Steel forgings and steel castings …………………………… 263
7. Forgings from billets and bars ……………………………… 238 (2) Steel pipes and tubes ……………………………………… 265
(1) Products ……………………………………………………238 3. Non-ferrous metal supply and demand statistics ………………268
(2) Labor ………………………………………………………238 (1) Supply and demand by commodity ………………………… 268
8. Iron castings ………………………………………………… 239 (2) Producers' receipts and shipments by commodity……………290
(1) Products ……………………………………………………239 (3) Shipments of sellers ………………………………………… 292
(2) Raw materials ………………………………………………239 (4) Consumers' receipts and shipments …………………………294
(3) Labor ………………………………………………………239 4. Metal processing statistics …………………………………… 295
9. Malleable iron castings and precision castings ………………240 (1) Metal heat-treatment ……………………………………… 295
(1)-1 Products …………………………………………………240 (2) Metal stamping ………………………………………………296
(1)-2 Production breakdown by material ………………………240
(2) Raw materials ………………………………………………240
(3) Labor ………………………………………………………240 Ⅵ. Revision of questionnaires 10. Non-ferrous metal castings ………………………………… 241 and Continuity Coefficients by Commodity
(1) Products ……………………………………………………241 1. Revision of questionnaires ………………………………………301( ) q
(2) Raw materials ………………………………………………241 2. Continuity Coefficients by Commodity …………………………303
(3) Labor ………………………………………………………241
11. Die castings ……………………………………………………242
(1) Products ……………………………………………………242
(2) Raw materials ………………………………………………242
(3) Labor ………………………………………………………242

利 用 上 の 注 意
この年報は、統計法に基づく経済産業省生産動態統計調査規則(基幹統計)により実施された鉄鋼製品、
非鉄金属製品及び金属製品に関する調査の集計結果を編集公表するものです。
1. 調査の対象
この年報に収録した調査票の種類及び調査の範囲は、次表のとおりです。
調 査 票 名 調査の範囲 鉄鋼月報(その1)銑鉄・フェロアロイ・粗鋼・鋼半製品・鍛鋼品・鋳鋼品
鉄鋼月報(その2)普通鋼熱間圧延鋼材
鉄鋼月報(その4)普通鋼冷間仕上鋼材(線類を除く)・めっき鋼材(線
類を除く)・冷間ロール成型形鋼
鉄鋼月報(その5)特殊鋼圧延鋼材
鉄鋼月報(その6)鋼管
鉄鋼月報(その7)磨棒鋼・線類・鋳鉄管・鉄鋼加工製品
鉄鋼月報(その9)労務・設備
鉄構物及び架線金物月報
ばね月報
弁及び管継手月報
空気動工具、作業工具、のこ刃及び機械刃物月報
ガス機器、石油機器及び太陽熱温水器月報
粉末や金製品月報(超硬チップを除く)
鍛工品月報
銑鉄鋳物月報
可鍛鋳鉄及び精密鋳造品月報
非鉄金属鋳物月報
ダイカスト月報
軽金属板製品月報
アルミニウム月報
非鉄金属製品月報(伸銅製品)
非鉄金属製品月報(高純度多結晶シリコン、シリコンウエハ、
はんだ、銅合金塊)
非鉄金属製品月報(アルミニウム圧延製品)
非鉄金属製品(電線・ケーブル)、光ファイバ製品月報
非鉄金属月報
全ての事業所
〃
〃
〃
〃
〃
(鉄鋼加工製品は従事者
20人以上)
全ての事業所
従事者30人以上の事業所
(鉄構物は50人以上)
従事者30人以上の事業所
〃
従事者30人以上の事業所
(作業工具は20人以上)
従事者50人以上の事業所
従事者30人以上の事業所
従事者20人以上の事業所
〃
従事者30人以上の事業所
従事者20人以上の事業所
(銅合金鋳物は10人以上)
従事者30人以上の事業所
従事者20人以上の事業所
全ての事業所
〃
〃
全ての事業所
従事者30人以上の事業所
(光ファイバ製品は全ての事業所)
全ての事業所
2. 調査項目の定義について
製 品
① 生 産
調査の対象事業所(以下「調査対象」という。)が、国内で実際に生産(受託生産を含む。)した製品の
数量をいいます。ただし、仕掛中の半製品は除きます。
なお、生産には調査対象で他の製品に加工又は消費するために生産したものも含みます。
(生産金額)
生産数量を契約価格又は生産者販売価格により評価した金額をいいます。
ここでいう契約価格又は生産者販売価格とは、企業の販売価格から積込み料、運賃、保険料、その
他の諸掛かりを除き、消費税を含めたものです。
② 受 入
調査対象が生産している調査品目と同一の製品で、工場又は倉庫に次の事由により受入れた数量
をいいます。
ア.他企業から購入したもの(輸入を含む)
イ.同一企業内の他工場から受入れたもの
ウ.委託生産品及び委託加工品を委託先の工場(下請工場を含む。)から受入れたもの
エ.返品(戻入れ)されたもの

③ 消 費
調査対象が他の製品の原材料、加工用として消費した数量をいいます。
④ 出 荷
調査対象及び調査対象が契約の主体となって借受けている倉庫又は保管場所から、実際に出荷し
た数量をいいます。
なお、出荷数量は次の事由により、「販売」、「その他」に区分しています。
(販 売)
ア.販売業者又は消費者である他企業に直接販売したもの
イ.販売することを目的として本社、営業所又は中継地などに出荷したもの
ウ.受託生産品を販売業者(消費者を含む。)である委託者へ出荷したもの
エ.同一調査品目を生産していない同一企業内の他工場へ出荷したもの(全くの転売品)
(その他)
ア.同一調査品目を生産している同一企業内の他工場に出荷したもの
イ. 同一企業内の他工場へ原材料として出荷したもの
ウ.委託生産又は委託加工のための原材料として出荷したもの
エ.受託生産品又は受託加工品を同一調査品目を生産している生産業者(委託者)へ出荷したもの
オ.自家使用したもの(自工場施設などへの設備投資、見本用、贈答用、試験研究用など)
カ.自己消費したもの(ただし、消費を調査していない場合のみ。)
(販売金額)
販売数量を契約価格又は生産者販売価格により評価した金額をいいます。
ここでいう契約価格又は生産者販売価格とは、企業の販売価格から積込み料、運賃、保険料、そ
の他の諸掛りを除き、消費税を含めたものです。
⑤ 月末在庫
調査対象が生産した調査品目の製品及び受入品で、調査対象及び調査対象が契約の主体となって
借受けている倉庫又は保管場所に、実際に保管してある製品の数量をいいます。
3. その他
(1) この年報で使用している記号の区分は下記のとおりです。
「0」 は単位未満 「-」 は実績なし 「…」 は不詳
「r」 は訂正 「x」 は秘匿 「▲」 はマイナス
(2) 単位未満を四捨五入しているため、内訳の積み上げと合計が一致しない場合があります。
(3) この年報に掲載された統計を他に転載するときは、必ず「鉄鋼・非鉄金属・金属製品統計年報(経済産
業省)」による旨を明記してください。
(4) 平成23年1月分から調査票の一部を改正しました。詳細については「調査票の改正について」(297
ページ)を参照してください。
(5) 調査対象事業所の見直しなどにより、数値の接続しない品目があります。詳細については 「品目別接
続係数について」(299ページ)を参照してください。
4. 問い合わせ先
この年報の内容についての問い合わせは、下記あてにご連絡ください。
〒100‐8902 東京都千代田区霞が関一丁目 3 番 1 号
経済産業省 大臣官房 調査統計グループ 鉱工業動態統計室
化学・金属班
電話(03)‐3501‐1511 大代表 内線 2866~2868
E-mail : [email protected]

Notes for Utilization The objective of this Yearbook is to compile and publish the results of research concerning Iron and steel, Non-ferrous metals,
and Fabricated metals products, which is conducted under the METI's Regulations for the Current Survey of Production (Fundamental Statistics ) based on the Statistics Law. 1. Subject of the survey The kinds of questionnaires and scope of the survey in this report are as in the following table.
Questionnaire name Survey scope Iron and steel (No. 1) Pig iron, ferro-alloys, crude steel, semi-finished steel, steel forgings, and steel castings Iron and steel (No. 2) Ordinary hot-rolled steel Iron and steel (No. 4) Ordinary cold-finished steel, metallic coated steel, and cold-formed steel sheets and shapes Iron and steel (No. 5) Special rolled steel Iron and steel (No. 6) Steel pipes and tubes Iron and steel (No. 7) Cold-finished steel bars, wires, cast iron pipes, and secondary steel products Iron and steel (No. 9) Labor and production equipment Steel structures and transmission line hardware Springs Valves and pipe fittings Pneumatic tools, machinist hand tools, saw blades and knives for machines Gas and oil equipment for cooking, boiling and heating, and solar water heaters Sintered products (excluding cemented carbide tips) Forgings from billets and bars Iron castings Malleable iron castings and precision castings Non-ferrous metal castings Die castings Light metal plate products Aluminum Non-ferrous metal products (Elongated copper products) Non-ferrous metal products (High-purity polycrystal silicon, silicon wafers,
solders and copper alloy ingots) Non-ferrous metal products (Aluminum mill products) Non-ferrous metal products (Electric wires / cables),and optical fiber products Non-ferrous metals
All business establishments All business establishments All business establishments All business establishments All business establishments All business establishments (For Secondary steel products,
Business establishments with 20 or more employees)
All business establishments Business establishments with 30 or
more employees (For Steel structure, Business
establishments with 50 or more employees)
Business establishments with 30 or more employees
Business establishments with 30 or more employees
Business establishments with 30 or more employees
(For Machinist hand tools, Business establishments with 20 or more employees)
Business establishments with 50 or more employees
Business establishments with 30 or more employees
Business establishments with 20 or more employees
Business establishments with 20 or more employees
Business establishments with 30 or more employees
Business establishments with 20 or more employees
(For Alloy castings, Business establishments with 10 or more employees)
Business establishments with 30 or more employees
Business establishments with 20 or more employees
All business establishments All business establishments All business establishments All business establishments Business establishments with 30 or
more employees (For Optical fiber products, All business establishments)
All business establishments 2. The definition of survey items Product ① Production The quantity of products actually produced (including produced as a consignee) by the establishment that is the object
of ‘the survey (hereafter, ‘the survey object’). However, ‘products in process’ shall be excluded. Besides, ‘Production’ includes products as process goods or for consumption for other products in ‘the survey object’.

(Production value) Value as evaluated by the contract price or producer’s selling price
In this case, ‘contract price’ or ‘producer’s selling price’ are the enterprise’s selling prices excluding shipping charges, transport costs, insurance costs and other costs, and including consumption tax.
② Reception The quantity of products received by the factories or warehouses of ‘the survey object’ that produces the same survey
commodity items due to the following circumstances: a. Purchase from other enterprises (including imports) b. Reception from other factories belonging to the same enterprise c. The commissioned products and commission-manufactured products received from the consignees (including
subcontracted factories) d. Returned products
③ Consumption The quantity of products consumed as materials, process goods in ‘the survey object’ ④ Shipment The quantity of products actually shipped from ‘the survey object’s’ warehouse or rental warehouse which ‘the survey
object’ mainly uses Besides, the quantity of products is distinguished as ‘Sales’ or ‘Other’ in the following ways: (Sales) a. Products directly sold to distributors or other consumer enterprises b. Products shipped to the headquarters/sales offices or relay points for the purpose of selling c. Commissioned products shipped to consigners that are sales dealers (including consumers) d. Products shipped to other factories of the same enterprise which are not producing the same survey commodity
(Other) a. Products shipped to other factories of the same enterprise which are producing the same products as the survey
commodity b. Products shipped to other factories of the same enterprise as materials c. Products shipped as materials for use in the commissioned products or commission-manufactured products d. The commissioned products or commission-manufactured products shipped to the manufacturers (consigners) that
are producing the same survey commodity e. Products used in-house (equipment investment for an enterprise’s own factory, use for samples, use for gifts, use in
testing and research) f. Products consumed in-house (only in the case of the no consumption survey item)
(Sales Value) Value as evaluated by the contract price or producer’s selling price In this case, ‘contract price’ or ‘producer’s selling price’ are the enterprise’s selling prices excluding shipping charges,
transport costs, insurance costs and other costs, and including consumption tax. ⑤ Inventory at the end of the month The quantity of products produced or received by ‘the survey object’ which are actually stored in ‘the survey object’s’
warehouses and rental warehouses which ‘the survey object’ mainly uses 3. Others (1) Abbreviations used in this report are as follows:
「0」 Less than unit after rounding 「-」 No results 「・・・」 Unknown 「r」 Revised 「x」 Conceal 「▲」 Minus
(2) Figures may not exactly equal totals because of rounding. (3) When reprinting the statistics contained in this report in other printed matter, the fact that they are based on the “Yearbook of Iron and Steel, Non-ferrous Metals, and Fabricated Metals Statistics(Ministry of Economy, Trade and Industry)” must be clearly indicated.
(4) Some questionnaires have been revised from January 2011. Please refer to ‘Revision of questionnaires’ (page301) for further details.
(5) Because of the review of the scopes, there may be discontinuity for some consecutive data of the commodity. Please refer to ‘Continuity Coefficients by Commodity’ (page303) for details.
4. Contact information If there are any questions about the contents of this report, please contact the following address. Chemical and Metal Group, Office of Current Survey for Mining and Manufacturing, Research and Statistics
Department, Minister’s Secretariat Ministry of Economy, Trade and Industry 1-3-1 Kasumigaseki, Chiyoda-ku, Tokyo 100-8902, Japan Tel: +81-3-3501-1511, Extension 2866-2868

概 況
Ⅰ 概 況
1.一般概況
23年の生産は2年ぶりの低下
平成23年の鉱工業生産指数は、92.2(前年比▲2.3%)と2年ぶりの低下となった。 四半期別の動向をみると、1~3月期は輸送機械工業、情報通信機械工業、非鉄金属工
業等が低下したことにより前期比▲1.5%の低下となった。4~6月期は輸送機械工業、電
子部品・デバイス工業、情報通信機械工業等が低下したことにより同▲4.2%の低下となっ
た。7~9月期は輸送機械工業、情報通信機械工業、一般機械工業等が上昇したことによ
り同 5.4%の上昇となった。10~12月期は輸送機械工業、パルプ・紙・紙加工品工業、
プラスチック製品工業等が上昇したことにより同 0.4%の上昇となった(第1図、第1表)。
第1図 鉱工業指数の推移
(平成 17 年=100、季節調整済)
70
80
90
100
110
120
130
140
150
19 20
(
21
暦
22
年
23
)
年 Ⅰ
└
Ⅱ
19
Ⅲ
年
Ⅳ
┘
Ⅰ
└
Ⅱ
20
Ⅲ
年
Ⅳ
┘
Ⅰ
└
Ⅱ
21
Ⅲ
年
Ⅳ
┘
Ⅰ
└
Ⅱ
22
Ⅲ
年
Ⅳ
┘
Ⅰ
└
Ⅱ
23
Ⅲ
年
Ⅳ
┘
生産
出荷
在庫
在庫率
第1表 鉱工業指数の推移(平成 17 年=100、季節調整済)
1~3月期 4~6月期 7~9月期 10~12月期 1~3月期 4~6月期 7~9月期 10~12月期
生 産 81.1 94.4 92.2 94.6 95.3 94.3 94.2 92.8 88.9 93.7 94.1(前期(年)比) ▲ 21.9 16.4 ▲ 2.3 7.4 0.7 ▲ 1.0 ▲ 0.1 ▲ 1.5 ▲ 4.2 5.4 0.4(前年同期比) - - - 28.0 21.3 14.0 5.9 ▲ 1.3 ▲ 5.8 ▲ 0.9 ▲ 1.6
出 荷 82.1 95.8 92.4 95.8 96.5 95.7 95.4 93.2 88.1 94.3 94.6(前期(年)比) ▲ 21.3 16.7 ▲ 3.5 7.5 0.7 ▲ 0.8 ▲ 0.3 ▲ 2.3 ▲ 5.5 7.0 0.3(前年同期比) - - - 26.9 21.7 14.4 6.4 ▲ 2.1 ▲ 8.3 ▲ 1.6 ▲ 2.2
国内向け出荷 81.3 92.7 88.8 92.6 93.7 92.9 91.7 89.0 84.9 90.6 91.5(前期(年)比) ▲ 19.9 14.0 ▲ 4.2 6.9 1.2 ▲ 0.9 ▲ 1.3 ▲ 2.9 ▲ 4.6 6.7 1.0(前年同期比) - - - 22.7 18.2 12.4 4.8 ▲ 4.1 ▲ 8.9 ▲ 2.6 ▲ 1.6
輸出向け出荷 85.5 108.7 107.8 108.6 108.7 107.1 111.2 113.0 101.8 109.7 107.8(前期(年)比) ▲ 26.4 27.1 ▲ 0.8 10.4 0.1 ▲ 1.5 3.8 1.6 ▲ 9.9 7.8 ▲ 1.7(前年同期比) - - - 46.1 35.4 22.5 11.8 6.0 ▲ 6.5 1.8 ▲ 4.1
在 庫(期(年)末) 93.1 96.6 100.3 94.4 96.9 97.3 96.7 98.1 101.1 102.9 101.5(前期(年)末比) ▲ 14.6 3.8 3.8 1.5 2.6 0.4 ▲ 0.6 1.4 3.1 1.8 ▲ 1.4(前年同期末比) - - - ▲ 6.1 1.2 3.5 3.8 3.9 4.6 6.0 3.8
在庫率 131.6 108.1 115.0 106.3 106.5 108.7 111.0 107.7 121.1 116.5 115.0(前期(年)比) 21.2 ▲ 17.9 6.4 ▲ 7.3 0.2 2.1 2.1 ▲ 3.0 12.4 ▲ 3.8 ▲ 1.3
稼働率(製造工業) 74.0 88.9 85.4 89.5 89.8 88.4 88.4 85.9 79.8 87.5 89.3(前期(年)比) ▲ 25.6 20.1 ▲ 3.9 9.4 0.3 ▲ 1.6 0.0 ▲ 2.8 ▲ 7.1 9.6 2.1
資料出所:鉱工業指数、鉱工業出荷内訳表(調査統計グループ経済解析室) (注) 1.輸出向け出荷及び国内向け出荷は「鉱工業出荷内訳表」による。
2.年及び前年同期比の数値は原指数による。
22年 23年22年 23年21年
13

概 況
2. 鉄鋼業
-冷間仕上鋼材、めっき鋼材などの減少により、生産は2年ぶりの低下-
(1) 概 況
① 23年の鉄鋼業の生産は、冷間仕上鋼材、めっき鋼材などが減少したことにより前年比▲2.9%と2
年ぶりの低下となった。
これを四半期別にみると、1~3月期は熱間圧延鋼材、冷間仕上鋼材など全ての業種が増加した
ことにより前期比 4.7%と2期連続の上昇、4~6月期は冷間仕上鋼材、熱間圧延鋼材など全ての
業種が減少したことにより同▲7.5%の低下、7~9月期は鋳鍛造品、冷間仕上鋼材が増加したこと
により同 0.7%の上昇、10~12月期は冷間仕上鋼材、鉄素製品などが減少したことにより同▲0.9%
の低下となった(第2-2図)。
② 出荷は、めっき鋼材、冷間仕上鋼材などが減少したことにより前年比▲1.5%と2年ぶりの低下と
なった。
内外需別にみると、 国内向けは冷間仕上鋼材、めっき鋼材などが減少したことにより前年比
▲0.9%の低下、輸出向けはめっき鋼材、熱間圧延鋼材などが減少したことにより同▲3.8%の低下と
なった。
四半期別にみると、1~3月期は熱間圧延鋼材、冷間仕上鋼材など全ての業種が増加したことに
より前期比 6.3%と3期ぶりの上昇、4~6月期は熱間圧延鋼材、冷間仕上鋼材など全ての業種が減
少したことにより同▲6.8%の低下、7~9月期は熱間圧延鋼材、めっき鋼材が減少したことにより同
▲0.2%の低下、10~12月期は熱間圧延鋼材、鋼管などが増加したことにより同 2.6%の上昇と
なった。
③ 在庫は、鉄素製品、鋼管などが増加したことにより前年末比 3.7%と2年連続の上昇となった。
なお、在庫率は、前年比 9.3%と2年ぶりの上昇となった。
第2-1図 鉄鋼業指数の推移
(17年=100、季節調整済)
50
60
70
80
90
100
110
120
130
140
150
160
19 20
(
21
暦
22
年
23
)
年 Ⅰ
└
Ⅱ
19
Ⅲ
年
Ⅳ
┘
Ⅰ
└
Ⅱ
20
Ⅲ
年
Ⅳ
┘
Ⅰ
└
Ⅱ
21
Ⅲ
年
Ⅳ
┘
Ⅰ
└
Ⅱ
22
Ⅲ
年
Ⅳ
┘
Ⅰ
└
Ⅱ
23
Ⅲ
年
Ⅳ
┘
生 産
出 荷
在 庫
在庫率
14
概 況
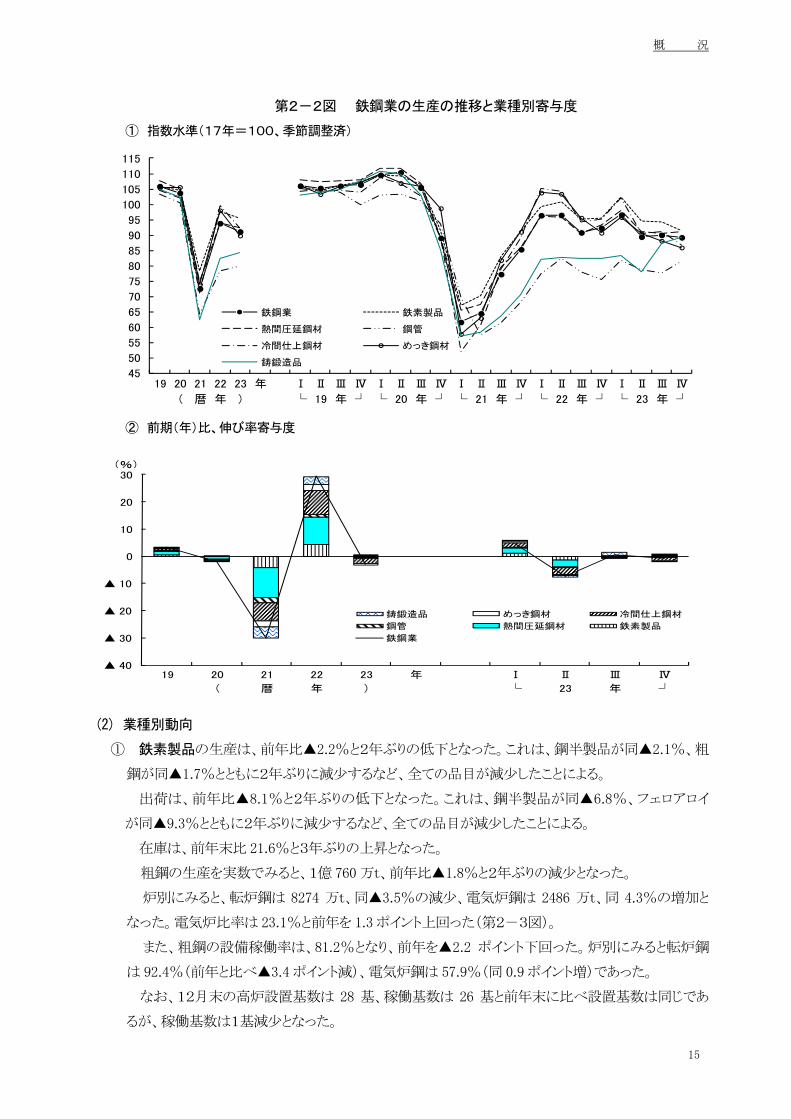
第2-2図 鉄鋼業の生産の推移と業種別寄与度
① 指数水準(17年=100、季節調整済)
45
50
55
60
65
70
75
80
85
90
95
100
105
110
115
19 20
(
21
暦
22
年
23
)
年 Ⅰ
└
Ⅱ
19
Ⅲ
年
Ⅳ
┘
Ⅰ
└
Ⅱ
20
Ⅲ
年
Ⅳ
┘
Ⅰ
└
Ⅱ
21
Ⅲ
年
Ⅳ
┘
Ⅰ
└
Ⅱ
22
Ⅲ
年
Ⅳ
┘
Ⅰ
└
Ⅱ
23
Ⅲ
年
Ⅳ
┘
鉄鋼業 鉄素製品
熱間圧延鋼材 鋼管
冷間仕上鋼材 めっき鋼材
鋳鍛造品
② 前期(年)比、伸び率寄与度
19 20
(
21
暦
22
年
23
)
年 Ⅰ
└
Ⅱ
23
Ⅲ
年
Ⅳ
┘
▲ 40
▲ 30
▲ 20
▲ 10
0
10
20
30
鋳鍛造品 めっき鋼材 冷間仕上鋼材
鋼管 熱間圧延鋼材 鉄素製品
鉄鋼業
(%)
(2) 業種別動向
① 鉄素製品の生産は、前年比▲2.2%と2年ぶりの低下となった。これは、鋼半製品が同▲2.1%、粗
鋼が同▲1.7%とともに2年ぶりに減少するなど、全ての品目が減少したことによる。
出荷は、前年比▲8.1%と2年ぶりの低下となった。これは、鋼半製品が同▲6.8%、フェロアロイ
が同▲9.3%とともに2年ぶりに減少するなど、全ての品目が減少したことによる。
在庫は、前年末比 21.6%と3年ぶりの上昇となった。
粗鋼の生産を実数でみると、1億 760 万t、前年比▲1.8%と2年ぶりの減少となった。
炉別にみると、転炉鋼は 8274 万t、同▲3.5%の減少、電気炉鋼は 2486 万t、同 4.3%の増加と
なった。電気炉比率は 23.1%と前年を 1.3 ポイント上回った(第2-3図)。
また、粗鋼の設備稼働率は、81.2%となり、前年を▲2.2 ポイント下回った。炉別にみると転炉鋼
は 92.4%(前年と比べ▲3.4 ポイント減)、電気炉鋼は 57.9%(同 0.9 ポイント増)であった。
なお、12月末の高炉設置基数は 28 基、稼働基数は 26 基と前年末に比べ設置基数は同じであ
るが、稼働基数は1基減少となった。
15

概 況
第2-3図 粗鋼の生産の推移
① 前年同期(年)比
▲ 60
▲ 40
▲ 20
0
20
40
60
19 20
(
21
暦
22
年
23
)
年 Ⅰ
└
Ⅱ
19
Ⅲ
年
Ⅳ
┘
Ⅰ
└
Ⅱ
20
Ⅲ
年
Ⅳ
┘
Ⅰ
└
Ⅱ
21
Ⅲ
年
Ⅳ
┘
Ⅰ
└
Ⅱ
22
Ⅲ
年
Ⅳ
┘
Ⅰ
└
Ⅱ
23
Ⅲ
年
Ⅳ
┘
(%)
② 炉別生産量
0
20
40
60
80
100
120
140
19 20
(
21
暦
22
年
23
)
年 Ⅰ
└
Ⅱ
19
Ⅲ
年
Ⅳ
┘
Ⅰ
└
Ⅱ
20
Ⅲ
年
Ⅳ
┘
Ⅰ
└
Ⅱ
21
Ⅲ
年
Ⅳ
┘
Ⅰ
└
Ⅱ
22
Ⅲ
年
Ⅳ
┘
Ⅰ
└
Ⅱ
23
Ⅲ
年
Ⅳ
┘
(百万t)
電気炉 転炉
② 熱間圧延鋼材の生産は、前年比▲1.4%と2年ぶりの低下となった。これは、普通鋼鋼帯が輸出向
け及び自動車向けの減少などから同▲6.7%と2年ぶりに減少したことなどによる(第2-4図)。
出荷は、前年比 0.4%と2年連続の上昇となった。これは、特殊鋼熱間圧延鋼材が同 2.1%と2年
連続の増加、小形棒鋼が同 3.9%と5年ぶりに増加したことなどによる。
在庫は、前年末比▲0.3%と3年ぶりの低下となった。これは、普通鋼鋼板が同▲7.6%と2年ぶり
の減少、普通鋼鋼帯が同▲4.4%と3年ぶりに減少したことなどによる。
第2-4図 熱間圧延鋼材の主要品目の生産の推移
(17年=100、季節調整済)
40
50
60
70
80
90
100
110
120
130
140
19 20
(
21
暦
22
年
23
)
年 Ⅰ
└
Ⅱ
19
Ⅲ
年
Ⅳ
┘
Ⅰ
└
Ⅱ
20
Ⅲ
年
Ⅳ
┘
Ⅰ
└
Ⅱ
21
Ⅲ
年
Ⅳ
┘
Ⅰ
└
Ⅱ
22
Ⅲ
年
Ⅳ
┘
Ⅰ
└
Ⅱ
23
Ⅲ
年
Ⅳ
┘
H形鋼
小形棒鋼
普通鋼鋼板
普通鋼鋼帯
特殊鋼熱間圧延鋼材
③ 鋼管の生産は、前年比 1.9%と2年連続の上昇となった。これは、普通鋼熱間鋼管が国内向けの
増加から同 3.0%と2年連続の増加となったことによる。一方、特殊鋼熱間鋼管は国内向けの減少か
ら同▲1.6%と2年ぶりの減少となった(第2-5図)。
16
概 況
17
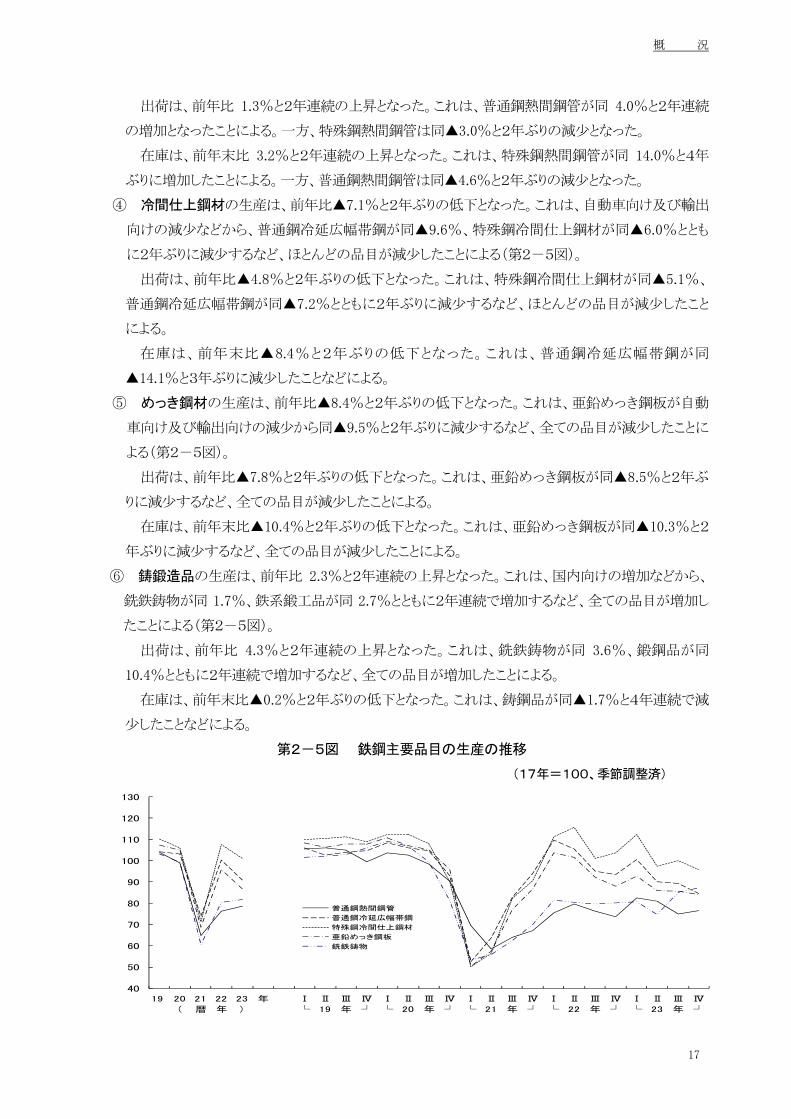
出荷は、前年比 1.3%と2年連続の上昇となった。これは、普通鋼熱間鋼管が同 4.0%と2年連続
の増加となったことによる。一方、特殊鋼熱間鋼管は同▲3.0%と2年ぶりの減少となった。
在庫は、前年末比 3.2%と2年連続の上昇となった。これは、特殊鋼熱間鋼管が同 14.0%と4年
ぶりに増加したことによる。一方、普通鋼熱間鋼管は同▲4.6%と2年ぶりの減少となった。
④ 冷間仕上鋼材の生産は、前年比▲7.1%と2年ぶりの低下となった。これは、自動車向け及び輸出
向けの減少などから、普通鋼冷延広幅帯鋼が同▲9.6%、特殊鋼冷間仕上鋼材が同▲6.0%ととも
に2年ぶりに減少するなど、ほとんどの品目が減少したことによる(第2-5図)。
出荷は、前年比▲4.8%と2年ぶりの低下となった。これは、特殊鋼冷間仕上鋼材が同▲5.1%、
普通鋼冷延広幅帯鋼が同▲7.2%とともに2年ぶりに減少するなど、ほとんどの品目が減少したこと
による。
在庫は、前年末比▲8.4%と2年ぶりの低下となった。これは、普通鋼冷延広幅帯鋼が同
▲14.1%と3年ぶりに減少したことなどによる。
⑤ めっき鋼材の生産は、前年比▲8.4%と2年ぶりの低下となった。これは、亜鉛めっき鋼板が自動
車向け及び輸出向けの減少から同▲9.5%と2年ぶりに減少するなど、全ての品目が減少したことに
よる(第2-5図)。
出荷は、前年比▲7.8%と2年ぶりの低下となった。これは、亜鉛めっき鋼板が同▲8.5%と2年ぶ
りに減少するなど、全ての品目が減少したことによる。
在庫は、前年末比▲10.4%と2年ぶりの低下となった。これは、亜鉛めっき鋼板が同▲10.3%と2
年ぶりに減少するなど、全ての品目が減少したことによる。
⑥ 鋳鍛造品の生産は、前年比 2.3%と2年連続の上昇となった。これは、国内向けの増加などから、
銑鉄鋳物が同 1.7%、鉄系鍛工品が同 2.7%とともに2年連続で増加するなど、全ての品目が増加し
たことによる(第2-5図)。
出荷は、前年比 4.3%と2年連続の上昇となった。これは、銑鉄鋳物が同 3.6%、鍛鋼品が同
10.4%とともに2年連続で増加するなど、全ての品目が増加したことによる。
在庫は、前年末比▲0.2%と2年ぶりの低下となった。これは、鋳鋼品が同▲1.7%と4年連続で減
少したことなどによる。
第2-5図 鉄鋼主要品目の生産の推移
(17年=100、季節調整済)
40
50
60
70
80
90
100
110
120
130
19 20
(
21
暦
22
年
23
)
年 Ⅰ
└
Ⅱ
19
Ⅲ
年
Ⅳ
┘
Ⅰ
└
Ⅱ
20
Ⅲ
年
Ⅳ
┘
Ⅰ
└
Ⅱ
21
Ⅲ
年
Ⅳ
┘
Ⅰ
└
Ⅱ
22
Ⅲ
年
Ⅳ
┘
Ⅰ
└
Ⅱ
23
Ⅲ
年
Ⅳ
┘
普通鋼熱間鋼管
普通鋼冷延広幅帯鋼
特殊鋼冷間仕上鋼材
亜鉛めっき鋼板
銑鉄鋳物

概 況
3. 非鉄金属工業
-非鉄金属地金、非鉄金属鋳物などの減少により、生産は2年ぶりの低下 -
(1) 概 況
① 23年の非鉄金属工業の生産は、前年比▲4.5%と2年ぶりの低下となった。これは、電線・ケーブ
ルが増加したものの、非鉄金属地金、非鉄金属鋳物、伸銅・アルミニウム圧延製品が減少した
ことによる。
四半期別にみると、1~3月期は非鉄金属地金、非鉄金属鋳物、電線・ケーブルが減少したこ
とにより前期比▲2.7%と2期ぶりの低下、4~6月期は非鉄金属鋳物、非鉄金属地金、伸
銅・アルミニウム圧延製品が減少したことにより同▲5.4%の低下、7~9月期は非鉄金属鋳物、非鉄
金属地金が増加したことにより同 5.4%の上昇、10~12月期は非鉄金属地金、電線・ケーブル、非
鉄金属鋳物が増加したことにより同 2.6%の上昇となった(第3-2図)。
② 出荷は、前年比▲4.7%と2年ぶりの低下となった。これは、非鉄金属地金、伸銅・アルミニウム圧
延製品、非鉄金属鋳物が減少したことによる。
内外需別にみると、国内向けはアルミニウムダイカスト、輸送機器用絶縁電線、電気銅などが減
少したことにより前年比▲7.3%の低下、輸出向けは銅・銅合金鋳物、通信用電線・ケーブルなどが
増加したことにより同 0.5%の上昇となった。
四半期別にみると、1~3月期は非鉄金属地金、非鉄金属鋳物、電線・ケーブルが減少したこと
により前期比▲2.1%と2期ぶりの低下、4~6月期は非鉄金属鋳物、非鉄金属地金、伸銅・アルミニ
ウム圧延製品、電線・ケーブルの全業種が減少したことにより同▲5.4%の低下、7~9月期は非鉄金
属鋳物、非鉄金属地金、電線・ケーブルが増加したことにより同 5.0%の上昇、10~12月期は電線・
ケーブル、非鉄金属地金、非鉄金属鋳物が増加したことにより同 2.2%の上昇となった。
③ 在庫は、前年末比 7.9%と2年連続の上昇となった。これは、非鉄金属地金、伸銅・アルミニウム
圧延製品、電線・ケーブルが増加したことによる。
なお、在庫率は、前年比 17.3%と2年ぶりの上昇となった。
第3-1図 非鉄金属工業指数の推移
(17年=100、季節調整済)
60
70
80
90
100
110
120
130
140
150
19 20
(
21
暦
22
年
23
)
年 Ⅰ
└
Ⅱ
19
Ⅲ
年
Ⅳ
┘
Ⅰ
└
Ⅱ
20
Ⅲ
年
Ⅳ
┘
Ⅰ
└
Ⅱ
21
Ⅲ
年
Ⅳ
┘
Ⅰ
└
Ⅱ
22
Ⅲ
年
Ⅳ
┘
Ⅰ
└
Ⅱ
23
Ⅲ
年
Ⅳ
┘
生 産
出 荷
在 庫
在 庫 率
18

概 況
第3-2図 非鉄金属工業の生産の推移と業種別寄与度
① 指数水準(17年=100、季節調整済)
50
60
70
80
90
100
110
120
19 20
(
21
暦
22
年
23
)
年 Ⅰ
└
Ⅱ
19
Ⅲ
年
Ⅳ
┘
Ⅰ
└
Ⅱ
20
Ⅲ
年
Ⅳ
┘
Ⅰ
└
Ⅱ
21
Ⅲ
年
Ⅳ
┘
Ⅰ
└
Ⅱ
22
Ⅲ
年
Ⅳ
┘
Ⅰ
└
Ⅱ
23
Ⅲ
年
Ⅳ
┘
非鉄金属工業
非鉄金属地金
伸銅・アルミニウム圧延製品
電線・ケーブル
非鉄金属鋳物
② 前期(年)比、伸び率寄与度
19 20
(
21
暦
22
年
23
)
年 Ⅰ
└
Ⅱ
23
Ⅲ
年
Ⅳ
┘
▲ 30
▲ 25
▲ 20
▲ 15
▲ 10
▲ 5
0
5
10
15
20
非鉄金属鋳物
電線・ケーブル
伸銅・アルミニウム圧延製品
非鉄金属地金
非鉄金属工業
(%)
(2) 業種別動向
① 非鉄金属地金の生産は、前年比▲8.7%と2年ぶりの低下となった。
品目別にみると、電気銅は震災により複数の製錬所が生産を一時停止したため前年比▲14.2%、
アルミニウム合金地金は同▲4.0%とともに2年ぶりに減少するなど、全ての品目が減少となった(第
3-3図)。
出荷は、前年比▲8.9%と2年ぶりの低下となった。これは、電気銅が同▲13.8%、アルミニウム
二次合金地金が同▲5.9%とともに2年ぶりに減少するなど、全ての品目が減少したことによる。
在庫は、前年末比 13.1%と2年連続の上昇となった。これは、亜鉛が同 88.4%と3年ぶりに増加、
電気金が同 23.9%と2年ぶりの増加となったことなどによる。
19

概 況
第3-3図 非鉄金属地金の生産の推移
(17年=100、季節調整済)
40
50
60
70
80
90
100
110
120
130
19 20
(
21
暦
22
年
23
)
年 Ⅰ
└
Ⅱ
19
Ⅲ
年
Ⅳ
┘
Ⅰ
└
Ⅱ
20
Ⅲ
年
Ⅳ
┘
Ⅰ
└
Ⅱ
21
Ⅲ
年
Ⅳ
┘
Ⅰ
└
Ⅱ
22
Ⅲ
年
Ⅳ
┘
Ⅰ
└
Ⅱ
23
Ⅲ
年
Ⅳ
┘
非鉄金属地金
アルミ合金地金
アルミ二次合金地金
電気金
電気銅
亜鉛
② 伸銅・アルミニウム圧延製品の生産は、前年比▲3.3%と2年ぶりの低下となった。
品目別にみると、アルミニウム板製品は自動車部品向け、電気機械器具向けなどの減少から前
年比▲6.9%、伸銅製品はアジア向けの減少などから同▲4.9%、アルミニウムはくは同▲3.3%とい
ずれも2年ぶりの減少となった(第3-4図)。
出荷は、前年比▲5.2%と2年ぶりの低下となった。これは、アルミニウム板製品が同▲6.7%、伸
銅製品が同▲4.4%とともに2年ぶりに減少するなど、全ての品目が減少したことによる。
在庫は、前年末比 5.7%と2年連続の上昇となった。これは、アルミニウム板製品が同 6.3%、伸銅
製品が同 6.3%とともに2年連続の増加となったことなどによる。
第3-4図 伸銅・アルミニウム圧延製品の生産の推移
(17年=100、季節調整済)
40
50
60
70
80
90
100
110
120
19 20
(
21
暦
22
年
23
)
年 Ⅰ
└
Ⅱ
19
Ⅲ
年
Ⅳ
┘
Ⅰ
└
Ⅱ
20
Ⅲ
年
Ⅳ
┘
Ⅰ
└
Ⅱ
21
Ⅲ
年
Ⅳ
┘
Ⅰ
└
Ⅱ
22
Ⅲ
年
Ⅳ
┘
Ⅰ
└
Ⅱ
23
Ⅲ
年
Ⅳ
┘
伸銅・アルミニウム圧延製品
伸銅製品
アルミニウム板製品
アルミニウム押出製品
アルミニウムはく
20

概 況
21
③ 電線・ケーブルの生産は、前年比 0.4%と2年連続の上昇となった。
品目別にみると、電力用電線・ケーブルは震災の復興需要から前年比 10.2%と5年ぶりの増加、
通信用ケーブル光ファイバ製品は同 10.1%と2年連続の増加となった。一方、輸送機器用絶縁電
線は自動車向けの減少から同▲8.5%と2年ぶりの減少となった(第3-5図)。
出荷は、前年比 0.0%の横ばいとなった。これは、通信用ケーブル光ファイバ製品が同 9.0%と2
年連続の増加、電力用電線・ケーブルが同 6.6%と3年ぶりの増加、機器用絶縁電線(輸送機器用
を除く)が同 1.7%と2年連続の増加となったものの、輸送機器用絶縁電線が同▲8.0%と2年ぶりの
減少、通信用電線・ケーブルが同▲5.5%と6年連続の減少となったことによる。
在庫は、前年末比 5.4%と2年連続の上昇となった。これは、輸送機器用絶縁電線が同 13.8%、
通信用ケーブル光ファイバ製品が同 22.8%とともに2年連続の増加となったことなどによる。
第3-5図 電線・ケーブルの生産の推移
(17年=100、季節調整済)
50
60
70
80
90
100
110
120
130
140
150
19 20
(
21
暦
22
年
23
)
年 Ⅰ
└
Ⅱ
19
Ⅲ
年
Ⅳ
┘
Ⅰ
└
Ⅱ
20
Ⅲ
年
Ⅳ
┘
Ⅰ
└
Ⅱ
21
Ⅲ
年
Ⅳ
┘
Ⅰ
└
Ⅱ
22
Ⅲ
年
Ⅳ
┘
Ⅰ
└
Ⅱ
23
Ⅲ
年
Ⅳ
┘
電線・ケーブル
機器用絶縁電線
輸送機器用絶縁電線
通信用電線・ケーブル
電力用電線・ケーブル
通信用ケーブル光ファイバ製品
④ 非鉄金属鋳物の生産は、前年比▲4.8%と2年ぶりの低下となった。
品目別にみると、自動車向けが減少したことなどにより、アルミニウムダイカストは前年比▲6.6%、
アルミニウム鋳物は同▲3.6%とともに2年ぶりの減少となった。一方、銅・銅合金鋳物は、同 4.8%と
2年連続の増加となった(第3-6図)。
第3-6図 非鉄金属鋳物の生産の推移
(17年=100、季節調整済)
40
50
60
70
80
90
100
110
120
19 20
(
21
暦
22
年
23
)
年 Ⅰ
└
Ⅱ
19
Ⅲ
年
Ⅳ
┘
Ⅰ
└
Ⅱ
20
Ⅲ
年
Ⅳ
┘
Ⅰ
└
Ⅱ
21
Ⅲ
年
Ⅳ
┘
Ⅰ
└
Ⅱ
22
Ⅲ
年
Ⅳ
┘
Ⅰ
└
Ⅱ
23
Ⅲ
年
Ⅳ
┘
非鉄金属鋳物
銅・銅合金鋳物
アルミニウム鋳物
アルミニウムダイカスト

概 況
4.金属製品工業
- 建設用金属製品、その他の金属製品の減少により、生産は2年ぶりの低下 -
(1) 概 況
① 23年の金属製品工業の生産は、前年比▲1.9%と2年ぶりの低下となった。これは、建築用金属製
品、暖ちゅう房熱機器が増加したものの、建設用金属製品、その他の金属製品が減少したことによ
る。
四半期別にみると、1~3月期は暖ちゅう房熱機器などが増加したものの、建設用金属製品が減
少したことにより前期比 0.0%の横ばい、4~6月期はその他の金属製品、建設用金属製品が減少し
たことにより同▲1.9%の低下 、7~9月期は建築用金属製品、その他の金属製品などが増加したこ
とにより同 0.5%の上昇、10~12月期は建築用金属製品、その他の金属製品が増加したことにより
同 1.1%の上昇となった(4-2図)。
② 出荷は、前年比▲2.9%と2年ぶりの低下となった。これは、建設用金属製品、その他の金属製品
が減少したことによる。
内外需別にみると、国内向けは鉄骨、粉末や金製機械材料、線ばねなどが減少したことにより前
年比▲3.5%の低下、輸出向けは粉末や金製機械材料、超硬チップ、かさね板ばねなどが増加した
ことにより同 1.6%の上昇となった。
四半期別にみると、1~3月期はその他の金属製品、建設用金属製品が減少したことにより前期比
▲0.6%と2期連続の低下、4~6月期はその他の金属製品、建設用金属製品、建築用金属製品が
減少したことにより同▲2.5%の低下、7~9月期は建築用金属製品、その他の金属製品などが増加
したことにより同 0.5%の上昇、10~12月期はその他の金属製品、暖ちゅう房熱機器、建築用金属
製品が増加したことにより同 1.5%の上昇となった。
③ 在庫は、その他の金属製品をはじめ全ての業種が増加したことにより前年末比 7.6%と3年ぶりの
上昇となった。
なお、在庫率は、前年比 6.8%と2年ぶりの上昇となった。
第4-1図 金属製品工業指数の推移
(17年=100、季節調整済)
70
80
90
100
110
120
130
19 20
(
21
暦
22
年
23
)
年 Ⅰ
└
Ⅱ
19
Ⅲ
年
Ⅳ
┘
Ⅰ
└
Ⅱ
20
Ⅲ
年
Ⅳ
┘
Ⅰ
└
Ⅱ
21
Ⅲ
年
Ⅳ
┘
Ⅰ
└
Ⅱ
22
Ⅲ
年
Ⅳ
┘
Ⅰ
└
Ⅱ
23
Ⅲ
年
Ⅳ
┘
生 産出 荷在 庫在 庫 率
22

概 況
第4-2図 金属製品工業の生産の推移と業種別寄与度
①指数水準(17年=100、季節調整済)
50
60
70
80
90
100
110
120
19 20
(
21
暦
22
年
23
)
年 Ⅰ
└
Ⅱ
19
Ⅲ
年
Ⅳ
┘
Ⅰ
└
Ⅱ
20
Ⅲ
年
Ⅳ
┘
Ⅰ
└
Ⅱ
21
Ⅲ
年
Ⅳ
┘
Ⅰ
└
Ⅱ
22
Ⅲ
年
Ⅳ
┘
Ⅰ
└
Ⅱ
23
Ⅲ
年
Ⅳ
┘
金属製品工業
建設用金属製品
建築用金属製品
暖ちゅう房熱機器
その他の金属製品
②前期(年)比、伸び率寄与度
19 20
(
21
暦
22
年
23
)
年 Ⅰ
└
Ⅱ
23
Ⅲ
年
Ⅳ
┘
▲ 20
▲ 15
▲ 10
▲ 5
0
5
10
その他の金属製品 暖ちゅう房熱機器
建築用金属製品 建設用金属製品
金属製品工業
(%)
(2) 業種別動向
① 建設用金属製品の生産は、前年比▲15.5%と3年連続の低下となった。
品目別にみると、橋りょうは大型物件が減少したことなどにより前年比▲22.5%、鉄骨は事務所、
店舗向けなどの減少により同▲10.5%とともに3年連続の減少となった。一方、軽量鉄骨は同1.2%と
5年ぶりの増加となった(第4-3図)。
出荷は、前年比▲15.8%と3年連続の低下となった。これは、橋りょうが同▲22.8%と2年連続の減
少となったことなどによる。
第4-3図 鉄骨、軽量鉄骨、橋りょうの生産の推移
(17年=100、季節調整済)
40
50
60
70
80
90
100
110
120
130
19 20
(
21
暦
22
年
23
)
年 Ⅰ
└
Ⅱ
19
Ⅲ
年
Ⅳ
┘
Ⅰ
└
Ⅱ
20
Ⅲ
年
Ⅳ
┘
Ⅰ
└
Ⅱ
21
Ⅲ
年
Ⅳ
┘
Ⅰ
└
Ⅱ
22
Ⅲ
年
Ⅳ
┘
Ⅰ
└
Ⅱ
23
Ⅲ
年
Ⅳ
┘
鉄 骨
軽量鉄骨
橋りょう
23

概 況
② 建築用金属製品の生産は、前年比 6.3%と2年連続の上昇となった。
品目別にみると、建築着工数の増加などから、木造住宅用アルミニウムサッシは前年比 7.2%と2
年連続の増加、ビル用アルミニウムサッシは同 6.6%と5年ぶりの増加、アルミニウムエクステリアは同
7.2%と2年連続の増加となるなど、全ての品目で増加となった(第4-4図)。
出荷は、前年比 4.2%と7年ぶりの上昇となった。これは、ビル用アルミニウムサッシが同 5.8%と5
年ぶりの増加、アルミニウムエクステリアが同 6.1%、木造住宅用アルミニウムサッシが同 2.6%ととも
に2年連続の増加となるなど、全ての品目で増加したことによる。
在庫は、前年末比1.4%と3年ぶりの上昇となった。これは、スチール・ステンレスドアが同36.6%と
4年ぶりの増加、木造住宅用アルミニウムサッシが同 4.7%と2年連続で増加したことなどによる。
第4-4図 建築用金属製品の主要品目の生産の推移
(17年=100、季節調整済)
50
60
70
80
90
100
110
120
19 20
(
21
暦
22
年
23
)
年 Ⅰ
└
Ⅱ
19
Ⅲ
年
Ⅳ
┘
Ⅰ
└
Ⅱ
20
Ⅲ
年
Ⅳ
┘
Ⅰ
└
Ⅱ
21
Ⅲ
年
Ⅳ
┘
Ⅰ
└
Ⅱ
22
Ⅲ
年
Ⅳ
┘
Ⅰ
└
Ⅱ
23
Ⅲ
年
Ⅳ
┘
木造住宅用アルミニウムサッシ
ビル用アルミニウムサッシ
アルミニウムエクステリア
アルミニウムドア
③ 暖ちゅう房熱機器の生産は、前年比 10.0%と2年連続の上昇となった。
品目別にみると、震災後の節電意識の高まりから石油ストーブは前年比 34.7%と3年連続の増加、
仮設住宅向け需要などの増加から、ガス湯沸器は同 8.5%、ガス風呂がまは同 4.9%とともに2年連
続の増加となった。また、石油温水給湯暖房機は同 14.6%と3年連続で増加するなど、全ての品目
が増加となった(第4-5図)。
出荷は、前年比 9.5%と2年連続の上昇となった。これは、石油ストーブが同 35.9%と3年連続の
増加、ガス湯沸器が同 7.0%、ガス風呂がまが同 4.1%とともに2年連続の増加、石油温水給湯暖房
機が同 11.8%と3年連続で増加するなど、全ての品目が増加したことによる。
在庫は、前年末比 8.5%と5年ぶりの上昇となった。これは、石油温水給湯暖房機が同 43.5%と2
年連続の増加、ガス風呂がまが同 15.4%と3年ぶりの増加、石油ストーブが同 13.4%と2年連続の増
加、ガス湯沸器が同 7.6%と3年ぶりに増加したことによる。
24

概 況
25
第4-5図 暖ちゅう房熱機器の生産の推移
(17年=100、季節調整済)
40
50
60
70
80
90
100
110
120
19 20
(
21
暦
22
年
23
)
年 Ⅰ
└
Ⅱ
19
Ⅲ
年
Ⅳ
┘
Ⅰ
└
Ⅱ
20
Ⅲ
年
Ⅳ
┘
Ⅰ
└
Ⅱ
21
Ⅲ
年
Ⅳ
┘
Ⅰ
└
Ⅱ
22
Ⅲ
年
Ⅳ
┘
Ⅰ
└
Ⅱ
23
Ⅲ
年
Ⅳ
┘
ガスこんろガス湯沸器ガス風呂がま石油ストーブ石油温水給湯暖房機
④ その他の金属製品の生産は、前年比▲3.1%と2年ぶりの低下となった。
品目別にみると、安価な輸入品の増加から産業用アルミニウム製品は前年比▲30.3%、自動車
の生産減から線ばねは同▲11.3%、うす板ばねは同▲6.9%といずれも2年ぶりの減少となった(第
4-6図)。
出荷は、前年比▲4.2%と2年ぶりの低下となった。これは、飲料用アルミニウム缶が同▲4.7%、
線ばねが同▲10.3%とともに2年ぶりに減少したことなどによる。
在庫は、前年末比 9.1%と3年ぶりの上昇となった。これは、食缶が同 19.4%、飲料用アルミニウ
ム缶が同 8.9%とともに2年ぶりに増加したことなどによる。
第4-6図 産業用アルミニウム製品、線ばね、うす板ばねの生産の推移
(17年=100、季節調整済)
30
40
50
60
70
80
90
100
110
120
130
19 20
(
21
暦
22
年
23
)
年 Ⅰ
└
Ⅱ
19
Ⅲ
年
Ⅳ
┘
Ⅰ
└
Ⅱ
20
Ⅲ
年
Ⅳ
┘
Ⅰ
└
Ⅱ
21
Ⅲ
年
Ⅳ
┘
Ⅰ
└
Ⅱ
22
Ⅲ
年
Ⅳ
┘
Ⅰ
└
Ⅱ
23
Ⅲ
年
Ⅳ
┘
産業用アルミニウム製品
線ばね
うす板ばね

指 数
2626
Ⅱ 指数 Indices
1. 生産指数(付加価値額ウェイト)
Indices of Industrial Production (Value Added Weights)
(1) 原 指 数 Original Index
年 月
Year and Month
鉱工業 鉄鋼業
鉄素製品(含、鋼半製品)
熱間圧延鋼 材
鋼 管冷間仕上鋼 材
めっき鋼材
鋳鍛造品普通鋼鋼
材(特 掲)
特殊鋼鋼材
(特 掲)Miningand
manufac-turing
Iron andSteel
Crudesteel
(Incl.semi-finishedsteel)
Hot
rolledsteel
Steel
pipes andtubes
Cold
finishedsteel
Metalliccoatedsteel
Steel
castingsand
forgings
Ordinarysteel
Specialsteel
ウェイト Weight 10,000.0 599.7 99.9 225.7 34.7 132.7 40.4 66.3 313.5 120.0
平成19年 (2007) 107.4 105.9 105.7 107.7 103.2 104.4 105.4 104.9 105.9 106.7
20 (2008) 103.8 103.7 104.4 105.0 100.4 101.9 105.6 102.2 102.8 106.2
21 (2009) 81.1 72.5 78.2 74.8 64.1 71.1 73.9 62.5 75.1 66.4
22 (2010) 94.4 93.8 97.6 93.8 78.2 99.4 98.0 82.3 92.3 100.9
23 (2011) 92.2 91.1 95.5 92.5 79.7 92.3 89.8 84.2 88.4 98.2
平成21年度 (09FY) 86.1 80.9 85.9 82.3 66.3 83.7 84.7 68.6 82.9 78.5
22 (10FY) 94.1 94.3 98.6 94.7 79.7 99.1 96.4 82.9 92.2 102.3
平成23年 1月 (Jan) 88.1 96.5 103.7 97.8 79.9 101.9 97.1 78.5 94.7 105.1
2月 (Feb) 93.2 92.2 94.7 93.4 83.5 95.1 86.2 86.2 89.1 101.2
3月 (Mar) 89.4 92.7 96.8 94.8 87.5 95.5 92.4 76.7 92.3 99.0
4月 (Apr) 79.7 84.8 89.0 88.8 76.8 82.8 85.0 72.9 85.5 86.0
5月 (May) 83.6 86.9 95.8 90.9 75.8 86.2 87.0 67.1 88.9 85.3
6月 (Jun) 97.6 90.7 94.7 91.7 75.7 92.0 88.7 88.1 88.6 94.5
7月 (Jul) 96.7 91.7 98.2 89.6 74.5 94.9 93.4 90.3 88.0 96.5
8月 (Aug) 91.5 91.2 95.3 91.4 76.1 96.5 92.5 81.1 88.9 99.6
9月 (Sep) 99.4 92.9 94.0 91.9 80.3 96.0 93.8 94.5 88.4 102.8
10月 (Oct) 96.1 95.6 100.9 97.3 83.6 93.5 90.4 95.2 89.8 106.5
( )11月 (Nov) 95.3 91.1 92.9 93.9 80.3 88.4 87.1 92.4 85.6 103.2
12月 (Dec) 95.2 87.0 90.3 88.2 82.3 84.4 83.5 87.7 81.3 98.8
(2)季 節 調 整 済 指 数 Seasonal Adjustment Index
平成23年 1~3月 (Q1) 92.8 96.6 102.3 97.9 81.6 102.0 95.8 83.2 94.6 105.7
4~6月 (Q2) 88.9 89.4 94.5 91.2 78.6 90.4 90.4 77.9 88.5 93.3
7~9月 (Q3) 93.7 90.0 94.2 90.4 77.7 91.2 88.1 87.2 86.4 97.1
10~12月 (Q4) 94.1 89.2 91.5 91.0 81.5 86.7 85.9 89.1 85.0 97.6
平成23年 1月 (Jan) 97.4 98.9 105.3 100.5 80.4 103.7 97.9 86.1 97.5 106.1
2月 (Feb) 98.5 100.2 103.8 101.2 85.1 106.9 97.5 89.4 97.1 111.7
3月 (Mar) 82.5 90.8 97.9 91.9 79.4 95.3 92.1 74.1 89.3 99.2
4月 (Apr) 84.5 90.0 94.3 93.1 78.4 90.0 92.0 76.7 89.7 95.0
5月 (May) 89.4 88.7 94.7 90.6 78.5 90.0 90.1 73.6 88.8 89.6
6月 (Jun) 92.8 89.5 94.6 89.9 78.8 91.1 89.1 83.3 87.1 95.4
7月 (Jul) 93.8 89.6 95.3 89.4 76.5 90.6 89.5 85.8 86.3 95.2
8月 (Aug) 94.6 91.2 94.6 92.0 78.0 93.2 87.0 88.4 87.6 99.6
9月 (Sep) 92.8 89.2 92.8 89.9 78.5 89.9 87.8 87.5 85.4 96.5
10月 (Oct) 94.5 90.6 94.0 92.2 81.7 89.0 86.9 89.4 86.1 99.5
11月 (Nov) 92.9 89.3 91.3 91.9 79.3 86.6 86.1 87.5 85.4 97.4
12月 (Dec) 95.0 87.8 89.3 89.0 83.5 84.6 84.8 90.3 83.4 95.9
資料出所:鉱工業指数(調査統計グループ経済解析室)
Data source: Indices of Industrial Production (Economic Analysis Office, Research and Statistics Department)

指 数
2727
(平成17年=100)
(2005 =100)
非鉄金属工 業
非鉄金属地 金
伸銅・アルミニウム
圧延製品
電線・ケーブル
非鉄金属鋳 物
金属製品工 業
建設用金属製品
建築用金属製品
暖ちゅう房熱機器
その他の金属製品
Non-ferrousmetals
Non-ferrous
metal
Copper andcopper-basealloys andaluminumrollingproducts
Electricwires andcables
Non-ferrous
metalcastings
Fabricatedmetals
Fabricatedstructural
metalproducts
Metal
products ofbuilding
Equipment
forhearting
and kitchen
Other metalproducts
211.7 55.5 59.3 42.3 54.6 566.8 87.1 114.1 56.6 309.0
104.4 106.2 98.9 106.1 107.2 96.8 94.9 89.1 86.7 102.1
99.0 99.2 93.7 102.9 101.6 94.8 105.6 81.2 82.7 99.1
77.4 89.5 69.9 79.6 71.6 77.9 94.2 68.2 78.9 76.7
90.5 98.3 85.8 85.5 91.7 83.1 78.5 68.5 85.2 89.4
86.4 89.7 83.0 85.8 87.3 81.5 66.3 72.8 93.7 86.6
84.0 94.3 77.4 82.5 81.7 79.7 88.6 67.1 80.6 81.6
89.3 96.1 85.6 84.8 89.9 83.0 77.0 69.5 86.0 89.1
86.1 95.2 78.6 85.0 85.9 75.2 62.6 67.5 88.8 79.2
88.1 90.1 83.4 84.7 93.8 81.6 77.4 66.0 85.9 87.7
81.1 85.4 85.2 79.0 73.9 83.9 103.3 68.7 84.3 83.9
77.9 81.0 84.9 78.1 66.8 75.4 55.7 62.4 82.9 84.3
77.9 85.8 84.1 83.0 59.3 76.3 53.9 63.9 91.6 84.4
88.3 86.7 88.1 89.5 89.2 86.2 67.1 73.8 106.0 92.5
89.8 88.5 87.5 85.6 96.9 83.9 62.0 74.2 94.4 91.6
82.1 86.2 76.8 77.9 86.8 79.5 66.9 74.4 87.4 83.4
91.3 92.8 82.5 90.8 99.9 83.9 67.3 77.6 91.4 89.6
94.6 98.2 83.7 94.1 103.4 84.0 56.6 79.6 104.6 89.6
92.3 94.3 83.8 93.9 98.4 86.8 65.8 84.3 107.2 89.8
87.5 92.2 77.5 88.0 93.2 80.7 57.4 81.7 100.3 83.4
87.3 91.3 87.4 83.7 87.5 82.5 73.0 70.3 87.6 88.6
82.6 85.0 84.0 86.3 74.4 80.9 65.4 70.4 102.0 85.5
87.1 89.2 81.6 85.3 92.4 81.3 66.7 73.3 94.9 86.3
89.4 93.5 80.3 89.7 95.1 82.2 59.9 77.7 92.4 87.1
91.9 95.8 88.5 90.2 93.7 84.3 71.6 71.9 90.6 91.6
92.7 95.7 90.2 88.5 97.5 86.1 74.8 72.6 88.7 94.1
77.4 82.5 83.6 72.3 71.2 77.0 72.7 66.5 83.4 80.2
80.6 84.1 84.7 80.4 72.7 78.7 66.6 68.3 92.1 83.2
82.4 85.8 84.5 90.8 66.5 80.7 61.6 70.4 105.8 86.2
84.7 85.2 82.9 87.6 84.0 83.2 68.1 72.6 108.0 87.1
86.2 86.6 82.1 85.2 89.8 82.0 66.9 72.7 99.6 86.2
88.0 89.3 82.2 85.7 95.6 82.1 70.8 74.1 95.1 86.8
87.1 91.8 80.4 85.0 91.7 79.7 62.4 73.1 90.0 85.9
90.2 95.7 80.1 89.8 95.9 81.7 59.3 75.6 93.1 86.8
88.4 93.1 80.2 88.3 92.6 82.5 61.4 77.6 92.4 87.4
89.7 91.7 80.5 90.9 96.7 82.4 59.0 80.0 91.7 87.1

指 数
2828
2. 生産者出荷指数
Indices of Producer's Shipments
(1) 原 指 数 Original Index
年 月
Year and Month
鉱工業 鉄鋼業
鉄素製品(含、鋼半製品)
熱間圧延鋼 材
鋼 管冷間仕上鋼 材
めっき鋼材
鋳鍛造品普通鋼鋼
材(特 掲)
特殊鋼鋼材
(特 掲)Miningand
manufac-turing
Iron andSteel
Crudesteel
(Incl.semi-finishedsteel)
Hot
rolledsteel
Steel
pipes andtubes
Cold
finishedsteel
Metalliccoatedsteel
Steel
castingsand
forgings
Ordinarysteel
Specialsteel
ウェイト Weight 10,000.0 547.4 30.5 242.9 55.1 88.3 66.3 64.3 300.3 152.3
平成19年 (2007) 107.8 106.0 109.0 107.5 103.3 103.4 105.9 104.9 106.0 106.0
20 (2008) 104.3 104.9 109.5 106.4 103.7 101.8 105.2 101.7 104.4 106.3
21 (2009) 82.1 72.2 93.1 75.1 65.1 71.1 71.7 59.3 76.2 65.6
22 (2010) 95.8 93.0 106.6 94.2 79.0 100.4 96.5 80.6 92.2 97.3
23 (2011) 92.4 91.6 98.0 94.6 80.0 95.6 89.0 84.1 90.1 96.4
平成21年度 (09FY) 87.1 79.5 99.9 81.9 65.4 82.7 82.1 65.7 82.5 75.3
22 (10FY) 95.3 94.0 107.2 95.6 81.1 101.3 95.0 81.8 92.5 99.5
平成23年 1月 (Jan) 86.8 95.2 106.8 97.7 84.2 102.7 96.0 78.5 94.3 101.6
2月 (Feb) 93.8 92.4 102.3 94.0 85.5 98.5 85.7 86.1 88.8 100.2
3月 (Mar) 95.2 99.5 104.9 104.0 94.8 107.5 95.2 77.3 100.3 106.2
4月 (Apr) 76.9 81.7 87.3 88.9 65.8 82.7 75.9 70.4 84.3 80.3
5月 (May) 79.6 82.5 88.7 89.5 67.5 82.1 79.9 69.0 84.8 82.3
6月 (Jun) 97.9 93.9 96.8 98.3 76.9 96.4 93.5 87.6 94.9 94.1
7月 (Jul) 96.6 90.6 100.3 91.1 73.5 96.3 91.5 89.7 89.1 92.0
8月 (Aug) 91.2 88.9 97.9 90.3 74.0 96.2 89.8 81.1 87.4 93.4
9月 (Sep) 102.6 94.9 95.6 95.3 86.8 100.9 93.3 93.5 90.8 103.4
10月 (Oct) 94.8 96.5 108.5 99.4 74.3 100.5 94.7 95.3 93.0 101.4
( )11月 (Nov) 95.1 91.7 95.6 94.1 85.9 91.7 84.6 92.7 85.6 102.4
12月 (Dec) 98.4 91.1 90.8 92.7 90.3 91.7 88.2 87.8 87.3 100.0
(2)季 節 調 整 済 指 数 Seasonal Adjustment Index
平成23年 1~3月 (Q1) 93.2 96.2 107.2 99.2 80.5 104.6 93.6 83.8 94.6 102.3
4~6月 (Q2) 88.1 89.7 93.7 94.3 74.4 91.7 88.2 77.5 90.7 91.3
7~9月 (Q3) 94.3 89.5 96.0 91.1 80.2 94.2 87.2 86.3 87.2 94.4
10~12月 (Q4) 94.6 91.8 96.6 94.8 84.9 93.0 87.9 89.3 88.7 98.3
平成23年 1月 (Jan) 96.8 98.2 112.3 101.9 83.7 104.7 95.5 86.0 97.6 102.4
2月 (Feb) 98.6 99.4 111.6 101.5 82.1 107.5 96.5 90.6 96.1 106.5
3月 (Mar) 84.3 90.9 97.6 94.3 75.8 101.5 88.9 74.9 90.1 98.1
4月 (Apr) 83.1 90.1 93.1 95.9 74.2 93.9 86.3 74.4 91.8 92.3
5月 (May) 87.5 88.0 93.6 92.7 74.5 86.3 86.0 74.8 89.1 88.3
6月 (Jun) 93.8 91.0 94.5 94.4 74.5 95.0 92.4 83.2 91.1 93.2
7月 (Jul) 94.4 89.7 100.8 90.8 78.6 93.9 87.9 85.1 88.0 92.2
8月 (Aug) 94.7 89.7 95.0 91.7 79.2 95.4 86.6 87.4 87.6 95.1
9月 (Sep) 93.9 89.2 92.2 90.8 82.7 93.3 87.1 86.3 86.0 96.0
10月 (Oct) 94.8 93.9 106.4 97.9 79.9 96.6 90.5 89.2 91.3 98.4
11月 (Nov) 93.0 89.7 93.9 92.6 86.0 89.8 82.5 87.8 85.5 98.2
12月 (Dec) 96.1 91.9 89.4 94.0 88.7 92.7 90.8 90.9 89.4 98.2

指 数
2929
(平成17年=100)
(2005 =100)
非鉄金属工 業
非鉄金属地 金
伸銅・アルミニウム
圧延製品
電線・ケーブル
非鉄金属鋳 物
金属製品工 業
建設用金属製品
建築用金属製品
暖ちゅう房熱機器
その他の金属製品
Non-ferrousmetals
Non-ferrous
metal
Copper andcopper-basealloys andaluminumrollingproducts
Electricwires andcables
Non-ferrous
metalcastings
Fabricatedmetals
Fabricatedstructural
metalproducts
Metal
products ofbuilding
Equipment
forhearting
and kitchen
Other metalproducts
262.8 56.5 86.6 63.3 56.4 479.9 74.2 105.6 55.5 244.6
103.9 107.6 100.3 102.7 107.2 96.9 93.5 92.5 86.5 102.3
98.4 95.7 95.9 101.4 101.6 93.9 100.7 85.0 80.4 98.7
76.3 86.7 71.1 78.3 71.6 79.3 91.2 73.7 79.7 78.0
89.6 93.9 88.5 85.7 91.7 83.9 80.9 73.1 83.0 89.6
85.4 85.5 83.9 85.7 87.3 81.5 68.1 76.2 90.9 85.8
82.9 91.1 79.4 81.4 81.6 80.7 86.7 72.4 80.8 82.5
88.5 91.2 87.8 85.8 89.9 83.8 79.7 74.1 85.0 89.0
84.4 85.4 81.5 86.3 85.9 74.9 64.0 70.6 90.8 76.5
88.4 85.5 86.7 88.5 93.8 79.9 79.6 69.5 79.2 84.7
83.4 88.1 87.6 81.9 73.9 86.0 107.2 72.7 93.6 83.6
77.2 75.5 86.0 75.6 66.9 75.1 57.0 66.0 76.9 84.2
76.2 74.6 86.9 78.0 59.3 72.9 55.2 67.6 67.2 81.8
88.0 85.3 91.2 85.1 89.2 83.1 68.9 77.2 75.1 91.8
87.2 80.7 86.7 85.0 96.8 81.8 63.4 78.8 67.9 91.8
81.8 81.8 78.5 81.7 86.8 79.3 68.7 79.0 73.0 84.1
90.7 91.9 83.8 90.9 99.9 84.5 69.0 82.0 96.3 87.6
92.6 96.0 82.2 94.4 103.3 84.5 57.8 82.8 107.6 88.1
90.4 92.9 81.8 92.7 98.4 89.7 67.4 87.7 121.8 90.1
84.6 88.4 73.9 88.4 93.1 86.8 58.6 80.8 141.2 85.6
86.6 86.1 89.3 85.5 87.5 82.9 74.8 75.3 89.9 87.7
81.9 80.0 85.6 83.6 74.4 80.8 68.6 73.7 97.8 84.6
86.0 85.6 82.5 85.3 92.4 81.2 68.8 77.6 87.3 84.7
87.9 90.5 79.3 89.9 95.0 82.4 60.4 79.0 91.0 87.6
89.7 87.2 91.0 90.2 93.7 85.3 74.5 77.3 87.9 90.4
91.5 87.8 92.9 91.2 97.5 86.5 79.4 77.7 87.7 92.5
78.5 83.3 84.1 75.2 71.2 76.9 70.5 70.8 94.1 80.2
80.1 78.0 85.9 80.0 72.8 79.4 68.1 71.9 95.7 82.9
81.4 78.8 86.3 86.0 66.4 80.4 66.4 73.3 100.1 85.0
84.3 83.3 84.7 84.9 84.0 82.5 71.4 76.0 97.5 85.9
84.6 81.4 82.9 84.7 89.8 81.6 69.5 76.4 82.3 85.5
87.0 85.7 82.8 87.1 95.5 82.8 74.1 78.7 89.7 85.5
86.4 89.6 81.9 84.0 91.8 79.3 62.9 77.6 89.9 83.2
88.5 91.3 79.9 90.2 95.8 82.2 61.0 78.1 93.2 86.9
86.6 89.2 79.3 87.8 92.6 82.0 62.4 79.6 84.4 87.8
88.6 90.9 78.8 91.6 96.5 83.0 57.9 79.2 95.3 88.0

指 数
3030
3. 生産者製品在庫指数
Indices of Producer's Inventory
(1) 原 指 数 Original Index
年 月
Year and Month
鉱工業 鉄鋼業
鉄素製品(含、鋼半製品)
熱間圧延鋼 材
鋼 管冷間仕上鋼 材
めっき鋼材
鋳鍛造品普通鋼鋼
材(特 掲)
特殊鋼鋼材
(特 掲)Miningand
manufac-turing
Iron andSteel
Crudesteel
(Incl.semi-finishedsteel)
Hot
rolledsteel
Steel
pipes andtubes
Cold
finishedsteel
Metalliccoatedsteel
Steel
castingsand
forgings
Ordinarysteel
Specialsteel
ウェイト Weight 10,000.0 1,062.1 313.0 325.2 117.7 138.4 107.6 60.2 456.8 232.1
平成19年末 (2007) 104.0 105.2 99.8 111.1 116.2 101.7 94.6 106.0 106.2 110.1
20 (2008) 109.0 102.0 112.3 98.6 103.3 92.5 92.3 102.9 93.5 104.4
21 (2009) 93.1 94.0 97.7 99.2 91.6 87.7 85.3 80.7 92.7 94.9
22 (2010) 96.6 100.4 89.5 113.4 93.7 107.4 97.8 88.3 103.7 111.5
23 (2011) 100.3 104.1 108.8 113.1 96.7 98.4 87.6 88.1 97.6 114.7
平成22年度末 (10FY) 89.5 88.8 82.2 99.4 85.9 90.5 82.5 79.1 93.1 91.8
23 (11FY) 93.0 94.9 87.9 107.5 80.7 102.3 88.6 85.1 99.6 97.6
平成23年 1月 (Jan) 104.3 101.7 91.3 116.2 90.1 110.4 96.4 89.3 105.0 112.3
2月 (Feb) 106.0 101.9 88.5 118.8 89.8 113.7 96.5 87.1 108.6 110.7
3月 (Mar) 93.0 94.9 87.9 107.5 80.7 102.3 88.6 85.1 99.6 97.6
4月 (Apr) 94.5 100.0 92.6 113.6 85.9 104.5 98.1 86.3 104.8 104.3
5月 (May) 102.9 106.2 97.1 122.7 89.7 112.6 104.0 85.8 113.9 108.6
6月 (Jun) 100.7 102.5 98.8 115.0 85.3 108.3 95.4 87.2 106.3 103.9
7月 (Jul) 101.2 103.7 103.5 113.7 87.7 105.9 97.6 88.4 104.4 106.8
8月 (Aug) 104.1 105.3 100.3 117.2 91.9 111.3 100.7 88.6 107.4 112.6
9月 (Sep) 101.0 103.4 101.8 112.5 85.3 110.4 100.3 87.4 104.1 108.4
10月 (Oct) 105.5 104.5 104.3 111.9 101.4 106.1 93.3 87.6 100.9 116.1
( )11月 (Nov) 107.4 105.7 104.5 115.6 98.7 105.1 97.1 88.4 103.8 115.5
12月 (Dec) 100.3 104.1 108.8 113.1 96.7 98.4 87.6 88.1 97.6 114.7
(2)季 節 調 整 済 指 数 Seasonal Adjustment Index
平成23年 1~3月末 (Q1) 98.1 100.9 92.0 114.2 89.9 109.2 98.2 87.2 106.8 107.1
4~6月末 (Q2) 101.1 103.1 98.4 115.0 89.2 108.7 96.5 87.1 106.2 108.3
7~9月末 (Q3) 102.9 105.7 105.6 114.6 91.3 109.6 97.5 87.5 104.6 112.2
10~12月末 (Q4) 101.5 102.4 106.1 112.0 91.4 97.0 85.4 86.5 97.9 108.6
平成23年 1月 (Jan) 101.1 98.3 87.6 112.9 85.9 107.3 93.8 88.5 103.4 106.2
2月 (Feb) 102.0 99.7 87.0 115.3 86.3 111.5 95.2 87.1 106.4 106.9
3月 (Mar) 98.1 100.9 92.0 114.2 89.9 109.2 98.2 87.2 106.8 107.1
4月 (Apr) 98.9 102.0 94.3 115.6 88.9 108.7 101.4 87.4 107.1 106.8
5月 (May) 104.0 104.3 93.9 121.3 85.7 113.6 105.3 87.2 112.1 108.9
6月 (Jun) 101.1 103.1 98.4 115.0 89.2 108.7 96.5 87.1 106.2 108.3
7月 (Jul) 101.1 104.4 102.6 115.8 91.2 106.9 97.5 87.9 105.2 110.6
8月 (Aug) 102.8 104.0 101.4 116.2 92.5 108.0 97.0 88.0 104.4 111.6
9月 (Sep) 102.9 105.7 105.6 114.6 91.3 109.6 97.5 87.5 104.6 112.2
10月 (Oct) 103.8 105.1 106.2 112.1 98.5 105.2 93.0 87.3 101.0 113.8
11月 (Nov) 103.3 104.2 104.6 113.3 92.4 104.3 95.3 87.4 101.9 110.6
12月 (Dec) 101.5 102.4 106.1 112.0 91.4 97.0 85.4 86.5 97.9 108.6

指 数
3131
(平成17年=100)
(2005 =100)
非鉄金属工 業
非鉄金属地 金
伸銅・アルミニウム
圧延製品
電線・ケーブル
金属製品工 業
建築用金属製品
暖ちゅう房熱機器
その他の金属製品
Non-ferrousmetals Non-ferrous
metal
Copper andcopper-basealloys and
aluminum rollingproducts
Electric wires
and cables
Fabricatedmetals
Metal productsof building
Equipment forhearting and
kitchen
Other metalproducts
276.5 73.0 113.7 89.8 715.5 132.9 208.8 373.8
102.9 100.0 99.5 109.6 85.0 74.7 75.0 94.3
104.4 117.5 100.4 98.7 86.8 85.9 72.3 95.3
95.6 111.4 89.8 90.0 75.7 65.9 49.1 94.0
100.7 116.5 95.8 94.1 73.6 63.2 45.7 92.8
108.7 131.8 101.3 99.2 79.2 64.1 49.6 101.2
90.5 99.5 84.2 91.2 79.0 68.4 47.7 100.3
99.4 128.3 89.7 88.3 77.5 72.5 36.7 102.1
104.9 139.6 91.9 93.3 74.5 65.7 42.7 95.4
104.0 142.3 91.0 89.2 78.9 70.7 45.3 100.7
99.4 128.3 89.7 88.3 77.5 72.5 36.7 102.1
99.8 121.8 94.1 89.1 78.8 77.7 38.6 101.6
104.9 127.2 97.6 96.0 85.5 79.9 52.9 105.6
102.2 118.2 93.2 100.4 90.8 81.4 71.1 105.1
107.9 127.0 99.5 102.9 94.7 81.4 86.1 104.3
106.6 134.6 95.2 98.3 97.0 83.8 95.0 102.9
105.7 132.1 94.4 98.6 96.2 82.8 91.2 103.8
106.2 129.9 96.6 99.1 96.2 85.9 88.6 104.0
104.9 123.8 96.5 100.0 90.5 72.0 77.9 104.1
108.7 131.8 101.3 99.2 79.2 64.1 49.6 101.2
99.3 121.2 92.9 89.3 82.3 74.0 49.8 101.8
103.2 123.8 94.1 98.9 86.0 78.8 63.1 101.7
106.1 131.0 95.6 98.6 90.0 79.2 71.1 104.5
105.1 128.9 95.7 97.2 88.5 68.5 67.0 106.3
100.6 122.8 90.2 94.8 82.4 69.4 58.0 97.9
103.1 132.7 91.3 92.0 83.9 71.7 58.5 101.5
99.3 121.2 92.9 89.3 82.3 74.0 49.8 101.8
101.5 129.5 95.9 88.6 82.0 76.9 47.7 101.4
106.0 127.8 98.9 96.1 84.0 79.4 55.8 100.8
103.2 123.8 94.1 98.9 86.0 78.8 63.1 101.7
108.9 135.4 98.1 101.0 88.2 79.5 69.5 103.0
107.6 135.1 96.9 99.0 89.7 80.2 72.5 103.1
106.1 131.0 95.6 98.6 90.0 79.2 71.1 104.5
107.7 136.5 96.2 99.5 90.2 84.7 69.7 104.1
106.7 135.2 95.0 99.0 90.6 73.8 74.8 104.9
105.1 128.9 95.7 97.2 88.5 68.5 67.0 106.3

時系列表(鉄鋼編)製品
Ⅲ 時系列表 Historical data〈鉄鋼編〉 Iron and Steel1. 製品 Products (1) 銑鉄 Pig iron
(単位:t、Unit:t)
平成19年 (2007) 86,770,755 86,273,274 497,481 5,377,617 5,301,752 34,528 41,33720 (2008) 86,171,136 85,599,251 571,885 4,795,332 4,733,744 25,134 36,45421 (2009) 66,942,610 66,783,027 159,583 3,551,289 3,510,918 11,544 28,82722 (2010) 82,283,358 81,954,312 329,046 4,019,050 3,966,540 21,832 30,67823 (2011) 81,028,352 80,714,878 313,474 3,429,413 3,386,736 20,155 22,522
平成21年度 (09FY) 72,526,186 72,334,599 191,587 4,138,593 4,092,843 14,754 30,99622 (10FY) 82,915,395 82,589,793 325,602 3,846,590 3,795,699 22,877 28,014
平成23年 1~3月 (Q1) 20,706,585 20,628,573 78,012 914,528 902,574 6,152 5,8024~6 (Q2) 19,574,468 19,475,928 98,540 812,834 803,430 5,118 4,2867~9 (Q3) 20,683,576 20,612,517 71,059 868,840 857,442 4,494 6,904
10~12 (Q4) 20,063,723 19,997,860 65,863 833,211 823,290 4,391 5,530
平成23年 1月 (Jan) 7,352,354 7,317,390 34,964 298,169 294,560 1,882 1,7272 (Feb) 6,573,649 6,559,364 14,285 271,878 267,902 2,055 1,9213 (Mar) 6,780,582 6,751,819 28,763 344,481 340,112 2,215 2,1544 (Apr) 6,134,608 6,097,350 37,258 305,921 302,510 1,939 1,4725 (May) 6,775,927 6,735,464 40,463 245,627 242,684 1,571 1,3726 (Jun) 6,663,933 6,643,114 20,819 261,286 258,236 1,608 1,442
7 (Jul) 7,067,047 7,045,962 21,085 300,766 296,799 1,516 2,4518 (Aug) 6,958,929 6,934,488 24,441 283,021 279,471 1,515 2,0359 (Sep) 6,657,600 6,632,067 25,533 285,053 281,172 1,463 2,418
10 (Oct) 7,103,765 7,083,692 20,073 300,984 297,388 1,548 2,04811 (Nov) 6,542,561 6,519,486 23,075 259,588 256,378 1,463 1,74712 (Dec) 6,417,397 6,394,682 22,715 272,639 269,524 1,380 1,735
注:受入は生産者と消費者の合計である。Note:"Receipts"comprises the total of producer's receipts plus consumer's receipts.
鋳物用銑Foundry pig iron
鋳鉄管用Cast iron pipes
and tubes
年 月Year and Month
生 産 Production 受 入 Receipts
計 Total
製鋼用銑Pig iron forsteel-making
鋳物用銑Foundry pig iron
計 Total
製鋼用銑Pig iron forsteel-making
32
(単位:t、Unit:t)
平成19年 (2007) 86,830,234 85,829,010 959,684 41,54020 (2008) 85,509,958 84,696,050 779,073 34,83521 (2009) 66,034,615 65,652,504 351,888 30,22322 (2010) 81,770,433 81,294,697 446,553 29,18323 (2011) 79,945,148 79,548,117 373,031 24,000
平成21年度 (09FY) 72,399,643 71,987,514 382,337 29,79222 (10FY) 82,396,374 81,915,617 451,907 28,850
平成23年 1~3月 (Q1) 20,676,731 20,556,311 114,565 5,8554~6 (Q2) 19,210,912 19,116,443 88,290 6,1797~9 (Q3) 20,333,089 20,245,525 82,388 5,176
10~12 (Q4) 19,724,416 19,629,838 87,788 6,790
平成23年 1月 (Jan) 7,341,882 7,302,665 37,188 2,0292 (Feb) 6,590,717 6,552,672 36,137 1,9083 (Mar) 6,744,132 6,700,974 41,240 1,9184 (Apr) 6,020,533 5,989,909 28,173 2,4515 (May) 6,648,531 6,618,393 28,284 1,8546 (Jun) 6,541,848 6,508,141 31,833 1,874
7 (Jul) 6,935,620 6,903,203 30,819 1,5988 (Aug) 6,837,141 6,811,342 24,192 1,6079 (Sep) 6,560,328 6,530,980 27,377 1,971
10 (Oct) 7,023,242 6,989,521 31,275 2,44611 (Nov) 6,415,863 6,385,413 28,244 2,20612 (Dec) 6,285,311 6,254,904 28,269 2,138
注:消費は生産者と消費者の合計である。Note:"Consumption"comprises the total of producer's consumption plus consumer's consumption.
年 月Year and Month
消 費 Consumption
計Total
製鋼用・鋳物用 For steel-making/casting
転炉用L D
converters
電気炉用Electric furnaces
鋳鉄管用Cast iron pipes
and tubes
32

時系列表 (鉄鋼編) 製品
1. 製品 Products (1) 銑鉄 Pig iron
(単位:t、Unit:t)
平成19年 (2007) 4,296,644 3,743,017 553,627 396,756 395,809 94720 (2008) 4,197,992 3,649,149 548,843 370,370 370,042 32821 (2009) 3,511,857 3,315,857 196,000 279,565 279,095 47022 (2010) 3,616,916 3,305,030 311,886 434,731 433,970 76123 (2011) 3,348,153 3,032,796 315,357 282,608 281,629 979
平成21年度 (09FY) 3,820,280 3,578,714 241,566 428,314 427,710 60422 (10FY) 3,541,453 3,226,246 315,207 330,088 329,321 767
平成23年 1~3月 (Q1) 890,273 798,395 91,878 65,893 65,753 1404~6 (Q2) 767,802 690,145 77,657 69,970 69,639 3317~9 (Q3) 831,925 754,345 77,580 95,727 95,553 174
10~12 (Q4) 858,153 789,911 68,242 51,018 50,684 334
平成23年 1月 (Jan) 284,831 258,287 26,544 23,009 23,009 -2 (Feb) 271,871 244,953 26,918 18,422 18,366 563 (Mar) 333,571 295,155 38,416 24,462 24,378 844 (Apr) 255,972 230,020 25,952 37,277 37,156 1215 (May) 241,776 215,950 25,826 22,420 22,337 836 (Jun) 270,054 244,175 25,879 10,273 10,146 127
7 (Jul) 282,974 258,083 24,891 33,500 33,407 938 (Aug) 267,604 241,417 26,187 36,083 36,083 -9 (Sep) 281,347 254,845 26,502 26,144 26,063 81
10 (Oct) 320,215 294,562 25,653 14,771 14,683 8811 (Nov) 267,130 245,453 21,677 19,682 19,549 13312 (Dec) 270,808 249,896 20,912 16,565 16,452 113
販 売 Sales その他 Others
計Total
製鋼用銑Pig iron for steel-
making
鋳物用銑Foundry pig iron
計Total
製鋼用銑Pig iron for steel-
making
鋳物用銑Foundry pig iron
年 月Year and Month
出荷 Shipments
33
(単位:t、Unit:t)
平成19年 (2007) 957,231 872,976 77,126 7,12920 (2008) 1,119,048 1,021,410 89,423 8,21521 (2009) 963,521 908,920 47,885 6,71622 (2010) 837,808 771,618 57,942 8,24823 (2011) 1,193,172 1,135,921 51,140 6,111
平成21年度 (09FY) 771,898 723,510 39,385 9,00322 (10FY) 680,540 629,997 42,242 8,301
平成23年 1~3月 (Q1) 680,540 629,997 42,242 8,3014~6 (Q2) 870,931 802,680 61,838 6,4137~9 (Q3) 1,028,449 967,033 54,053 7,363
10~12 (Q4) 1,193,172 1,135,921 51,140 6,111
平成23年 1月 (Jan) 802,823 728,999 65,875 7,9492 (Feb) 728,813 667,889 52,867 8,0573 (Mar) 680,540 629,997 42,242 8,3014 (Apr) 758,599 698,480 52,838 7,2815 (May) 821,899 747,853 67,246 6,8006 (Jun) 870,931 802,680 61,838 6,413
7 (Jul) 935,976 871,334 57,419 7,2238 (Aug) 996,763 933,492 55,613 7,6589 (Sep) 1,028,449 967,033 54,053 7,36310 (Oct) 1,043,109 987,789 48,352 6,96811 (Nov) 1,103,410 1,047,414 49,484 6,51212 (Dec) 1,193,172 1,135,921 51,140 6,111
注:在庫は生産者と消費者の合計である。Note:"Inventory"comprises the total of producer's stocks plus consumer's stocks.
年 月Year and Month
在 庫 Inventory
計Total
製鋼用銑Pig iron for steel-
making
鋳物用銑Foundry pig iron
鋳鉄管用Cast iron pipes and
tubes
33

時系列表 (鉄鋼編) 製品
1 製品 Products (2) フェロアロイ Ferro-alloys
①生産業者分受払 Receipts and shipments by producers (単位:t、Unit:t)
平成19年 (2007) 858,331 226,863 290,715 884,160 72,870 148,24620 (2008) 827,823 257,705 296,436 898,170 73,397 149,42121 (2009) 722,277 124,174 212,309 724,209 53,996 134,21622 (2010) 892,937 204,470 296,472 911,621 66,044 141,71523 (2011) 833,817 186,057 301,754 827,039 62,900 157,150
平成21年度 (09FY) 763,499 128,867 225,672 778,287 62,500 128,55922 (10FY) 898,769 208,418 306,165 919,766 64,172 137,160
平成23年 1~3月 (Q1) 215,753 42,164 79,022 218,298 14,380 137,1604~6 (Q2) 200,031 51,383 73,768 174,598 16,735 172,4817~9 (Q3) 196,645 42,812 67,589 210,677 16,105 155,752
10~12 (Q4) 221,388 49,698 81,375 223,466 15,680 157,150
平成23年 1月 (Jan) 83,285 15,967 27,820 80,748 5,316 144,8102 (Feb) 65,871 11,620 23,368 74,286 4,579 135,7833 (Mar) 66,597 14,577 27,834 63,264 4,485 137,1604 (Apr) 63,040 17,181 23,149 60,588 5,301 142,7195 (May) 65,563 17,305 25,813 52,791 5,682 159,4036 (Jun) 71,428 16,897 24,806 61,219 5,752 172,481
7 (Jul) 74,935 14,817 21,753 70,395 5,015 176,7458 (Aug) 66,494 13,078 23,160 74,142 6,060 167,5799 (Sep) 55,216 14,917 22,676 66,140 5,030 155,752
10 (Oct) 73,036 15,298 28,282 80,841 5,708 146,93611 (Nov) 73,985 20,918 25,188 72,422 5,563 153,70612 (Dec) 74,367 13,482 27,905 70,203 4,409 157,150
(単位:t、Unit:t)
販 売Sales
その他Others
生 産Production
受 入Receipts
消 費Consumption
出荷 Shipments在 庫Inventory
年 月Year and Month
合 計 Grand total
34
フェロマンガン Ferro-manganese
計 Total
平成19年 (2007) 420,151 157,787 208,674 519,581 12,986 80,73020 (2008) 431,181 191,863 206,112 571,618 15,993 76,48721 (2009) 361,375 83,627 142,356 402,458 9,810 79,45122 (2010) 453,265 144,392 200,527 531,411 11,546 93,49323 (2011) 456,798 131,351 195,492 529,999 11,052 102,015
平成21年度 (09FY) 370,596 85,866 148,823 443,147 10,403 75,27622 (10FY) 465,797 146,211 206,965 542,244 11,643 91,878
平成23年 1~3月 (Q1) 116,417 28,299 52,048 133,425 2,791 91,8784~6 (Q2) 125,325 36,790 47,980 128,651 2,518 114,9867~9 (Q3) 90,804 28,815 42,714 129,151 2,900 92,797
10~12 (Q4) 124,252 37,447 52,750 138,772 2,843 102,015
平成23年 1月 (Jan) 43,321 10,422 18,450 47,945 943 94,6642 (Feb) 33,627 7,725 15,550 41,244 863 91,3203 (Mar) 39,469 10,152 18,048 44,236 985 91,8784 (Apr) 39,191 12,278 13,881 42,901 732 97,3215 (May) 46,533 12,606 17,414 42,800 822 110,4086 (Jun) 39,601 11,906 16,685 42,950 964 114,986
7 (Jul) 39,146 10,117 14,058 43,517 741 116,4568 (Aug) 31,783 8,119 14,718 44,323 1,066 108,7859 (Sep) 19,875 10,579 13,938 41,311 1,093 92,797
10 (Oct) 37,494 10,744 18,309 48,928 1,006 87,77311 (Nov) 44,669 17,415 15,679 47,144 1,015 97,90312 (Dec) 42,089 9,288 18,762 42,700 822 102,015
販 売Sales
その他Others
生 産Production
受 入Receipts
消 費Consumption
出荷 Shipments在 庫Inventory
年 月Year and Month
3434

時系列表 (鉄鋼編) 製品
1 製品 Products (2) フェロアロイ Ferro-alloys
①生産業者分受払 Receipts and shipments by producers (単位:t、Unit:t)
フェロマンガン Ferro-manganese
高 炭 素 High-carbon ferro-manganese
平成19年 (2007) 312,330 137,905 154,438 408,112 12,986 59,13520 (2008) 323,500 166,711 151,308 451,872 15,993 56,60521 (2009) 283,220 71,609 106,218 319,762 9,790 61,31222 (2010) 331,840 131,764 147,592 412,780 11,526 72,76823 (2011) 332,683 119,225 143,206 410,202 11,050 77,823
平成21年度 (09FY) 286,281 72,893 109,638 347,497 10,363 55,38622 (10FY) 338,813 134,089 152,713 423,356 11,643 64,707
平成23年 1~3月 (Q1) 82,095 25,590 38,444 106,274 2,791 64,7074~6 (Q2) 93,505 34,213 35,432 102,152 2,516 82,5597~9 (Q3) 66,614 25,514 30,936 97,476 2,900 68,061
10~12 (Q4) 90,469 33,908 38,394 104,300 2,843 77,823
平成23年 1月 (Jan) 31,598 9,452 13,736 38,012 943 72,2902 (Feb) 23,175 6,981 11,487 32,424 863 67,3403 (Mar) 27,322 9,157 13,221 35,838 985 64,7074 (Apr) 29,820 11,354 10,354 33,366 732 70,1505 (May) 34,611 12,094 13,057 34,651 822 79,6756 (Jun) 29,074 10,765 12,021 34,135 962 82,559
7 (Jul) 32,148 9,051 10,293 32,548 741 88,1778 (Aug) 23,304 6,903 10,628 33,616 1,066 82,6449 (Sep) 11,162 9,560 10,015 31,312 1,093 68,061
10 (Oct) 25,696 9,616 13,163 36,635 1,006 63,53111 (Nov) 34,444 16,266 11,457 35,026 1,015 75,40312 (Dec) 30,329 8,026 13,774 32,639 822 77,823
(単位:t、Unit:t)
販 売Sales
その他Others
在 庫Inventory
年 月Year and Month 生 産
Production受 入Receipts
消 費Consumption
出荷 Shipments
35
フェロマンガン Ferro-manganese
低 炭 素 Low-carbon ferro-manganese
平成19年 (2007) 107,821 19,882 54,236 111,469 - 21,59520 (2008) 107,681 25,152 54,804 119,746 - 19,88221 (2009) 78,155 12,018 36,138 82,696 20 18,13922 (2010) 121,425 12,628 52,935 118,631 20 20,72523 (2011) 124,115 12,126 52,286 119,797 2 24,192
平成21年度 (09FY) 84,315 12,973 39,185 95,650 40 19,89022 (10FY) 126,984 12,122 54,252 118,888 - 27,171
平成23年 1~3月 (Q1) 34,322 2,709 13,604 27,151 - 27,1714~6 (Q2) 31,820 2,577 12,548 26,499 2 32,4277~9 (Q3) 24,190 3,301 11,778 31,675 - 24,736
10~12 (Q4) 33,783 3,539 14,356 34,472 - 24,192
平成23年 1月 (Jan) 11,723 970 4,714 9,933 - 22,3742 (Feb) 10,452 744 4,063 8,820 - 23,9803 (Mar) 12,147 995 4,827 8,398 - 27,1714 (Apr) 9,371 924 3,527 9,535 - 27,1715 (May) 11,922 512 4,357 8,149 - 30,7336 (Jun) 10,527 1,141 4,664 8,815 2 32,427
7 (Jul) 6,998 1,066 3,765 10,969 - 28,2798 (Aug) 8,479 1,216 4,090 10,707 - 26,1419 (Sep) 8,713 1,019 3,923 9,999 - 24,73610 (Oct) 11,798 1,128 5,146 12,293 - 24,24211 (Nov) 10,225 1,149 4,222 12,118 - 22,50012 (Dec) 11,760 1,262 4,988 10,061 - 24,192
販 売Sales
その他Others
在 庫Inventory
年 月Year and Month 生 産
Production受 入Receipts
消 費Consumption
出荷 Shipments
3535

時系列表 (鉄鋼編) 製品
1 製品 Products (2) フェロアロイ Ferro-alloys
①生産業者分受払 Receipts and shipments by producers (単位:t、Unit:t)
平成19年 (2007) 52,901 15,829 34,953 37,222 4,037 17,28020 (2008) 58,884 9,092 39,816 39,979 5,350 17,88921 (2009) 49,205 4,485 38,721 31,577 1,138 16,59322 (2010) 49,865 6,790 48,777 27,975 5,418 15,95223 (2011) 49,798 7,690 56,961 22,777 2,612 22,461
平成21年度 (09FY) 51,528 3,135 40,135 30,996 2,233 14,78922 (10FY) 48,904 7,763 51,286 27,438 4,636 15,105
平成23年 1~3月 (Q1) 11,952 1,266 15,046 6,482 452 15,1054~6 (Q2) 13,282 2,693 14,683 5,475 477 19,4277~9 (Q3) 11,177 2,525 11,999 4,840 1,159 20,625
10~12 (Q4) 13,387 1,206 15,233 5,980 524 22,461
平成23年 1月 (Jan) 5,800 127 5,144 2,437 150 17,1432 (Feb) 3,598 90 4,812 2,146 129 16,5343 (Mar) 2,554 1,049 5,090 1,899 173 15,1054 (Apr) 6,033 1,045 5,324 1,249 139 18,4095 (May) 2,733 1,056 4,640 1,891 133 18,6826 (Jun) 4,516 592 4,719 2,335 205 19,427
7 (Jul) 3,281 1,103 3,352 1,592 189 19,8648 (Aug) 5,067 1,376 4,168 1,893 804 21,5389 (Sep) 2,829 46 4,479 1,355 166 20,625
10 (Oct) 5,262 804 5,138 2,645 156 21,46511 (Nov) 2,466 90 5,257 1,399 191 20,34312 (Dec) 5,659 312 4,838 1,936 177 22,461
(単位:t、Unit:t)
販 売Sales
その他Others
生 産Production
受 入Receipts
消 費Consumption
出荷 Shipments在 庫Inventory
年 月Year and Month
シリコマンガン Silico-manganese
36
平成19年 (2007) - 32,221 30,793 1,045 102 2,02020 (2008) - 33,454 32,246 965 71 2,00521 (2009) - 22,085 21,192 587 139 2,11822 (2010) - 31,172 29,973 923 95 1,96623 (2011) - 30,149 29,212 1,063 80 1,617
平成21年度 (09FY) - 24,456 23,773 695 71 1,67122 (10FY) - 31,577 30,504 939 90 1,363
平成23年 1~3月 (Q1) - 7,361 7,514 217 11 1,3634~6 (Q2) - 7,168 6,503 251 18 1,7597~9 (Q3) - 7,642 7,436 313 24 1,707
10~12 (Q4) - 7,978 7,759 282 27 1,617
平成23年 1月 (Jan) - 2,298 2,616 76 - 1,5722 (Feb) - 2,540 1,656 73 3 2,3803 (Mar) - 2,523 3,242 68 8 1,3634 (Apr) - 2,540 2,097 84 10 1,7125 (May) - 2,108 2,260 78 8 1,4746 (Jun) - 2,520 2,146 89 - 1,759
7 (Jul) - 2,630 2,711 113 8 1,5578 (Aug) - 2,582 2,378 96 8 1,6579 (Sep) - 2,430 2,347 104 8 1,707
10 (Oct) - 2,737 2,512 92 8 1,83211 (Nov) - 2,389 2,622 112 9 1,47812 (Dec) - 2,852 2,625 78 10 1,617
販 売Sales
その他Others
生 産Production
受 入Receipts
消 費Consumption
出荷 Shipments在 庫Inventory
年 月Year and Month
フェロシリコン Ferro-silicon
3636

時系列表 (鉄鋼編) 製品
1 製品 Products (2) フェロアロイ Ferro-alloys
①生産業者分受払 Receipts and shipments by producers (単位:t、Unit:t)
フェロクロム Ferro-chromium
計 Total
平成19年 (2007) 12,016 12,792 9,395 19,048 - 9,78020 (2008) 13,888 15,468 10,864 20,605 - 7,50221 (2009) 7,698 8,728 5,443 12,141 - 6,31122 (2010) 16,208 14,212 8,757 23,045 - 4,94523 (2011) 17,217 10,203 9,925 19,413 - 2,532
平成21年度 (09FY) 11,368 9,178 6,611 15,861 - 5,53722 (10FY) 16,302 15,092 9,144 23,540 - 4,023
平成23年 1~3月 (Q1) 4,326 3,702 2,396 6,349 - 4,0234~6 (Q2) 4,356 2,087 2,386 4,294 - 3,7867~9 (Q3) 3,697 2,108 2,394 4,558 - 2,349
10~12 (Q4) 4,838 2,306 2,749 4,212 - 2,532
平成23年 1月 (Jan) 1,393 1,960 949 1,900 - 5,4492 (Feb) 1,364 1,117 737 2,061 - 5,1303 (Mar) 1,569 625 710 2,388 - 4,0234 (Apr) 1,311 791 882 1,609 - 3,6345 (May) 1,536 776 902 1,413 - 3,6316 (Jun) 1,509 520 602 1,272 - 3,786
7 (Jul) 1,387 725 806 1,439 - 3,6538 (Aug) 947 787 867 1,272 - 3,2489 (Sep) 1,363 596 721 1,847 - 2,34910 (Oct) 1,601 725 848 1,194 - 2,63311 (Nov) 1,675 794 920 1,375 - 2,80712 (Dec) 1,562 787 981 1,643 - 2,532
(単位:t、Unit:t)
販 売Sales
生 産Production
受 入Receipts
消 費Consumption
出荷 Shipments在 庫Inventory
その他Others
年 月Year and Month
37
フェロクロム Ferro-chromium
高炭素 High-carbon ferro-chromium
平成19年 (2007) 308 10,497 6,695 8,237 - 5,12620 (2008) - 13,386 7,285 7,964 - 3,24121 (2009) - 7,737 3,783 4,580 - 2,58222 (2010) - 12,744 6,686 7,047 - 1,60923 (2011) - 8,200 6,711 2,803 - 290
平成21年度 (09FY) - 8,063 4,776 5,451 - 1,65722 (10FY) - 13,416 6,784 6,733 - 1,532
平成23年 1~3月 (Q1) - 3,188 1,678 1,582 - 1,5324~6 (Q2) - 1,590 1,600 1,062 - 4607~9 (Q3) - 1,641 1,652 60 - 389
10~12 (Q4) - 1,781 1,781 99 - 290
平成23年 1月 (Jan) - 1,794 742 585 - 2,0762 (Feb) - 987 527 502 - 2,0323 (Mar) - 407 409 495 - 1,5324 (Apr) - 566 576 431 - 1,0915 (May) - 638 638 481 - 6106 (Jun) - 386 386 150 - 460
7 (Jul) - 569 569 18 - 4428 (Aug) - 593 593 29 - 4139 (Sep) - 479 490 13 - 389
10 (Oct) - 577 577 44 - 34511 (Nov) - 584 584 24 - 32112 (Dec) - 620 620 31 - 290
販 売Sales
生 産Production
受 入Receipts
消 費Consumption
出荷 Shipments在 庫Inventory
その他Others
年 月Year and Month
3737

時系列表 (鉄鋼編) 製品
1 製品 Products (2) フェロアロイ Ferro-alloys
①生産業者分受払 Receipts and shipments by producers (単位:t、Unit:t)
フェロクロム Ferro-chromium
低炭素 Low-carbon ferro-chromium
平成19年 (2007) 11,708 2,295 2,700 10,811 - 4,65420 (2008) 13,888 2,082 3,579 12,641 - 4,26121 (2009) 7,698 991 1,660 7,561 - 3,72922 (2010) 16,208 1,468 2,071 15,998 - 3,33623 (2011) 17,217 2,003 3,214 16,610 - 2,242
平成21年度 (09FY) 11,368 1,115 1,835 10,410 - 3,88022 (10FY) 16,302 1,676 2,360 16,807 - 2,491
平成23年 1~3月 (Q1) 4,326 514 718 4,767 - 2,4914~6 (Q2) 4,356 497 786 3,232 - 3,3267~9 (Q3) 3,697 467 742 4,498 - 1,960
10~12 (Q4) 4,838 525 968 4,113 - 2,242
平成23年 1月 (Jan) 1,393 166 207 1,315 - 3,3732 (Feb) 1,364 130 210 1,559 - 3,0983 (Mar) 1,569 218 301 1,893 - 2,4914 (Apr) 1,311 225 306 1,178 - 2,5435 (May) 1,536 138 264 932 - 3,0216 (Jun) 1,509 134 216 1,122 - 3,326
7 (Jul) 1,387 156 237 1,421 - 3,2118 (Aug) 947 194 274 1,243 - 2,8359 (Sep) 1,363 117 231 1,834 - 1,96010 (Oct) 1,601 148 271 1,150 - 2,28811 (Nov) 1,675 210 336 1,351 - 2,48612 (Dec) 1,562 167 361 1,612 - 2,242
(単位:t、Unit:t)
生 産Production
年 月Year and Month 受 入
Receipts消 費
Consumption
出荷 Shipments在 庫Inventory
販 売Sales
その他Others
38
平成19年 (2007) 351,503 883 816 285,366 55,739 30,39220 (2008) 301,361 684 735 241,634 51,965 38,10221 (2009) 284,884 405 424 259,802 42,899 20,26622 (2010) 348,420 849 830 304,496 48,974 15,23423 (2011) 279,944 1,238 3,388 225,158 49,139 18,729
平成21年度 (09FY) 309,389 459 460 268,502 49,790 22,12122 (10FY) 339,555 933 933 299,856 47,784 14,035
平成23年 1~3月 (Q1) 74,730 219 245 64,785 11,118 14,0354~6 (Q2) 49,453 344 336 28,372 13,717 21,4057~9 (Q3) 84,450 323 1,614 64,428 12,022 28,114
10~12 (Q4) 71,311 352 1,193 67,573 12,282 18,729
平成23年 1月 (Jan) 30,031 87 96 26,006 4,215 15,0352 (Feb) 24,741 36 45 26,509 3,584 9,6743 (Mar) 19,958 96 104 12,270 3,319 14,0354 (Apr) 14,135 167 139 12,211 4,415 11,5715 (May) 12,111 72 63 4,160 4,719 14,8126 (Jun) 23,207 105 134 12,001 4,583 21,405
7 (Jul) 28,938 114 297 21,416 4,077 24,6678 (Aug) 26,688 80 556 23,983 4,182 22,7159 (Sep) 28,824 129 761 19,029 3,763 28,114
10 (Oct) 26,070 142 838 25,626 4,534 23,32711 (Nov) 22,530 114 217 20,202 4,348 21,20512 (Dec) 22,711 96 138 21,745 3,400 18,729
販 売Sales
その他Others
生 産Production
フェロニッケル Ferro-nickel
受 入Receipts
消 費Consumption
出荷 Shipments在 庫Inventory
年 月Year and Month
3838

時系列表 (鉄鋼編) 製品
1 製品 Products (2) フェロアロイ Ferro-alloys
①生産業者分受払 Receipts and shipments by producers (単位:t、Unit:t)
平成19年 (2007) - - - - - -20 (2008) - - - - - -21 (2009) - - - - - -22 (2010) - - - - - -23 (2011) - - - - - -
平成21年度 (09FY) - - - - - -22 (10FY) - - - - - -
平成23年 1~3月 (Q1) - - - - - -4~6 (Q2) - - - - - -7~9 (Q3) - - - - - -
10~12 (Q4) - - - - - -
平成23年 1月 (Jan) - - - - - -2 (Feb) - - - - - -3 (Mar) - - - - - -4 (Apr) - - - - - -5 (May) - - - - - -6 (Jun) - - - - - -
7 (Jul) - - - - - -8 (Aug) - - - - - -9 (Sep) - - - - - -
10 (Oct) - - - - - -11 (Nov) - - - - - -12 (Dec) - - - - - -
(単位:t、Unit:t)
年 月Year and Month
フェロタングステン Ferro-tungsten
生 産Production
受 入Receipts
消 費Consumption
出荷 Shipments在 庫Inventory
販 売Sales
その他Others
39
平成19年 (2007) 4,573 42 41 4,545 - 39120 (2008) 4,554 56 50 4,504 - 45021 (2009) 3,598 40 37 3,536 - 51522 (2010) 4,615 30 29 4,706 - 42523 (2011) 5,167 46 38 5,088 - 512
平成21年度 (09FY) 3,852 46 36 3,884 - 44722 (10FY) 5,005 30 30 4,941 - 511
平成23年 1~3月 (Q1) 1,405 8 9 1,318 - 5114~6 (Q2) 1,255 8 8 1,152 - 6147~9 (Q3) 1,216 24 16 1,226 - 612
10~12 (Q4) 1,291 6 5 1,392 - 512
平成23年 1月 (Jan) 390 6 6 453 - 3622 (Feb) 478 2 2 434 - 4063 (Mar) 537 - 1 431 - 5114 (Apr) 455 8 8 384 - 5825 (May) 416 - - 363 - 6356 (Jun) 384 - - 405 - 614
7 (Jul) 328 10 10 361 - 5818 (Aug) 401 6 6 417 - 5659 (Sep) 487 8 - 448 - 612
10 (Oct) 479 4 3 480 - 61211 (Nov) 445 - - 424 - 63312 (Dec) 367 2 2 488 - 512
販 売Sales
その他Others
生 産Production
受 入Receipts
消 費Consumption
出荷 Shipments在 庫Inventory
年 月Year and Month
フェロモリブデン Ferro-molybdenum
3939

時系列表 (鉄鋼編) 製品
1 製品 Products (2) フェロアロイ Ferro-alloys
①生産業者分受払 Receipts and shipments by producers (単位:t、Unit:t)
平成19年 (2007) 3,205 296 302 3,256 - 47820 (2008) 3,477 268 331 3,197 - 68621 (2009) 2,560 154 307 2,526 5 58022 (2010) 4,190 206 585 3,307 - 1,08423 (2011) 3,980 146 326 3,022 - 1,854
平成21年度 (09FY) 3,398 160 426 3,041 - 76122 (10FY) 4,082 196 510 3,155 - 1,369
平成23年 1~3月 (Q1) 1,035 20 67 698 - 1,3694~6 (Q2) 784 40 64 744 - 1,3857~9 (Q3) 1,030 38 61 691 - 1,698
10~12 (Q4) 1,131 48 134 889 - 1,854
平成23年 1月 (Jan) 346 12 24 306 - 1,1122 (Feb) 333 4 15 194 - 1,2403 (Mar) 356 4 28 198 - 1,3694 (Apr) 132 16 16 303 - 1,1985 (May) 256 16 21 210 - 1,2396 (Jun) 396 8 27 231 - 1,385
7 (Jul) 292 12 23 197 - 1,4698 (Aug) 341 16 24 236 - 1,5669 (Sep) 397 10 14 258 - 1,698
10 (Oct) 237 12 17 262 - 1,66811 (Nov) 465 16 52 295 - 1,80212 (Dec) 429 20 65 332 - 1,854
(単位:t、Unit:t)
販 売Sales
その他Others
受 入Receipts
消 費Consumption
出荷 Shipments生 産
Production
年 月Year and Month
フェロバナジウム Ferro-vanadium
在 庫Inventory
40
平成19年 (2007) 13,982 7,013 5,741 14,097 6 7,17520 (2008) 14,478 6,820 6,282 15,668 18 6,30021 (2009) 12,957 4,650 3,829 11,582 5 8,38222 (2010) 16,374 6,819 6,994 15,758 11 8,61623 (2011) 20,913 5,234 6,412 20,519 17 7,430
平成21年度 (09FY) 13,368 5,567 5,408 12,161 3 7,95722 (10FY) 19,124 6,616 6,793 17,653 19 8,876
平成23年 1~3月 (Q1) 5,888 1,289 1,697 5,024 8 8,8764~6 (Q2) 5,576 2,253 1,808 5,659 5 9,1197~9 (Q3) 4,271 1,337 1,355 5,470 - 7,850
10~12 (Q4) 5,178 355 1,552 4,366 4 7,430
平成23年 1月 (Jan) 2,004 1,055 535 1,625 8 9,4732 (Feb) 1,730 106 551 1,625 - 9,0993 (Mar) 2,154 128 611 1,774 - 8,8764 (Apr) 1,783 336 802 1,847 5 8,2925 (May) 1,978 671 513 1,876 - 8,5226 (Jun) 1,815 1,246 493 1,936 - 9,119
7 (Jul) 1,563 106 496 1,760 - 8,4988 (Aug) 1,267 112 443 1,922 - 7,5059 (Sep) 1,441 1,119 416 1,788 - 7,850
10 (Oct) 1,893 130 617 1,614 4 7,62611 (Nov) 1,735 100 441 1,471 - 7,53512 (Dec) 1,550 125 494 1,281 - 7,430
販 売Sales
その他Others
受 入Receipts
消 費Consumption
出荷 Shipments在 庫Inventory
生 産Production
年 月Year and Month
その他のフェロアロイ Other ferro-alloys
4040

時系列表 (鉄鋼編) 製品
1 製品 Products (2) フェロアロイ Ferro-alloys
② 製鋼業者分受払 Receipts and shipments by steel manufacturers (単位:t、Unit:t)
平成19年 (2007) 2,577,537 2,510,169 256,623 495,459 484,736 21,77920 (2008) 2,521,494 2,394,599 353,308 528,174 517,034 25,07021 (2009) 1,626,870 1,761,774 199,848 379,544 377,103 19,62022 (2010) 2,287,242 2,291,271 178,451 503,202 494,039 22,63923 (2011) 2,190,781 2,161,549 193,345 487,222 485,976 18,754
平成21年度 (09FY) 1,770,242 1,982,922 170,764 415,499 410,924 15,55922 (10FY) 2,308,539 2,305,482 160,271 515,568 506,876 18,493
平成23年 1~3月 (Q1) 548,667 567,226 160,271 124,024 126,593 18,4934~6 (Q2) 541,395 524,682 171,296 122,102 117,321 22,3367~9 (Q3) 565,016 548,008 184,297 115,753 120,106 16,882
10~12 (Q4) 535,703 521,633 193,345 125,343 121,956 18,754
平成23年 1月 (Jan) 196,531 195,854 177,627 45,078 43,834 23,4172 (Feb) 174,680 186,550 167,843 37,926 40,596 20,2523 (Mar) 177,456 184,822 160,271 41,020 42,163 18,4934 (Apr) 186,144 175,038 168,831 40,523 37,756 21,0565 (May) 167,901 170,780 164,462 41,007 40,117 21,6986 (Jun) 187,350 178,864 171,296 40,572 39,448 22,336
7 (Jul) 204,220 183,637 190,316 38,502 40,280 20,0848 (Aug) 176,952 182,886 183,227 40,609 40,885 19,4659 (Sep) 183,844 181,485 184,297 36,642 38,941 16,882
10 (Oct) 195,565 192,086 186,091 45,356 45,151 16,49211 (Nov) 179,339 168,479 194,793 41,506 39,414 18,12112 (Dec) 160,799 161,068 193,345 38,481 37,391 18,754
(単位:t、Unit:t)
ガ
受 入Receipts
消 費Consumption
計 Total合 計 Grand total
フェロマンガン Ferro-manganese
在 庫Inventory
受 入Receipts
消 費Consumption
在 庫Inventory
年 月Year and Month
41
平成19年 (2007) 413,481 403,758 17,283 81,978 80,978 4,49620 (2008) 429,299 419,763 18,875 98,875 97,271 6,19521 (2009) 316,964 313,965 13,979 62,580 63,138 5,64122 (2010) 420,756 414,471 14,130 82,446 79,568 8,50923 (2011) 409,304 405,250 12,903 77,918 80,726 5,851
平成21年度 (09FY) 347,738 342,820 11,046 67,761 68,104 4,51322 (10FY) 432,150 424,506 12,924 83,418 82,370 5,569
平成23年 1~3月 (Q1) 106,234 105,863 12,924 17,790 20,730 5,5694~6 (Q2) 103,033 98,671 16,208 19,069 18,650 6,1287~9 (Q3) 97,790 100,325 12,582 17,963 19,781 4,300
10~12 (Q4) 102,247 100,391 12,903 23,096 21,565 5,851
平成23年 1月 (Jan) 38,787 36,722 15,728 6,291 7,112 7,6892 (Feb) 32,213 33,693 13,762 5,713 6,903 6,4903 (Mar) 35,234 35,448 12,924 5,786 6,715 5,5694 (Apr) 33,726 32,020 14,286 6,797 5,736 6,7705 (May) 35,433 34,098 15,374 5,574 6,019 6,3246 (Jun) 33,874 32,553 16,208 6,698 6,895 6,128
7 (Jul) 32,351 33,551 14,557 6,151 6,729 5,5278 (Aug) 34,272 34,320 14,170 6,337 6,565 5,2959 (Sep) 31,167 32,454 12,582 5,475 6,487 4,300
10 (Oct) 36,938 36,927 11,979 8,418 8,224 4,51311 (Nov) 34,076 32,746 12,845 7,430 6,668 5,27612 (Dec) 31,233 30,718 12,903 7,248 6,673 5,851
受 入Receipts
消 費Consumption
高炭素 High-carbon ferro-manganese 低炭素 Low-carbon ferro-manganese
フェロマンガン Ferro-manganese
在 庫Inventory
受 入Receipts
消 費Consumption
在 庫Inventory
年 月Year and Month
4141

時系列表 (鉄鋼編) 製品
1 製品 Products (2) フェロアロイ Ferro-alloys
② 製鋼業者分受払 Receipts and shipments by steel manufacturers (単位:t、Unit:t)
平成19年 (2007) 328,825 324,942 31,002 373,815 369,821 28,464 953,874 911,046 133,59920 (2008) 341,346 332,668 38,890 393,946 386,710 29,156 881,014 808,194 193,77421 (2009) 221,831 236,890 24,184 289,533 294,551 20,210 485,166 569,990 103,33422 (2010) 260,263 257,396 26,953 394,957 387,771 23,365 764,539 784,196 77,59423 (2011) 250,961 251,996 24,252 374,258 372,684 21,291 742,294 720,408 96,489
平成21年度 (09FY) 229,564 242,624 21,066 332,545 330,735 22,514 508,150 670,771 87,27522 (10FY) 262,161 256,150 26,530 396,711 393,041 22,170 766,705 782,509 68,862
平成23年 1~3月 (Q1) 62,987 62,884 26,530 98,801 99,010 22,170 175,909 187,762 68,8624~6 (Q2) 63,440 63,776 25,089 87,450 91,434 17,474 191,329 174,033 83,7457~9 (Q3) 55,292 59,496 20,791 95,296 94,434 17,359 206,207 190,160 98,330
10~12 (Q4) 69,242 65,840 24,252 92,711 87,806 21,291 168,849 168,453 96,489
平成23年 1月 (Jan) 19,402 20,350 26,006 31,900 34,917 20,097 67,688 64,837 79,8332 (Feb) 22,298 21,498 26,321 33,805 32,025 21,545 51,795 61,821 73,0003 (Mar) 21,287 21,036 26,530 33,096 32,068 22,170 56,426 61,104 68,8624 (Apr) 21,371 20,802 25,991 28,794 30,424 20,323 67,470 59,066 76,4685 (May) 19,399 21,391 24,000 28,797 30,558 18,389 55,983 53,777 77,7876 (Jun) 22,670 21,583 25,089 29,859 30,452 17,474 67,876 61,190 83,745
7 (Jul) 20,374 20,171 25,204 32,826 31,299 18,641 79,270 62,980 99,5358 (Aug) 17,174 19,280 23,090 33,051 31,374 20,048 54,912 63,676 90,3469 (Sep) 17,744 20,045 20,791 29,419 31,761 17,359 72,025 63,504 98,33010 (Oct) 22,404 22,567 20,683 35,401 32,507 19,894 63,271 64,299 96,63311 (Nov) 21,143 21,985 19,836 31,627 28,234 22,910 55,331 53,395 97,39712 (Dec) 25,695 21,288 24,252 25,683 27,065 21,291 50,247 50,759 96,489
(単位:t、Unit:t)
在庫Inventory
在庫Inventory
受入Receipts
消費Consumption
在庫Inventory
受入Receipts
消費Consumption
計 Total年 月
Year and Month
シリコマンガン Silico-manganese フェロシリコン Ferro-siliconフェロクロム Ferro-chromium
受入Receipts
消費Consumption
42
平成19年 (2007) 901,752 859,655 126,139 52,122 51,391 7,460 304,801 303,538 26,38820 (2008) 831,019 760,340 184,758 49,995 47,854 9,016 260,413 236,874 49,45221 (2009) 458,646 539,784 98,157 26,520 30,206 5,177 176,196 206,448 19,06222 (2010) 722,055 742,130 72,372 42,484 42,066 5,222 246,388 250,755 15,12423 (2011) 695,391 675,082 90,566 46,903 45,326 5,923 223,163 221,486 17,368
平成21年度 (09FY) 477,793 637,962 82,354 30,357 32,809 4,921 198,685 238,468 12,95922 (10FY) 721,813 738,435 63,752 44,892 44,074 5,110 247,071 249,617 11,062
平成23年 1~3月 (Q1) 164,709 176,770 63,752 11,200 10,992 5,110 58,733 63,446 11,0624~6 (Q2) 180,055 163,315 78,463 11,274 10,718 5,282 52,476 53,599 9,8597~9 (Q3) 195,053 178,712 93,453 11,154 11,448 4,877 64,231 55,815 18,272
10~12 (Q4) 155,574 156,285 90,566 13,275 12,168 5,923 47,723 48,626 17,368
平成23年 1月 (Jan) 64,146 61,241 74,752 3,542 3,596 5,081 22,681 21,991 15,8122 (Feb) 48,010 58,494 67,599 3,785 3,327 5,401 19,563 21,731 13,9123 (Mar) 52,553 57,035 63,752 3,873 4,069 5,110 16,489 19,724 11,0624 (Apr) 63,424 55,288 71,178 4,046 3,778 5,290 19,207 18,832 11,4365 (May) 52,680 50,488 72,612 3,303 3,289 5,175 14,322 16,246 9,4336 (Jun) 63,951 57,539 78,463 3,925 3,651 5,282 18,947 18,521 9,859
7 (Jul) 75,896 59,356 94,559 3,374 3,624 4,976 25,029 20,011 14,8768 (Aug) 50,975 59,852 85,293 3,937 3,824 5,053 21,673 18,563 17,9859 (Sep) 68,182 59,504 93,453 3,843 4,000 4,877 17,529 17,241 18,27210 (Oct) 58,637 60,223 91,223 4,634 4,076 5,410 19,379 17,641 20,00911 (Nov) 51,149 49,073 92,141 4,182 4,322 5,256 17,618 15,593 22,03412 (Dec) 45,788 46,989 90,566 4,459 3,770 5,923 10,726 15,392 17,368
受入Receipts
消費Consumption
在庫Inventory
受入Receipts
消費Consumption
在庫Inventory
受入Receipts
消費Consumption
在庫Inventory
高炭素 High-carbon ferro-chromium 低炭素 Low-carbon ferro-chromium年 月
Year and Month
フェロクロム Ferro-chromiumフェロニッケル Ferro-nickel
4242

時系列表 (鉄鋼編) 製品
1 製品 Products (2) フェロアロイ Ferro-alloys
② 製鋼業者分受払 Receipts and shipments by steel manufacturers (単位:t、Unit:t)
平成19年 (2007) 1,081 1,137 290 5,712 5,513 1,08620 (2008) 1,407 1,253 412 5,762 5,421 1,27621 (2009) 429 548 270 3,012 3,286 92022 (2010) 1,450 1,363 307 5,553 5,508 90323 (2011) 1,563 1,559 274 5,745 5,265 1,238
平成21年度 (09FY) 578 682 266 3,381 3,792 83522 (10FY) 1,612 1,516 303 5,848 5,671 926
平成23年 1~3月 (Q1) 403 395 303 1,399 1,353 9264~6 (Q2) 435 389 341 1,270 1,221 9547~9 (Q3) 391 434 287 1,419 1,243 1,090
10~12 (Q4) 334 341 274 1,657 1,448 1,238
平成23年 1月 (Jan) 137 166 277 555 492 9602 (Feb) 172 125 317 439 441 9533 (Mar) 94 104 303 405 420 9264 (Apr) 133 131 303 484 434 9735 (May) 129 111 319 371 359 9866 (Jun) 173 147 341 415 428 954
7 (Jul) 113 153 297 395 424 9138 (Aug) 170 148 314 529 383 1,0549 (Sep) 108 133 287 495 436 1,09010 (Oct) 139 153 274 552 487 1,13411 (Nov) 127 107 288 536 490 1,15512 (Dec) 68 81 274 569 471 1,238
(単位:t、Unit:t)
受 入Receipts
消 費Consumption
在 庫Inventory
受 入Receipts
消 費Consumption
在 庫Inventory
年 月Year and Month
フェロタングステン Ferro-tungsten フェロモリブデン Ferro-molybdenum
43
平成19年 (2007) 7,630 7,409 950 106,340 102,027 13,06520 (2008) 7,883 7,230 1,332 101,549 99,215 13,94621 (2009) 4,235 4,362 1,028 66,924 68,596 11,22022 (2010) 6,415 6,281 1,013 104,475 103,962 10,55323 (2011) 6,578 6,452 1,026 98,997 95,723 12,653
平成21年度 (09FY) 4,704 4,834 832 77,136 80,092 9,45822 (10FY) 6,694 6,425 1,039 106,169 103,677 10,886
平成23年 1~3月 (Q1) 1,601 1,546 1,039 24,810 24,237 10,8864~6 (Q2) 1,571 1,557 1,032 21,322 21,352 10,4667~9 (Q3) 1,594 1,592 1,012 24,833 24,728 10,274
10~12 (Q4) 1,812 1,757 1,026 28,032 25,406 12,653
平成23年 1月 (Jan) 558 557 1,006 8,532 8,710 10,2192 (Feb) 552 513 1,038 8,130 7,800 10,5053 (Mar) 491 476 1,039 8,148 7,727 10,8864 (Apr) 568 511 1,094 7,594 7,082 11,1875 (May) 402 511 978 7,491 7,710 10,8726 (Jun) 601 535 1,032 6,237 6,560 10,466
7 (Jul) 413 521 918 7,298 7,798 9,8488 (Aug) 565 550 923 8,269 8,027 10,0029 (Sep) 616 521 1,012 9,266 8,903 10,27410 (Oct) 546 611 930 8,517 8,670 10,04211 (Nov) 630 557 990 10,821 8,704 12,06212 (Dec) 636 589 1,026 8,694 8,032 12,653
受 入Receipts
消 費Consumption
在 庫Inventory
受 入Receipts
消 費Consumption
在 庫Inventory
その他のフェロアロイ Other ferro-alloys
年 月Year and Month
フェロバナジウム Ferro-vanadium
4343

時系列表 (鉄鋼編) 製品
1 製品 Products (3) 粗鋼 Crude steel ① 生産 Production ア 合計 Grand total (単位:t、Unit:t)
平成19年 (2007) 120,202,937 119,002,807 1,260,355 117,742,452 674,458 525,672 89,242,363 89,219,484 418,48120 (2008) 118,739,328 117,507,637 1,260,645 116,246,992 688,464 543,227 89,238,291 89,220,201 364,39521 (2009) 87,534,137 86,685,913 574,089 86,111,824 496,997 351,227 68,337,358 68,325,469 240,69422 (2010) 109,598,507 108,642,288 986,998 107,655,290 568,646 387,573 85,755,570 85,755,023 272,71923 (2011) 107,601,194 106,608,386 1,085,503 105,522,883 569,988 422,820 82,743,436 82,741,997 224,923
平成21年度 (09FY) 96,448,064 95,617,704 640,373 94,977,331 487,986 342,374 75,748,472 75,740,959 227,52922 (10FY) 110,792,860 109,828,695 1,068,627 108,760,068 565,225 398,940 86,296,641 86,294,723 282,613
平成23年 1~3月 (Q1) 27,704,503 27,479,114 279,121 27,199,993 127,237 98,152 21,667,599 21,666,228 72,6704~6 (Q2) 26,367,965 26,109,969 268,540 25,841,429 150,523 107,473 19,990,800 19,990,765 45,5797~9 (Q3) 26,950,022 26,700,738 266,796 26,433,942 142,979 106,305 21,068,945 21,068,912 52,104
10~12 (Q4) 26,578,704 26,318,565 271,046 26,047,519 149,249 110,890 20,016,092 20,016,092 54,570
平成23年 1月 (Jan) 9,654,978 9,583,740 88,158 9,495,582 40,448 30,790 7,676,558 7,675,860 21,9292 (Feb) 8,931,208 8,854,112 93,330 8,760,782 43,466 33,630 6,913,711 6,913,129 25,9763 (Mar) 9,118,317 9,041,262 97,633 8,943,629 43,323 33,732 7,077,330 7,077,239 24,7654 (Apr) 8,433,043 8,344,474 84,939 8,259,535 52,688 35,881 6,328,752 6,328,717 15,4155 (May) 9,049,079 8,968,183 89,897 8,878,286 46,811 34,085 6,839,600 6,839,600 14,8416 (Jun) 8,885,843 8,797,312 93,704 8,703,608 51,024 37,507 6,822,448 6,822,448 15,323
7 (Jul) 9,152,148 9,067,349 95,167 8,972,182 48,759 36,040 7,200,370 7,200,337 17,7878 (Aug) 8,909,328 8,833,076 83,837 8,749,239 43,585 32,667 7,065,061 7,065,061 18,3319 (Sep) 8,888,546 8,800,313 87,792 8,712,521 50,635 37,598 6,803,514 6,803,514 15,98610 (Oct) 9,478,503 9,388,670 93,264 9,295,406 52,479 37,354 7,200,470 7,200,470 18,27211 (Nov) 8,697,228 8,609,298 94,975 8,514,323 49,735 38,195 6,492,873 6,492,873 19,25512 (Dec) 8,402,973 8,320,597 82,807 8,237,790 47,035 35,341 6,322,749 6,322,749 17,043
小 計Sub-total
インゴットケース
によるものIngot-case
連続鋳造によるもの Continuous
casting
小 計Sub-total
インゴットケース
によるものIngot-case
鋳鋼鋳込Liquid steelfor casting
計Total
年 月Year and Month
合 計 Grand total 転 炉 LD converters
計Total
圧延用鋼塊Steel ingots for rolling 鍛鋼用鋼塊
Steel ingots forforging steel
圧延用鋼塊Steel ingots for rolling
44
(単位:t、Unit:t)
平成19年 (2007) 88,801,003 22,879 30,960,574 29,783,323 841,874 28,941,449 651,579 525,67220 (2008) 88,855,806 18,090 29,501,037 28,287,436 896,250 27,391,186 670,374 543,22721 (2009) 68,084,775 11,889 19,196,779 18,360,444 333,395 18,027,049 485,108 351,22722 (2010) 85,482,304 547 23,842,937 22,887,265 714,279 22,172,986 568,099 387,57323 (2011) 82,517,074 1,439 24,857,758 23,866,389 860,580 23,005,809 568,549 422,820
平成21年度 (09FY) 75,513,430 7,513 20,699,592 19,876,745 412,844 19,463,901 480,473 342,37422 (10FY) 86,012,110 1,918 24,496,219 23,533,972 786,014 22,747,958 563,307 398,940
平成23年 1~3月 (Q1) 21,593,558 1,371 6,036,904 5,812,886 206,451 5,606,435 125,866 98,1524~6 (Q2) 19,945,186 35 6,377,165 6,119,204 222,961 5,896,243 150,488 107,4737~9 (Q3) 21,016,808 33 5,881,077 5,631,826 214,692 5,417,134 142,946 106,305
10~12 (Q4) 19,961,522 - 6,562,612 6,302,473 216,476 6,085,997 149,249 110,890
平成23年 1月 (Jan) 7,653,931 698 1,978,420 1,907,880 66,229 1,841,651 39,750 30,7902 (Feb) 6,887,153 582 2,017,497 1,940,983 67,354 1,873,629 42,884 33,6303 (Mar) 7,052,474 91 2,040,987 1,964,023 72,868 1,891,155 43,232 33,7324 (Apr) 6,313,302 35 2,104,291 2,015,757 69,524 1,946,233 52,653 35,8815 (May) 6,824,759 - 2,209,479 2,128,583 75,056 2,053,527 46,811 34,0856 (Jun) 6,807,125 - 2,063,395 1,974,864 78,381 1,896,483 51,024 37,507
7 (Jul) 7,182,550 33 1,951,778 1,867,012 77,380 1,789,632 48,726 36,0408 (Aug) 7,046,730 - 1,844,267 1,768,015 65,506 1,702,509 43,585 32,6679 (Sep) 6,787,528 - 2,085,032 1,996,799 71,806 1,924,993 50,635 37,59810 (Oct) 7,182,198 - 2,278,033 2,188,200 74,992 2,113,208 52,479 37,35411 (Nov) 6,473,618 - 2,204,355 2,116,425 75,720 2,040,705 49,735 38,19512 (Dec) 6,305,706 - 2,080,224 1,997,848 65,764 1,932,084 47,035 35,341
注:*印の品目は電気炉として計上。
Note: Item marked * is included in electric furnaces.
計Total
圧延用鋼塊Steel ingots for rolling 鍛鋼用鋼塊
Steel ingots for forging steel
*鋳鋼鋳込Liquid steelfor casting
連続鋳造によるもの
Continuouscasting
小 計Sub-total
インゴットケース
によるものIngot-case
連続鋳造によるもの Continuous
casting
年 月Year and Month
転炉 LD converters 電 気 炉 Electric furnaces圧延用鋼塊
Steel ingots forrolling 鍛鋼用鋼塊
Steel ingots forforging steel
44

時系列表 (鉄鋼編) 製品
1 製品 Products (3) 粗鋼 Crude steel ① 生産 Production イ 普通鋼 Ordinary steel (単位:t、Unit:t)
平成19年 (2007) 94,078,631 93,697,204 166,001 93,531,203 138,414 243,013 71,540,629 71,520,958 136,42020 (2008) 92,572,178 92,176,778 170,576 92,006,202 136,081 259,319 71,151,419 71,133,457 141,26221 (2009) 71,407,407 71,148,765 108,840 71,039,925 92,699 165,943 57,028,592 57,016,799 92,23922 (2010) 84,928,806 84,673,740 124,736 84,549,004 66,898 188,168 68,622,367 68,622,018 102,19123 (2011) 83,216,667 82,928,970 97,084 82,831,886 70,678 217,019 65,804,004 65,802,598 81,418
平成21年度 (09FY) 77,592,900 77,356,447 107,692 77,248,755 75,693 160,760 62,632,117 62,624,668 88,13722 (10FY) 85,646,176 85,383,357 129,035 85,254,322 65,219 197,600 68,940,496 68,938,776 107,099
平成23年 1~3月 (Q1) 21,500,137 21,436,850 33,799 21,403,051 14,301 48,986 17,386,256 17,384,885 28,9964~6 (Q2) 20,761,122 20,685,420 18,206 20,667,214 21,355 54,347 16,158,126 16,158,091 13,5067~9 (Q3) 20,774,359 20,699,594 22,388 20,677,206 19,653 55,112 16,671,786 16,671,786 18,842
10~12 (Q4) 20,181,049 20,107,106 22,691 20,084,415 15,369 58,574 15,587,836 15,587,836 20,074
平成23年 1月 (Jan) 7,469,438 7,449,516 11,679 7,437,837 4,497 15,425 6,131,713 6,131,015 9,9052 (Feb) 6,900,333 6,878,755 10,441 6,868,314 4,803 16,775 5,523,399 5,522,817 8,7953 (Mar) 7,130,366 7,108,579 11,679 7,096,900 5,001 16,786 5,731,144 5,731,053 10,2964 (Apr) 6,670,833 6,645,197 7,411 6,637,786 7,746 17,890 5,115,324 5,115,289 5,8965 (May) 7,141,583 7,117,573 5,330 7,112,243 6,472 17,538 5,526,476 5,526,476 3,8326 (Jun) 6,948,706 6,922,650 5,465 6,917,185 7,137 18,919 5,516,326 5,516,326 3,778
7 (Jul) 7,144,168 7,118,729 6,383 7,112,346 6,506 18,933 5,781,165 5,781,165 5,1138 (Aug) 6,844,135 6,821,453 8,748 6,812,705 6,004 16,678 5,544,242 5,544,242 7,8179 (Sep) 6,786,056 6,759,412 7,257 6,752,155 7,143 19,501 5,346,379 5,346,379 5,912
10 (Oct) 7,189,215 7,162,915 8,825 7,154,090 6,627 19,673 5,586,505 5,586,505 7,93511 (Nov) 6,604,278 6,580,462 6,205 6,574,257 3,878 19,938 5,073,905 5,073,905 5,34512 (Dec) 6,387,556 6,363,729 7,661 6,356,068 4,864 18,963 4,927,426 4,927,426 6,794
連続鋳造によるもの Continuous
casting
小 計Sub-total
インゴットケースによるものIngot-case
小 計Sub-total
計Total
圧延用鋼塊Steel ingots for rolling 鍛鋼用鋼塊
Steel ingots forforging steel
鋳鋼鋳込Liquid steelfor casting
計Totalインゴットケース
によるものIngot-case
圧延用鋼塊Steel ingots for rolling年 月
Year and Month
合 計 Grand total 転 炉 LD converters
45
(単位:t、Unit:t)
平成19年 (2007) 71,384,538 19,671 22,538,002 22,176,246 29,581 22,146,665 118,743 243,01320 (2008) 70,992,195 17,962 21,420,759 21,043,321 29,314 21,014,007 118,119 259,31921 (2009) 56,924,560 11,793 14,378,815 14,131,966 16,601 14,115,365 80,906 165,94322 (2010) 68,519,827 349 16,306,439 16,051,722 22,545 16,029,177 66,549 188,16823 (2011) 65,721,180 1,406 17,412,663 17,126,372 15,666 17,110,706 69,272 217,019
平成21年度 (09FY) 62,536,531 7,449 14,960,783 14,731,779 19,555 14,712,224 68,244 160,76022 (10FY) 68,831,677 1,720 16,705,680 16,444,581 21,936 16,422,645 63,499 197,600
平成23年 1~3月 (Q1) 17,355,889 1,371 4,113,881 4,051,965 4,803 4,047,162 12,930 48,9864~6 (Q2) 16,144,585 35 4,602,996 4,527,329 4,700 4,522,629 21,320 54,3477~9 (Q3) 16,652,944 - 4,102,573 4,027,808 3,546 4,024,262 19,653 55,112
10~12 (Q4) 15,567,762 - 4,593,213 4,519,270 2,617 4,516,653 15,369 58,574
平成23年 1月 (Jan) 6,121,110 698 1,337,725 1,318,501 1,774 1,316,727 3,799 15,4252 (Feb) 5,514,022 582 1,376,934 1,355,938 1,646 1,354,292 4,221 16,7753 (Mar) 5,720,757 91 1,399,222 1,377,526 1,383 1,376,143 4,910 16,7864 (Apr) 5,109,393 35 1,555,509 1,529,908 1,515 1,528,393 7,711 17,8905 (May) 5,522,644 - 1,615,107 1,591,097 1,498 1,589,599 6,472 17,5386 (Jun) 5,512,548 - 1,432,380 1,406,324 1,687 1,404,637 7,137 18,919
7 (Jul) 5,776,052 - 1,363,003 1,337,564 1,270 1,336,294 6,506 18,9338 (Aug) 5,536,425 - 1,299,893 1,277,211 931 1,276,280 6,004 16,6789 (Sep) 5,340,467 - 1,439,677 1,413,033 1,345 1,411,688 7,143 19,50110 (Oct) 5,578,570 - 1,602,710 1,576,410 890 1,575,520 6,627 19,67311 (Nov) 5,068,560 - 1,530,373 1,506,557 860 1,505,697 3,878 19,93812 (Dec) 4,920,632 - 1,460,130 1,436,303 867 1,435,436 4,864 18,963
注:*印の品目は電気炉として計上。
Note: Item marked * is included in electric furnaces.
連続鋳造によるもの Continuous
casting
計Total
圧延用鋼塊Steel ingots for rolling 鍛鋼用鋼塊
Steel ingots for forging steel
*鋳鋼鋳込Liquid steelfor casting
小 計Sub-total
インゴットケースによるものIngot-case
連続鋳造によるもの Continuous
casting
年 月Year and Month
転炉 LD converters 電 気 炉 Electric furnaces圧延用鋼塊
Steel ingots forrolling 鍛鋼用鋼塊
Steel ingots forforging steel
45

時系列表 (鉄鋼編) 製品
1 製品 Products (3) 粗鋼 Crude steel ① 生産 Production ウ 特殊鋼 Special steel (単位:t、Unit:t)
平成19年 (2007) 26,124,306 25,305,603 1,094,354 24,211,249 536,044 282,659 17,701,734 17,698,526 282,06120 (2008) 26,167,150 25,330,859 1,090,069 24,240,790 552,383 283,908 18,086,872 18,086,744 223,13321 (2009) 16,126,730 15,537,148 465,249 15,071,899 404,298 185,284 11,308,766 11,308,670 148,45522 (2010) 24,669,701 23,968,548 862,262 23,106,286 501,748 199,405 17,133,203 17,133,005 170,52823 (2011) 24,384,527 23,679,416 988,419 22,690,997 499,310 205,801 16,939,432 16,939,399 143,505
平成21年度 (09FY) 18,855,164 18,261,257 532,681 17,728,576 412,293 181,614 13,116,355 13,116,291 139,39222 (10FY) 25,146,684 24,445,338 939,592 23,505,746 500,006 201,340 17,356,145 17,355,947 175,514
平成23年 1~3月 (Q1) 6,204,366 6,042,264 245,322 5,796,942 112,936 49,166 4,281,343 4,281,343 43,6744~6 (Q2) 5,606,843 5,424,549 250,334 5,174,215 129,168 53,126 3,832,674 3,832,674 32,0737~9 (Q3) 6,175,663 6,001,144 244,408 5,756,736 123,326 51,193 4,397,159 4,397,126 33,262
10~12 (Q4) 6,397,655 6,211,459 248,355 5,963,104 133,880 52,316 4,428,256 4,428,256 34,496
平成23年 1月 (Jan) 2,185,540 2,134,224 76,479 2,057,745 35,951 15,365 1,544,845 1,544,845 12,0242 (Feb) 2,030,875 1,975,357 82,889 1,892,468 38,663 16,855 1,390,312 1,390,312 17,1813 (Mar) 1,987,951 1,932,683 85,954 1,846,729 38,322 16,946 1,346,186 1,346,186 14,4694 (Apr) 1,762,210 1,699,277 77,528 1,621,749 44,942 17,991 1,213,428 1,213,428 9,5195 (May) 1,907,496 1,850,610 84,567 1,766,043 40,339 16,547 1,313,124 1,313,124 11,0096 (Jun) 1,937,137 1,874,662 88,239 1,786,423 43,887 18,588 1,306,122 1,306,122 11,545
7 (Jul) 2,007,980 1,948,620 88,784 1,859,836 42,253 17,107 1,419,205 1,419,172 12,6748 (Aug) 2,065,193 2,011,623 75,089 1,936,534 37,581 15,989 1,520,819 1,520,819 10,5149 (Sep) 2,102,490 2,040,901 80,535 1,960,366 43,492 18,097 1,457,135 1,457,135 10,07410 (Oct) 2,289,288 2,225,755 84,439 2,141,316 45,852 17,681 1,613,965 1,613,965 10,33711 (Nov) 2,092,950 2,028,836 88,770 1,940,066 45,857 18,257 1,418,968 1,418,968 13,91012 (Dec) 2,015,417 1,956,868 75,146 1,881,722 42,171 16,378 1,395,323 1,395,323 10,249
小 計Sub-total
インゴットケースによるものIngot-case
連続鋳造によるもの Continuous
casting
計Total
圧延用鋼塊Steel ingots for rolling
小 計Sub-total
インゴットケースによるものIngot-case
転 炉 LD converters
計Total
圧延用鋼塊Steel ingots for rolling年 月
Year and Month
合 計 Grand total
鍛鋼用鋼塊Steel ingots forforging steel
鋳鋼鋳込Liquid steelfor casting
46
(単位:t、Unit:t)
平成19年 (2007) 17,416,465 3,208 8,422,572 7,607,077 812,293 6,794,784 532,836 282,65920 (2008) 17,863,611 128 8,080,278 7,244,115 866,936 6,377,179 552,255 283,90821 (2009) 11,160,215 96 4,817,964 4,228,478 316,794 3,911,684 404,202 185,28422 (2010) 16,962,477 198 7,536,498 6,835,543 691,734 6,143,809 501,550 199,40523 (2011) 16,795,894 33 7,445,095 6,740,017 844,914 5,895,103 499,277 205,801
平成21年度 (09FY) 12,976,899 64 5,738,809 5,144,966 393,289 4,751,677 412,229 181,61422 (10FY) 17,180,433 198 7,790,539 7,089,391 764,078 6,325,313 499,808 201,340
平成23年 1~3月 (Q1) 4,237,669 - 1,923,023 1,760,921 201,648 1,559,273 112,936 49,1664~6 (Q2) 3,800,601 - 1,774,169 1,591,875 218,261 1,373,614 129,168 53,1267~9 (Q3) 4,363,864 33 1,778,504 1,604,018 211,146 1,392,872 123,293 51,193
10~12 (Q4) 4,393,760 - 1,969,399 1,783,203 213,859 1,569,344 133,880 52,316
平成23年 1月 (Jan) 1,532,821 - 640,695 589,379 64,455 524,924 35,951 15,3652 (Feb) 1,373,131 - 640,563 585,045 65,708 519,337 38,663 16,8553 (Mar) 1,331,717 - 641,765 586,497 71,485 515,012 38,322 16,9464 (Apr) 1,203,909 - 548,782 485,849 68,009 417,840 44,942 17,9915 (May) 1,302,115 - 594,372 537,486 73,558 463,928 40,339 16,5476 (Jun) 1,294,577 - 631,015 568,540 76,694 491,846 43,887 18,588
7 (Jul) 1,406,498 33 588,775 529,448 76,110 453,338 42,220 17,1078 (Aug) 1,510,305 - 544,374 490,804 64,575 426,229 37,581 15,9899 (Sep) 1,447,061 - 645,355 583,766 70,461 513,305 43,492 18,09710 (Oct) 1,603,628 - 675,323 611,790 74,102 537,688 45,852 17,68111 (Nov) 1,405,058 - 673,982 609,868 74,860 535,008 45,857 18,25712 (Dec) 1,385,074 - 620,094 561,545 64,897 496,648 42,171 16,378
注:*印の品目は電気炉として計上。
Note: Item marked * is included in electric furnaces.
小 計Sub-total
インゴットケースによるものIngot-case
連続鋳造によるもの Continuous
casting
圧延用鋼塊Steel ingots for
rolling 鍛鋼用鋼塊Steel ingots forforging steel
連続鋳造によるもの Continuous
casting
転炉 LD converters 電 気 炉 Electric furnaces
計Total
圧延用鋼塊Steel ingots for rolling 鍛鋼用鋼塊
Steel ingots for forging steel
*鋳鋼鋳込Liquid steelfor casting
年 月Year and Month
46

時系列表 (鉄鋼編) 製品
1 製品 Products (3) 粗鋼 Crude steel ② 受入 Receipts
(単位:t、Unit:t)
平成19年 (2007) 830,296 82,853 747,443 811,083 71,190 739,893 19,213 11,663 7,55020 (2008) 808,917 84,615 724,302 790,554 73,639 716,915 18,363 10,976 7,38721 (2009) 429,935 71,645 358,290 412,652 61,102 351,550 17,283 10,543 6,74022 (2010) 587,379 68,355 519,024 570,590 57,661 512,929 16,789 10,694 6,09523 (2011) 517,749 36,936 480,813 500,568 25,437 475,131 17,181 11,499 5,682
平成21年度 (09FY) 493,872 70,726 423,146 477,768 60,920 416,848 16,104 9,806 6,29822 (10FY) 611,497 67,268 544,229 593,831 55,895 537,936 17,666 11,373 6,293
平成23年 1~3月 (Q1) 156,444 16,880 139,564 152,090 14,017 138,073 4,354 2,863 1,4914~6 (Q2) 95,848 7,275 88,573 91,575 4,390 87,185 4,273 2,885 1,3887~9 (Q3) 127,492 6,602 120,890 123,277 3,823 119,454 4,215 2,779 1,436
10~12 (Q4) 137,965 6,179 131,786 133,626 3,207 130,419 4,339 2,972 1,367
平成23年 1月 (Jan) 45,826 5,352 40,474 44,178 4,395 39,783 1,648 957 6912 (Feb) 54,993 6,024 48,969 53,621 5,066 48,555 1,372 958 4143 (Mar) 55,625 5,504 50,121 54,291 4,556 49,735 1,334 948 3864 (Apr) 26,786 2,143 24,643 25,336 1,224 24,112 1,450 919 5315 (May) 22,483 2,384 20,099 21,116 1,429 19,687 1,367 955 4126 (Jun) 46,579 2,748 43,831 45,123 1,737 43,386 1,456 1,011 445
7 (Jul) 43,653 1,794 41,859 42,328 900 41,428 1,325 894 4318 (Aug) 32,822 2,385 30,437 31,549 1,483 30,066 1,273 902 3719 (Sep) 51,017 2,423 48,594 49,400 1,440 47,960 1,617 983 63410 (Oct) 51,750 2,415 49,335 50,113 1,376 48,737 1,637 1,039 59811 (Nov) 44,571 2,111 42,460 43,135 1,090 42,045 1,436 1,021 41512 (Dec) 41,644 1,653 39,991 40,378 741 39,637 1,266 912 354
③ 費
計Total
普通鋼Ordinary
steel
特殊鋼Specialsteel
計Total
普通鋼Ordinary
steel
年 月Year and Month
合 計 Grand total 鋼 塊 Steel ingots 鋳鋼鋳込 Liquid steel for casting
特殊鋼Specialsteel
計Total
普通鋼Ordinary
steel
特殊鋼Specialsteel
47
③ 消費 Consumption(単位:t、Unit:t)
平成19年 (2007) 120,537,914 94,042,169 26,495,745 120,006,077 93,800,481 26,205,596 531,837 241,688 290,14920 (2008) 119,150,253 92,547,047 26,603,206 118,603,786 92,291,809 26,311,977 546,467 255,238 291,22921 (2009) 87,755,425 71,408,538 16,346,887 87,401,166 71,246,107 16,155,059 354,259 162,431 191,82822 (2010) 109,971,536 84,924,095 25,047,441 109,582,189 84,739,986 24,842,203 389,347 184,109 205,23823 (2011) 107,981,770 83,208,644 24,773,126 107,557,828 82,995,979 24,561,849 423,942 212,665 211,277
平成21年度 (09FY) 96,739,379 77,597,405 19,141,974 96,394,411 77,440,011 18,954,400 344,968 157,394 187,57422 (10FY) 111,183,080 85,640,432 25,542,648 110,782,500 85,447,233 25,335,267 400,580 193,199 207,381
平成23年 1~3月 (Q1) 27,804,840 21,500,110 6,304,730 27,706,310 21,452,167 6,254,143 98,530 47,943 50,5874~6 (Q2) 26,417,722 20,760,445 5,657,277 26,310,012 20,707,158 5,602,854 107,710 53,287 54,4237~9 (Q3) 27,058,911 20,769,858 6,289,053 26,952,247 20,715,805 6,236,442 106,664 54,053 52,611
10~12 (Q4) 26,700,297 20,178,231 6,522,066 26,589,259 20,120,849 6,468,410 111,038 57,382 53,656
平成23年 1月 (Jan) 9,682,109 7,469,060 2,213,049 9,651,012 7,454,012 2,197,000 31,097 15,048 16,0492 (Feb) 8,967,031 6,899,741 2,067,290 8,933,388 6,883,356 2,050,032 33,643 16,385 17,2583 (Mar) 9,155,700 7,131,309 2,024,391 9,121,910 7,114,799 2,007,111 33,790 16,510 17,2804 (Apr) 8,448,688 6,670,046 1,778,642 8,412,747 6,652,572 1,760,175 35,941 17,474 18,4675 (May) 9,058,662 7,140,300 1,918,362 9,024,506 7,123,107 1,901,399 34,156 17,193 16,9636 (Jun) 8,910,372 6,950,099 1,960,273 8,872,759 6,931,479 1,941,280 37,613 18,620 18,993
7 (Jul) 9,189,195 7,142,674 2,046,521 9,153,128 7,124,093 2,029,035 36,067 18,581 17,4868 (Aug) 8,931,697 6,843,232 2,088,465 8,899,159 6,827,036 2,072,123 32,538 16,196 16,3429 (Sep) 8,938,019 6,783,952 2,154,067 8,899,960 6,764,676 2,135,284 38,059 19,276 18,783
10 (Oct) 9,520,264 7,187,433 2,332,831 9,482,740 7,168,168 2,314,572 37,524 19,265 18,25911 (Nov) 8,736,332 6,604,325 2,132,007 8,698,040 6,584,689 2,113,351 38,292 19,636 18,65612 (Dec) 8,443,701 6,386,473 2,057,228 8,408,479 6,367,992 2,040,487 35,222 18,481 16,741
計Total
普通鋼Ordinary
steel
特殊鋼Specialsteel
計Total
普通鋼Ordinary
steel
特殊鋼Specialsteel
計Total
普通鋼Ordinary
steel
特殊鋼Specialsteel
年 月Year and Month
合 計 Grand total 鋼 塊 Steel ingots 鋳鋼鋳込 Liquid steel for casting
47

時系列表 (鉄鋼編) 製品
1 製品 Products (3) 粗鋼 Crude steel ④ 販売 Sales
(単位:t、Unit:t)
平成19年 (2007) 178,593 88,813 89,780 165,433 75,767 89,666 13,160 13,046 11420 (2008) 174,097 86,462 87,635 158,935 71,497 87,438 15,162 14,965 19721 (2009) 134,206 64,589 69,617 119,407 50,161 69,246 14,799 14,428 37122 (2010) 132,812 71,465 61,347 117,862 56,792 61,070 14,950 14,673 27723 (2011) 73,725 47,095 26,630 57,842 31,313 26,529 15,883 15,782 101
平成21年度 (09FY) 126,222 63,695 62,527 112,358 50,237 62,121 13,864 13,458 40622 (10FY) 132,215 70,445 61,770 116,371 54,839 61,532 15,844 15,606 238
平成23年 1~3月 (Q1) 32,765 16,996 15,769 28,799 13,068 15,731 3,966 3,928 384~6 (Q2) 14,692 10,754 3,938 10,694 6,794 3,900 3,998 3,960 387~9 (Q3) 14,250 10,685 3,565 10,411 6,871 3,540 3,839 3,814 25
10~12 (Q4) 12,018 8,660 3,358 7,938 4,580 3,358 4,080 4,080 -
平成23年 1月 (Jan) 8,340 5,377 2,963 7,027 4,064 2,963 1,313 1,313 -2 (Feb) 13,266 6,059 7,207 11,952 4,745 7,207 1,314 1,314 -3 (Mar) 11,159 5,560 5,599 9,820 4,259 5,561 1,339 1,301 384 (Apr) 4,904 3,283 1,621 3,605 2,022 1,583 1,299 1,261 385 (May) 3,977 2,846 1,131 2,665 1,534 1,131 1,312 1,312 -6 (Jun) 5,811 4,625 1,186 4,424 3,238 1,186 1,387 1,387 -
7 (Jul) 4,588 3,519 1,069 3,336 2,292 1,044 1,252 1,227 258 (Aug) 5,169 3,961 1,208 3,930 2,722 1,208 1,239 1,239 -9 (Sep) 4,493 3,205 1,288 3,145 1,857 1,288 1,348 1,348 -
10 (Oct) 5,153 3,960 1,193 3,728 2,535 1,193 1,425 1,425 -11 (Nov) 3,962 2,605 1,357 2,560 1,203 1,357 1,402 1,402 -12 (Dec) 2,903 2,095 808 1,650 842 808 1,253 1,253 -
⑤
普通鋼Ordinary
steel
特殊鋼Specialsteel
計Total
普通鋼Ordinary
steel
特殊鋼Specialsteel
計Total
計Total
普通鋼Ordinary
steel
特殊鋼Specialsteel
鋼 塊 Steel ingots 鋳鋼鋳込 Liquid steel for casting
年 月Year and Month
合 計 Grand total
48
⑤ その他 Others (単位:t、Unit:t)
平成19年 (2007) 303,781 29,694 274,087 303,781 29,694 274,087 - - -20 (2008) 247,293 26,911 220,382 247,293 26,911 220,382 - - -21 (2009) 85,823 11,885 73,938 85,823 11,885 73,938 - - -22 (2010) 57,069 462 56,607 57,069 462 56,607 - - -23 (2011) 57,644 1,616 56,028 57,644 1,616 56,028 - - -
平成21年度 (09FY) 72,903 7,545 65,358 72,903 7,545 65,358 - - -22 (10FY) 58,492 1,850 56,642 58,492 1,850 56,642 - - -
平成23年 1~3月 (Q1) 15,251 1,413 13,838 15,251 1,413 13,838 - - -4~6 (Q2) 14,201 127 14,074 14,201 127 14,074 - - -7~9 (Q3) 14,722 25 14,697 14,722 25 14,697 - - -
10~12 (Q4) 13,470 51 13,419 13,470 51 13,419 - - -
平成23年 1月 (Jan) 5,200 740 4,460 5,200 740 4,460 - - -2 (Feb) 4,937 582 4,355 4,937 582 4,355 - - -3 (Mar) 5,114 91 5,023 5,114 91 5,023 - - -4 (Apr) 4,753 60 4,693 4,753 60 4,693 - - -5 (May) 4,917 46 4,871 4,917 46 4,871 - - -6 (Jun) 4,531 21 4,510 4,531 21 4,510 - - -
7 (Jul) 5,258 - 5,258 5,258 - 5,258 - - -8 (Aug) 4,712 - 4,712 4,712 - 4,712 - - -9 (Sep) 4,752 25 4,727 4,752 25 4,727 - - -
10 (Oct) 4,857 51 4,806 4,857 51 4,806 - - -11 (Nov) 5,039 - 5,039 5,039 - 5,039 - - -12 (Dec) 3,574 - 3,574 3,574 - 3,574 - - -
計Total
普通鋼Ordinary
steel
特殊鋼Specialsteel
計Total
普通鋼Ordinary
steel
特殊鋼Specialsteel
計Total
年 月Year and Month
合 計 Grand total 鋼 塊 Steel ingots 鋳鋼鋳込 Liquid steel for casting
普通鋼Ordinary
steel
特殊鋼Specialsteel
48

時系列表 (鉄鋼編) 製品
1 製品 Products (3) 粗鋼 Crude steel ⑥ 在庫 Inventory
(単位:t、Unit:t)
平成19年 (2007) 97,785 22,853 74,932 96,283 21,962 74,321 1,502 891 61120 (2008) 74,124 19,224 54,900 72,691 18,247 54,444 1,433 977 45621 (2009) 62,499 13,307 49,192 61,577 12,658 48,919 922 649 27322 (2010) 87,274 14,445 72,829 86,287 13,716 72,571 987 729 25823 (2011) 92,630 10,692 81,938 91,468 9,894 81,574 1,162 798 364
平成21年度 (09FY) 64,822 12,228 52,594 64,008 11,689 52,319 814 539 27522 (10FY) 95,224 12,942 82,282 94,228 12,236 81,992 996 706 290
平成23年 1~3月 (Q1) 95,224 12,942 82,282 94,228 12,236 81,992 996 706 2904~6 (Q2) 112,284 10,014 102,270 111,250 9,323 101,927 1,034 691 3437~9 (Q3) 101,777 10,405 91,372 100,727 9,691 91,036 1,050 714 336
10~12 (Q4) 92,630 10,692 81,938 91,468 9,894 81,574 1,162 798 364
平成23年 1月 (Jan) 92,368 14,058 78,310 91,353 13,308 78,045 1,015 750 2652 (Feb) 93,266 14,034 79,232 92,206 13,250 78,956 1,060 784 2763 (Mar) 95,224 12,942 82,282 94,228 12,236 81,992 996 706 2904 (Apr) 96,700 12,529 84,171 95,613 11,749 83,864 1,087 780 3075 (May) 100,643 13,305 87,338 99,571 12,536 87,035 1,072 769 3036 (Jun) 112,284 10,014 102,270 111,250 9,323 101,927 1,034 691 343
7 (Jul) 109,037 9,783 99,254 107,957 9,073 98,884 1,080 710 3708 (Aug) 109,288 9,109 100,179 108,046 8,255 99,791 1,242 854 3889 (Sep) 101,777 10,405 91,372 100,727 9,691 91,036 1,050 714 336
10 (Oct) 101,748 10,591 91,157 100,655 9,855 90,800 1,093 736 35711 (Nov) 98,198 10,051 88,147 97,168 9,394 87,774 1,030 657 37312 (Dec) 92,630 10,692 81,938 91,468 9,894 81,574 1,162 798 364
(4) 鋼半製品 Semi-finished steel合
普通鋼Ordinary
steel
特殊鋼Specialsteel
計Total
普通鋼Ordinary
steel
特殊鋼Specialsteel
計Total
普通鋼Ordinary
steel
特殊鋼Specialsteel
計Total
鋳鋼鋳込 Liquid steel for casting
年 月Year and Month
合 計 Grand total 鋼 塊 Steel ingots
49
ア 合計 Grand total(単位:t、Unit:t)
平成19年 (2007) 116,941,386 8,914,880 112,817,536 8,919,161 9,400,227 3,643,60120 (2008) 115,357,783 8,760,683 110,517,652 8,977,887 9,130,757 4,226,88421 (2009) 85,359,365 4,739,827 80,444,969 7,952,191 5,397,562 3,636,15122 (2010) 106,960,339 7,985,021 102,943,290 8,864,703 7,775,219 3,241,17323 (2011) 104,593,516 7,000,238 99,974,596 8,258,163 6,984,213 3,915,665
平成21年度 (09FY) 94,366,869 5,714,471 90,195,918 8,524,175 6,382,693 2,988,87422 (10FY) 107,999,034 7,931,824 103,198,950 8,960,283 7,711,112 3,275,132
平成23年 1~3月 (Q1) 26,998,264 1,900,996 25,794,610 2,208,867 1,920,733 3,275,1324~6 (Q2) 25,538,794 1,792,250 24,274,291 2,044,771 1,798,209 3,479,5587~9 (Q3) 26,230,730 1,761,424 25,174,641 2,046,019 1,734,767 3,639,145
10~12 (Q4) 25,825,728 1,545,568 24,731,054 1,958,506 1,530,504 3,915,665
平成23年 1月 (Jan) 9,422,989 693,651 8,982,591 723,037 693,544 3,334,8572 (Feb) 8,703,508 658,171 8,339,207 706,726 682,562 3,286,2923 (Mar) 8,871,767 549,174 8,472,812 779,104 544,627 3,275,1324 (Apr) 8,159,663 625,802 7,746,722 615,030 597,141 3,431,8475 (May) 8,750,182 602,657 8,287,367 697,988 642,613 3,516,1916 (Jun) 8,628,949 563,791 8,240,202 731,753 558,455 3,479,558
7 (Jul) 8,908,571 565,938 8,431,642 710,928 542,970 3,650,7428 (Aug) 8,649,411 604,097 8,486,182 660,355 642,417 3,504,8809 (Sep) 8,672,748 591,389 8,256,817 674,736 549,380 3,639,14510 (Oct) 9,212,325 535,177 8,710,865 725,864 514,743 3,821,49011 (Nov) 8,437,869 489,331 8,240,648 643,034 496,851 3,750,79912 (Dec) 8,175,534 521,060 7,779,541 589,608 518,910 3,915,665
在 庫Inventory
生 産Production
受 入Receipts
その他Others
販 売Sales
年 月Year and Month
合 計 Grand total
消 費Consumption
出 荷 Shipments
49

時系列表 (鉄鋼編) 製品
1 製品 Products (4) 鋼半製品 Semi-finished steel イ 普通鋼 Ordinary steel
(単位:t、Unit:t)
平成19年 (2007) 93,094,512 6,195,319 86,652,770 7,451,063 5,968,865 2,343,98120 (2008) 91,600,759 6,185,780 84,361,044 7,468,906 5,898,805 2,981,83621 (2009) 70,757,011 3,099,713 64,171,131 7,237,970 3,270,887 2,528,45822 (2010) 84,078,680 5,400,477 78,138,182 7,503,407 4,595,643 2,072,93823 (2011) 82,335,467 4,425,285 75,465,406 7,047,583 3,846,547 2,633,597
平成21年度 (09FY) 76,907,240 3,810,363 70,765,030 7,633,068 3,891,000 1,945,90822 (10FY) 84,802,803 5,264,148 78,040,589 7,581,958 4,473,270 2,118,317
平成23年 1~3月 (Q1) 21,295,129 1,241,524 19,514,817 1,891,120 1,118,164 2,118,3174~6 (Q2) 20,531,418 1,188,368 18,763,324 1,785,810 1,066,395 2,276,5007~9 (Q3) 20,556,477 1,131,538 18,941,809 1,716,208 936,772 2,403,404
10~12 (Q4) 19,952,443 863,855 18,245,456 1,654,445 725,216 2,633,597
平成23年 1月 (Jan) 7,403,001 459,874 6,783,014 620,442 406,052 2,149,0332 (Feb) 6,839,497 431,204 6,303,579 598,700 410,431 2,102,7993 (Mar) 7,052,631 350,446 6,428,224 671,978 301,681 2,118,3174 (Apr) 6,597,145 410,256 6,018,563 539,847 353,979 2,236,0355 (May) 7,063,361 424,422 6,408,611 611,904 418,350 2,313,9946 (Jun) 6,870,912 353,690 6,336,150 634,059 294,066 2,276,500
7 (Jul) 7,069,767 348,217 6,386,838 593,684 283,296 2,442,5948 (Aug) 6,766,900 409,357 6,403,976 555,222 376,099 2,301,2909 (Sep) 6,719,810 373,964 6,150,995 567,302 277,377 2,403,404
10 (Oct) 7,112,426 287,197 6,425,872 603,523 228,113 2,551,60911 (Nov) 6,526,575 282,441 6,088,206 551,087 240,316 2,500,76112 (Dec) 6,313,442 294,217 5,731,378 499,835 256,787 2,633,597
鋼
販 売Sales
その他Others
生 産Production
年 月Year and Month
普通鋼 Ordinary steel
受 入Receipts
消 費Consumption
出 荷 Shipments在 庫
Inventory
50
ウ 特殊鋼 Special steel(単位:t、Unit:t)
平成19年 (2007) 23,846,874 2,719,561 26,164,766 1,468,098 3,431,362 1,299,62020 (2008) 23,757,024 2,574,903 26,156,608 1,508,981 3,231,952 1,245,04821 (2009) 14,602,354 1,640,114 16,273,838 714,221 2,126,675 1,107,69322 (2010) 22,881,659 2,584,544 24,805,108 1,361,296 3,179,576 1,168,23523 (2011) 22,258,049 2,574,953 24,509,190 1,210,580 3,137,666 1,282,068
平成21年度 (09FY) 17,459,629 1,904,108 19,430,888 891,107 2,491,693 1,042,96622 (10FY) 23,196,231 2,667,676 25,158,361 1,378,325 3,237,842 1,156,815
平成23年 1~3月 (Q1) 5,703,135 659,472 6,279,793 317,747 802,569 1,156,8154~6 (Q2) 5,007,376 603,882 5,510,967 258,961 731,814 1,203,0587~9 (Q3) 5,674,253 629,886 6,232,832 329,811 797,995 1,235,741
10~12 (Q4) 5,873,285 681,713 6,485,598 304,061 805,288 1,282,068
平成23年 1月 (Jan) 2,019,988 233,777 2,199,577 102,595 287,492 1,185,8242 (Feb) 1,864,011 226,967 2,035,628 108,026 272,131 1,183,4933 (Mar) 1,819,136 198,728 2,044,588 107,126 242,946 1,156,8154 (Apr) 1,562,518 215,546 1,728,159 75,183 243,162 1,195,8125 (May) 1,686,821 178,235 1,878,756 86,084 224,263 1,202,1976 (Jun) 1,758,037 210,101 1,904,052 97,694 264,389 1,203,058
7 (Jul) 1,838,804 217,721 2,044,804 117,244 259,674 1,208,1488 (Aug) 1,882,511 194,740 2,082,206 105,133 266,318 1,203,5909 (Sep) 1,952,938 217,425 2,105,822 107,434 272,003 1,235,741
10 (Oct) 2,099,899 247,980 2,284,993 122,341 286,630 1,269,88111 (Nov) 1,911,294 206,890 2,152,442 91,947 256,535 1,250,03812 (Dec) 1,862,092 226,843 2,048,163 89,773 262,123 1,282,068
在 庫Inventory
その他Others
販 売Sales
消 費Consumption
出 荷 Shipments生 産
Production受 入
Receipts
年 月Year and Month
特殊鋼 Special steel
50

時系列表 (鉄鋼編) 製品
1 製品 Products (5) 鍛鋼品(打放) Steel forgings ア 合計 Grand total
(単位:t、Unit:t)
平成19年 (2007) 742,106 97 219,911 508,179 11,773 22,27920 (2008) 738,143 80 234,665 493,686 9,825 21,93321 (2009) 493,825 138 213,038 280,945 5,273 16,19822 (2010) 613,481 124 227,014 373,224 7,149 21,62123 (2011) 622,731 38 201,098 412,025 7,767 22,698
平成21年度 (09FY) 510,691 71 202,560 302,258 5,832 16,97022 (10FY) 622,898 114 220,678 388,562 7,127 22,866
平成23年 1~3月 (Q1) 147,316 11 43,535 100,762 1,684 22,8664~6 (Q2) 147,964 4 52,245 93,367 1,862 23,3457~9 (Q3) 159,182 18 51,420 105,784 2,054 22,971
10~12 (Q4) 168,269 5 53,898 112,112 2,167 22,698
平成23年 1月 (Jan) 43,516 - 11,233 31,541 494 21,8612 (Feb) 51,218 3 15,170 34,769 635 22,4563 (Mar) 52,582 8 17,132 34,452 555 22,8664 (Apr) 49,495 4 20,787 29,449 660 21,4635 (May) 45,160 - 14,654 29,180 546 22,2366 (Jun) 53,309 - 16,804 34,738 656 23,345
7 (Jul) 54,791 - 18,097 35,671 719 23,5878 (Aug) 48,884 - 15,033 33,108 614 23,5859 (Sep) 55,507 18 18,290 37,005 721 22,97110 (Oct) 57,661 - 17,349 38,912 738 23,53611 (Nov) 54,273 5 16,991 37,448 772 22,45612 (Dec) 56,335 - 19,558 35,752 657 22,698
普 鋼
販 売Sales
その他Others
年 月Year and Month
合 計 Grand total
生 産Production
受 入Receipts
消 費Consumption
出 荷 Shipments在 庫
Inventory
51
イ 普通鋼 Ordinary steel(単位:t、Unit:t)
平成19年 (2007) 208,110 29 66,121 137,889 3,705 10,07920 (2008) 214,672 21 73,650 139,040 2,874 9,21621 (2009) 124,321 12 61,202 63,461 1,463 7,42822 (2010) 157,242 17 61,402 91,385 2,041 9,86423 (2011) 162,750 15 48,549 111,756 2,588 9,735
平成21年度 (09FY) 127,642 15 56,299 70,286 1,653 6,89322 (10FY) 163,131 22 56,369 100,892 2,102 10,688
平成23年 1~3月 (Q1) 40,003 8 9,466 29,089 632 10,6884~6 (Q2) 42,191 1 15,164 25,798 647 11,2727~9 (Q3) 39,482 2 12,351 26,771 634 11,000
10~12 (Q4) 41,074 4 11,568 30,098 675 9,735
平成23年 1月 (Jan) 11,572 - 2,625 8,735 132 9,9442 (Feb) 13,567 - 3,410 9,692 207 10,2033 (Mar) 14,864 8 3,431 10,662 293 10,6884 (Apr) 13,394 1 6,084 8,270 251 9,4785 (May) 12,531 - 3,309 8,391 159 10,1516 (Jun) 16,266 - 5,771 9,137 237 11,272
7 (Jul) 13,830 - 4,129 9,382 253 11,3398 (Aug) 12,949 - 4,196 8,613 99 11,3809 (Sep) 12,703 2 4,026 8,776 282 11,00010 (Oct) 14,720 - 3,681 10,697 230 11,11211 (Nov) 13,365 4 3,966 10,088 223 10,20312 (Dec) 12,989 - 3,921 9,313 222 9,735
在 庫Inventory
年 月Year and Month
普通鋼 Ordinary steel
生 産Production
受 入Receipts
消 費Consumption
出 荷 Shipments
販 売Sales
その他Others
51

時系列表 (鉄鋼編) 製品
1 製品 Products (5) 鍛鋼品(打放) Steel forgings ウ 特殊鋼 Special steel
(単位:t、Unit:t)
平成19年 (2007) 533,996 68 153,790 370,290 8,068 12,20020 (2008) 523,471 59 161,015 354,646 6,951 12,71721 (2009) 369,504 126 151,836 217,484 3,810 8,77022 (2010) 456,239 107 165,612 281,839 5,108 11,75723 (2011) 459,981 23 152,549 300,269 5,179 12,963
平成21年度 (09FY) 383,049 56 146,261 231,972 4,179 10,07722 (10FY) 459,767 92 164,309 287,670 5,025 12,178
平成23年 1~3月 (Q1) 107,313 3 34,069 71,673 1,052 12,1784~6 (Q2) 105,773 3 37,081 67,569 1,215 12,0737~9 (Q3) 119,700 16 39,069 79,013 1,420 11,971
10~12 (Q4) 127,195 1 42,330 82,014 1,492 12,963
平成23年 1月 (Jan) 31,944 - 8,608 22,806 362 11,9172 (Feb) 37,651 3 11,760 25,077 428 12,2533 (Mar) 37,718 - 13,701 23,790 262 12,1784 (Apr) 36,101 3 14,703 21,179 409 11,9855 (May) 32,629 - 11,345 20,789 387 12,0856 (Jun) 37,043 - 11,033 25,601 419 12,073
7 (Jul) 40,961 - 13,968 26,289 466 12,2488 (Aug) 35,935 - 10,837 24,495 515 12,2059 (Sep) 42,804 16 14,264 28,229 439 11,97110 (Oct) 42,941 - 13,668 28,215 508 12,42411 (Nov) 40,908 1 13,025 27,360 549 12,25312 (Dec) 43,346 - 15,637 26,439 435 12,963
(6) 鋳鋼品(鋳放) Steel castings
合
販 売Sales
その他Others
生 産Production
受 入Receipts
消 費Consumption
出 荷 Shipments在 庫
Inventory
年 月Year and Month
特殊鋼 Special steel
52
ア 合計 Grand total(単位:t、Unit:t)
平成19年 (2007) 302,612 345 121,926 178,999 1,089 24,60120 (2008) 309,065 223 130,870 176,534 1,320 24,56521 (2009) 206,766 67 80,551 129,054 907 20,51722 (2010) 218,441 132 86,568 131,214 934 19,67923 (2011) 230,369 112 87,766 141,448 832 19,347
平成21年度 (09FY) 198,229 80 76,550 124,027 866 18,81222 (10FY) 223,954 119 89,707 132,963 973 18,462
平成23年 1~3月 (Q1) 54,543 28 22,188 33,087 285 18,4624~6 (Q2) 58,177 49 22,259 34,423 211 19,6317~9 (Q3) 57,382 19 21,616 35,801 191 19,237
10~12 (Q4) 60,267 16 21,703 38,137 145 19,347
平成23年 1月 (Jan) 17,401 2 7,087 10,575 71 19,2512 (Feb) 18,604 11 7,090 11,448 106 19,1573 (Mar) 18,538 15 8,011 11,064 108 18,4624 (Apr) 19,223 14 7,470 11,500 84 18,5985 (May) 18,759 14 6,989 10,967 61 19,2916 (Jun) 20,195 21 7,800 11,956 66 19,631
7 (Jul) 19,485 9 7,649 11,845 89 19,4958 (Aug) 17,873 5 6,169 11,637 52 19,4849 (Sep) 20,024 5 7,798 12,319 50 19,23710 (Oct) 19,990 12 7,394 12,614 56 19,18011 (Nov) 20,695 1 7,403 13,161 48 19,11912 (Dec) 19,582 3 6,906 12,362 41 19,347
その他Others
生 産Production
受 入Receipts
消 費Consumption
出 荷 Shipments在 庫
Inventory販 売Sales
年 月Year and Month
合 計 Grand total
52

時系列表 (鉄鋼編) 製品
1 製品 Products
(6) 鋳鋼品(鋳放) Steel castings
イ 普通鋼 Ordinary steel(単位:t、Unit:t)
平成19年 (2007) 152,082 138 46,660 104,341 296 13,35820 (2008) 158,653 12 53,861 103,352 303 13,97821 (2009) 105,168 8 23,808 82,763 309 12,06022 (2010) 116,295 - 36,834 80,358 294 10,36723 (2011) 129,224 8 45,514 83,041 292 10,173
平成21年度 (09FY) 101,223 8 22,978 79,531 336 10,51822 (10FY) 121,682 - 41,441 79,923 303 9,990
平成23年 1~3月 (Q1) 30,133 - 11,004 19,263 94 9,9904~6 (Q2) 31,995 8 11,295 19,904 81 10,5757~9 (Q3) 32,673 - 10,856 21,490 77 10,635
10~12 (Q4) 34,423 - 12,359 22,384 40 10,173
平成23年 1月 (Jan) 9,647 - 3,490 6,284 27 10,1542 (Feb) 10,211 - 3,438 6,505 29 10,3503 (Mar) 10,275 - 4,076 6,474 38 9,9904 (Apr) 10,479 - 3,904 6,540 36 9,9385 (May) 10,411 - 3,436 6,362 22 10,4836 (Jun) 11,105 8 3,955 7,002 23 10,575
7 (Jul) 11,146 - 3,936 7,095 33 10,6178 (Aug) 10,124 - 2,909 6,867 32 10,8879 (Sep) 11,403 - 4,011 7,528 12 10,63510 (Oct) 11,493 - 4,283 7,270 14 10,58211 (Nov) 11,731 - 4,274 7,879 10 10,07112 (Dec) 11,199 - 3,802 7,235 16 10,173
鋼
その他Others
消 費Consumption
出 荷 Shipments在 庫
Inventory生 産
Production受 入
Receipts
年 月Year and Month
普通鋼 Ordinary steel
販 売Sales
53
ウ 特殊鋼 Special steel(単位:t、Unit:t)
平成19年 (2007) 150,530 207 75,266 74,658 793 11,24320 (2008) 150,412 211 77,009 73,182 1,017 10,58721 (2009) 101,598 59 56,743 46,291 598 8,45722 (2010) 102,146 132 49,734 50,856 640 9,31223 (2011) 101,145 104 42,252 58,407 540 9,174
平成21年度 (09FY) 97,006 72 53,572 44,496 530 8,29422 (10FY) 102,272 119 48,266 53,040 670 8,472
平成23年 1~3月 (Q1) 24,410 28 11,184 13,824 191 8,4724~6 (Q2) 26,182 41 10,964 14,519 130 9,0567~9 (Q3) 24,709 19 10,760 14,311 114 8,602
10~12 (Q4) 25,844 16 9,344 15,753 105 9,174
平成23年 1月 (Jan) 7,754 2 3,597 4,291 44 9,0972 (Feb) 8,393 11 3,652 4,943 77 8,8073 (Mar) 8,263 15 3,935 4,590 70 8,4724 (Apr) 8,744 14 3,566 4,960 48 8,6605 (May) 8,348 14 3,553 4,605 39 8,8086 (Jun) 9,090 13 3,845 4,954 43 9,056
7 (Jul) 8,339 9 3,713 4,750 56 8,8788 (Aug) 7,749 5 3,260 4,770 20 8,5979 (Sep) 8,621 5 3,787 4,791 38 8,602
10 (Oct) 8,497 12 3,111 5,344 42 8,59811 (Nov) 8,964 1 3,129 5,282 38 9,04812 (Dec) 8,383 3 3,104 5,127 25 9,174
販 売Sales
その他Others
生 産Production
受 入Receipts
消 費Consumption
出 荷 Shipments在 庫
Inventory
年 月Year and Month
特殊鋼 Special steel
53

時系列表 (鉄鋼編) 製品
1. 製品 Products (7) 普通鋼熱間圧延鋼材 Ordinary hot-rolled steel
内再生鋼材Reclaimed steel
平成19年 (2007) 86,704,377 97,184 1,765,814 24,892,074 (34,674,042) 57,332,059 5,977,442 (469,564) 2,831,19620 (2008) 84,299,487 89,919 2,007,135 24,303,160 (33,826,713) 56,144,227 6,219,170 (518,285) 2,423,73321 (2009) 63,416,561 60,411 978,842 17,533,802 (23,991,182) 42,674,921 3,979,498 (367,837) 2,517,25322 (2010) 77,259,514 68,995 1,488,653 23,751,399 (31,774,395) 49,283,657 5,269,827 (419,119) 2,764,14623 (2011) 74,492,268 58,456 1,315,999 21,721,052 (29,691,248) 49,005,382 4,924,240 (447,023) 2,723,360
平成21年度 (09FY) 69,833,034 64,746 1,197,010 20,645,949 (27,800,402) 45,360,026 4,543,360 (401,399) 2,517,75422 (10FY) 77,198,440 67,208 1,491,913 23,536,874 (31,562,746) 49,653,485 5,162,739 (411,901) 2,648,525
平成23年 1~3月 (Q1) 19,390,330 16,686 416,659 5,805,235 (7,809,282) 12,772,759 1,288,647 (411,901) 2,648,5254~6 (Q2) 18,528,226 14,991 301,970 5,173,488 (7,139,236) 12,232,833 1,134,667 (457,259) 2,869,4767~9 (Q3) 18,586,458 12,596 298,606 5,782,923 (7,728,738) 11,876,900 1,280,134 (508,110) 2,752,147
10~12 (Q4) 17,987,254 14,183 298,764 4,959,406 (7,013,992) 12,122,890 1,220,792 (447,023) 2,723,360
平成23年 1月 (Jan) 6,642,386 4,903 141,049 2,069,347 (2,748,469) 4,174,728 461,232 (434,991) 2,818,0692 (Feb) 6,266,717 5,595 147,733 1,845,949 (2,471,697) 4,009,965 402,253 (411,569) 2,962,0583 (Mar) 6,481,227 6,188 127,877 1,889,939 (2,589,116) 4,588,066 425,162 (411,901) 2,648,5254 (Apr) 5,985,264 6,475 98,813 1,527,258 (2,227,432) 4,003,789 410,754 (417,261) 2,752,9915 (May) 6,286,671 5,205 109,730 1,782,089 (2,401,876) 3,919,335 341,836 (425,182) 3,082,7186 (Jun) 6,256,291 3,311 93,427 1,864,141 (2,509,928) 4,309,709 382,077 (457,259) 2,869,476
7 (Jul) 6,194,235 3,869 99,673 1,949,355 (2,591,716) 3,948,327 418,239 (469,263) 2,829,8328 (Aug) 6,281,279 4,073 115,406 1,963,980 (2,593,552) 3,905,547 442,742 (494,968) 2,890,6959 (Sep) 6,110,944 4,654 83,527 1,869,588 (2,543,470) 4,023,026 419,153 (508,110) 2,752,147
10 (Oct) 6,301,493 5,227 104,370 1,822,975 (2,536,727) 4,192,967 445,037 (501,344) 2,705,29811 (Nov) 5,973,985 4,063 95,893 1,655,855 (2,323,674) 3,911,848 361,164 (462,292) 2,836,17412 (Dec) 5,711,776 4,893 98,501 1,480,576 (2,153,591) 4,018,075 414,591 (447,023) 2,723,360
注:1. 「販売」の( )は鋼材次工程用消費で外数。
2.「在庫」の( )は、普通鋼鋼管専業者、冷間仕上鋼材(線類を除く)、めっき鋼材(線類を除く)及び冷間ロール成型形鋼専業者分の在庫を示す。Notes: 1. Figures in brackets in "Sales" : consumption for processed goods, uncounted. 2. Figures in brackets in "Inventory" : inventory of manufactures specializing in ordinary steel pipes and tubes, or in cold-finished steel (excluding wires), coated steel (excluding wires) and cold-formed steel sheets and shapes.
(単位:t、Unit: t)
Inventory販 売Sales
その他Others
在 庫生 産Production
受 入Receipts
消 費Consumption
出 荷 ShipmentsGrand total
(単位:t、Unit: t)
年 月Year and Month
合 計
54
計 Total
販 売Sales
平成19年 (2007) 498,109 - - 490,428 3,197 33,890 447,070 - -20 (2008) 529,467 - - 523,720 5,322 33,642 479,915 - -21 (2009) 557,412 - - 541,333 4,523 46,213 524,491 - -22 (2010) 630,289 - - 640,883 2,220 33,375 597,328 - -23 (2011) 575,219 - - 574,543 5,593 28,396 538,954 - -
平成21年度 (09FY) 533,465 - - 508,805 3,282 39,795 502,124 - -22 (10FY) 620,144 - - 629,639 2,404 27,857 585,735 - -
平成23年 1~3月 (Q1) 142,163 - - 147,120 546 27,857 133,101 - -4~6 (Q2) 168,585 - - 145,246 3,670 47,586 160,332 - -7~9 (Q3) 132,121 - - 163,658 568 15,386 124,098 - -
10~12 (Q4) 132,350 - - 118,519 809 28,396 121,423 - -
平成23年 1月 (Jan) 40,302 - - 37,066 38 36,558 36,935 - -2 (Feb) 45,288 - - 47,899 365 33,582 42,115 - -3 (Mar) 56,573 - - 62,155 143 27,857 54,051 - -4 (Apr) 60,891 - - 46,281 181 42,265 58,890 - -5 (May) 49,215 - - 35,515 1,002 54,963 46,392 - -6 (Jun) 58,479 - - 63,450 2,487 47,586 55,050 - -
7 (Jul) 48,951 - - 58,011 437 37,995 47,035 - -8 (Aug) 56,184 - - 51,262 69 42,849 52,633 - -9 (Sep) 26,986 - - 54,385 62 15,386 24,430 - -
10 (Oct) 42,853 - - 28,644 219 29,377 38,733 - -11 (Nov) 48,964 - - 38,140 382 39,807 45,293 - -12 (Dec) 40,533 - - 51,735 208 28,396 37,397 - -
その他Others
受 入Receipts
消 費Consumption
生 産Production
受 入Receipts
消 費Consumption
出 荷 Shipments在 庫
Inventory生 産
Production
重軌条 Heavy rails and accessories
Rails (Including accessories)
(単位 、 )
年 月Year and Month
軌条(含付属品)
54

時系列表 (鉄鋼編) 製品
1. 製品 Products (7) 普通鋼熱間圧延鋼材 Ordinary hot-rolled steel
軌条(含付属品)Rails (Including accessories)
販 売 販 売
Sales Sales
平成19年 (2007) 438,987 3,197 28,738 51,039 - - 51,441 - 5,15220 (2008) 474,912 5,322 28,417 49,552 - - 48,808 - 5,22521 (2009) 506,996 4,523 41,348 32,921 - - 34,337 - 4,86522 (2010) 606,008 2,220 30,061 32,961 - - 34,875 - 3,31423 (2011) 539,785 5,593 23,601 36,265 - - 34,758 - 4,795
平成21年度 (09FY) 477,490 3,282 35,013 31,341 - - 31,315 - 4,78222 (10FY) 595,081 2,404 23,234 34,409 - - 34,558 - 4,623
平成23年 1~3月 (Q1) 139,367 546 23,234 9,062 - - 7,753 - 4,6234~6 (Q2) 137,515 3,670 42,379 8,253 - - 7,731 - 5,2077~9 (Q3) 154,564 568 11,344 8,023 - - 9,094 - 4,042
10~12 (Q4) 108,339 809 23,601 10,927 - - 10,180 - 4,795
平成23年 1月 (Jan) 33,731 38 33,211 3,367 - - 3,335 - 3,3472 (Feb) 45,481 365 29,493 3,173 - - 2,418 - 4,0893 (Mar) 60,155 143 23,234 2,522 - - 2,000 - 4,6234 (Apr) 43,592 181 38,350 2,001 - - 2,689 - 3,9155 (May) 32,966 1,002 50,774 2,823 - - 2,549 - 4,1896 (Jun) 60,957 2,487 42,379 3,429 - - 2,493 - 5,207
7 (Jul) 55,114 437 33,823 1,916 - - 2,897 - 4,1728 (Aug) 48,415 69 38,012 3,551 - - 2,847 - 4,8379 (Sep) 51,035 62 11,344 2,556 - - 3,350 - 4,042
10 (Oct) 25,081 219 24,768 4,120 - - 3,563 - 4,60911 (Nov) 34,660 382 35,015 3,671 - - 3,480 - 4,79212 (Dec) 48,598 208 23,601 3,136 - - 3,137 - 4,795
(単位:t、Unit: t)
その他Others
その他Others
出 荷 Shipments在 庫
Inventory生 産
Production受 入
Receipts消 費
Consumption
重軌条 Heavy rails and accessories
(単位:t、Unit: t)
年 月Year and Month 出 荷 Shipments
在 庫Inventory
軽軌条 Light rails and accessories
55
形 鋼 Steel shapes計 Total
在 庫
Inventory
平成19年 (2007) 819,099 62,410 1,813 810,852 76,047 47,553 7,889,035 145,592 1,92820 (2008) 767,813 186,767 856 768,756 197,913 34,590 7,357,224 380,560 1,61721 (2009) 625,390 144,680 814 610,583 147,219 46,014 4,865,331 189,399 1,35422 (2010) 635,385 146,971 1,067 642,058 150,196 35,023 5,196,070 283,337 2,11523 (2011) 527,431 105,667 999 517,570 109,509 39,765 5,482,120 217,565 745
平成21年度 (09FY) 703,804 180,283 1,342 691,523 182,238 33,581 5,134,989 250,948 1,70922 (10FY) 559,488 115,442 815 567,456 119,150 20,991 5,321,298 263,045 1,639
平成23年 1~3月 (Q1) 131,079 25,634 301 143,647 26,716 20,991 1,428,437 70,737 1034~6 (Q2) 111,517 19,234 28 110,054 20,341 21,149 1,519,165 41,893 2107~9 (Q3) 95,512 23,091 45 76,640 24,531 38,522 1,193,434 39,315 168
10~12 (Q4) 189,323 37,708 625 187,229 37,921 39,765 1,341,084 65,620 264
平成23年 1月 (Jan) 50,376 10,956 20 47,131 11,933 37,265 451,368 26,758 642 (Feb) 40,932 12,454 262 43,473 12,518 34,384 482,439 35,886 193 (Mar) 39,771 2,224 19 53,043 2,265 20,991 494,630 8,093 204 (Apr) 49,603 5,471 - 41,069 5,997 28,852 530,527 3,587 1265 (May) 30,970 7,538 22 39,919 7,592 19,828 533,549 23,382 626 (Jun) 30,944 6,225 6 29,066 6,752 21,149 455,089 14,924 22
7 (Jul) 20,346 4,940 18 23,602 6,082 16,725 377,545 8,450 548 (Aug) 35,463 10,539 21 20,840 10,599 31,262 412,219 13,615 429 (Sep) 39,703 7,612 6 32,198 7,850 38,522 403,670 17,250 72
10 (Oct) 51,180 11,400 23 49,442 11,573 40,050 457,882 19,788 10011 (Nov) 67,803 14,338 245 67,611 14,365 39,970 433,543 21,882 10112 (Dec) 70,340 11,970 357 70,176 11,983 39,765 449,659 23,950 63
販 売Sales
その他Others
生 産Production
受 入Receipts
消 費Consumption
生 産Production
受 入Receipts
消 費Consumption
出 荷 Shipments
Sheet pilings
(単位 、 )
年 月Year and Month
鋼 矢 板
55
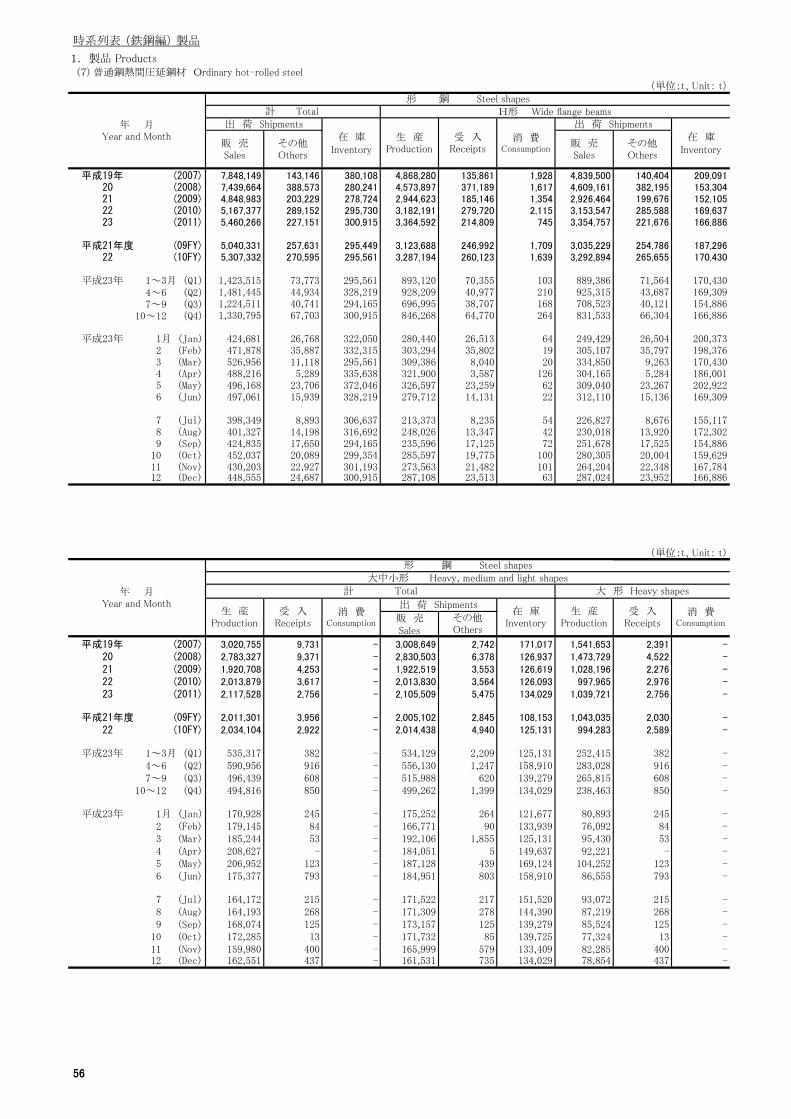
時系列表 (鉄鋼編) 製品
1. 製品 Products (7) 普通鋼熱間圧延鋼材 Ordinary hot-rolled steel
(単位:t、Unit: t)
在 庫 在 庫Inventory Inventory
平成19年 (2007) 7,848,149 143,146 380,108 4,868,280 135,861 1,928 4,839,500 140,404 209,09120 (2008) 7,439,664 388,573 280,241 4,573,897 371,189 1,617 4,609,161 382,195 153,30421 (2009) 4,848,983 203,229 278,724 2,944,623 185,146 1,354 2,926,464 199,676 152,10522 (2010) 5,167,377 289,152 295,730 3,182,191 279,720 2,115 3,153,547 285,588 169,63723 (2011) 5,460,266 227,151 300,915 3,364,592 214,809 745 3,354,757 221,676 166,886
平成21年度 (09FY) 5,040,331 257,631 295,449 3,123,688 246,992 1,709 3,035,229 254,786 187,29622 (10FY) 5,307,332 270,595 295,561 3,287,194 260,123 1,639 3,292,894 265,655 170,430
平成23年 1~3月 (Q1) 1,423,515 73,773 295,561 893,120 70,355 103 889,386 71,564 170,4304~6 (Q2) 1,481,445 44,934 328,219 928,209 40,977 210 925,315 43,687 169,3097~9 (Q3) 1,224,511 40,741 294,165 696,995 38,707 168 708,523 40,121 154,886
10~12 (Q4) 1,330,795 67,703 300,915 846,268 64,770 264 831,533 66,304 166,886
平成23年 1月 (Jan) 424,681 26,768 322,050 280,440 26,513 64 249,429 26,504 200,3732 (Feb) 471,878 35,887 332,315 303,294 35,802 19 305,107 35,797 198,3763 (Mar) 526,956 11,118 295,561 309,386 8,040 20 334,850 9,263 170,4304 (Apr) 488,216 5,289 335,638 321,900 3,587 126 304,165 5,284 186,0015 (May) 496,168 23,706 372,046 326,597 23,259 62 309,040 23,267 202,9226 (Jun) 497,061 15,939 328,219 279,712 14,131 22 312,110 15,136 169,309
7 (Jul) 398,349 8,893 306,637 213,373 8,235 54 226,827 8,676 155,1178 (Aug) 401,327 14,198 316,692 248,026 13,347 42 230,018 13,920 172,3029 (Sep) 424,835 17,650 294,165 235,596 17,125 72 251,678 17,525 154,886
10 (Oct) 452,037 20,089 299,354 285,597 19,775 100 280,305 20,004 159,62911 (Nov) 430,203 22,927 301,193 273,563 21,482 101 264,204 22,348 167,78412 (Dec) 448,555 24,687 300,915 287,108 23,513 63 287,024 23,952 166,886
(単位:t、Unit: t)
その他Others
販 売Sales
その他Others
販 売Sales
出 荷 Shipments
生 産Production
受 入Receipts
計 Total H形 Wide flange beams形 鋼 Steel shapes
消 費Consumption
出 荷 Shipments年 月Year and Month
56
販 売Sales
平成19年 (2007) 3,020,755 9,731 - 3,008,649 2,742 171,017 1,541,653 2,391 -20 (2008) 2,783,327 9,371 - 2,830,503 6,378 126,937 1,473,729 4,522 -21 (2009) 1,920,708 4,253 - 1,922,519 3,553 126,619 1,028,196 2,276 -22 (2010) 2,013,879 3,617 - 2,013,830 3,564 126,093 997,965 2,976 -23 (2011) 2,117,528 2,756 - 2,105,509 5,475 134,029 1,039,721 2,756 -
平成21年度 (09FY) 2,011,301 3,956 - 2,005,102 2,845 108,153 1,043,035 2,030 -22 (10FY) 2,034,104 2,922 - 2,014,438 4,940 125,131 994,283 2,589 -
平成23年 1~3月 (Q1) 535,317 382 - 534,129 2,209 125,131 252,415 382 -4~6 (Q2) 590,956 916 - 556,130 1,247 158,910 283,028 916 -7~9 (Q3) 496,439 608 - 515,988 620 139,279 265,815 608 -
10~12 (Q4) 494,816 850 - 499,262 1,399 134,029 238,463 850 -
平成23年 1月 (Jan) 170,928 245 - 175,252 264 121,677 80,893 245 -2 (Feb) 179,145 84 - 166,771 90 133,939 76,092 84 -3 (Mar) 185,244 53 - 192,106 1,855 125,131 95,430 53 -4 (Apr) 208,627 - - 184,051 5 149,637 92,221 - -5 (May) 206,952 123 - 187,128 439 169,124 104,252 123 -6 (Jun) 175,377 793 - 184,951 803 158,910 86,555 793 -
7 (Jul) 164,172 215 - 171,522 217 151,520 93,072 215 -8 (Aug) 164,193 268 - 171,309 278 144,390 87,219 268 -9 (Sep) 168,074 125 - 173,157 125 139,279 85,524 125 -
10 (Oct) 172,285 13 - 171,732 85 139,725 77,324 13 -11 (Nov) 159,980 400 - 165,999 579 133,409 82,285 400 -12 (Dec) 162,551 437 - 161,531 735 134,029 78,854 437 -
その他Others
生 産Production
計 Total
受 入Receipts
消 費Consumption
出 荷 Shipments在 庫
Inventory生 産
Production受 入
Receipts消 費
Consumption
大 形 Heavy shapes
大中小形 Heavy, medium and light shapes
(単位 、 )
年 月Year and Month
形 鋼 Steel shapes
56

時系列表 (鉄鋼編) 製品
1. 製品 Products (7) 普通鋼熱間圧延鋼材 Ordinary hot-rolled steel
(単位:t、Unit: t)
販 売 販 売
Sales Sales
平成19年 (2007) 1,536,863 2,693 70,036 1,479,102 7,340 - 1,471,786 49 100,98120 (2008) 1,479,640 5,902 62,645 1,309,598 4,849 - 1,350,863 476 64,29221 (2009) 1,032,455 3,334 57,674 892,512 1,977 - 890,064 219 68,94522 (2010) 996,541 3,538 57,987 1,015,914 641 - 1,017,289 26 68,10623 (2011) 1,040,819 3,511 55,655 1,077,807 - - 1,064,690 1,964 78,374
平成21年度 (09FY) 1,041,692 2,773 46,221 968,266 1,926 - 963,410 72 61,93222 (10FY) 984,781 3,164 54,514 1,039,821 333 - 1,029,657 1,776 70,617
平成23年 1~3月 (Q1) 255,510 448 54,514 282,902 - - 278,619 1,761 70,6174~6 (Q2) 273,452 1,212 63,728 307,928 - - 282,678 35 95,1827~9 (Q3) 265,013 620 64,494 230,624 - - 250,975 - 74,785
10~12 (Q4) 246,844 1,231 55,655 256,353 - - 252,418 168 78,374
平成23年 1月 (Jan) 81,430 248 57,375 90,035 - - 93,822 16 64,3022 (Feb) 74,060 90 59,305 103,053 - - 92,711 - 74,6343 (Mar) 100,020 110 54,514 89,814 - - 92,086 1,745 70,6174 (Apr) 83,044 5 63,653 116,406 - - 101,007 - 85,9845 (May) 92,407 404 75,203 102,700 - - 94,721 35 93,9216 (Jun) 98,001 803 63,728 88,822 - - 86,950 - 95,182
7 (Jul) 89,662 217 67,123 71,100 - - 81,860 - 84,3978 (Aug) 86,636 278 67,698 76,974 - - 84,673 - 76,6929 (Sep) 88,715 125 64,494 82,550 - - 84,442 - 74,785
10 (Oct) 82,704 85 59,034 94,961 - - 89,028 - 80,69111 (Nov) 85,541 411 55,738 77,695 - - 80,458 168 77,67112 (Dec) 78,599 735 55,655 83,697 - - 82,932 - 78,374
(単位:t、Unit: t)
その他Others
その他Others
受 入Receipts
消 費Consumption
出 荷 Shipments在 庫
Inventory
出 荷 Shipments在 庫
Inventory生 産
Production
大中小形 Heavy, medium and light shapes
年 月Year and Month
形 鋼 Steel shapes
大形 Heavy shapes 中小形 Medium and light shapes
57
位
在 庫
内再生鋼材 InventoryReclaimed steel
平成19年 (2007) 13,148,134 97,184 91,875 - 13,044,203 129,891 737,28620 (2008) 11,624,807 89,919 93,581 - 11,674,841 138,664 645,17021 (2009) 9,092,610 60,411 61,234 - 9,080,605 83,805 631,66222 (2010) 9,202,564 68,995 59,236 - 9,138,669 86,703 645,39223 (2011) 9,590,394 58,456 90,554 - 9,523,471 82,514 696,646
平成21年度 (09FY) 9,136,278 64,746 59,186 - 9,071,700 81,261 582,97422 (10FY) 9,369,575 67,208 63,178 - 9,269,208 82,077 636,165
平成23年 1~3月 (Q1) 2,321,622 16,686 18,591 - 2,327,291 13,554 636,1654~6 (Q2) 2,426,201 14,991 21,009 - 2,314,504 30,219 719,1477~9 (Q3) 2,275,802 12,596 23,069 - 2,393,290 18,311 601,410
10~12 (Q4) 2,566,769 14,183 27,885 - 2,488,386 20,430 696,646
平成23年 1月 (Jan) 754,739 4,903 5,340 - 764,510 3,887 634,1112 (Feb) 788,305 5,595 6,104 - 754,283 3,849 665,9823 (Mar) 778,578 6,188 7,147 - 808,498 5,818 636,1654 (Apr) 825,491 6,475 9,273 - 787,304 17,624 652,9105 (May) 836,167 5,205 6,369 - 744,474 6,852 740,5166 (Jun) 764,543 3,311 5,367 - 782,726 5,743 719,147
7 (Jul) 771,594 3,869 7,832 - 800,333 6,077 688,7418 (Aug) 719,919 4,073 7,302 - 772,267 4,858 635,6969 (Sep) 784,289 4,654 7,935 - 820,690 7,376 601,410
10 (Oct) 886,004 5,227 7,936 - 851,423 7,056 636,61811 (Nov) 868,758 4,063 8,983 - 851,429 6,697 665,20712 (Dec) 812,007 4,893 10,966 - 785,534 6,677 696,646
生 産Production
年 月Year and Month
棒 鋼 Steel bars計 Total
受 入Receipts
消 費Consumption
出 荷 Shipments
販 売Sales
その他Others
57

時系列表 (鉄鋼編) 製品
1. 製品 Products (7) 普通鋼熱間圧延鋼材 Ordinary hot-rolled steel
(単位:t、Unit: t)
棒 鋼 Steel bars
販 売
Sales
平成19年 (2007) 517,459 2,413 - 522,605 159 36,942 650,739 18,778 -20 (2008) 484,555 1,588 - 485,780 116 37,186 568,715 13,716 -21 (2009) 356,565 1,035 - 366,005 39 28,859 368,021 3,197 -22 (2010) 395,144 347 - 387,416 479 36,456 440,281 7,327 -23 (2011) 408,336 674 - 404,888 649 40,174 480,059 9,129 -
平成21年度 (09FY) 364,436 822 - 364,876 78 28,997 383,855 4,013 -22 (10FY) 403,674 445 - 400,250 533 32,433 464,533 9,488 -
平成23年 1~3月 (Q1) 103,551 174 - 107,896 93 32,433 126,097 3,495 -4~6 (Q2) 103,864 137 - 97,960 423 38,041 123,617 1,920 -7~9 (Q3) 92,820 119 - 99,677 35 31,324 106,862 2,051 -
10~12 (Q4) 108,101 244 - 99,355 98 40,174 123,483 1,663 -
平成23年 1月 (Jan) 33,704 24 - 33,729 72 36,524 41,238 731 -2 (Feb) 29,515 85 - 35,223 21 30,876 45,863 1,537 -3 (Mar) 40,332 65 - 38,944 - 32,433 38,996 1,227 -4 (Apr) 35,034 33 - 29,839 192 37,465 39,109 348 -5 (May) 40,540 31 - 35,071 - 42,964 50,342 642 -6 (Jun) 28,290 73 - 33,050 231 38,041 34,166 930 -
7 (Jul) 34,608 33 - 35,045 35 37,600 38,560 776 -8 (Aug) 24,274 74 - 29,145 - 32,865 29,772 670 -9 (Sep) 33,938 12 - 35,487 - 31,324 38,530 605 -
10 (Oct) 34,847 57 - 29,989 31 36,204 35,909 639 -11 (Nov) 35,854 160 - 38,196 1 33,986 46,310 570 -12 (Dec) 37,400 27 - 31,170 66 40,174 41,264 454 -
(単位:t、Unit: t)
生 産Production
生 産Production
その他Others
消 費Consumption
出 荷 Shipments在 庫
Inventory
Heavy bars Medium bars
受 入Receipts
消 費Consumption
大 形
受 入Receipts
中 形
年 月Year and Month
58
位
販 売 内再生鋼材 販 売Sales Reclaimed steel Sales
平成19年 (2007) 632,891 24,744 62,258 11,979,936 97,184 70,684 - 11,888,707 104,988 638,08620 (2008) 574,910 23,096 45,036 10,571,537 89,919 78,277 - 10,614,151 115,452 562,94821 (2009) 364,276 6,553 47,103 8,368,024 60,411 57,002 - 8,350,324 77,213 555,70022 (2010) 436,223 12,931 48,872 8,367,139 68,995 51,562 - 8,315,030 73,293 560,06423 (2011) 467,466 15,239 61,120 8,701,999 58,456 80,751 - 8,651,117 66,626 595,352
平成21年度 (09FY) 380,642 7,825 42,097 8,387,987 64,746 54,351 - 8,326,182 73,358 511,88022 (10FY) 449,691 15,334 53,271 8,501,368 67,208 53,245 - 8,419,267 66,210 550,461
平成23年 1~3月 (Q1) 120,805 5,110 53,271 2,091,974 16,686 14,922 - 2,098,590 8,351 550,4614~6 (Q2) 120,130 3,146 54,974 2,198,720 14,991 18,952 - 2,096,414 26,650 626,1327~9 (Q3) 107,488 3,177 53,897 2,076,120 12,596 20,899 - 2,186,125 15,099 516,189
10~12 (Q4) 119,043 3,806 61,120 2,335,185 14,183 25,978 - 2,269,988 16,526 595,352
平成23年 1月 (Jan) 39,008 1,554 50,869 679,797 4,903 4,585 - 691,773 2,261 546,7182 (Feb) 42,536 1,982 52,533 712,927 5,595 4,482 - 676,524 1,846 582,5733 (Mar) 39,261 1,574 53,271 699,250 6,188 5,855 - 730,293 4,244 550,4614 (Apr) 40,683 932 50,665 751,348 6,475 8,892 - 716,782 16,500 564,7805 (May) 37,540 937 63,115 745,285 5,205 5,696 - 671,863 5,915 634,4376 (Jun) 41,907 1,277 54,974 702,087 3,311 4,364 - 707,769 4,235 626,132
7 (Jul) 36,104 1,141 56,603 698,426 3,869 7,023 - 729,184 4,901 594,5388 (Aug) 36,995 1,007 50,199 665,873 4,073 6,558 - 706,127 3,851 552,6329 (Sep) 34,389 1,029 53,897 711,821 4,654 7,318 - 750,814 6,347 516,189
10 (Oct) 36,484 1,216 52,718 815,248 5,227 7,240 - 784,950 5,809 547,69611 (Nov) 42,451 1,326 60,428 786,594 4,063 8,253 - 770,782 5,370 570,79312 (Dec) 40,108 1,264 61,120 733,343 4,893 10,485 - 714,256 5,347 595,352
その他Others
その他Others
出 荷 Shipments
年 月Year and Month
棒 鋼 Steel bars
在 庫Inventory
生 産Production
受 入Receipts
消 費Consumption
出 荷 Shipments在 庫
Inventory
中 形 小 形 Light bars
Medium bars 小 計 Sub-total
58

時系列表 (鉄鋼編) 製品
1. 製品 Products (7) 普通鋼熱間圧延鋼材 Ordinary hot-rolled steel
(単位:t、Unit: t)
棒 鋼 Steel bars
鉄 筋 用 For reinforcing
内再生鋼材 販 売Reclaimed steel Sales
平成19年 (2007) 11,102,313 68,827 28,148 - 11,021,085 61,233 578,23920 (2008) 9,812,891 67,147 39,703 - 9,847,838 75,656 505,49521 (2009) 7,850,529 42,981 27,717 - 7,827,439 47,130 507,00022 (2010) 7,758,643 51,233 26,900 - 7,737,109 47,737 504,33723 (2011) 8,095,009 39,934 52,022 - 8,071,234 37,081 535,007
平成21年度 (09FY) 7,833,185 46,999 28,208 - 7,777,943 46,491 467,18322 (10FY) 7,881,781 49,532 29,124 - 7,835,745 41,215 498,880
平成23年 1~3月 (Q1) 1,928,715 12,315 9,307 - 1,940,159 2,558 498,8804~6 (Q2) 2,032,354 10,221 11,887 - 1,950,247 19,328 562,3407~9 (Q3) 1,944,009 8,156 13,078 - 2,052,603 7,032 459,986
10~12 (Q4) 2,189,931 9,242 17,750 - 2,128,225 8,163 535,007
平成23年 1月 (Jan) 625,384 3,570 3,235 - 640,614 883 491,4002 (Feb) 658,585 4,297 3,589 - 623,466 911 529,3073 (Mar) 644,746 4,448 2,483 - 676,079 764 498,8804 (Apr) 690,876 4,819 5,839 - 659,868 13,426 509,8975 (May) 695,004 3,734 3,503 - 625,346 3,696 579,3676 (Jun) 646,474 1,668 2,545 - 665,033 2,206 562,340
7 (Jul) 652,268 2,348 4,843 - 686,582 2,604 530,5068 (Aug) 621,521 2,638 4,852 - 662,789 2,131 491,7829 (Sep) 670,220 3,170 3,383 - 703,232 2,297 459,986
10 (Oct) 766,318 3,478 4,744 - 737,511 3,281 490,31111 (Nov) 736,535 2,462 5,460 - 723,645 2,560 510,34112 (Dec) 687,078 3,302 7,546 - 667,069 2,322 535,007
(単位:t、Unit: t)
その他Others
消 費Consumption
出 荷 Shipments在 庫
Inventory生 産
Production受 入
Receipts
小 形 Light bars
年 月Year and Month
59
位
内再生鋼材 販 売Reclaimed steel Sales
平成19年 (2007) 877,623 28,357 42,536 - 867,622 43,755 59,84720 (2008) 758,646 22,772 38,574 - 766,313 39,796 57,45321 (2009) 517,495 17,430 29,285 - 522,885 30,083 48,70022 (2010) 608,496 17,762 24,662 - 577,921 25,556 55,72723 (2011) 606,990 18,522 28,729 - 579,883 29,545 60,345
平成21年度 (09FY) 554,802 17,747 26,143 - 548,239 26,867 44,69722 (10FY) 619,587 17,676 24,121 - 583,522 24,995 51,581
平成23年 1~3月 (Q1) 163,259 4,371 5,615 - 158,431 5,793 51,5814~6 (Q2) 166,366 4,770 7,065 - 146,167 7,322 63,7927~9 (Q3) 132,111 4,440 7,821 - 133,522 8,067 56,203
10~12 (Q4) 145,254 4,941 8,228 - 141,763 8,363 60,345
平成23年 1月 (Jan) 54,413 1,333 1,350 - 51,159 1,378 55,3182 (Feb) 54,342 1,298 893 - 53,058 935 53,2663 (Mar) 54,504 1,740 3,372 - 54,214 3,480 51,5814 (Apr) 60,472 1,656 3,053 - 56,914 3,074 54,8835 (May) 50,281 1,471 2,193 - 46,517 2,219 55,0706 (Jun) 55,613 1,643 1,819 - 42,736 2,029 63,792
7 (Jul) 46,158 1,521 2,180 - 42,602 2,297 64,0328 (Aug) 44,352 1,435 1,706 - 43,338 1,720 60,8509 (Sep) 41,601 1,484 3,935 - 47,582 4,050 56,203
10 (Oct) 48,930 1,749 2,496 - 47,439 2,528 57,38511 (Nov) 50,059 1,601 2,793 - 47,137 2,810 60,45212 (Dec) 46,265 1,591 2,939 - 47,187 3,025 60,345
その他Others
生 産Production
受 入Receipts
消 費Consumption
出 荷 Shipments在 庫
Inventory
小 形 Light bars
年 月Year and Month
棒 鋼 Steel bars
その他用 For others
59

時系列表 (鉄鋼編) 製品
1. 製品 Products (7) 普通鋼熱間圧延鋼材 Ordinary hot-rolled steel
(単位:t、Unit: t)
平成19年 (2007) 683,098 14,899 10,079 (360,695) 410,079 267,980 (16,530) 13,08620 (2008) 749,505 15,965 10,147 (388,534) 458,214 291,888 (24,025) 36,02121 (2009) 408,561 5,096 2,673 (207,221) 252,032 175,327 (17,406) 17,43922 (2010) 656,528 9,048 6,535 (304,234) 366,565 281,004 (20,632) 19,00823 (2011) 657,552 11,084 8,626 (302,082) 350,713 291,007 (14,922) 18,376
平成21年度 (09FY) 463,433 6,264 3,599 (234,049) 255,914 205,130 (14,147) 22,64322 (10FY) 664,105 8,689 6,377 (297,195) 376,630 279,752 (14,878) 20,865
平成23年 1~3月 (Q1) 159,423 1,451 1,313 (68,277) 88,346 65,466 (14,878) 20,8654~6 (Q2) 166,813 3,024 2,603 (84,959) 82,993 81,496 (19,799) 19,4877~9 (Q3) 161,857 2,717 2,367 (76,111) 87,543 71,257 (15,978) 17,324
10~12 (Q4) 169,459 3,892 2,343 (72,735) 91,831 72,788 (14,922) 18,376
平成23年 1月 (Jan) 50,400 847 711 (22,972) 29,079 21,857 (17,794) 17,4272 (Feb) 51,966 332 227 (22,772) 28,179 19,372 (15,350) 20,2593 (Mar) 57,057 272 375 (22,533) 31,088 24,237 (14,878) 20,8654 (Apr) 57,078 542 525 (28,252) 35,156 24,351 (16,127) 17,6555 (May) 57,771 1,066 1,040 (27,059) 24,432 27,296 (16,819) 22,1436 (Jun) 51,964 1,416 1,038 (29,648) 23,405 29,849 (19,799) 19,487
7 (Jul) 53,539 843 794 (20,842) 26,543 25,030 (16,934) 19,0818 (Aug) 57,453 640 636 (25,956) 34,958 20,795 (16,393) 19,4639 (Sep) 50,865 1,234 937 (29,313) 26,042 25,432 (15,978) 17,324
10 (Oct) 60,275 1,756 900 (26,302) 30,136 25,908 (17,277) 20,63911 (Nov) 60,372 1,242 772 (24,591) 36,234 23,966 (17,013) 19,49212 (Dec) 48,812 894 671 (21,842) 25,461 22,914 (14,922) 18,376
注:1.「販売」の( )は鋼材次工程用消費で外数。
2.「在庫」の( )は、普通鋼鋼管専業者、冷間仕上鋼材(線類を除く)、めっき鋼材(線類を除く)及び冷間ロール成型形鋼専業者分の在庫を示す。Notes: 1. Figures in brackets in "Sales" : consumption for processed goods, uncounted. 2. Figures in brackets in "Inventory" : inventory of manufactures specializing in ordinary steel pipes and tubes, or in cold-finished steel (excluding wires), coated steel (excluding wires) and cold-formed steel sheets and shapes.
(単位:t、Unit: t)
Inventory販 売Sales
その他Others
在 庫生 産Production
受 入Receipts
消 費Consumption
出 荷 Shipments
管 材Rounds for tubes
年 月Year and Month
60
位
販 売Sales
平成19年 (2007) 2,538,877 303,293 35,878 2,482,975 331,221 96,053 687,964 86,521 -20 (2008) 2,386,309 255,602 47,592 2,298,352 297,223 96,112 609,574 105,429 -21 (2009) 1,634,934 162,903 38,209 1,571,476 187,516 96,796 379,904 50,075 -22 (2010) 1,871,695 193,967 42,248 1,798,328 218,762 103,128 454,258 63,277 -23 (2011) 1,810,777 150,584 30,765 1,740,173 191,444 96,515 448,369 73,786 -
平成21年度 (09FY) 1,833,067 180,665 39,808 1,758,353 204,201 95,060 417,666 56,173 -22 (10FY) 1,880,628 188,275 42,455 1,820,644 212,089 88,218 464,046 63,579 -
平成23年 1~3月 (Q1) 499,109 44,270 10,067 498,692 49,664 88,218 125,503 17,402 -4~6 (Q2) 446,736 42,375 9,381 410,258 54,516 97,864 103,559 18,630 -7~9 (Q3) 408,430 33,925 6,987 393,884 44,631 95,304 93,416 18,903 -
10~12 (Q4) 456,502 30,014 4,330 437,339 42,633 96,515 125,891 18,851 -
平成23年 1月 (Jan) 180,638 15,792 3,647 174,164 16,107 105,532 44,374 5,464 -2 (Feb) 166,254 13,910 3,009 166,290 16,685 98,896 43,542 5,492 -3 (Mar) 152,217 14,568 3,411 158,238 16,872 88,218 37,587 6,446 -4 (Apr) 162,042 11,893 2,089 133,712 17,773 104,768 41,873 5,832 -5 (May) 151,620 16,814 3,783 134,198 19,696 112,909 34,909 6,628 -6 (Jun) 133,074 13,668 3,509 142,348 17,047 97,864 26,777 6,170 -
7 (Jul) 146,779 10,774 2,678 136,113 14,391 103,012 29,130 5,467 -8 (Aug) 125,200 13,018 2,223 132,309 15,433 90,613 32,328 7,310 -9 (Sep) 136,451 10,133 2,086 125,462 14,807 95,304 31,958 6,126 -
10 (Oct) 153,598 11,198 2,336 152,593 15,489 89,703 40,277 6,718 -11 (Nov) 150,775 10,254 887 147,167 14,001 88,714 41,978 6,237 -12 (Dec) 152,129 8,562 1,107 137,579 13,143 96,515 43,636 5,896 -
その他Others
出 荷 Shipments在 庫
Inventory
年 月Year and Month
線 材 Steel wire rods
生 産Production
受 入Receipts
消 費Consumption
生 産Production
受 入Receipts
消 費Consumption
計 Totalバーインコイル Bars in coil
小 計 Sub-total
60

時系列表 (鉄鋼編) 製品
1. 製品 Products (7) 普通鋼熱間圧延鋼材 Ordinary hot-rolled steel
(単位:t、Unit: t)
線 材 Steel wire rods
小 計 Sub-total 鉄筋用 For reinforcing
販 売 販 売
Sales Sales
平成19年 (2007) 695,962 91,674 28,429 352,764 21,395 - 353,703 21,498 12,33420 (2008) 634,515 106,602 26,129 342,275 23,497 - 343,295 24,286 10,52821 (2009) 389,738 52,363 29,306 215,249 2,770 - 213,031 3,193 12,35222 (2010) 479,687 68,059 22,883 252,359 2,106 - 252,752 2,252 11,81223 (2011) 485,064 73,640 25,088 260,742 4,871 - 260,966 4,958 11,502
平成21年度 (09FY) 429,151 57,682 26,078 232,515 4,264 - 232,838 4,393 10,50622 (10FY) 494,964 67,686 19,667 261,373 - - 263,216 146 8,518
平成23年 1~3月 (Q1) 138,879 17,589 19,667 74,968 - - 78,235 28 8,5184~6 (Q2) 106,569 18,913 23,581 62,493 4,074 - 58,715 4,084 12,2857~9 (Q3) 101,060 18,175 26,438 49,278 797 - 48,380 810 13,171
10~12 (Q4) 138,556 18,963 25,088 74,003 - - 75,636 36 11,502
平成23年 1月 (Jan) 46,434 5,449 23,521 25,460 - - 26,150 9 11,1132 (Feb) 46,602 5,582 23,608 26,785 - - 25,752 - 12,1463 (Mar) 45,843 6,558 19,667 22,723 - - 26,333 19 8,5184 (Apr) 38,798 5,946 25,595 28,959 1,114 - 23,396 1,114 14,0815 (May) 34,387 6,707 27,252 18,997 2,221 - 19,243 2,221 13,8356 (Jun) 33,384 6,260 23,581 14,537 739 - 16,076 749 12,285
7 (Jul) 32,481 5,505 23,173 14,238 797 - 15,240 807 11,2748 (Aug) 36,786 6,499 22,275 17,919 - - 19,262 3 9,9279 (Sep) 31,793 6,171 26,438 17,121 - - 13,878 - 13,171
10 (Oct) 45,828 6,744 25,067 22,564 - - 23,910 19 11,80611 (Nov) 46,050 6,285 25,111 25,375 - - 25,357 17 11,80712 (Dec) 46,678 5,934 25,088 26,064 - - 26,369 - 11,502
(単位:t、Unit: t)
その他Others
その他Others
在 庫Inventory
生 産Production
受 入Receipts
消 費Consumption
出 荷 Shipments在 庫
Inventory
出 荷 Shipments
バーインコイル Bars in coil
年 月Year and Month
61
位
計 Total
販 売Sales
平成19年 (2007) 335,200 65,126 - 342,259 70,176 16,095 1,850,913 216,772 35,87820 (2008) 267,299 81,932 - 291,220 82,316 15,601 1,776,735 150,173 47,59221 (2009) 164,655 47,305 - 176,707 49,170 16,954 1,255,030 112,828 38,20922 (2010) 201,899 61,171 - 226,935 65,807 11,071 1,417,437 130,690 42,24823 (2011) 187,627 68,915 - 224,098 68,682 13,586 1,362,408 76,798 30,765
平成21年度 (09FY) 185,151 51,909 - 196,313 53,289 15,572 1,415,401 124,492 39,80822 (10FY) 202,673 63,579 - 231,748 67,540 11,149 1,416,582 124,696 42,455
平成23年 1~3月 (Q1) 50,535 17,402 - 60,644 17,561 11,149 373,606 26,868 10,0674~6 (Q2) 41,066 14,556 - 47,854 14,829 11,296 343,177 23,745 9,3817~9 (Q3) 44,138 18,106 - 52,680 17,365 13,267 315,014 15,022 6,987
10~12 (Q4) 51,888 18,851 - 62,920 18,927 13,586 330,611 11,163 4,330
平成23年 1月 (Jan) 18,914 5,464 - 20,284 5,440 12,408 136,264 10,328 3,6472 (Feb) 16,757 5,492 - 20,850 5,582 11,462 122,712 8,418 3,0093 (Mar) 14,864 6,446 - 19,510 6,539 11,149 114,630 8,122 3,4114 (Apr) 12,914 4,718 - 15,402 4,832 11,514 120,169 6,061 2,0895 (May) 15,912 4,407 - 15,144 4,486 13,417 116,711 10,186 3,7836 (Jun) 12,240 5,431 - 17,308 5,511 11,296 106,297 7,498 3,509
7 (Jul) 14,892 4,670 - 17,241 4,698 11,899 117,649 5,307 2,6788 (Aug) 14,409 7,310 - 17,524 6,496 12,348 92,872 5,708 2,2239 (Sep) 14,837 6,126 - 17,915 6,171 13,267 104,493 4,007 2,086
10 (Oct) 17,713 6,718 - 21,918 6,725 13,261 113,321 4,480 2,33611 (Nov) 16,603 6,237 - 20,693 6,268 13,304 108,797 4,017 88712 (Dec) 17,572 5,896 - 20,309 5,934 13,586 108,493 2,666 1,107
その他Others
生 産Production
受 入Receipts
消 費Consumption
年 月Year and Month
線 材 Steel wire rods
出 荷 Shipments在 庫
Inventory生 産
Production受 入
Receipts消 費
Consumption
バーインコイル Bars in coil 普通鋼線材 Ordinary and special wire
その他用 For others
61

時系列表 (鉄鋼編) 製品
1. 製品 Products (7) 普通鋼熱間圧延鋼材 Ordinary hot-rolled steel
(単位:t、Unit: t)
販 売 販 売
Sales Sales
平成19年 (2007) 1,787,013 239,547 67,624 1,112,158 160,487 258 1,108,129 159,367 35,06120 (2008) 1,663,837 190,621 69,983 993,987 95,680 40 964,460 99,162 38,56921 (2009) 1,181,738 135,153 67,490 620,364 83,128 - 608,341 85,785 32,68522 (2010) 1,318,641 150,703 80,245 655,061 91,387 2 630,984 90,804 33,07423 (2011) 1,255,109 117,804 71,427 628,940 47,783 - 582,544 51,539 31,376
平成21年度 (09FY) 1,329,202 146,519 68,982 697,167 92,357 2 676,240 96,095 28,18622 (10FY) 1,325,680 144,403 68,551 667,835 84,364 - 637,038 83,839 30,162
平成23年 1~3月 (Q1) 359,813 32,075 68,551 185,778 17,341 - 177,601 18,043 30,1624~6 (Q2) 303,689 35,603 74,283 154,141 15,695 - 136,899 16,096 34,6267~9 (Q3) 292,824 26,456 68,866 131,693 9,121 - 123,583 10,974 31,741
10~12 (Q4) 298,783 23,670 71,427 157,328 5,626 - 144,461 6,426 31,376
平成23年 1月 (Jan) 127,730 10,658 82,011 66,389 5,847 - 59,933 6,050 36,5352 (Feb) 119,688 11,103 75,288 65,638 5,842 - 60,060 6,126 37,7763 (Mar) 112,395 10,314 68,551 53,751 5,652 - 57,608 5,867 30,1624 (Apr) 94,914 11,827 79,173 55,090 4,135 - 46,147 4,069 32,3945 (May) 99,811 12,989 85,657 54,637 6,628 - 45,681 6,834 37,3136 (Jun) 108,964 10,787 74,283 44,414 4,932 - 45,071 5,193 34,626
7 (Jul) 103,632 8,886 79,839 48,487 2,821 - 44,659 3,014 36,1018 (Aug) 95,523 8,934 68,338 36,381 3,224 - 37,875 4,653 29,7779 (Sep) 93,669 8,636 68,866 46,825 3,076 - 41,049 3,307 31,741
10 (Oct) 106,765 8,745 64,636 55,722 2,493 - 51,115 2,727 31,92811 (Nov) 101,117 7,716 63,603 52,384 1,677 - 50,707 1,957 29,19812 (Dec) 90,901 7,209 71,427 49,222 1,456 - 42,639 1,742 31,376
(単位:t、Unit: t)
在 庫Inventory
計 Total普通鋼線材 Ordinary and special wire rods
年 月Year and Month
線 材 Steel wire rods
普通線材 Ordinary wire rods出 荷 Shipments
在 庫Inventory
生 産Production
受 入Receipts
消 費Consumption
出 荷 Shipments
その他Others
その他Others
62
位
販売 Sales その他Others
平成19年 (2007) 738,755 56,285 35,620 678,884 80,180 32,563 127,565 1 17,00020 (2008) 782,748 54,493 47,552 699,377 91,459 31,414 143,264 - 17,40221 (2009) 634,666 29,700 38,209 573,397 49,368 34,805 82,086 2 9,04722 (2010) 762,376 39,303 42,246 687,657 59,899 47,171 109,560 2 13,75123 (2011) 733,468 29,015 30,765 672,565 66,265 40,051 105,457 - 8,962
平成21年度 (09FY) 718,234 32,135 39,806 652,962 50,424 40,796 90,587 1 10,94822 (10FY) 748,747 40,332 42,455 688,642 60,564 38,389 109,033 2 13,082
平成23年 1~3月 (Q1) 187,828 9,527 10,067 182,212 14,032 38,389 27,423 - 2,8894~6 (Q2) 189,036 8,050 9,381 166,790 19,507 39,657 29,453 - 2,6367~9 (Q3) 183,321 5,901 6,987 169,241 15,482 37,125 23,756 - 2,153
10~12 (Q4) 173,283 5,537 4,330 154,322 17,244 40,051 24,825 - 1,284
平成23年 1月 (Jan) 69,875 4,481 3,647 67,797 4,608 45,476 9,284 - 9702 (Feb) 57,074 2,576 3,009 59,628 4,977 37,512 10,837 - 1,0223 (Mar) 60,879 2,470 3,411 54,787 4,447 38,389 7,302 - 8974 (Apr) 65,079 1,926 2,089 48,767 7,758 46,779 10,561 - 7725 (May) 62,074 3,558 3,783 54,130 6,155 48,344 8,876 - 8716 (Jun) 61,883 2,566 3,509 63,893 5,594 39,657 10,016 - 993
7 (Jul) 69,162 2,486 2,678 58,973 5,872 43,738 8,326 - 8118 (Aug) 56,491 2,484 2,223 57,648 4,281 38,561 9,309 - 5959 (Sep) 57,668 931 2,086 52,620 5,329 37,125 6,121 - 747
10 (Oct) 57,599 1,987 2,336 55,650 6,018 32,708 8,864 - 45911 (Nov) 56,413 2,340 887 50,410 5,759 34,405 8,953 - 43412 (Dec) 59,271 1,210 1,107 48,262 5,467 40,051 7,008 - 391
出 荷 Shipments 在 庫Inventory
生 産Production
受 入Receipts
消 費Consumption
小 計 Sub-total
生 産Production
受 入Receipts
消 費Consumption
低炭素 Low-carbon wire rods
年 月Year and Month
線 材 Steel wire rods普通鋼線材 Ordinary and special wire rods
特殊線材 Special wire rods
62

時系列表 (鉄鋼編) 製品
1. 製品 Products (7) 普通鋼熱間圧延鋼材 Ordinary hot-rolled steel
(単位:t、Unit: t)
販売 Sales その他Others 販売 Sales その他Others
平成19年 (2007) 44,081 67,017 3,299 611,190 56,284 18,620 634,803 13,163 29,26420 (2008) 46,312 78,047 4,800 639,484 54,493 30,150 653,065 13,412 26,61421 (2009) 27,287 45,682 4,870 552,580 29,698 29,162 546,110 3,686 29,93522 (2010) 38,588 58,745 3,344 652,816 39,301 28,495 649,069 1,154 43,82723 (2011) 34,362 62,307 3,169 628,011 29,015 21,803 638,203 3,958 36,882
平成21年度 (09FY) 32,965 47,483 4,295 627,647 32,134 28,858 619,997 2,941 36,50122 (10FY) 35,974 59,507 4,764 639,714 40,330 29,373 652,668 1,057 33,625
平成23年 1~3月 (Q1) 9,423 13,691 4,764 160,405 9,527 7,178 172,789 341 33,6254~6 (Q2) 9,245 17,472 4,862 159,583 8,050 6,745 157,545 2,035 34,7957~9 (Q3) 8,659 14,584 3,223 159,565 5,901 4,834 160,582 898 33,902
10~12 (Q4) 7,035 16,560 3,169 148,458 5,537 3,046 147,287 684 36,882
平成23年 1月 (Jan) 3,401 4,410 3,847 60,591 4,481 2,677 64,396 198 41,6292 (Feb) 2,311 4,884 6,467 46,237 2,576 1,987 57,317 93 31,0453 (Mar) 3,711 4,397 4,764 53,577 2,470 2,514 51,076 50 33,6254 (Apr) 4,280 6,619 3,654 54,518 1,926 1,317 44,487 1,139 43,1255 (May) 2,737 5,490 3,432 53,198 3,558 2,912 51,393 665 44,9126 (Jun) 2,228 5,363 4,862 51,867 2,566 2,516 61,665 231 34,795
7 (Jul) 3,668 5,649 3,061 60,836 2,486 1,867 55,305 223 40,6778 (Aug) 1,951 3,847 5,977 47,182 2,484 1,628 55,697 434 32,5849 (Sep) 3,040 5,088 3,223 51,547 931 1,339 49,580 241 33,902
10 (Oct) 2,054 5,821 3,753 48,735 1,987 1,877 53,596 197 28,95511 (Nov) 1,858 5,595 4,819 47,460 2,340 453 48,552 164 29,58612 (Dec) 3,123 5,144 3,169 52,263 1,210 716 45,139 323 36,882
注:1.「販売」の( )は鋼材次工程用消費で外数。
2.「在庫」の( )は、普通鋼鋼管専業者、冷間仕上鋼材(線類を除く)、めっき鋼材(線類を除く)及び冷間ロール成型形鋼専業者分の在庫を示す。Notes: 1. Figures in brackets in "Sales" : consumption for processed goods, uncounted. 2. Figures in brackets in "Inventory" : inventory of manufactures specializing in ordinary steel pipes and tubes, or in cold-finished steel (excluding wires), coated steel (excluding wires) and cold-formed steel sheets and shapes.
(単位:t、Unit: t)
在 庫Inventory
消 費Consumption
出 荷 Shipments
高炭素 High-carbon wire rods低炭素 Low-carbon wire rods年 月
Year and Month
線 材 Steel wire rods普通鋼線材 Ordinary and special wire rods
出 荷 Shipments 在 庫Inventory
生 産Production
受 入Receipts
特殊線材 Special wire rods
63
位
平成19年 (2007) 13,210,727 161,020 318,259 (607,038) 12,811,500 220,526 (8,409) 490,27420 (2008) 13,986,932 143,172 245,945 (569,846) 13,683,053 214,285 (8,316) 456,50921 (2009) 11,362,034 52,836 140,942 (325,157) 11,165,082 110,566 (3,894) 456,17522 (2010) 12,582,695 127,542 211,284 (369,046) 12,331,787 91,361 (5,690) 526,67923 (2011) 12,507,589 68,877 214,277 (424,490) 12,302,514 84,855 (9,446) 486,738
平成21年度 (09FY) 11,136,060 43,639 150,044 (297,641) 10,933,924 88,558 (6,486) 524,17122 (10FY) 12,731,428 149,588 241,780 (409,414) 12,508,511 99,983 (6,370) 542,204
平成23年 1~3月 (Q1) 3,275,082 38,046 79,417 (121,904) 3,182,882 28,704 (6,370) 542,2044~6 (Q2) 3,212,937 19,430 58,665 (115,078) 3,171,163 23,569 (6,151) 517,8017~9 (Q3) 3,060,846 4,088 52,791 (107,463) 2,913,182 15,795 (10,714) 597,861
10~12 (Q4) 2,958,724 7,313 23,404 (80,045) 3,035,287 16,787 (9,446) 486,738
平成23年 1月 (Jan) 1,100,700 12,716 23,262 (35,645) 1,055,758 8,243 (6,211) 552,1412 (Feb) 1,042,388 15,500 21,120 (34,385) 974,172 9,405 (7,917) 603,8063 (Mar) 1,131,994 9,830 35,035 (51,874) 1,152,952 11,056 (6,370) 542,2044 (Apr) 1,054,166 8,187 19,579 (37,857) 1,020,382 10,272 (7,872) 552,7315 (May) 1,121,724 7,944 28,508 (47,417) 1,051,303 9,044 (9,610) 592,3056 (Jun) 1,037,047 3,299 10,578 (29,804) 1,099,478 4,253 (6,151) 517,801
7 (Jul) 979,085 395 16,487 (35,180) 938,317 4,820 (8,469) 537,2418 (Aug) 1,044,079 2,360 17,403 (34,724) 957,849 6,145 (9,683) 601,5309 (Sep) 1,037,682 1,333 18,901 (37,559) 1,017,016 4,830 (10,714) 597,861
10 (Oct) 1,050,003 2,884 5,657 (24,810) 1,092,850 6,022 (10,877) 545,29811 (Nov) 1,053,106 1,312 13,220 (32,015) 984,658 3,904 (9,822) 597,01012 (Dec) 855,615 3,117 4,527 (23,220) 957,779 6,861 (9,446) 486,738
Inventory販 売Sales
その他Others
在 庫生 産Production
計 Total
年 月Year and Month
鋼 板 Steel sheets and plates
受 入Receipts
消 費Consumption
出 荷 Shipments
63

時系列表 (鉄鋼編) 製品
1. 製品 Products (7) 普通鋼熱間圧延鋼材 Ordinary hot-rolled steel
(単位:t、Unit: t)
鋼 板 Steel sheets and plates厚 板 Heavy plates
平成19年 (2007) 13,013,704 150,526 318,259 (597,043) 12,613,010 215,816 (8,409) 468,89820 (2008) 13,822,448 132,683 245,945 (561,316) 13,516,555 209,486 (8,316) 431,47821 (2009) 11,261,215 50,936 140,942 (319,162) 11,068,394 106,222 (3,894) 444,26322 (2010) 12,419,060 126,997 211,284 (361,571) 12,177,331 87,640 (5,690) 512,94623 (2011) 12,296,388 68,877 214,277 (417,470) 12,100,993 81,288 (9,446) 471,240
平成21年度 (09FY) 11,019,899 42,147 150,044 (290,761) 10,822,984 84,621 (6,486) 509,75422 (10FY) 12,554,131 149,377 241,780 (401,974) 12,339,372 95,948 (6,370) 529,896
平成23年 1~3月 (Q1) 3,226,860 38,046 79,417 (119,999) 3,135,210 27,682 (6,370) 529,8964~6 (Q2) 3,164,607 19,430 58,665 (113,633) 3,124,535 22,870 (6,151) 504,9157~9 (Q3) 3,007,421 4,088 52,791 (105,703) 2,863,038 15,069 (10,714) 583,924
10~12 (Q4) 2,897,500 7,313 23,404 (78,135) 2,978,210 15,667 (9,446) 471,240
平成23年 1月 (Jan) 1,085,625 12,716 23,262 (35,085) 1,039,314 8,023 (6,211) 540,0172 (Feb) 1,025,746 15,500 21,120 (33,705) 960,074 9,171 (7,917) 589,9143 (Mar) 1,115,489 9,830 35,035 (51,209) 1,135,822 10,488 (6,370) 529,8964 (Apr) 1,037,897 8,187 19,579 (37,327) 1,005,078 9,999 (7,872) 539,6795 (May) 1,104,935 7,944 28,508 (47,057) 1,036,322 8,801 (9,610) 578,3286 (Jun) 1,021,775 3,299 10,578 (29,249) 1,083,135 4,070 (6,151) 504,915
7 (Jul) 963,324 395 16,487 (34,640) 923,459 4,583 (8,469) 524,7028 (Aug) 1,025,006 2,360 17,403 (34,114) 939,643 5,877 (9,683) 588,1919 (Sep) 1,019,091 1,333 18,901 (36,949) 999,936 4,609 (10,714) 583,924
10 (Oct) 1,029,832 2,884 5,657 (24,160) 1,073,481 5,660 (10,877) 531,23511 (Nov) 1,031,907 1,312 13,220 (31,405) 965,115 3,620 (9,822) 582,11912 (Dec) 835,761 3,117 4,527 (22,570) 939,614 6,387 (9,446) 471,240
注:1.「販売」の( )は鋼材次工程用消費で外数。
2.「在庫」の( )は、普通鋼鋼管専業者、冷間仕上鋼材(線類を除く)、めっき鋼材(線類を除く)及び冷間ロール成型形鋼専業者分の在庫を示す。Notes: 1. Figures in brackets in "Sales" : consumption for processed goods, uncounted. 2. Figures in brackets in "Inventory" : inventory of manufactures specializing in ordinary steel pipes and tubes, or in cold-finished steel (excluding wires), coated steel (excluding wires) and cold-formed steel sheets and shapes.
(単位:t、Unit: t)
Inventory消 費
Consumption
出 荷 Shipments
販 売Sales
その他Others
在 庫生 産Production
受 入Receipts
年 月Year and Month
64
位
鋼 板 Steel sheets and plates
平成19年 (2007) 197,023 10,494 - (9,995) 198,490 4,710 - 21,37620 (2008) 164,484 10,489 - (8,530) 166,498 4,799 - 25,03121 (2009) 100,819 1,900 - (5,995) 96,688 4,344 - 11,91222 (2010) 163,635 545 - (7,475) 154,456 3,721 - 13,73323 (2011) 211,201 - - (7,020) 201,521 3,567 - 15,498
平成21年度 (09FY) 116,161 1,492 - (6,880) 110,940 3,937 - 14,41722 (10FY) 177,297 211 - (7,440) 169,139 4,035 - 12,308
平成23年 1~3月 (Q1) 48,222 - - (1,905) 47,672 1,022 - 12,3084~6 (Q2) 48,330 - - (1,445) 46,628 699 - 12,8867~9 (Q3) 53,425 - - (1,760) 50,144 726 - 13,937
10~12 (Q4) 61,224 - - (1,910) 57,077 1,120 - 15,498
平成23年 1月 (Jan) 15,075 - - (560) 16,444 220 - 12,1242 (Feb) 16,642 - - (680) 14,098 234 - 13,8923 (Mar) 16,505 - - (665) 17,130 568 - 12,3084 (Apr) 16,269 - - (530) 15,304 273 - 13,0525 (May) 16,789 - - (360) 14,981 243 - 13,9776 (Jun) 15,272 - - (555) 16,343 183 - 12,886
7 (Jul) 15,761 - - (540) 14,858 237 - 12,5398 (Aug) 19,073 - - (610) 18,206 268 - 13,3399 (Sep) 18,591 - - (610) 17,080 221 - 13,937
10 (Oct) 20,171 - - (650) 19,369 362 - 14,06311 (Nov) 21,199 - - (610) 19,543 284 - 14,89112 (Dec) 19,854 - - (650) 18,165 474 - 15,498
在 庫販 売Sales
その他Others
消 費Consumption
出 荷 Shipments
Inventory
受 入Receipts
中 板 ・ 薄 板 Medium plates/light sheets
年 月Year and Month 生 産
Production
64

時系列表 (鉄鋼編) 製品
1. 製品 Products (7) 普通鋼熱間圧延鋼材 Ordinary hot-rolled steel
(単位:t、Unit: t)
平成19年 (2007) 47,840,243 986,725 24,446,871 (33,706,309) 19,433,873 4,805,434 (444,625) 1,026,81820 (2008) 46,813,590 931,488 23,914,830 (32,868,333) 19,297,627 4,685,302 (485,944) 833,65321 (2009) 34,811,377 362,694 17,287,055 (23,458,804) 14,604,827 3,067,313 (346,537) 940,27722 (2010) 46,420,540 668,552 23,424,231 (31,101,115) 19,197,990 4,150,429 (392,797) 1,102,02923 (2011) 43,272,311 671,668 21,395,794 (28,964,676) 18,536,132 3,932,167 (422,655) 1,053,198
平成21年度 (09FY) 40,828,576 476,025 20,386,557 (27,268,712) 17,099,476 3,521,059 (380,766) 921,26222 (10FY) 45,987,693 703,696 23,179,091 (30,856,137) 19,174,065 4,096,689 (390,653) 1,014,481
平成23年 1~3月 (Q1) 11,417,312 217,930 5,696,332 (7,619,101) 4,961,266 1,030,224 (390,653) 1,014,4814~6 (Q2) 10,458,126 155,005 5,084,850 (6,939,199) 4,517,170 875,922 (431,309) 1,115,6457~9 (Q3) 11,239,856 172,401 5,702,719 (7,545,164) 4,624,192 1,064,300 (481,418) 1,088,843
10~12 (Q4) 10,157,017 126,332 4,911,893 (6,861,212) 4,433,504 961,721 (422,655) 1,053,198
平成23年 1月 (Jan) 4,006,204 68,640 2,035,949 (2,689,852) 1,642,339 372,399 (410,986) 1,107,2382 (Feb) 3,644,050 63,547 1,814,776 (2,414,540) 1,523,791 304,172 (388,302) 1,168,5283 (Mar) 3,767,058 85,743 1,845,607 (2,514,709) 1,795,136 353,653 (390,653) 1,014,4814 (Apr) 3,239,079 59,860 1,499,578 (2,161,323) 1,451,669 329,267 (393,262) 1,014,9635 (May) 3,499,888 46,617 1,742,920 (2,327,400) 1,393,326 246,648 (398,753) 1,164,7866 (Jun) 3,719,159 48,528 1,842,352 (2,450,476) 1,672,175 300,007 (431,309) 1,115,645
7 (Jul) 3,790,473 66,439 1,922,937 (2,535,694) 1,567,059 352,509 (443,860) 1,118,2868 (Aug) 3,824,655 67,932 1,938,018 (2,532,872) 1,534,735 370,645 (468,892) 1,150,0069 (Sep) 3,624,728 38,030 1,841,764 (2,476,598) 1,522,398 341,146 (481,418) 1,088,843
10 (Oct) 3,595,530 49,408 1,808,182 (2,485,615) 1,535,842 358,681 (473,190) 1,042,53611 (Nov) 3,285,296 37,882 1,635,522 (2,267,068) 1,356,406 274,922 (435,457) 1,082,79812 (Dec) 3,276,191 39,042 1,468,189 (2,108,529) 1,541,256 328,118 (422,655) 1,053,198
注:1.「販売」の( )は鋼材次工程用消費で外数。
2.「在庫」の( )は、普通鋼鋼管専業者、冷間仕上鋼材(線類を除く)、めっき鋼材(線類を除く)及び冷間ロール成型形鋼専業者分の在庫を示す。Notes: 1. Figures in brackets in "Sales" : consumption for processed goods, uncounted. 2. Figures in brackets in "Inventory" : inventory of manufactures specializing in ordinary steel pipes and tubes, or in cold-finished steel (excluding wires), coated steel (excluding wires) and cold-formed steel sheets and shapes.
(単位:t、Unit: t)
Inventory生 産
Production受 入
Receipts消 費
Consumption
年 月Year and Month
鋼 帯 Steel strips計 Total
出 荷 Shipments
販 売Sales
その他Others
在 庫
65
位
平成19年 (2007) 46,917,446 986,725 23,939,782 (33,706,309) 19,069,633 4,772,000 (444,625) 1,013,80120 (2008) 45,959,379 931,488 23,424,158 (32,868,333) 18,967,576 4,653,597 (485,944) 820,48221 (2009) 34,285,602 362,694 16,971,338 (23,458,804) 14,422,695 3,038,670 (346,537) 929,67522 (2010) 45,758,771 668,552 23,022,268 (31,101,115) 18,970,869 4,119,641 (392,797) 1,090,06623 (2011) 42,649,745 623,307 20,975,480 (28,964,676) 18,318,682 3,899,221 (422,655) 1,041,576
平成21年度 (09FY) 40,249,195 476,025 20,044,703 (27,268,712) 16,892,991 3,491,385 (380,766) 909,52122 (10FY) 45,316,721 698,436 22,777,538 (30,856,137) 18,935,008 4,065,567 (390,653) 999,284
平成23年 1~3月 (Q1) 11,250,029 212,670 5,601,594 (7,619,101) 4,895,407 1,022,028 (390,653) 999,2844~6 (Q2) 10,317,692 121,851 4,971,690 (6,939,199) 4,464,722 866,062 (431,309) 1,102,3977~9 (Q3) 11,084,615 164,202 5,589,663 (7,545,164) 4,580,621 1,056,692 (481,418) 1,076,113
10~12 (Q4) 9,997,409 124,584 4,812,533 (6,861,212) 4,377,932 954,439 (422,655) 1,041,576
平成23年 1月 (Jan) 3,947,212 67,864 2,000,978 (2,689,852) 1,620,561 370,061 (410,986) 1,094,7522 (Feb) 3,591,559 60,365 1,783,032 (2,414,540) 1,502,035 301,460 (388,302) 1,156,7153 (Mar) 3,711,258 84,441 1,817,584 (2,514,709) 1,772,811 350,507 (390,653) 999,2844 (Apr) 3,190,528 49,811 1,464,265 (2,161,323) 1,433,839 325,695 (393,262) 997,8675 (May) 3,451,472 34,038 1,702,508 (2,327,400) 1,374,981 243,719 (398,753) 1,148,3476 (Jun) 3,675,692 38,002 1,804,917 (2,450,476) 1,655,902 296,648 (431,309) 1,102,397
7 (Jul) 3,746,917 59,209 1,884,047 (2,535,694) 1,555,666 350,106 (443,860) 1,106,5878 (Aug) 3,765,271 67,594 1,898,260 (2,532,872) 1,520,927 368,073 (468,892) 1,134,8199 (Sep) 3,572,427 37,399 1,807,356 (2,476,598) 1,504,028 338,513 (481,418) 1,076,113
10 (Oct) 3,543,707 47,978 1,774,731 (2,485,615) 1,518,720 356,742 (473,190) 1,029,24911 (Nov) 3,231,742 37,564 1,602,911 (2,267,068) 1,337,426 272,141 (435,457) 1,070,08112 (Dec) 3,221,960 39,042 1,434,891 (2,108,529) 1,521,786 325,556 (422,655) 1,041,576
生 産Production
受 入Receipts
消 費Consumption
出 荷 Shipments
小 計 Sub-total
在 庫Inventory
販 売Sales
その他Others
幅600㎜以上 Steel strips (600mm or more in width)
年 月Year and Month
鋼 帯 Steel strips
65

時系列表 (鉄鋼編) 製品
1. 製品 Products (7) 普通鋼熱間圧延鋼材 Ordinary hot-rolled steel
(単位:t、Unit: t)
平成19年 (2007) 2,099,868 - 1,926,271 (1,926,271) 17,680 149,567 18,89120 (2008) 2,104,218 4,718 1,908,153 (1,908,153) 14,976 154,252 27,64021 (2009) 1,578,414 - 1,458,010 (1,458,010) 9,845 92,548 27,38822 (2010) 2,163,197 - 1,975,484 (1,975,484) 12,008 146,974 31,27423 (2011) 2,122,066 1,949 1,957,748 (1,957,748) 11,465 130,905 23,362
平成21年度 (09FY) 1,806,278 - 1,672,983 (1,672,983) 10,944 103,325 22,30122 (10FY) 2,211,831 - 2,031,906 (2,031,906) 12,057 147,414 17,141
平成23年 1~3月 (Q1) 577,408 - 544,415 (544,415) 3,022 36,333 17,1414~6 (Q2) 547,792 1,949 516,493 (516,493) 2,037 20,668 18,3687~9 (Q3) 538,195 - 486,879 (486,879) 3,335 36,929 21,569
10~12 (Q4) 458,671 - 409,961 (409,961) 3,071 36,975 23,362
平成23年 1月 (Jan) 190,139 - 178,455 (178,455) 918 12,457 25,4902 (Feb) 184,409 - 169,044 (169,044) 1,032 11,288 28,3953 (Mar) 202,860 - 196,916 (196,916) 1,072 12,588 17,1414 (Apr) 179,978 1,949 160,979 (160,979) 687 7,380 24,9515 (May) 189,135 - 188,772 (188,772) 672 2,901 19,4206 (Jun) 178,679 - 166,742 (166,742) 678 10,387 18,368
7 (Jul) 188,085 - 164,918 (164,918) 1,054 10,540 26,7528 (Aug) 180,307 - 164,567 (164,567) 957 13,193 27,5379 (Sep) 169,803 - 157,394 (157,394) 1,324 13,196 21,569
10 (Oct) 151,960 - 137,064 (137,064) 958 11,641 22,37511 (Nov) 167,894 - 144,135 (144,135) 1,166 12,846 27,76712 (Dec) 138,817 - 128,762 (128,762) 947 12,488 23,362
注:1.「販売」の( )は鋼材次工程用消費で外数。
2.「在庫」の( )は、普通鋼鋼管専業者、冷間仕上鋼材(線類を除く)、めっき鋼材(線類を除く)及び冷間ロール成型形鋼専業者分の在庫を示す。Notes: 1. Figures in brackets in "Sales" : consumption for processed goods, uncounted. 2. Figures in brackets in "Inventory" : inventory of manufactures specializing in ordinary steel pipes and tubes, or in cold-finished steel (excluding wires), coated steel (excluding wires) and cold-formed steel sheets and shapes.
(単位:t、Unit: t)
販 売Sales
消 費Consumption
出 荷 Shipments在 庫
Inventoryその他Others
年 月Year and Month
鋼 帯 Steel strips幅600㎜以上 Steel strips (600mm or more in width)
冷延電気鋼帯用 Cold-rolled electrical sheets and strips
生 産Production
受 入Receipts
66
位
平成19年 (2007) 44,817,578 986,725 22,013,511 (31,780,038) 19,051,953 4,622,433 (444,625) 994,91020 (2008) 43,855,161 926,770 21,516,005 (30,960,180) 18,952,600 4,499,345 (485,944) 792,84221 (2009) 32,707,188 362,694 15,513,328 (22,000,794) 14,412,850 2,946,122 (346,537) 902,28722 (2010) 43,595,574 668,552 21,046,784 (29,125,631) 18,958,861 3,972,667 (392,797) 1,058,79223 (2011) 40,527,679 621,358 19,017,732 (27,006,928) 18,307,217 3,768,316 (422,655) 1,018,214
平成21年度 (09FY) 38,442,917 476,025 18,371,720 (25,595,729) 16,882,047 3,388,060 (380,766) 887,22022 (10FY) 43,104,890 698,436 20,745,632 (28,824,231) 18,922,951 3,918,153 (390,653) 982,143
平成23年 1~3月 (Q1) 10,672,621 212,670 5,057,179 (7,074,686) 4,892,385 985,695 (390,653) 982,1434~6 (Q2) 9,769,900 119,902 4,455,197 (6,422,706) 4,462,685 845,394 (431,309) 1,084,0297~9 (Q3) 10,546,420 164,202 5,102,784 (7,058,285) 4,577,286 1,019,763 (481,418) 1,054,544
10~12 (Q4) 9,538,738 124,584 4,402,572 (6,451,251) 4,374,861 917,464 (422,655) 1,018,214
平成23年 1月 (Jan) 3,757,073 67,864 1,822,523 (2,511,397) 1,619,643 357,604 (410,986) 1,069,2622 (Feb) 3,407,150 60,365 1,613,988 (2,245,496) 1,501,003 290,172 (388,302) 1,128,3203 (Mar) 3,508,398 84,441 1,620,668 (2,317,793) 1,771,739 337,919 (390,653) 982,1434 (Apr) 3,010,550 47,862 1,303,286 (2,000,344) 1,433,152 318,315 (393,262) 972,9165 (May) 3,262,337 34,038 1,513,736 (2,138,628) 1,374,309 240,818 (398,753) 1,128,9276 (Jun) 3,497,013 38,002 1,638,175 (2,283,734) 1,655,224 286,261 (431,309) 1,084,029
7 (Jul) 3,558,832 59,209 1,719,129 (2,370,776) 1,554,612 339,566 (443,860) 1,079,8358 (Aug) 3,584,964 67,594 1,733,693 (2,368,305) 1,519,970 354,880 (468,892) 1,107,2829 (Sep) 3,402,624 37,399 1,649,962 (2,319,204) 1,502,704 325,317 (481,418) 1,054,544
10 (Oct) 3,391,747 47,978 1,637,667 (2,348,551) 1,517,762 345,101 (473,190) 1,006,87411 (Nov) 3,063,848 37,564 1,458,776 (2,122,933) 1,336,260 259,295 (435,457) 1,042,31412 (Dec) 3,083,143 39,042 1,306,129 (1,979,767) 1,520,839 313,068 (422,655) 1,018,214
生 産Production
受 入Receipts
消 費Consumption
在 庫Inventory
販 売Sales
その他Others
出 荷 Shipments
その他 Other steel strips
幅600㎜以上 Steel strips (600mm or more in width)鋼 帯 Steel strips
年 月Year and Month
66

時系列表 (鉄鋼編) 製品
1. 製品 Products (7) 普通鋼熱間圧延鋼材 Ordinary hot-rolled steel
(単位:t、Unit: t)
販 売
Sales
平成19年 (2007) 922,797 - 507,089 364,240 33,434 13,01720 (2008) 854,211 - 490,672 330,051 31,705 13,17121 (2009) 525,775 - 315,717 182,132 28,643 10,60222 (2010) 661,769 - 401,963 227,121 30,788 11,96323 (2011) 622,566 48,361 420,314 217,450 32,946 11,622
平成21年度 (09FY) 579,381 - 341,854 206,485 29,674 11,74122 (10FY) 670,972 5,260 401,553 239,057 31,122 15,197
平成23年 1~3月 (Q1) 167,283 5,260 94,738 65,859 8,196 15,1974~6 (Q2) 140,434 33,154 113,160 52,448 9,860 13,2487~9 (Q3) 155,241 8,199 113,056 43,571 7,608 12,730
10~12 (Q4) 159,608 1,748 99,360 55,572 7,282 11,622
平成23年 1月 (Jan) 58,992 776 34,971 21,778 2,338 12,4862 (Feb) 52,491 3,182 31,744 21,756 2,712 11,8133 (Mar) 55,800 1,302 28,023 22,325 3,146 15,1974 (Apr) 48,551 10,049 35,313 17,830 3,572 17,0965 (May) 48,416 12,579 40,412 18,345 2,929 16,4396 (Jun) 43,467 10,526 37,435 16,273 3,359 13,248
7 (Jul) 43,556 7,230 38,890 11,393 2,403 11,6998 (Aug) 59,384 338 39,758 13,808 2,572 15,1879 (Sep) 52,301 631 34,408 18,370 2,633 12,730
10 (Oct) 51,823 1,430 33,451 17,122 1,939 13,28711 (Nov) 53,554 318 32,611 18,980 2,781 12,71712 (Dec) 54,231 - 33,298 19,470 2,562 11,622
(単位:t、Unit: t)
その他Others
生 産Production
受 入Receipts
消 費Consumption
出 荷 Shipments在 庫
Inventory
Narrow strips (less than 600mm in width)幅600㎜未満
鋼 帯 Steel strips
年 月Year and Month
67
位
販 売Sales
平成19年 (2007) 77,055 - 77,246 - - 6,12820 (2008) 83,840 - 82,173 - - 7,79521 (2009) 58,912 - 62,755 - - 3,95322 (2010) 63,748 - 63,919 - - 3,78223 (2011) 68,875 - 69,846 - - 2,811
平成21年度 (09FY) 63,362 - 62,890 - - 2,81922 (10FY) 64,081 - 64,717 - - 2,183
平成23年 1~3月 (Q1) 16,103 - 17,702 - - 2,1834~6 (Q2) 18,146 - 17,751 - - 2,5787~9 (Q3) 18,600 - 17,846 - - 3,332
10~12 (Q4) 16,026 - 16,547 - - 2,811
平成23年 1月 (Jan) 7,659 - 5,694 - - 5,7472 (Feb) 5,095 - 6,536 - - 4,3063 (Mar) 3,349 - 5,472 - - 2,1834 (Apr) 6,387 - 5,361 - - 3,2095 (May) 5,767 - 5,754 - - 3,2226 (Jun) 5,992 - 6,636 - - 2,578
7 (Jul) 5,923 - 6,387 - - 2,1148 (Aug) 6,107 - 5,637 - - 2,5849 (Sep) 6,570 - 5,822 - - 3,332
10 (Oct) 4,168 - 5,777 - - 1,72311 (Nov) 5,368 - 5,108 - - 1,98312 (Dec) 6,490 - 5,662 - - 2,811
その他Others
受 入Receipts
消 費Consumption
出 荷 Shipments在 庫
Inventory生 産
Production
年 月Year and Month
外 輪 Tyres and wheels
67

時系列表 (鉄鋼編) 製品
1. 製品 Products (8) 普通鋼冷間仕上鋼材 Ordinary cold-finished steel
(単位:t、 Unit: t)
磨 帯 鋼Cold-rolled narrow strips
在 庫
平成19年 (2007) 148,432 - 217 (18,947) 144,454 - (858) 15,70720 (2008) 146,686 - 165 (17,153) 135,970 3 (1,200) 26,33821 (2009) 82,468 - 117 (11,672) 80,443 - (760) 28,24722 (2010) 111,056 - 84 (13,337) 106,583 11 (942) 32,62423 (2011) 93,864 - 42 (13,282) 87,743 63 (813) 38,640
平成21年度 (09FY) 99,162 - 119 (12,084) 94,195 - (903) 28,98922 (10FY) 106,036 - 79 (13,587) 101,739 11 (915) 33,195
平成23年 1~3月 (Q1) 23,904 - 20 (3,505) 23,313 - (915) 33,1954~6 (Q2) 22,140 - 9 (2,880) 20,024 47 (791) 35,2557~9 (Q3) 23,852 - 4 (3,199) 22,886 16 (829) 36,201
10~12 (Q4) 23,968 - 9 (3,698) 21,520 - (813) 38,640
平成23年 1月 (Jan) 8,107 - 14 (1,135) 7,637 - (898) 33,0802 (Feb) 7,794 - 3 (1,204) 7,220 - (940) 33,6513 (Mar) 8,003 - 3 (1,166) 8,456 - (915) 33,1954 (Apr) 7,991 - 4 (993) 5,973 - (1,056) 35,2095 (May) 6,943 - 2 (865) 6,494 16 (808) 35,6406 (Jun) 7,206 - 3 (1,022) 7,557 31 (791) 35,255
7 (Jul) 7,945 - 1 (1,035) 7,461 - (762) 35,7388 (Aug) 6,317 - 1 (910) 6,893 16 (597) 35,1459 (Sep) 9,590 - 2 (1,254) 8,532 - (829) 36,201
10 (Oct) 9,630 - 3 (1,167) 8,721 - (845) 37,10711 (Nov) 6,719 - 3 (1,398) 6,596 - (852) 37,22712 (Dec) 7,619 - 3 (1,133) 6,203 - (813) 38,640
注:1.「販売」の( )は鋼材次工程用消費で外数。
2.「在庫」の( )は、普通鋼鋼管専業者、冷間仕上鋼材(線類を除く)、めっき鋼材(線類を除く)及び冷間ロール成型形鋼専業者分の在庫を示す。
2. Figures in brackets in "Inventory" : inventory of manufactures specializing in ordinary steel pipes and tubes, or in cold-finished steel (excluding wires),
coated steel (excluding wires) and cold-formed steel sheets and shapes.
(単位:t Unit: t)
Notes: 1. Figures in brackets in "Sales" : consumption for processed goods, uncounted.
販 売 Sales その他 OthersInventory
生 産Production
受 入Receipts
年 月Year and Month 消 費
Consumption
出 荷 Shipments
68
(単位:t、 Unit: t)
在 庫
平成19年 (2007) 24,039,278 1,526,644 17,234,638 (17,200,337) 7,222,488 1,114,507 (19,993) 432,31020 (2008) 23,773,488 1,402,195 16,896,531 (16,866,035) 7,359,543 969,108 (23,842) 369,70621 (2009) 17,072,745 804,575 11,633,073 (11,605,320) 5,633,860 551,281 (22,987) 408,82522 (2010) 23,159,263 990,786 15,700,535 (15,663,894) 7,674,139 707,396 (18,007) 449,70923 (2011) 20,934,265 935,082 14,178,531 (14,144,120) 7,122,342 610,073 (18,906) 386,671
平成21年度 (09FY) 20,133,505 902,268 13,579,469 (13,549,632) 6,640,180 637,055 (17,080) 431,89622 (10FY) 22,772,145 957,659 15,378,197 (15,341,662) 7,605,921 680,285 (14,441) 469,078
平成23年 1~3月 (Q1) 5,527,453 207,524 3,638,773 (3,630,622) 1,922,424 149,760 (14,441) 469,0784~6 (Q2) 5,003,509 252,365 3,421,916 (3,413,479) 1,625,537 165,453 (22,834) 498,0367~9 (Q3) 5,481,519 232,772 3,736,216 (3,728,224) 1,858,971 138,986 (23,801) 472,927
10~12 (Q4) 4,921,784 242,421 3,381,626 (3,371,795) 1,715,410 155,874 (18,906) 386,671
平成23年 1月 (Jan) 1,983,510 74,409 1,311,262 (1,308,257) 651,579 54,280 (13,121) 492,9112 (Feb) 1,777,474 70,833 1,159,605 (1,157,179) 611,166 54,035 (13,518) 514,1813 (Mar) 1,766,469 62,282 1,167,906 (1,165,186) 659,679 41,445 (14,441) 469,0784 (Apr) 1,531,394 76,523 1,071,619 (1,069,042) 490,966 49,753 (15,827) 461,2495 (May) 1,680,903 82,658 1,154,285 (1,151,423) 510,325 54,825 (21,902) 497,0526 (Jun) 1,791,212 93,184 1,196,012 (1,193,014) 624,246 60,875 (22,834) 498,036
7 (Jul) 1,845,842 86,691 1,279,446 (1,276,870) 629,917 53,013 (23,030) 466,2248 (Aug) 1,846,444 76,730 1,241,624 (1,238,764) 626,720 45,036 (20,463) 476,9729 (Sep) 1,789,233 69,351 1,215,146 (1,212,590) 602,334 40,937 (23,801) 472,927
10 (Oct) 1,760,628 74,547 1,161,887 (1,158,568) 633,961 45,957 (21,294) 467,69811 (Nov) 1,619,898 91,268 1,142,921 (1,139,518) 541,161 62,456 (17,632) 435,25812 (Dec) 1,541,258 76,606 1,076,818 (1,073,709) 540,288 47,461 (18,906) 386,671
生 産Production
受 入Receipts
消 費Consumption
出 荷 Shipments
販 売 Sales その他 OthersInventory
Cold-rolled wide strips年 月
Year and Month
冷延広幅帯鋼
68
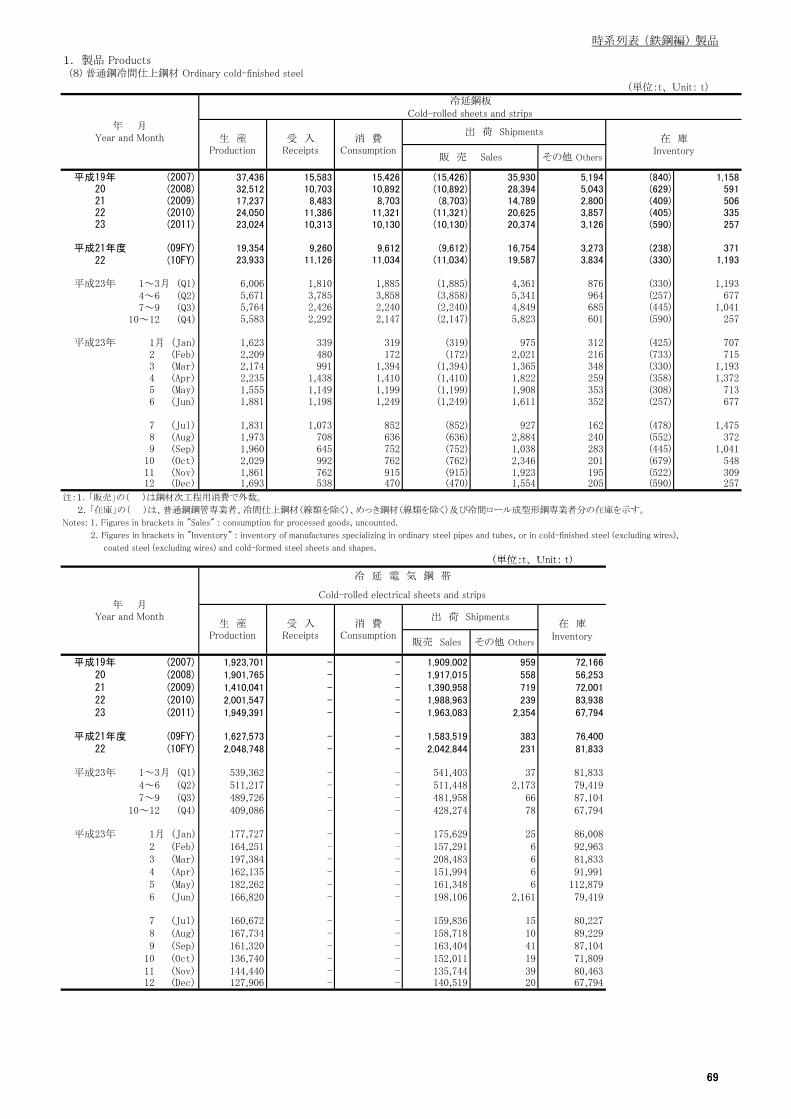
時系列表 (鉄鋼編) 製品
1. 製品 Products (8) 普通鋼冷間仕上鋼材 Ordinary cold-finished steel
(単位:t、 Unit: t)
冷延鋼板Cold-rolled sheets and strips
在 庫
平成19年 (2007) 37,436 15,583 15,426 (15,426) 35,930 5,194 (840) 1,15820 (2008) 32,512 10,703 10,892 (10,892) 28,394 5,043 (629) 59121 (2009) 17,237 8,483 8,703 (8,703) 14,789 2,800 (409) 50622 (2010) 24,050 11,386 11,321 (11,321) 20,625 3,857 (405) 33523 (2011) 23,024 10,313 10,130 (10,130) 20,374 3,126 (590) 257
平成21年度 (09FY) 19,354 9,260 9,612 (9,612) 16,754 3,273 (238) 37122 (10FY) 23,933 11,126 11,034 (11,034) 19,587 3,834 (330) 1,193
平成23年 1~3月 (Q1) 6,006 1,810 1,885 (1,885) 4,361 876 (330) 1,1934~6 (Q2) 5,671 3,785 3,858 (3,858) 5,341 964 (257) 6777~9 (Q3) 5,764 2,426 2,240 (2,240) 4,849 685 (445) 1,041
10~12 (Q4) 5,583 2,292 2,147 (2,147) 5,823 601 (590) 257
平成23年 1月 (Jan) 1,623 339 319 (319) 975 312 (425) 7072 (Feb) 2,209 480 172 (172) 2,021 216 (733) 7153 (Mar) 2,174 991 1,394 (1,394) 1,365 348 (330) 1,1934 (Apr) 2,235 1,438 1,410 (1,410) 1,822 259 (358) 1,3725 (May) 1,555 1,149 1,199 (1,199) 1,908 353 (308) 7136 (Jun) 1,881 1,198 1,249 (1,249) 1,611 352 (257) 677
7 (Jul) 1,831 1,073 852 (852) 927 162 (478) 1,4758 (Aug) 1,973 708 636 (636) 2,884 240 (552) 3729 (Sep) 1,960 645 752 (752) 1,038 283 (445) 1,041
10 (Oct) 2,029 992 762 (762) 2,346 201 (679) 54811 (Nov) 1,861 762 915 (915) 1,923 195 (522) 30912 (Dec) 1,693 538 470 (470) 1,554 205 (590) 257
注:1.「販売」の( )は鋼材次工程用消費で外数。
2.「在庫」の( )は、普通鋼鋼管専業者、冷間仕上鋼材(線類を除く)、めっき鋼材(線類を除く)及び冷間ロール成型形鋼専業者分の在庫を示す。
2. Figures in brackets in "Inventory" : inventory of manufactures specializing in ordinary steel pipes and tubes, or in cold-finished steel (excluding wires),
coated steel (excluding wires) and cold-formed steel sheets and shapes.
(単位:t Unit: t)
Notes: 1. Figures in brackets in "Sales" : consumption for processed goods, uncounted.
販 売 Sales その他 OthersInventory
受 入Receipts
消 費Consumption
出 荷 Shipments年 月
Year and Month 生 産Production
69
(単位:t、 Unit: t)
在 庫Inventory
平成19年 (2007) 1,923,701 - - 1,909,002 959 72,16620 (2008) 1,901,765 - - 1,917,015 558 56,25321 (2009) 1,410,041 - - 1,390,958 719 72,00122 (2010) 2,001,547 - - 1,988,963 239 83,93823 (2011) 1,949,391 - - 1,963,083 2,354 67,794
平成21年度 (09FY) 1,627,573 - - 1,583,519 383 76,40022 (10FY) 2,048,748 - - 2,042,844 231 81,833
平成23年 1~3月 (Q1) 539,362 - - 541,403 37 81,8334~6 (Q2) 511,217 - - 511,448 2,173 79,4197~9 (Q3) 489,726 - - 481,958 66 87,104
10~12 (Q4) 409,086 - - 428,274 78 67,794
平成23年 1月 (Jan) 177,727 - - 175,629 25 86,0082 (Feb) 164,251 - - 157,291 6 92,9633 (Mar) 197,384 - - 208,483 6 81,8334 (Apr) 162,135 - - 151,994 6 91,9915 (May) 182,262 - - 161,348 6 112,8796 (Jun) 166,820 - - 198,106 2,161 79,419
7 (Jul) 160,672 - - 159,836 15 80,2278 (Aug) 167,734 - - 158,718 10 89,2299 (Sep) 161,320 - - 163,404 41 87,104
10 (Oct) 136,740 - - 152,011 19 71,80911 (Nov) 144,440 - - 135,744 39 80,46312 (Dec) 127,906 - - 140,519 20 67,794
販売 Sales その他 Others
消 費Consumption
出 荷 Shipments生 産
Production受 入
Receipts
Cold-rolled electrical sheets and strips年 月
Year and Month
冷 延 電 気 鋼 帯
69

時系列表 (鉄鋼編) 製品
1. 製品 Products (8) 普通鋼冷間仕上鋼材 Ordinary cold-finished steel
(単位:t、 Unit: t)
平成19年 (2007) 217,415 9,295 220,973 989 22,884 872,014 286,481 580,789 1,811 30,81520 (2008) 205,990 8,809 207,731 731 25,509 816,253 254,144 560,686 1,041 31,50821 (2009) 102,449 3,641 111,354 321 19,325 612,983 208,398 407,889 823 27,25822 (2010) 152,189 3,589 156,546 822 19,203 688,833 237,840 448,057 114 24,61323 (2011) 153,599 3,407 160,500 1,265 19,883 673,662 226,790 443,763 404 27,062
平成21年度 (09FY) 117,868 3,912 125,229 386 19,476 653,295 224,272 432,517 764 25,45422 (10FY) 153,661 3,424 159,669 952 18,607 691,709 234,734 450,897 106 25,241
平成23年 1~3月 (Q1) 38,070 871 40,716 272 18,607 179,824 58,088 120,925 50 25,2414~6 (Q2) 37,928 493 39,183 257 19,721 159,921 54,152 101,943 9 28,8707~9 (Q3) 39,264 1,032 41,156 329 19,789 158,012 54,168 105,442 64 26,342
10~12 (Q4) 38,337 1,011 39,445 407 19,883 175,905 60,382 115,453 281 27,062
平成23年 1月 (Jan) 11,413 259 12,095 87 18,958 54,949 18,056 36,165 9 25,5872 (Feb) 13,112 339 14,103 71 18,796 60,974 19,989 40,914 22 25,7853 (Mar) 13,545 273 14,518 114 18,607 63,901 20,043 43,846 19 25,2414 (Apr) 13,152 165 13,573 102 19,100 57,386 20,241 37,571 1 25,3255 (May) 11,428 110 11,830 57 19,390 50,741 16,845 30,712 6 28,3146 (Jun) 13,348 218 13,780 98 19,721 51,794 17,066 33,660 2 28,870
7 (Jul) 13,276 346 13,945 100 19,717 50,052 17,036 33,346 34 28,1808 (Aug) 12,562 301 13,430 96 19,585 50,658 17,187 34,442 18 26,8249 (Sep) 13,426 385 13,781 133 19,789 57,302 19,945 37,654 12 26,342
10 (Oct) 13,032 347 13,658 221 19,177 59,699 20,222 39,248 80 27,40911 (Nov) 13,189 352 13,282 105 19,703 60,503 21,385 38,553 99 27,75212 (Dec) 12,116 312 12,505 81 19,883 55,703 18,775 37,652 102 27,062
(単位:t Unit: t)
生 産Production
消 費Consumption
出 荷 Shipments消 費
Consumption
出 荷 Shipments在 庫
Inventory販売 Sales その他Others 販売 Sales
Cold-finished bars Steel wires
在 庫Inventory
その他Others
生 産Production
年 月Year and Month
磨 棒 鋼 鉄 線
70
(単位:t、 Unit: t)
平成19年 (2007) 420,265 6,374 404,174 12,199 8,167 385,381 190,176 194,637 1,922 8,89220 (2008) 404,120 5,124 387,515 14,170 7,636 385,128 183,473 198,684 2,564 9,78121 (2009) 288,857 4,327 278,652 7,375 8,235 286,982 145,725 141,765 2,175 8,29622 (2010) 333,761 5,104 320,300 11,732 7,523 327,421 158,428 167,423 2,075 8,76323 (2011) 313,492 4,927 300,056 11,090 7,424 319,414 155,330 161,663 2,228 9,145
平成21年度 (09FY) 328,700 4,698 316,495 9,160 7,352 302,487 149,224 151,974 2,035 7,85922 (10FY) 327,823 5,077 313,443 11,425 8,125 330,309 158,036 170,338 2,123 8,544
平成23年 1~3月 (Q1) 81,616 1,231 77,660 2,745 8,125 81,963 38,567 43,294 533 8,5444~6 (Q2) 67,633 1,105 64,386 2,675 7,975 80,754 41,073 39,165 666 8,7347~9 (Q3) 80,420 1,273 77,852 2,776 7,261 78,900 37,946 40,251 480 8,329
10~12 (Q4) 83,823 1,318 80,158 2,894 7,424 77,797 37,744 38,953 549 9,145
平成23年 1月 (Jan) 26,086 404 24,920 795 7,569 25,439 12,175 13,708 162 8,1502 (Feb) 28,175 418 26,824 990 7,713 27,434 12,875 14,289 153 8,3543 (Mar) 27,355 409 25,916 960 8,125 29,090 13,517 15,297 218 8,5444 (Apr) 22,326 365 21,371 950 7,939 27,709 13,619 13,631 336 8,7605 (May) 19,942 339 18,867 778 8,045 24,648 12,668 12,273 116 8,3946 (Jun) 25,365 401 24,148 947 7,975 28,397 14,786 13,261 214 8,734
7 (Jul) 26,258 426 25,327 906 7,843 27,533 13,683 13,901 167 8,4858 (Aug) 24,738 405 24,257 883 7,274 23,479 11,234 12,429 181 8,1899 (Sep) 29,424 442 28,268 987 7,261 27,888 13,029 13,921 132 8,329
10 (Oct) 29,288 463 28,193 970 7,216 26,721 13,116 13,454 175 8,33211 (Nov) 28,173 445 26,551 986 7,752 26,655 12,940 13,330 158 8,65512 (Dec) 26,362 410 25,414 938 7,424 24,421 11,688 12,169 216 9,145
販売 Sales
生 産Production
消 費Consumption
出 荷 Shipments在 庫
Inventory在 庫
Inventory生 産
Production消 費
Consumption
出 荷 Shipments
その他Othersその他Others 販売 Sales
年 月Year and Month
冷間圧造用炭素鋼線Carbon steel wires for cold heading and cold forging
硬 鋼 線Hard-drawn wires
70

時系列表 (鉄鋼編) 製品
1. 製品 Products (8) 普通鋼冷間仕上鋼材 Ordinary cold-finished steel
(単位:t、 Unit: t)
平成19年 (2007) 265,834 265,372 31 - 5,21220 (2008) 257,777 258,014 27 - 5,51921 (2009) 180,542 182,869 20 - 2,98422 (2010) 199,412 197,874 26 - 4,94623 (2011) 155,232 155,444 30 - 2,331
平成21年度 (09FY) 180,570 180,136 21 - 6,56822 (10FY) 194,280 196,319 29 - 1,978
平成23年 1~3月 (Q1) 41,909 41,944 9 - 1,9784~6 (Q2) 39,495 38,680 7 - 2,8917~9 (Q3) 36,648 37,283 7 - 2,695
10~12 (Q4) 37,180 37,537 7 - 2,331
平成23年 1月 (Jan) 13,796 13,686 2 - 2,6862 (Feb) 14,386 14,293 3 - 2,2263 (Mar) 13,727 13,965 4 - 1,9784 (Apr) 12,853 13,097 3 - 1,8365 (May) 12,633 11,814 2 - 2,6536 (Jun) 14,009 13,769 2 - 2,891
7 (Jul) 12,913 12,760 2 - 3,5378 (Aug) 11,059 11,664 2 - 2,8819 (Sep) 12,676 12,859 3 - 2,695
10 (Oct) 12,964 12,913 2 - 2,74411 (Nov) 12,752 12,970 3 - 2,52312 (Dec) 11,464 11,654 2 - 2,331
(9) めっき鋼材、冷間ロール成型形鋼 Coated steel and cold-formed steel shapes (単位:t Unit: t)
出 荷 Shipments在 庫
Inventory販売 Sales その他 Others
生 産Production
消 費Consumption
溶 接 棒 心 線Core wires for welding rods
年 月Year and Month
71
(単位:t、 Unit: t)
在 庫Inventory
平成19年 (2007) 994,645 62 - 993,844 3,710 61,29020 (2008) 1,112,841 473 - 1,099,495 6,801 69,05921 (2009) 915,838 87 - 909,148 6,002 60,45622 (2010) 1,053,985 844 - 1,038,377 5,986 71,26323 (2011) 978,533 230 - 983,086 5,573 60,988
平成21年度 (09FY) 989,155 798 - 974,167 6,753 52,10522 (10FY) 1,058,261 145 - 1,046,972 5,542 59,063
平成23年 1~3月 (Q1) 267,931 33 - 278,900 1,598 59,0634~6 (Q2) 258,464 33 - 253,167 1,440 63,1307~9 (Q3) 248,386 20 - 239,868 1,309 70,063
10~12 (Q4) 203,752 144 - 211,151 1,226 60,988
平成23年 1月 (Jan) 95,914 23 - 84,086 375 82,7542 (Feb) 76,390 7 - 91,834 486 66,9653 (Mar) 95,627 3 - 102,980 737 59,0634 (Apr) 91,045 - - 86,369 566 63,2065 (May) 95,288 - - 76,985 353 81,4006 (Jun) 72,131 33 - 89,813 521 63,130
7 (Jul) 80,497 1 - 78,894 260 64,3388 (Aug) 84,481 19 - 71,101 724 76,8689 (Sep) 83,408 - - 89,873 325 70,063
10 (Oct) 65,702 - - 71,588 522 63,47011 (Nov) 66,629 - - 62,640 542 66,72812 (Dec) 71,421 144 - 76,923 162 60,988
生 産Production
受 入Receipts
消 費Consumption
年 月Year and Month
ブ リ キ
出 荷 Shipments
販売 Sales その他 Others
Tin plates
71

時系列表 (鉄鋼編) 製品
1. 製品 Products (9) めっき鋼材、冷間ロール成型形鋼 Coated steel and cold-formed steel shapes
(単位:t、 Unit: t)
在 庫Inventory
平成19年 (2007) 797,917 473 - 801,310 1,207 41,17320 (2008) 842,858 222 - 837,940 817 45,49021 (2009) 729,924 307 - 730,634 1,398 43,68822 (2010) 849,291 295 - 833,612 2,089 57,57123 (2011) 818,147 183 - 819,130 2,800 53,963
平成21年度 (09FY) 759,129 262 - 763,336 1,601 37,53522 (10FY) 849,695 265 - 839,900 2,342 45,251
平成23年 1~3月 (Q1) 202,586 19 - 214,120 801 45,2514~6 (Q2) 216,430 35 - 211,557 564 49,5937~9 (Q3) 203,098 54 - 195,176 611 56,956
10~12 (Q4) 196,033 75 - 198,277 824 53,963
平成23年 1月 (Jan) 73,619 - - 75,018 149 56,0222 (Feb) 59,934 19 - 58,565 199 57,2093 (Mar) 69,033 - - 80,537 453 45,2514 (Apr) 71,252 - - 66,591 163 49,7495 (May) 75,271 2 - 74,000 210 50,8106 (Jun) 69,907 33 - 70,966 191 49,593
7 (Jul) 68,817 22 - 68,893 112 49,4278 (Aug) 66,538 4 - 58,658 306 57,0059 (Sep) 67,743 28 - 67,625 193 56,956
10 (Oct) 66,868 38 - 66,844 190 56,83011 (Nov) 63,036 20 - 64,624 274 54,98812 (Dec) 66,129 17 - 66,809 360 53,963
注:1.「販売」の( )は鋼材次工程用消費で外数。
2.「在庫」の( )は、普通鋼鋼管専業者、冷間仕上鋼材(線類を除く)、めっき鋼材(線類を除く)及び冷間ロール成型形鋼専業者分の在庫を示す。
2. Figures in brackets in "Inventory" : inventory of manufactures specializing in ordinary steel pipes and tubes, or in cold-finished steel
(excluding wires), coated steel (excluding wires) and cold-formed steel sheets and shapes.
(単位:t Unit: t)
Notes: 1. Figures in brackets in "Sales" : consumption for processed goods, uncounted.
年 月Year and Month
ティンフリースチール
生 産Production
受 入Receipts
消 費Consumption
Tin-free steel
出 荷 Shipments
販売 Sales その他 Others
72
(単位:t、 Unit: t)
亜 鉛 め っ き 鋼 板
Galvanized sheets
平成19年 (2007) 15,118,311 263,085 179,795 (397,350) 14,788,771 352,608 (32,377) 665,19020 (2008) 14,773,123 207,315 185,097 (390,827) 14,509,745 332,583 (32,480) 631,38821 (2009) 9,664,445 135,451 142,370 (331,115) 9,491,606 211,016 (29,815) 585,62422 (2010) 13,498,114 121,614 119,781 (338,210) 13,191,079 242,095 (31,216) 658,21123 (2011) 12,220,456 138,344 128,550 (359,415) 12,067,347 237,307 (29,919) 590,536
平成21年度 (09FY) 11,415,996 137,872 139,846 (335,071) 11,039,291 230,547 (33,521) 580,27622 (10FY) 13,191,062 116,357 114,415 (347,305) 12,934,369 237,195 (28,049) 612,040
平成23年 1~3月 (Q1) 3,107,661 30,989 29,877 (92,372) 3,099,732 58,281 (28,049) 612,0404~6 (Q2) 2,861,798 37,806 30,031 (88,123) 2,760,764 61,774 (29,235) 658,3797~9 (Q3) 3,211,821 33,810 33,274 (83,834) 3,137,881 54,648 (27,097) 681,739
10~12 (Q4) 3,039,176 35,739 35,368 (95,086) 3,068,970 62,604 (29,919) 590,536
平成23年 1月 (Jan) 1,085,156 10,189 10,402 (28,769) 1,087,943 19,762 (31,787) 636,2662 (Feb) 996,397 9,497 9,412 (30,224) 963,960 16,943 (28,343) 653,1823 (Mar) 1,026,108 11,303 10,063 (33,379) 1,047,829 21,576 (28,049) 612,0404 (Apr) 916,229 10,391 9,172 (31,003) 827,508 22,541 (27,206) 680,4795 (May) 927,191 12,228 10,184 (29,356) 880,655 20,452 (26,632) 708,7616 (Jun) 1,018,378 15,187 10,675 (27,764) 1,052,601 18,781 (29,235) 658,379
7 (Jul) 1,075,998 11,887 10,863 (26,594) 1,041,964 17,653 (28,266) 676,1078 (Aug) 1,057,864 11,652 10,265 (26,268) 1,041,692 17,254 (27,759) 677,1119 (Sep) 1,077,959 10,271 12,146 (30,972) 1,054,225 19,741 (27,097) 681,739
10 (Oct) 1,065,721 11,207 12,696 (32,234) 1,095,234 21,433 (27,622) 630,63911 (Nov) 1,023,669 13,369 12,394 (32,732) 972,642 20,100 (30,593) 661,44712 (Dec) 949,786 11,163 10,278 (30,120) 1,001,094 21,071 (29,919) 590,536
生 産Production
受 入Receipts
消 費Consumption
出 荷 Shipments在 庫
Inventory
計 Total
販 売 Sales その他 Others
年 月Year and Month
72

時系列表 (鉄鋼編) 製品
1. 製品 Products (9) めっき鋼材、冷間ロール成型形鋼 Coated steel and cold-formed steel shapes
(単位:t、 Unit: t)
在 庫販 売 Sales その他 Others Inventory
平成19年 (2007) 11,617,653 263,085 163,231 11,328,427 328,296 525,87920 (2008) 11,409,892 207,296 170,874 11,165,079 300,545 512,03121 (2009) 7,747,956 135,249 132,269 7,608,372 183,815 466,19622 (2010) 10,578,171 121,496 108,791 10,321,725 206,871 528,36823 (2011) 9,918,385 138,279 118,091 9,754,792 199,825 515,608
平成21年度 (09FY) 9,023,142 137,636 129,741 8,744,838 198,219 456,76022 (10FY) 10,450,265 116,260 103,362 10,205,648 203,595 515,541
平成23年 1~3月 (Q1) 2,532,269 30,976 27,415 2,499,973 50,517 515,5414~6 (Q2) 2,226,599 37,763 27,378 2,165,545 53,853 532,0497~9 (Q3) 2,605,442 33,810 30,799 2,532,632 46,237 564,130
10~12 (Q4) 2,554,075 35,730 32,499 2,556,642 49,218 515,608
平成23年 1月 (Jan) 885,824 10,189 9,542 882,228 17,447 515,6032 (Feb) 810,959 9,497 8,711 776,128 14,013 538,1193 (Mar) 835,486 11,290 9,162 841,617 19,057 515,5414 (Apr) 723,903 10,390 8,225 664,565 20,161 557,6225 (May) 703,609 12,225 9,302 686,253 17,800 560,5066 (Jun) 799,087 15,148 9,851 814,727 15,892 532,049
7 (Jul) 868,130 11,887 9,995 835,307 14,832 551,9328 (Aug) 856,708 11,652 9,422 845,538 14,279 551,4259 (Sep) 880,604 10,271 11,382 851,787 17,126 564,130
10 (Oct) 893,932 11,207 11,762 910,932 17,126 530,55611 (Nov) 859,037 13,360 11,474 816,356 14,954 558,84212 (Dec) 801,106 11,163 9,263 829,354 17,138 515,608
(単位:t Unit: t)
生 産Production
受 入Receipts
消 費Consumption
出 荷 Shipments
溶 融 め っ き年 月Year and Month
亜鉛めっき鋼板Galvanized sheets
Hot-dip zinc-coated sheets
73
(単位:t、 Unit: t)
在 庫販 売 Sales その他 Others Inventory
平成19年 (2007) 3,500,658 - 16,564 3,460,344 24,312 139,31120 (2008) 3,363,231 19 14,223 3,344,666 32,038 119,35721 (2009) 1,916,489 202 10,101 1,883,234 27,201 119,42822 (2010) 2,919,943 118 10,990 2,869,354 35,224 129,84323 (2011) 2,302,071 65 10,459 2,312,555 37,482 74,928
平成21年度 (09FY) 2,392,854 236 10,105 2,294,453 32,328 123,51622 (10FY) 2,740,797 97 11,053 2,728,721 33,600 96,499
平成23年 1~3月 (Q1) 575,392 13 2,462 599,759 7,764 96,4994~6 (Q2) 635,199 43 2,653 595,219 7,921 126,3307~9 (Q3) 606,379 - 2,475 605,249 8,411 117,609
10~12 (Q4) 485,101 9 2,869 512,328 13,386 74,928
平成23年 1月 (Jan) 199,332 - 860 205,715 2,315 120,6632 (Feb) 185,438 - 701 187,832 2,930 115,0633 (Mar) 190,622 13 901 206,212 2,519 96,4994 (Apr) 192,326 1 947 162,943 2,380 122,8575 (May) 223,582 3 882 194,402 2,652 148,2556 (Jun) 219,291 39 824 237,874 2,889 126,330
7 (Jul) 207,868 - 868 206,657 2,821 124,1758 (Aug) 201,156 - 843 196,154 2,975 125,6869 (Sep) 197,355 - 764 202,438 2,615 117,609
10 (Oct) 171,789 - 934 184,302 4,307 100,08311 (Nov) 164,632 9 920 156,286 5,146 102,60512 (Dec) 148,680 - 1,015 171,740 3,933 74,928
生 産Production
受 入Receipts
消 費Consumption
出 荷 ShipmentsElectric zinc-coated sheets
電気めっき
Galvanized sheets年 月
Year and Month
亜鉛めっき鋼板
73

時系列表 (鉄鋼編) 製品
1. 製品 Products (9) めっき鋼材、冷間ロール成型形鋼 Coated steel and cold-formed steel shapes
(単位:t、 Unit: t)
在 庫Inventory
平成19年 (2007) 1,474,498 15,219 62,951 1,412,489 7,342 127,69020 (2008) 1,242,614 7,687 44,108 1,205,452 5,701 122,73321 (2009) 849,600 1,736 13,036 832,203 2,201 127,15322 (2010) 1,221,552 1,925 67 1,169,394 10,169 170,91723 (2011) 1,129,900 7,756 - 1,105,597 19,179 183,646
平成21年度 (09FY) 1,027,220 1,898 4,915 982,313 2,478 132,32922 (10FY) 1,210,175 1,634 - 1,167,408 13,633 163,058
平成23年 1~3月 (Q1) 295,603 333 - 299,580 4,294 163,0584~6 (Q2) 279,236 258 - 260,872 6,047 175,4037~9 (Q3) 291,951 4,174 - 283,296 4,983 183,248
10~12 (Q4) 263,110 2,991 - 261,849 3,855 183,646
平成23年 1月 (Jan) 96,955 202 - 93,449 1,404 173,2382 (Feb) 96,577 101 - 96,913 1,124 171,9313 (Mar) 102,071 30 - 109,218 1,766 163,0584 (Apr) 82,226 - - 87,710 1,134 156,3455 (May) 93,774 7 - 79,291 1,580 169,2756 (Jun) 103,236 251 - 93,871 3,333 175,403
7 (Jul) 93,024 1,366 - 91,455 1,275 176,9948 (Aug) 106,972 1,630 - 100,073 1,467 184,1239 (Sep) 91,955 1,178 - 91,768 2,241 183,248
10 (Oct) 92,936 1,089 - 88,219 1,073 187,98911 (Nov) 80,541 986 - 90,123 1,284 178,10412 (Dec) 89,633 916 - 83,507 1,498 183,646
(単位:t Unit: t)
その他Others販売 Sales
生 産Production
受 入Receipts
消 費Consumption
年 月Year and Month
その他の金属めっき鋼板Other metallic-coated sheets
出 荷 Shipments
74
(単位:t、 Unit: t)
平成19年 (2007) 141,555 7,050 128,765 22 16,308 129,405 76,420 52,829 1,749 4,91120 (2008) 121,750 5,156 114,613 15 18,714 120,568 70,928 49,950 2,160 4,86821 (2009) 75,615 4,792 75,301 - 14,522 100,911 64,169 38,759 1,419 3,78722 (2010) 97,244 5,299 93,170 90 14,103 112,825 72,354 40,730 1,422 3,94823 (2011) 90,881 5,587 86,777 8 14,006 107,302 68,679 38,716 1,043 4,593
平成21年度 (09FY) 89,030 5,200 83,714 - 14,277 103,771 65,903 39,832 1,128 3,51222 (10FY) 95,256 5,447 93,794 90 11,904 112,563 72,138 40,843 1,391 3,619
平成23年 1~3月 (Q1) 23,749 1,481 25,308 - 11,904 27,364 17,609 10,414 227 3,6194~6 (Q2) 23,260 1,029 22,376 2 11,938 27,605 18,367 9,109 302 4,0697~9 (Q3) 21,750 1,444 17,990 3 14,381 25,863 16,618 9,348 196 4,113
10~12 (Q4) 22,122 1,633 21,103 3 14,006 26,470 16,085 9,845 318 4,593
平成23年 1月 (Jan) 7,483 593 7,962 - 13,503 9,120 5,890 3,369 61 3,9022 (Feb) 8,651 207 9,381 - 12,844 9,054 6,001 3,345 42 3,7753 (Mar) 7,615 681 7,965 - 11,904 9,190 5,718 3,700 124 3,6194 (Apr) 7,348 290 8,201 - 10,825 8,885 5,761 3,054 200 3,7115 (May) 7,890 455 7,057 1 11,261 8,539 5,816 2,836 35 3,7466 (Jun) 8,022 284 7,118 1 11,938 10,181 6,790 3,219 67 4,069
7 (Jul) 7,574 597 5,927 1 13,022 8,981 5,830 3,218 80 4,0338 (Aug) 6,492 233 5,636 1 13,685 8,064 5,185 2,798 41 4,1889 (Sep) 7,684 614 6,427 1 14,381 8,818 5,603 3,332 75 4,113
10 (Oct) 7,202 299 6,616 1 14,740 9,169 5,653 3,329 174 4,25411 (Nov) 8,078 892 7,394 1 14,591 9,182 5,698 3,473 94 4,25612 (Dec) 6,842 442 7,093 1 14,006 8,119 4,734 3,043 50 4,593
販売 Sales その他Others その他Others
生 産Production
消 費Consumption
出 荷 Shipments在 庫
Inventory生 産
Production消 費
Consumption
出 荷 Shipments在 庫
Inventory販売 Sales
Galvanized steel wires年 月
Year and Month
針 金 亜鉛めっき硬鋼線
Galvanized hard drawn wires
74

時系列表 (鉄鋼編) 製品
1. 製品 Products (9) めっき鋼材、冷間ロール成型形鋼 Coated steel and cold-formed steel shapes
(単位:t、 Unit: t)
冷 間 ロ ー ル 成 型 形 鋼 Cold-formed steel shapes簡 易 鋼 矢 板 Cold-formed sheet pilings
在 庫Inventory
平成19年 (2007) 15,528 - - 15,149 - 2,76020 (2008) 11,558 - - 12,946 - 1,37321 (2009) 9,931 - - 9,904 - 1,40022 (2010) 10,075 - - 10,310 - 1,16523 (2011) 10,165 - - 10,007 - 1,321
平成21年度 (09FY) 10,719 - - 10,648 - 58522 (10FY) 10,484 - - 10,323 - 746
平成23年 1~3月 (Q1) 2,944 - - 3,363 - 7464~6 (Q2) 1,686 - - 1,573 - 8587~9 (Q3) 2,169 - - 2,055 - 972
10~12 (Q4) 3,366 - - 3,016 - 1,321
平成23年 1月 (Jan) 930 - - 936 - 1,1582 (Feb) 473 - - 985 - 6473 (Mar) 1,541 - - 1,442 - 7464 (Apr) 646 - - 623 - 7685 (May) 462 - - 520 - 7106 (Jun) 578 - - 430 - 858
7 (Jul) 516 - - 597 - 7778 (Aug) 451 - - 319 - 9099 (Sep) 1,202 - - 1,139 - 972
10 (Oct) 1,050 - - 910 - 1,11111 (Nov) 1,346 - - 1,151 - 1,30712 (Dec) 970 - - 955 - 1,321
(単位:t Unit: t)
消 費Consumption
受 入Receipts
販 売 Sales その他 Others
生 産Production
年 月Year and Month
出 荷 Shipments
75
(単位:t、 Unit: t)
冷 間 ロ ー ル 成 型 形 鋼 Cold-formed steel shapes
軽 量 形 鋼 Cold-formed shapes
在 庫Inventory
平成19年 (2007) 733,018 7,397 44 720,286 17,364 31,06620 (2008) 655,949 1,941 52 652,038 8,531 26,89221 (2009) 476,666 705 17 476,639 7,942 21,06822 (2010) 476,173 1,780 95 468,057 9,155 19,72523 (2011) 501,328 2,115 26 491,576 8,832 21,594
平成21年度 (09FY) 480,460 919 50 475,367 8,212 21,54222 (10FY) 493,600 2,051 65 481,411 9,857 22,620
平成23年 1~3月 (Q1) 137,010 532 10 130,100 2,803 22,6204~6 (Q2) 118,697 640 3 114,167 2,022 25,8847~9 (Q3) 113,251 662 3 117,465 2,111 20,986
10~12 (Q4) 132,370 281 10 129,844 1,896 21,594
平成23年 1月 (Jan) 43,846 213 9 42,170 997 20,2372 (Feb) 45,966 180 - 43,858 1,043 21,1313 (Mar) 47,198 139 1 44,072 763 22,6204 (Apr) 48,474 242 1 44,501 609 26,4835 (May) 35,059 184 1 34,210 691 26,4026 (Jun) 35,164 214 1 35,456 722 25,884
7 (Jul) 35,550 287 - 37,686 630 23,8708 (Aug) 37,779 164 1 39,324 640 21,8159 (Sep) 39,922 211 2 40,455 841 20,986
10 (Oct) 46,548 129 2 43,913 885 22,57011 (Nov) 43,863 87 8 43,105 606 22,52812 (Dec) 41,959 65 - 42,826 405 21,594
販 売 Sales その他 Others
生 産Production
受 入Receipts
年 月Year and Month
消 費Consumption
出 荷 Shipments
75

時系列表 (鉄鋼編) 製品
1. 製品 Products (10) 特殊鋼熱間圧延鋼材 Special hot-rolled steel
① 形状別 By configuration
平成19年 (2007) 21,498,239 3,427,250 6,320,058 (6,894,429) 16,176,609 2,341,587 (124,215) 685,74720 (2008) 21,782,133 3,371,699 6,392,939 (6,991,038) 16,344,092 2,341,078 (130,357) 648,31221 (2009) 13,269,392 2,123,508 4,227,523 (4,574,577) 9,732,359 1,409,027 (125,460) 606,55022 (2010) 20,505,040 2,778,074 6,038,590 (6,539,083) 14,937,805 2,054,721 (107,920) 737,44223 (2011) 20,339,859 2,935,277 5,799,574 (6,298,811) 15,247,406 2,030,211 (122,888) 761,783
平成21年度 (09FY) 15,724,851 2,369,810 4,849,846 (5,229,372) 11,379,402 1,664,388 (106,510) 597,49922 (10FY) 20,923,886 2,826,554 6,038,717 (6,560,479) 15,388,897 2,101,145 (108,874) 681,592
平成23年 1~3月 (Q1) 5,241,396 747,003 1,477,753 (1,630,000) 3,974,273 548,922 (108,874) 681,5924~6 (Q2) 4,663,539 741,687 1,293,622 (1,388,705) 3,525,223 508,612 (109,364) 725,6107~9 (Q3) 5,076,369 748,630 1,491,450 (1,624,778) 3,787,180 518,813 (107,008) 713,209
10~12 (Q4) 5,358,555 697,957 1,536,749 (1,655,328) 3,960,730 453,864 (122,888) 761,783
平成23年 1月 (Jan) 1,831,693 270,083 524,703 (572,810) 1,333,603 204,870 (116,876) 760,6102 (Feb) 1,716,589 243,923 508,553 (564,782) 1,293,730 177,837 (110,639) 730,2943 (Mar) 1,693,114 232,997 444,497 (492,408) 1,346,940 166,215 (108,874) 681,5924 (Apr) 1,504,183 257,051 418,022 (446,902) 1,096,631 175,252 (105,817) 746,4305 (May) 1,499,389 234,352 410,469 (440,974) 1,145,584 154,226 (104,121) 764,2326 (Jun) 1,659,967 250,284 465,131 (500,829) 1,283,008 179,134 (109,364) 725,610
7 (Jul) 1,643,470 250,751 484,340 (527,502) 1,229,996 168,536 (116,689) 717,3978 (Aug) 1,692,234 245,646 507,941 (556,793) 1,224,960 170,359 (114,660) 742,2139 (Sep) 1,740,665 252,233 499,169 (540,483) 1,332,224 179,918 (107,008) 713,209
10 (Oct) 1,856,165 255,922 528,704 (564,261) 1,372,427 161,312 (121,358) 738,74511 (Nov) 1,819,801 226,913 519,471 (558,077) 1,347,160 149,961 (126,011) 746,10412 (Dec) 1,682,589 215,122 488,574 (532,990) 1,241,143 142,591 (122,888) 761,783
注:1.「販売」の( )は鋼材次工程用消費で外数。
2.「在庫」の( )は、鋼材次工程業者の素材在庫で外数。
(単位:t Unit: t)
Notes: 1. Figures in brackets in "Sales" : consumption for processed goods, uncounted.
2. Figures in brackets in "Inventory" : material inventories relating to secondary steel processing business proprietors, uncounted.
生 産Production
受 入Receipts
消 費Consumption
出 荷 Shipments在 庫
Inventory販 売 Sales その他Others
年 月Year and Month
合 計Grand total
(単位:t、Unit: t)
76
平成19年 (2007) 381,911 1,883 499 384,850 2,543 22,64620 (2008) 397,569 2,622 76 398,502 5,697 18,52221 (2009) 178,848 2,735 224 173,133 2,729 24,06822 (2010) 393,638 2,963 217 380,184 2,776 37,11323 (2011) 500,334 2,984 253 490,156 3,306 46,560
平成21年度 (09FY) 244,335 2,920 211 245,930 2,869 13,08522 (10FY) 436,149 2,932 318 421,363 2,907 27,322
平成23年 1~3月 (Q1) 129,310 854 126 138,865 926 27,3224~6 (Q2) 112,882 784 56 106,328 798 33,7757~9 (Q3) 132,742 708 44 141,364 902 24,889
10~12 (Q4) 125,400 638 27 103,599 680 46,560
平成23年 1月 (Jan) 49,858 287 25 56,631 384 30,2102 (Feb) 34,802 313 49 42,239 314 22,7093 (Mar) 44,650 254 52 39,995 228 27,3224 (Apr) 30,598 205 3 32,727 156 25,2325 (May) 38,424 314 24 29,117 335 34,4776 (Jun) 43,860 265 29 44,484 307 33,775
7 (Jul) 60,678 288 21 46,020 321 48,3738 (Aug) 34,788 171 15 46,786 302 36,2179 (Sep) 37,276 249 8 48,558 279 24,889
10 (Oct) 41,782 273 15 34,067 313 32,53911 (Nov) 31,881 206 7 38,510 199 25,89412 (Dec) 51,737 159 5 31,022 168 46,560
販売 Sales その他Others生 産
Production受 入
Receipts消 費
Consumption
出 荷 Shipments在 庫
Inventory
年 月Year and Month
形 鋼Steel shapes
(単位:t、Unit: t)
76

時系列表 (鉄鋼編) 製品
1. 製品 Products (10) 特殊鋼熱間圧延鋼材 Special hot-rolled steel
① 形状別 By configuration
平成19年 (2007) 6,724,149 392,491 131,934 6,606,212 397,386 (3,199) 200,44220 (2008) 6,883,261 378,041 138,371 6,771,138 378,327 (1,471) 182,43321 (2009) 3,448,161 104,123 59,877 3,387,539 121,648 (1,120) 165,66222 (2010) 6,029,672 226,605 125,682 5,856,598 184,087 (2,123) 197,75923 (2011) 6,256,373 262,572 153,039 6,057,992 192,199 (2,981) 214,449
平成21年度 (09FY) 4,265,765 125,142 75,446 4,113,936 145,883 (2,004) 167,46622 (10FY) 6,260,098 250,963 137,502 6,096,885 184,120 (2,112) 191,541
平成23年 1~3月 (Q1) 1,601,801 69,021 37,334 1,570,324 44,729 (2,112) 191,5414~6 (Q2) 1,430,918 62,709 42,604 1,386,335 48,270 (2,214) 193,0587~9 (Q3) 1,529,404 66,878 34,963 1,476,348 49,321 (3,336) 198,871
10~12 (Q4) 1,694,250 63,964 38,138 1,624,985 49,879 (2,981) 214,449
平成23年 1月 (Jan) 527,135 20,397 13,364 508,190 14,679 (1,859) 202,6312 (Feb) 533,949 23,513 11,845 512,508 14,467 (2,004) 213,5763 (Mar) 540,717 25,111 12,125 549,626 15,583 (2,112) 191,5414 (Apr) 452,051 20,991 14,133 417,672 16,218 (2,553) 212,0835 (May) 455,733 19,422 13,330 446,302 15,076 (2,712) 207,4426 (Jun) 523,134 22,296 15,141 522,361 16,976 (2,214) 193,058
7 (Jul) 511,399 23,007 13,492 489,331 16,400 (2,719) 195,5758 (Aug) 482,060 21,953 8,220 467,192 15,684 (2,445) 200,2159 (Sep) 535,945 21,918 13,251 519,825 17,237 (3,336) 198,871
10 (Oct) 562,994 22,058 13,367 540,108 16,923 (2,863) 206,80211 (Nov) 573,197 21,111 14,023 556,650 18,743 (2,777) 196,77212 (Dec) 558,059 20,795 10,748 528,227 14,213 (2,981) 214,449
注:1.「販売」の( )は鋼材次工程用消費で外数。
2.「在庫」の( )は、鋼材次工程業者の素材在庫で外数。
(単位:t Unit: t)
Notes: 1. Figures in brackets in "Sales" : consumption for processed goods, uncounted.
2. Figures in brackets in "Inventory" : material inventories relating to secondary steel processing business proprietors, uncounted.
受 入Receipts
消 費Consumption
出 荷 Shipments在 庫
Inventory販 売 Sales その他Others生 産
Production
年 月Year and Month
棒 鋼Steel bars
(単位:t、Unit: t)
77
平成19年 (2007) 1,662,975 1,007,874 1,099,717 (1,603,642) 1,170,635 353,263 (23,436) 42,57320 (2008) 1,685,010 1,037,630 1,127,978 (1,616,995) 1,190,835 351,815 (33,528) 21,92321 (2009) 1,077,489 755,655 779,727 (1,048,837) 783,730 231,531 (22,824) 20,21922 (2010) 1,355,012 809,074 904,029 (1,330,704) 901,524 331,284 (24,830) 28,32423 (2011) 1,498,992 931,801 1,017,131 (1,499,373) 1,027,632 351,806 (31,334) 30,455
平成21年度 (09FY) 1,060,842 707,302 753,948 (1,026,879) 737,107 241,323 (22,155) 20,20822 (10FY) 1,405,850 843,942 940,979 (1,397,495) 939,149 336,399 (20,703) 29,856
平成23年 1~3月 (Q1) 354,578 225,868 253,261 (371,495) 241,233 80,768 (20,703) 29,8564~6 (Q2) 378,062 226,255 250,094 (363,234) 256,283 90,011 (24,463) 32,2367~9 (Q3) 368,045 225,397 247,026 (376,141) 256,711 85,597 (21,544) 30,919
10~12 (Q4) 398,307 254,281 266,750 (388,503) 273,405 95,430 (31,334) 30,455
平成23年 1月 (Jan) 124,006 84,844 87,145 (126,693) 89,417 27,384 (25,041) 27,6932 (Feb) 119,913 76,726 91,397 (129,453) 84,082 25,407 (21,438) 27,6933 (Mar) 110,659 64,298 74,719 (115,349) 67,734 27,977 (20,703) 29,8564 (Apr) 134,453 84,881 88,329 (125,524) 91,137 31,389 (21,796) 34,3785 (May) 125,802 76,705 91,091 (125,920) 88,215 27,569 (26,100) 33,1376 (Jun) 117,807 64,669 70,674 (111,790) 76,931 31,053 (24,463) 32,236
7 (Jul) 131,676 82,194 85,849 (130,335) 93,313 28,745 (28,036) 32,6248 (Aug) 125,245 77,877 84,102 (126,922) 87,614 30,017 (26,875) 31,4649 (Sep) 111,124 65,326 77,075 (118,884) 75,784 26,835 (21,544) 30,919
10 (Oct) 147,857 97,842 93,758 (131,248) 105,441 34,712 (28,015) 31,03511 (Nov) 127,228 79,309 86,274 (127,155) 82,628 31,448 (28,349) 33,85012 (Dec) 123,222 77,130 86,718 (130,100) 85,336 29,270 (31,334) 30,455
販 売 Sales その他Others
出 荷 Shipments在 庫
Inventory生 産
Production受 入
Receipts消 費
Consumption
年 月Year and Month
管 材Rounds for tubes
(単位:t、Unit: t)
77

時系列表 (鉄鋼編) 製品
1. 製品 Products (10) 特殊鋼熱間圧延鋼材 Special hot-rolled steel
① 形状別 By configuration
平成19年 (2007) 4,394,559 157,120 193,649 4,286,360 80,872 155,59520 (2008) 4,446,064 166,828 178,500 4,322,288 95,777 170,16421 (2009) 2,916,079 86,646 98,015 2,838,182 59,496 176,34322 (2010) 4,382,009 114,199 122,061 4,238,218 88,091 222,13323 (2011) 4,163,728 143,762 121,832 4,080,547 114,602 199,712
平成21年度 (09FY) 3,544,893 102,825 106,017 3,427,755 77,248 163,37322 (10FY) 4,383,582 112,826 120,984 4,249,811 89,669 197,480
平成23年 1~3月 (Q1) 1,065,843 31,138 28,101 1,064,736 28,306 197,4804~6 (Q2) 908,179 38,787 28,348 889,932 30,940 183,9217~9 (Q3) 1,073,534 33,073 30,443 1,029,489 26,914 202,948
10~12 (Q4) 1,116,172 40,764 34,940 1,096,390 28,442 199,712
平成23年 1月 (Jan) 376,001 9,547 8,599 371,210 9,236 218,6502 (Feb) 360,103 11,117 10,365 352,302 9,020 218,0513 (Mar) 329,739 10,474 9,137 341,224 10,050 197,4804 (Apr) 291,701 14,908 10,682 276,218 11,963 205,5055 (May) 308,820 12,365 8,463 286,821 9,308 218,7306 (Jun) 307,658 11,514 9,203 326,893 9,669 183,921
7 (Jul) 338,217 12,061 10,248 326,871 9,496 187,4908 (Aug) 355,383 8,904 8,586 341,920 8,314 192,3739 (Sep) 379,934 12,108 11,609 360,698 9,104 202,948
10 (Oct) 389,358 12,685 10,864 384,184 9,144 200,76611 (Nov) 369,966 16,735 12,796 357,147 10,409 206,78412 (Dec) 356,848 11,344 11,280 355,059 8,889 199,712
注:1.「販売」の( )は鋼材次工程用消費で外数。
2.「在庫」の( )は、鋼材次工程業者の素材在庫で外数。
(単位:t Unit: t)
Notes: 1. Figures in brackets in "Sales" : consumption for processed goods, uncounted.
2. Figures in brackets in "Inventory" : material inventories relating to secondary steel processing business proprietors, uncounted.
消 費Consumption
出 荷 Shipments在 庫
Inventory販 売 Sales その他Others生 産
Production受 入
Receipts
年 月Year and Month
線 材Steel wire rods
(単位:t、Unit: t)
78
(単位:t、Unit: t)
平成19年 (2007) 2,240,897 69,880 962,222 (973,918) 1,277,909 87,590 (225) 73,14120 (2008) 2,303,024 43,513 964,695 (971,505) 1,340,702 52,438 (251) 76,39721 (2009) 1,475,712 42,790 581,698 (587,252) 929,982 30,356 (170) 63,13622 (2010) 2,074,482 38,670 848,715 (853,962) 1,153,025 119,159 (86) 63,22623 (2011) 2,087,517 8,089 688,202 (694,639) 1,343,153 33,079 (138) 102,969
平成21年度 (09FY) 1,496,432 56,090 650,377 (655,914) 896,035 28,555 (109) 61,84322 (10FY) 2,105,357 15,755 767,196 (772,751) 1,233,862 125,395 (272) 66,032
平成23年 1~3月 (Q1) 504,600 1,842 162,166 (163,703) 326,570 18,074 (272) 66,0324~6 (Q2) 464,461 2,223 80,670 (82,558) 342,378 5,255 (146) 106,4697~9 (Q3) 480,912 1,932 165,447 (167,140) 341,862 3,917 (125) 80,023
10~12 (Q4) 637,544 2,092 279,919 (281,238) 332,343 5,833 (138) 102,969
平成23年 1月 (Jan) 187,853 451 65,271 (65,796) 90,414 8,576 (257) 88,2792 (Feb) 152,552 522 59,395 (59,905) 103,004 6,739 (216) 73,0693 (Mar) 164,195 869 37,500 (38,002) 133,152 2,759 (272) 66,0324 (Apr) 142,834 668 19,141 (19,780) 95,941 2,114 (112) 93,1245 (May) 141,321 809 25,168 (25,688) 121,850 1,315 (151) 87,6076 (Jun) 180,306 746 36,361 (37,090) 124,587 1,826 (146) 106,469
7 (Jul) 127,379 631 43,488 (44,151) 112,303 480 (183) 78,9368 (Aug) 178,768 783 63,895 (64,297) 95,078 1,822 (216) 97,6639 (Sep) 174,765 518 58,064 (58,692) 134,481 1,615 (125) 80,023
10 (Oct) 216,410 756 93,166 (93,595) 123,664 2,195 (83) 78,75211 (Nov) 237,030 661 86,330 (86,783) 117,054 1,606 (132) 111,66612 (Dec) 184,104 675 100,423 (100,860) 91,625 2,032 (138) 102,969
在 庫Inventory販 売 Sales その他Others
生 産Production
受 入Receipts
消 費Consumption
出 荷 Shipments
年 月Year and Month
鋼 板Steel sheets and plates
78

時系列表 (鉄鋼編) 製品
1. 製品 Products (10) 特殊鋼熱間圧延鋼材 Special hot-rolled steel
① 形状別 By configuration
平成19年 (2007) 6,093,748 1,798,002 3,932,037 (4,316,869) 2,450,643 1,419,933 (52,566) 191,35020 (2008) 6,067,205 1,743,065 3,983,319 (4,402,538) 2,320,627 1,457,024 (49,835) 178,87321 (2009) 4,173,103 1,131,559 2,707,982 (2,938,488) 1,619,793 963,267 (56,622) 157,12222 (2010) 6,270,227 1,586,563 4,037,886 (4,354,417) 2,408,256 1,329,324 (43,083) 188,88723 (2011) 5,832,915 1,586,069 3,819,117 (4,104,799) 2,247,926 1,335,219 (41,276) 167,638
平成21年度 (09FY) 5,112,584 1,375,531 3,263,847 (3,546,579) 1,958,639 1,168,510 (45,965) 171,52422 (10FY) 6,332,850 1,600,136 4,071,738 (4,390,233) 2,447,827 1,362,655 (48,427) 169,361
平成23年 1~3月 (Q1) 1,585,264 418,280 996,765 (1,094,802) 632,545 376,119 (48,427) 169,3614~6 (Q2) 1,369,037 410,929 891,850 (942,913) 543,967 333,338 (43,677) 176,1517~9 (Q3) 1,491,732 420,642 1,013,527 (1,081,497) 541,406 352,162 (43,781) 175,559
10~12 (Q4) 1,386,882 336,218 916,975 (985,587) 530,008 273,600 (41,276) 167,638
平成23年 1月 (Jan) 566,840 154,557 350,299 (380,321) 217,741 144,611 (47,641) 193,1472 (Feb) 515,270 131,732 335,502 (375,424) 199,595 121,890 (50,941) 175,1963 (Mar) 503,154 131,991 310,964 (339,057) 215,209 109,618 (48,427) 169,3614 (Apr) 452,546 135,398 285,734 (301,598) 182,936 113,412 (41,015) 176,1085 (May) 429,289 124,737 272,393 (289,366) 173,279 100,623 (39,550) 182,8396 (Jun) 487,202 150,794 333,723 (351,949) 187,752 119,303 (43,677) 176,151
7 (Jul) 474,121 132,570 331,242 (353,016) 162,158 113,094 (43,302) 174,3998 (Aug) 515,990 135,958 343,123 (365,574) 186,370 114,220 (41,763) 184,2819 (Sep) 501,621 152,114 339,162 (362,907) 192,878 124,848 (43,781) 175,559
10 (Oct) 497,764 122,308 317,534 (339,418) 184,963 98,025 (43,602) 188,85111 (Nov) 480,499 108,891 320,041 (344,139) 195,171 87,556 (46,976) 171,13812 (Dec) 408,619 105,019 279,400 (302,030) 149,874 88,019 (41,276) 167,638
注:1.「販売」の( )は鋼材次工程用消費で外数。
2.「在庫」の( )は、鋼材次工程業者の素材在庫で外数。
Notes: 1. Figures in brackets in "Sales" : consumption for processed goods, uncounted.
2. Figures in brackets in "Inventory" : material inventories relating to secondary steel processing business proprietors, uncounted.
生 産Production
受 入Receipts
消 費Consumption
鋼 帯Steel strips
出 荷 Shipments在 庫
Inventory販 売 Sales その他Others
年 月Year and Month
(単位:t、Unit: t)
7979

時系列表 (鉄鋼編) 製品
1. 製品 Products (10) 特殊鋼熱間圧延鋼材 Special hot-rolled steel
② 鋼種別(生産・在庫) By kind of steel (Production/Inventory)
平成19年 (2007) 21,498,239 685,747 277,935 7,654 134,245 3,406 124,660 3,884 15,951 36420 (2008) 21,782,133 648,312 278,962 8,093 130,664 2,888 126,668 4,615 17,876 59021 (2009) 13,269,392 606,550 118,838 4,601 61,219 1,586 50,273 2,644 6,555 36322 (2010) 20,505,040 737,442 264,305 8,211 144,302 4,062 107,146 3,641 12,766 50823 (2011) 20,339,859 761,783 249,273 8,488 126,016 3,770 106,650 4,046 16,504 672
平成21年度 (09FY) 15,724,851 597,499 153,577 4,885 85,354 1,989 60,935 2,493 7,163 40322 (10FY) 20,923,886 681,592 268,456 8,496 143,776 4,399 110,680 3,600 13,938 497
平成23年 1~3月 (Q1) 5,241,396 681,592 63,236 8,496 32,496 4,399 26,861 3,600 3,856 4974~6 (Q2) 4,663,539 725,610 64,735 8,778 33,181 4,720 27,390 3,529 4,130 5297~9 (Q3) 5,076,369 713,209 63,550 8,411 32,764 4,493 26,504 3,205 4,271 713
10~12 (Q4) 5,358,555 761,783 57,752 8,488 27,575 3,770 25,895 4,046 4,247 672
平成23年 1月 (Jan) 1,831,693 760,610 22,283 9,289 12,385 4,953 8,634 3,879 1,260 4572 (Feb) 1,716,589 730,294 19,620 9,421 9,802 5,230 8,596 3,694 1,218 4973 (Mar) 1,693,114 681,592 21,333 8,496 10,309 4,399 9,631 3,600 1,378 4974 (Apr) 1,504,183 746,430 22,741 9,383 12,370 5,359 9,006 3,451 1,336 5595 (May) 1,499,389 764,232 19,179 7,376 9,112 3,539 8,695 3,330 1,367 5076 (Jun) 1,659,967 725,610 22,815 8,778 11,699 4,720 9,689 3,529 1,427 529
7 (Jul) 1,643,470 717,397 22,281 8,824 12,081 4,928 8,732 3,301 1,466 5958 (Aug) 1,692,234 742,213 20,271 9,257 10,497 5,144 8,459 3,500 1,315 6139 (Sep) 1,740,665 713,209 20,998 8,411 10,186 4,493 9,313 3,205 1,490 713
10 (Oct) 1,856,165 738,745 20,889 8,614 10,846 4,973 8,564 2,919 1,469 71611 (Nov) 1,819,801 746,104 18,150 7,989 7,622 3,879 9,124 3,441 1,390 66512 (Dec) 1,682,589 761,783 18,713 8,488 9,107 3,770 8,207 4,046 1,388 672
注:鋼種別在庫は生産者分のみ。
Note: Inventory by kind of steel is for producers' portion only.
② 鋼種別(生産・在庫) By kind of steel (Production/Inventory) (単位:t Unit: t)
生 産Production
在 庫Inventory
生 産Production
在 庫Inventory
生 産Production
在 庫Inventory
生 産Production
在 庫Inventory
生 産Production
在 庫Inventory
計Total
炭素工具鋼Carbon tool steel
合金工具鋼Alloy tool steel
高速度工具鋼High-speed tool steel
年 月Year and Month
合 計Grand total
工 具 鋼 Tool steel
(単位:t、Unit: t)
80
② 鋼種別(生産・在庫) By kind of steel (Production/Inventory) (単位:t、Unit: t)
平成19年 (2007) 3,079 - 9,202,600 245,788 5,099,889 159,314 4,102,711 86,47420 (2008) 3,754 - 9,344,488 256,087 5,152,106 158,724 4,192,382 97,36321 (2009) 791 8 5,205,075 245,118 2,843,319 153,500 2,361,756 91,61822 (2010) 91 - 8,475,384 313,169 4,709,973 196,285 3,765,411 116,88423 (2011) 103 - 8,655,769 307,196 4,616,659 190,227 4,039,110 116,969
平成21年度 (09FY) 125 - 6,251,944 237,973 3,505,715 150,279 2,746,229 87,69422 (10FY) 62 - 8,709,457 275,980 4,789,705 172,140 3,919,752 103,840
平成23年 1~3月 (Q1) 23 - 2,190,614 275,980 1,184,566 172,140 1,006,048 103,8404~6 (Q2) 34 - 1,952,863 286,342 1,020,892 172,482 931,971 113,8607~9 (Q3) 11 - 2,133,223 292,978 1,136,405 180,445 996,818 112,533
10~12 (Q4) 35 - 2,379,069 307,196 1,274,796 190,227 1,104,273 116,969
平成23年 1月 (Jan) 4 - 756,921 304,603 417,734 199,272 339,187 105,3312 (Feb) 4 - 723,217 305,414 383,467 192,517 339,750 112,8973 (Mar) 15 - 710,476 275,980 383,365 172,140 327,111 103,8404 (Apr) 29 14 649,381 319,330 337,058 197,610 312,323 121,7205 (May) 5 - 628,827 313,362 325,136 185,884 303,691 127,4786 (Jun) - - 674,655 286,342 358,698 172,482 315,957 113,860
7 (Jul) 2 - 703,578 295,428 355,331 170,723 348,247 124,7058 (Aug) - - 704,455 302,128 382,506 178,275 321,949 123,8539 (Sep) 9 - 725,190 292,978 398,568 180,445 326,622 112,533
10 (Oct) 10 6 809,886 306,330 435,694 189,750 374,192 116,58011 (Nov) 14 4 796,412 303,988 426,079 181,260 370,333 122,72812 (Dec) 11 - 772,771 307,196 413,023 190,227 359,748 116,969
生 産Production
在 庫Inventory
生 産Production
在 庫Inventory
生 産Production
在 庫Inventory
生 産Production
在 庫Inventory
その他の工具鋼Other tool steel
計Total
機械構造用炭素鋼Carbon steel for machine structure
年 月Year and Month
工 具 鋼Tool steel
構 造 用 鋼 Structural steel
構造用合金鋼Alloy steel for structure
80

時系列表 (鉄鋼編) 製品
1. 製品 Products (10) 特殊鋼熱間圧延鋼材 Special hot-rolled steel
② 鋼種別(生産・在庫) By kind of steel (Production/Inventory)
平成19年 (2007) 12,017,704 432,305 504,131 25,311 923,983 27,62320 (2008) 12,158,683 384,132 509,061 20,118 1,047,806 33,33521 (2009) 7,945,479 356,831 290,195 25,398 546,103 31,87622 (2010) 11,765,351 416,062 433,942 26,837 990,566 32,89923 (2011) 11,434,817 446,099 427,775 24,614 1,117,301 38,099
平成21年度 (09FY) 9,319,330 354,641 356,793 24,585 687,413 31,48422 (10FY) 11,945,973 397,116 433,475 23,338 1,036,426 30,420
平成23年 1~3月 (Q1) 2,987,546 397,116 105,380 23,338 273,415 30,4204~6 (Q2) 2,645,941 430,490 85,422 20,615 283,099 35,5187~9 (Q3) 2,879,596 411,820 116,440 20,818 265,916 36,238
10~12 (Q4) 2,921,734 446,099 120,533 24,614 294,871 38,099
平成23年 1月 (Jan) 1,052,489 446,718 31,395 24,456 86,645 31,6502 (Feb) 973,752 415,459 39,637 28,742 89,670 34,5633 (Mar) 961,305 397,116 34,348 23,338 97,100 30,4204 (Apr) 832,061 417,717 28,366 23,813 87,597 31,9125 (May) 851,383 443,494 27,328 25,964 98,484 36,6426 (Jun) 962,497 430,490 29,728 20,615 97,018 35,518
7 (Jul) 917,611 413,145 35,487 21,464 92,094 32,8688 (Aug) 967,508 430,828 39,289 20,730 78,809 32,7929 (Sep) 994,477 411,820 41,664 20,818 95,013 36,238
10 (Oct) 1,025,390 423,801 40,259 21,217 94,470 34,33311 (Nov) 1,005,239 434,127 37,419 23,129 100,839 36,41412 (Dec) 891,105 446,099 42,855 24,614 99,562 38,099
(単位:t Unit: t)
生 産Production
在 庫Inventory
生 産Production
在 庫Inventory
生 産Production
在 庫Inventory
計Total
ばね鋼Spring steel
軸受鋼Bearing steel
年 月Year and Month
特 殊 用 途 鋼 Steel for special purposes
(単位:t、Unit: t)
81
平成19年 (2007) 3,492,210 165,130 1,322,334 41,633 226,344 9,836 107,386 1,793 1,518,137 99,43220 (2008) 3,209,876 117,440 1,247,297 35,350 219,456 8,356 86,498 1,588 1,356,663 62,71521 (2009) 2,346,002 108,939 806,856 32,833 130,922 7,293 49,155 435 1,141,607 57,57022 (2010) 3,084,123 118,937 1,223,778 43,259 209,771 5,577 63,892 378 1,319,342 58,01223 (2011) 2,931,487 122,684 1,149,682 41,292 203,131 8,427 57,219 557 1,240,384 59,967
平成21年度 (09FY) 2,717,181 114,320 968,152 34,848 163,036 9,502 58,532 383 1,293,843 60,82022 (10FY) 3,112,544 111,558 1,241,373 41,553 206,362 4,803 62,336 190 1,327,292 53,455
平成23年 1~3月 (Q1) 771,323 111,558 296,285 41,553 49,274 4,803 15,314 190 338,428 53,4554~6 (Q2) 745,033 117,125 279,406 33,432 41,497 7,079 15,043 179 334,100 64,4567~9 (Q3) 759,343 124,066 311,395 41,508 62,104 7,165 14,617 230 301,267 63,620
10~12 (Q4) 655,788 122,684 262,596 41,292 50,256 8,427 12,245 557 266,589 59,967
平成23年 1月 (Jan) 270,224 126,660 109,409 43,212 20,593 7,776 4,106 176 112,349 62,2122 (Feb) 258,076 123,971 101,496 43,920 16,225 6,786 6,037 252 111,073 61,2093 (Mar) 243,023 111,558 85,380 41,553 12,456 4,803 5,171 190 115,006 53,4554 (Apr) 239,079 120,983 94,685 51,243 13,565 5,913 5,193 166 101,116 50,4325 (May) 244,836 112,276 87,896 37,925 11,645 5,373 5,032 353 116,124 57,0266 (Jun) 261,118 117,125 96,825 33,432 16,287 7,079 4,818 179 116,860 64,456
7 (Jul) 255,413 119,375 106,342 38,216 21,056 8,412 5,265 169 96,375 59,7458 (Aug) 252,148 127,633 105,941 45,605 19,884 7,270 4,960 163 100,385 63,1939 (Sep) 251,782 124,066 99,112 41,508 21,164 7,165 4,392 230 104,507 63,620
10 (Oct) 248,790 127,351 105,615 43,923 20,632 8,599 5,064 374 96,043 63,33211 (Nov) 210,556 127,725 86,107 43,172 15,738 9,031 3,372 141 84,775 64,00012 (Dec) 196,442 122,684 70,874 41,292 13,886 8,427 3,809 557 85,771 59,967
注:19年よりステンレス鋼の定義及び鋼種を変更した。これにより18年以前は不連続となっている。 Note: In 2007, the definition and category for Stainless Steel changed.
在 庫Inventory
生 産Production
在 庫Inventory
在 庫Inventory
生 産Production
在 庫Inventory
生 産Production
生 産Production
年 月Year and Month
特 殊 用 途 鋼 Steel for special purposes
小 計Sub total
Cr系Cr stainless steel
在 庫Inventory
生 産Production
Cr-Mn系Cr-Mn stainless steel
Cr-Ni系Cr-Ni stainless steel
ステンレス鋼 Stainless steel
Cr-Mo系Cr-Mo stainless steel
(単位:t、Unit: t)
81

時系列表 (鉄鋼編) 製品
1. 製品 Products (10) 特殊鋼熱間圧延鋼材 Special hot-rolled steel
② 鋼種別(生産・在庫) By kind of steel (Production/Inventory)
平成19年 (2007) 318,009 12,436 987,711 37,346 720,635 26,422 5,278,383 145,944 110,651 4,52920 (2008) 299,962 9,431 919,300 34,460 789,847 30,533 5,580,765 143,757 102,028 4,48921 (2009) 217,462 10,808 526,073 32,693 532,406 23,972 3,630,014 131,497 74,686 2,45622 (2010) 267,340 11,711 808,875 32,660 750,185 31,805 5,613,907 171,362 83,753 1,56223 (2011) 281,071 12,441 744,318 30,553 751,709 28,872 5,380,181 197,768 82,046 3,509
平成21年度 (09FY) 233,618 8,767 654,708 30,093 599,639 20,668 4,225,196 130,480 78,400 3,01122 (10FY) 275,181 11,557 808,958 29,060 774,769 43,785 5,697,455 154,845 82,346 4,110
平成23年 1~3月 (Q1) 72,022 11,557 205,091 29,060 199,914 43,785 1,411,652 154,845 20,771 4,1104~6 (Q2) 74,987 11,979 146,367 27,365 203,111 38,359 1,165,149 188,379 17,760 3,1297~9 (Q3) 69,960 11,543 195,018 31,404 193,287 33,105 1,327,638 160,814 21,954 5,375
10~12 (Q4) 64,102 12,441 197,842 30,553 155,397 28,872 1,475,742 197,768 21,561 3,509
平成23年 1月 (Jan) 23,767 13,284 67,302 35,905 75,647 35,973 513,614 188,950 7,662 3,1242 (Feb) 23,245 11,804 73,560 35,378 65,704 43,002 439,373 147,053 7,732 2,7503 (Mar) 25,010 11,557 64,229 29,060 58,563 43,785 458,665 154,845 5,377 4,1104 (Apr) 24,520 13,229 40,384 29,736 70,097 47,616 362,056 162,059 4,482 1,5985 (May) 24,139 11,599 44,204 27,873 71,831 51,909 358,433 185,706 6,267 3,1246 (Jun) 26,328 11,979 61,779 27,365 61,183 38,359 444,660 188,379 7,011 3,129
7 (Jul) 26,375 12,833 65,285 28,363 68,519 40,241 393,823 168,398 6,990 2,4368 (Aug) 20,978 11,402 64,145 28,452 58,910 38,306 468,032 179,893 6,175 3,0229 (Sep) 22,607 11,543 65,588 31,404 65,858 33,105 465,783 160,814 8,789 5,375
10 (Oct) 21,436 11,123 69,019 29,436 57,939 29,667 508,407 179,309 6,506 2,48811 (Nov) 20,564 11,381 65,182 27,721 53,659 36,271 529,268 179,446 8,316 3,42112 (Dec) 22,102 12,441 63,641 30,553 43,799 28,872 438,067 197,768 6,739 3,509
注:その他の特殊用途鋼には耐熱鋼、高マンガン鋼が含まれる。
なお、平成19年よりステンレス鋼の定義変更に伴い耐熱鋼の一部がステンレス鋼に移動したため、平成18年以前は不連続となっている。
Note: Other Steel for Special Purposes includes heat-resisting and high-manganese steel. In addition, because classifications for steel categories changed in 2007,
(単位:t Unit: t)
生 産Production
在 庫Inventory
生 産Production
在 庫Inventory
生 産Production
在 庫Inventory
その他の特殊用途鋼Other steel for special
purposesCr-Ni-Mo系
Cr-Ni-Mo stainless steel
年 月Year and Month
特 殊 用 途 鋼 Steel for special purposesステンレス鋼 Stainless
快削鋼Free-cutting steel
ピアノ線材Piano wire rods
高抗張力鋼High-tensile-strength
steel
生 産Production
在 庫Inventory
生 産Production
在 庫Inventory
(単位:t、Unit: t)
82
平成19年 (2007) 80,795 1,04720 (2008) 82,452 1,03221 (2009) 59,862 1,40322 (2010) 71,279 1,70823 (2011) 63,010 1,024
平成21年度 (09FY) 59,516 34122 (10FY) 69,397 921
平成23年 1~3月 (Q1) 14,356 9214~6 (Q2) 16,908 8197~9 (Q3) 17,318 1,906
10~12 (Q4) 14,428 1,024
平成23年 1月 (Jan) 4,368 1,0132 (Feb) 5,255 1,1703 (Mar) 4,733 9214 (Apr) 5,876 1,0355 (May) 5,358 1,3576 (Jun) 5,674 819
7 (Jul) 6,329 8638 (Aug) 5,020 8009 (Sep) 5,969 1,906
10 (Oct) 5,402 1,41511 (Nov) 4,830 94912 (Dec) 4,196 1,024
生 産Production
在 庫Inventory
年 月Year and Month
合わせ鋼材Clad steel
(単位:t、Unit: t)
82

時系列表 (鉄鋼編) 製品
1. 製品 Products (11) 鋼管 Steel pipes and tubes
① 総表 Summary table
その他Others平成19年 (2007) 9,895,311 1,156,142 1,316,124 (1,307,695) 9,042,708 672,813 (21,765) 707,847
20 (2008) 9,721,750 1,144,425 1,276,581 (1,269,995) 9,024,188 643,265 (30,804) 639,48821 (2009) 6,172,324 691,327 822,767 (818,417) 5,732,360 381,239 (20,531) 558,06622 (2010) 7,690,143 868,757 1,066,288 (1,060,301) 6,944,642 461,929 (20,963) 577,81823 (2011) 7,804,152 870,154 1,108,088 (1,102,375) 7,055,842 411,325 (21,188) 594,948
平成21年度 (09FY) 6,446,270 737,301 898,406 (892,918) 5,807,557 421,259 (20,312) 523,64022 (10FY) 7,793,022 856,480 1,072,313 (1,066,341) 7,103,090 413,761 (22,229) 509,597
平成23年 1~3月 (Q1) 2,023,530 212,447 267,265 (265,684) 1,913,241 106,127 (22,229) 509,5974~6 (Q2) 1,828,379 206,335 279,012 (277,645) 1,586,378 105,740 (22,311) 546,0427~9 (Q3) 1,893,910 228,117 277,018 (275,772) 1,729,900 101,693 (21,692) 539,298
10~12 (Q4) 2,058,333 223,255 284,793 (283,274) 1,826,323 97,765 (21,188) 594,948
平成23年 1月 (Jan) 644,170 71,806 86,088 (85,557) 608,544 34,926 (21,619) 558,1712 (Feb) 684,218 71,762 92,488 (91,970) 622,061 38,176 (21,244) 555,7033 (Mar) 695,142 68,879 88,689 (88,157) 682,636 33,025 (22,229) 509,5974 (Apr) 610,012 64,475 93,804 (93,358) 506,091 33,103 (23,943) 541,0345 (May) 606,949 64,324 91,956 (91,499) 509,101 36,017 (23,135) 566,4566 (Jun) 611,418 77,536 93,252 (92,788) 571,186 36,620 (22,311) 546,042
7 (Jul) 611,374 77,244 91,364 (90,947) 547,634 34,145 (22,222) 552,7258 (Aug) 623,321 73,917 87,817 (87,453) 545,709 32,991 (21,818) 575,7429 (Sep) 659,215 76,956 97,837 (97,372) 636,557 34,557 (21,692) 539,298
10 (Oct) 698,534 73,907 98,529 (98,023) 561,664 30,194 (20,275) 616,18911 (Nov) 665,756 73,032 93,206 (92,721) 622,560 31,326 (20,713) 603,40512 (Dec) 694,043 76,316 93,058 (92,530) 642,099 36,245 (21,188) 594,948
注:1.「普通鋼」の「熱間鋼管」及び「冷けん鋼管」、「特殊鋼」の「熱間鋼管」の「販売」の( )は、冷けん用及びめっき用に消費された数量で外数。
2.「普通鋼」及び「特殊鋼」の「熱間鋼管」の「在庫」の( )は、冷けん及びめっき専業者の素材在庫で外数。
年 月Year and Month
合 計Grand total
(単位:t、Unit: t)
生 産Production
受 入Receipts
消 費Consumption
出 荷 Shipments 在 庫Inventory販 売 Sales
(単位:t、Unit: t)
83
その他Others
平成19年 (2007) 6,885,047 1,077,054 1,043,652 (1,042,719) 6,269,925 643,510 (18,650) 454,35720 (2008) 6,568,860 1,067,419 990,385 (990,385) 6,093,031 609,178 (27,424) 410,01421 (2009) 4,321,614 653,423 672,931 (672,931) 3,999,508 363,309 (17,552) 343,14922 (2010) 5,131,217 820,174 844,535 (844,535) 4,607,019 399,592 (18,534) 382,99923 (2011) 5,273,379 821,329 871,168 (871,168) 4,775,278 389,014 (18,326) 372,102
平成21年度 (09FY) 4,476,748 698,605 734,191 (734,191) 4,059,094 370,165 (17,763) 334,28422 (10FY) 5,251,232 807,766 848,179 (848,179) 4,722,379 385,949 (19,877) 369,937
平成23年 1~3月 (Q1) 1,373,391 200,598 212,260 (212,260) 1,259,010 100,696 (19,877) 369,9374~6 (Q2) 1,343,273 196,267 224,115 (224,115) 1,160,794 101,989 (19,565) 397,9867~9 (Q3) 1,269,808 214,692 216,970 (216,970) 1,191,686 96,171 (18,830) 361,582
10~12 (Q4) 1,286,907 209,772 217,823 (217,823) 1,163,788 90,158 (18,326) 372,102
平成23年 1月 (Jan) 436,676 67,861 67,851 (67,851) 411,195 33,713 (19,233) 369,5812 (Feb) 454,048 67,675 75,306 (75,306) 410,408 36,046 (18,880) 365,5353 (Mar) 482,667 65,062 69,103 (69,103) 437,407 30,937 (19,877) 369,9374 (Apr) 460,650 61,146 75,725 (75,725) 383,719 31,828 (21,354) 391,1345 (May) 442,504 61,736 73,062 (73,062) 375,257 34,918 (20,439) 404,2856 (Jun) 440,119 73,385 75,328 (75,328) 401,818 35,243 (19,565) 397,986
7 (Jul) 412,073 72,322 71,491 (71,491) 397,446 32,297 (19,337) 374,0798 (Aug) 414,519 69,934 69,139 (69,139) 370,934 31,287 (18,953) 380,7399 (Sep) 443,216 72,436 76,340 (76,340) 423,306 32,587 (18,830) 361,582
10 (Oct) 440,758 69,674 76,037 (76,037) 392,122 28,291 (17,434) 371,50211 (Nov) 430,826 68,562 72,071 (72,071) 394,146 28,872 (17,969) 372,01712 (Dec) 415,323 71,536 69,715 (69,715) 377,520 32,995 (18,326) 372,102
specializing in cold-draw and metallic-coating, uncounted.
年 月Year and Month
普 通 鋼 Ordinary steel
計 Total
生 産Production
受 入Receipts
消 費Consumption
出 荷 Shipments 在 庫Inventory
2. Figures in brackets in "Inventory" of both "Ordinary" and "Special" steel (excluding cold-drawn pipes) : inventory of materials of manufacturers
販 売 Sales
Notes: 1.Figures in brackets in "Sales" in the following categories are consumption for cold-draw and metallic-coating,
uncounted : hot-steel pipes and tubes and cold-drawn pipes and tubes of ordinary steel, and hot-steel pipes and tubes of special steel.
83

時系列表 (鉄鋼編) 製品
1. 製品 Products (11) 鋼管 Steel pipes and tubes
① 総表 Summary table
その他Others平成19年 (2007) 5,861,226 878,455 1,043,652 (1,042,719) 5,311,503 380,567 (18,650) 389,122
20 (2008) 5,589,267 882,852 990,385 (990,385) 5,163,939 364,795 (27,424) 347,77621 (2009) 3,654,832 548,752 672,931 (672,931) 3,365,840 214,541 (17,552) 289,75922 (2010) 4,297,279 687,038 844,535 (844,535) 3,820,954 217,092 (18,534) 328,10123 (2011) 4,428,269 680,688 871,168 (871,168) 3,977,640 208,435 (18,326) 313,129
平成21年度 (09FY) 3,751,441 587,417 734,191 (734,191) 3,372,330 212,750 (17,763) 286,49422 (10FY) 4,418,437 677,852 848,179 (848,179) 3,940,605 207,995 (19,877) 319,416
平成23年 1~3月 (Q1) 1,167,623 168,131 212,260 (212,260) 1,060,973 56,159 (19,877) 319,4164~6 (Q2) 1,123,610 152,997 224,115 (224,115) 962,630 48,299 (19,565) 338,2857~9 (Q3) 1,061,639 178,391 216,970 (216,970) 994,710 52,355 (18,830) 298,726
10~12 (Q4) 1,075,397 181,169 217,823 (217,823) 959,327 51,622 (18,326) 313,129
平成23年 1月 (Jan) 371,268 57,063 67,851 (67,851) 350,529 18,724 (19,233) 314,4292 (Feb) 380,486 56,658 75,306 (75,306) 342,413 19,958 (18,880) 309,7453 (Mar) 415,869 54,410 69,103 (69,103) 368,031 17,477 (19,877) 319,4164 (Apr) 385,848 48,080 75,725 (75,725) 316,192 15,036 (21,354) 337,0425 (May) 371,240 46,443 73,062 (73,062) 312,716 17,015 (20,439) 345,9886 (Jun) 366,522 58,474 75,328 (75,328) 333,722 16,248 (19,565) 338,285
7 (Jul) 343,525 59,965 71,491 (71,491) 335,241 17,133 (19,337) 312,0018 (Aug) 347,644 57,075 69,139 (69,139) 308,231 16,688 (18,953) 316,6589 (Sep) 370,470 61,351 76,340 (76,340) 351,238 18,534 (18,830) 298,726
10 (Oct) 367,316 59,619 76,037 (76,037) 319,583 15,012 (17,434) 311,36211 (Nov) 360,148 59,747 72,071 (72,071) 326,218 16,588 (17,969) 312,71112 (Dec) 347,933 61,803 69,715 (69,715) 313,526 20,022 (18,326) 313,129
注:1.「普通鋼」の「熱間鋼管」及び「冷けん鋼管」、「特殊鋼」の「熱間鋼管」の「販売」の( )は、冷けん用及びめっき用に消費された数量で外数。
2.「普通鋼」及び「特殊鋼」の「熱間鋼管」の「在庫」の( )は、冷けん及びめっき専業者の素材在庫で外数。
(単位:t、Unit: t)
年 月Year and Month
普 通 鋼 Ordinary steel
(単位:t、Unit: t)
熱間鋼管 Hot-steel pipes and tubes
生 産Production
受 入Receipts
消 費Consumption
出 荷 Shipments 在 庫Inventory販 売 Sales
84
その他Others
平成19年 (2007) 358,795 904 - - 352,976 11,137 11,64720 (2008) 346,048 750 - - 341,034 11,058 10,33621 (2009) 187,308 313 - - 189,073 3,061 9,20422 (2010) 270,594 536 - - 268,516 5,129 10,09223 (2011) 265,610 306 - - 266,059 3,767 11,040
平成21年度 (09FY) 217,297 423 - - 218,703 3,381 8,60322 (10FY) 270,675 425 - - 268,573 5,286 9,828
平成23年 1~3月 (Q1) 66,851 100 - - 67,131 1,298 9,8284~6 (Q2) 58,690 107 - - 58,183 785 10,4497~9 (Q3) 69,044 32 - - 69,158 892 11,217
10~12 (Q4) 71,025 67 - - 71,587 792 11,040
平成23年 1月 (Jan) 21,351 41 - - 21,332 396 10,0422 (Feb) 23,081 50 - - 22,893 550 10,3303 (Mar) 22,419 9 - - 22,906 352 9,8284 (Apr) 20,749 55 - - 19,793 312 10,5925 (May) 17,253 32 - - 17,255 265 10,3886 (Jun) 20,688 20 - - 21,135 208 10,449
7 (Jul) 22,188 - - - 22,115 300 10,7868 (Aug) 21,681 7 - - 21,754 261 11,1469 (Sep) 25,175 25 - - 25,289 331 11,217
10 (Oct) 24,380 12 - - 25,140 225 10,61811 (Nov) 24,312 11 - - 24,052 241 10,89712 (Dec) 22,333 44 - - 22,395 326 11,040
specializing in cold-draw and metallic-coating, uncounted.
年 月Year and Month
普 通 鋼 Ordinary steel
受 入Receipts
冷けん鋼管 Cold-drawn pipes and tubes
生 産Production
消 費Consumption
出 荷 Shipments 在 庫Inventory
2. Figures in brackets in "Inventory" of both "Ordinary" and "Special" steel (excluding cold-drawn pipes) : inventory of materials of manufacturers
販 売 Sales
Notes: 1.Figures in brackets in "Sales" in the following categories are consumption for cold-draw and metallic-coating,
uncounted : hot-steel pipes and tubes and cold-drawn pipes and tubes of ordinary steel, and hot-steel pipes and tubes of special steel.
84

時系列表 (鉄鋼編) 製品
1. 製品 Products (11) 鋼管 Steel pipes and tubes
① 総表 Summary table (単位:t、Unit: t)
販 売 Sales その他Others平成19年 (2007) 665,026 197,695 - 605,446 251,806 53,588
20 (2008) 633,545 183,817 - 588,058 233,325 51,90221 (2009) 479,474 104,358 - 444,595 145,707 44,18622 (2010) 563,344 132,600 - 517,549 177,371 44,80623 (2011) 579,500 140,335 - 531,579 176,812 47,933
平成21年度 (09FY) 508,010 110,765 - 468,061 154,034 39,18722 (10FY) 562,120 129,489 - 513,201 172,668 40,693
平成23年 1~3月 (Q1) 138,917 32,367 - 130,906 43,239 40,6934~6 (Q2) 160,973 43,163 - 139,981 52,905 49,2527~9 (Q3) 139,125 36,269 - 127,818 42,924 51,639
10~12 (Q4) 140,485 28,536 - 132,874 37,744 47,933
平成23年 1月 (Jan) 44,057 10,757 - 39,334 14,593 45,1102 (Feb) 50,481 10,967 - 45,102 15,538 45,4603 (Mar) 44,379 10,643 - 46,470 13,108 40,6934 (Apr) 54,053 13,011 - 47,734 16,480 43,5005 (May) 54,011 15,261 - 45,286 17,638 47,9096 (Jun) 52,909 14,891 - 46,961 18,787 49,252
7 (Jul) 46,360 12,357 - 40,090 14,864 51,2928 (Aug) 45,194 12,852 - 40,949 14,338 52,9359 (Sep) 47,571 11,060 - 46,779 13,722 51,639
10 (Oct) 49,062 10,043 - 47,399 13,054 49,52211 (Nov) 46,366 8,804 - 43,876 12,043 48,40912 (Dec) 45,057 9,689 - 41,599 12,647 47,933
年 月Year and Month
受 入Receipts
普 通 鋼 Ordinary steel
めっき鋼管 Metallic-coated pipes and tubes
生 産Production
消 費Consumption
出 荷 Shipments 在 庫Inventory
(単位:t、Unit: t)
85
その他Others
平成19年 (2007) 3,010,264 79,088 272,472 (264,976) 2,772,783 29,303 (3,115) 253,49020 (2008) 3,152,890 77,006 286,196 (279,610) 2,931,157 34,087 (3,380) 229,47421 (2009) 1,850,710 37,904 149,836 (145,486) 1,732,852 17,930 (2,979) 214,91722 (2010) 2,558,926 48,583 221,753 (215,766) 2,337,623 62,337 (2,429) 194,81923 (2011) 2,530,773 48,825 236,920 (231,207) 2,280,564 22,311 (2,862) 222,846
平成21年度 (09FY) 1,969,522 38,696 164,215 (158,727) 1,748,463 51,094 (2,549) 189,35622 (10FY) 2,541,790 48,714 224,134 (218,162) 2,380,711 27,812 (2,352) 139,660
平成23年 1~3月 (Q1) 650,139 11,849 55,005 (53,424) 654,231 5,431 (2,352) 139,6604~6 (Q2) 485,106 10,068 54,897 (53,530) 425,584 3,751 (2,746) 148,0567~9 (Q3) 624,102 13,425 60,048 (58,802) 538,214 5,522 (2,862) 177,716
10~12 (Q4) 771,426 13,483 66,970 (65,451) 662,535 7,607 (2,862) 222,846
平成23年 1月 (Jan) 207,494 3,945 18,237 (17,706) 197,349 1,213 (2,386) 188,5902 (Feb) 230,170 4,087 17,182 (16,664) 211,653 2,130 (2,364) 190,1683 (Mar) 212,475 3,817 19,586 (19,054) 245,229 2,088 (2,352) 139,6604 (Apr) 149,362 3,329 18,079 (17,633) 122,372 1,275 (2,589) 149,9005 (May) 164,445 2,588 18,894 (18,437) 133,844 1,099 (2,696) 162,1716 (Jun) 171,299 4,151 17,924 (17,460) 169,368 1,377 (2,746) 148,056
7 (Jul) 199,301 4,922 19,873 (19,456) 150,188 1,848 (2,885) 178,6468 (Aug) 208,802 3,983 18,678 (18,314) 174,775 1,704 (2,865) 195,0039 (Sep) 215,999 4,520 21,497 (21,032) 213,251 1,970 (2,862) 177,716
10 (Oct) 257,776 4,233 22,492 (21,986) 169,542 1,903 (2,841) 244,68711 (Nov) 234,930 4,470 21,135 (20,650) 228,414 2,454 (2,744) 231,38812 (Dec) 278,720 4,780 23,343 (22,815) 264,579 3,250 (2,862) 222,846
注:1.「販売」の( )は、冷けん用及びめっき用に消費された数量で外数。
2.「在庫」の( )は、冷けん及びめっき専業者の素材在庫で外数。
Notes: 1.Figures in brackets in "Sales" : consumption for cold-draw and metallic-coating, uncounted.
2. Figures in brackets in "Inventory" : inventory of materials of manufacturers specializing in cold-draw and metallic-coating, uncounted.
年 月Year and Month
特 殊 鋼 Special steel
計 Total
生 産Production
受 入Receipts
消 費Consumption
出 荷 Shipments 在 庫Inventory販 売 Sales
85

時系列表 (鉄鋼編) 製品
1. 製品 Products (11) 鋼管 Steel pipes and tubes
① 総表 Summary table
その他Others平成19年 (2007) 2,825,454 79,048 265,775 (264,976) 2,597,662 25,885 (3,115) 244,819
20 (2008) 2,952,923 76,958 280,059 (279,610) 2,748,562 30,899 (3,380) 216,15021 (2009) 1,737,245 37,850 145,833 (145,486) 1,624,613 14,433 (2,979) 206,02022 (2010) 2,399,846 48,562 216,105 (215,766) 2,190,522 59,898 (2,429) 186,08323 (2011) 2,359,666 48,795 231,606 (231,207) 2,123,618 19,553 (2,862) 212,155
平成21年度 (09FY) 1,847,269 38,652 159,077 (158,727) 1,634,729 48,250 (2,549) 181,70722 (10FY) 2,378,898 48,694 218,500 (218,162) 2,230,484 25,105 (2,352) 131,747
平成23年 1~3月 (Q1) 608,815 11,843 53,528 (53,424) 615,210 4,793 (2,352) 131,7474~6 (Q2) 444,558 10,062 53,632 (53,530) 388,720 3,294 (2,746) 139,1847~9 (Q3) 583,129 13,416 58,896 (58,802) 499,238 5,055 (2,862) 169,394
10~12 (Q4) 723,164 13,474 65,550 (65,451) 620,450 6,411 (2,862) 212,155
平成23年 1月 (Jan) 194,573 3,944 17,742 (17,706) 185,261 1,033 (2,386) 180,0762 (Feb) 217,061 4,085 16,699 (16,664) 199,238 1,808 (2,364) 182,0583 (Mar) 197,181 3,814 19,087 (19,054) 230,711 1,952 (2,352) 131,7474 (Apr) 136,045 3,326 17,666 (17,633) 109,520 1,053 (2,589) 142,5105 (May) 150,587 2,587 18,469 (18,437) 121,733 999 (2,696) 153,7976 (Jun) 157,926 4,149 17,497 (17,460) 157,467 1,242 (2,746) 139,184
7 (Jul) 186,208 4,920 19,484 (19,456) 137,408 1,614 (2,885) 170,4448 (Aug) 195,938 3,983 18,346 (18,314) 162,846 1,703 (2,865) 186,4549 (Sep) 200,983 4,513 21,066 (21,032) 198,984 1,738 (2,862) 169,394
10 (Oct) 241,244 4,227 22,020 (21,986) 155,046 1,564 (2,841) 235,55511 (Nov) 219,629 4,468 20,685 (20,650) 214,704 2,068 (2,744) 221,86512 (Dec) 262,291 4,779 22,845 (22,815) 250,700 2,779 (2,862) 212,155
注:1.「販売」の( )は、冷けん用及びめっき用に消費された数量で外数。
2.「在庫」の( )は、冷けん及びめっき専業者の素材在庫で外数。
Notes: 1.Figures in brackets in "Sales" : consumption for cold-draw and metallic-coating, uncounted.
2. Figures in brackets in "Inventory" : inventory of materials of manufacturers specializing in cold-draw and metallic-coating, uncounted.
(単位:t、Unit: t)
(単位:t、Unit: t)
年 月Year and Month
特 殊 鋼 Special steel
熱間鋼管 Hot-steel pipes and tubes
消 費Consumption
在 庫Inventory
受 入Receipts 販 売 Sales
出 荷 Shipments生 産Production
86
販売 Sales その他Others
平成19年 (2007) 184,810 40 6,697 175,121 3,418 8,67120 (2008) 199,967 48 6,137 182,595 3,188 13,32421 (2009) 113,465 54 4,003 108,239 3,497 8,89722 (2010) 159,080 21 5,648 147,101 2,439 8,73623 (2011) 171,107 30 5,314 156,946 2,758 10,691
平成21年度 (09FY) 122,253 44 5,138 113,734 2,844 7,64922 (10FY) 162,892 20 5,634 150,227 2,707 7,913
平成23年 1~3月 (Q1) 41,324 6 1,477 39,021 638 7,9134~6 (Q2) 40,548 6 1,265 36,864 457 8,8727~9 (Q3) 40,973 9 1,152 38,976 467 8,322
10~12 (Q4) 48,262 9 1,420 42,085 1,196 10,691
平成23年 1月 (Jan) 12,921 1 495 12,088 180 8,5142 (Feb) 13,109 2 483 12,415 322 8,1103 (Mar) 15,294 3 499 14,518 136 7,9134 (Apr) 13,317 3 413 12,852 222 7,3905 (May) 13,858 1 425 12,111 100 8,3746 (Jun) 13,373 2 427 11,901 135 8,872
7 (Jul) 13,093 2 389 12,780 234 8,2028 (Aug) 12,864 - 332 11,929 1 8,5499 (Sep) 15,016 7 431 14,267 232 8,322
10 (Oct) 16,532 6 472 14,496 339 9,13211 (Nov) 15,301 2 450 13,710 386 9,52312 (Dec) 16,429 1 498 13,879 471 10,691
冷けん鋼管 Cold-drawn pipes and tubes
生 産Production
受 入Receipts
消 費Consumption
出 荷 Shipments
年 月Year and Month
特 殊 鋼 Special steel
在 庫Inventory
86

時系列表 (鉄鋼編) 製品
1. 製品 Products (11) 鋼管 Steel pipes and tubes
② 製法別生産内訳 Production by method
Seamless 内ユージン・セジュルネ法
pipes and Ugine-Sejournet
tubes process
平成19年 (2007) 5,861,226 707,264 221,031 3,740,718 1,192,213 2,825,454 1,361,306 88,517 427,338 1,036,81020 (2008) 5,589,267 706,868 212,523 3,541,420 1,128,456 2,952,923 1,399,109 90,013 523,649 1,030,16521 (2009) 3,654,832 484,736 135,140 2,283,332 751,624 1,737,245 857,253 57,715 243,455 636,53722 (2010) 4,297,279 558,097 160,450 2,800,409 778,323 2,399,846 1,156,829 70,883 365,753 877,26423 (2011) 4,428,269 616,608 165,399 2,881,780 764,482 2,359,666 1,225,689 75,902 394,091 739,886
平成21年度 (09FY) 3,751,441 468,186 136,076 2,444,560 702,619 1,847,269 849,286 57,812 293,531 704,45222 (10FY) 4,418,437 575,904 161,840 2,877,864 802,829 2,378,898 1,201,488 74,876 375,832 801,578
平成23年 1~3月 (Q1) 1,167,623 159,163 40,474 759,748 208,238 608,815 308,236 20,112 123,128 177,4514~6 (Q2) 1,123,610 160,153 49,456 691,445 222,556 444,558 281,467 18,800 78,423 84,6687~9 (Q3) 1,061,639 150,583 41,551 712,201 157,304 583,129 304,932 17,035 96,439 181,758
10~12 (Q4) 1,075,397 146,709 33,918 718,386 176,384 723,164 331,054 19,955 96,101 296,009
平成23年 1月 (Jan) 371,268 53,482 13,120 239,787 64,879 194,573 100,690 6,611 30,412 63,4712 (Feb) 380,486 49,335 11,770 252,921 66,460 217,061 100,875 6,510 48,652 67,5343 (Mar) 415,869 56,346 15,584 267,040 76,899 197,181 106,671 6,991 44,064 46,4464 (Apr) 385,848 56,713 15,350 238,797 74,988 136,045 93,578 5,941 25,832 16,6355 (May) 371,240 54,781 17,795 220,901 77,763 150,587 98,124 6,236 24,562 27,9016 (Jun) 366,522 48,659 16,311 231,747 69,805 157,926 89,765 6,623 28,029 40,132
7 (Jul) 343,525 50,855 13,918 225,588 53,164 186,208 105,507 5,321 30,563 50,1388 (Aug) 347,644 45,649 15,626 233,535 52,834 195,938 99,078 5,342 28,930 67,9309 (Sep) 370,470 54,079 12,007 253,078 51,306 200,983 100,347 6,372 36,946 63,690
10 (Oct) 367,316 50,326 12,068 248,959 55,963 241,244 105,422 6,846 34,855 100,96711 (Nov) 360,148 46,446 8,994 240,885 63,823 219,629 109,689 6,605 29,671 80,26912 (Dec) 347,933 49,937 12,856 228,542 56,598 262,291 115,943 6,504 31,575 114,773
③ 鋼種別生産内訳 Production by kind of steel
電弧溶接鋼管Arc-weldedpipes and
tubes
普通鋼熱間鋼管Ordinary hot-steel pipes and tubes
特殊鋼熱間鋼管 Special hot-steel pipes and tubes
継目無鋼管
(単位:t、Unit: t)
電弧溶接鋼管Arc-weldedpipes and
tubes
計Total
年 月Year and Month 電縫鋼管
Electric-weldedpipes and tubes
計Total
継目無鋼管Seamlesspipes and
tubes
鍛接鋼管Butt weldedpipes and
tubes
電縫鋼管Electric-welded
pipes and tubes
(単位:t、Unit: t)
87
平成19年 (2007) 2,825,454 107 47,407 817,664 116,103 475,071 - 1,365,970 3,13220 (2008) 2,952,923 76 46,326 844,710 126,010 417,108 - 1,518,118 57521 (2009) 1,737,245 15 10,441 528,699 61,155 298,297 - 838,047 59122 (2010) 2,399,846 7 32,391 647,365 104,985 354,737 - 1,259,225 1,13623 (2011) 2,359,666 5 37,921 656,071 112,276 398,940 - 1,152,707 1,746
平成21年度 (09FY) 1,847,269 13 13,175 498,779 72,686 296,296 - 965,656 66422 (10FY) 2,378,898 7 35,843 660,601 103,776 378,778 - 1,198,696 1,197
平成23年 1~3月 (Q1) 608,815 - 9,100 164,931 23,437 101,453 - 309,626 2684~6 (Q2) 444,558 - 11,173 146,240 27,248 91,562 - 167,837 4987~9 (Q3) 583,129 - 8,664 166,940 28,853 101,402 - 276,613 657
10~12 (Q4) 723,164 5 8,984 177,960 32,738 104,523 - 398,631 323
平成23年 1月 (Jan) 194,573 - 2,855 52,738 7,574 31,553 - 99,775 782 (Feb) 217,061 - 2,553 54,072 7,063 36,963 - 116,322 883 (Mar) 197,181 - 3,692 58,121 8,800 32,937 - 93,529 1024 (Apr) 136,045 - 3,448 48,455 8,517 31,816 - 43,683 1265 (May) 150,587 - 3,822 51,004 9,803 28,377 - 57,456 1256 (Jun) 157,926 - 3,903 46,781 8,928 31,369 - 66,698 247
7 (Jul) 186,208 - 3,156 58,383 9,821 34,960 - 79,593 2958 (Aug) 195,938 - 2,864 53,170 8,746 32,341 - 98,645 1729 (Sep) 200,983 - 2,644 55,387 10,286 34,101 - 98,375 190
10 (Oct) 241,244 - 3,422 55,135 11,643 35,191 - 135,732 12111 (Nov) 219,629 - 2,861 62,619 10,613 33,259 - 110,175 10212 (Dec) 262,291 5 2,701 60,206 10,482 36,073 - 152,724 100
注:その他の特殊用途鋼には耐熱鋼、高マンガン鋼が含まれる。なお、平成20年よりステンレス鋼の定義変更に伴い耐熱鋼の一部がステンレス鋼に移動したため、平成19年以前は不連続となっている。
Note: Other Steel for Special Purposes includes heat-resisting and high-manganese steel. In addition, because classifications for steel categories changed in 2007,
年 月Year and Month
特殊鋼熱間鋼管 Special hot-steel pipes and tubes
構造用合金鋼Alloy steel
for structure
軸受鋼Bearingsteel
ステンレス鋼
Stainlesssteel
快削鋼Free-
cuttingsteel
高抗張力鋼High-tensile-strength steel
その他の特殊
用途鋼
Other steel forspecial purposes
計Total
合金工具鋼Alloy tool
steel
機械構造用炭素鋼
Carbon steelfor machinestructure
and some categories of heat-resisting steel have been moved to the Stainless Steel category this category has been discontinued since 2006.
87

時系列表 (鉄鋼編) 製品
1. 製品 Products (12) 特殊鋼冷間仕上鋼材及び鋳鉄管
Special cold-finished steel, and cast iron pipes and tubes (単位:t、Unit: t)
平成19年 (2007) 3,113,868 70,487 49,021 3,035,951 91,048 160,06020 (2008) 2,997,530 132,545 58,432 2,953,229 126,371 151,09221 (2009) 2,019,325 63,299 38,632 1,997,505 71,549 126,37622 (2010) 3,041,817 188,581 62,433 2,918,567 196,702 174,80023 (2011) 2,861,971 159,630 77,261 2,771,145 169,562 162,423
平成21年度 (09FY) 2,414,385 105,080 49,125 2,330,055 113,501 126,86922 (10FY) 3,076,984 182,165 65,748 2,969,838 189,399 152,944
平成23年 1~3月 (Q1) 755,471 42,847 19,081 753,098 44,221 152,9444~6 (Q2) 653,657 34,228 20,046 613,310 37,006 165,0547~9 (Q3) 744,266 36,761 18,323 705,492 40,496 176,010
10~12 (Q4) 708,577 45,794 19,811 699,245 47,839 162,423
平成23年 1月 (Jan) 261,672 15,287 7,302 253,564 15,967 172,7782 (Feb) 249,248 13,207 5,316 239,803 13,179 175,5933 (Mar) 244,551 14,353 6,463 259,731 15,075 152,9444 (Apr) 213,215 10,728 8,540 199,049 11,285 156,5125 (May) 213,263 11,575 4,648 197,161 11,691 166,8476 (Jun) 227,179 11,925 6,858 217,100 14,030 165,054
7 (Jul) 237,876 9,922 7,527 225,606 11,118 165,2268 (Aug) 253,137 13,593 5,472 230,412 14,801 177,7379 (Sep) 253,253 13,246 5,324 249,474 14,577 176,010
10 (Oct) 244,404 16,604 7,871 242,780 17,407 168,07311 (Nov) 233,721 15,520 6,825 227,111 15,838 167,52112 (Dec) 230,452 13,670 5,115 229,354 14,594 162,423
(単位:t、Unit: t)
販 売Sales
その他Others
消 費Consumption
在 庫Inventory
出 荷 Shipments年 月
Year and Month
合 計 (1)~(3)Total (1)~(3)
生 産Production
受 入Receipts
88
平成19年 (2007) 339,164 - 290 333,007 3,356 18,00720 (2008) 321,584 22 234 316,895 1,757 19,14421 (2009) 198,531 15 190 202,477 530 14,15622 (2010) 307,906 - 319 305,504 492 15,63723 (2011) 294,245 - 262 291,838 243 16,802
平成21年度 (09FY) 245,604 4 235 245,191 653 12,49422 (10FY) 310,091 - 319 306,779 325 16,361
平成23年 1~3月 (Q1) 79,149 - 83 78,049 102 16,3614~6 (Q2) 71,130 - 59 68,628 62 18,2867~9 (Q3) 73,708 - 65 75,860 43 16,978
10~12 (Q4) 70,258 - 55 69,301 36 16,802
平成23年 1月 (Jan) 25,386 - 31 25,927 28 14,9942 (Feb) 25,949 - 24 24,926 38 15,8463 (Mar) 27,814 - 28 27,196 36 16,3614 (Apr) 23,178 - 18 21,137 21 18,3385 (May) 22,496 - 15 22,463 24 18,1156 (Jun) 25,456 - 26 25,028 17 18,286
7 (Jul) 24,516 - 23 25,163 16 17,5978 (Aug) 24,302 - 17 24,695 12 17,1389 (Sep) 24,890 - 25 26,002 15 16,978
10 (Oct) 26,420 - 26 25,314 16 16,98911 (Nov) 22,115 - 11 23,269 9 15,82512 (Dec) 21,723 - 18 20,718 11 16,802
販 売Sales
その他Others
生 産Production
受 入Receipts
消 費Consumption
出 荷 Shipments在 庫
Inventory
磨帯鋼(1)Cold-rolled narrow strips
年 月Year and Month
88

時系列表 (鉄鋼編) 製品
1. 製品 Products (12) 特殊鋼冷間仕上鋼材及び鋳鉄管
Special cold-finished steel, and cast iron pipes and tubes (単位:t、Unit: t)
平成19年 (2007) 2,615,818 70,487 48,731 - 2,545,322 87,515 132,60820 (2008) 2,528,876 132,523 58,198 - 2,489,434 124,128 121,91521 (2009) 1,751,900 63,231 38,442 - 1,719,994 70,893 106,40422 (2010) 2,628,132 188,581 62,114 - 2,506,996 196,127 152,83423 (2011) 2,465,147 159,588 76,999 - 2,377,609 169,126 139,345
平成21年度 (09FY) 2,087,595 105,071 48,890 - 2,000,133 112,789 108,83722 (10FY) 2,661,486 182,165 65,429 - 2,557,439 188,967 130,876
平成23年 1~3月 (Q1) 649,549 42,847 18,998 - 647,548 44,089 130,8764~6 (Q2) 557,010 34,188 19,987 - 520,198 36,871 140,2767~9 (Q3) 645,230 36,761 18,258 - 604,780 40,387 152,785
10~12 (Q4) 613,358 45,792 19,756 - 605,083 47,779 139,345
平成23年 1月 (Jan) 227,405 15,287 7,271 - 219,162 15,928 150,9852 (Feb) 214,968 13,207 5,292 - 206,324 13,140 153,2713 (Mar) 207,176 14,353 6,435 - 222,062 15,021 130,8764 (Apr) 182,040 10,728 8,522 - 169,821 11,264 132,6275 (May) 182,270 11,535 4,633 - 166,288 11,662 142,9736 (Jun) 192,700 11,925 6,832 - 184,089 13,945 140,276
7 (Jul) 205,578 9,922 7,504 - 192,820 11,091 141,3378 (Aug) 220,120 13,593 5,455 - 197,586 14,771 154,0749 (Sep) 219,532 13,246 5,299 - 214,374 14,525 152,785
10 (Oct) 209,605 16,602 7,845 - 208,840 17,374 144,98711 (Nov) 203,975 15,520 6,814 - 195,929 15,825 145,93612 (Dec) 199,778 13,670 5,097 - 200,314 14,580 139,345
注:( )は、鋼材次工程用消費で外数。
Note: Figures in brackets in "Sales" : consumption for processed goods, uncounted.
(単位:t、Unit: t)
販 売Sales
その他Others
在 庫Inventory
生 産Production
受 入Receipts
消 費Consumption
出 荷 Shipments年 月
Year and Month
冷延広幅帯鋼(2)Cold-rolled wide strips
89
平成19年 (2007) 158,886 37,913 - - 157,622 177 9,44520 (2008) 147,070 34,286 - - 146,900 486 10,03321 (2009) 68,894 22,142 53 - 75,034 126 5,81622 (2010) 105,779 25,822 - - 106,067 83 6,32923 (2011) 102,579 29,159 42 - 101,698 193 6,276
平成21年度 (09FY) 81,186 22,124 5 - 84,731 59 5,53822 (10FY) 105,407 27,061 - - 105,620 107 5,707
平成23年 1~3月 (Q1) 26,773 6,820 - - 27,501 30 5,7074~6 (Q2) 25,517 8,030 40 - 24,484 73 6,4927~9 (Q3) 25,328 7,850 - - 24,852 66 6,247
10~12 (Q4) 24,961 6,459 2 - 24,861 24 6,276
平成23年 1月 (Jan) 8,881 2,135 - - 8,475 11 6,7992 (Feb) 8,331 2,109 - - 8,553 1 6,4763 (Mar) 9,561 2,576 - - 10,473 18 5,7074 (Apr) 7,997 2,485 - - 8,091 - 5,5475 (May) 8,497 2,304 40 - 8,410 5 5,7596 (Jun) 9,023 3,241 - - 7,983 68 6,492
7 (Jul) 7,782 2,691 - - 7,623 11 6,2928 (Aug) 8,715 2,589 - - 8,131 18 6,5259 (Sep) 8,831 2,570 - - 9,098 37 6,247
10 (Oct) 8,379 2,206 2 - 8,626 17 6,09711 (Nov) 7,631 2,121 - - 7,913 4 5,76012 (Dec) 8,951 2,132 - - 8,322 3 6,276
その他Others
内ステンレス鋼板Stainless steel
販 売Sales
出 荷 Shipments在 庫
Inventory
年 月Year and Month
冷延鋼板(3)Cold-rolled sheets and strips
生 産 Production受 入
Receipts消 費
Consumption
89

時系列表 (鉄鋼編) 製品
1. 製品 Products (12) 特殊鋼冷間仕上鋼材及び鋳鉄管
Special cold-finished steel, and cast iron pipes and tubes (単位:t、Unit: t)
平成19年 (2007) 891,656 15,390 875,591 16,996 41,006 98,354 75,762 22,577 - 1,08720 (2008) 863,289 13,984 844,829 19,400 43,653 102,199 80,134 22,092 - 1,02821 (2009) 476,200 8,199 474,428 11,292 35,293 93,375 77,411 16,129 - 85222 (2010) 749,985 12,267 729,726 18,745 38,904 75,581 59,385 16,188 - 85523 (2011) 728,146 14,277 710,341 16,137 43,717 70,501 55,653 14,880 - 828
平成21年度 (09FY) 567,728 9,297 559,094 13,579 36,486 89,097 72,981 15,951 - 87922 (10FY) 752,325 13,031 734,504 18,322 37,866 72,859 56,923 15,882 - 934
平成23年 1~3月 (Q1) 181,970 3,451 179,509 3,913 37,866 16,990 13,155 3,754 - 9344~6 (Q2) 166,800 3,185 163,597 3,404 39,352 19,079 15,247 4,040 - 7287~9 (Q3) 188,263 3,859 183,237 4,395 40,707 17,438 13,936 3,569 - 665
10~12 (Q4) 191,113 3,782 183,998 4,425 43,717 16,994 13,315 3,517 - 828
平成23年 1月 (Jan) 57,328 1,129 56,008 1,380 38,828 5,184 3,903 1,278 - 8542 (Feb) 62,723 1,208 62,498 869 38,225 5,734 4,477 1,303 - 8083 (Mar) 61,919 1,114 61,003 1,664 37,866 6,072 4,775 1,173 - 9344 (Apr) 55,353 1,132 54,135 1,025 38,668 6,624 5,154 1,538 - 8645 (May) 48,848 840 49,173 710 38,312 5,959 4,799 1,225 - 8036 (Jun) 62,599 1,213 60,289 1,669 39,352 6,496 5,294 1,277 - 728
7 (Jul) 63,352 1,200 61,579 1,589 39,629 6,006 4,785 1,254 - 6968 (Aug) 58,100 1,206 57,353 977 39,861 5,455 4,257 1,171 - 7209 (Sep) 66,811 1,453 64,305 1,829 40,707 5,977 4,894 1,144 - 665
10 (Oct) 65,783 1,315 63,328 2,189 41,473 5,362 4,187 1,122 - 71611 (Nov) 65,520 1,241 62,336 983 44,247 5,773 4,443 1,196 - 85612 (Dec) 59,810 1,226 58,334 1,253 43,717 5,859 4,685 1,199 - 828
(単位:t、Unit: t)
消 費Consumption
販 売Sales
その他Others
在 庫Inventory
販 売Sales
その他Others
生 産Production
消 費Consumption
出荷 Shipments在 庫
Inventory生 産
Production
PC鋼線PC wires
出荷 Shipments年 月
Year and Month
磨棒鋼Cold-finished bars
90
平成19年 (2007) 42,918 - 42,793 - 2,568 100,106 2,649 96,645 565 5,91520 (2008) 44,172 - 43,134 - 3,571 84,817 2,245 82,358 536 5,59521 (2009) 27,889 - 28,895 - 2,451 55,979 1,705 54,788 291 4,39922 (2010) 44,927 - 44,736 - 2,675 76,843 1,743 74,586 543 4,41223 (2011) 40,195 - 39,949 - 2,868 83,614 1,387 80,534 481 6,242
平成21年度 (09FY) 35,326 - 35,461 - 2,438 65,576 1,774 63,422 349 4,34822 (10FY) 45,405 - 45,089 - 2,767 78,795 1,650 76,151 599 5,429
平成23年 1~3月 (Q1) 10,997 - 10,871 - 2,767 21,466 384 20,638 170 5,4294~6 (Q2) 9,062 - 9,224 - 2,645 21,086 282 20,404 87 5,7277~9 (Q3) 9,845 - 9,873 - 2,519 19,837 331 18,990 86 6,124
10~12 (Q4) 10,291 - 9,981 - 2,868 21,225 390 20,502 138 6,242
平成23年 1月 (Jan) 3,413 - 3,471 - 2,596 6,727 120 6,628 61 5,1302 (Feb) 3,649 - 3,604 - 2,629 7,291 121 6,928 57 5,2723 (Mar) 3,935 - 3,796 - 2,767 7,448 143 7,082 52 5,4294 (Apr) 3,565 - 3,441 - 2,958 7,758 111 7,242 31 5,7365 (May) 2,719 - 2,834 - 2,814 6,460 76 6,625 33 5,5536 (Jun) 2,778 - 2,949 - 2,645 6,868 95 6,537 23 5,727
7 (Jul) 3,315 - 3,362 - 2,565 6,475 120 6,107 24 5,9458 (Aug) 3,083 - 3,080 - 2,572 6,242 94 6,247 29 5,7929 (Sep) 3,447 - 3,431 - 2,519 7,120 117 6,636 33 6,124
10 (Oct) 3,565 - 3,381 - 2,713 7,188 130 6,692 34 6,39111 (Nov) 3,416 - 3,352 - 2,784 7,231 150 7,220 38 6,25412 (Dec) 3,310 - 3,248 - 2,868 6,806 110 6,590 66 6,242
消 費Consumption
在 庫Inventory販 売
Salesその他Others
生 産Production
消 費Consumption
出荷 Shipments在 庫
Inventory販 売Sales
その他Others
生 産Production
年 月Year and Month
ピアノ線Piano wires
ステンレス鋼線Stainless steel wires
出荷 Shipments
90

時系列表 (鉄鋼編) 製品
1. 製品 Products (12) 特殊鋼冷間仕上鋼材及び鋳鉄管
Special cold-finished steel, and cast iron pipes and tubes (単位:t、Unit: t)
平成19年 (2007) 845,664 32,082 817,113 17,796 12,172 505,472 34,492 450,021 34,021 10,12120 (2008) 809,607 33,590 781,315 20,330 9,662 500,961 36,278 444,007 36,377 9,58021 (2009) 539,814 20,619 524,037 13,759 9,875 311,962 27,556 276,353 22,068 8,19522 (2010) 753,017 30,158 720,956 23,809 10,463 452,156 36,346 396,061 35,148 9,55023 (2011) 721,116 29,169 689,785 23,536 12,057 441,474 38,504 384,071 33,298 9,445
平成21年度 (09FY) 651,220 25,213 629,018 17,359 10,572 368,592 31,007 325,368 26,514 8,69922 (10FY) 746,950 30,487 713,588 24,691 11,579 451,601 36,238 395,419 35,601 9,476
平成23年 1~3月 (Q1) 182,428 7,714 173,963 6,301 11,579 107,641 8,858 94,262 8,307 9,4764~6 (Q2) 141,432 5,632 135,729 4,469 10,505 91,949 9,166 79,378 6,739 8,5737~9 (Q3) 192,529 7,650 183,682 6,839 11,028 117,483 10,523 102,295 9,203 8,197
10~12 (Q4) 204,727 8,173 196,411 5,927 12,057 124,401 9,957 108,136 9,049 9,445
平成23年 1月 (Jan) 57,892 2,404 55,007 2,037 11,058 33,834 2,749 29,729 2,610 9,4662 (Feb) 64,386 2,715 61,459 2,257 11,360 37,475 2,698 33,454 2,906 9,2503 (Mar) 60,150 2,595 57,497 2,007 11,579 36,332 3,411 31,079 2,791 9,4764 (Apr) 46,584 1,931 44,442 1,491 11,206 30,241 2,746 26,408 2,242 9,0035 (May) 38,859 1,416 37,728 1,116 10,761 25,957 2,988 22,015 1,831 8,8386 (Jun) 55,989 2,285 53,559 1,862 10,505 35,751 3,432 30,955 2,666 8,573
7 (Jul) 62,258 2,479 59,812 2,082 10,494 40,342 3,656 34,732 3,099 8,8658 (Aug) 59,085 2,312 56,176 2,207 10,613 35,529 3,329 31,270 2,778 8,1329 (Sep) 71,186 2,859 67,694 2,550 11,028 41,612 3,538 36,293 3,326 8,197
10 (Oct) 71,771 2,909 68,540 2,730 11,020 43,058 3,333 36,900 3,614 8,76811 (Nov) 68,701 2,713 65,355 2,530 11,474 41,498 3,382 35,204 3,708 9,38812 (Dec) 64,255 2,551 62,516 667 12,057 39,845 3,242 36,032 1,727 9,445
(単位:t、Unit: t)
出荷 Shipments在 庫
Inventory生 産
Production消 費
Consumption
出荷 Shipments在 庫
Inventory販 売Sales
その他Others
販 売Sales
その他Others
生 産Production
消 費Consumption
年 月Year and Month
冷間圧造用炭素鋼線Carbon steel wires for cold heading and cold forging
その他の特殊鋼線Other special steel wires
91
平成19年 (2007) 416,319 402,239 21,378 81,79820 (2008) 434,131 421,767 6,154 91,93121 (2009) 404,118 405,056 3,022 88,22222 (2010) 316,132 333,373 2,460 60,67823 (2011) 299,916 306,009 3,079 54,171
平成21年度 (09FY) 368,665 386,503 2,496 63,62722 (10FY) 314,911 325,766 2,575 53,561
平成23年 1~3月 (Q1) 66,059 73,372 654 53,5614~6 (Q2) 78,022 55,810 868 75,2167~9 (Q3) 70,277 86,343 760 59,141
10~12 (Q4) 85,558 90,484 797 54,171
平成23年 1月 (Jan) 22,145 27,943 176 55,3662 (Feb) 21,145 25,404 217 51,3823 (Mar) 22,769 20,025 261 53,5614 (Apr) 24,600 14,597 253 63,6125 (May) 22,696 18,350 312 67,4026 (Jun) 30,726 22,863 303 75,216
7 (Jul) 23,444 24,847 308 73,7418 (Aug) 19,668 31,888 209 61,5509 (Sep) 27,165 29,608 243 59,141
10 (Oct) 27,821 30,566 267 56,38811 (Nov) 29,004 32,601 272 52,73012 (Dec) 28,733 27,317 258 54,171
生 産Production
出荷 Shipments
販 売Sales
その他Others
年 月Year and Month
鋳鉄管Cast iron pipes and tubes
在 庫Inventory
91

時系列表 (鉄鋼編) 製品
1. 製品 Products (13) 鉄鋼加工製品 Secondary steel products
(単位:t、Unit: t)
内鋼より線 内鋼より線 内鋼より線 内鋼より線Strand wires Strand wires Strand wires Strand wires
平成19年 (2007) 463,600 365,831 466,963 370,285 5,585 668 30,758 16,54520 (2008) 466,058 362,548 461,380 361,079 7,288 619 34,180 18,14021 (2009) 336,217 253,263 230,020 149,458 112,279 107,523 30,323 15,25722 (2010) 407,731 321,605 270,001 188,820 140,797 135,348 28,952 13,47623 (2011) 381,750 295,892 243,414 162,691 137,987 132,855 30,879 14,257
平成21年度 (09FY) 355,996 274,643 242,505 163,162 120,186 115,036 29,547 14,92022 (10FY) 404,127 317,871 265,304 183,970 143,172 138,121 26,769 11,428
平成23年 1~3月 (Q1) 91,979 70,886 60,382 40,180 34,217 32,921 26,769 11,4284~6 (Q2) 98,615 76,713 60,783 39,692 36,321 34,965 28,716 13,5857~9 (Q3) 96,932 75,126 61,490 41,177 34,254 32,964 30,260 14,644
10~12 (Q4) 94,224 73,167 60,759 41,642 33,195 32,005 30,879 14,257
平成23年 1月 (Jan) 30,311 23,835 20,080 13,833 11,176 10,748 28,122 12,7622 (Feb) 32,660 25,496 21,030 14,399 11,870 11,490 28,028 12,4403 (Mar) 29,008 21,555 19,272 11,948 11,171 10,683 26,769 11,4284 (Apr) 31,582 24,549 20,189 13,233 11,207 10,734 27,126 12,0425 (May) 32,389 25,414 19,439 12,853 12,640 12,236 27,569 12,4046 (Jun) 34,644 26,750 21,155 13,606 12,474 11,995 28,716 13,585
7 (Jul) 34,126 26,733 21,304 14,717 12,140 11,725 29,518 13,8968 (Aug) 28,657 21,910 18,888 12,025 9,856 9,457 29,583 14,3509 (Sep) 34,149 26,483 21,298 14,435 12,258 11,782 30,260 14,644
10 (Oct) 34,093 26,782 20,868 14,456 12,213 11,732 31,448 15,26111 (Nov) 32,113 24,925 20,550 13,735 11,415 11,076 31,754 15,43012 (Dec) 28,018 21,460 19,341 13,451 9,567 9,197 30,879 14,257
(単位:t、Unit: t)
年 月Year and Month
鋼 索Wire ropes
その他 Others生 産 Production
出 荷 Shipments在 庫 Inventory
販 売 Sales
92
平成19年 (2007) 69,141 71,593 - 5,234 322,637 323,874 2,543 14,56020 (2008) 74,946 80,160 - 4,985 315,692 312,422 2,995 16,50121 (2009) 74,961 74,933 - 6,615 264,698 267,150 2,692 12,79822 (2010) 56,268 59,528 - 4,838 259,558 259,422 2,360 13,75523 (2011) 53,584 53,814 24 5,021 252,907 253,228 2,982 11,588
平成21年度 (09FY) 69,217 70,516 - 5,478 266,556 266,797 2,685 12,66922 (10FY) 54,228 55,795 - 5,444 258,997 257,142 2,440 14,698
平成23年 1~3月 (Q1) 12,313 11,950 - 5,444 65,045 63,194 703 14,6984~6 (Q2) 14,576 14,890 - 5,269 56,079 55,526 758 14,8217~9 (Q3) 13,366 13,608 - 5,038 60,764 62,911 637 12,360
10~12 (Q4) 13,329 13,366 24 5,021 71,019 71,597 884 11,588
平成23年 1月 (Jan) 3,528 4,092 - 4,468 20,357 19,931 186 13,2702 (Feb) 4,206 3,712 - 5,025 22,228 21,514 268 13,9723 (Mar) 4,579 4,146 - 5,444 22,460 21,749 249 14,6984 (Apr) 5,074 5,378 - 5,231 19,889 19,962 295 14,4625 (May) 4,435 4,569 - 5,126 16,985 16,390 249 14,9336 (Jun) 5,067 4,943 - 5,269 19,205 19,174 214 14,821
7 (Jul) 4,558 4,924 - 4,923 18,602 19,816 183 13,4628 (Aug) 4,168 4,548 - 4,614 19,894 20,327 204 12,9739 (Sep) 4,640 4,136 - 5,038 22,268 22,768 250 12,360
10 (Oct) 4,191 4,811 24 4,382 23,707 23,729 313 12,36511 (Nov) 4,461 4,357 - 4,490 24,566 24,677 305 12,14012 (Dec) 4,677 4,198 - 5,021 22,746 23,191 266 11,588
年 月Year and Month
PC鋼より線 PC strand wires
金 網 Wire netting
生 産Production
出 荷 Shipments
計 Total
在 庫 Inventory
生 産Production
出 荷 Shipments在 庫
Inventory販 売Sales
その他Others
販 売Sales
その他Others
92

時系列表 (鉄鋼編) 製品
1. 製品 Products (13) 鉄鋼加工製品 Secondary steel products
(単位:t、Unit: t)
平成19年 (2007) 57,876 57,979 574 3,447 26,923 27,420 34 2,28220 (2008) 48,658 49,028 392 3,161 19,339 19,365 19 2,00321 (2009) 43,518 44,658 338 2,187 12,521 12,964 - 1,67522 (2010) 43,459 43,916 333 2,137 12,973 13,086 - 1,46523 (2011) 42,569 42,668 327 2,320 11,755 11,833 - 1,435
平成21年度 (09FY) 44,483 45,146 334 2,250 14,092 14,563 - 1,18222 (10FY) 42,612 43,243 332 2,002 11,385 11,326 - 1,295
平成23年 1~3月 (Q1) 10,932 11,205 82 2,002 3,266 3,466 - 1,2954~6 (Q2) 9,212 8,648 80 2,567 2,396 2,106 - 1,6027~9 (Q3) 10,104 10,097 83 2,637 2,530 2,596 - 1,539
10~12 (Q4) 12,321 12,718 82 2,320 3,563 3,665 - 1,435
平成23年 1月 (Jan) 3,630 3,800 28 2,016 1,029 1,167 - 1,3402 (Feb) 3,634 3,884 27 1,818 1,131 1,298 - 1,1923 (Mar) 3,668 3,521 27 2,002 1,106 1,001 - 1,2954 (Apr) 3,135 2,976 26 2,176 823 666 - 1,4545 (May) 2,838 2,655 27 2,379 745 691 - 1,5166 (Jun) 3,239 3,017 27 2,567 828 749 - 1,602
7 (Jul) 3,319 3,261 27 2,625 783 886 - 1,4998 (Aug) 3,239 3,095 28 2,797 821 835 - 1,4889 (Sep) 3,546 3,741 28 2,637 926 875 - 1,539
10 (Oct) 3,960 4,034 28 2,617 1,093 1,115 - 1,50911 (Nov) 4,274 4,543 27 2,378 1,257 1,355 - 1,41512 (Dec) 4,087 4,141 27 2,320 1,213 1,195 - 1,435
(単位:t、Unit: t)
年 月Year and Month
金 網 Wire netting
生 産Production
出 荷 Shipments在 庫
Inventory
一般金網 General wire netting 蛇かご Wire cylinders
販 売Sales
その他Others
販 売Sales
その他Others
生 産Production
出 荷 Shipments在 庫
Inventory
93
平成19年 (2007) 237,838 238,475 1,935 8,831 77,009 77,168 9 7,35820 (2008) 247,695 244,029 2,584 11,337 62,815 63,588 3 6,56721 (2009) 208,659 209,528 2,354 8,936 41,079 43,507 8 4,09822 (2010) 203,126 202,420 2,027 10,153 49,400 49,702 36 3,62923 (2011) 198,583 198,727 2,655 7,833 49,725 49,457 496 3,266
平成21年度 (09FY) 207,981 207,088 2,351 9,237 43,454 44,992 7 4,23222 (10FY) 205,000 202,573 2,108 11,401 49,480 49,879 300 3,277
平成23年 1~3月 (Q1) 50,847 48,523 621 11,401 12,133 12,069 265 3,2774~6 (Q2) 44,471 44,772 678 10,652 12,306 11,959 51 3,5817~9 (Q3) 48,130 50,218 554 8,184 12,290 12,481 71 3,324
10~12 (Q4) 55,135 55,214 802 7,833 12,996 12,948 109 3,266
平成23年 1月 (Jan) 15,698 14,964 158 9,914 3,954 3,927 217 3,2812 (Feb) 17,463 16,332 241 10,962 4,007 3,944 43 3,3043 (Mar) 17,686 17,227 222 11,401 4,172 4,198 5 3,2774 (Apr) 15,931 16,320 269 10,832 4,146 4,057 22 3,3495 (May) 13,402 13,044 222 11,038 3,984 3,853 - 3,4826 (Jun) 15,138 15,408 187 10,652 4,176 4,049 29 3,581
7 (Jul) 14,500 15,669 156 9,338 4,038 4,109 44 3,4668 (Aug) 15,834 16,397 176 8,688 3,908 4,018 21 3,3389 (Sep) 17,796 18,152 222 8,184 4,344 4,354 6 3,324
10 (Oct) 18,654 18,580 285 8,239 4,253 4,223 57 3,29811 (Nov) 19,035 18,779 278 8,347 4,479 4,474 29 3,27412 (Dec) 17,446 17,855 239 7,833 4,264 4,251 23 3,266
出 荷 Shipments在 庫
Inventory
年 月Year and Month
金 網 Wire netting 鉄くぎ Wire nails
販 売Sales
その他Others
溶接金網 Welded wire netting 計 Total
在 庫 Inventory
生 産Production
生 産Production
出 荷 Shipments
販 売Sales
その他Others
93

時系列表 (鉄鋼編) 製品
1. 製品 Products (13) 鉄鋼加工製品 Secondary steel products
(単位:t、Unit: t)
平成19年 (2007) 20,128 20,097 9 2,652 56,881 57,071 - 4,70620 (2008) 15,031 15,481 3 2,198 47,784 48,107 - 4,36921 (2009) 8,278 9,185 3 1,305 32,801 34,322 5 2,79322 (2010) 8,587 8,679 5 1,135 40,813 41,023 31 2,49423 (2011) 6,124 6,212 28 921 43,601 43,245 468 2,345
平成21年度 (09FY) 8,694 9,160 3 1,342 34,760 35,832 4 2,89022 (10FY) 8,083 8,335 4 874 41,397 41,544 296 2,403
平成23年 1~3月 (Q1) 1,689 1,813 - 874 10,444 10,256 265 2,4034~6 (Q2) 1,708 1,564 5 1,041 10,598 10,395 46 2,5407~9 (Q3) 1,229 1,357 22 900 11,061 11,124 49 2,424
10~12 (Q4) 1,498 1,478 1 921 11,498 11,470 108 2,345
平成23年 1月 (Jan) 475 533 - 919 3,479 3,394 217 2,3622 (Feb) 595 564 - 956 3,412 3,380 43 2,3483 (Mar) 619 716 - 874 3,553 3,482 5 2,4034 (Apr) 601 622 - 859 3,545 3,435 22 2,4905 (May) 527 483 - 912 3,457 3,370 - 2,5706 (Jun) 580 459 5 1,041 3,596 3,590 24 2,540
7 (Jul) 417 448 10 1,003 3,621 3,661 34 2,4638 (Aug) 387 405 6 981 3,521 3,613 15 2,3579 (Sep) 425 504 6 900 3,919 3,850 - 2,424
10 (Oct) 495 520 - 875 3,758 3,703 57 2,42311 (Nov) 517 523 - 869 3,962 3,951 29 2,40512 (Dec) 486 435 1 921 3,778 3,816 22 2,345
年 月Year and Month
鉄丸くぎ Round wire nails
生 産Production
出 荷 Shipments在 庫
Inventory
特殊くぎ Special wire nails
鉄くぎ Wire nails
生 産Production
出 荷 Shipments在 庫
Inventory
(単位:t、Unit: t)
販 売Sales
その他Others
販 売Sales
その他Others
94
平成19年 (2007) 320,389 317,672 1,782 10,838 388,281 388,381 - 3,40220 (2008) 319,528 316,930 991 11,745 375,047 375,694 - 2,67821 (2009) 228,700 223,059 812 16,141 295,103 294,600 - 3,14022 (2010) 249,008 249,591 872 14,014 353,173 352,959 - 3,33423 (2011) 254,962 254,910 1,235 13,111 343,390 343,605 - 2,988
平成21年度 (09FY) 225,746 224,031 808 13,520 331,593 331,269 - 3,20322 (10FY) 259,486 256,295 992 15,706 356,910 356,672 - 3,382
平成23年 1~3月 (Q1) 66,222 64,704 340 15,706 92,521 92,479 - 3,3824~6 (Q2) 63,370 64,614 277 13,736 88,926 89,128 - 3,1367~9 (Q3) 62,402 61,730 344 14,485 81,437 81,274 - 3,227
10~12 (Q4) 62,968 63,862 274 13,111 80,506 80,724 - 2,988
平成23年 1月 (Jan) 21,054 20,661 109 14,263 29,601 29,811 - 3,1032 (Feb) 22,197 21,591 85 15,299 30,099 30,185 - 3,0073 (Mar) 22,971 22,452 146 15,706 32,821 32,483 - 3,3824 (Apr) 21,129 22,217 104 14,591 33,480 33,569 - 3,3235 (May) 19,894 20,574 71 13,736 27,230 27,379 - 3,1226 (Jun) 22,347 21,823 102 13,736 28,216 28,180 - 3,136
7 (Jul) 21,069 20,821 116 14,427 27,700 27,627 - 3,1968 (Aug) 20,035 19,934 91 14,347 26,766 26,831 - 3,0919 (Sep) 21,298 20,975 137 14,485 26,971 26,816 - 3,227
10 (Oct) 21,826 21,150 101 14,982 27,399 27,581 - 3,03311 (Nov) 21,242 21,519 112 14,538 26,728 26,650 - 3,09612 (Dec) 19,900 21,193 61 13,111 26,379 26,493 - 2,988
電気溶接棒Electrical welding rods
ドラム缶Steel drums
生 産Production
出 荷 Shipments在 庫
Inventory生 産
Production販 売Sales
その他Others
販 売Sales
その他Others
年 月Year and Month 出 荷 Shipments
在 庫 Inventory
94

時系列表 (鉄鋼編) 製品
1. 製品 Products (13) 鉄鋼加工製品 Secondary steel products
平成19年 (2007) 224,503 222,031 1,876 3,906 597,532 554,356 170,522 30,46920 (2008) 213,143 210,204 1,236 4,089 561,857 522,678 150,628 26,46721 (2009) 189,289 186,115 1,353 4,510 525,144 478,213 126,980 27,98122 (2010) 198,166 195,187 3,324 4,419 511,771 466,644 119,597 27,56623 (2011) 195,458 192,024 3,354 4,726 516,049 454,161 141,125 32,903
平成21年度 (09FY) 194,221 191,036 1,871 4,298 521,210 475,583 125,156 27,15922 (10FY) 200,012 196,788 3,337 4,396 507,097 456,406 119,609 32,871
平成23年 1~3月 (Q1) 48,305 47,556 788 4,396 115,703 101,406 26,652 32,8714~6 (Q2) 48,831 47,774 849 4,659 137,297 122,641 42,636 29,0267~9 (Q3) 47,173 46,538 732 4,611 123,666 107,620 33,661 31,321
10~12 (Q4) 51,149 50,156 985 4,726 139,383 122,494 38,176 32,903
平成23年 1月 (Jan) 15,577 15,234 246 4,519 35,194 32,149 8,294 27,1492 (Feb) 15,504 15,225 256 4,553 39,444 35,023 9,220 28,9033 (Mar) 17,224 17,097 286 4,396 41,065 34,234 9,138 32,8714 (Apr) 17,310 16,844 298 4,585 46,446 42,394 13,158 31,0235 (May) 15,382 14,860 279 4,853 47,136 42,746 15,267 29,3396 (Jun) 16,139 16,070 272 4,659 43,715 37,501 14,211 29,026
7 (Jul) 15,611 15,485 265 4,555 38,742 33,248 10,893 30,5558 (Aug) 15,484 15,301 272 4,452 39,688 34,619 9,973 31,6299 (Sep) 16,078 15,752 195 4,611 45,236 39,753 12,795 31,321
10 (Oct) 16,902 16,471 374 4,703 48,084 40,744 14,953 31,99911 (Nov) 17,424 17,191 325 4,648 50,253 44,389 12,746 33,44612 (Dec) 16,823 16,494 286 4,726 41,046 37,361 10,477 32,903
(単位:t、Unit: t)
(単位:t、Unit: t)
在 庫 Inventory
生 産Production
出 荷 Shipments在 庫
Inventory販 売Sales
その他Others
生 産Production
出 荷 Shipments年 月
Year and Month
18リットル缶18 l cans
食 缶Food cans
販 売Sales
その他Others
95
平成19年 (2007) 125,481 123,264 1,701 9,52920 (2008) 113,061 111,733 2,121 7,64321 (2009) 91,054 88,875 1,913 7,55922 (2010) 81,614 80,647 1,848 6,78723 (2011) 81,806 79,496 1,779 7,010
平成21年度 (09FY) 88,502 86,201 1,917 8,20222 (10FY) 80,318 79,430 1,777 7,439
平成23年 1~3月 (Q1) 20,159 18,974 398 7,4394~6 (Q2) 21,386 20,979 514 7,2787~9 (Q3) 18,402 18,003 473 7,179
10~12 (Q4) 21,859 21,540 394 7,010
平成23年 1月 (Jan) 6,228 5,795 85 6,9912 (Feb) 6,998 6,284 146 7,5743 (Mar) 6,933 6,895 167 7,4394 (Apr) 6,942 6,959 209 7,2635 (May) 7,370 7,079 148 7,3666 (Jun) 7,074 6,941 157 7,278
7 (Jul) 6,533 6,347 180 7,2828 (Aug) 5,802 5,780 141 7,1539 (Sep) 6,067 5,876 152 7,179
10 (Oct) 7,175 6,847 113 7,36011 (Nov) 7,677 7,597 178 7,25912 (Dec) 7,007 7,096 103 7,010
年 月Year and Month
一般缶General cans
在 庫 Inventory販 売
Salesその他Others
生 産Production
出 荷 Shipments
95

時系列表 (鉄鋼編) 製品
1. 製品 Products
(14) 終鋼材 Finished steel (単位:t、 Unit: t)
① 普通鋼・特殊鋼の合計(生産) Grand total (Production) ② 普通鋼(生産) Ordinary steel (Production)
平成19年 (2007) 105,431,000 85,027,367 20,403,633 85,027,367 498,109 819,09920 (2008) 103,296,590 82,702,700 20,593,890 82,702,700 529,467 767,81321 (2009) 74,415,115 62,024,403 12,390,712 62,024,403 557,412 625,39022 (2010) 94,936,764 75,610,138 19,326,626 75,610,138 630,289 635,38523 (2011) 92,018,535 72,815,569 19,202,966 72,815,569 575,219 527,431
平成21年度 (09FY) 82,755,080 68,068,384 14,686,696 68,068,384 533,465 703,80422 (10FY) 95,298,127 75,542,463 19,755,664 75,542,463 620,144 559,488
平成23年 1~3月 (Q1) 23,980,615 19,000,116 4,980,499 19,000,116 142,163 131,0794~6 (Q2) 22,510,742 18,165,503 4,345,239 18,165,503 168,585 111,5177~9 (Q3) 22,796,789 18,027,536 4,769,253 18,027,536 132,121 95,512
10~12 (Q4) 22,730,389 17,622,414 5,107,975 17,622,414 132,350 189,323
平成23年 1月 (Jan) 8,165,567 6,452,537 1,713,030 6,452,537 40,302 50,3762 (Feb) 7,791,990 6,167,889 1,624,101 6,167,889 45,288 40,9323 (Mar) 8,023,058 6,379,690 1,643,368 6,379,690 56,573 39,7714 (Apr) 7,299,407 5,906,111 1,393,296 5,906,111 60,891 49,6035 (May) 7,556,831 6,139,027 1,417,804 6,139,027 49,215 30,9706 (Jun) 7,654,504 6,120,365 1,534,139 6,120,365 58,479 30,944
7 (Jul) 7,484,926 5,952,578 1,532,348 5,952,578 48,951 20,3468 (Aug) 7,676,588 6,095,845 1,580,743 6,095,845 56,184 35,4639 (Sep) 7,635,275 5,979,113 1,656,162 5,979,113 26,986 39,703
10 (Oct) 7,891,228 6,135,739 1,755,489 6,135,739 42,853 51,18011 (Nov) 7,536,617 5,826,965 1,709,652 5,826,965 48,964 67,80312 (Dec) 7,302,544 5,659,710 1,642,834 5,659,710 40,533 70,340
注:1. 本表は現行の鉄鋼月報で調査している熱間、冷間、めっきの工程別調査を商慣習として広く用いられている完成鋼材に組み替えたものである。
(単位:t Unit: t)
年 月Year and Month
合 計Grand Total
普通鋼計Ordinary steel
total
特殊鋼計Special steel total
合 計Grand total
軌条(含付属品)Rails and
accessories
鋼矢板Sheet pilings
2. 組み替えの方法は熱間圧延鋼材(管材、鋼帯幅600㎜以上冷延電気鋼帯用を除く。)、冷間仕上鋼材及びめっき鋼材(磨棒鋼及び線類を除く。)、鋼管及び 冷間ロール成型形鋼を加えたものから重複生産を調整するため、熱間、冷間及びめっきの各工程における鋼材次工程の消費量を差し引いて算出する。
96
(単位:t、 Unit: t)
形 鋼 Steel shapes
平成19年 (2007) 15,528 8,622,053 4,868,280 1,541,653 1,479,102 733,01820 (2008) 11,558 8,013,173 4,573,897 1,473,729 1,309,598 655,94921 (2009) 9,931 5,341,997 2,944,623 1,028,196 892,512 476,66622 (2010) 10,075 5,672,243 3,182,191 997,965 1,015,914 476,17323 (2011) 10,165 5,983,448 3,364,592 1,039,721 1,077,807 501,328
平成21年度 (09FY) 10,719 5,615,449 3,123,688 1,043,035 968,266 480,46022 (10FY) 10,484 5,814,898 3,287,194 994,283 1,039,821 493,600
平成23年 1~3月 (Q1) 2,944 1,565,447 893,120 252,415 282,902 137,0104~6 (Q2) 1,686 1,637,862 928,209 283,028 307,928 118,6977~9 (Q3) 2,169 1,306,685 696,995 265,815 230,624 113,251
10~12 (Q4) 3,366 1,473,454 846,268 238,463 256,353 132,370
平成23年 1月 (Jan) 930 495,214 280,440 80,893 90,035 43,8462 (Feb) 473 528,405 303,294 76,092 103,053 45,9663 (Mar) 1,541 541,828 309,386 95,430 89,814 47,1984 (Apr) 646 579,001 321,900 92,221 116,406 48,4745 (May) 462 568,608 326,597 104,252 102,700 35,0596 (Jun) 578 490,253 279,712 86,555 88,822 35,164
7 (Jul) 516 413,095 213,373 93,072 71,100 35,5508 (Aug) 451 449,998 248,026 87,219 76,974 37,7799 (Sep) 1,202 443,592 235,596 85,524 82,550 39,922
10 (Oct) 1,050 504,430 285,597 77,324 94,961 46,54811 (Nov) 1,346 477,406 273,563 82,285 77,695 43,86312 (Dec) 970 491,618 287,108 78,854 83,697 41,959
年 月Year and Month
簡易鋼矢板Cold-formed sheet
pilings 計 Total
H形鋼Wide flange beams
大 形Heavy shapes
中小形Medium and light
shapes
軽量形鋼Cold-formed steel
shapes
96

時系列表 (鉄鋼編) 製品
1. 製品 Products
(14) 終鋼材 Finished steel
② 普通鋼(生産) Ordinary steel (Production) (単位:t、 Unit: t)
棒 鋼Steel bars
小 形 棒 鋼Light bars
平成19年 (2007) 13,148,134 517,459 650,739 11,979,936 11,102,313 877,62320 (2008) 11,624,807 484,555 568,715 10,571,537 9,812,891 758,64621 (2009) 9,092,610 356,565 368,021 8,368,024 7,850,529 517,49522 (2010) 9,202,564 395,144 440,281 8,367,139 7,758,643 608,49623 (2011) 9,590,394 408,336 480,059 8,701,999 8,095,009 606,990
平成21年度 (09FY) 9,136,278 364,436 383,855 8,387,987 7,833,185 554,80222 (10FY) 9,369,575 403,674 464,533 8,501,368 7,881,781 619,587
平成23年 1~3月 (Q1) 2,321,622 103,551 126,097 2,091,974 1,928,715 163,2594~6 (Q2) 2,426,201 103,864 123,617 2,198,720 2,032,354 166,3667~9 (Q3) 2,275,802 92,820 106,862 2,076,120 1,944,009 132,111
10~12 (Q4) 2,566,769 108,101 123,483 2,335,185 2,189,931 145,254
平成23年 1月 (Jan) 754,739 33,704 41,238 679,797 625,384 54,4132 (Feb) 788,305 29,515 45,863 712,927 658,585 54,3423 (Mar) 778,578 40,332 38,996 699,250 644,746 54,5044 (Apr) 825,491 35,034 39,109 751,348 690,876 60,4725 (May) 836,167 40,540 50,342 745,285 695,004 50,2816 (Jun) 764,543 28,290 34,166 702,087 646,474 55,613
7 (Jul) 771,594 34,608 38,560 698,426 652,268 46,1588 (Aug) 719,919 24,274 29,772 665,873 621,521 44,3529 (Sep) 784,289 33,938 38,530 711,821 670,220 41,601
10 (Oct) 886,004 34,847 35,909 815,248 766,318 48,93011 (Nov) 868,758 35,854 46,310 786,594 736,535 50,05912 (Dec) 812,007 37,400 41,264 733,343 687,078 46,265
Notes: 1. This table is a re-arrangement of the present Iron and Steel Monthly Report research classified by the processes of hot rolling, cold rolling and
metal-coating into categories of complete steel products commonly used in business.
2. The re-arranged method is to add the following together: hot-rolled steel (excluding rounds for tubes, and steel strips with strip-width of 600 mm
or more for cold-rolled electrical sheet and strips), cold-finished steel, coated steel (excluding cold-finished bars and wires),
steel pipes and tubes, and cold-rolled steel shapes, and then, to adjust overlap of production, and subtract the amounts of consumption in each of
the subsequent hot-rolled cold-rolled and coated steel processes (単位:t Unit: t)
年 月Year and Month 計
Total大 形
Heavy bars中 形
Medium bars 小 計Sub-total
鉄筋用For reinforcing
その他用For others
97
the subsequent hot-rolled, cold-rolled and coated steel processes. (単位:t、 Unit: t)
線 材Steel wire rods
平成19年 (2007) 2,538,877 687,964 1,112,158 738,755 12,416,66120 (2008) 2,386,309 609,574 993,987 782,748 13,261,13221 (2009) 1,634,934 379,904 620,364 634,666 10,942,05322 (2010) 1,871,695 454,258 655,061 762,376 12,057,48923 (2011) 1,810,777 448,369 628,940 733,468 11,878,918
平成21年度 (09FY) 1,833,067 417,666 697,167 718,234 10,729,13822 (10FY) 1,880,628 464,046 667,835 748,747 12,152,157
平成23年 1~3月 (Q1) 499,109 125,503 185,778 187,828 3,106,8614~6 (Q2) 446,736 103,559 154,141 189,036 3,050,9747~9 (Q3) 408,430 93,416 131,693 183,321 2,901,718
10~12 (Q4) 456,502 125,891 157,328 173,283 2,819,365
平成23年 1月 (Jan) 180,638 44,374 66,389 69,875 1,050,5402 (Feb) 166,254 43,542 65,638 57,074 992,0413 (Mar) 152,217 37,587 53,751 60,879 1,064,2804 (Apr) 162,042 41,873 55,090 65,079 1,000,5705 (May) 151,620 34,909 54,637 62,074 1,057,8786 (Jun) 133,074 26,777 44,414 61,883 992,526
7 (Jul) 146,779 29,130 48,487 69,162 928,6848 (Aug) 125,200 32,328 36,381 56,491 990,8929 (Sep) 136,451 31,958 46,825 57,668 982,142
10 (Oct) 153,598 40,277 55,722 57,599 1,005,67211 (Nov) 150,775 41,978 52,384 56,413 1,000,50212 (Dec) 152,129 43,636 49,222 59,271 813,191
年 月Year and Month
厚 板Heavy steel plates
計 Total
バーインコイルBars in coil
普 通Ordinary wire rods
特 殊Special wire rods
97

時系列表 (鉄鋼編) 製品
1. 製品 Products
(14) 終鋼材 Finished steel
② 普通鋼(生産) Ordinary steel (Production) (単位:t、 Unit: t)
冷延薄板類Cold-rolled sheets
平成19年 (2007) 187,028 13,960,337 6,990,436 129,485 6,838,941 22,010 1,923,701 994,64520 (2008) 155,954 13,749,192 7,058,606 129,533 6,907,453 21,620 1,901,765 1,112,84121 (2009) 94,824 11,232,169 5,546,755 70,796 5,467,425 8,534 1,410,041 915,83822 (2010) 156,160 15,131,712 7,605,817 97,719 7,495,369 12,729 2,001,547 1,053,98523 (2011) 204,181 14,143,317 6,883,621 80,582 6,790,145 12,894 1,949,391 978,533
平成21年度 (09FY) 109,281 13,426,569 6,680,693 87,078 6,583,873 9,742 1,627,573 989,15522 (10FY) 169,857 14,951,631 7,535,831 92,449 7,430,483 12,899 2,048,748 1,058,261
平成23年 1~3月 (Q1) 46,317 3,765,218 1,921,351 20,399 1,896,831 4,121 539,362 267,9314~6 (Q2) 46,885 3,487,628 1,611,103 19,260 1,590,030 1,813 511,217 258,4647~9 (Q3) 51,665 3,643,376 1,777,472 20,653 1,753,295 3,524 489,726 248,386
10~12 (Q4) 59,314 3,247,095 1,573,695 20,270 1,549,989 3,436 409,086 203,752
平成23年 1月 (Jan) 14,515 1,304,668 683,529 6,972 675,253 1,304 177,727 95,9142 (Feb) 15,962 1,214,145 628,922 6,590 620,295 2,037 164,251 76,3903 (Mar) 15,840 1,246,405 608,900 6,837 601,283 780 197,384 95,6274 (Apr) 15,739 1,058,757 470,175 6,998 462,352 825 162,135 91,0455 (May) 16,429 1,172,125 535,914 6,078 529,480 356 182,262 95,2886 (Jun) 14,717 1,256,746 605,014 6,184 598,198 632 166,820 72,131
7 (Jul) 15,221 1,231,612 576,861 6,910 568,972 979 160,672 80,4978 (Aug) 18,463 1,276,043 614,424 5,407 607,680 1,337 167,734 84,4819 (Sep) 17,981 1,135,721 586,187 8,336 576,643 1,208 161,320 83,408
10 (Oct) 19,521 1,095,019 611,790 8,463 602,060 1,267 136,740 65,70211 (Nov) 20,589 994,469 486,647 5,321 480,380 946 144,440 66,62912 (Dec) 19,204 1,157,607 475,258 6,486 467,549 1,223 127,906 71,421
(単位:t Unit: t)
年 月Year and Month
中板・薄板Medium
plates/lightsheets
鋼 帯Steel strips
冷延電気鋼帯
Cold-rolled electrical sheets
and strips
ブリキTin plates計
Total
磨帯鋼Cold-rolled
narrow strips
冷延広幅帯鋼Cold-rolledwide strips
冷延鋼板Cold-rolledsheets and
strips
98
(単位:t、 Unit: t)
鋼 管Steel pipes and tubes
平成19年 (2007) 797,917 14,720,961 1,474,498 5,842,328 4,818,507 358,795 665,026 77,05520 (2008) 842,858 14,382,296 1,242,614 5,578,475 4,598,882 346,048 633,545 83,84021 (2009) 729,924 9,333,330 849,600 3,648,683 2,981,901 187,308 479,474 58,91222 (2010) 849,291 13,159,904 1,221,552 4,286,682 3,452,744 270,594 563,344 63,74823 (2011) 818,147 11,861,041 1,129,900 4,402,211 3,557,101 265,610 579,500 68,875
平成21年度 (09FY) 759,129 11,080,925 1,027,220 3,742,557 3,017,250 217,297 508,010 63,36222 (10FY) 849,695 12,843,757 1,210,175 4,403,053 3,570,258 270,675 562,120 64,081
平成23年 1~3月 (Q1) 202,586 3,015,289 295,603 1,161,131 955,363 66,851 138,917 16,1034~6 (Q2) 216,430 2,773,675 279,236 1,119,158 899,495 58,690 160,973 18,1467~9 (Q3) 203,098 3,127,987 291,951 1,052,838 844,669 69,044 139,125 18,600
10~12 (Q4) 196,033 2,944,090 263,110 1,069,084 857,574 71,025 140,485 16,026
平成23年 1月 (Jan) 73,619 1,056,387 96,955 368,825 303,417 21,351 44,057 7,6592 (Feb) 59,934 966,173 96,577 378,742 305,180 23,081 50,481 5,0953 (Mar) 69,033 992,729 102,071 413,564 346,766 22,419 44,379 3,3494 (Apr) 71,252 885,226 82,226 384,925 310,123 20,749 54,053 6,3875 (May) 75,271 897,835 93,774 369,442 298,178 17,253 54,011 5,7676 (Jun) 69,907 990,614 103,236 364,791 291,194 20,688 52,909 5,992
7 (Jul) 68,817 1,049,404 93,024 340,582 272,034 22,188 46,360 5,9238 (Aug) 66,538 1,031,596 106,972 345,380 278,505 21,681 45,194 6,1079 (Sep) 67,743 1,046,987 91,955 366,876 294,130 25,175 47,571 6,570
10 (Oct) 66,868 1,033,487 92,936 364,721 291,279 24,380 49,062 4,16811 (Nov) 63,036 990,937 80,541 358,755 288,077 24,312 46,366 5,36812 (Dec) 66,129 919,666 89,633 345,608 278,218 22,333 45,057 6,490
年 月Year and Month
ティンフリースチール
Tin-free steel
亜鉛めっき鋼板
Galvanizedsheets
外 輪Tyres and
wheels
冷けんCold-drawnpipes and
tubes
めっきMetallic-
coated pipesand tubes
計Total
熱 間Hot-steelpipes and
tubes
その他の金属めっき鋼板
Other metalliccoated sheets
98

時系列表 (鉄鋼編) 製品
1. 製品 Products
(14) 終鋼材 Finished steel
③ 特殊鋼(形状別)(生産・出荷・在庫) Special steel (by configuration)(Production/Shipments/Inventory) (単位:t、 Unit: t)
平成19年 (2007) 20,403,633 20,374,579 1,115,829 14,544,477 14,529,164 699,16420 (2008) 20,593,890 20,647,827 1,061,892 14,723,080 14,744,298 677,94621 (2009) 12,390,712 12,464,089 988,515 8,666,163 8,699,866 644,24322 (2010) 19,326,626 19,188,683 1,126,458 13,941,649 13,831,482 754,41023 (2011) 19,202,966 19,165,570 1,163,854 14,041,429 14,020,116 775,723
平成21年度 (09FY) 14,686,696 14,503,480 944,143 10,461,516 10,345,939 625,36922 (10FY) 19,755,664 19,702,304 997,503 14,355,052 14,277,874 702,547
平成23年 1~3月 (Q1) 4,980,499 5,109,454 997,503 3,628,313 3,680,176 702,5474~6 (Q2) 4,345,239 4,287,475 1,055,267 3,260,006 3,223,142 739,4117~9 (Q3) 4,769,253 4,738,400 1,086,120 3,459,687 3,469,566 729,532
10~12 (Q4) 5,107,975 5,030,241 1,163,854 3,693,423 3,647,232 775,723
平成23年 1月 (Jan) 1,713,030 1,693,060 1,146,428 1,261,570 1,233,306 782,6742 (Feb) 1,624,101 1,646,642 1,123,887 1,161,347 1,188,259 755,7623 (Mar) 1,643,368 1,769,752 997,503 1,205,396 1,258,611 702,5474 (Apr) 1,393,296 1,326,066 1,064,733 1,048,352 995,167 755,7325 (May) 1,417,804 1,377,315 1,105,222 1,058,533 1,040,757 773,5086 (Jun) 1,534,139 1,584,094 1,055,267 1,153,121 1,187,218 739,411
7 (Jul) 1,532,348 1,509,881 1,077,734 1,114,627 1,123,061 730,9778 (Aug) 1,580,743 1,527,699 1,130,778 1,137,118 1,112,922 755,1739 (Sep) 1,656,162 1,700,820 1,086,120 1,207,942 1,233,583 729,532
10 (Oct) 1,755,489 1,671,750 1,169,859 1,275,295 1,250,569 754,25811 (Nov) 1,709,652 1,715,719 1,163,792 1,261,651 1,253,770 762,13912 (Dec) 1,642,834 1,642,772 1,163,854 1,156,477 1,142,893 775,723
(単位:t Unit: t)
年 月Year and Month
合 計 Grand total
熱間圧延鋼材Hot-rolled steel
計 Total
生 産Production
出 荷Shipments
在 庫Inventory
生 産Production
出 荷Shipments
在 庫Inventory
99
(単位:t、 Unit: t)
平成19年 (2007) 381,911 386,057 22,646 6,724,149 6,734,511 203,64120 (2008) 397,569 401,693 18,522 6,883,261 6,902,998 183,90421 (2009) 178,848 173,302 24,068 3,448,161 3,465,283 166,78222 (2010) 393,638 380,593 37,113 6,029,672 5,996,572 199,88223 (2011) 500,334 490,887 46,560 6,256,373 6,238,825 217,430
平成21年度 (09FY) 244,335 246,162 13,085 4,265,765 4,227,737 169,47022 (10FY) 436,149 421,912 27,322 6,260,098 6,235,915 193,653
平成23年 1~3月 (Q1) 129,310 139,101 27,322 1,601,801 1,608,030 193,6534~6 (Q2) 112,882 106,429 33,775 1,430,918 1,429,299 195,2727~9 (Q3) 132,742 141,628 24,889 1,529,404 1,522,469 202,207
10~12 (Q4) 125,400 103,729 46,560 1,694,250 1,679,027 217,430
平成23年 1月 (Jan) 49,858 56,761 30,210 527,135 522,527 204,4902 (Feb) 34,802 42,303 22,709 533,949 522,859 215,5803 (Mar) 44,650 40,037 27,322 540,717 562,644 193,6534 (Apr) 30,598 32,688 25,232 452,051 431,068 214,6365 (May) 38,424 29,179 34,477 455,733 460,215 210,1546 (Jun) 43,860 44,562 33,775 523,134 538,016 195,272
7 (Jul) 60,678 46,080 48,373 511,399 508,377 198,2948 (Aug) 34,788 46,944 36,217 482,060 477,694 202,6609 (Sep) 37,276 48,604 24,889 535,945 536,398 202,207
10 (Oct) 41,782 34,132 32,539 562,994 555,536 209,66511 (Nov) 31,881 38,526 25,894 573,197 583,313 199,54912 (Dec) 51,737 31,071 46,560 558,059 540,178 217,430
年 月Year and Month
熱間圧延鋼材 Hot-rolled steel
出 荷Shipments
在 庫Inventory
形 鋼Steel shapes
棒 鋼Steel bars
生 産Production
出 荷Shipments
在 庫Inventory
生 産Production
99

時系列表 (鉄鋼編) 製品
1. 製品 Products
(14) 終鋼材 Finished steel
③ 特殊鋼(形状別)(生産・出荷・在庫) Special steel (by configuration)(Production/Shipments/Inventory) (単位:t、 Unit: t)
平成19年 (2007) 4,394,559 4,404,668 155,595 1,266,979 1,266,478 73,36620 (2008) 4,446,064 4,431,495 170,164 1,331,519 1,328,237 76,64821 (2009) 2,916,079 2,909,900 176,343 888,460 901,802 63,30622 (2010) 4,382,009 4,336,219 222,133 1,220,520 1,220,514 63,31223 (2011) 4,163,728 4,186,149 199,712 1,392,878 1,353,083 103,107
平成21年度 (09FY) 3,544,893 3,509,416 163,373 840,518 853,734 61,95222 (10FY) 4,383,582 4,349,475 197,480 1,332,606 1,328,254 66,304
平成23年 1~3月 (Q1) 1,065,843 1,090,496 197,480 340,897 337,905 66,3044~6 (Q2) 908,179 921,738 183,921 381,903 341,592 106,6157~9 (Q3) 1,073,534 1,054,507 202,948 313,772 340,239 80,148
10~12 (Q4) 1,116,172 1,119,408 199,712 356,306 333,347 103,107
平成23年 1月 (Jan) 376,001 379,484 218,650 122,057 96,833 88,5362 (Feb) 360,103 360,702 218,051 92,647 107,898 73,2853 (Mar) 329,739 350,310 197,480 126,193 133,174 66,3044 (Apr) 291,701 283,676 205,505 123,054 96,122 93,2365 (May) 308,820 295,595 218,730 115,633 121,111 87,7586 (Jun) 307,658 342,467 183,921 143,216 124,359 106,615
7 (Jul) 338,217 334,648 187,490 83,228 110,724 79,1198 (Aug) 355,383 350,500 192,373 114,471 95,711 97,8799 (Sep) 379,934 369,359 202,948 116,073 133,804 80,148
10 (Oct) 389,358 391,540 200,766 122,815 124,128 78,83511 (Nov) 369,966 363,948 206,784 150,247 117,284 111,79812 (Dec) 356,848 363,920 199,712 83,244 91,935 103,107
(単位:t Unit: t)
年 月Year and Month
熱間圧延鋼材 Hot-rolled steel
線 材Wire rods
鋼 板Sheets and plates
生 産Production
出 荷Shipments
在 庫Inventory
生 産Production
出 荷Shipments
在 庫Inventory
100
(単位:t、 Unit: t)
平成19年 (2007) 1,776,879 1,737,450 243,916 3,113,868 3,111,977 160,06020 (2008) 1,664,667 1,679,875 228,708 2,997,530 3,006,498 151,09221 (2009) 1,234,615 1,249,579 213,744 2,019,325 2,044,041 126,37622 (2010) 1,915,810 1,897,584 231,970 3,041,817 2,993,393 174,80023 (2011) 1,728,116 1,751,172 208,914 2,861,971 2,874,348 162,423
平成21年度 (09FY) 1,566,005 1,508,890 217,489 2,414,385 2,386,148 126,86922 (10FY) 1,942,617 1,942,318 217,788 3,076,984 3,050,909 152,944
平成23年 1~3月 (Q1) 490,462 504,644 217,788 755,471 777,327 152,9444~6 (Q2) 426,124 424,084 219,828 653,657 641,547 165,0547~9 (Q3) 410,235 410,723 219,340 744,266 733,310 176,010
10~12 (Q4) 401,295 411,721 208,914 708,577 722,164 162,423
平成23年 1月 (Jan) 186,519 177,701 240,788 261,672 263,694 172,7782 (Feb) 139,846 154,497 226,137 249,248 246,433 175,5933 (Mar) 164,097 172,446 217,788 244,551 267,200 152,9444 (Apr) 150,948 151,613 217,123 213,215 209,647 156,5125 (May) 139,923 134,657 222,389 213,263 202,928 166,8476 (Jun) 135,253 137,814 219,828 227,179 228,972 165,054
7 (Jul) 121,105 123,232 217,701 237,876 237,704 165,2268 (Aug) 150,416 142,073 226,044 253,137 240,626 177,7379 (Sep) 138,714 145,418 219,340 253,253 254,980 176,010
10 (Oct) 158,346 145,233 232,453 244,404 252,341 168,07311 (Nov) 136,360 150,699 218,114 233,721 234,273 167,52112 (Dec) 106,589 115,789 208,914 230,452 235,550 162,423
年 月Year and Month
熱間圧延鋼材Hot-rolled steel
鋼 帯Steel strips
生 産Production
冷間仕上鋼材Cold-finished steel
計Total
出 荷Shipments
在 庫Inventory
生 産Production
出 荷Shipments
在 庫Inventory
100

時系列表 (鉄鋼編) 製品
1. 製品 Products
(14) 終鋼材 Finished steel
③ 特殊鋼(形状別)(生産・出荷・在庫) Special steel (by configuration)(Production/Shipments/Inventory)
平成19年 (2007) 339,164 337,371 18,007 2,615,818 2,616,027 132,608 158,886 158,579 9,44520 (2008) 321,584 320,447 19,144 2,528,876 2,539,569 121,915 147,070 146,482 10,03321 (2009) 198,531 203,519 14,156 1,751,900 1,767,411 106,404 68,894 73,111 5,81622 (2010) 307,906 306,425 15,637 2,628,132 2,581,702 152,834 105,779 105,266 6,32923 (2011) 294,245 293,080 16,802 2,465,147 2,478,636 139,345 102,579 102,632 6,276
平成21年度 (09FY) 245,604 247,018 12,494 2,087,595 2,056,640 108,837 81,186 82,490 5,53822 (10FY) 310,091 306,224 16,361 2,661,486 2,639,447 130,876 105,407 105,238 5,707
平成23年 1~3月 (Q1) 79,149 78,425 16,361 649,549 671,507 130,876 26,773 27,395 5,7074~6 (Q2) 71,130 69,205 18,286 557,010 547,610 140,276 25,517 24,732 6,4927~9 (Q3) 73,708 75,016 16,978 645,230 632,721 152,785 25,328 25,573 6,247
10~12 (Q4) 70,258 70,434 16,802 613,358 626,798 139,345 24,961 24,932 6,276
平成23年 1月 (Jan) 25,386 26,029 14,994 227,405 229,254 150,985 8,881 8,411 6,7992 (Feb) 25,949 25,097 15,846 214,968 212,682 153,271 8,331 8,654 6,4763 (Mar) 27,814 27,299 16,361 207,176 229,571 130,876 9,561 10,330 5,7074 (Apr) 23,178 21,201 18,338 182,040 180,289 132,627 7,997 8,157 5,5475 (May) 22,496 22,719 18,115 182,270 171,924 142,973 8,497 8,285 5,7596 (Jun) 25,456 25,285 18,286 192,700 195,397 140,276 9,023 8,290 6,492
7 (Jul) 24,516 25,205 17,597 205,578 204,517 141,337 7,782 7,982 6,2928 (Aug) 24,302 24,761 17,138 220,120 207,383 154,074 8,715 8,482 6,5259 (Sep) 24,890 25,050 16,978 219,532 220,821 152,785 8,831 9,109 6,247
10 (Oct) 26,420 26,409 16,989 209,605 217,403 144,987 8,379 8,529 6,09711 (Nov) 22,115 23,279 15,825 203,975 203,026 145,936 7,631 7,968 5,76012 (Dec) 21,723 20,746 16,802 199,778 206,369 139,345 8,951 8,435 6,276
(単位:t Unit: t)
(単位:t、 Unit: t)
年 月Year and Month
冷間仕上鋼材 Cold-finished steel
磨帯鋼Cold-rolled narrow strips
冷延広幅帯鋼Cold-rolled wide strips
冷延鋼板Cold-rolled sheets and strips
生 産Production
出 荷Shipments
在 庫Inventory
生 産Production
生 産Production
出 荷Shipments
在 庫Inventory
出 荷Shipments
在 庫Inventory
101
(単位:t、 Unit: t)
平成19年 (2007) 2,745,288 2,733,438 256,605 2,560,478 2,546,406 247,934 184,810 187,032 8,67120 (2008) 2,873,280 2,897,031 232,854 2,673,313 2,701,717 219,530 199,967 195,314 13,32421 (2009) 1,705,224 1,720,182 217,896 1,591,759 1,602,290 208,999 113,465 117,892 8,89722 (2010) 2,343,160 2,363,808 197,248 2,184,080 2,204,567 188,512 159,080 159,241 8,73623 (2011) 2,299,566 2,271,106 225,708 2,128,459 2,101,954 215,017 171,107 169,152 10,691
平成21年度 (09FY) 1,810,795 1,771,393 191,905 1,688,542 1,646,873 184,256 122,253 124,520 7,64922 (10FY) 2,323,628 2,373,521 142,012 2,160,736 2,210,893 134,099 162,892 162,628 7,913
平成23年 1~3月 (Q1) 596,715 651,951 142,012 555,391 609,804 134,099 41,324 42,147 7,9134~6 (Q2) 431,576 422,786 150,802 391,028 383,197 141,930 40,548 39,589 8,8727~9 (Q3) 565,300 535,524 180,578 524,327 494,001 172,256 40,973 41,523 8,322
10~12 (Q4) 705,975 660,845 225,708 657,713 614,952 215,017 48,262 45,893 10,691
平成23年 1月 (Jan) 189,788 196,060 190,976 176,867 182,917 182,462 12,921 13,143 8,5142 (Feb) 213,506 211,950 192,532 200,397 198,437 184,422 13,109 13,513 8,1103 (Mar) 193,421 243,941 142,012 178,127 228,450 134,099 15,294 15,491 7,9134 (Apr) 131,729 121,252 152,489 118,412 107,412 145,099 13,317 13,840 7,3905 (May) 146,008 133,630 164,867 132,150 120,756 156,493 13,858 12,874 8,3746 (Jun) 153,839 167,904 150,802 140,466 155,029 141,930 13,373 12,875 8,872
7 (Jul) 179,845 149,116 181,531 166,752 135,353 173,329 13,093 13,763 8,2028 (Aug) 190,488 174,151 197,868 177,624 161,634 189,319 12,864 12,517 8,5499 (Sep) 194,967 212,257 180,578 179,951 197,014 172,256 15,016 15,243 8,322
10 (Oct) 235,790 168,840 247,528 219,258 153,118 238,396 16,532 15,722 9,13211 (Nov) 214,280 227,676 234,132 198,979 212,766 224,609 15,301 14,910 9,52312 (Dec) 255,905 264,329 225,708 239,476 249,068 215,017 16,429 15,261 10,691
年 月Year and Month
鋼 管 Steel pipes and tubes
計Total
熱 間Hot-steel pipes and tubes
冷けんCold-drawn pipes and tubes
出 荷Shipments
在 庫Inventory
生 産Production
出 荷Shipments
在 庫Inventory
生 産Production
出 荷Shipments
在 庫Inventory
生 産Production
101

時系列表 (鉄鋼編) 製品
1. 製品 Products
(14) 終鋼材 Finished steel
④ 特殊鋼(鋼種別・生産) Special steel (by kind of steel/production) (単位:t、 Unit: t)
平成19年 (2007) 20,403,633 268,386 124,510 125,067 15,730 3,079 9,007,882 5,117,575 3,890,30720 (2008) 20,593,890 254,113 104,927 127,794 17,638 3,754 9,148,984 5,137,090 4,011,89421 (2009) 12,390,712 106,937 48,471 51,206 6,469 791 5,020,209 2,842,245 2,177,96422 (2010) 19,326,626 202,341 85,817 103,799 12,634 91 8,281,045 4,671,675 3,609,37023 (2011) 19,202,966 198,879 79,431 103,027 16,318 103 8,345,522 4,606,203 3,739,319
平成21年度 (09FY) 14,686,696 126,399 58,454 60,727 7,093 125 6,067,030 3,488,701 2,578,32922 (10FY) 19,755,664 211,442 90,566 107,028 13,786 62 8,496,715 4,765,055 3,731,660
平成23年 1~3月 (Q1) 4,980,499 52,729 23,050 25,845 3,811 23 2,123,850 1,182,556 941,2944~6 (Q2) 4,345,239 52,148 21,791 26,234 4,089 34 1,874,102 1,021,281 852,8217~9 (Q3) 4,769,253 50,514 20,631 25,651 4,221 11 2,066,662 1,134,054 932,608
10~12 (Q4) 5,107,975 43,488 13,959 25,297 4,197 35 2,280,908 1,268,312 1,012,596
平成23年 1月 (Jan) 1,713,030 19,060 9,399 8,412 1,245 4 722,824 414,705 308,1192 (Feb) 1,624,101 16,177 6,710 8,260 1,203 4 695,150 382,873 312,2773 (Mar) 1,643,368 17,492 6,941 9,173 1,363 15 705,876 384,978 320,8984 (Apr) 1,393,296 18,726 8,605 8,770 1,322 29 611,659 336,400 275,2595 (May) 1,417,804 15,409 5,545 8,505 1,354 5 603,378 325,373 278,0056 (Jun) 1,534,139 18,013 7,641 8,959 1,413 - 659,065 359,508 299,557
7 (Jul) 1,532,348 17,965 8,004 8,510 1,449 2 678,858 355,235 323,6238 (Aug) 1,580,743 15,812 6,255 8,259 1,298 - 674,998 382,338 292,6609 (Sep) 1,656,162 16,737 6,372 8,882 1,474 9 712,806 396,481 316,325
10 (Oct) 1,755,489 15,638 5,659 8,518 1,451 10 767,065 435,305 331,76011 (Nov) 1,709,652 13,624 3,640 8,596 1,374 14 766,738 421,791 344,94712 (Dec) 1,642,834 14,226 4,660 8,183 1,372 11 747,105 411,216 335,889
(単位:t Unit: t)
年 月Year and Month
合 計Grand total
工 具 鋼 Tool steel 構造用鋼 Structural steel
計 Total
炭素工具鋼Carbon
tool steel
合金工具鋼Alloy
tool steel
高速度工具鋼
High-speedtool steel
その他の工具鋼Other
tool steels
計Total
機械構造用炭素鋼
Carbon steelfor machinestructure
構造用合金鋼Alloy steel for
structure
102
(単位:t、 Unit: t)
平成19年 (2007) 11,127,365 506,430 901,395 3,122,056 986,317 720,635 4,778,160 112,37220 (2008) 11,190,793 510,729 1,024,015 2,874,758 917,504 789,847 4,969,505 104,43521 (2009) 7,263,566 290,660 538,707 2,074,576 525,260 532,406 3,226,947 75,01022 (2010) 10,843,240 435,440 974,393 2,779,922 808,822 750,185 5,008,242 86,23623 (2011) 10,658,565 428,852 1,091,504 2,678,944 744,239 751,709 4,880,982 82,335
平成21年度 (09FY) 8,493,267 357,658 672,288 2,386,623 654,046 599,639 3,744,138 78,87522 (10FY) 11,047,507 434,723 1,020,527 2,830,173 808,954 774,769 5,093,701 84,660
平成23年 1~3月 (Q1) 2,803,920 105,598 268,338 708,232 205,089 199,914 1,295,697 21,0524~6 (Q2) 2,418,989 85,698 277,694 669,717 146,367 203,111 1,018,862 17,5407~9 (Q3) 2,652,077 116,752 258,366 679,518 195,018 193,287 1,186,667 22,469
10~12 (Q4) 2,783,579 120,804 287,106 621,477 197,765 155,397 1,379,756 21,274
平成23年 1月 (Jan) 971,146 31,518 86,171 240,799 67,302 75,647 461,780 7,9292 (Feb) 912,774 39,681 87,695 242,820 73,559 65,704 395,227 8,0883 (Mar) 920,000 34,399 94,472 224,613 64,228 58,563 438,690 5,0354 (Apr) 762,911 28,469 87,870 220,139 40,384 70,097 311,376 4,5765 (May) 799,017 27,380 95,317 222,991 44,204 71,831 330,963 6,3316 (Jun) 857,061 29,849 94,507 226,587 61,779 61,183 376,523 6,633
7 (Jul) 835,525 35,657 89,281 224,388 65,285 68,519 345,205 7,1908 (Aug) 889,933 39,401 74,857 227,842 64,145 58,910 418,597 6,1819 (Sep) 926,619 41,694 94,228 227,288 65,588 65,858 422,865 9,098
10 (Oct) 972,786 40,325 92,847 229,748 69,019 57,939 476,513 6,39511 (Nov) 929,290 37,553 97,767 200,246 65,182 53,659 466,377 8,50612 (Dec) 881,503 42,926 96,492 191,483 63,564 43,799 436,866 6,373
注:その他の特殊用途鋼には耐熱鋼、高マンガン鋼が含まれる。なお、平成19年よりステンレス鋼の定義変更に伴い耐熱鋼の一部がステンレス鋼に移動したため、平成18年以前は不連続となっている。
Note: Other Steel for Special Purposes includes heat-resisting and high-manganese steel. In addition, because classifications for steel categories changed in 2007,
and some categories of heat-resisting steel have been moved to the Stainless Steel category this category has been discontinued since 2006.
年 月Year and Month
特 殊 用 途 鋼 Steel for special purposes
計 Total
ばね鋼Spring steel
軸受鋼Bearingsteel
ステンレス鋼
Stainlesssteel
快削鋼Free-
cutting steel
ピアノ線材Piano wire
rods
高抗張力鋼High-tensile-strength steel
その他の特殊用途鋼Other steelfor specialpurposes
102

時系列表 (鉄鋼編) 原材料
2. 原材料 Raw materials (1) 鉄くず Iron and steel scrap
① 銑くず Pig iron scrap(単位:t、Unit: t)
平成19年 (2007) 794,429 446,381 1,166,456 1,137,824 4,600 73320 (2008) 837,266 448,639 1,236,813 1,199,793 7,707 72221 (2009) 595,483 366,701 878,562 846,938 5,927 55522 (2010) 676,581 371,579 984,963 940,127 27,743 71423 (2011) 584,939 415,370 901,332 834,225 16,825 844
平成21年度 (09FY) 644,504 378,827 948,719 918,754 10,638 58022 (10FY) 662,030 354,605 951,350 909,853 24,887 762
平成23年 1~3月 (Q1) 154,434 83,531 219,689 214,400 1,855 2084~6 (Q2) 139,626 111,045 219,073 200,976 4,138 2147~9 (Q3) 137,759 114,167 226,236 204,364 5,977 206
10~12 (Q4) 153,120 106,627 236,334 214,485 4,855 216
平成23年 1月 (Jan) 46,896 29,327 74,724 72,882 849 482 (Feb) 54,984 25,033 70,886 69,054 131 753 (Mar) 52,554 29,171 74,079 72,464 875 854 (Apr) 46,498 34,636 71,291 67,615 2,802 735 (May) 44,774 32,605 70,020 64,216 511 806 (Jun) 48,354 43,804 77,762 69,145 825 61
7 (Jul) 44,527 40,264 77,455 69,364 1,777 638 (Aug) 46,332 38,071 71,467 64,418 2,374 599 (Sep) 46,900 35,832 77,314 70,582 1,826 84
10 (Oct) 55,302 34,324 81,493 74,863 2,132 7011 (Nov) 48,596 34,131 79,300 71,835 2,155 7812 (Dec) 49,222 38,172 75,541 67,787 568 68
受 入Receipts
発 生Generation
消 費 Consumption
計Total
鉄鋼部門消費 Consumption by iron and steel
小 計Sub-total
製銑用(高炉)For iron-making
フェロアロイ用For ferro-alloys
年 月Year and Month
103
(単位:t、Unit: t)
平成19年 (2007) 1,056,420 328,267 728,153 75,845 226 28,632 251,16920 (2008) 1,116,361 388,077 728,284 74,880 123 37,020 243,83821 (2009) 777,893 275,274 502,619 62,351 212 31,624 219,38422 (2010) 862,804 299,843 562,961 48,689 177 44,836 196,35223 (2011) 769,250 267,854 501,396 47,243 63 67,107 231,526
平成21年度 (09FY) 851,386 313,945 537,441 55,905 245 29,965 217,73322 (10FY) 834,078 281,942 552,136 50,007 119 41,497 200,186
平成23年 1~3月 (Q1) 201,163 71,946 129,217 11,167 7 5,289 200,1864~6 (Q2) 183,789 64,553 119,236 12,828 7 18,097 213,7417~9 (Q3) 187,978 70,924 117,054 10,178 25 21,872 225,804
10~12 (Q4) 196,320 60,431 135,889 13,070 24 21,849 231,526
平成23年 1月 (Jan) 68,387 26,335 42,052 3,591 7 1,842 192,2562 (Feb) 65,264 20,090 45,174 3,584 0 1,832 195,4933 (Mar) 67,512 25,521 41,991 3,992 0 1,615 200,1864 (Apr) 60,575 21,324 39,251 4,165 0 3,676 202,9115 (May) 59,574 20,764 38,810 4,051 0 5,804 204,8616 (Jun) 63,640 22,465 41,175 4,612 7 8,617 213,741
7 (Jul) 63,959 24,462 39,497 3,548 17 8,091 215,6728 (Aug) 59,048 23,860 35,188 2,929 8 7,049 224,7669 (Sep) 64,971 22,602 42,369 3,701 0 6,732 225,804
10 (Oct) 68,440 22,750 45,690 4,221 0 6,630 229,06511 (Nov) 65,089 17,700 47,389 4,489 24 7,465 226,16912 (Dec) 62,791 19,981 42,810 4,360 0 7,754 231,526
年 月Year and Month
消 費 Consumption
在 庫Inventory
小 計Sub-total
転 炉LD converters
製鋼用 For steel-making鋳 鉄 管 用For cast iron
pipes and tubes
その他Others電 気 炉
Electric furnaces
鉄鋼部門消費 Consumption by iron and steel sections
その他 Others
103103

時系列表 (鉄鋼編) 原材料
2. 原材料 Raw materials (1) 鉄くず Iron and steel scrap
② 鋼くず Steel scrap(単位:t、Unit: t)
溶解用 For melting
平成19年 (2007) 35,369,263 12,291,298 45,033,253 43,838,306 30,09020 (2008) 35,817,981 12,497,958 45,605,984 44,444,807 193,21521 (2009) 21,820,780 9,095,297 30,224,821 29,670,916 146,12222 (2010) 29,187,883 11,470,969 38,957,224 38,431,907 441,13523 (2011) 28,581,077 11,396,107 37,657,526 37,270,143 371,543
平成21年度 (09FY) 24,248,643 9,733,653 33,668,708 33,088,860 237,31322 (10FY) 30,000,711 11,594,780 39,515,949 39,049,322 448,609
平成23年 1~3月 (Q1) 7,414,910 2,898,896 9,719,047 9,624,436 120,1064~6 (Q2) 7,205,244 2,762,878 9,573,446 9,470,091 70,7927~9 (Q3) 6,856,495 2,874,308 9,137,627 9,044,830 114,300
10~12 (Q4) 7,104,428 2,860,025 9,227,406 9,130,786 66,345
平成23年 1月 (Jan) 2,223,666 973,345 3,253,947 3,221,734 52,2622 (Feb) 2,465,080 930,575 3,186,944 3,158,684 29,8443 (Mar) 2,726,164 994,976 3,278,156 3,244,018 38,0004 (Apr) 2,544,660 889,701 3,184,777 3,149,330 17,6075 (May) 2,279,673 920,828 3,202,187 3,176,767 12,5996 (Jun) 2,380,911 952,349 3,186,482 3,143,994 40,586
7 (Jul) 2,383,712 944,361 3,074,323 3,042,965 32,1188 (Aug) 2,190,249 972,238 2,918,789 2,889,577 50,0389 (Sep) 2,282,534 957,709 3,144,515 3,112,288 32,144
10 (Oct) 2,668,308 987,851 3,320,348 3,284,403 41,69311 (Nov) 2,170,604 945,119 3,052,040 3,018,641 16,61712 (Dec) 2,265,516 927,055 2,855,018 2,827,742 8,035
*:再生用発生品を含む。
年 月Year and Month
計Total
鉄鋼部門消費 Consumption by iron and steel sections
*:Including generation for reclaimed
*受 入 Receipts
小 計Sub-total 製 銑 用
For iron-making
発 生Generation
消 費 Consumption
104
(単位:t、Unit: t)
平成19年 (2007) 43,325,844 381,968 100,404 1,194,947 3,074,40220 (2008) 43,720,280 437,016 94,296 1,161,177 3,864,21621 (2009) 29,028,132 434,065 62,597 553,905 2,987,89622 (2010) 37,546,234 371,894 72,644 525,317 2,755,78023 (2011) 36,477,056 359,110 62,434 387,383 3,418,335
平成21年度 (09FY) 32,382,964 401,429 67,154 579,848 2,682,72722 (10FY) 38,153,715 376,006 70,992 466,627 2,942,801
平成23年 1~3月 (Q1) 9,407,143 79,675 17,512 94,611 2,942,8014~6 (Q2) 9,288,815 94,511 15,973 103,355 2,912,0407~9 (Q3) 8,830,763 85,860 13,907 92,797 3,093,762
10~12 (Q4) 8,950,335 99,064 15,042 96,620 3,418,335
平成23年 1月 (Jan) 3,135,758 28,556 5,158 32,213 2,551,2662 (Feb) 3,097,197 25,753 5,890 28,260 2,615,3023 (Mar) 3,174,188 25,366 6,464 34,138 2,942,8014 (Apr) 3,093,977 30,917 6,829 35,447 3,039,9795 (May) 3,128,609 30,052 5,507 25,420 2,905,8356 (Jun) 3,066,229 33,542 3,637 42,488 2,912,040
7 (Jul) 2,977,380 29,366 4,101 31,358 3,034,1118 (Aug) 2,810,349 24,924 4,266 29,212 3,140,6959 (Sep) 3,043,034 31,570 5,540 32,227 3,093,762
10 (Oct) 3,204,771 32,451 5,488 35,945 3,283,36511 (Nov) 2,965,656 32,059 4,309 33,399 3,214,69112 (Dec) 2,779,908 34,554 5,245 27,276 3,418,335
*:再生用発生品を含む。*: Including generation for reclaimed
年 月Year and Month
消 費 Consumption
*在 庫 Inventory
溶解用 For melting
*再 生 用 For reclaimed
鉄鋼部門消費 Consumption by iron and steel sections
その他 Others製 鋼 用
For steel-makingそ の 他
Others
104104

時系列表 (鉄鋼編) 原材料
2. 原材料 Raw materials (1) 鉄くず Iron and steel scrap
② 鋼くず Steel scrap ア) 溶解用鋼くず Steel scrap for melting (単位:t、Unit: t)
平成19年 (2007) 35,269,995 12,291,298 44,932,849 43,737,902 30,090 3,72720 (2008) 35,726,331 12,497,958 45,511,688 44,350,511 193,215 3,88821 (2009) 21,760,353 9,095,297 30,162,224 29,608,319 146,122 3,62422 (2010) 29,116,665 11,470,969 38,884,580 38,359,263 441,135 5,89323 (2011) 28,516,241 11,396,107 37,595,092 37,207,709 371,543 9,850
平成21年度 (09FY) 24,181,134 9,733,653 33,601,554 33,021,706 237,313 3,87422 (10FY) 29,933,160 11,594,780 39,444,957 38,978,330 448,609 8,098
平成23年 1~3月 (Q1) 7,395,735 2,898,896 9,701,535 9,606,924 120,106 2,9754~6 (Q2) 7,187,033 2,762,878 9,557,473 9,454,118 70,792 2,7127~9 (Q3) 6,844,487 2,874,308 9,123,720 9,030,923 114,300 1,734
10~12 (Q4) 7,088,986 2,860,025 9,212,364 9,115,744 66,345 2,429
平成23年 1月 (Jan) 2,218,061 973,345 3,248,789 3,216,576 52,262 1,0072 (Feb) 2,458,652 930,575 3,181,054 3,152,794 29,844 8393 (Mar) 2,719,022 994,976 3,271,692 3,237,554 38,000 1,1294 (Apr) 2,537,043 889,701 3,177,948 3,142,501 17,607 8125 (May) 2,272,463 920,828 3,196,680 3,171,260 12,599 1,0376 (Jun) 2,377,527 952,349 3,182,845 3,140,357 40,586 863
7 (Jul) 2,380,539 944,361 3,070,222 3,038,864 32,118 7368 (Aug) 2,187,081 972,238 2,914,523 2,885,311 50,038 4139 (Sep) 2,276,867 957,709 3,138,975 3,106,748 32,144 585
10 (Oct) 2,662,823 987,851 3,314,860 3,278,915 41,693 1,01411 (Nov) 2,166,462 945,119 3,047,731 3,014,332 16,617 83212 (Dec) 2,259,701 927,055 2,849,773 2,822,497 8,035 583
消 費 Consumption
発 生Generation 小 計
Sub-total
計Total
年 月Year and Month
受 入Receipts
鉄鋼部門消費 Consumption by iron and steel
製銑用(高炉)For iron-making
フェロアロイ用For ferro-alloys
105
(単位:t、Unit: t)
平成19年 (2007) 43,325,844 12,063,106 31,262,738 349,120 29,121 1,194,947 3,060,63820 (2008) 43,720,280 13,743,587 29,976,693 381,941 51,187 1,161,177 3,852,89521 (2009) 29,028,132 9,612,281 19,415,851 352,134 78,307 553,905 2,978,55322 (2010) 37,546,234 13,238,517 24,307,717 273,778 92,223 525,317 2,747,26323 (2011) 36,477,056 10,953,335 25,523,721 262,902 86,358 387,383 3,407,695
平成21年度 (09FY) 32,382,964 11,446,143 20,936,821 321,031 76,524 579,848 2,669,70622 (10FY) 38,153,715 13,124,541 25,029,174 272,790 95,118 466,627 2,932,623
平成23年 1~3月 (Q1) 9,407,143 3,236,522 6,170,621 54,353 22,347 94,611 2,932,6234~6 (Q2) 9,288,815 2,736,333 6,552,482 70,026 21,773 103,355 2,899,8247~9 (Q3) 8,830,763 2,778,131 6,052,632 62,403 21,723 92,797 3,083,445
10~12 (Q4) 8,950,335 2,202,349 6,747,986 76,120 20,515 96,620 3,407,695
平成23年 1月 (Jan) 3,135,758 1,120,774 2,014,984 18,972 8,577 32,213 2,542,3042 (Feb) 3,097,197 1,033,564 2,063,633 17,524 7,390 28,260 2,605,8023 (Mar) 3,174,188 1,082,184 2,092,004 17,857 6,380 34,138 2,932,6234 (Apr) 3,093,977 937,253 2,156,724 22,276 7,829 35,447 3,029,0135 (May) 3,128,609 852,060 2,276,549 21,414 7,601 25,420 2,893,3666 (Jun) 3,066,229 947,020 2,119,209 26,336 6,343 42,488 2,899,824
7 (Jul) 2,977,380 971,795 2,005,585 20,624 8,006 31,358 3,022,8238 (Aug) 2,810,349 908,342 1,902,007 16,887 7,624 29,212 3,130,5109 (Sep) 3,043,034 897,994 2,145,040 24,892 6,093 32,227 3,083,445
10 (Oct) 3,204,771 861,111 2,343,660 24,750 6,687 35,945 3,273,05111 (Nov) 2,965,656 696,291 2,269,365 25,797 5,430 33,399 3,204,54512 (Dec) 2,779,908 644,947 2,134,961 25,573 8,398 27,276 3,407,695
在 庫Inventory
製鋼用 For steel-making鋳鉄管用
For cast iron pipes and tubes
その他Others
鉄鋼部門消費 Consumption by iron and steel sections
その他 Others年 月
Year and Month
消 費 Consumption
小 計Sub-total
転 炉LD converters
電 気 炉Electricfurnaces
105105
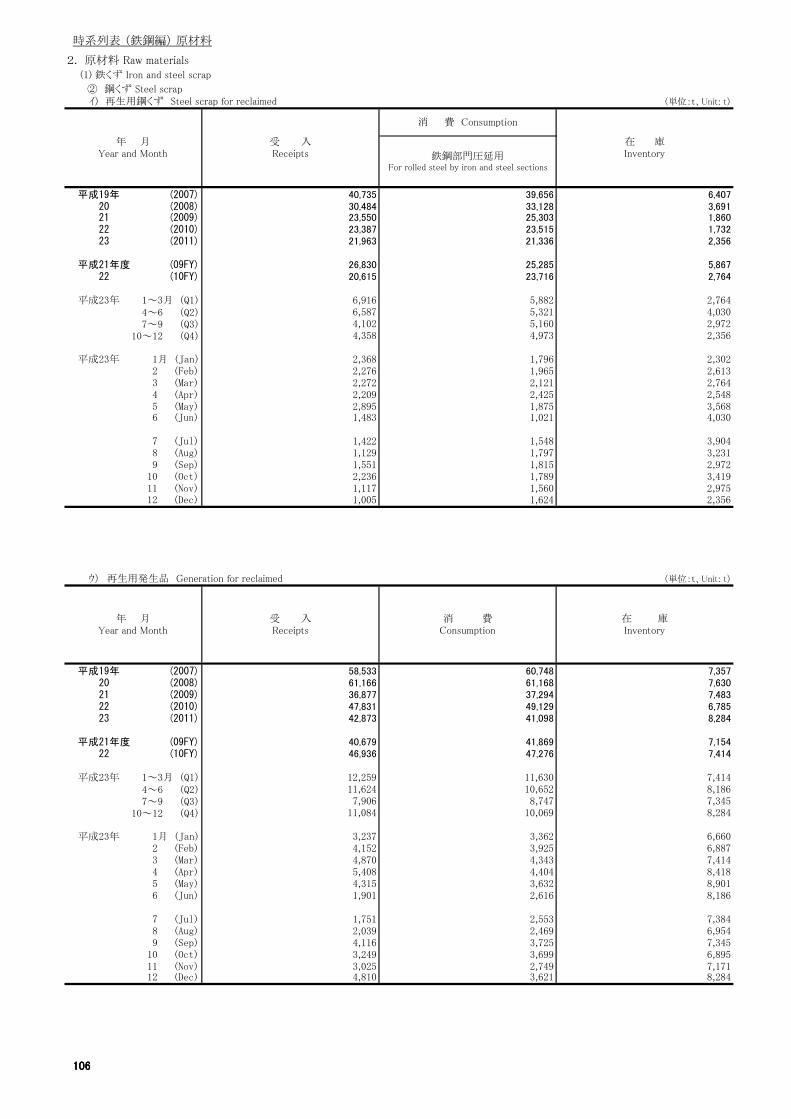
時系列表 (鉄鋼編) 原材料
2. 原材料 Raw materials (1) 鉄くず Iron and steel scrap
② 鋼くず Steel scrap イ) 再生用鋼くず Steel scrap for reclaimed (単位:t、Unit: t)
平成19年 (2007) 40,735 39,656 6,40720 (2008) 30,484 33,128 3,69121 (2009) 23,550 25,303 1,86022 (2010) 23,387 23,515 1,73223 (2011) 21,963 21,336 2,356
平成21年度 (09FY) 26,830 25,285 5,86722 (10FY) 20,615 23,716 2,764
平成23年 1~3月 (Q1) 6,916 5,882 2,7644~6 (Q2) 6,587 5,321 4,0307~9 (Q3) 4,102 5,160 2,972
10~12 (Q4) 4,358 4,973 2,356
平成23年 1月 (Jan) 2,368 1,796 2,3022 (Feb) 2,276 1,965 2,6133 (Mar) 2,272 2,121 2,7644 (Apr) 2,209 2,425 2,5485 (May) 2,895 1,875 3,5686 (Jun) 1,483 1,021 4,030
7 (Jul) 1,422 1,548 3,9048 (Aug) 1,129 1,797 3,2319 (Sep) 1,551 1,815 2,972
10 (Oct) 2,236 1,789 3,41911 (Nov) 1,117 1,560 2,97512 (Dec) 1,005 1,624 2,356
在 庫Inventory
年 月Year and Month
受 入Receipts
消 費 Consumption
鉄鋼部門圧延用For rolled steel by iron and steel sections
106
ウ) 再生用発生品 Generation for reclaimed (単位:t、Unit: t)
平成19年 (2007) 58,533 60,748 7,35720 (2008) 61,166 61,168 7,63021 (2009) 36,877 37,294 7,48322 (2010) 47,831 49,129 6,78523 (2011) 42,873 41,098 8,284
平成21年度 (09FY) 40,679 41,869 7,15422 (10FY) 46,936 47,276 7,414
平成23年 1~3月 (Q1) 12,259 11,630 7,4144~6 (Q2) 11,624 10,652 8,1867~9 (Q3) 7,906 8,747 7,345
10~12 (Q4) 11,084 10,069 8,284
平成23年 1月 (Jan) 3,237 3,362 6,6602 (Feb) 4,152 3,925 6,8873 (Mar) 4,870 4,343 7,4144 (Apr) 5,408 4,404 8,4185 (May) 4,315 3,632 8,9016 (Jun) 1,901 2,616 8,186
7 (Jul) 1,751 2,553 7,3848 (Aug) 2,039 2,469 6,9549 (Sep) 4,116 3,725 7,345
10 (Oct) 3,249 3,699 6,89511 (Nov) 3,025 2,749 7,17112 (Dec) 4,810 3,621 8,284
年 月Year and Month
受 入Receipts
消 費Consumption
在 庫Inventory
106106

時系列表 (鉄鋼編) 生産能力
3. 生産能力 Production capacity
平成19年末 (2007) 30 85,511,842 28 84,885,342 2 626,500
20 (2008) 31 86,814,053 28 85,687,553 3 1,126,500
21 (2009) 31 89,959,144 28 88,832,644 3 1,126,500
22 (2010) 31 90,924,972 28 89,798,472 3 1,126,500
23 (2011) 31 91,782,633 28 90,656,133 3 1,126,500
平成23年 1月 (Jan) 31 90,924,972 28 89,798,472 3 1,126,500
2 (Feb) 31 90,924,972 28 89,798,472 3 1,126,500
3 (Mar) 31 90,924,972 28 89,798,472 3 1,126,500
4 (Apr) 31 90,924,972 28 89,798,472 3 1,126,500
5 (May) 31 91,782,633 28 90,656,133 3 1,126,500
6 (Jun) 31 91,782,633 28 90,656,133 3 1,126,500
7 (Jul) 31 91,782,633 28 90,656,133 3 1,126,500
8 (Aug) 31 91,782,633 28 90,656,133 3 1,126,500
9 (Sep) 31 91,782,633 28 90,656,133 3 1,126,500
10 (Oct) 31 91,782,633 28 90,656,133 3 1,126,500
11 (Nov) 31 91,782,633 28 90,656,133 3 1,126,500
12 (Dec) 31 91,782,633 28 90,656,133 3 1,126,500
能 力 Capacity 基 数 Number
(能力:t/年、 Capacity: t/Year)
年 月Year and Month
製銑設備 Iron manufacturing
能 力 Capacity
(能力:t/年、 Capacity: t/Year)
計 Total 高 炉 Blast furnaces その他の炉 Other furnaces
基 数 Number 能 力 Capacity 基 数 Number
107
平成19年末 (2007) 410 129,628,051 64 89,506,081 346 40,121,970
20 (2008) 408 129,833,724 64 89,511,522 344 40,322,202
21 (2009) 406 129,886,085 64 89,511,522 342 40,374,563
22 (2010) 411 132,443,058 64 89,511,522 347 42,931,536
23 (2011) 412 132,447,397 64 89,511,522 348 42,935,875
平成23年 1月 (Jan) 411 132,443,058 64 89,511,522 347 42,931,536
2 (Feb) 411 132,443,058 64 89,511,522 347 42,931,536
3 (Mar) 411 132,443,058 64 89,511,522 347 42,931,536
4 (Apr) 412 132,447,397 64 89,511,522 348 42,935,875
5 (May) 412 132,447,397 64 89,511,522 348 42,935,875
6 (Jun) 412 132,447,397 64 89,511,522 348 42,935,875
7 (Jul) 412 132,447,397 64 89,511,522 348 42,935,875
8 (Aug) 412 132,447,397 64 89,511,522 348 42,935,875
9 (Sep) 412 132,447,397 64 89,511,522 348 42,935,875
10 (Oct) 412 132,447,397 64 89,511,522 348 42,935,875
11 (Nov) 412 132,447,397 64 89,511,522 348 42,935,875
12 (Dec) 412 132,447,397 64 89,511,522 348 42,935,875
(能力:t/年、 Capacity: t/Year)
年 月Year and Month
製鋼設備 Steel manufacturing
能 力 Capacity
計 Total 転 炉 LD converters 電気炉 Electric furnaces
基 数 Number 能 力 Capacity 基 数 Number 能 力 Capacity 基 数 Number
107

時系列表 (鉄鋼編) 労務
4. 労務 Labor (1) 月末従事者数 Number of persons engaged at the end of month (単位:人、 Unit: persons)
平成19年末 (2007) 159,151 99,266 14,559 45,326
20 (2008) 162,350 101,219 14,159 46,972
21 (2009) 159,200 100,518 13,449 45,233
22 (2010) 159,005 100,055 13,461 45,489
23 (2011) 159,926 100,190 13,309 46,427
平成23年 1月 (Jan) 158,731 99,683 13,327 45,721
2 (Feb) 158,615 99,681 13,294 45,640
3 (Mar) 158,704 99,758 13,412 45,534
4 (Apr) 161,391 101,498 13,444 46,449
5 (May) 162,018 101,572 13,448 46,998
6 (Jun) 161,930 101,522 13,445 46,963
7 (Jul) 161,529 101,258 13,395 46,876
8 (Aug) 161,331 101,157 13,344 46,830
9 (Sep) 161,010 100,959 13,320 46,731
10 (Oct) 160,215 100,422 13,357 46,436
11 (Nov) 160,224 100,396 13,350 46,478
12 (Dec) 159,926 100,190 13,309 46,427
(2) 業態別月末従事者数(平成23年12月末) Number of persons engaged at the end of month by business (End of December, 2011)
(単位:人、 Unit: persons)
鉄鋼加工製品部門Iron and steel products
sections
その他の部門Other sections
年 月Year and Month
計Total
鉄鋼部門Iron and steel sections
108
(単位:人、 Unit: persons)
13,309 444 - 12,865
注:業態別区分は次のとおりである。 ① 高炉メーカー:高炉が稼働している会社
② 電炉メーカー:圧延用鋼塊を生産し、圧延設備が稼働している高炉メーカー以外の会社
③ その他のメーカー:高炉、電炉メーカー以外の会社
Notes: Enterprises are divided into the following categories by type of operation.
① Manufacturers with blast furnaces: companies that operate blast furnaces.
② Manufacturers with electric furnaces: companies that produce steel ingots for metal rolling and operate metal rolling equipment.
③ Other Manufacturers: enterprises other than manufacturers with blast furnaces and manufacturers with electric furnaces.
電炉メーカーManufacturers withelectric furnaces
その他メーカーOther
manufacturers
区 分Classification
計Total
高炉メーカーManufacturers with
blast furnaces
計 Total 159,926 49,175 24,355 86,396
鉄鋼部門Iron and steel sections
100,190 45,495 21,197 33,498
鉄鋼加工部門Iron and steel products
sections
その他の部門Other sections
46,427 3,236 3,158 40,033
108

時系列表 (非鉄金属編) 製品
<非鉄金属編> Non-ferrous metals
1. 製 品 Products
(1) 非鉄金属 Non-ferrous metals
生 産 消 費 販 売 Sales 在 庫金額(百万円) その他
Production Consumption Value Others Inventory( million yen)
平成19年 (2007) 155,859,851 - 143,312,330 323,089 12,590,520 4,607,81420 (2008) 124,832,179 - 110,419,048 273,115 12,812,650 6,208,29521 (2009) 133,259,671 - 132,537,320 330,328 - 6,930,64722 (2010) 135,790,539 - 136,129,981 382,791 - 6,611,27123 (2011) 131,886,688 4,468 130,291,983 477,610 6,000 8,194,790
平成21年度 (09FY) 137,281,796 - 136,122,550 352,011 - 5,348,08122 (10FY) 133,748,410 - 131,251,788 381,078 - 7,864,051
平成23年 1~3月 (Q1) 32,933,181 - 31,679,683 96,182 - 7,864,0514~6 (Q2) 31,934,920 - 34,408,054 116,879 - 5,390,9177~9 (Q3) 31,317,241 - 31,359,226 130,129 - 5,348,932
10~12 (Q4) 35,701,346 4,468 32,845,020 134,420 6,000 8,194,790
平成23年 1月 (Jan) 11,033,205 - 11,540,056 34,434 - 6,104,4182 (Feb) 10,762,125 - 9,739,609 28,045 - 7,126,9343 (Mar) 11,137,851 - 10,400,018 33,703 - 7,864,0514 (Apr) 10,570,003 - 10,472,298 33,240 - 7,961,7565 (May) 10,673,152 - 11,549,016 41,135 - 7,085,8916 (Jun) 10,691,765 - 12,386,740 42,504 - 5,390,917
7 (Jul) 10,003,900 - 9,264,569 36,381 - 6,130,2488 (Aug) 10,237,304 - 10,757,872 45,471 - 5,609,6809 (Sep) 11,076,037 - 11,336,785 48,277 - 5,348,932
10 (Oct) 12,630,172 4,000 10,491,404 42,464 - 7,483,70011 (Nov) 11,705,671 - 11,300,446 47,254 - 7,888,92512 (Dec) 11,365,503 468 11,053,170 44,702 6,000 8,194,790
注:平成21年1月から出荷に係る記入方法の変更をしたことから、それ以前と不連続が生じています。
数 量Quantity
出 荷 Shipments年 月
Year and Month
① 電 気 金 (g) Electrolytic gold
109
生 産 消 費 販 売 Sales 在 庫金額(百万円) その他
Production Consumption Value Others Inventory( million yen)
平成19年 (2007) 2,258,009 70,764 1,922,159 88,136 263,631 114,04620 (2008) 2,042,604 73,189 1,602,057 73,754 309,526 171,87321 (2009) 1,865,936 - 1,906,956 76,864 - 130,85322 (2010) 1,898,208 4,832 1,917,256 97,598 - 106,97623 (2011) 1,724,218 1,068 1,685,965 143,115 - 143,951
平成21年度 (09FY) 1,875,697 - 1,845,265 79,475 - 149,77322 (10FY) 1,816,721 5,900 1,880,093 107,988 - 80,501
平成23年 1~3月 (Q1) 399,783 1,068 425,188 31,492 - 80,5014~6 (Q2) 409,054 - 405,309 36,213 - 84,0387~9 (Q3) 441,805 - 419,975 39,724 - 105,869
10~12 (Q4) 473,576 - 435,493 35,686 - 143,951
平成23年 1月 (Jan) 148,053 384 156,745 10,532 - 97,8992 (Feb) 138,095 684 125,120 8,949 - 110,1903 (Mar) 113,635 - 143,323 12,011 - 80,5014 (Apr) 99,422 - 96,124 8,923 - 83,5905 (May) 159,505 - 160,492 14,629 - 82,6046 (Jun) 150,127 - 148,693 12,661 - 84,038
7 (Jul) 149,739 - 133,230 12,511 - 100,5478 (Aug) 159,028 - 141,740 13,841 - 117,8369 (Sep) 133,038 - 145,005 13,372 - 105,869
10 (Oct) 154,409 - 150,226 12,136 - 110,05211 (Nov) 145,330 - 144,076 12,167 - 111,30512 (Dec) 173,837 - 141,191 11,383 - 143,951
注:平成21年1月から出荷に係る記入方法の変更をしたことから、それ以前と不連続が生じています。
数 量Quantity
年 月Year and Month
② 電 気 銀 (kg) Electrolytic silver 出 荷 Shipments
109

時系列表 (非鉄金属編) 製品
(1) 非鉄金属 Non-ferrous metals
生 産 消 費 販 売 Sales 在 庫金額(百万円) その他
Production Consumption Value Others Inventory( million yen)
平成19年 (2007) 1,972,107 1,711,549 15,456 13,763 245,145 2,29820 (2008) 1,921,539 1,674,088 16,484 15,950 237,958 1,08021 (2009) 1,788,637 1,563,965 8,949 3,826 216,665 13822 (2010) 1,925,184 1,707,543 17,045 12,588 200,734 -23 (2011) 1,662,305 1,492,258 13,424 10,671 156,623 -
平成21年度 (09FY) 1,862,914 1,626,984 15,629 11,440 220,245 38222 (10FY) 1,872,027 1,696,614 1,416 1,148 174,379 -
平成23年 1~3月 (Q1) 449,120 419,123 - - 29,997 -4~6 (Q2) 393,928 344,436 12,035 9,742 37,457 -7~9 (Q3) 431,008 384,959 - - 46,049 -
10~12 (Q4) 388,249 343,740 1,389 929 43,120 -
平成23年 1月 (Jan) 172,065 157,297 - - 14,768 -2 (Feb) 137,616 126,710 - - 10,906 -3 (Mar) 139,439 135,116 - - 4,323 -4 (Apr) 104,865 96,517 - - 8,348 -5 (May) 149,591 130,490 4,857 3,918 14,244 -6 (Jun) 139,472 117,429 7,178 5,824 14,865 -
7 (Jul) 144,647 129,155 - - 15,492 -8 (Aug) 159,453 144,182 - - 15,271 -9 (Sep) 126,908 111,622 - - 15,286 -
10 (Oct) 115,136 101,844 - - 13,292 -11 (Nov) 114,208 99,622 - - 14,586 -12 (Dec) 158,905 142,274 1,389 929 15,242 -
数 量Quantity
出 荷 Shipments年 月
Year and Month
③ 粗 銅 (t) Blister copper
110
④ 電 気 銅 (t) Electrolytic copper
生 産 受 入 消 費 販 売 Sales 在 庫金額(百万円) その他
Production Receipts Consumption Value Others Inventory( million yen)
平成19年 (2007) 1,576,818 227,464 273,491 1,055,809 681,751 477,277 41,81220 (2008) 1,539,957 223,796 265,461 977,630 571,304 512,461 50,01121 (2009) 1,439,843 171,435 193,835 1,365,148 605,773 56,783 45,52222 (2010) 1,548,688 211,079 246,149 1,440,677 828,845 63,038 55,69623 (2011) 1,328,288 206,418 226,926 1,241,903 833,853 64,783 56,694
平成21年度 (09FY) 1,491,125 196,891 228,995 1,404,408 704,942 63,300 40,82022 (10FY) 1,500,131 204,553 237,878 1,384,900 832,705 61,010 61,888
平成23年 1~3月 (Q1) 343,958 45,979 54,373 314,854 215,292 14,419 61,8884~6 (Q2) 297,792 61,122 62,070 279,676 179,539 19,443 59,6147~9 (Q3) 335,592 50,037 54,775 300,704 218,968 16,142 73,621
10~12 (Q4) 350,946 49,280 55,708 346,669 220,054 14,779 56,694
平成23年 1月 (Jan) 127,657 14,622 18,184 97,365 66,981 4,882 77,5442 (Feb) 113,062 14,869 18,691 103,596 74,628 4,576 78,5133 (Mar) 103,239 16,488 17,498 113,893 73,683 4,961 61,8884 (Apr) 93,198 21,308 20,191 94,431 63,648 6,110 55,6605 (May) 104,624 19,827 20,574 91,547 57,593 7,149 60,8416 (Jun) 99,970 19,987 21,305 93,698 58,298 6,184 59,614
7 (Jul) 104,991 18,611 18,589 93,956 72,451 6,380 64,2928 (Aug) 114,544 15,203 17,535 95,916 70,046 4,896 75,6929 (Sep) 116,057 16,223 18,651 110,832 76,471 4,866 73,621
10 (Oct) 118,777 17,629 20,925 124,352 77,191 4,882 59,87011 (Nov) 112,763 16,613 18,489 114,476 73,278 5,003 51,27712 (Dec) 119,406 15,038 16,294 107,841 69,585 4,894 56,694
注:平成21年1月から出荷に係る記入方法の変更をしたことから、それ以前と不連続が生じています。
数 量Quantity
年 月Year and Month
出 荷 Shipments
110

時系列表 (非鉄金属編) 製品
(1) 非鉄金属 Non-ferrous metals
⑤ 銅 ケ ー ク Copper cake (t)
生 産 受 入 消 費 販 売 Sales 在 庫金額(百万円) その他
Production Receipts Consumption Value Others Inventory( million yen)
平成19年 (2007) 268,039 1,201 75,333 88,484 78,923 106,596 5,60020 (2008) 266,584 778 77,302 88,275 72,246 98,403 7,09821 (2009) 189,521 52 52,072 138,132 78,583 - 6,30022 (2010) 257,804 - 63,980 193,662 134,947 - 6,42223 (2011) 236,000 28 60,181 176,752 133,800 - 5,309
平成21年度 (09FY) 228,449 10 61,304 165,211 104,649 - 6,58322 (10FY) 251,719 12 64,524 189,209 138,149 - 4,580
平成23年 1~3月 (Q1) 58,169 12 15,653 44,370 37,411 - 4,5804~6 (Q2) 61,052 4 16,190 44,387 35,435 - 4,8517~9 (Q3) 61,128 8 14,006 46,358 34,910 - 5,623
10~12 (Q4) 55,651 4 14,332 41,637 26,044 - 5,309
平成23年 1月 (Jan) 19,761 4 4,755 14,521 12,140 - 6,9112 (Feb) 19,102 4 5,346 14,200 12,294 - 6,4713 (Mar) 19,306 4 5,552 15,649 12,977 - 4,5804 (Apr) 20,636 4 5,493 15,729 13,231 - 3,7895 (May) 20,052 - 5,791 13,664 10,574 - 4,3876 (Jun) 20,364 - 4,906 14,994 11,630 - 4,851
7 (Jul) 21,245 4 4,684 15,834 12,881 - 5,5828 (Aug) 19,696 4 4,652 14,888 11,115 - 5,7429 (Sep) 20,187 - 4,670 15,636 10,914 - 5,623
10 (Oct) 20,963 - 4,632 15,803 9,578 - 6,15111 (Nov) 18,914 - 5,197 14,366 9,135 - 5,50212 (Dec) 15,774 4 4,503 11,468 7,331 - 5,309
注:平成21年1月から出荷に係る記入方法の変更をしたことから、それ以前と不連続が生じています。
数 量Quantity
出 荷 Shipments年 月
Year and Month
111
⑥ 銅 ビ レ ッ ト Copper billets (t)
生 産 受 入 消 費 販 売 Sales 在 庫金額(百万円) その他
Production Receipts Consumption Value Others Inventory( million yen)
平成19年 (2007) 101,633 - 23,655 32,375 28,737 45,500 2,59120 (2008) 93,910 - 21,896 28,135 22,012 43,774 2,57221 (2009) 57,397 - 14,695 43,208 23,269 - 2,02922 (2010) 70,725 - 14,468 56,412 39,866 - 1,79323 (2011) 72,645 - 15,972 56,136 42,319 - 1,894
平成21年度 (09FY) 61,133 - 14,381 46,577 28,780 - 1,93222 (10FY) 71,086 - 15,148 56,211 41,504 - 1,223
平成23年 1~3月 (Q1) 16,120 - 3,781 12,474 10,546 - 1,2234~6 (Q2) 20,005 - 4,205 15,200 12,054 - 1,8237~9 (Q3) 17,840 - 3,971 14,103 10,718 - 1,589
10~12 (Q4) 18,680 - 4,015 14,359 9,001 - 1,894
平成23年 1月 (Jan) 4,771 - 1,271 3,213 2,687 - 1,6472 (Feb) 6,430 - 1,368 4,938 4,275 - 1,7693 (Mar) 4,919 - 1,142 4,323 3,584 - 1,2234 (Apr) 6,129 - 1,431 4,647 3,915 - 1,2745 (May) 6,208 - 1,435 5,232 4,011 - 8156 (Jun) 7,668 - 1,339 5,321 4,128 - 1,823
7 (Jul) 7,246 - 1,366 5,781 4,704 - 1,9228 (Aug) 5,433 - 1,271 4,169 3,115 - 1,9159 (Sep) 5,161 - 1,334 4,153 2,899 - 1,589
10 (Oct) 6,364 - 1,425 4,969 3,013 - 1,55911 (Nov) 6,503 - 1,248 5,097 3,241 - 1,71712 (Dec) 5,813 - 1,342 4,293 2,747 - 1,894
注:平成21年1月から出荷に係る記入方法の変更をしたことから、それ以前と不連続が生じています。
数 量Quantity
年 月Year and Month
出 荷 Shipments
111

時系列表 (非鉄金属編) 製品
(1) 非鉄金属 Non-ferrous metals
⑦ 粗 鉛(副産粗鉛を含む) Lead bullion (including crude lead sub-product) (t)
生 産 受 入 消 費 販 売 Sales 在 庫金額(百万円) その他
Production Receipts Consumption Value Others Inventory( million yen)
平成19年 (2007) 256,879 … 219,788 - - 39,894 2,41820 (2008) 276,291 … 233,899 - - 40,614 3,61521 (2009) 232,262 … 190,475 42,374 8,762 25 3,00322 (2010) 260,189 … 224,432 35,991 9,578 - 2,76923 (2011) 243,457 … 213,682 30,902 7,064 - 1,641
平成21年度 (09FY) 239,940 … 199,211 40,143 8,819 25 2,19522 (10FY) 257,617 … 223,330 33,343 9,444 - 3,139
平成23年 1~3月 (Q1) 55,791 … 49,224 6,197 1,643 - 3,1394~6 (Q2) 59,865 … 58,858 1,677 241 - 2,4697~9 (Q3) 69,108 … 56,201 12,301 2,982 - 3,074
10~12 (Q4) 58,693 … 49,399 10,727 2,198 - 1,641
平成23年 1月 (Jan) 23,420 … 19,865 3,915 1,040 - 2,4092 (Feb) 20,461 … 18,444 2,282 603 - 2,1443 (Mar) 11,910 … 10,915 - - - 3,1394 (Apr) 19,804 … 19,012 1,677 241 - 2,2545 (May) 19,907 … 20,009 - - - 2,1526 (Jun) 20,154 … 19,837 - - - 2,469
7 (Jul) 24,517 … 19,426 3,114 816 - 4,4468 (Aug) 23,282 … 19,033 4,336 1,028 - 4,3599 (Sep) 21,309 … 17,742 4,851 1,138 - 3,074
10 (Oct) 19,632 … 16,364 3,408 686 - 2,93411 (Nov) 18,249 … 16,100 3,445 703 - 1,63812 (Dec) 20,812 … 16,935 3,874 809 - 1,641
注:平成21年1月から出荷に係る記入方法の変更をしたことから、それ以前と不連続が生じています。
数 量Quantity
出 荷 Shipments年 月
Year and Month
112
⑧ 電 気 鉛 Electrolytic lead (t)
生 産 受 入 消 費 販 売 Sales 在 庫金額(百万円) その他
Production Receipts Consumption Value Others Inventory( million yen)
平成19年 (2007) 219,423 - 11,398 203,141 58,844 6,652 5,33920 (2008) 224,905 799 8,084 204,678 46,822 6,233 11,91521 (2009) 192,196 - 5,263 190,830 34,642 - 7,68122 (2010) 215,828 - 5,382 209,771 42,927 - 8,57523 (2011) 215,064 - 5,056 211,027 47,571 - 7,555
平成21年度 (09FY) 195,826 - 5,750 194,605 39,030 - 6,82422 (10FY) 216,108 - 4,853 213,354 44,124 - 4,831
平成23年 1~3月 (Q1) 48,327 - 895 51,175 11,427 - 4,8314~6 (Q2) 53,203 - 1,539 46,386 10,438 - 10,1087~9 (Q3) 56,006 - 1,237 53,992 12,256 - 10,887
10~12 (Q4) 57,528 - 1,385 59,474 13,450 - 7,555
平成23年 1月 (Jan) 19,729 - 178 18,844 4,219 - 9,2822 (Feb) 17,736 - 334 19,019 4,334 - 7,6653 (Mar) 10,862 - 383 13,312 2,874 - 4,8314 (Apr) 17,487 - 569 15,493 3,681 - 6,2565 (May) 18,861 - 545 14,370 3,128 - 10,2026 (Jun) 16,855 - 425 16,523 3,629 - 10,108
7 (Jul) 18,158 - 457 17,067 3,814 - 10,7438 (Aug) 19,343 - 451 16,990 3,471 - 12,6459 (Sep) 18,505 - 329 19,935 4,971 - 10,887
10 (Oct) 19,748 - 482 20,269 4,485 - 9,88311 (Nov) 18,957 - 453 20,508 4,625 - 7,87912 (Dec) 18,823 - 450 18,697 4,340 - 7,555
注:平成21年1月から出荷に係る記入方法の変更をしたことから、それ以前と不連続が生じています。
数 量Quantity
年 月Year and Month
出 荷 Shipments
112

時系列表 (非鉄金属編) 製品
(1) 非鉄金属 Non-ferrous metals
⑨ 亜 鉛 計 Zinc total (ア ~ イ) (t)
生 産 受 入 消 費 販 売 Sales 在 庫金額(百万円) その他
Production Receipts Consumption Value Others Inventory( million yen)
平成19年 (2007) 597,650 - 74,027 216,500 70,456 312,826 17,76520 (2008) 615,533 - 75,317 221,682 47,361 310,100 26,19221 (2009) 540,604 - - 544,292 83,145 - 22,50322 (2010) 574,008 - - 576,821 99,362 - 19,71423 (2011) 544,674 - - 527,232 84,897 - 37,157
平成21年度 (09FY) 546,115 - - 562,020 93,435 - 21,08222 (10FY) 560,770 - - 567,059 96,572 - 14,819
平成23年 1~3月 (Q1) 128,677 - - 133,573 23,640 - 14,8194~6 (Q2) 112,858 - - 104,744 16,983 - 22,9957~9 (Q3) 137,736 - - 136,966 22,673 - 23,703
10~12 (Q4) 165,403 - - 151,949 21,601 - 37,157
平成23年 1月 (Jan) 53,662 - - 49,846 8,836 - 23,5302 (Feb) 43,281 - - 47,010 8,405 - 19,8033 (Mar) 31,734 - - 36,717 6,399 - 14,8194 (Apr) 27,716 - - 31,015 5,817 - 11,5205 (May) 43,866 - - 33,975 5,266 - 21,4736 (Jun) 41,276 - - 39,754 5,900 - 22,995
7 (Jul) 43,187 - - 44,462 7,812 - 21,6588 (Aug) 44,388 - - 45,264 7,449 - 20,7829 (Sep) 50,161 - - 47,240 7,412 - 23,703
10 (Oct) 54,776 - - 49,410 6,866 - 29,06911 (Nov) 53,482 - - 52,991 7,584 - 29,56012 (Dec) 57,145 - - 49,548 7,151 - 37,157
注:平成21年1月から出荷に係る記入方法の変更をしたことから、それ以前と不連続が生じています。
数 量Quantity
年 月Year and Month
出 荷 Shipments
113
ア 電 気 亜 鉛 (精留亜鉛を含む) Electrolytic zinc(including reflux refined zinc) (t)
生 産 受 入 消 費 販 売 Sales 在 庫金額(百万円) その他
Production Receipts Consumption Value Others Inventory( million yen)
平成19年 (2007) 460,939 - 74,027 121,257 49,875 263,858 13,37920 (2008) 472,468 - 75,317 129,389 29,794 263,566 17,56721 (2009) 429,165 - - 434,834 62,533 - 11,89722 (2010) 458,649 - - 460,018 75,872 - 10,55223 (2011) 425,930 - - 410,825 62,395 - 25,658
平成21年度 (09FY) 434,523 - - 450,955 71,312 - 15,11022 (10FY) 443,026 - - 450,769 73,440 - 7,393
平成23年 1~3月 (Q1) 101,354 - - 104,514 17,833 - 7,3934~6 (Q2) 94,059 - - 82,701 12,882 - 18,7517~9 (Q3) 101,957 - - 102,218 15,796 - 18,490
10~12 (Q4) 128,560 - - 121,392 15,884 - 25,658
平成23年 1月 (Jan) 41,102 - - 37,762 6,322 - 13,8922 (Feb) 36,309 - - 37,035 6,396 - 13,1683 (Mar) 23,943 - - 29,717 5,115 - 7,3934 (Apr) 22,828 - - 22,505 4,172 - 7,7165 (May) 36,834 - - 27,217 4,038 - 17,3336 (Jun) 34,397 - - 32,979 4,672 - 18,751
7 (Jul) 29,583 - - 32,132 5,329 - 16,2028 (Aug) 32,113 - - 34,347 5,306 - 13,9689 (Sep) 40,261 - - 35,739 5,161 - 18,490
10 (Oct) 42,552 - - 38,911 4,930 - 22,13111 (Nov) 41,799 - - 42,305 5,582 - 21,62512 (Dec) 44,209 - - 40,176 5,372 - 25,658
注:平成21年1月から出荷に係る記入方法の変更をしたことから、それ以前と不連続が生じています。
出 荷 Shipments
数 量Quantity
年 月Year and Month
113

時系列表 (非鉄金属編) 製品
(1) 非鉄金属 Non-ferrous metals
イ 蒸 留 亜 鉛 Distilled zinc (t)
生 産 販 売 Sales 在 庫金額(百万円) その他
Production Value Others Inventory( million yen)
平成19年 (2007) 136,711 95,243 20,581 48,968 4,38620 (2008) 143,065 92,293 17,567 46,534 8,62521 (2009) 111,439 109,458 20,612 - 10,60622 (2010) 115,359 116,803 23,490 - 9,16223 (2011) 118,744 116,407 22,502 - 11,499
平成21年度 (09FY) 111,592 111,065 22,123 - 5,97222 (10FY) 117,744 116,290 23,132 - 7,426
平成23年 1~3月 (Q1) 27,323 29,059 5,807 - 7,4264~6 (Q2) 18,799 22,043 4,101 - 4,2447~9 (Q3) 35,779 34,748 6,877 - 5,213
10~12 (Q4) 36,843 30,557 5,717 - 11,499
平成23年 1月 (Jan) 12,560 12,084 2,514 - 9,6382 (Feb) 6,972 9,975 2,009 - 6,6353 (Mar) 7,791 7,000 1,284 - 7,4264 (Apr) 4,888 8,510 1,645 - 3,8045 (May) 7,032 6,758 1,228 - 4,1406 (Jun) 6,879 6,775 1,228 - 4,244
7 (Jul) 13,604 12,330 2,483 - 5,4568 (Aug) 12,275 10,917 2,143 - 6,8149 (Sep) 9,900 11,501 2,251 - 5,213
10 (Oct) 12,224 10,499 1,936 - 6,93811 (Nov) 11,683 10,686 2,002 - 7,93512 (Dec) 12,936 9,372 1,779 - 11,499
注:平成21年1月から出荷に係る記入方法の変更をしたことから、それ以前と不連続が生じています。
出 荷 Shipments
数 量Quantity
年 月Year and Month
114114

時系列表 (非鉄金属編) 製品
(2) アルミニウム Aluminum
(単位:t、 Unit: t)
① 精 製 ア ル ミ ニ ウ ム 地 金 High grade aluminum metal
出 荷 Shipments生 産 受 入 消 費 販 売 Sales 在 庫
金額(百万円)Production Receipts Consumption Value Inventory
(million yen)
平成19年 (2007) 50,777 15 13,907 36,940 21,567 96 1,61120 (2008) 51,630 35 17,370 33,320 19,225 118 2,08821 (2009) 32,699 - 11,542 20,456 7,460 47 2,24822 (2010) 49,440 - 19,407 29,355 11,404 70 2,88923 (2011) 43,324 10 17,538 25,665 10,353 130 2,938
平成21年度 (09FY) 43,665 - 16,009 27,918 10,122 47 2,09522 (10FY) 48,193 4 19,492 28,044 11,246 70 2,937
平成23年 1~3月 (Q1) 11,678 4 5,217 6,462 2,653 - 2,9374~6 (Q2) 13,094 6 5,675 7,431 3,051 67 2,8657~9 (Q3) 11,791 - 4,437 7,193 2,905 63 2,964
10~12 (Q4) 6,761 - 2,209 4,579 1,744 - 2,938
平成23年 1月 (Jan) 3,528 2 1,713 2,025 823 - 2,7262 (Feb) 3,857 2 1,606 2,314 956 - 2,6653 (Mar) 4,293 - 1,898 2,123 874 - 2,9374 (Apr) 3,767 3 1,835 1,930 792 - 2,9425 (May) 4,571 1 1,898 2,649 1,083 - 2,9696 (Jun) 4,756 2 1,942 2,852 1,177 67 2,865
7 (Jul) 4,974 - 1,972 2,859 1,174 37 2,9718 (Aug) 3,822 - 1,736 2,068 841 - 2,9899 (Sep) 2,995 - 729 2,266 890 26 2,964
10 (Oct) 3,254 - 1,295 1,872 726 - 3,05211 (Nov) 2,316 - 667 1,734 657 - 2,96612 (Dec) 1,191 - 247 973 361 - 2,938
(単位:t、 Unit: t)
数 量Quantity
そ の 他Others
年 月Year and Month
115
出 荷 Shipments生 産 受 入 消 費 販 売 Sales 在 庫
金額(百万円)Production Receipts Consumption Value Inventory
(million yen)
平成19年 (2007) 376,350 5,386 … 376,725 134,463 4,357 15,20220 (2008) 334,535 4,646 … 336,532 108,800 3,515 14,34421 (2009) 262,710 371 … 263,227 53,201 2,749 12,10222 (2010) 309,988 436 … 309,402 74,629 3,171 8,13323 (2011) 304,585 658 … 301,121 72,930 2,867 8,813
平成21年度 (09FY) 291,759 333 … 289,305 63,146 3,075 11,94822 (10FY) 314,067 560 … 309,303 74,645 3,040 12,310
平成23年 1~3月 (Q1) 81,975 213 … 77,391 19,193 606 12,3104~6 (Q2) 65,845 181 … 66,551 16,917 773 10,9837~9 (Q3) 76,069 132 … 75,883 19,163 722 10,488
10~12 (Q4) 80,696 132 … 81,296 17,657 766 8,813
平成23年 1月 (Jan) 26,723 30 … 24,757 6,102 135 9,9892 (Feb) 26,112 66 … 26,009 6,443 133 10,0223 (Mar) 29,140 117 … 26,625 6,648 338 12,3104 (Apr) 22,084 59 … 21,847 5,426 336 12,2645 (May) 18,172 58 … 18,404 4,525 236 11,8516 (Jun) 25,589 64 … 26,300 6,966 201 10,983
7 (Jul) 28,038 40 … 25,651 6,779 278 13,1328 (Aug) 21,381 49 … 23,223 6,063 232 11,1039 (Sep) 26,650 43 … 27,009 6,320 212 10,488
10 (Oct) 28,483 52 … 28,020 6,259 290 10,67411 (Nov) 27,940 37 … 27,003 5,802 177 11,07112 (Dec) 24,273 43 … 26,273 5,597 299 8,813
そ の 他Others
年 月Year and Month
② ア ル ミ ニ ウ ム 合 金 地 金 計 (ア ~ イ) Total of aluminum alloy ingots
数 量Quantity
115

時系列表 (非鉄金属編) 製品
(2) アルミニウム Aluminum
(単位:t、 Unit: t)
ア. 鋳 物 用 ・ ダ イ カ ス ト 用 For castings/die castings
出 荷 Shipments生 産 受 入 消 費 販 売 Sales 在 庫
金額(百万円)Production Receipts Consumption Value Inventory
(million yen)
平成19年 (2007) 120,570 3,599 … 124,187 50,051 362 5,75920 (2008) 106,029 3,210 … 109,097 39,619 187 5,70921 (2009) 74,201 235 … 75,021 17,910 166 4,84422 (2010) 101,281 433 … 101,480 27,682 247 5,02523 (2011) 92,597 658 … 92,410 25,593 213 5,190
平成21年度 (09FY) 89,799 258 … 88,615 22,263 205 4,94022 (10FY) 100,553 560 … 100,089 27,441 245 5,861
平成23年 1~3月 (Q1) 25,184 213 … 24,489 6,916 61 5,8614~6 (Q2) 19,075 181 … 19,755 5,715 60 5,2957~9 (Q3) 23,786 132 … 23,864 6,596 59 5,282
10~12 (Q4) 24,552 132 … 24,302 6,367 33 5,190
平成23年 1月 (Jan) 8,044 30 … 7,999 2,236 28 5,0702 (Feb) 8,128 66 … 8,338 2,363 30 4,8933 (Mar) 9,012 117 … 8,152 2,316 3 5,8614 (Apr) 6,355 59 … 6,487 1,894 33 5,7535 (May) 4,828 58 … 4,923 1,425 27 5,6866 (Jun) 7,892 64 … 8,345 2,395 - 5,295
7 (Jul) 8,368 40 … 8,126 2,313 28 5,5498 (Aug) 7,570 49 … 7,286 2,003 31 5,8479 (Sep) 7,848 43 … 8,452 2,279 - 5,282
10 (Oct) 8,671 52 … 8,691 2,305 - 5,27511 (Nov) 8,568 37 … 8,110 2,115 5 5,36512 (Dec) 7,313 43 … 7,501 1,947 28 5,190
(単位:t、 Unit: t)
数 量Quantity
そ の 他Others
年 月Year and Month
116
イ. そ の 他 用 For others
出 荷 Shipments生 産 受 入 消 費 販 売 Sales 在 庫
金額(百万円)Production Receipts Consumption Value Inventory
(million yen)
平成19年 (2007) 255,780 1,787 … 252,538 84,412 3,995 9,44320 (2008) 228,506 1,436 … 227,435 69,181 3,328 8,63521 (2009) 188,509 136 … 188,206 35,291 2,583 7,25822 (2010) 208,707 3 … 207,922 46,947 2,924 3,10823 (2011) 211,988 - … 208,711 47,338 2,654 3,623
平成21年度 (09FY) 201,960 75 … 200,690 40,883 2,870 7,00822 (10FY) 213,514 - … 209,214 47,204 2,795 6,449
平成23年 1~3月 (Q1) 56,791 - … 52,902 12,278 545 6,4494~6 (Q2) 46,770 - … 46,796 11,202 713 5,6887~9 (Q3) 52,283 - … 52,019 12,567 663 5,206
10~12 (Q4) 56,144 - … 56,994 11,291 733 3,623
平成23年 1月 (Jan) 18,679 - … 16,758 3,866 107 4,9192 (Feb) 17,984 - … 17,671 4,080 103 5,1293 (Mar) 20,128 - … 18,473 4,332 335 6,4494 (Apr) 15,729 - … 15,360 3,532 303 6,5115 (May) 13,344 - … 13,481 3,099 209 6,1656 (Jun) 17,697 - … 17,955 4,571 201 5,688
7 (Jul) 19,670 - … 17,525 4,466 250 7,5838 (Aug) 13,811 - … 15,937 4,060 201 5,2569 (Sep) 18,802 - … 18,557 4,041 212 5,206
10 (Oct) 19,812 - … 19,329 3,954 290 5,39911 (Nov) 19,372 - … 18,893 3,687 172 5,70612 (Dec) 16,960 - … 18,772 3,649 271 3,623
そ の 他Others
数 量Quantity
年 月Year and Month
116

時系列表 (非鉄金属編) 製品
(2) アルミニウム Aluminum
(単位:t、 Unit: t)
③ ア ル ミ ニ ウ ム 二 次 地 金 計 ( ア ~イ) Totel of secondary aluminum ingots
出 荷 Shipments生 産 受 入 消 費 販 売 Sales 在 庫
金額(百万円)Production Receipts Consumption Value Inventory
(million yen)
平成19年 (2007) 153,204 11,508 … 146,335 35,421 18,348 2,78320 (2008) 148,847 11,385 … 141,982 33,619 17,356 3,59821 (2009) 111,349 6,185 … 108,857 18,545 9,865 3,18722 (2010) 125,990 8,734 … 126,418 23,687 9,910 3,17523 (2011) 141,789 11,305 … 137,688 26,247 15,347 2,754
平成21年度 (09FY) 115,624 7,124 … 114,106 19,882 9,921 2,30822 (10FY) 132,403 9,557 … 131,387 24,794 11,645 2,306
平成23年 1~3月 (Q1) 36,194 2,915 … 35,452 6,698 4,337 2,3064~6 (Q2) 35,943 2,177 … 33,708 6,547 3,536 3,1527~9 (Q3) 35,368 2,967 … 34,945 6,729 3,699 2,663
10~12 (Q4) 34,284 3,246 … 33,583 6,273 3,775 2,754
平成23年 1月 (Jan) 11,490 1,051 … 11,535 2,111 1,542 2,4872 (Feb) 12,405 1,104 … 11,935 2,290 1,607 2,4543 (Mar) 12,299 760 … 11,982 2,297 1,188 2,3064 (Apr) 12,140 549 … 11,078 2,167 1,026 2,8915 (May) 11,554 756 … 10,958 2,109 1,240 3,0086 (Jun) 12,249 872 … 11,672 2,271 1,270 3,152
7 (Jul) 12,071 891 … 11,736 2,257 1,244 3,0998 (Aug) 11,391 1,019 … 11,600 2,239 1,223 2,6609 (Sep) 11,906 1,057 … 11,609 2,233 1,232 2,663
10 (Oct) 11,852 1,178 … 11,417 2,166 1,293 2,95711 (Nov) 11,371 1,113 … 11,137 2,075 1,286 3,02812 (Dec) 11,061 955 … 11,029 2,031 1,196 2,754
(単位:t、 Unit: t)
数 量Quantity
そ の 他Others
年 月Year and Month
117
ア. 脱 酸 用 For deoxidizing
出 荷 Shipments生 産 受 入 消 費 販 売 Sales 在 庫
金額(百万円)Production Receipts Consumption Value Inventory
(million yen)
平成19年 (2007) 78,880 11,466 … 78,899 22,026 11,262 2,09020 (2008) 77,047 11,148 … 76,936 21,111 11,139 2,13721 (2009) 50,373 6,059 … 53,248 9,325 3,999 2,11522 (2010) 58,353 8,734 … 64,863 13,274 3,891 2,03823 (2011) 75,025 11,210 … 76,560 15,804 9,421 1,831
平成21年度 (09FY) 51,802 7,056 … 56,317 10,310 3,995 1,56722 (10FY) 64,707 9,527 … 69,621 14,301 5,680 1,596
平成23年 1~3月 (Q1) 19,539 2,885 … 19,824 3,994 2,880 1,5964~6 (Q2) 18,998 2,170 … 18,379 3,963 2,049 2,2917~9 (Q3) 18,103 2,967 … 19,422 4,052 2,219 1,545
10~12 (Q4) 18,385 3,188 … 18,935 3,794 2,273 1,831
平成23年 1月 (Jan) 6,010 1,044 … 6,403 1,229 1,042 1,4862 (Feb) 6,583 1,104 … 6,657 1,364 1,102 1,4143 (Mar) 6,946 737 … 6,764 1,401 736 1,5964 (Apr) 6,778 542 … 6,166 1,338 537 2,2135 (May) 5,985 756 … 5,990 1,293 756 2,1986 (Jun) 6,235 872 … 6,223 1,332 756 2,291
7 (Jul) 5,887 891 … 6,128 1,281 756 2,1508 (Aug) 5,955 1,019 … 6,645 1,389 731 1,7239 (Sep) 6,261 1,057 … 6,649 1,383 732 1,545
10 (Oct) 6,532 1,178 … 6,569 1,331 807 1,85411 (Nov) 5,981 1,055 … 6,269 1,255 770 1,86212 (Dec) 5,872 955 … 6,097 1,209 696 1,831
そ の 他Others
数 量Quantity
年 月Year and Month
117

時系列表 (非鉄金属編) 製品
(2) アルミニウム Aluminum
(単位:t、 Unit: t)
イ. そ の 他 用 For others
出 荷 Shipments生 産 受 入 消 費 販 売 Sales 在 庫
金額(百万円)Production Receipts Consumption Value Inventory
(million yen)
平成19年 (2007) 74,324 42 … 67,436 13,396 7,086 69320 (2008) 71,800 237 … 65,046 12,508 6,217 1,46121 (2009) 60,976 126 … 55,609 9,220 5,866 1,07222 (2010) 67,637 - … 61,555 10,413 6,019 1,13723 (2011) 66,764 95 … 61,128 10,444 5,926 923
平成21年度 (09FY) 63,822 68 … 57,789 9,573 5,926 74122 (10FY) 67,696 30 … 61,766 10,493 5,965 710
平成23年 1~3月 (Q1) 16,655 30 … 15,628 2,704 1,457 7104~6 (Q2) 16,945 7 … 15,329 2,584 1,487 8617~9 (Q3) 17,265 - … 15,523 2,677 1,480 1,118
10~12 (Q4) 15,899 58 … 14,648 2,478 1,502 923
平成23年 1月 (Jan) 5,480 7 … 5,132 882 500 1,0012 (Feb) 5,822 - … 5,278 926 505 1,0403 (Mar) 5,353 23 … 5,218 896 452 7104 (Apr) 5,362 7 … 4,912 830 489 6785 (May) 5,569 - … 4,968 816 484 8106 (Jun) 6,014 - … 5,449 939 514 861
7 (Jul) 6,184 - … 5,608 976 488 9498 (Aug) 5,436 - … 4,955 851 492 9379 (Sep) 5,645 - … 4,960 851 500 1,118
10 (Oct) 5,320 - … 4,848 836 486 1,10311 (Nov) 5,390 58 … 4,868 820 516 1,16612 (Dec) 5,189 - … 4,932 822 500 923
(単位:t、 Unit: t)
数 量Quantity
そ の 他Others
年 月Year and Month
118
出 荷 Shipments生 産 受 入 消 費 販 売 Sales 在 庫
金額(百万円)Production Receipts Consumption Value Inventory
(million yen)
平成19年 (2007) 1,284,826 70,648 … 1,238,420 345,436 96,000 39,59720 (2008) 1,159,527 66,989 … 1,136,145 320,220 80,606 37,89521 (2009) 815,629 39,698 … 803,578 150,946 46,749 35,21122 (2010) 978,245 34,241 … 951,338 205,876 51,333 34,47123 (2011) 915,450 31,214 … 894,815 196,018 32,705 33,279
平成21年度 (09FY) 924,080 37,772 … 899,034 172,748 50,768 35,85322 (10FY) 964,121 33,232 … 939,310 205,007 45,746 33,916
平成23年 1~3月 (Q1) 235,561 7,237 … 230,839 49,604 7,963 33,9164~6 (Q2) 193,074 6,936 … 188,055 43,879 7,135 33,3177~9 (Q3) 239,749 8,363 … 235,576 51,769 8,817 32,281
10~12 (Q4) 247,066 8,678 … 240,345 50,766 8,790 33,279
平成23年 1月 (Jan) 76,463 2,643 … 75,852 16,349 2,924 33,6292 (Feb) 81,019 2,676 … 80,473 17,326 3,128 31,9843 (Mar) 78,079 1,918 … 74,514 15,929 1,911 33,9164 (Apr) 61,852 2,230 … 57,913 14,059 2,084 36,1655 (May) 54,322 2,088 … 54,016 12,928 2,196 34,9166 (Jun) 76,900 2,618 … 76,126 16,892 2,855 33,317
7 (Jul) 81,419 2,872 … 79,479 17,484 3,214 33,4178 (Aug) 73,659 2,662 … 72,888 16,279 2,600 32,6689 (Sep) 84,671 2,829 … 83,209 18,006 3,003 32,281
10 (Oct) 88,339 2,929 … 84,768 17,939 3,096 33,69011 (Nov) 83,720 3,036 … 80,336 16,983 3,078 35,07812 (Dec) 75,007 2,713 … 75,241 15,844 2,616 33,279
そ の 他Others
数 量Quantity
年 月Year and Month
④ ア ル ミ ニ ウ ム 二 次 合 金 地 金 計 (ア ~ イ) Total of secondary aluminum alloy ingots
118

時系列表 (非鉄金属編) 製品
(2) アルミニウム Aluminum
(単位:t、 Unit: t)
ア. 鋳 物 ・ ダ イ カ ス ト 用 For castings/die castings
出 荷 Shipments生 産 受 入 消 費 販 売 Sales 在 庫
金額(百万円)Production Receipts Consumption Value Inventory
(million yen)
平成19年 (2007) 1,154,110 47,361 … 1,151,939 320,404 47,364 36,95620 (2008) 1,041,316 47,952 … 1,056,101 298,060 40,378 33,86221 (2009) 724,317 26,998 … 738,476 139,723 21,526 30,01822 (2010) 880,040 22,006 … 886,146 193,284 22,579 29,08823 (2011) 826,813 20,979 … 826,538 181,902 18,632 30,802
平成21年度 (09FY) 827,199 24,409 … 831,531 160,690 23,429 30,60522 (10FY) 870,475 22,328 … 873,678 192,175 21,335 31,827
平成23年 1~3月 (Q1) 215,945 5,222 … 214,356 46,255 4,980 31,8274~6 (Q2) 169,169 4,856 … 170,457 39,721 3,937 30,6777~9 (Q3) 216,665 5,338 … 217,378 48,220 5,020 30,078
10~12 (Q4) 225,034 5,563 … 224,347 47,707 4,695 30,802
平成23年 1月 (Jan) 70,182 1,801 … 70,582 15,345 1,826 29,7922 (Feb) 74,265 1,822 … 74,846 16,139 1,919 29,1093 (Mar) 71,498 1,599 … 68,928 14,771 1,235 31,8274 (Apr) 53,458 1,599 … 51,981 12,290 1,124 33,5345 (May) 46,469 1,599 … 48,379 11,766 1,283 31,9746 (Jun) 69,242 1,658 … 70,097 15,664 1,530 30,677
7 (Jul) 73,558 1,756 … 73,139 16,236 1,854 31,0538 (Aug) 65,838 1,753 … 66,992 15,166 1,472 30,0169 (Sep) 77,269 1,829 … 77,247 16,818 1,694 30,078
10 (Oct) 80,849 1,890 … 79,340 16,879 1,735 31,41711 (Nov) 76,094 1,947 … 75,259 15,974 1,619 32,21212 (Dec) 68,091 1,726 … 69,748 14,853 1,341 30,802
(単位:t、 Unit: t)
数 量Quantity
そ の 他Others
年 月Year and Month
119
イ. そ の 他 用 For others
出 荷 Shipments生 産 受 入 消 費 販 売 Sales 在 庫
金額(百万円)Production Receipts Consumption Value Inventory
(million yen)
平成19年 (2007) 130,716 23,287 … 86,481 25,033 48,636 2,64120 (2008) 118,211 19,037 … 80,044 22,160 40,228 4,03321 (2009) 91,312 12,700 … 65,102 11,222 25,223 5,19322 (2010) 98,205 12,235 … 65,192 12,591 28,754 5,38323 (2011) 88,637 10,235 … 68,277 14,115 14,073 2,477
平成21年度 (09FY) 96,881 13,363 … 67,503 12,058 27,339 5,24822 (10FY) 93,646 10,904 … 65,632 12,832 24,411 2,089
平成23年 1~3月 (Q1) 19,616 2,015 … 16,483 3,349 2,983 2,0894~6 (Q2) 23,905 2,080 … 17,598 4,158 3,198 2,6407~9 (Q3) 23,084 3,025 … 18,198 3,549 3,797 2,203
10~12 (Q4) 22,032 3,115 … 15,998 3,059 4,095 2,477
平成23年 1月 (Jan) 6,281 842 … 5,270 1,004 1,098 3,8372 (Feb) 6,754 854 … 5,627 1,188 1,209 2,8753 (Mar) 6,581 319 … 5,586 1,158 676 2,0894 (Apr) 8,394 631 … 5,932 1,769 960 2,6315 (May) 7,853 489 … 5,637 1,161 913 2,9426 (Jun) 7,658 960 … 6,029 1,228 1,325 2,640
7 (Jul) 7,861 1,116 … 6,340 1,249 1,360 2,3648 (Aug) 7,821 909 … 5,896 1,113 1,128 2,6529 (Sep) 7,402 1,000 … 5,962 1,188 1,309 2,203
10 (Oct) 7,490 1,039 … 5,428 1,060 1,361 2,27311 (Nov) 7,626 1,089 … 5,077 1,009 1,459 2,86612 (Dec) 6,916 987 … 5,493 991 1,275 2,477
年 月Year and Month そ の 他
Others数 量Quantity
119

時系列表 (非鉄金属編) 製品
(2) アルミニウム Aluminum
(単位:t、 Unit: t)
⑤ ア ル ミ ニ ム 粉 Aluminum powder
出 荷 Shipments生 産 受 入 消 費 販 売 Sales 在 庫
金額(百万円)Production Receipts Consumption Value Inventory
(million yen)
平成19年 (2007) 16,125 - 132 15,999 20,350 - 1,98420 (2008) 14,391 - 280 14,247 18,161 - 1,83921 (2009) 10,129 - 109 10,429 13,438 - 1,64322 (2010) 13,101 - 57 13,283 16,037 - 1,75523 (2011) 12,882 - 19 12,623 15,792 - 1,816
平成21年度 (09FY) 11,838 - 40 12,105 15,534 - 1,64522 (10FY) 12,859 - 67 12,959 15,564 - 1,753
平成23年 1~3月 (Q1) 3,079 - 14 3,071 3,600 - 1,7534~6 (Q2) 3,098 - 1 3,019 4,121 - 1,7697~9 (Q3) 3,282 - 3 3,327 4,075 - 1,661
10~12 (Q4) 3,424 - 2 3,206 3,995 - 1,816
平成23年 1月 (Jan) 971 - 4 979 1,155 - 1,7882 (Feb) 1,000 - 5 1,004 1,190 - 1,7583 (Mar) 1,108 - 4 1,088 1,255 - 1,7534 (Apr) 1,009 - 0 935 1,256 - 1,8075 (May) 938 - - 973 1,401 - 1,7516 (Jun) 1,151 - 1 1,111 1,464 - 1,769
7 (Jul) 1,154 - 0 1,159 1,525 - 1,7438 (Aug) 1,041 - - 1,057 1,255 - 1,7079 (Sep) 1,087 - 3 1,112 1,295 - 1,661
10 (Oct) 1,212 - 2 1,100 1,295 - 1,75111 (Nov) 1,215 - 0 1,112 1,384 - 1,83412 (Dec) 997 - - 994 1,316 - 1,816
そ の 他Others
数 量Quantity
年 月Year and Month
120120

時系列表 (非鉄金属編) 製品
(3) 非鉄金属製品(伸銅製品) Non-ferrous metal products (Elongated copper products) (単位:t、Unit: t)
ア. 伸 銅 製 品 合 計 (イ~エ) Total of elongated copper products
出 荷 Shipments生 産 受 入 消 費 販 売 Sales 在 庫
金額(百万円) そ の 他Production Receipts Consumption Value Others Inventory
(million yen)
平成19年 (2007) 1,003,699 7,117 15,947 987,462 995,813 6,378 35,61420 (2008) 944,409 6,297 14,799 932,187 901,524 5,851 32,81921 (2009) 654,357 4,866 10,884 648,666 476,904 2,355 29,20522 (2010) 867,415 4,999 15,503 845,791 720,306 6,946 33,68623 (2011) 824,431 5,646 15,899 808,432 743,635 3,651 35,809
平成21年度 (09FY) 753,934 4,969 12,023 740,927 577,052 2,751 28,39722 (10FY) 864,212 5,131 15,727 842,878 737,072 6,393 33,214
平成23年 1~3月 (Q1) 209,382 1,360 4,049 206,494 193,256 851 33,2144~6 (Q2) 219,800 1,524 4,377 213,760 205,803 1,177 35,3597~9 (Q3) 203,272 1,460 3,711 200,514 185,475 1,180 34,552
10~12 (Q4) 191,977 1,302 3,762 187,664 159,101 443 35,809
平成23年 1月 (Jan) 66,312 460 1,232 67,353 61,261 687 31,2362 (Feb) 70,065 423 1,301 69,083 65,074 80 31,5613 (Mar) 73,005 477 1,516 70,058 66,922 84 33,2144 (Apr) 73,918 503 1,500 71,502 70,051 472 34,1685 (May) 72,711 485 1,372 70,081 67,750 548 35,4826 (Jun) 73,171 536 1,505 72,177 68,002 157 35,359
7 (Jul) 72,658 478 1,340 68,482 64,172 502 38,1088 (Aug) 62,214 425 1,069 63,393 58,932 424 35,5859 (Sep) 68,400 557 1,302 68,639 62,370 254 34,552
10 (Oct) 65,520 458 1,244 63,902 56,213 267 34,84111 (Nov) 65,996 461 1,269 63,983 53,752 87 35,89812 (Dec) 60,461 383 1,249 59,779 49,136 89 35,809
(単位:t、Unit: t)
イ 銅 製 品 計 (ア) ( ) T l f d
数 量Quantity
年 月Year and Month
121
イ. 銅 製 品 計 (ア)~(エ) Total of copper products
出 荷 Shipments生 産 受 入 消 費 販 売 Sales 在 庫
金額(百万円) そ の 他Production Receipts Consumption Value Others Inventory
(million yen)
平成19年 (2007) 501,007 2,257 - 497,739 538,914 5,025 15,64320 (2008) 476,654 1,534 - 476,753 512,223 4,800 12,29421 (2009) 336,432 1,454 - 337,176 282,750 1,001 11,74322 (2010) 445,029 1,214 - 441,245 411,853 4,006 12,90023 (2011) 424,210 1,556 - 422,641 429,688 2,050 13,663
平成21年度 (09FY) 386,773 1,526 - 384,946 334,548 602 11,22822 (10FY) 445,837 1,340 - 442,029 424,525 4,005 12,439
平成23年 1~3月 (Q1) 108,457 403 - 108,910 112,287 400 12,4394~6 (Q2) 114,252 430 - 112,525 118,609 800 13,5857~9 (Q3) 104,560 397 - 104,508 106,662 658 13,259
10~12 (Q4) 96,941 326 - 96,698 92,130 192 13,663
平成23年 1月 (Jan) 34,021 129 - 35,460 35,388 400 11,1902 (Feb) 36,352 133 - 36,212 37,759 - 11,5133 (Mar) 38,084 141 - 37,238 39,140 - 12,4394 (Apr) 38,420 148 - 38,012 40,478 400 12,5275 (May) 38,162 129 - 36,796 39,139 400 13,5766 (Jun) 37,670 153 - 37,717 38,991 - 13,585
7 (Jul) 38,049 138 - 36,162 37,144 400 15,2318 (Aug) 31,965 130 - 32,967 33,986 130 13,9179 (Sep) 34,546 129 - 35,379 35,532 128 13,259
10 (Oct) 33,624 94 - 32,997 32,250 167 13,72411 (Nov) 32,834 113 - 32,646 31,268 - 14,00212 (Dec) 30,483 119 - 31,055 28,612 25 13,663
数 量Quantity
年 月Year and Month
121

時系列表 (非鉄金属編) 製品
(3) 非鉄金属製品(伸銅製品) Non-ferrous metal products (Elongated copper products) (単位:t、Unit: t)
(ア) 銅 製 品 (板) Plates and sheets
出 荷 Shipments生 産 受 入 消 費 販 売 Sales 在 庫
金額(百万円) そ の 他Production Receipts Consumption Value Others Inventory
(million yen)
平成19年 (2007) 17,818 305 - 17,979 17,537 - 58820 (2008) 19,874 234 - 19,939 17,992 - 75821 (2009) 11,848 158 - 12,145 8,009 - 53822 (2010) 15,145 168 - 15,026 12,952 - 82823 (2011) 16,184 172 - 16,397 15,563 - 768
平成21年度 (09FY) 12,515 167 - 12,628 8,815 - 61722 (10FY) 15,363 169 - 15,504 14,182 - 648
平成23年 1~3月 (Q1) 4,140 44 - 4,364 4,139 - 6484~6 (Q2) 4,228 49 - 4,179 4,334 - 7357~9 (Q3) 4,106 42 - 4,083 3,906 - 799
10~12 (Q4) 3,710 37 - 3,771 3,183 - 768
平成23年 1月 (Jan) 1,234 16 - 1,476 1,353 - 6022 (Feb) 1,426 14 - 1,371 1,322 - 6713 (Mar) 1,480 14 - 1,517 1,463 - 6484 (Apr) 1,308 16 - 1,260 1,330 - 7025 (May) 1,441 15 - 1,412 1,440 - 7456 (Jun) 1,479 18 - 1,507 1,565 - 735
7 (Jul) 1,389 15 - 1,389 1,411 - 7508 (Aug) 1,278 11 - 1,285 1,301 - 7549 (Sep) 1,439 16 - 1,409 1,194 - 799
10 (Oct) 1,353 15 - 1,281 1,014 - 88711 (Nov) 1,306 10 - 1,418 1,288 - 78412 (Dec) 1,051 12 - 1,072 882 - 768
(単位:t、Unit: t)
(イ) 銅 製 品 (条) St i
数 量Quantity
年 月Year and Month
122
生 産 受 入 消 費 在 庫金額(百万円) そ の 他
Production Receipts Consumption Value Others Inventory(million yen)
平成19年 (2007) 269,999 232 - 265,925 312,179 5,025 8,72220 (2008) 259,240 160 - 256,288 290,241 4,800 7,09921 (2009) 181,269 495 - 179,683 150,650 1,001 7,97222 (2010) 261,666 110 - 257,382 249,086 4,006 8,51423 (2011) 237,197 102 - 234,849 245,900 2,050 8,653
平成21年度 (09FY) 225,993 506 - 222,201 196,846 602 7,89422 (10FY) 257,230 109 - 252,383 251,763 4,005 8,991
平成23年 1~3月 (Q1) 61,082 28 - 60,255 65,198 400 8,9914~6 (Q2) 62,681 35 - 61,352 66,908 800 9,5627~9 (Q3) 58,718 13 - 58,430 61,508 658 8,881
10~12 (Q4) 54,716 26 - 54,812 52,286 192 8,653
平成23年 1月 (Jan) 18,721 14 - 19,326 20,253 400 7,5262 (Feb) 20,673 9 - 20,243 22,121 - 7,9583 (Mar) 21,688 5 - 20,686 22,824 - 8,9914 (Apr) 21,497 12 - 21,616 23,786 400 8,4925 (May) 20,875 12 - 19,453 21,496 400 9,5266 (Jun) 20,309 11 - 20,283 21,626 - 9,562
7 (Jul) 20,946 2 - 19,488 20,653 400 10,7118 (Aug) 18,267 6 - 18,694 19,816 130 9,7479 (Sep) 19,505 5 - 20,248 21,040 128 8,881
10 (Oct) 19,409 3 - 19,031 18,872 167 9,12111 (Nov) 18,311 17 - 18,199 17,059 - 9,25012 (Dec) 16,996 6 - 17,582 16,355 25 8,653
出 荷 Shipments販 売 Sales
数 量Quantity
年 月Year and Month
(イ) 銅 製 品 (条) Strips
122

時系列表 (非鉄金属編) 製品
(3) 非鉄金属製品(伸銅製品) Non-ferrous metal products (Elongated copper products) (単位:t、Unit: t)
(ウ) 銅 製 品 (管) Pipes and tubes
出 荷 Shipments生 産 受 入 消 費 販 売 Sales 在 庫
金額(百万円) そ の 他Production Receipts Consumption Value Others Inventory
(million yen)
平成19年 (2007) 168,019 1,542 - 168,664 163,224 - 4,94720 (2008) 155,443 991 - 157,781 160,956 - 3,57021 (2009) 113,873 665 - 115,623 99,884 - 2,53922 (2010) 134,622 788 - 135,492 117,916 - 2,50823 (2011) 133,201 1,081 - 133,831 129,506 - 3,014
平成21年度 (09FY) 118,233 712 - 119,970 102,691 - 2,00622 (10FY) 138,598 870 - 139,661 124,770 - 1,774
平成23年 1~3月 (Q1) 34,312 258 - 35,290 33,584 - 1,7744~6 (Q2) 37,344 281 - 37,072 36,823 - 2,1217~9 (Q3) 32,381 288 - 32,628 31,686 - 2,445
10~12 (Q4) 29,164 254 - 28,841 27,413 - 3,014
平成23年 1月 (Jan) 11,187 75 - 11,692 10,757 - 2,0722 (Feb) 11,169 87 - 11,536 11,151 - 1,8513 (Mar) 11,956 96 - 12,062 11,676 - 1,7744 (Apr) 12,299 96 - 11,932 11,967 - 2,1705 (May) 12,580 88 - 12,563 12,594 - 2,2316 (Jun) 12,465 97 - 12,577 12,262 - 2,121
7 (Jul) 12,390 99 - 11,966 11,575 - 2,5768 (Aug) 9,658 96 - 10,159 9,942 - 2,2709 (Sep) 10,333 93 - 10,503 10,170 - 2,445
10 (Oct) 9,790 72 - 9,597 9,473 - 2,58711 (Nov) 9,890 82 - 9,827 9,189 - 2,70712 (Dec) 9,484 100 - 9,417 8,751 - 3,014
(単位:t、Unit: t)
( ) 銅 製 品 (棒 線) R d d b / i
数 量Quantity
年 月Year and Month
123
(エ) 銅 製 品 (棒・線) Rods and bars/wires
出 荷 Shipments生 産 受 入 消 費 販 売 Sales 在 庫
金額(百万円) そ の 他Production Receipts Consumption Value Others Inventory
(million yen)
平成19年 (2007) 45,171 178 - 45,171 45,974 - 1,38620 (2008) 42,097 149 - 42,745 43,034 - 86721 (2009) 29,442 136 - 29,725 24,207 - 69422 (2010) 33,596 148 - 33,345 31,898 - 1,05023 (2011) 37,628 201 - 37,564 38,719 - 1,228
平成21年度 (09FY) 30,032 141 - 30,147 26,196 - 71122 (10FY) 34,646 192 - 34,481 33,811 - 1,026
平成23年 1~3月 (Q1) 8,923 73 - 9,001 9,366 - 1,0264~6 (Q2) 9,999 65 - 9,922 10,544 - 1,1677~9 (Q3) 9,355 54 - 9,367 9,561 - 1,134
10~12 (Q4) 9,351 9 - 9,274 9,248 - 1,228
平成23年 1月 (Jan) 2,879 24 - 2,966 3,025 - 9902 (Feb) 3,084 23 - 3,062 3,164 - 1,0333 (Mar) 2,960 26 - 2,973 3,177 - 1,0264 (Apr) 3,316 24 - 3,204 3,395 - 1,1635 (May) 3,266 14 - 3,368 3,609 - 1,0746 (Jun) 3,417 27 - 3,350 3,539 - 1,167
7 (Jul) 3,324 22 - 3,319 3,506 - 1,1948 (Aug) 2,762 17 - 2,829 2,927 - 1,1469 (Sep) 3,269 15 - 3,219 3,127 - 1,134
10 (Oct) 3,072 4 - 3,088 2,891 - 1,12911 (Nov) 3,327 4 - 3,202 3,732 - 1,26112 (Dec) 2,952 1 - 2,984 2,625 - 1,228
数 量Quantity
年 月Year and Month
123

時系列表 (非鉄金属編) 製品
(3) 非鉄金属製品(伸銅製品) Non-ferrous metal products (Elongated copper products) (単位:t、Unit: t)
ウ. 黄 銅 製 品 計 (ア)~(オ) Total of brass products
出 荷 Shipments生 産 受 入 消 費 販 売 Sales 在 庫
金額(百万円) そ の 他Production Receipts Consumption Value Others Inventory
(million yen)
平成19年 (2007) 427,100 4,096 14,650 414,658 349,906 1,349 16,03520 (2008) 398,798 3,932 13,457 388,137 294,276 1,049 15,65521 (2009) 273,103 2,774 9,916 266,103 145,778 1,351 13,73522 (2010) 358,422 2,861 13,922 342,346 229,933 2,940 16,17923 (2011) 345,844 3,261 14,532 332,114 238,544 1,599 17,622
平成21年度 (09FY) 311,241 2,729 10,898 299,744 179,424 2,146 13,56222 (10FY) 357,577 2,869 14,198 341,937 235,675 2,387 16,085
平成23年 1~3月 (Q1) 87,633 716 3,681 84,557 62,670 450 16,0854~6 (Q2) 90,675 860 4,006 86,618 65,821 377 17,0467~9 (Q3) 85,154 911 3,403 82,332 59,406 522 16,883
10~12 (Q4) 82,382 774 3,442 78,607 50,648 250 17,622
平成23年 1月 (Jan) 27,729 213 1,134 27,336 19,467 286 15,4122 (Feb) 29,209 224 1,188 28,395 21,050 80 15,4133 (Mar) 30,695 279 1,359 28,826 22,154 84 16,0854 (Apr) 30,806 251 1,384 28,598 22,281 72 17,1915 (May) 29,417 289 1,260 28,432 21,524 148 17,1866 (Jun) 30,452 320 1,362 29,588 22,015 157 17,046
7 (Jul) 29,879 284 1,220 27,571 20,306 102 18,1598 (Aug) 26,098 255 1,011 26,151 18,848 294 17,1269 (Sep) 29,177 372 1,172 28,610 20,251 126 16,883
10 (Oct) 27,582 277 1,137 26,655 18,078 100 16,66211 (Nov) 28,717 277 1,171 27,127 17,033 86 17,24312 (Dec) 26,083 220 1,134 24,825 15,537 64 17,622
(単位:t、Unit: t)
(ア) 黄 銅 製 品 (板) Pl d h
数 量Quantity
年 月Year and Month
124
(ア) 黄 銅 製 品 (板) Plates and sheets
出 荷 Shipments生 産 受 入 消 費 販 売 Sales 在 庫
金額(百万円) そ の 他Production Receipts Consumption Value Others Inventory
(million yen)
平成19年 (2007) 10,825 55 34 10,765 10,240 - 53420 (2008) 10,969 173 40 11,132 9,792 - 50521 (2009) 7,091 54 45 7,275 5,067 1 30522 (2010) 7,632 19 63 7,429 5,826 2 45923 (2011) 8,036 25 49 7,933 6,766 1 511
平成21年度 (09FY) 7,382 30 32 7,300 5,315 3 38722 (10FY) 7,606 22 74 7,661 6,173 - 283
平成23年 1~3月 (Q1) 1,800 8 16 1,970 1,727 - 2834~6 (Q2) 2,241 5 17 2,095 1,860 - 4017~9 (Q3) 2,117 9 13 2,095 1,812 1 418
10~12 (Q4) 1,878 3 3 1,773 1,367 - 511
平成23年 1月 (Jan) 531 3 3 625 519 - 3662 (Feb) 608 1 5 644 567 - 3253 (Mar) 661 4 8 701 641 - 2834 (Apr) 727 2 5 617 542 - 3755 (May) 671 1 1 672 609 - 3746 (Jun) 843 2 11 806 709 - 401
7 (Jul) 759 3 9 731 636 - 4238 (Aug) 673 1 - 681 589 - 4169 (Sep) 685 5 4 683 587 1 418
10 (Oct) 642 1 - 565 420 - 49611 (Nov) 688 2 2 671 536 - 51212 (Dec) 548 - 1 537 411 - 511
数 量Quantity
年 月Year and Month
124

時系列表 (非鉄金属編) 製品
(3) 非鉄金属製品(伸銅製品) Non-ferrous metal products (Elongated copper products) (単位:t、Unit: t)
(イ) 黄 銅 製 品 (条) Strips
出 荷 Shipments生 産 受 入 消 費 販 売 Sales 在 庫
金額(百万円) そ の 他Production Receipts Consumption Value Others Inventory
(million yen)
平成19年 (2007) 129,386 495 1,121 128,460 121,088 6 5,55720 (2008) 124,248 403 930 122,994 105,049 5 6,38421 (2009) 77,673 96 547 78,357 49,321 - 5,37722 (2010) 114,944 76 869 112,965 82,332 2,106 4,42723 (2011) 106,003 275 781 104,766 81,649 791 4,669
平成21年度 (09FY) 98,973 85 592 98,004 65,346 801 4,81622 (10FY) 110,795 125 890 109,686 81,880 1,505 3,717
平成23年 1~3月 (Q1) 25,367 62 230 25,816 20,827 200 3,7174~6 (Q2) 26,307 120 232 25,055 20,914 198 4,7237~9 (Q3) 25,773 68 168 25,985 20,669 335 4,065
10~12 (Q4) 28,556 25 151 27,910 19,239 58 4,669
平成23年 1月 (Jan) 8,348 6 66 8,574 6,756 200 3,9502 (Feb) 8,510 14 72 8,595 6,982 - 3,8973 (Mar) 8,509 42 92 8,647 7,090 - 3,7174 (Apr) 9,032 36 87 8,464 7,343 - 4,2525 (May) 8,426 31 70 7,968 6,619 100 4,4806 (Jun) 8,849 53 75 8,623 6,952 98 4,723
7 (Jul) 8,583 12 64 8,126 6,608 54 4,9418 (Aug) 7,476 24 43 8,033 6,476 235 4,1169 (Sep) 9,714 32 61 9,826 7,585 46 4,065
10 (Oct) 9,671 17 46 9,550 6,915 53 4,10411 (Nov) 9,896 6 47 9,648 6,391 4 4,30512 (Dec) 8,989 2 58 8,712 5,933 1 4,669
(単位:t、Unit: t)
(ウ) 黄 銅 製 品 (管) Pi d b
数 量Quantity
年 月Year and Month
125
(ウ) 黄 銅 製 品 (管) Pipes and tubes
出 荷 Shipments生 産 受 入 消 費 販 売 Sales 在 庫
金額(百万円) そ の 他Production Receipts Consumption Value Others Inventory
(million yen)
平成19年 (2007) 14,560 32 - 14,813 16,620 - 24920 (2008) 13,391 19 - 13,526 15,166 - 12921 (2009) 9,717 12 - 9,737 8,860 - 9822 (2010) 10,002 34 - 10,092 9,970 - 4923 (2011) 10,617 13 - 10,493 10,615 - 171
平成21年度 (09FY) 9,698 11 - 9,674 8,994 - 12722 (10FY) 10,206 35 - 10,287 10,236 - 82
平成23年 1~3月 (Q1) 2,670 3 - 2,631 2,717 - 824~6 (Q2) 2,592 3 - 2,511 2,631 - 1667~9 (Q3) 2,545 4 - 2,511 2,530 - 201
10~12 (Q4) 2,810 3 - 2,840 2,737 - 171
平成23年 1月 (Jan) 773 1 - 752 749 - 662 (Feb) 938 1 - 940 992 - 613 (Mar) 959 1 - 939 976 - 824 (Apr) 933 1 - 931 949 - 855 (May) 780 1 - 773 836 - 936 (Jun) 879 1 - 807 846 - 166
7 (Jul) 808 2 - 824 848 - 1528 (Aug) 834 1 - 854 851 - 1309 (Sep) 903 1 - 833 831 - 201
10 (Oct) 954 1 - 1,004 978 - 15211 (Nov) 923 1 - 909 847 - 16512 (Dec) 933 1 - 927 912 - 171
数 量Quantity
年 月Year and Month
125

時系列表 (非鉄金属編) 製品
(3) 非鉄金属製品(伸銅製品) Non-ferrous metal products (Elongated copper products) (単位:t、Unit: t)
生 産 受 入 消 費 在 庫金額(百万円) そ の 他
Production Receipts Consumption Value Others Inventory(million yen)
平成19年 (2007) 231,677 3,514 8,455 225,493 169,725 1,311 7,54220 (2008) 213,568 3,333 7,581 208,763 137,312 1,008 6,64321 (2009) 151,696 2,599 6,483 146,626 67,625 1,307 6,06622 (2010) 190,855 2,732 8,211 182,028 108,415 818 8,50423 (2011) 191,281 2,948 9,219 183,854 118,427 797 8,749
平成21年度 (09FY) 165,337 2,596 7,115 158,301 81,775 1,325 6,10822 (10FY) 194,234 2,687 8,459 184,667 113,469 874 9,077
平成23年 1~3月 (Q1) 49,496 643 2,295 47,079 31,236 250 9,0774~6 (Q2) 51,027 732 2,421 49,632 33,996 171 8,8877~9 (Q3) 48,495 830 2,243 46,331 29,820 185 9,336
10~12 (Q4) 42,263 743 2,260 40,812 23,375 191 8,749
平成23年 1月 (Jan) 15,388 203 726 15,414 9,810 86 7,9272 (Feb) 16,473 208 762 15,716 10,321 80 8,0943 (Mar) 17,635 232 807 15,949 11,105 84 9,0774 (Apr) 16,878 212 811 15,944 11,108 64 9,4085 (May) 16,865 256 785 16,650 11,371 48 9,2336 (Jun) 17,284 264 825 17,038 11,516 59 8,887
7 (Jul) 17,374 267 777 15,970 10,554 48 9,6588 (Aug) 15,252 229 712 14,972 9,583 59 9,3979 (Sep) 15,869 334 754 15,389 9,683 78 9,336
10 (Oct) 14,006 258 748 13,683 8,314 46 8,91611 (Nov) 14,967 268 770 14,072 7,900 82 9,16812 (Dec) 13,290 217 742 13,057 7,161 63 8,749
(単位:t、Unit: t)
(オ) 黄 銅 製 品 (線) Wi
出 荷 Shipments販 売 Sales
数 量Quantity
年 月Year and Month
(エ) 黄 銅 製 品 (棒) Rods and bars
126
(オ) 黄 銅 製 品 (線) Wires
出 荷 Shipments生 産 受 入 消 費 販 売 Sales 在 庫
金額(百万円) そ の 他Production Receipts Consumption Value Others Inventory
(million yen)
平成19年 (2007) 40,652 - 5,040 35,127 32,234 32 2,15320 (2008) 36,622 4 4,906 31,722 26,956 36 1,99421 (2009) 26,926 13 2,841 24,108 14,905 43 1,88922 (2010) 34,989 - 4,779 29,832 23,389 14 2,74023 (2011) 29,907 - 4,483 25,068 21,088 10 3,522
平成21年度 (09FY) 29,851 7 3,159 26,465 17,995 17 2,12422 (10FY) 34,736 - 4,775 29,636 23,916 8 2,926
平成23年 1~3月 (Q1) 8,300 - 1,140 7,061 6,163 - 2,9264~6 (Q2) 8,508 - 1,336 7,325 6,419 8 2,8697~9 (Q3) 6,224 - 979 5,410 4,576 1 2,863
10~12 (Q4) 6,875 - 1,028 5,272 3,930 1 3,522
平成23年 1月 (Jan) 2,689 - 339 1,971 1,632 - 3,1032 (Feb) 2,680 - 349 2,500 2,188 - 3,0363 (Mar) 2,931 - 452 2,590 2,342 - 2,9264 (Apr) 3,236 - 481 2,642 2,339 8 3,0715 (May) 2,675 - 404 2,369 2,088 - 3,0066 (Jun) 2,597 - 451 2,314 1,992 - 2,869
7 (Jul) 2,355 - 370 1,920 1,660 - 2,9858 (Aug) 1,863 - 256 1,611 1,350 - 3,0679 (Sep) 2,006 - 353 1,879 1,566 1 2,863
10 (Oct) 2,309 - 343 1,853 1,452 1 2,99411 (Nov) 2,243 - 352 1,827 1,358 - 3,09312 (Dec) 2,323 - 333 1,592 1,120 - 3,522
数 量Quantity
年 月Year and Month
126

時系列表 (非鉄金属編) 製品
(3) 非鉄金属製品(伸銅製品) Non-ferrous metal products (Elongated copper products) (単位:t、Unit: t)
エ. そ の 他 の 伸 銅 製 品 計 (ア)~(イ) Total of other non-ferrous metal products
出 荷 Shipments生 産 受 入 消 費 販 売 Sales 在 庫
金額(百万円) そ の 他Production Receipts Consumption Value Others Inventory
(million yen)
平成19年 (2007) 75,592 764 1,297 75,065 106,992 4 3,93620 (2008) 68,957 831 1,342 67,297 95,025 2 4,87021 (2009) 44,822 638 968 45,387 48,375 3 3,72722 (2010) 63,964 924 1,581 62,200 78,521 - 4,60723 (2011) 54,377 829 1,367 53,677 75,402 2 4,524
平成21年度 (09FY) 55,920 714 1,125 56,237 63,080 3 3,60722 (10FY) 60,798 922 1,529 58,912 76,871 1 4,690
平成23年 1~3月 (Q1) 13,292 241 368 13,027 18,299 1 4,6904~6 (Q2) 14,873 234 371 14,617 21,374 - 4,7287~9 (Q3) 13,558 152 308 13,674 19,407 - 4,410
10~12 (Q4) 12,654 202 320 12,359 16,322 1 4,524
平成23年 1月 (Jan) 4,562 118 98 4,557 6,406 1 4,6342 (Feb) 4,504 66 113 4,476 6,265 - 4,6353 (Mar) 4,226 57 157 3,994 5,628 - 4,6904 (Apr) 4,692 104 116 4,892 7,292 - 4,4505 (May) 5,132 67 112 4,853 7,087 - 4,7206 (Jun) 5,049 63 143 4,872 6,995 - 4,728
7 (Jul) 4,730 56 120 4,749 6,722 - 4,7188 (Aug) 4,151 40 58 4,275 6,098 - 4,5429 (Sep) 4,677 56 130 4,650 6,587 - 4,410
10 (Oct) 4,314 87 107 4,250 5,884 - 4,45511 (Nov) 4,445 71 98 4,210 5,451 1 4,65312 (Dec) 3,895 44 115 3,899 4,987 - 4,524
(単位:t、Unit: t)
(ア) そ の 他 の 伸 銅 製 品 (板 条) Pl d h / i
数 量Quantity
年 月Year and Month
127
(ア) そ の 他 の 伸 銅 製 品 (板・条) Plates and sheets/strips
出 荷 Shipments生 産 受 入 消 費 販 売 Sales 在 庫
金額(百万円) そ の 他Production Receipts Consumption Value Others Inventory
(million yen)
平成19年 (2007) 66,080 764 186 66,718 97,405 - 3,41820 (2008) 59,574 829 171 59,139 85,909 - 4,29121 (2009) 38,662 632 130 39,959 43,825 - 3,33422 (2010) 55,105 880 175 54,748 71,204 - 4,21723 (2011) 45,884 798 149 46,362 67,721 - 4,192
平成21年度 (09FY) 48,909 683 150 50,150 57,624 - 3,19822 (10FY) 51,916 894 167 51,389 69,445 - 4,302
平成23年 1~3月 (Q1) 11,001 232 31 11,082 16,299 - 4,3024~6 (Q2) 12,727 227 43 12,696 19,308 - 4,4307~9 (Q3) 11,511 145 42 11,901 17,513 - 4,118
10~12 (Q4) 10,645 194 33 10,683 14,602 - 4,192
平成23年 1月 (Jan) 3,811 115 13 3,909 5,729 - 4,2232 (Feb) 3,758 65 9 3,799 5,568 - 4,2393 (Mar) 3,432 52 9 3,374 5,003 - 4,3024 (Apr) 4,003 103 12 4,231 6,579 - 4,1415 (May) 4,429 63 15 4,250 6,438 - 4,3996 (Jun) 4,295 61 16 4,215 6,291 - 4,430
7 (Jul) 4,004 53 14 4,148 6,082 - 4,3998 (Aug) 3,543 38 14 3,709 5,502 - 4,2409 (Sep) 3,964 54 14 4,044 5,929 - 4,118
10 (Oct) 3,644 85 13 3,687 5,272 - 4,14711 (Nov) 3,760 67 12 3,613 4,852 - 4,34912 (Dec) 3,241 42 8 3,383 4,478 - 4,192
数 量Quantity
年 月Year and Month
127

時系列表 (非鉄金属編) 製品
(3) 非鉄金属製品(伸銅製品) Non-ferrous metal products (Elongated copper products) (単位:t、Unit: t)
(イ). そ の 他 の 伸 銅 製 品 (棒・線) Rods and bars/wires
出 荷 Shipments生 産 受 入 消 費 販 売 Sales 在 庫
金額(百万円) そ の 他Production Receipts Consumption Value Others Inventory
(million yen)
平成19年 (2007) 9,512 - 1,111 8,347 9,587 4 51820 (2008) 9,383 2 1,171 8,158 9,116 2 57921 (2009) 6,160 6 838 5,428 4,549 3 39322 (2010) 8,859 44 1,406 7,452 7,317 - 39023 (2011) 8,493 31 1,218 7,315 7,681 2 332
平成21年度 (09FY) 7,011 31 975 6,087 5,457 3 40922 (10FY) 8,882 28 1,362 7,523 7,426 1 388
平成23年 1~3月 (Q1) 2,291 9 337 1,945 2,000 1 3884~6 (Q2) 2,146 7 328 1,921 2,066 - 2987~9 (Q3) 2,047 7 266 1,773 1,895 - 292
10~12 (Q4) 2,009 8 287 1,676 1,721 1 332
平成23年 1月 (Jan) 751 3 85 648 678 1 4112 (Feb) 746 1 104 677 697 - 3963 (Mar) 794 5 148 620 625 - 3884 (Apr) 689 1 104 661 713 - 3095 (May) 703 4 97 603 649 - 3216 (Jun) 754 2 127 657 704 - 298
7 (Jul) 726 3 106 601 640 - 3198 (Aug) 608 2 44 566 596 - 3029 (Sep) 713 2 116 606 658 - 292
10 (Oct) 670 2 94 563 612 - 30811 (Nov) 685 4 86 597 599 1 30412 (Dec) 654 2 107 516 509 - 332
数 量Quantity
年 月Year and Month
128128

時系列表 (非鉄金属編) 製品
(単位:t、Unit: t)
出 荷 Shipments
生 産 受 入 消 費 販 売 Sales 在 庫 金額(百万円) その他
Production Receipts Consumption Value Others Inventory(million yen)
平成19年 (2007) 2,318,673 18,471 527,691 1,771,594 915,493 34,576 62,67520 (2008) 2,223,372 19,717 473,095 1,729,486 867,089 32,738 66,95621 (2009) 1,724,782 17,744 373,409 1,348,781 583,769 29,310 54,93322 (2010) 2,042,189 27,741 416,878 1,620,153 722,946 32,453 54,10823 (2011) 1,975,125 34,366 454,737 1,520,219 678,287 29,723 57,923
平成21年度 (09FY) 1,872,373 21,152 386,373 1,477,753 633,288 31,210 49,14522 (10FY) 2,033,752 29,549 428,745 1,600,932 715,534 31,948 49,176
平成23年 1~3月 (Q1) 485,984 8,227 106,413 384,298 170,837 7,700 49,1764~6 (Q2) 506,476 8,304 105,163 400,219 176,931 8,057 51,5277~9 (Q3) 485,916 8,218 113,508 370,848 167,450 7,217 53,081
10~12 (Q4) 496,749 9,617 129,653 364,854 163,069 6,749 57,923
平成23年 1月 (Jan) 154,133 2,746 35,726 119,675 53,210 2,427 52,9152 (Feb) 165,339 2,794 34,752 131,807 58,714 2,555 51,7703 (Mar) 166,512 2,687 35,935 132,816 58,913 2,718 49,1764 (Apr) 165,473 2,757 34,302 128,068 56,148 2,656 52,1105 (May) 166,730 2,729 32,942 132,686 58,212 2,704 54,8106 (Jun) 174,273 2,818 37,919 139,465 62,571 2,697 51,527
7 (Jul) 173,104 2,754 38,278 131,374 59,072 2,638 54,8848 (Aug) 151,377 2,610 36,774 116,666 52,927 2,417 52,7939 (Sep) 161,435 2,854 38,456 122,808 55,451 2,162 53,081
10 (Oct) 168,690 3,216 41,927 126,171 56,594 2,338 54,47311 (Nov) 169,660 3,207 44,607 126,055 56,044 2,224 53,56712 (Dec) 158,399 3,194 43,119 112,628 50,431 2,187 57,923
(単位:t、Unit: t)
② 板 製 品 計 ア~ウ Total of flat rolled products
数 量Quantity
年 月Year and Month
① 合 計 (はくを除く) ②~③ Total (excluding aluminum foils)
(4) 非鉄金属製品(アルミニウム圧延製品) Non-ferrous metal products (Aluminum mill products)
129
出 荷 Shipments生 産 受 入 消 費 販 売 Sales 在 庫
金額(百万円) その他Production Receipts Consumption Value Others Inventory
(million yen)
平成19年 (2007) 1,359,295 6,333 48,501 1,307,223 576,187 5,974 50,97820 (2008) 1,351,144 6,875 45,928 1,297,245 563,809 6,256 56,14221 (2009) 1,062,775 5,350 34,675 1,037,822 384,527 6,280 42,57522 (2010) 1,280,893 7,525 42,843 1,233,910 482,401 9,457 42,96823 (2011) 1,192,726 7,254 39,996 1,149,986 451,735 8,177 45,653
平成21年度 (09FY) 1,170,449 6,370 40,858 1,131,669 420,390 7,419 37,81222 (10FY) 1,263,692 7,188 42,708 1,217,144 476,351 9,060 38,068
平成23年 1~3月 (Q1) 294,544 1,747 10,395 288,411 113,257 1,980 38,0684~6 (Q2) 322,204 1,876 10,484 311,772 123,484 1,974 39,5357~9 (Q3) 292,074 1,875 10,317 279,413 110,306 2,179 41,362
10~12 (Q4) 283,904 1,756 8,800 270,390 104,688 2,044 45,653
平成23年 1月 (Jan) 91,655 596 3,397 88,768 34,947 583 42,2052 (Feb) 101,794 609 3,581 99,285 39,042 721 40,9793 (Mar) 101,095 542 3,417 100,358 39,268 676 38,0684 (Apr) 104,058 606 3,401 98,602 38,877 656 40,0165 (May) 109,603 574 3,416 105,214 41,769 619 42,7196 (Jun) 108,543 696 3,667 107,956 42,838 699 39,535
7 (Jul) 107,464 634 3,802 100,324 39,527 742 42,7818 (Aug) 88,872 563 3,269 87,280 34,580 691 40,8869 (Sep) 95,738 678 3,246 91,809 36,199 746 41,362
10 (Oct) 98,472 608 3,425 93,914 36,592 761 42,27211 (Nov) 97,019 584 3,224 93,635 36,244 684 41,44312 (Dec) 88,413 564 2,151 82,841 31,852 599 45,653
数 量Quantity
年 月Year and Month
② 板 製 品 計 ア~ウ Total of flat rolled products
129

時系列表 (非鉄金属編) 製品
(単位:t、Unit: t)
出 荷 Shipments
生 産 受 入 消 費 販 売 Sales 在 庫 金額(百万円) その他
Production Receipts Consumption Value Others Inventory(million yen)
平成19年 (2007) 212,595 2,826 - 212,162 113,268 1,463 7,82520 (2008) 211,573 2,897 - 211,777 108,706 1,124 9,15821 (2009) 128,156 1,671 - 130,411 55,140 952 7,64022 (2010) 166,946 2,948 - 170,851 73,984 1,856 4,68423 (2011) 151,405 2,839 - 152,287 69,461 1,874 4,812
平成21年度 (09FY) 149,794 2,133 - 151,359 62,435 1,198 6,18922 (10FY) 166,371 2,974 - 169,089 74,156 2,056 4,384
平成23年 1~3月 (Q1) 41,944 806 - 42,448 18,678 645 4,3844~6 (Q2) 45,604 797 - 46,053 20,970 512 4,2047~9 (Q3) 32,463 733 - 31,846 15,042 446 5,105
10~12 (Q4) 31,394 503 - 31,940 14,771 271 4,812
平成23年 1月 (Jan) 12,826 270 - 13,208 5,799 234 4,3632 (Feb) 13,953 292 - 14,218 6,220 210 4,1953 (Mar) 15,165 244 - 15,022 6,659 201 4,3844 (Apr) 15,458 294 - 14,966 6,510 176 4,9845 (May) 15,395 204 - 15,809 7,368 159 4,6146 (Jun) 14,751 299 - 15,278 7,092 177 4,204
7 (Jul) 12,102 241 - 11,623 5,495 154 4,8118 (Aug) 9,996 199 - 9,803 4,689 139 5,0399 (Sep) 10,365 293 - 10,420 4,858 153 5,105
10 (Oct) 10,490 187 - 11,209 5,212 93 4,49511 (Nov) 10,544 165 - 11,054 5,080 93 4,05912 (Dec) 10,360 151 - 9,677 4,479 85 4,812
(単位:t、Unit: t)イ. 円 板 Circles
数 量Quantity
年 月Year and Month
ア. 板 Plates and sheets
(4) 非鉄金属製品(アルミニウム圧延製品) Non-ferrous metal products (Aluminum mill products)
130
出 荷 Shipments生 産 受 入 消 費 販 売 Sales 在 庫
金額(百万円) その他Production Receipts Consumption Value Others Inventory
(million yen)
平成19年 (2007) 27,663 - - 27,703 22,639 212 1,24420 (2008) 24,895 - - 24,580 19,239 183 1,35621 (2009) 18,037 - 61 18,378 11,614 134 81922 (2010) 23,584 - 1 23,661 15,365 142 59723 (2011) 20,449 - 126 19,941 12,700 285 697
平成21年度 (09FY) 21,328 - 61 21,355 13,547 125 73322 (10FY) 22,794 - 3 22,535 14,503 141 864
平成23年 1~3月 (Q1) 5,356 - 2 5,060 3,125 31 8644~6 (Q2) 5,725 - 30 5,866 3,922 62 6307~9 (Q3) 5,026 - - 4,922 3,161 106 631
10~12 (Q4) 4,342 - 94 4,093 2,492 86 697
平成23年 1月 (Jan) 1,749 - - 1,728 1,090 8 6102 (Feb) 1,873 - 2 1,810 1,155 8 6673 (Mar) 1,734 - - 1,522 880 15 8644 (Apr) 1,872 - - 2,097 1,447 11 6285 (May) 1,884 - 20 1,747 1,154 15 7296 (Jun) 1,969 - 10 2,022 1,321 36 630
7 (Jul) 1,853 - - 1,837 1,176 34 6158 (Aug) 1,609 - - 1,534 981 40 6509 (Sep) 1,564 - - 1,551 1,004 32 631
10 (Oct) 1,573 - 10 1,435 905 37 71911 (Nov) 1,366 - 84 1,308 796 33 66012 (Dec) 1,403 - - 1,350 791 16 697
数 量Quantity
年 月Year and Month
イ. 円 板 Circles
130

時系列表 (非鉄金属編) 製品
(単位:t、Unit: t)
出 荷 Shipments
生 産 受 入 消 費 販 売 Sales 在 庫 金額(百万円) その他
Production Receipts Consumption Value Others Inventory(million yen)
平成19年 (2007) 1,119,037 3,507 48,501 1,067,358 440,280 4,299 41,90920 (2008) 1,114,676 3,978 45,928 1,060,888 435,864 4,949 45,62821 (2009) 916,582 3,679 34,614 889,033 317,773 5,194 34,11622 (2010) 1,090,363 4,577 42,842 1,039,398 393,052 7,459 37,68723 (2011) 1,020,872 4,415 39,870 977,758 369,574 6,018 40,144
平成21年度 (09FY) 999,327 4,237 40,797 958,955 344,408 6,096 30,89022 (10FY) 1,074,527 4,214 42,705 1,025,520 387,692 6,863 32,820
平成23年 1~3月 (Q1) 247,244 941 10,393 240,903 91,454 1,304 32,8204~6 (Q2) 270,875 1,079 10,454 259,853 98,592 1,400 34,7017~9 (Q3) 254,585 1,142 10,317 242,645 92,103 1,627 35,626
10~12 (Q4) 248,168 1,253 8,706 234,357 87,425 1,687 40,144
平成23年 1月 (Jan) 77,080 326 3,397 73,832 28,058 341 37,2322 (Feb) 85,968 317 3,579 83,257 31,667 503 36,1173 (Mar) 84,196 298 3,417 83,814 31,729 460 32,8204 (Apr) 86,728 312 3,401 81,539 30,920 469 34,4045 (May) 92,324 370 3,396 87,658 33,247 445 37,3766 (Jun) 91,823 397 3,657 90,656 34,425 486 34,701
7 (Jul) 93,509 393 3,802 86,864 32,856 554 37,3558 (Aug) 77,267 364 3,269 75,943 28,910 512 35,1979 (Sep) 83,809 385 3,246 79,838 30,337 561 35,626
10 (Oct) 86,409 421 3,415 81,270 30,475 631 37,05811 (Nov) 85,109 419 3,140 81,273 30,368 558 36,72412 (Dec) 76,650 413 2,151 71,814 26,582 498 40,144
(単位:t、Unit: t)③ 押出品計 ア~ウ Total of aluminum extruded products
数 量Quantity
年 月Year and Month
ウ. 条 Strips
(4) 非鉄金属製品(アルミニウム圧延製品) Non-ferrous metal products (Aluminum mill products)
131
出 荷 Shipments生 産 受 入 消 費 販 売 Sales 在 庫
金額(百万円) その他Production Receipts Consumption Value Others Inventory
(million yen)
平成19年 (2007) 959,378 12,138 479,190 464,371 339,306 28,602 11,69720 (2008) 872,228 12,842 427,167 432,241 303,280 26,482 10,81421 (2009) 662,007 12,394 338,734 310,959 199,242 23,030 12,35822 (2010) 761,296 20,216 374,035 386,243 240,545 22,996 11,14023 (2011) 782,399 27,112 414,741 370,233 226,552 21,546 12,270
平成21年度 (09FY) 701,924 14,782 345,515 346,084 212,898 23,791 11,33322 (10FY) 770,060 22,361 386,037 383,788 239,183 22,888 11,108
平成23年 1~3月 (Q1) 191,440 6,480 96,018 95,887 57,580 5,720 11,1084~6 (Q2) 184,272 6,428 94,679 88,447 53,447 6,083 11,9927~9 (Q3) 193,842 6,343 103,191 91,435 57,144 5,038 11,719
10~12 (Q4) 212,845 7,861 120,853 94,464 58,381 4,705 12,270
平成23年 1月 (Jan) 62,478 2,150 32,329 30,907 18,263 1,844 10,7102 (Feb) 63,545 2,185 31,171 32,522 19,672 1,834 10,7913 (Mar) 65,417 2,145 32,518 32,458 19,645 2,042 11,1084 (Apr) 61,415 2,151 30,901 29,466 17,271 2,000 12,0945 (May) 57,127 2,155 29,526 27,472 16,443 2,085 12,0916 (Jun) 65,730 2,122 34,252 31,509 19,733 1,998 11,992
7 (Jul) 65,640 2,120 34,476 31,050 19,545 1,896 12,1038 (Aug) 62,505 2,047 33,505 29,386 18,347 1,726 11,9079 (Sep) 65,697 2,176 35,210 30,999 19,252 1,416 11,719
10 (Oct) 70,218 2,608 38,502 32,257 20,002 1,577 12,20111 (Nov) 72,641 2,623 41,383 32,420 19,800 1,540 12,12412 (Dec) 69,986 2,630 40,968 29,787 18,579 1,588 12,270
数 量Quantity
年 月Year and Month
③ 押出品計 ア~ウ Total of aluminum extruded products
131

時系列表 (非鉄金属編) 製品
(単位:t、Unit: t)
出 荷 Shipments
生 産 受 入 消 費 販 売 Sales 在 庫 金額(百万円) その他
Production Receipts Consumption Value Others Inventory(million yen)
平成19年 (2007) 72,615 - 2,185 67,987 54,183 2,399 1,09620 (2008) 67,077 - 2,003 62,520 48,896 2,425 1,25621 (2009) 46,092 21 1,067 43,524 30,403 1,512 1,25122 (2010) 58,183 6 1,529 54,870 40,127 1,942 1,15523 (2011) 51,380 8 837 48,935 35,717 1,840 1,015
平成21年度 (09FY) 51,722 15 1,169 48,982 33,809 1,669 1,10722 (10FY) 57,093 3 1,441 53,903 39,646 1,896 1,051
平成23年 1~3月 (Q1) 13,743 - 240 13,219 9,560 476 1,0514~6 (Q2) 12,529 2 172 11,861 8,851 498 1,0537~9 (Q3) 12,732 - 188 12,123 8,921 452 1,022
10~12 (Q4) 12,376 6 237 11,732 8,385 414 1,015
平成23年 1月 (Jan) 4,376 - 77 4,270 3,043 131 1,0572 (Feb) 4,757 - 86 4,611 3,335 166 1,0363 (Mar) 4,610 - 77 4,338 3,182 179 1,0514 (Apr) 4,189 2 75 3,777 2,789 167 1,2225 (May) 3,816 - 65 3,681 2,743 161 1,1326 (Jun) 4,524 - 32 4,403 3,319 170 1,053
7 (Jul) 4,504 - 55 4,224 3,230 152 1,1268 (Aug) 3,895 - 63 3,779 2,726 156 1,0239 (Sep) 4,333 - 70 4,120 2,965 144 1,022
10 (Oct) 4,350 - 79 4,080 2,960 136 1,07711 (Nov) 4,268 2 93 4,061 2,834 149 1,04412 (Dec) 3,758 4 65 3,591 2,591 129 1,015
(単位:t、Unit: t)イ. 棒 ・線 Rods and bars/wires
数 量Quantity
ア. 管 Pipes and tubes
年 月Year and Month
(4) 非鉄金属製品(アルミニウム圧延製品) Non-ferrous metal products (Aluminum mill products)
132
出 荷 Shipments生 産 受 入 消 費 販 売 Sales 在 庫
金額(百万円) その他Production Receipts Consumption Value Others Inventory
(million yen)
平成19年 (2007) 64,308 9,292 317 71,603 35,496 2,502 2,13520 (2008) 61,393 10,039 270 68,569 32,640 2,768 1,95921 (2009) 33,532 8,290 176 39,218 16,668 922 3,46222 (2010) 51,370 13,401 258 63,539 26,344 2,560 1,88023 (2011) 48,119 11,507 222 56,089 24,474 2,213 2,916
平成21年度 (09FY) 40,437 10,574 180 48,544 19,981 1,359 2,86822 (10FY) 51,696 12,759 262 62,669 26,488 2,510 1,886
平成23年 1~3月 (Q1) 12,094 2,925 59 14,399 6,176 555 1,8864~6 (Q2) 12,738 2,915 52 14,339 6,249 747 2,4017~9 (Q3) 12,035 2,742 57 13,838 6,194 545 2,737
10~12 (Q4) 11,252 2,925 54 13,513 5,855 366 2,916
平成23年 1月 (Jan) 3,774 970 15 4,786 2,016 191 1,6322 (Feb) 4,033 995 16 4,761 2,059 131 1,7513 (Mar) 4,287 960 28 4,852 2,101 233 1,8864 (Apr) 4,450 980 20 4,945 2,133 203 2,1495 (May) 4,139 990 9 4,744 2,045 288 2,2366 (Jun) 4,149 945 23 4,650 2,071 256 2,401
7 (Jul) 4,237 947 15 4,779 2,139 245 2,5458 (Aug) 3,776 887 19 4,480 2,019 159 2,5519 (Sep) 4,022 908 23 4,579 2,036 141 2,737
10 (Oct) 3,993 985 18 4,717 2,064 155 2,82611 (Nov) 3,847 970 20 4,677 2,019 92 2,85512 (Dec) 3,412 970 16 4,119 1,772 119 2,916
数 量Quantity
年 月Year and Month
イ. 棒 ・線 Rods and bars/wires
132

時系列表 (非鉄金属編) 製品
(単位:t、Unit: t)
出 荷 Shipments
生 産 受 入 消 費 販 売 Sales 在 庫 金額(百万円) その他
Production Receipts Consumption Value Others Inventory(million yen)
平成19年 (2007) 822,455 2,846 476,688 324,781 249,627 23,701 8,46620 (2008) 743,758 2,803 424,894 301,152 221,744 21,289 7,59921 (2009) 582,383 4,083 337,491 228,217 152,171 20,596 7,64522 (2010) 651,743 6,809 372,248 267,834 174,074 18,494 8,10523 (2011) 682,900 15,597 413,682 265,209 166,361 17,493 8,339
平成21年度 (09FY) 609,765 4,193 344,166 248,558 159,108 20,763 7,35822 (10FY) 661,271 9,599 384,334 267,216 173,049 18,482 8,171
平成23年 1~3月 (Q1) 165,603 3,555 95,719 68,269 41,844 4,689 8,1714~6 (Q2) 159,005 3,511 94,455 62,247 38,347 4,838 8,5387~9 (Q3) 169,075 3,601 102,946 65,474 42,029 4,041 7,960
10~12 (Q4) 189,217 4,930 120,562 69,219 44,141 3,925 8,339
平成23年 1月 (Jan) 54,328 1,180 32,237 21,851 13,204 1,522 8,0212 (Feb) 54,755 1,190 31,069 23,150 14,278 1,537 8,0043 (Mar) 56,520 1,185 32,413 23,268 14,362 1,630 8,1714 (Apr) 52,776 1,169 30,806 20,744 12,349 1,630 8,7235 (May) 49,172 1,165 29,452 19,047 11,655 1,636 8,7236 (Jun) 57,057 1,177 34,197 22,456 14,343 1,572 8,538
7 (Jul) 56,899 1,173 34,406 22,047 14,176 1,499 8,4328 (Aug) 54,834 1,160 33,423 21,127 13,602 1,411 8,3339 (Sep) 57,342 1,268 35,117 22,300 14,251 1,131 7,960
10 (Oct) 61,875 1,623 38,405 23,460 14,978 1,286 8,29811 (Nov) 64,526 1,651 41,270 23,682 14,947 1,299 8,22512 (Dec) 62,816 1,656 40,887 22,077 14,216 1,340 8,339
(単位:t、Unit: t)
④ は く Foils
数 量Quantity
年 月Year and Month
ウ. 形 材 Shapes and profiles
(4) 非鉄金属製品(アルミニウム圧延製品) Non-ferrous metal products (Aluminum mill products)
133
出 荷 Shipments生 産 受 入 消 費 販 売 Sales 在 庫
金額(百万円) その他Production Receipts Consumption Value Others Inventory
(million yen)
平成19年 (2007) 136,587 1,153 - 138,661 130,459 28 6,34420 (2008) 129,191 8,712 - 128,186 127,837 9,384 6,53621 (2009) 97,538 4,728 - 98,544 95,282 5,111 5,10422 (2010) 122,387 6,317 - 121,266 110,499 6,432 6,07123 (2011) 118,327 7,132 - 116,395 113,179 8,497 5,782
平成21年度 (09FY) 111,997 5,008 - 111,833 102,197 5,525 5,16822 (10FY) 121,788 6,671 - 121,104 112,050 6,895 5,700
平成23年 1~3月 (Q1) 28,734 1,659 - 28,949 27,557 1,927 5,7004~6 (Q2) 31,672 2,018 - 31,229 30,269 2,242 5,0247~9 (Q3) 31,477 1,912 - 30,792 29,495 2,301 5,265
10~12 (Q4) 26,444 1,543 - 25,425 25,858 2,027 5,782
平成23年 1月 (Jan) 9,177 463 - 9,220 8,874 654 5,8382 (Feb) 9,674 616 - 9,754 9,284 631 5,8543 (Mar) 9,883 580 - 9,975 9,399 642 5,7004 (Apr) 10,235 802 - 9,718 9,550 762 6,0815 (May) 10,093 590 - 10,419 9,830 710 5,6816 (Jun) 11,344 626 - 11,092 10,889 770 5,024
7 (Jul) 11,149 653 - 10,880 10,294 743 5,1638 (Aug) 9,898 626 - 9,552 9,175 764 5,3569 (Sep) 10,430 633 - 10,360 10,026 794 5,265
10 (Oct) 10,093 578 - 9,541 9,538 754 5,62311 (Nov) 8,962 505 - 8,880 8,841 667 5,54312 (Dec) 7,389 460 - 7,004 7,479 606 5,782
数 量Quantity
年 月Year and Month
④ は く Foils
133

時系列表 (非鉄金属編) 製品
(5) 非鉄金属製品(電線・ケ-ブル) Non-ferrous metal products (Electric wires/cables)(単位:導体t、 Unit: metal core tons)
ア. 銅 裸 線 (電 線 メ ー カ ー 向け 心 線 ) Bare copper wires (for electric wire manufactures)
出 荷 Shipments
生 産 受 入 販 売 Sales 在 庫
金額(百万円)
Production Receipts Value Inventory
(million yen)
平成19年 (2007) 635,492 35,226 555,732 385,821 114,789 8,69820 (2008) 608,516 34,346 530,369 345,932 113,414 8,19121 (2009) 451,804 27,594 425,016 167,344 54,548 7,91622 (2010) 471,516 31,715 447,056 232,560 57,145 6,64023 (2011) 471,683 29,970 439,518 259,727 63,814 5,840
平成21年度 (09FY) 454,870 29,458 429,568 183,433 53,758 5,84522 (10FY) 476,926 31,455 450,477 248,303 57,975 6,034
平成23年 1~3月 (Q1) 118,424 8,030 112,370 69,137 14,936 6,0344~6 (Q2) 129,310 7,469 118,787 74,469 17,773 6,4617~9 (Q3) 107,257 8,360 102,169 60,899 13,838 6,267
10~12 (Q4) 116,692 6,111 106,192 55,222 17,267 5,840
平成23年 1月 (Jan) 38,328 2,677 37,546 22,440 4,986 5,1812 (Feb) 39,206 2,594 36,331 22,369 5,262 5,4953 (Mar) 40,890 2,759 38,493 24,328 4,688 6,0344 (Apr) 48,149 2,501 42,446 26,603 6,930 7,3785 (May) 41,255 2,490 39,286 24,875 5,246 6,6616 (Jun) 39,906 2,478 37,055 22,991 5,597 6,461
7 (Jul) 37,447 2,337 34,621 21,102 5,060 6,6348 (Aug) 31,963 3,545 31,556 19,120 3,973 6,6829 (Sep) 37,847 2,478 35,992 20,677 4,805 6,267
10 (Oct) 39,037 1,684 36,129 19,224 5,594 5,34311 (Nov) 42,576 2,143 36,899 19,073 5,861 7,37712 (Dec) 35,079 2,284 33,164 16,925 5,812 5,840
(単位:導体t、 Unit: metal core tons)
イ 銅 線 (完 成 品) 合 計 (ア) (イ) C i ( l ) l
数 量Quantity
そ の 他Others
年 月Year and Month
134
イ. 銅 線 (完 成 品) 合 計 (ア)~(イ) Copper wires (complete) total
出 荷 Shipments
生 産 受 入 販 売 Sales 在 庫
金額(百万円)
Production Receipts Value Inventory
(million yen)
平成19年 (2007) 775,001 251,064 807,667 1,537,487 214,130 49,11220 (2008) 740,907 233,713 800,003 1,517,826 175,219 48,31521 (2009) 593,204 210,431 646,737 1,021,971 163,644 42,84922 (2010) 640,863 253,089 692,885 1,215,063 197,575 44,80923 (2011) 646,941 260,381 700,620 1,221,877 201,133 46,667
平成21年度 (09FY) 611,381 224,672 661,310 1,097,086 176,817 43,07122 (10FY) 640,188 258,490 697,254 1,220,653 199,732 42,545
平成23年 1~3月 (Q1) 154,727 65,396 173,502 305,486 48,305 42,5454~6 (Q2) 166,753 59,718 172,592 293,420 46,191 48,8877~9 (Q3) 156,220 65,268 172,190 319,848 51,436 46,048
10~12 (Q4) 169,241 69,999 182,336 303,123 55,201 46,667
平成23年 1月 (Jan) 51,375 21,546 57,998 102,569 16,544 43,0002 (Feb) 53,055 23,280 59,059 105,785 17,169 42,8243 (Mar) 50,297 20,570 56,445 97,132 14,592 42,5454 (Apr) 55,694 19,069 58,954 97,843 14,447 43,4725 (May) 54,883 19,242 54,789 91,329 14,918 47,3226 (Jun) 56,176 21,407 58,849 104,248 16,826 48,887
7 (Jul) 51,837 21,403 56,053 104,644 16,914 48,9658 (Aug) 48,976 20,822 56,194 102,424 15,717 46,2799 (Sep) 55,407 23,043 59,943 112,780 18,805 46,048
10 (Oct) 57,581 23,638 61,341 101,550 18,663 46,61211 (Nov) 57,471 23,861 61,565 97,842 18,627 47,31612 (Dec) 54,189 22,500 59,430 103,731 17,911 46,667
そ の 他Others
年 月Year and Month
数 量Quantity
134

時系列表 (非鉄金属編) 製品
(5) 非鉄金属製品(電線・ケ-ブル) Non-ferrous metal products (Electric wires/cables)(単位:導体t、 Unit: metal core tons)
(ア) 裸 線 ( ユーザー向 け) Bare copper wires (for users)
出 荷 Shipments
生 産 受 入 販 売 Sales 在 庫
金額(百万円)
Production Receipts Value Inventory
(million yen)
平成19年 (2007) 61,656 6,166 56,680 54,693 10,825 1,25220 (2008) 60,027 5,287 55,299 52,844 9,882 1,16421 (2009) 54,718 4,669 50,000 34,874 9,402 1,11322 (2010) 69,036 5,937 63,587 51,257 11,460 1,04923 (2011) 60,055 7,208 60,799 55,049 6,404 1,125
平成21年度 (09FY) 61,929 5,194 56,626 40,250 10,745 93122 (10FY) 67,990 6,305 64,382 54,007 9,955 954
平成23年 1~3月 (Q1) 15,618 1,651 15,913 14,184 1,493 9544~6 (Q2) 15,012 1,783 14,952 14,389 1,742 1,0597~9 (Q3) 14,161 1,681 14,365 13,294 1,558 985
10~12 (Q4) 15,264 2,093 15,569 13,182 1,611 1,125
平成23年 1月 (Jan) 5,114 545 5,205 4,580 462 1,0352 (Feb) 5,337 580 5,459 4,810 506 1,0313 (Mar) 5,167 526 5,249 4,794 525 9544 (Apr) 5,563 723 5,572 5,359 633 1,0315 (May) 4,890 492 4,864 4,672 533 1,0206 (Jun) 4,559 568 4,516 4,358 576 1,059
7 (Jul) 4,301 504 4,277 4,098 497 1,0878 (Aug) 5,387 557 5,403 4,923 498 1,1279 (Sep) 4,473 620 4,685 4,273 563 985
10 (Oct) 5,249 605 5,208 4,418 522 1,10611 (Nov) 4,620 790 4,790 4,111 590 1,11512 (Dec) 5,395 698 5,571 4,653 499 1,125
(単位:導体t、 Unit: metal core tons)
(イ) 絶 縁 電 線 計 f I l d i l
数 量Quantity
そ の 他Others
年 月Year and Month
135
(イ) 絶 縁 電 線 計 a~f Insulated wires total
出 荷 Shipments
生 産 受 入 販 売 Sales 在 庫
金額(百万円)
Production Receipts Value Inventory
(million yen)
平成19年 (2007) 713,345 244,898 750,987 1,482,794 203,305 47,86020 (2008) 680,880 228,426 744,704 1,464,982 165,337 47,15121 (2009) 538,486 205,762 596,737 987,097 154,242 41,73622 (2010) 571,827 247,152 629,298 1,163,806 186,115 43,76023 (2011) 586,886 253,173 639,821 1,166,828 194,729 45,542
平成21年度 (09FY) 549,452 219,478 604,684 1,056,836 166,072 42,14022 (10FY) 572,198 252,185 632,872 1,166,646 189,777 41,591
平成23年 1~3月 (Q1) 139,109 63,745 157,589 291,302 46,812 41,5914~6 (Q2) 151,741 57,935 157,640 279,031 44,449 47,8287~9 (Q3) 142,059 63,587 157,825 306,554 49,878 45,063
10~12 (Q4) 153,977 67,906 166,767 289,941 53,590 45,542
平成23年 1月 (Jan) 46,261 21,001 52,793 97,989 16,082 41,9652 (Feb) 47,718 22,700 53,600 100,975 16,663 41,7933 (Mar) 45,130 20,044 51,196 92,338 14,067 41,5914 (Apr) 50,131 18,346 53,382 92,484 13,814 42,4415 (May) 49,993 18,750 49,925 86,657 14,385 46,3026 (Jun) 51,617 20,839 54,333 99,890 16,250 47,828
7 (Jul) 47,536 20,899 51,776 100,546 16,417 47,8788 (Aug) 43,589 20,265 50,791 97,501 15,219 45,1529 (Sep) 50,934 22,423 55,258 108,507 18,242 45,063
10 (Oct) 52,332 23,033 56,133 97,132 18,141 45,50611 (Nov) 52,851 23,071 56,775 93,731 18,037 46,20112 (Dec) 48,794 21,802 53,859 99,078 17,412 45,542
そ の 他Others数 量
Quantity
年 月Year and Month
135

時系列表 (非鉄金属編) 製品
(5) 非鉄金属製品(電線・ケ-ブル) Non-ferrous metal products (Electric wires/cables)(単位:導体t、 Unit: metal core tons)
a. 巻 線 Winding wires
出 荷 Shipments
生 産 受 入 販 売 Sales 在 庫
金額(百万円)
Production Receipts Value Inventory
(million yen)
平成19年 (2007) 163,017 39,678 165,249 175,640 38,505 12,04120 (2008) 155,272 36,261 156,445 169,279 34,115 13,39421 (2009) 106,657 52,042 112,438 92,404 50,446 10,50622 (2010) 142,896 89,385 140,094 127,979 91,823 10,66223 (2011) 136,839 95,064 133,289 135,766 97,875 11,408
平成21年度 (09FY) 122,342 65,499 124,821 103,101 64,818 10,57422 (10FY) 141,621 94,324 139,071 130,597 96,661 10,415
平成23年 1~3月 (Q1) 33,447 23,751 33,333 32,751 24,158 10,4154~6 (Q2) 32,078 20,996 31,248 32,631 21,909 10,4567~9 (Q3) 35,256 24,476 33,988 35,616 25,192 11,168
10~12 (Q4) 36,058 25,841 34,720 34,768 26,616 11,408
平成23年 1月 (Jan) 10,722 8,041 11,112 10,864 8,285 10,0122 (Feb) 12,166 8,670 11,768 11,506 8,688 10,3673 (Mar) 10,559 7,040 10,453 10,381 7,185 10,4154 (Apr) 10,377 6,154 9,704 10,102 6,581 10,6625 (May) 9,772 6,666 9,886 10,414 7,129 10,1516 (Jun) 11,929 8,176 11,658 12,115 8,199 10,456
7 (Jul) 12,329 8,331 11,533 12,077 8,516 11,0888 (Aug) 9,841 7,340 10,367 10,996 7,724 10,1709 (Sep) 13,086 8,805 12,088 12,543 8,952 11,168
10 (Oct) 12,872 8,833 11,931 12,151 9,075 11,65011 (Nov) 12,196 8,883 11,824 11,685 8,914 11,85912 (Dec) 10,990 8,125 10,965 10,932 8,627 11,408
(単位:導体t、 Unit: metal core tons)
b 機 器 用 電 線 A li i
数 量Quantity
そ の 他Others
年 月Year and Month
136
b. 機 器 用 電 線 Appliance wires
出 荷 Shipments
生 産 受 入 販 売 Sales 在 庫
金額(百万円)
Production Receipts Value Inventory
(million yen)
平成19年 (2007) 54,359 4,506 55,458 194,036 3,202 5,04020 (2008) 48,522 4,135 49,988 176,069 2,939 4,42821 (2009) 34,747 2,361 35,168 119,193 1,922 3,71722 (2010) 44,446 2,692 44,097 164,103 2,528 4,08623 (2011) 44,197 3,181 45,013 161,699 2,476 3,856
平成21年度 (09FY) 38,190 2,221 37,889 131,912 2,183 3,86722 (10FY) 43,917 2,696 44,533 166,206 2,485 3,475
平成23年 1~3月 (Q1) 10,449 690 11,161 40,097 654 3,4754~6 (Q2) 12,269 806 11,910 42,160 672 3,9157~9 (Q3) 10,791 893 10,997 41,292 544 4,026
10~12 (Q4) 10,688 792 10,945 38,150 606 3,856
平成23年 1月 (Jan) 3,458 245 3,679 13,222 201 3,9372 (Feb) 3,391 225 3,600 13,152 220 3,7433 (Mar) 3,600 220 3,882 13,723 233 3,4754 (Apr) 4,123 262 4,200 14,284 224 3,4255 (May) 4,028 264 3,834 13,575 202 3,6716 (Jun) 4,118 280 3,876 14,301 246 3,915
7 (Jul) 3,845 249 3,824 13,891 200 4,0328 (Aug) 3,485 372 3,610 13,551 160 4,0289 (Sep) 3,461 272 3,563 13,850 184 4,026
10 (Oct) 3,514 242 3,539 12,844 207 4,03011 (Nov) 3,744 260 3,894 13,109 203 3,85512 (Dec) 3,430 290 3,512 12,197 196 3,856
そ の 他Others数 量
Quantity
年 月Year and Month
136

時系列表 (非鉄金属編) 製品
(5) 非鉄金属製品(電線・ケ-ブル) Non-ferrous metal products (Electric wires/cables)(単位:導体t、 Unit: metal core tons)
出 荷 Shipments
生 産 受 入 販 売 Sales 在 庫
金額(百万円)
Production Receipts Value Inventory
(million yen)
平成19年 (2007) 58,392 44,050 57,745 465,464 44,710 1,29920 (2008) 58,444 41,620 56,744 468,466 43,270 1,13121 (2009) 42,055 32,360 41,640 337,463 32,813 1,05322 (2010) 49,531 38,850 48,924 417,973 39,363 1,08723 (2011) 45,340 36,335 44,962 364,687 36,532 1,237
平成21年度 (09FY) 46,345 35,916 45,959 385,510 36,389 97622 (10FY) 47,215 37,209 46,671 401,471 37,620 1,054
平成23年 1~3月 (Q1) 10,668 8,350 10,616 92,600 8,426 1,0544~6 (Q2) 8,887 6,489 8,694 72,380 6,591 1,1287~9 (Q3) 12,216 10,087 12,208 105,902 10,067 1,152
10~12 (Q4) 13,569 11,409 13,444 93,805 11,448 1,237
平成23年 1月 (Jan) 3,813 3,009 3,762 31,801 3,053 1,0912 (Feb) 4,085 3,298 4,101 34,628 3,360 1,0123 (Mar) 2,770 2,043 2,753 26,171 2,013 1,0544 (Apr) 2,262 1,332 2,105 21,045 1,471 1,0665 (May) 2,830 2,120 2,847 21,717 2,048 1,1116 (Jun) 3,795 3,037 3,742 29,618 3,072 1,128
7 (Jul) 3,992 3,271 3,949 33,932 3,265 1,1838 (Aug) 3,715 3,041 3,758 32,642 3,056 1,1099 (Sep) 4,509 3,775 4,501 39,328 3,746 1,152
10 (Oct) 4,690 3,948 4,652 30,149 3,926 1,21211 (Nov) 4,436 3,709 4,377 27,379 3,722 1,26212 (Dec) 4,443 3,752 4,415 36,277 3,800 1,237
(単位:導体t、 Unit: metal core tons)
d 通 信 用 電 線 ケ ブ ル T l i ti i / bl
数 量Quantity
そ の 他Others
年 月Year and Month
c. 輸 送 機 器 用 電 線 Wire and cables for transport equipment
137
出 荷 Shipments
生 産 受 入 販 売 Sales 在 庫
金額(百万円)
Production Receipts Value Inventory
(million yen)
平成19年 (2007) 31,038 8,548 32,653 71,948 6,718 5,36820 (2008) 29,543 8,187 31,782 68,892 6,350 5,23621 (2009) 26,299 6,958 28,316 51,626 5,079 5,45222 (2010) 26,223 6,587 27,362 54,016 5,329 5,41523 (2011) 25,262 5,552 25,933 54,903 4,510 5,644
平成21年度 (09FY) 26,947 7,441 28,877 54,067 5,248 5,53922 (10FY) 25,647 5,805 26,423 53,606 5,148 5,306
平成23年 1~3月 (Q1) 6,426 1,418 6,687 14,427 1,288 5,3064~6 (Q2) 7,148 1,577 7,061 14,793 1,157 5,7167~9 (Q3) 5,812 1,257 6,151 13,045 969 5,631
10~12 (Q4) 5,876 1,300 6,034 12,638 1,096 5,644
平成23年 1月 (Jan) 2,249 565 2,286 5,022 528 5,4602 (Feb) 1,956 405 2,075 4,439 367 5,3603 (Mar) 2,221 448 2,326 4,966 393 5,3064 (Apr) 2,505 481 2,461 5,160 401 5,3995 (May) 2,316 577 2,283 4,732 406 5,5456 (Jun) 2,327 519 2,317 4,901 350 5,716
7 (Jul) 2,220 503 2,257 4,760 333 5,8358 (Aug) 1,774 324 1,976 4,063 278 5,6619 (Sep) 1,818 430 1,918 4,222 358 5,631
10 (Oct) 1,911 418 1,999 4,315 375 5,55611 (Nov) 1,961 448 2,092 4,204 375 5,50612 (Dec) 2,004 434 1,943 4,119 346 5,644
そ の 他Others数 量
Quantity
年 月Year and Month
d. 通 信 用 電 線 ・ケ-ブ ル Telecommunication wires/cables
137
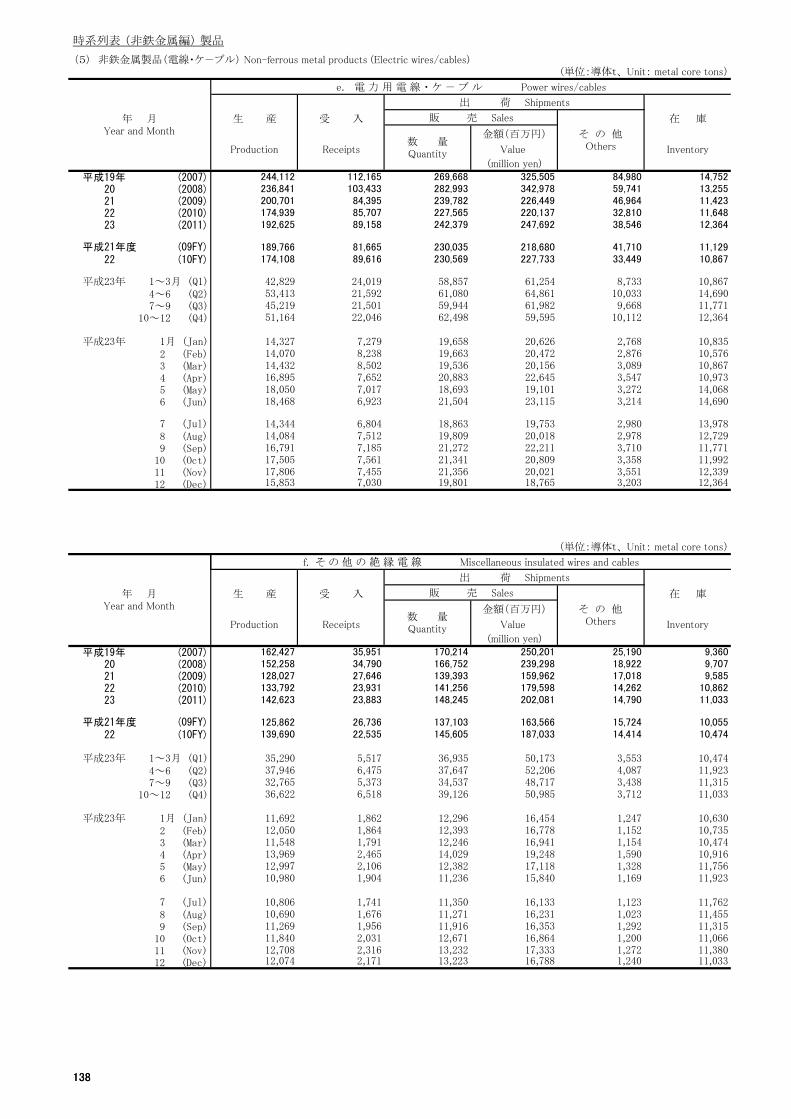
時系列表 (非鉄金属編) 製品
(5) 非鉄金属製品(電線・ケ-ブル) Non-ferrous metal products (Electric wires/cables)(単位:導体t、 Unit: metal core tons)
e. 電 力 用 電 線 ・ ケ - ブ ル Power wires/cables
出 荷 Shipments
生 産 受 入 販 売 Sales 在 庫
金額(百万円)
Production Receipts Value Inventory
(million yen)
平成19年 (2007) 244,112 112,165 269,668 325,505 84,980 14,75220 (2008) 236,841 103,433 282,993 342,978 59,741 13,25521 (2009) 200,701 84,395 239,782 226,449 46,964 11,42322 (2010) 174,939 85,707 227,565 220,137 32,810 11,64823 (2011) 192,625 89,158 242,379 247,692 38,546 12,364
平成21年度 (09FY) 189,766 81,665 230,035 218,680 41,710 11,12922 (10FY) 174,108 89,616 230,569 227,733 33,449 10,867
平成23年 1~3月 (Q1) 42,829 24,019 58,857 61,254 8,733 10,8674~6 (Q2) 53,413 21,592 61,080 64,861 10,033 14,6907~9 (Q3) 45,219 21,501 59,944 61,982 9,668 11,771
10~12 (Q4) 51,164 22,046 62,498 59,595 10,112 12,364
平成23年 1月 (Jan) 14,327 7,279 19,658 20,626 2,768 10,8352 (Feb) 14,070 8,238 19,663 20,472 2,876 10,5763 (Mar) 14,432 8,502 19,536 20,156 3,089 10,8674 (Apr) 16,895 7,652 20,883 22,645 3,547 10,9735 (May) 18,050 7,017 18,693 19,101 3,272 14,0686 (Jun) 18,468 6,923 21,504 23,115 3,214 14,690
7 (Jul) 14,344 6,804 18,863 19,753 2,980 13,9788 (Aug) 14,084 7,512 19,809 20,018 2,978 12,7299 (Sep) 16,791 7,185 21,272 22,211 3,710 11,771
10 (Oct) 17,505 7,561 21,341 20,809 3,358 11,99211 (Nov) 17,806 7,455 21,356 20,021 3,551 12,33912 (Dec) 15,853 7,030 19,801 18,765 3,203 12,364
(単位:導体t、 Unit: metal core tons)
f そ の 他 の 絶 縁 電 線 Mi ll i l d i d bl
数 量Quantity
そ の 他Others
年 月Year and Month
138
f. そ の 他 の 絶 縁 電 線 Miscellaneous insulated wires and cables
出 荷 Shipments
生 産 受 入 販 売 Sales 在 庫
金額(百万円)
Production Receipts Value Inventory
(million yen)
平成19年 (2007) 162,427 35,951 170,214 250,201 25,190 9,36020 (2008) 152,258 34,790 166,752 239,298 18,922 9,70721 (2009) 128,027 27,646 139,393 159,962 17,018 9,58522 (2010) 133,792 23,931 141,256 179,598 14,262 10,86223 (2011) 142,623 23,883 148,245 202,081 14,790 11,033
平成21年度 (09FY) 125,862 26,736 137,103 163,566 15,724 10,05522 (10FY) 139,690 22,535 145,605 187,033 14,414 10,474
平成23年 1~3月 (Q1) 35,290 5,517 36,935 50,173 3,553 10,4744~6 (Q2) 37,946 6,475 37,647 52,206 4,087 11,9237~9 (Q3) 32,765 5,373 34,537 48,717 3,438 11,315
10~12 (Q4) 36,622 6,518 39,126 50,985 3,712 11,033
平成23年 1月 (Jan) 11,692 1,862 12,296 16,454 1,247 10,6302 (Feb) 12,050 1,864 12,393 16,778 1,152 10,7353 (Mar) 11,548 1,791 12,246 16,941 1,154 10,4744 (Apr) 13,969 2,465 14,029 19,248 1,590 10,9165 (May) 12,997 2,106 12,382 17,118 1,328 11,7566 (Jun) 10,980 1,904 11,236 15,840 1,169 11,923
7 (Jul) 10,806 1,741 11,350 16,133 1,123 11,7628 (Aug) 10,690 1,676 11,271 16,231 1,023 11,4559 (Sep) 11,269 1,956 11,916 16,353 1,292 11,315
10 (Oct) 11,840 2,031 12,671 16,864 1,200 11,06611 (Nov) 12,708 2,316 13,232 17,333 1,272 11,38012 (Dec) 12,074 2,171 13,223 16,788 1,240 11,033
そ の 他Others数 量
Quantity
年 月Year and Month
138

時系列表 (非鉄金属編) 製品
(5) 非鉄金属製品(電線・ケ-ブル) Non-ferrous metal products (Electric wires/cables)(単位:導体t、 Unit: metal core tons)
ウ. ア ル ミ ニ ウ ム 線 Aluminum wires
出 荷 Shipments
生 産 受 入 販 売 Sales 在 庫
金額(百万円)
Production Receipts Value Inventory
(million yen)
平成19年 (2007) 37,764 9,230 29,013 27,216 17,853 1,04520 (2008) 41,507 11,217 34,584 26,884 18,104 1,07821 (2009) 53,228 14,891 52,454 35,899 15,321 1,46522 (2010) 44,723 11,000 39,304 27,188 16,770 1,06723 (2011) 31,999 7,588 24,754 16,850 14,887 1,017
平成21年度 (09FY) 56,619 14,604 53,893 36,371 17,431 1,81522 (10FY) 38,721 9,808 33,407 23,027 15,590 1,267
平成23年 1~3月 (Q1) 8,057 2,279 6,446 4,587 3,689 1,2674~6 (Q2) 7,770 1,792 6,471 4,588 3,231 1,0797~9 (Q3) 7,617 1,652 5,287 3,344 4,070 1,009
10~12 (Q4) 8,555 1,865 6,550 4,331 3,897 1,017
平成23年 1月 (Jan) 2,623 684 2,239 1,516 1,211 9252 (Feb) 2,759 1,016 2,455 1,733 1,176 1,0663 (Mar) 2,675 579 1,752 1,338 1,302 1,2674 (Apr) 2,825 835 2,571 1,733 1,189 1,1165 (May) 2,614 562 2,064 1,603 1,026 1,1916 (Jun) 2,331 395 1,836 1,252 1,016 1,079
7 (Jul) 2,247 330 1,109 956 1,513 1,0358 (Aug) 2,508 749 2,108 1,164 1,149 1,0339 (Sep) 2,862 573 2,070 1,224 1,408 1,009
10 (Oct) 2,920 690 2,195 1,444 1,441 97511 (Nov) 3,257 576 2,551 1,649 1,341 95412 (Dec) 2,378 599 1,804 1,238 1,115 1,017
そ の 他Others数 量
Quantity
年 月Year and Month
139139

時系列表 (非鉄金属編) 製品
① 高純度多結晶シリコン (kg) High-purity polycrystal silicon
出 荷 Shipments生 産 受 入 消 費 販 売 Sales 在 庫
金額(百万円)Production Receipts Consumption Value Inventory
(million yen)
平成19年 (2007) 7,363,803 - 68,718 6,878,562 50,680 118,944 1,191,97120 (2008) 7,471,422 - 76,329 7,231,677 59,907 222,103 1,133,28521 (2009) 8,633,102 - 83,760 6,876,341 49,990 49,037 2,757,25122 (2010) x - x x x x 1,485,52023 (2011) 12,132,997 - 251,161 10,108,184 66,080 4,639 2,669,977
平成21年度 (09FY) 9,477,601 - 86,795 8,627,817 58,669 47,796 2,014,877
22 (10FY) x - x x x x 1,437,086
平成23年 1~3月 (Q1) 2,895,122 - 50,809 2,892,431 18,128 316 1,437,0864~6 (Q2) 3,143,333 - 65,197 2,045,969 13,378 4,323 1,880,3737~9 (Q3) 2,927,147 - 70,319 2,798,077 18,643 - 1,939,125
10~12 (Q4) 3,167,395 - 64,836 2,371,707 15,931 - 2,669,977
平成23年 1月 (Jan) 977,714 - 7,053 780,822 4,792 9 1,675,3502 (Feb) 825,278 - 13,765 953,985 6,171 - 1,532,8783 (Mar) 1,092,130 - 29,991 1,157,624 7,165 307 1,437,0864 (Apr) 1,004,778 - 17,906 526,256 3,304 3,723 1,309,4235 (May) 1,091,197 - 24,385 577,126 3,617 540 1,798,5696 (Jun) 1,047,358 - 22,906 942,587 6,457 60 1,880,373
7 (Jul) 850,069 - 24,224 857,118 5,843 - 1,849,1008 (Aug) 1,019,468 - 22,918 875,703 5,812 - 1,969,9479 (Sep) 1,057,610 - 23,177 1,065,256 6,988 - 1,939,125
10 (Oct) 825,557 - 22,489 779,429 5,006 - 1,962,76411 (Nov) 1,094,915 - 20,827 788,963 5,457 - 2,247,89012 (Dec) 1,246,923 - 21,520 803,315 5,468 - 2,669,977
数 量Quantity
そ の 他Others
年 月Year and Month
(6) 非鉄金属製品(高純度多結晶シリコン、シリコンウエハ、はんだ、銅合金塊) Non-ferrous metal products (High-purity polycrystal silicon, silicon wafers, solders and copper alloy ingots)
140140

時系列表 (非鉄金属編) 製品
② シリコンウエハ 計 (ア~エ) (㎡) Silicon wafers
出 荷 Shipments生 産 受 入 消 費 販 売 Sales 在 庫
金額(百万円)Production Receipts Consumption Value Inventory
(million yen)
平成19年 (2007) 3,113,118 1,994,260 - 3,365,621 837,247 1,745,064 119,23520 (2008) 2,990,296 1,893,237 - 3,188,725 677,703 1,660,805 164,41121 (2009) 2,174,868 1,453,393 - 2,397,578 376,235 1,286,094 110,27322 (2010) 3,090,474 2,037,734 - 3,314,991 495,589 1,769,620 149,82523 (2011) 2,849,334 1,832,569 - 3,097,235 447,221 1,574,871 156,318
平成21年度 (09FY) 2,614,109 1,706,836 - 2,833,992 430,951 1,498,316 124,619
22 (10FY) 3,027,279 1,994,614 - 3,282,833 488,991 1,730,428 130,712
平成23年 1~3月 (Q1) 669,459 434,216 - 754,504 111,079 368,616 130,7124~6 (Q2) 700,797 454,419 - 776,335 115,532 385,864 124,1067~9 (Q3) 812,219 523,789 - 863,934 119,805 460,918 137,041
10~12 (Q4) 666,859 420,145 - 702,462 100,805 359,473 156,318
平成23年 1月 (Jan) 241,949 160,837 - 261,534 38,439 143,302 147,7822 (Feb) 236,046 160,132 - 268,465 39,093 138,077 137,4523 (Mar) 191,464 113,247 - 224,505 33,547 87,237 130,7124 (Apr) 183,480 130,865 - 230,841 35,097 106,366 108,9995 (May) 243,466 151,815 - 256,840 38,308 128,826 117,6906 (Jun) 273,851 171,739 - 288,654 42,127 150,672 124,106
7 (Jul) 280,147 183,166 - 297,536 42,887 162,750 126,9888 (Aug) 273,367 165,306 - 277,940 38,871 146,617 141,3039 (Sep) 258,705 175,317 - 288,458 38,047 151,551 137,041
10 (Oct) 247,807 146,807 - 246,596 35,574 133,932 152,37411 (Nov) 220,441 145,348 - 229,422 31,778 121,673 168,33212 (Dec) 198,611 127,990 - 226,444 33,453 103,868 156,318
数 量Quantity
そ の 他Others
年 月Year and Month
(6) 非鉄金属製品(高純度多結晶シリコン、シリコンウエハ、はんだ、銅合金塊) Non-ferrous metal products (High-purity polycrystal silicon, silicon wafers, solders and copper alloy ingots)
141
② シリコンウエハ 計 (ア~エ) (103sq.in.) Silicon wafers
出 荷 Shipments生 産 受 入 消 費 販 売 Sales 在 庫
Production Receipts Consumption Inventory
平成19年 (2007) (4,827,278) (3,092,354) (-) (5,218,814) (2,705,941) (184,887)20 (2008) (4,636,837) (2,935,699) (-) (4,944,524) (2,575,279) (254,939)21 (2009) (3,372,411) (2,253,666) (-) (3,717,746) (1,994,255) (170,996)22 (2010) (4,792,190) (3,159,772) (-) (5,140,310) (2,744,017) (232,324)23 (2011) (4,418,268) (2,841,629) (-) (4,802,642) (2,442,043) (242,393)
平成21年度 (09FY) (4,053,518) (2,646,671) (-) (4,394,465) (2,323,330) (193,240)22 (10FY) (4,694,185) (3,092,902) (-) (5,090,438) (2,683,249) (202,687)
平成23年 1~3月 (Q1) (1,038,077) (673,307) (-) (1,169,951) (571,590) (202,687)4~6 (Q2) (1,086,685) (704,634) (-) (1,203,805) (598,332) (192,440)7~9 (Q3) (1,259,457) (812,201) (-) (1,339,632) (714,714) (212,495)
10~12 (Q4) (1,034,049) (651,487) (-) (1,089,254) (557,407) (242,393)
平成23年 1月 (Jan) (375,173) (249,397) (-) (405,539) (222,209) (229,154)2 (Feb) (366,018) (248,309) (-) (416,291) (214,109) (213,136)3 (Mar) (296,886) (175,601) (-) (348,121) (135,272) (202,687)4 (Apr) (284,512) (202,921) (-) (357,951) (164,938) (169,024)5 (May) (377,530) (235,410) (-) (398,260) (199,761) (182,494)6 (Jun) (424,643) (266,303) (-) (447,594) (233,633) (192,440)
7 (Jul) (434,403) (284,022) (-) (461,362) (252,365) (196,917)8 (Aug) (423,894) (256,329) (-) (430,980) (227,348) (219,109)9 (Sep) (401,160) (271,850) (-) (447,290) (235,001) (212,495)
10 (Oct) (384,260) (227,643) (-) (382,379) (207,676) (236,275)11 (Nov) (341,822) (225,380) (-) (355,744) (188,669) (261,023)12 (Dec) (307,967) (198,464) (-) (351,131) (161,062) (242,393)
注:( )内は、「sq.in. 」単位の数値である。「sq.in. 」とはスクエアインチを表し、「sq.in. 」単位の数値に換算係数を乗じたものが
「㎡」単位の数値である。
Note: The unit of numbers in parentheses is square inch (sq.in.). The unit "㎡"is "sq.in."multiplied by a conversion coefficient.
数 量Quantity
年 月Year and Month そ の 他
Others
141

時系列表 (非鉄金属編) 製品
ア. シリコンウエハ 5インチ(125mm)以下 (㎡) Silicon wafers <5 in.
生 産 受 入 消 費 販 売 Sales 在 庫
Production Receipts Consumption Inventory
平成19年 (2007) 190,735 214,648 - 270,733 133,735 12,95120 (2008) 170,624 197,525 - 241,951 125,764 13,24721 (2009) 92,409 106,987 - 134,320 68,749 7,84722 (2010) 129,905 150,029 - 186,630 89,598 10,95023 (2011) 86,211 118,021 - 135,340 69,917 8,275
平成21年度 (09FY) 113,144 131,516 - 164,107 83,909 7,381
22 (10FY) 121,202 141,657 - 174,038 84,171 11,441
平成23年 1~3月 (Q1) 23,706 30,762 - 36,217 17,619 11,4414~6 (Q2) 22,986 33,600 - 38,136 20,417 9,1617~9 (Q3) 21,650 29,916 - 33,745 17,658 8,883
10~12 (Q4) 17,869 23,743 - 27,242 14,223 8,275
平成23年 1月 (Jan) 8,758 10,777 - 13,083 6,444 10,8852 (Feb) 7,412 10,138 - 12,071 5,687 10,6373 (Mar) 7,536 9,847 - 11,063 5,488 11,4414 (Apr) 7,175 10,955 - 12,305 6,355 11,3915 (May) 7,703 11,400 - 12,709 7,154 9,9816 (Jun) 8,108 11,245 - 13,122 6,908 9,161
7 (Jul) 7,985 11,039 - 12,141 6,581 9,2698 (Aug) 7,029 10,099 - 11,407 5,789 9,1249 (Sep) 6,636 8,778 - 10,197 5,288 8,883
10 (Oct) 6,491 8,694 - 10,042 5,450 8,51411 (Nov) 6,028 8,044 - 8,962 4,764 8,53212 (Dec) 5,350 7,005 - 8,238 4,009 8,275
数 量Quantity
そ の 他Others
年 月Year and Month
出 荷 Shipments
(6) 非鉄金属製品(高純度多結晶シリコン、シリコンウエハ、はんだ、銅合金塊) Non-ferrous metal products (High-purity polycrystal silicon, silicon wafers, solders and copper alloy ingots)
142
ア. シリコンウエハ 5インチ(125mm)以下 (103sq.in.) Silicon wafers <5 in.
生 産 受 入 消 費 販 売 Sales 在 庫
Production Receipts Consumption Inventory
平成19年 (2007) (295,755) (332,841) (-) (419,811) (207,369) (20,079)20 (2008) (264,577) (306,289) (-) (375,175) (195,010) (20,542)21 (2009) (143,287) (165,890) (-) (208,279) (106,605) (12,168)22 (2010) (201,441) (232,641) (-) (289,393) (138,935) (16,980)23 (2011) (133,684) (183,013) (-) (209,856) (108,417) (12,832)
平成21年度 (09FY) (175,442) (203,928) (-) (254,467) (130,114) (11,446)22 (10FY) (187,943) (219,662) (-) (269,864) (130,519) (17,742)
平成23年 1~3月 (Q1) (36,758) (47,704) (-) (56,155) (27,322) (17,742)4~6 (Q2) (35,647) (52,103) (-) (59,133) (31,658) (14,207)7~9 (Q3) (33,574) (46,389) (-) (52,325) (27,381) (13,773)
10~12 (Q4) (27,705) (36,817) (-) (42,243) (22,056) (12,832)
平成23年 1月 (Jan) (13,580) (16,710) (-) (20,286) (9,993) (16,877)2 (Feb) (11,493) (15,724) (-) (18,717) (8,820) (16,492)3 (Mar) (11,685) (15,270) (-) (17,152) (8,509) (17,742)4 (Apr) (11,127) (16,988) (-) (19,081) (9,855) (17,666)5 (May) (11,945) (17,678) (-) (19,705) (11,091) (15,477)6 (Jun) (12,575) (17,437) (-) (20,347) (10,712) (14,207)
7 (Jul) (12,381) (17,117) (-) (18,826) (10,206) (14,374)8 (Aug) (10,901) (15,660) (-) (17,686) (8,976) (14,149)9 (Sep) (10,292) (13,612) (-) (15,813) (8,199) (13,773)
10 (Oct) (10,065) (13,482) (-) (15,570) (8,450) (13,202)11 (Nov) (9,346) (12,474) (-) (13,897) (7,389) (13,232)12 (Dec) (8,294) (10,861) (-) (12,776) (6,217) (12,832)
注:( )内は、「sq.in. 」単位の数値である。「sq.in. 」とはスクエアインチを表し、「sq.in. 」単位の数値に換算係数を乗じたものが
「㎡」単位の数値である。
Note: The unit of numbers in parentheses is square inch (sq.in.). The unit "㎡"is "sq.in."multiplied by a conversion coefficient.
出 荷 Shipments
そ の 他Others
数 量Quantity
年 月Year and Month
142

時系列表 (非鉄金属編) 製品
イ. シリコンウエハ 6インチ(150mm) (㎡) Silicon wafers 6 in.
生 産 受 入 消 費 販 売 Sales 在 庫
Production Receipts Consumption Inventory
平成19年 (2007) 368,473 297,647 - 462,700 204,030 17,27420 (2008) 342,869 265,893 - 420,952 189,846 15,73121 (2009) 227,160 171,415 - 276,182 129,777 8,05122 (2010) 335,576 263,962 - 402,759 186,674 15,88423 (2011) 242,564 220,012 - 311,700 155,752 8,976
平成21年度 (09FY) 283,969 217,120 - 341,283 162,898 9,952
22 (10FY) 319,949 255,326 - 387,358 180,310 15,119
平成23年 1~3月 (Q1) 65,092 55,938 - 82,238 39,141 15,1194~6 (Q2) 71,467 62,850 - 91,473 45,750 11,8467~9 (Q3) 58,594 57,173 - 76,328 41,416 9,276
10~12 (Q4) 47,411 44,051 - 61,661 29,445 8,976
平成23年 1月 (Jan) 22,078 18,527 - 28,669 13,239 14,5772 (Feb) 21,651 18,972 - 27,770 13,191 13,9843 (Mar) 21,363 18,439 - 25,799 12,711 15,1194 (Apr) 22,053 20,510 - 30,297 13,861 13,3295 (May) 24,796 21,861 - 31,277 15,978 12,6056 (Jun) 24,618 20,479 - 29,899 15,911 11,846
7 (Jul) 21,885 21,055 - 28,303 15,008 11,0648 (Aug) 18,760 18,571 - 24,260 13,790 10,2289 (Sep) 17,949 17,547 - 23,765 12,618 9,276
10 (Oct) 16,771 15,306 - 22,654 10,542 8,06711 (Nov) 15,750 15,139 - 20,729 9,740 8,56712 (Dec) 14,890 13,606 - 18,278 9,163 8,976
数 量Quantity
そ の 他Others
年 月Year and Month
出 荷 Shipments
(6) 非鉄金属製品(高純度多結晶シリコン、シリコンウエハ、はんだ、銅合金塊) Non-ferrous metal products (High-purity polycrystal silicon, silicon wafers, solders and copper alloy ingots)
143
イ. シリコンウエハ 6インチ(150mm) (103sq.in.) Silicon wafers 6 in.
生 産 受 入 消 費 販 売 Sales 在 庫
Production Receipts Consumption Inventory
平成19年 (2007) (571,364) (461,538) (-) (717,462) (316,372) (26,784)20 (2008) (531,657) (412,297) (-) (652,742) (294,375) (24,392)21 (2009) (352,240) (265,803) (-) (428,249) (201,236) (12,484)22 (2010) (520,355) (409,313) (-) (624,530) (289,466) (24,630)23 (2011) (376,125) (341,153) (-) (483,326) (241,517) (13,919)
平成21年度 (09FY) (440,332) (336,679) (-) (529,199) (252,590) (15,433)22 (10FY) (496,119) (395,918) (-) (600,650) (279,600) (23,445)
平成23年 1~3月 (Q1) (100,932) (86,738) (-) (127,523) (60,695) (23,445)4~6 (Q2) (110,822) (97,452) (-) (141,839) (70,942) (18,370)7~9 (Q3) (90,857) (88,656) (-) (118,355) (64,225) (14,383)
10~12 (Q4) (73,514) (68,307) (-) (95,609) (45,655) (13,919)
平成23年 1月 (Jan) (34,234) (28,729) (-) (44,454) (20,529) (22,603)2 (Feb) (33,573) (29,419) (-) (43,064) (20,455) (21,685)3 (Mar) (33,125) (28,590) (-) (40,005) (19,711) (23,445)4 (Apr) (34,198) (31,802) (-) (46,981) (21,494) (20,670)5 (May) (38,451) (33,897) (-) (48,497) (24,777) (19,548)6 (Jun) (38,173) (31,753) (-) (46,361) (24,671) (18,370)
7 (Jul) (33,934) (32,649) (-) (43,887) (23,272) (17,159)8 (Aug) (29,091) (28,798) (-) (37,619) (21,384) (15,860)9 (Sep) (27,832) (27,209) (-) (36,849) (19,569) (14,383)
10 (Oct) (26,008) (23,734) (-) (35,127) (16,345) (12,509)11 (Nov) (24,421) (23,475) (-) (32,141) (15,102) (13,283)12 (Dec) (23,085) (21,098) (-) (28,341) (14,208) (13,919)
注:( )内は、「sq.in. 」単位の数値である。「sq.in. 」とはスクエアインチを表し、「sq.in. 」単位の数値に換算係数を乗じたものが
「㎡」単位の数値である。
Note: The unit of numbers in parentheses is square inch (sq.in.). The unit "㎡"is "sq.in."multiplied by a conversion coefficient.
出 荷 Shipments
そ の 他Others
数 量Quantity
年 月Year and Month
143

時系列表 (非鉄金属編) 製品
ウ. シリコンウエハ 8インチ(200mm) (㎡) Silicon wafers 8 in.
生 産 受 入 消 費 販 売 Sales 在 庫
Production Receipts Consumption Inventory
平成19年 (2007) 1,024,150 610,236 - 1,091,168 565,137 38,19720 (2008) 821,355 468,897 - 873,471 421,764 42,49821 (2009) 492,040 314,393 - 555,684 269,740 25,06322 (2010) 808,634 504,557 - 855,159 442,061 40,27323 (2011) 671,414 409,472 - 712,157 372,538 36,976
平成21年度 (09FY) 636,943 399,744 - 695,131 348,218 26,186
22 (10FY) 804,229 499,118 - 844,801 442,883 42,467
平成23年 1~3月 (Q1) 178,893 108,659 - 187,059 98,898 42,4674~6 (Q2) 186,323 118,186 - 203,491 107,726 36,3947~9 (Q3) 183,812 107,215 - 187,984 99,654 40,121
10~12 (Q4) 122,386 75,412 - 133,623 66,260 36,976
平成23年 1月 (Jan) 63,160 38,975 - 65,854 35,546 41,0972 (Feb) 58,753 35,779 - 61,881 32,805 41,2873 (Mar) 56,980 33,905 - 59,324 30,547 42,4674 (Apr) 57,086 37,137 - 66,350 32,888 38,1105 (May) 62,752 40,928 - 67,121 37,013 37,4146 (Jun) 66,485 40,121 - 70,020 37,825 36,394
7 (Jul) 66,459 36,922 - 66,042 36,675 37,2368 (Aug) 61,842 36,669 - 64,591 33,138 38,0649 (Sep) 55,511 33,624 - 57,351 29,841 40,121
10 (Oct) 46,428 26,443 - 48,875 25,062 39,06611 (Nov) 40,820 26,630 - 44,236 22,394 39,61712 (Dec) 35,138 22,339 - 40,512 18,804 36,976
数 量Quantity
出 荷 Shipments
そ の 他Others
年 月Year and Month
(6) 非鉄金属製品(高純度多結晶シリコン、シリコンウエハ、はんだ、銅合金塊) Non-ferrous metal products (High-purity polycrystal silicon, silicon wafers, solders and copper alloy ingots)
144
ウ. シリコンウエハ 8インチ(200mm) (103sq.in.) Silicon wafers 8 in.
生 産 受 入 消 費 販 売 Sales 在 庫
Production Receipts Consumption Inventory
平成19年 (2007) (1,588,072) (946,247) (-) (1,691,993) (876,318) (59,228)20 (2008) (1,273,624) (727,082) (-) (1,354,424) (654,001) (65,898)21 (2009) (762,982) (487,502) (-) (861,659) (418,267) (38,868)22 (2010) (1,253,898) (782,377) (-) (1,326,028) (685,463) (62,451)23 (2011) (1,041,121) (634,932) (-) (1,104,286) (577,667) (57,338)
平成21年度 (09FY) (987,670) (619,852) (-) (1,077,889) (539,958) (40,603)22 (10FY) (1,247,064) (773,939) (-) (1,309,964) (686,741) (65,850)
平成23年 1~3月 (Q1) (277,395) (168,488) (-) (290,058) (153,356) (65,850)4~6 (Q2) (288,917) (183,265) (-) (315,539) (167,043) (56,429)7~9 (Q3) (285,031) (166,247) (-) (291,489) (154,524) (62,210)
10~12 (Q4) (189,778) (116,932) (-) (207,200) (102,744) (57,338)
平成23年 1月 (Jan) (97,939) (60,435) (-) (102,115) (55,120) (63,729)2 (Feb) (91,103) (55,479) (-) (95,954) (50,869) (64,022)3 (Mar) (88,353) (52,574) (-) (91,989) (47,367) (65,850)4 (Apr) (88,517) (57,584) (-) (102,885) (50,998) (59,093)5 (May) (97,307) (63,466) (-) (104,079) (57,394) (58,014)6 (Jun) (103,093) (62,215) (-) (108,575) (58,651) (56,429)
7 (Jul) (103,057) (57,252) (-) (102,405) (56,869) (57,741)8 (Aug) (95,894) (56,858) (-) (100,156) (51,383) (59,022)9 (Sep) (86,080) (52,137) (-) (88,928) (46,272) (62,210)
10 (Oct) (71,994) (41,001) (-) (75,788) (38,862) (60,578)11 (Nov) (63,299) (41,292) (-) (68,592) (34,724) (61,432)12 (Dec) (54,485) (34,639) (-) (62,820) (29,158) (57,338)
注:( )内は、「sq.in. 」単位の数値である。「sq.in. 」とはスクエアインチを表し、「sq.in. 」単位の数値に換算係数を乗じたものが
「㎡」単位の数値である。
Note: The unit of numbers in parentheses is square inch (sq.in.). The unit "㎡"is "sq.in."multiplied by a conversion coefficient.
そ の 他Others
数 量Quantity
年 月Year and Month
出 荷 Shipments
144

時系列表 (非鉄金属編) 製品
エ. シリコンウエハ 12インチ(300mm)以上 (㎡) Silicon wafers 12 in.<
生 産 受 入 消 費 販 売 Sales 在 庫
Production Receipts Consumption Inventory
平成19年 (2007) 1,529,760 871,729 - 1,541,020 842,162 50,81320 (2008) 1,655,448 960,922 - 1,652,351 923,431 92,93521 (2009) 1,363,259 860,598 - 1,431,392 817,828 69,31222 (2010) 1,816,359 1,119,186 - 1,870,443 1,051,287 82,71823 (2011) 1,849,145 1,085,064 - 1,938,038 976,664 102,091
平成21年度 (09FY) 1,580,053 958,456 - 1,633,471 903,291 81,100
22 (10FY) 1,781,899 1,098,513 - 1,876,636 1,023,064 61,685
平成23年 1~3月 (Q1) 401,768 238,857 - 448,990 212,958 61,6854~6 (Q2) 420,021 239,783 - 443,235 211,971 66,7057~9 (Q3) 548,163 329,485 - 565,877 302,190 78,761
10~12 (Q4) 479,193 276,939 - 479,936 249,545 102,091
平成23年 1月 (Jan) 147,953 92,558 - 153,928 88,073 81,2232 (Feb) 148,230 95,243 - 166,743 86,394 71,5443 (Mar) 105,585 51,056 - 128,319 38,491 61,6854 (Apr) 97,166 62,263 - 121,889 53,262 46,1695 (May) 148,215 77,626 - 145,733 68,681 57,6906 (Jun) 174,640 99,894 - 175,613 90,028 66,705
7 (Jul) 183,818 114,150 - 191,050 104,486 69,4198 (Aug) 185,736 99,967 - 177,682 93,900 83,8879 (Sep) 178,609 115,368 - 197,145 103,804 78,761
10 (Oct) 178,117 96,364 - 165,025 92,878 96,72711 (Nov) 157,843 95,535 - 155,495 84,775 111,61612 (Dec) 143,233 85,040 - 159,416 71,892 102,091
数 量Quantity
出 荷 Shipments
そ の 他Others
年 月Year and Month
(6) 非鉄金属製品(高純度多結晶シリコン、シリコンウエハ、はんだ、銅合金塊) Non-ferrous metal products (High-purity polycrystal silicon, silicon wafers, solders and copper alloy ingots)
145
エ. シリコンウエハ 12インチ(300mm)以上 (103sq.in.) Silicon wafers 12 in. <
生 産 受 入 消 費 販 売 Sales 在 庫
Production Receipts Consumption Inventory
平成19年 (2007) (2,372,087) (1,351,728) (-) (2,389,548) (1,305,882) (78,796)20 (2008) (2,566,979) (1,490,031) (-) (2,562,183) (1,431,893) (144,107)21 (2009) (2,113,902) (1,334,471) (-) (2,219,559) (1,268,147) (107,476)22 (2010) (2,816,496) (1,735,441) (-) (2,900,359) (1,630,153) (128,263)23 (2011) (2,867,338) (1,682,531) (-) (3,005,174) (1,514,442) (158,304)
平成21年度 (09FY) (2,450,074) (1,486,212) (-) (2,532,910) (1,400,668) (125,758)22 (10FY) (2,763,059) (1,703,383) (-) (2,909,960) (1,586,389) (95,650)
平成23年 1~3月 (Q1) (622,992) (370,377) (-) (696,215) (330,217) (95,650)4~6 (Q2) (651,299) (371,814) (-) (687,294) (328,689) (103,434)7~9 (Q3) (849,995) (510,909) (-) (877,463) (468,584) (122,129)
10~12 (Q4) (743,052) (429,431) (-) (744,202) (386,952) (158,304)
平成23年 1月 (Jan) (229,420) (143,523) (-) (238,684) (136,567) (125,945)2 (Feb) (229,849) (147,687) (-) (258,556) (133,965) (110,937)3 (Mar) (163,723) (79,167) (-) (198,975) (59,685) (95,650)4 (Apr) (150,670) (96,547) (-) (189,004) (82,591) (71,595)5 (May) (229,827) (120,369) (-) (225,979) (106,499) (89,455)6 (Jun) (270,802) (154,898) (-) (272,311) (139,599) (103,434)
7 (Jul) (285,031) (177,004) (-) (296,244) (162,018) (107,643)8 (Aug) (288,008) (155,013) (-) (275,519) (145,605) (130,078)9 (Sep) (276,956) (178,892) (-) (305,700) (160,961) (122,129)
10 (Oct) (276,193) (149,426) (-) (255,894) (144,019) (149,986)11 (Nov) (244,756) (148,139) (-) (241,114) (131,454) (173,076)12 (Dec) (222,103) (131,866) (-) (247,194) (111,479) (158,304)
注:( )内は、「sq.in. 」単位の数値である。「sq.in. 」とはスクエアインチを表し、「sq.in. 」単位の数値に換算係数を乗じたものが
「㎡」単位の数値である。
Note: The unit of numbers in parentheses is square inch (sq.in.). The unit "㎡"is "sq.in."multiplied by a conversion coefficient.
年 月Year and Month
出 荷 Shipments
そ の 他Others
数 量Quantity
145

時系列表 (非鉄金属編) 製品
(単位:t、Unit: t)
③ は ん だ Solders
出 荷 Shipments生 産 受 入 消 費 販 売 Sales 在 庫
金額(百万円)Production Receipts Consumption Value Inventory
(million yen)
平成19年 (2007) 27,480 139 11 27,510 78,414 - 1,07520 (2008) 22,154 135 43 22,342 76,215 3 96121 (2009) 15,710 88 12 15,491 46,869 15 1,16722 (2010) 20,544 103 12 19,651 69,199 53 2,16623 (2011) 16,415 128 14 16,167 71,751 11 2,403
平成21年度 (09FY) 18,530 89 12 17,722 55,788 25 1,614
22 (10FY) 19,698 113 12 19,206 71,413 46 2,235
平成23年 1~3月 (Q1) 4,319 30 3 4,274 17,780 3 2,2354~6 (Q2) 4,168 27 4 4,014 19,209 3 2,4037~9 (Q3) 4,118 25 3 4,056 18,617 4 2,426
10~12 (Q4) 3,810 46 4 3,823 16,145 1 2,403
平成23年 1月 (Jan) 1,452 10 1 1,415 6,083 2 2,2092 (Feb) 1,410 11 1 1,424 5,383 - 2,2053 (Mar) 1,457 9 1 1,435 6,313 1 2,2354 (Apr) 1,547 8 1 1,446 6,529 1 2,3415 (May) 1,261 9 1 1,279 6,339 1 2,3266 (Jun) 1,360 10 2 1,289 6,341 1 2,403
7 (Jul) 1,399 11 1 1,324 6,151 1 2,4848 (Aug) 1,316 6 1 1,344 6,404 2 2,4569 (Sep) 1,403 8 1 1,388 6,062 1 2,426
10 (Oct) 1,344 7 1 1,364 5,663 1 2,40311 (Nov) 1,252 33 1 1,288 5,446 - 2,40112 (Dec) 1,214 6 2 1,171 5,036 - 2,403
(単位:t、Unit: t)
そ の 他Others
数 量Quantity
(6) 非鉄金属製品(高純度多結晶シリコン、シリコンウエハ、はんだ、銅合金塊) Non-ferrous metal products (High-purity polycrystal silicon, silicon wafers, solders and copper alloy ingots)
年 月Year and Month
146
④ 銅 合 金 塊 Copper alloy ingots
出 荷 Shipments生 産 受 入 消 費 販 売 Sales 在 庫
金額(百万円)Production Receipts Consumption Value Inventory
(million yen)
平成19年 (2007) 90,530 2,878 1,798 88,875 75,823 2,313 2,47920 (2008) 94,177 2,397 1,590 92,339 70,542 2,140 3,02621 (2009) 81,362 1,607 1,007 80,772 39,885 1,439 2,78622 (2010) 81,923 1,709 1,152 80,588 52,230 1,598 3,06623 (2011) 82,524 2,963 1,005 82,861 58,349 1,595 3,121
平成21年度 (09FY) 80,497 1,850 1,077 79,817 45,105 1,567 2,62722 (10FY) 82,765 1,617 1,171 81,720 54,940 1,547 2,659
平成23年 1~3月 (Q1) 21,094 373 305 21,292 15,820 368 2,6594~6 (Q2) 21,720 1,039 273 21,606 15,967 414 3,2307~9 (Q3) 19,618 1,181 190 20,545 14,783 378 3,020
10~12 (Q4) 20,092 370 237 19,418 11,780 435 3,121
平成23年 1月 (Jan) 6,749 102 105 6,700 4,888 113 3,0292 (Feb) 6,886 137 101 7,199 5,395 129 2,6493 (Mar) 7,459 134 99 7,393 5,536 126 2,6594 (Apr) 7,578 209 103 7,317 5,440 128 2,9345 (May) 6,904 413 95 6,900 5,228 139 3,1526 (Jun) 7,238 417 75 7,389 5,299 147 3,230
7 (Jul) 6,933 462 81 7,082 5,151 149 3,3488 (Aug) 6,066 289 51 6,631 4,818 119 2,9379 (Sep) 6,619 430 58 6,832 4,814 110 3,020
10 (Oct) 6,969 153 95 6,425 4,036 165 3,40811 (Nov) 6,962 156 76 6,394 3,799 134 3,81012 (Dec) 6,161 61 66 6,599 3,944 136 3,121
数 量Quantity
年 月Year and Month そ の 他
Others
146

時系列表 (非鉄金属編) 製品
(単位:㎞コア、Unit: ㎞ core)
光ファイバ製品 ①~② Optical fiber products
出 荷 Shipments生 産 受 入 販 売 Sales 在 庫
数 量 金額(百万円)Production Receipts Quantity Value Others Inventory
(million yen)
平成19年 (2007)20 (2008)21 (2009)22 (2010)23 (2011)
平成21年度 (09FY)22 (10FY)
平成23年 1~3月 (Q1)4~6 (Q2)7~9 (Q3)
10~12 (Q4)
平成23年 1月 (Jan)2 (Feb)3 (Mar)4 (Apr)5 (May)6 (Jun)
7 (Jul)8 (Aug)9 (Sep)
10 (Oct)11 (Nov)12 (Dec)
(単位:㎞コア、Unit: ㎞ core)
① 通信用ケーブル計 ア~イ Total of telecommunication cables
3,067,884 16,463 3,049,056 9,134 36,479 712,585714,2643,364,564 12,662 3,319,344 8,561 39,806
3,539,588 5,996 3,559,219 10,236 26,706 696,975738,0533,387,710 4,960 3,359,213 8,481 38,709
2,962,107 3,586 2,999,999 6,753 23,315 742,796801,1353,174,459 5,965 3,087,543 8,411 27,073
2,903,286 7,274 2,809,245 7,249 23,863 735,560658,9112,393,261 20,092 2,353,130 7,983 34,588
2,049,537 23,113 2,031,264 8,064 30,615 633,762622,4672,455,757 13,327 2,508,566 9,398 24,266
2,971,157 15,840 2,960,699 9,032 25,486 685,604684,9242,529,498 19,276 2,470,579 9,301 25,328
9,972,036 35,121 9,927,619 27,931 102,991 712,585738,0539,524,276 14,511 9,446,755 23,645 89,097
7,346,084 50,479 7,193,639 23,296 89,066 735,560622,4677,956,412 48,443 7,939,844 27,731 75,080
33,672,845 213,451 33,585,617 116,398 355,847 622,467667,35436,457,352 192,989 36,350,818 131,420 337,328
34,798,808 148,554 34,507,857 102,603 356,234 712,585631,55334,479,555 215,605 34,300,391 115,743 359,882
34,415,870 196,885 34,300,498 135,551 373,970 587,586656,69434,360,546 219,851 34,210,305 145,910 411,030
29,848,655 230,373 29,521,749 145,258 487,076 704,017
その他
(7) 光ファイバ製品 Optical fiber products
年 月Year and Month
147
① 通信用ケ ブル計 ア イ Total of telecommunication cables
出 荷 Shipments生 産 受 入 在 庫
Production Receipts Sales Others Inventory
平成19年 (2007)20 (2008)21 (2009)22 (2010)23 (2011)
平成21年度 (09FY)22 (10FY)
平成23年 1~3月 (Q1)4~6 (Q2)7~9 (Q3)
10~12 (Q4)
平成23年 1月 (Jan)2 (Feb)3 (Mar)4 (Apr)5 (May)6 (Jun)
7 (Jul)8 (Aug)9 (Sep)
10 (Oct)11 (Nov)12 (Dec) 911,223 16,463 928,834 34,243 482,599
1,064,077 12,662 1,007,634 36,362 517,8061,039,016 5,996 1,066,733 24,727 485,1761,007,942 4,960 946,647 35,512 531,841
805,401 3,586 823,756 20,729 499,810958,333 5,965 893,954 22,247 535,250
885,508 7,274 829,641 20,721 486,726996,779 20,092 995,418 32,856 444,419995,930 23,113 971,174 26,737 455,631
1,185,367 13,327 1,189,143 19,862 433,9821,042,561 15,840 1,046,096 23,248 443,6711,095,644 19,276 1,029,949 23,727 454,846
3,014,316 35,121 3,003,201 95,332 482,5992,771,676 14,511 2,664,357 78,488 531,8412,878,217 50,479 2,796,233 80,314 486,7263,323,572 48,443 3,265,188 66,837 433,982
11,751,835 213,451 11,695,499 309,643 433,98210,292,511 192,989 10,162,450 297,353 465,585
11,987,781 148,554 11,728,979 320,971 482,59910,891,180 215,605 10,769,193 314,391 393,11010,221,551 196,885 10,112,664 309,374 362,58413,123,632 219,851 12,974,188 374,747 376,56213,002,130 230,373 12,774,842 460,123 388,278
販 売 その他年 月
Year and Month
147

時系列表 (非鉄金属編) 製品
(7) 光ファイバ製品 Optical fiber products
(単位:㎞コア、Unit: ㎞ core)
生 産 受 入 在 庫
Production Receipts Sales Others Inventory
平成19年 (2007) 12,876,884 230,292 12,653,902 455,525 378,18220 (2008) 12,993,390 219,803 12,852,910 365,896 366,94321 (2009) 10,116,069 196,778 10,014,499 300,849 354,13422 (2010) 10,740,940 215,543 10,627,930 308,539 381,30623 (2011) 11,770,388 148,553 11,525,142 316,596 461,535
平成21年度 (09FY) 10,185,688 192,856 10,059,419 290,092 458,75622 (10FY) 11,561,973 213,430 11,513,362 305,096 423,660
平成23年 1~3月 (Q1) 3,256,390 48,443 3,197,476 65,824 423,6604~6 (Q2) 2,820,682 50,478 2,743,316 79,149 472,9487~9 (Q3) 2,729,477 14,511 2,625,413 77,459 515,850
10~12 (Q4) 2,963,839 35,121 2,958,937 94,164 461,535
平成23年 1月 (Jan) 1,075,871 19,276 1,010,516 23,402 443,0272 (Feb) 1,024,381 15,840 1,028,193 22,816 431,9423 (Mar) 1,156,138 13,327 1,158,767 19,606 423,6604 (Apr) 971,535 23,113 949,359 26,316 443,1485 (May) 979,359 20,091 977,661 32,498 432,6316 (Jun) 869,788 7,274 816,296 20,335 472,948
7 (Jul) 944,355 5,965 880,828 21,865 521,0028 (Aug) 790,002 3,586 809,393 20,367 484,8879 (Sep) 995,120 4,960 935,192 35,227 515,850
10 (Oct) 1,021,808 5,996 1,052,092 24,316 467,02811 (Nov) 1,044,616 12,662 990,305 36,135 497,75212 (Dec) 897,415 16,463 916,540 33,713 461,535
イ. その他の光ケーブル Other optical fiber products
(単位:㎞コア、Unit: ㎞ core)
販 売 その他
出 荷 Shipments年 月
Year and Month
ア.光ファイバケーブル(通信複合ケーブルを含む) Optical fiber cables (including telecommunication composite cables)
148
生 産 受 入 在 庫
Production Receipts Sales Others Inventory
平成19年 (2007) 125,246 81 120,940 4,598 10,09620 (2008) 130,242 48 121,278 8,851 9,61921 (2009) 105,482 107 98,165 8,525 8,45022 (2010) 150,240 62 141,263 5,852 11,80423 (2011) 217,393 1 203,837 4,375 21,064
平成21年度 (09FY) 106,823 133 103,031 7,261 6,82922 (10FY) 189,862 21 182,137 4,547 10,322
平成23年 1~3月 (Q1) 67,182 - 67,712 1,013 10,3224~6 (Q2) 57,535 1 52,917 1,165 13,7787~9 (Q3) 42,199 - 38,944 1,029 15,991
10~12 (Q4) 50,477 - 44,264 1,168 21,064
平成23年 1月 (Jan) 19,773 - 19,433 325 11,8192 (Feb) 18,180 - 17,903 432 11,7293 (Mar) 29,229 - 30,376 256 10,3224 (Apr) 24,395 - 21,815 421 12,4835 (May) 17,420 1 17,757 358 11,7886 (Jun) 15,720 - 13,345 386 13,778
7 (Jul) 13,978 - 13,126 382 14,2488 (Aug) 15,399 - 14,363 362 14,9239 (Sep) 12,822 - 11,455 285 15,991
10 (Oct) 17,208 - 14,641 411 18,14811 (Nov) 19,461 - 17,329 227 20,05412 (Dec) 13,808 - 12,294 530 21,064
販 売 その他
出 荷 Shipments年 月
Year and Month
イ. その他の光ケ ブル Other optical fiber products
148

時系列表 (非鉄金属編) 製品
(7) 光ファイバ製品 Optical fiber products
(単位:㎞コア、Unit: ㎞ core)
② 光ファイバ心線(ユーザー向け) Optical fiber core wires (for users)
出 荷 Shipments生 産 受 入 在 庫
Production Receipts Sales Others Inventory
平成19年 (2007)20 (2008)21 (2009)22 (2010)23 (2011)
平成21年度 (09FY)22 (10FY)
平成23年 1~3月 (Q1)4~6 (Q2)7~9 (Q3)
10~12 (Q4)
平成23年 1月 (Jan)2 (Feb)3 (Mar)4 (Apr)5 (May)6 (Jun)
7 (Jul)8 (Aug)9 (Sep)
10 (Oct)11 (Nov)12 (Dec)
(販売先内訳) Sales breakdown by industrial sector (単位:㎞コア、Unit: ㎞ core)
光ファイバ製品 ①~② Optical fiber products
2,156,661 - 2,120,222 2,236 229,9862,300,487 - 2,311,710 3,444 196,4582,500,572 - 2,492,486 1,979 211,7992,379,768 - 2,412,566 3,197 206,2122,156,706 - 2,176,243 2,586 242,9862,216,126 - 2,193,589 4,826 265,885
2,017,778 - 1,979,604 3,142 248,8341,396,482 - 1,357,712 1,732 214,4921,053,607 - 1,060,090 3,878 178,1311,270,390 - 1,319,423 4,404 188,4851,928,596 - 1,914,603 2,238 241,9331,433,854 - 1,440,630 1,601 230,078
6,957,720 - 6,924,418 7,659 229,9866,752,600 - 6,782,398 10,609 206,2124,467,867 - 4,397,406 8,752 248,8344,632,840 - 4,674,656 8,243 188,485
21,921,010 - 21,890,118 46,204 188,48526,164,841 - 26,188,368 39,975 201,769
22,811,027 - 22,778,878 35,263 229,98623,588,375 - 23,531,198 45,491 238,44324,194,319 - 24,187,834 64,596 225,00221,236,914 - 21,236,117 36,283 280,13216,846,525 - 16,746,907 26,953 315,739
販 売 その他年 月
Year and Month
149
計
Total Telecommunications Construction/ Electrical Transport /electric power facility installation machinery equipment Others
companies industries
平成19年 (2007)20 (2008)21 (2009)22 (2010)23 (2011)
平成21年度 (09FY)22 (10FY)
平成23年 1~3月 (Q1)4~6 (Q2)7~9 (Q3)
10~12 (Q4)
平成23年 1月 (Jan)2 (Feb)3 (Mar)4 (Apr)5 (May)6 (Jun)
7 (Jul)8 (Aug)9 (Sep)
10 (Oct)11 (Nov)12 (Dec) 2,296,3483,049,056
3,319,344 784,449 19,445 56,570 60693,143 17,041 42,005 519
2,458,820801,546 37,229 39,870 182 2,680,3923,559,219
3,359,213 720,190 26,770 36,756 786 2,574,711607,520 24,461 59,241 97 2,308,6802,999,999
3,087,543 672,716 46,903 77,131 87 2,290,706
659,724 33,844 99,995 23 2,015,6592,809,2452,353,130 866,774 22,027 50,624 22 1,413,683
822,709 24,865 36,896 139 1,146,6552,031,2642,508,566 959,856 36,490 55,500 11 1,456,709
729,169 28,662 33,339 248 2,169,2812,960,6992,470,579 678,571 72,539 50,811 412 1,668,246
2,279,138 73,715 138,445 761 7,435,5609,927,6199,446,755 2,000,426 98,134 173,128 970 7,174,097
2,349,207 80,736 187,515 184 4,575,9977,193,6397,939,844 2,367,596 137,691 139,650 671 5,294,236
7,539,038 1,110,160 694,426 2,121 24,239,87233,585,61736,350,818 6,932,261 661,974 404,624 1,996 28,349,963
8,996,367 390,276 638,738 2,586 24,479,89034,507,85734,300,391 6,929,963 1,148,573 669,973 1,872 25,550,010
6,913,183 594,362 367,556 6,452 26,418,94534,300,49834,210,305 8,671,734 600,488 563,069 5,775 24,369,239
8,875,840 584,409 641,544 17,452 19,402,504
通信・電力業 建設・設備施工業 電気機械工業
29,521,749
輸送機械工業 その他年 月
Year and Month
光 ァイ 製品 ① ② p p
149

時系列表 (非鉄金属編) 製品
(7) 光ファイバ製品 Optical fiber products
(販売先内訳) Sales breakdown by industrial sector (単位:㎞コア、Unit: ㎞ core)
合 計Telecommunications Construction/ Electrical Transport
Total /electric power facility installation machinery equipment Otherscompanies industries
平成19年 (2007) 12,774,842 8,841,247 570,374 202,899 17,451 3,142,87120 (2008) 12,974,188 8,637,641 592,891 144,631 4,754 3,594,27121 (2009) 10,112,664 6,876,960 589,713 134,827 6,445 2,504,71922 (2010) 10,769,193 6,905,934 1,144,564 321,886 1,865 2,394,94423 (2011) 11,728,979 8,970,517 382,617 291,461 2,579 2,081,805
平成21年度 (09FY) 10,162,450 6,910,051 656,860 144,140 1,990 2,449,40922 (10FY) 11,695,499 7,515,315 1,107,002 345,037 2,109 2,726,036
平成23年 1~3月 (Q1) 3,265,188 2,363,004 137,239 61,307 665 702,9734~6 (Q2) 2,796,233 2,345,117 80,601 90,631 184 279,7007~9 (Q3) 2,664,357 1,990,012 95,302 88,789 970 489,284
10~12 (Q4) 3,003,201 2,272,384 69,475 50,734 760 609,848
平成23年 1月 (Jan) 1,029,949 677,490 72,295 19,644 406 260,1142 (Feb) 1,046,096 726,642 28,504 20,684 248 270,0183 (Mar) 1,189,143 958,872 36,440 20,979 11 172,8414 (Apr) 971,174 821,369 24,864 17,723 139 107,0795 (May) 995,418 865,726 21,935 20,944 22 86,7916 (Jun) 829,641 658,022 33,802 51,964 23 85,830
7 (Jul) 893,954 664,584 46,791 45,931 87 136,5618 (Aug) 823,756 606,703 24,341 29,667 97 162,9489 (Sep) 946,647 718,725 24,170 13,191 786 189,775
10 (Oct) 1,066,733 799,124 34,277 14,272 181 218,87911 (Nov) 1,007,634 782,318 18,817 26,460 60 179,97912 (Dec) 928,834 690,942 16,381 10,002 519 210,990
(単位:㎞コア、Unit: ㎞ core)
ア.光ファイバケーブル(通信複合ケーブルを含む)Optical fiber cables(including telecommunication composite cables)
① 通信用ケーブル計 Total of telecommunication cable
通信・電力業 建設・設備施工業 電気機械工業 輸送機械工業 その他年 月
Year and Month
150
合 計Telecommunications Construction/ Electrical Transport
Total /electric power facility installation machinery equipment Others companies industries
平成19年 (2007) 12,653,902 8,802,211 569,775 147,441 17,394 3,117,08120 (2008) 12,852,910 8,597,360 592,311 87,616 4,696 3,570,92721 (2009) 10,014,499 6,830,275 589,102 98,439 6,420 2,490,26322 (2010) 10,627,930 6,852,210 1,144,056 260,325 1,850 2,369,48923 (2011) 11,525,142 8,848,535 382,197 235,013 2,534 2,056,863
平成21年度 (09FY) 10,059,419 6,864,844 656,309 101,795 1,968 2,434,50322 (10FY) 11,513,362 7,421,694 1,106,387 283,336 2,087 2,699,858
平成23年 1~3月 (Q1) 3,197,476 2,314,393 137,032 48,129 655 697,2674~6 (Q2) 2,743,316 2,314,392 80,544 74,820 170 273,3907~9 (Q3) 2,625,413 1,970,115 95,215 74,669 965 484,449
10~12 (Q4) 2,958,937 2,249,635 69,406 37,395 744 601,757
平成23年 1月 (Jan) 1,010,516 664,582 72,282 15,482 400 257,7702 (Feb) 1,028,193 713,812 28,489 17,233 245 268,4143 (Mar) 1,158,767 935,999 36,261 15,414 10 171,0834 (Apr) 949,359 806,806 24,848 12,640 126 104,9395 (May) 977,661 855,392 21,918 15,592 21 84,7386 (Jun) 816,296 652,194 33,778 46,588 23 83,713
7 (Jul) 880,828 657,835 46,773 41,180 85 134,9558 (Aug) 809,393 598,942 24,306 24,909 96 161,1409 (Sep) 935,192 713,338 24,136 8,580 784 188,354
10 (Oct) 1,052,092 791,761 34,244 9,860 180 216,04711 (Nov) 990,305 773,394 18,795 21,206 48 176,86212 (Dec) 916,540 684,480 16,367 6,329 516 208,848
建設・設備施工業 電気機械工業
光 ァイ ケ (通信複合ケ を含む) p ( g p )
通信・電力業 輸送機械工業 その他年 月
Year and Month
150

時系列表 (非鉄金属編) 製品
(7) 光ファイバ製品 Optical fiber products
(販売先内訳) Sales breakdown by industrial sector (単位:㎞コア、Unit: ㎞ core)
計Telecommunications Construction/ Electrical Transport
Total /electric power facility installation machinery equipment Others commpanies industries
平成19年 (2007) 120,940 39,036 599 55,458 57 25,79020 (2008) 121,278 40,281 580 57,015 58 23,34421 (2009) 98,165 46,685 611 36,388 25 14,45622 (2010) 141,263 53,724 508 61,561 15 25,45523 (2011) 203,837 121,982 420 56,448 45 24,942
平成21年度 (09FY) 103,031 45,207 551 42,345 22 14,90622 (10FY) 182,137 93,621 615 61,701 22 26,178
平成23年 1~3月 (Q1) 67,712 48,611 207 13,178 10 5,7064~6 (Q2) 52,917 30,725 57 15,811 14 6,3107~9 (Q3) 38,944 19,897 87 14,120 5 4,835
10~12 (Q4) 44,264 22,749 69 13,339 16 8,091
平成23年 1月 (Jan) 19,433 12,908 13 4,162 6 2,3442 (Feb) 17,903 12,830 15 3,451 3 1,6043 (Mar) 30,376 22,873 179 5,565 1 1,7584 (Apr) 21,815 14,563 16 5,083 13 2,1405 (May) 17,757 10,334 17 5,352 1 2,0536 (Jun) 13,345 5,828 24 5,376 - 2,117
7 (Jul) 13,126 6,749 18 4,751 2 1,6068 (Aug) 14,363 7,761 35 4,758 1 1,8089 (Sep) 11,455 5,387 34 4,611 2 1,421
10 (Oct) 14,641 7,363 33 4,412 1 2,83211 (Nov) 17,329 8,924 22 5,254 12 3,11712 (Dec) 12,294 6,462 14 3,673 3 2,142
(単位:㎞コア、Unit: ㎞ core)
② 光ファイバ心線(ユーザー向け) Optical fiber core wires (for users)
建設・設備施工業 電気機械工業 輸送機械工業 その他年 月
Year and Month
イ. その他の光ケーブル Other opticalfiber prducts
通信・電力業
151
計Telecommunications Construction/ Electrical Transport
Total /electric power facility installation machinery equipment Others commpanies industries
平成19年 (2007) 16,746,907 34,593 14,035 438,645 1 16,259,63320 (2008) 21,236,117 34,093 7,597 418,438 1,021 20,774,96821 (2009) 24,187,834 36,223 4,649 232,729 7 23,914,22622 (2010) 23,531,198 24,029 4,009 348,087 7 23,155,06623 (2011) 22,778,878 25,850 7,659 347,277 7 22,398,085
平成21年度 (09FY) 26,188,368 22,210 5,114 260,484 6 25,900,55422 (10FY) 21,890,118 23,723 3,158 349,389 12 21,513,836
平成23年 1~3月 (Q1) 4,674,656 4,592 452 78,343 6 4,591,2634~6 (Q2) 4,397,406 4,090 135 96,884 - 4,296,2977~9 (Q3) 6,782,398 10,414 2,832 84,339 - 6,684,813
10~12 (Q4) 6,924,418 6,754 4,240 87,711 1 6,825,712
平成23年 1月 (Jan) 1,440,630 1,081 244 31,167 6 1,408,1322 (Feb) 1,914,603 2,527 158 12,655 - 1,899,2633 (Mar) 1,319,423 984 50 34,521 - 1,283,8684 (Apr) 1,060,090 1,340 1 19,173 - 1,039,5765 (May) 1,357,712 1,048 92 29,680 - 1,326,8926 (Jun) 1,979,604 1,702 42 48,031 - 1,929,829
7 (Jul) 2,193,589 8,132 112 31,200 - 2,154,1458 (Aug) 2,176,243 817 120 29,574 - 2,145,7329 (Sep) 2,412,566 1,465 2,600 23,565 - 2,384,936
10 (Oct) 2,492,486 2,422 2,952 25,598 1 2,461,51311 (Nov) 2,311,710 2,131 628 30,110 - 2,278,84112 (Dec) 2,120,222 2,201 660 32,003 - 2,085,358
年 月Year and Month
② 光ファイ 心線( サ 向け) Optical fiber core wires (for users)
電気機械工業 輸送機械工業 その他通信・電力業 建設・設備施工業
151

時系列表 (非鉄金属編) 製品
(8) 軽金属板製品 Light metal plate products(単位:t、Unit: t)
生 産 受 入 在 庫Production Receipts 金額(百万円) その他 Inventory
Value Others(million yen)
平成19年 (2007) 355,121 58,757 355,606 396,066 58,664 22,95420 (2008) 359,025 63,526 341,322 375,726 80,054 27,09321 (2009) 348,921 54,888 328,810 358,991 73,680 28,45322 (2010) 368,725 51,946 353,586 378,488 67,955 27,45523 (2011) 361,460 39,892 330,339 367,095 68,675 29,647
平成21年度 (09FY) 354,160 53,343 333,082 361,969 70,696 33,69622 (10FY) 365,856 49,743 348,530 375,254 68,635 31,862
平成23年 1~3月 (Q1) 79,420 9,472 69,719 78,058 14,621 31,8624~6 (Q2) 107,766 11,702 92,863 101,516 20,939 37,5277~9 (Q3) 93,967 9,883 89,078 97,299 17,389 34,908
10~12 (Q4) 80,307 8,836 78,679 90,222 15,726 29,647
平成23年 1月 (Jan) 23,159 3,241 19,170 21,156 4,939 29,7452 (Feb) 28,844 3,497 24,716 27,504 5,093 32,2783 (Mar) 27,417 2,734 25,834 29,398 4,589 31,8624 (Apr) 34,352 3,500 29,469 31,393 6,688 33,5575 (May) 37,669 4,061 30,216 33,454 7,066 38,0076 (Jun) 35,744 4,140 33,178 36,669 7,185 37,527
7 (Jul) 35,917 3,684 34,718 36,800 6,562 35,8468 (Aug) 29,982 3,548 29,096 31,768 6,104 34,1769 (Sep) 28,069 2,651 25,265 28,731 4,722 34,908
10 (Oct) 26,268 2,876 24,823 29,051 5,339 33,89011 (Nov) 28,033 3,330 26,914 31,100 5,714 32,62512 (Dec) 26,006 2,630 26,942 30,071 4,673 29,647
(単位:t、Unit: t)
年 月Year and Month
合計(1~6) Total 出 荷 Shipments
販 売 Sales
数 量Quantity
日用品 (1) Daily necessities
152
生 産 受 入 在 庫Production Receipts 金額(百万円) その他 Inventory
Value Others(million yen)
平成19年 (2007) 1,899 168 2,076 4,813 - 1,33920 (2008) 1,738 212 1,921 4,750 - 1,36721 (2009) 1,168 64 1,457 3,687 274 80722 (2010) 1,164 115 1,484 3,636 88 51323 (2011) 1,195 141 1,486 3,612 54 308
平成21年度 (09FY) 1,141 70 1,437 3,629 185 71622 (10FY) 1,144 121 1,471 3,572 87 422
平成23年 1~3月 (Q1) 267 24 366 872 15 4224~6 (Q2) 337 38 343 821 15 4387~9 (Q3) 278 34 291 707 12 448
10~12 (Q4) 313 46 486 1,212 13 308
平成23年 1月 (Jan) 81 7 107 244 3 4902 (Feb) 91 8 107 271 6 4763 (Mar) 95 8 152 357 5 4224 (Apr) 107 11 132 325 5 4025 (May) 120 11 103 247 5 4266 (Jun) 110 17 108 249 5 438
7 (Jul) 91 10 81 193 4 4558 (Aug) 85 11 99 243 3 4509 (Sep) 102 13 111 271 5 448
10 (Oct) 97 12 121 320 5 43011 (Nov) 93 12 134 326 4 39712 (Dec) 123 23 231 566 3 308
販 売 Sales 年 月Year and Month
日用品 (1) Daily necessities 出 荷 Shipments
数 量Quantity
152

時系列表 (非鉄金属編) 製品
(8) 軽金属板製品 Light metal plate products(単位:t、Unit: t)
生 産 受 入 在 庫Production Receipts 金額(百万円) その他 Inventory
Value Others(million yen)
平成19年 (2007) 353,223 58,589 353,530 391,253 58,664 21,61620 (2008) 357,287 63,314 339,400 370,976 80,054 25,72621 (2009) 347,752 54,824 327,353 355,304 73,407 27,64622 (2010) 367,561 51,831 352,102 374,852 67,867 26,94323 (2011) 360,265 39,751 328,853 363,483 68,620 29,339
平成21年度 (09FY) 353,019 53,273 331,645 358,340 70,512 32,98122 (10FY) 364,713 49,622 347,060 371,682 68,548 31,439
平成23年 1~3月 (Q1) 79,153 9,448 69,353 77,186 14,607 31,4394~6 (Q2) 107,428 11,664 92,520 100,695 20,924 37,0887~9 (Q3) 93,689 9,849 88,787 96,592 17,377 34,461
10~12 (Q4) 79,995 8,790 78,193 89,010 15,713 29,339
平成23年 1月 (Jan) 23,078 3,234 19,064 20,912 4,936 29,2542 (Feb) 28,753 3,489 24,608 27,233 5,087 31,8023 (Mar) 27,322 2,725 25,681 29,041 4,584 31,4394 (Apr) 34,245 3,490 29,337 31,068 6,683 33,1555 (May) 37,549 4,051 30,112 33,207 7,061 37,5816 (Jun) 35,634 4,124 33,071 36,420 7,180 37,088
7 (Jul) 35,826 3,673 34,637 36,607 6,558 35,3918 (Aug) 29,896 3,537 28,997 31,525 6,102 33,7279 (Sep) 27,967 2,638 25,154 28,460 4,717 34,461
10 (Oct) 26,172 2,865 24,702 28,731 5,334 33,46011 (Nov) 27,939 3,318 26,780 30,774 5,709 32,22812 (Dec) 25,884 2,607 26,711 29,505 4,669 29,339
(単位:t、Unit: t)
年 月Year and Month
産業用品計 (2~6) For industry
販 売 Sales 出 荷 Shipments
数 量Quantity
飲料用缶計 (2~3) Cans for beverages
153
生 産 受 入 在 庫Production Receipts 金額(百万円) その他 Inventory
Value Others(million yen)
平成19年 (2007) 336,294 58,254 337,290 334,255 57,571 21,18420 (2008) 340,328 62,421 322,536 315,892 78,980 25,38121 (2009) 336,849 54,060 316,657 312,161 72,442 27,25022 (2010) 341,614 51,071 326,304 319,512 66,912 26,57423 (2011) 342,182 39,004 310,980 312,710 67,692 28,940
平成21年度 (09FY) 338,099 52,508 316,965 311,960 69,534 32,56122 (10FY) 340,399 48,916 322,892 317,205 67,644 31,072
平成23年 1~3月 (Q1) 74,040 9,246 64,295 64,895 14,348 31,0724~6 (Q2) 103,583 11,446 88,699 89,281 20,668 36,7327~9 (Q3) 89,055 9,665 84,185 83,713 17,153 34,114
10~12 (Q4) 75,504 8,646 73,801 74,821 15,523 28,940
平成23年 1月 (Jan) 21,395 3,145 17,419 17,457 4,835 28,8602 (Feb) 26,759 3,412 22,580 22,863 4,986 31,4643 (Mar) 25,885 2,690 24,296 24,575 4,527 31,0724 (Apr) 33,141 3,432 28,269 27,623 6,612 32,7645 (May) 36,397 3,980 28,936 29,616 6,974 37,2316 (Jun) 34,045 4,034 31,494 32,042 7,083 36,732
7 (Jul) 34,050 3,593 32,910 32,131 6,465 35,0008 (Aug) 28,447 3,469 27,556 27,632 6,023 33,3369 (Sep) 26,559 2,603 23,718 23,950 4,666 34,114
10 (Oct) 24,532 2,823 23,082 24,016 5,281 33,10511 (Nov) 26,411 3,279 25,337 25,632 5,655 31,80312 (Dec) 24,561 2,545 25,382 25,173 4,586 28,940
年 月Year and Month
飲料用缶計 (2~3) Cans for beverages
販 売 Sales 出 荷 Shipments
数 量Quantity
153

時系列表 (非鉄金属編) 製品
(8) 軽金属板製品 Light metal plate products(単位:t、Unit: t)
生 産 受 入 在 庫Production Receipts 金額(百万円) その他 Inventory
Value Others(million yen)
平成19年 (2007) 232,261 27,193 235,645 230,142 24,558 11,99420 (2008) 239,939 29,884 234,052 224,704 34,468 14,07021 (2009) 237,380 22,878 229,498 219,399 30,669 14,21822 (2010) 244,925 21,816 236,691 222,560 29,526 14,71123 (2011) 242,916 15,727 229,535 218,176 29,171 14,503
平成21年度 (09FY) 240,083 21,567 229,700 218,581 29,654 17,55322 (10FY) 243,961 20,803 234,324 219,719 29,008 18,832
平成23年 1~3月 (Q1) 52,456 3,803 46,225 44,010 5,769 18,8324~6 (Q2) 73,644 4,585 66,468 63,801 9,315 21,2787~9 (Q3) 63,654 3,967 62,932 58,957 7,597 18,369
10~12 (Q4) 53,162 3,372 53,910 51,408 6,489 14,503
平成23年 1月 (Jan) 14,777 1,473 12,495 12,078 2,297 16,1692 (Feb) 18,603 1,418 16,473 15,893 2,033 17,6843 (Mar) 19,076 912 17,258 16,039 1,439 18,8324 (Apr) 23,525 1,215 21,427 20,019 2,671 19,4745 (May) 25,737 1,628 21,307 20,780 3,144 22,3886 (Jun) 24,382 1,742 23,733 23,002 3,500 21,278
7 (Jul) 24,583 1,679 25,050 23,042 2,991 19,4978 (Aug) 20,625 1,393 20,566 19,402 2,746 18,2039 (Sep) 18,446 896 17,315 16,513 1,861 18,369
10 (Oct) 17,267 1,048 16,708 16,414 2,271 17,70611 (Nov) 18,306 1,303 18,539 17,710 2,283 16,49212 (Dec) 17,589 1,021 18,664 17,284 1,935 14,503
(単位:t、Unit: t)
年 月Year and Month
缶体 (2) Can bodies
販 売 Sales 出 荷 Shipments
数 量Quantity
缶ふた (3) Can lids
154
生 産 受 入 在 庫Production Receipts 金額(百万円) その他 Inventory
Value Others(million yen)
平成19年 (2007) 104,033 31,061 101,645 104,113 33,013 9,19020 (2008) 100,389 32,538 88,484 91,188 44,512 11,31121 (2009) 99,469 31,182 87,158 92,762 41,773 13,03222 (2010) 96,689 29,255 89,613 96,952 37,386 11,86323 (2011) 99,266 23,276 81,445 94,534 38,522 14,437
平成21年度 (09FY) 98,016 30,941 87,264 93,379 39,880 15,00822 (10FY) 96,438 28,114 88,568 97,486 38,636 12,240
平成23年 1~3月 (Q1) 21,584 5,443 18,069 20,885 8,579 12,2404~6 (Q2) 29,939 6,861 22,232 25,480 11,353 15,4557~9 (Q3) 25,402 5,698 21,253 24,756 9,556 15,745
10~12 (Q4) 22,342 5,275 19,891 23,413 9,034 14,437
平成23年 1月 (Jan) 6,618 1,672 4,924 5,379 2,537 12,6912 (Feb) 8,157 1,993 6,107 6,970 2,954 13,7793 (Mar) 6,809 1,778 7,038 8,536 3,089 12,2404 (Apr) 9,617 2,217 6,842 7,604 3,941 13,2905 (May) 10,660 2,352 7,629 8,836 3,830 14,8446 (Jun) 9,663 2,292 7,761 9,040 3,583 15,455
7 (Jul) 9,467 1,914 7,860 9,089 3,474 15,5028 (Aug) 7,822 2,076 6,990 8,230 3,277 15,1339 (Sep) 8,113 1,707 6,403 7,437 2,805 15,745
10 (Oct) 7,264 1,775 6,375 7,602 3,011 15,39911 (Nov) 8,105 1,976 6,798 7,922 3,372 15,31112 (Dec) 6,972 1,524 6,718 7,889 2,651 14,437
販 売 Sales 年 月Year and Month
出 荷 Shipments缶ふた (3) Can lids
数 量Quantity
154

時系列表 (非鉄金属編) 製品
(8) 軽金属板製品 Light metal plate products(単位:t、Unit: t)
生 産 受 入 在 庫Production Receipts 金額(百万円) その他 Inventory
Value Others(million yen)
平成19年 (2007) 16,929 335 16,240 56,998 1,094 43220 (2008) 16,960 892 16,864 55,084 1,074 34521 (2009) 10,903 764 10,696 43,143 964 39622 (2010) 25,947 760 25,797 55,340 955 36923 (2011) 18,083 747 17,873 50,773 928 398
平成21年度 (09FY) 14,920 765 14,681 46,380 977 41922 (10FY) 24,314 706 24,168 54,477 904 367
平成23年 1~3月 (Q1) 5,113 202 5,058 12,291 259 3674~6 (Q2) 3,845 218 3,820 11,414 255 3567~9 (Q3) 4,633 184 4,603 12,879 224 346
10~12 (Q4) 4,491 144 4,392 14,189 190 398
平成23年 1月 (Jan) 1,683 89 1,645 3,455 101 3952 (Feb) 1,994 77 2,028 4,370 100 3383 (Mar) 1,436 36 1,385 4,466 57 3674 (Apr) 1,104 58 1,067 3,445 71 3915 (May) 1,151 71 1,176 3,591 87 3506 (Jun) 1,590 89 1,577 4,378 97 356
7 (Jul) 1,775 80 1,727 4,476 93 3928 (Aug) 1,449 69 1,440 3,893 79 3919 (Sep) 1,408 35 1,436 4,510 52 346
10 (Oct) 1,640 42 1,620 4,715 53 35511 (Nov) 1,528 40 1,443 5,142 54 42512 (Dec) 1,323 62 1,329 4,332 83 398
(単位:t、Unit: t)
出 荷 Shipments販 売 Sales
数 量Quantity
年 月Year and Month
産業用アルミニウム計(除・飲料用缶)(4~6) Aluminium for industry(excluding alminium cans for beverages)
電気器具用品 (4) Parts for electric equipment
155
生 産 受 入 在 庫Production Receipts 金額(百万円) その他 Inventory
Value Others(million yen)
平成19年 (2007) 3,015 - 3,041 5,628 - 10220 (2008) 2,743 - 2,738 4,744 - 10721 (2009) 2,091 - 2,082 3,641 45 11522 (2010) 3,080 - 3,123 4,991 - 7223 (2011) 2,684 - 2,678 4,648 - 79
平成21年度 (09FY) 2,321 - 2,352 3,911 45 7022 (10FY) 3,133 - 3,132 5,244 - 71
平成23年 1~3月 (Q1) 715 - 715 1,324 - 714~6 (Q2) 671 - 686 1,161 - 587~9 (Q3) 675 - 664 1,144 - 69
10~12 (Q4) 624 - 613 1,019 - 79
平成23年 1月 (Jan) 237 - 235 413 - 752 (Feb) 231 - 243 490 - 623 (Mar) 246 - 237 421 - 714 (Apr) 225 - 219 361 - 775 (May) 189 - 213 366 - 556 (Jun) 257 - 254 434 - 58
7 (Jul) 243 - 238 392 - 628 (Aug) 220 - 216 379 - 669 (Sep) 212 - 210 373 - 69
10 (Oct) 226 - 226 366 - 6811 (Nov) 205 - 198 332 - 7512 (Dec) 193 - 189 321 - 79
出 荷 Shipments販 売 Sales
数 量Quantity
年 月Year and Month
電気器具用品 (4) Parts for electric equipment
155

時系列表 (非鉄金属編) 製品
(8) 軽金属板製品 Light metal plate products(単位:t、Unit: t)
生 産 受 入 在 庫Production Receipts 金額(百万円) その他 Inventory
Value Others(million yen)
平成19年 (2007) 7,669 - 7,729 19,766 - 10220 (2008) 8,070 - 8,093 19,599 - 7821 (2009) 4,907 - 4,861 13,152 - 12422 (2010) 5,944 - 5,979 15,065 - 10823 (2011) 4,740 - 4,722 11,951 - 125
平成21年度 (09FY) 5,470 - 5,389 14,883 - 18822 (10FY) 5,626 - 5,650 13,701 - 165
平成23年 1~3月 (Q1) 1,196 - 1,139 2,694 - 1654~6 (Q2) 774 - 794 1,970 - 1447~9 (Q3) 1,290 - 1,307 3,401 - 127
10~12 (Q4) 1,480 - 1,482 3,886 - 125
平成23年 1月 (Jan) 397 - 360 919 - 1452 (Feb) 447 - 449 1,065 - 1433 (Mar) 352 - 330 710 - 1654 (Apr) 267 - 285 552 - 1475 (May) 210 - 213 515 - 1446 (Jun) 297 - 296 903 - 144
7 (Jul) 437 - 441 1,138 - 1418 (Aug) 395 - 390 1,018 - 1469 (Sep) 458 - 476 1,245 - 127
10 (Oct) 520 - 514 1,319 - 13311 (Nov) 475 - 416 1,156 - 19212 (Dec) 485 - 552 1,411 - 125
(単位:t、Unit: t)
年 月Year and Month
船舶・車両用品 (5) Parts for ships/vehicles 出 荷 Shipments
販 売 Sales
数 量Quantity
その他の産業用品 (6) Others
156
生 産 受 入 在 庫Production Receipts 金額(百万円) その他 Inventory
Value Others(million yen)
平成19年 (2007) 6,245 335 5,470 31,604 1,094 22820 (2008) 6,147 892 6,033 30,741 1,074 16021 (2009) 3,905 764 3,753 26,350 919 15722 (2010) 16,923 760 16,695 35,284 955 18923 (2011) 10,658 747 10,473 34,174 928 194
平成21年度 (09FY) 7,129 765 6,939 27,586 932 16122 (10FY) 15,554 706 15,386 35,532 904 131
平成23年 1~3月 (Q1) 3,203 202 3,204 8,273 259 1314~6 (Q2) 2,400 218 2,340 8,283 255 1547~9 (Q3) 2,669 184 2,632 8,334 224 150
10~12 (Q4) 2,387 144 2,297 9,284 190 194
平成23年 1月 (Jan) 1,049 89 1,050 2,123 101 1752 (Feb) 1,316 77 1,336 2,815 100 1323 (Mar) 838 36 818 3,335 57 1314 (Apr) 612 58 564 2,532 71 1665 (May) 753 71 750 2,710 87 1526 (Jun) 1,035 89 1,026 3,041 97 154
7 (Jul) 1,096 80 1,048 2,946 93 1898 (Aug) 834 69 834 2,496 79 1799 (Sep) 739 35 750 2,892 52 150
10 (Oct) 894 42 880 3,030 53 15411 (Nov) 849 40 830 3,654 54 15812 (Dec) 644 62 587 2,600 83 194
その他の産業用品 (6) Others 出 荷 Shipments
販 売 Sales
数 量Quantity
年 月Year and Month
156

時系列表 (非鉄金属編) 原材料
2.原材料 Raw materials (1) アルミニウム Aluminum
(単位:t、 Unit: t)
アルミニウム地金 アルミニウム二次地金 アルミニウムのくずアルミニウム滓
(ドロス・灰)銅及び銅の故又はくず
消 費 在 庫 消 費 在 庫 消 費 在 庫 消 費 在 庫 消 費 在 庫
Consumption Inventory Consumption Inventory Consumption Inventory Consumption Inventory Consumption Inventory
平成19年 (2007) 468,087 14,476 378,467 24,807 1,263,450 53,447 179,684 1,967 15,798 1,00920 (2008) 441,748 14,718 342,802 24,342 1,143,471 55,505 151,928 2,221 13,524 1,74121 (2009) 307,769 10,134 246,488 20,101 824,823 48,311 124,033 3,181 9,372 79622 (2010) 355,092 8,501 295,583 20,521 956,256 52,863 132,691 2,805 10,004 96623 (2011) 343,046 11,078 267,955 23,161 884,634 53,232 118,586 2,238 9,223 968
平成21年度 (09FY) 343,919 9,252 277,680 18,084 903,240 45,260 127,885 2,851 10,148 635
22 (10FY) 359,818 8,840 289,758 20,031 946,228 52,886 130,501 2,262 10,021 756
平成23年 1~3月 (Q1) 91,023 8,840 70,948 20,031 230,531 52,886 29,523 2,262 2,420 7564~6 (Q2) 77,889 9,465 56,227 21,067 199,663 56,620 28,709 2,560 1,967 7687~9 (Q3) 87,174 10,710 69,097 23,599 225,234 50,708 30,539 2,462 2,336 1,011
10~12 (Q4) 86,960 11,078 71,683 23,161 229,206 53,232 29,815 2,238 2,500 968
平成23年 1月 (Jan) 29,443 8,405 23,113 19,761 74,464 50,374 9,572 2,487 834 7942 (Feb) 28,746 8,722 23,489 20,016 80,891 47,903 9,981 2,660 819 7473 (Mar) 32,834 8,840 24,346 20,031 75,176 52,886 9,970 2,262 767 7564 (Apr) 25,717 9,930 18,467 20,969 63,989 59,074 9,429 2,032 588 8755 (May) 22,703 10,885 16,325 21,371 59,033 58,680 8,817 2,577 560 8286 (Jun) 29,469 9,465 21,435 21,067 76,641 56,620 10,463 2,560 819 768
7 (Jul) 32,198 9,936 23,402 18,625 76,104 50,984 10,394 2,742 857 8938 (Aug) 25,263 10,093 21,729 20,074 70,782 53,392 9,842 2,531 684 9809 (Sep) 29,713 10,710 23,966 23,599 78,348 50,708 10,303 2,462 795 1,011
10 (Oct) 31,662 10,845 25,890 21,610 79,912 50,307 10,448 2,428 971 76411 (Nov) 30,279 10,639 25,047 20,904 77,951 52,031 9,980 2,329 751 74212 (Dec) 25,019 11,078 20,746 23,161 71,343 53,232 9,387 2,238 778 968
年 月Year and Month
Aluminum ingots Aluminum scrap Copper and copper scrapAluminum drossSecondary aluminum ingots
157
(2) 非鉄金属製品(伸銅製品) Non-ferrous metal products (Elongated copper products)
(単位:t、 Unit: t)
電 気 銅 銅 の 故 又 は く ず 銅 合 金 の 故 又 は く ず
生 産 消 費 在 庫 生 産 消 費 在 庫 生 産 消 費 在 庫
(発生) (発生) (発生)
Production Consumption Inventory Production Consumption Inventory Production Consumption Inventory
平成19年 (2007) … 452,203 7,089 179,720 208,591 5,839 242,693 379,710 11,77720 (2008) … 441,382 10,495 167,538 197,269 6,719 193,284 363,964 12,22621 (2009) … 308,224 4,041 130,506 140,844 5,120 138,781 261,705 8,97822 (2010) … 415,227 5,000 167,746 185,536 6,010 189,190 338,658 10,99923 (2011) … 376,209 6,468 158,505 184,333 6,515 175,310 332,529 11,459
平成21年度 (09FY) … 360,988 2,536 145,494 163,887 3,854 159,708 302,278 7,11522 (10FY) … 410,201 4,583 168,291 184,188 6,020 186,258 336,258 10,691
平成23年 1~3月 (Q1) … 90,261 4,583 39,976 44,488 6,020 42,582 83,111 10,6914~6 (Q2) … 107,733 5,663 43,386 50,434 6,562 48,893 92,351 9,9487~9 (Q3) … 91,605 3,980 38,533 44,073 6,254 43,872 80,451 10,036
10~12 (Q4) … 86,610 6,468 36,610 45,338 6,515 39,963 76,616 11,459
平成23年 1月 (Jan) … 29,332 4,203 12,294 12,700 8,084 13,391 26,675 10,1892 (Feb) … 30,597 3,605 13,967 15,133 7,517 13,715 28,864 9,3223 (Mar) … 30,332 4,583 13,715 16,655 6,020 15,476 27,572 10,6914 (Apr) … 35,688 5,615 14,542 16,946 7,414 16,753 32,132 11,3735 (May) … 36,096 5,267 13,927 17,452 6,192 16,490 30,208 9,8146 (Jun) … 35,949 5,663 14,917 16,036 6,562 15,650 30,011 9,948
7 (Jul) … 33,578 4,824 13,986 15,918 5,982 14,911 27,500 10,7908 (Aug) … 27,643 5,512 11,619 13,030 7,538 13,591 25,066 11,1509 (Sep) … 30,384 3,980 12,928 15,125 6,254 15,370 27,885 10,036
10 (Oct) … 31,140 4,548 13,218 15,697 6,808 14,075 25,110 11,47411 (Nov) … 28,338 4,405 12,459 15,918 6,027 13,984 27,566 10,81812 (Dec) … 27,132 6,468 10,933 13,723 6,515 11,904 23,940 11,459
Copper scrap Copper base alloy scrap年 月Year and Month
Electrolytic copper
157

時系列表 (非鉄金属編) 原材料
(2) 非鉄金属製品(伸銅製品) Non-ferrous metal products (Elongated copper products)(単位:t、 Unit: t)
亜 鉛 再 生 亜 鉛
生 産 消 費 在 庫 生 産 消 費 在 庫
(発生) (発生)
Production Consumption Inventory Production Consumption Inventory
平成19年 (2007) … 63,837 1,980 6,243 9,247 91620 (2008) … 57,692 1,727 2,467 8,892 36021 (2009) … 38,347 733 2,094 6,200 21822 (2010) … 54,495 1,342 2,900 7,499 44023 (2011) … 52,692 1,143 2,422 8,699 353
平成21年度 (09FY) … 45,813 793 2,506 6,787 189
22 (10FY) … 53,456 1,405 2,850 7,931 229
平成23年 1~3月 (Q1) … 11,597 1,405 677 2,257 2294~6 (Q2) … 14,687 1,966 739 2,932 6967~9 (Q3) … 12,616 1,426 582 1,909 379
10~12 (Q4) … 13,792 1,143 424 1,601 353
平成23年 1月 (Jan) … 3,529 1,189 191 605 3762 (Feb) … 4,224 1,256 172 705 2583 (Mar) … 3,844 1,405 314 947 2294 (Apr) … 4,578 2,224 286 988 3315 (May) … 5,046 2,353 216 1,083 4096 (Jun) … 5,063 1,966 237 861 696
7 (Jul) … 4,301 1,750 202 571 6508 (Aug) … 3,892 1,539 194 710 4859 (Sep) … 4,423 1,426 186 628 379
10 (Oct) … 4,675 1,142 164 610 35611 (Nov) … 4,730 1,285 143 587 32612 (Dec) … 4,387 1,143 117 404 353
Zinc Re-melted zinc年 月Year and Month
158
(3) 非鉄金属製品(アルミニウム圧延製品) Non-ferrous metal products (Aluminum mill products)
(単位:t、 Unit: t)
アルミニウム地金 アルミニウム合金地金 アルミニウム二次地金 アルミニウムくず
消 費 在 庫 消 費 在 庫 消 費 在 庫 消 費 在 庫
Consumption Inventory Consumption Inventory Consumption Inventory Consumption Inventory
平成19年 (2007) 1,669,049 71,709 3,041,624 89,359 251,233 8,657 1,710,803 39,37920 (2008) 1,570,710 105,002 2,927,631 96,250 238,105 8,535 1,704,470 46,08421 (2009) 1,240,052 66,539 2,321,044 66,535 190,194 7,772 1,371,750 46,58722 (2010) 1,471,265 58,763 2,735,427 76,458 201,040 6,087 1,583,488 44,78023 (2011) 1,366,978 81,246 2,624,611 80,272 189,870 9,945 1,516,667 41,728
平成21年度 (09FY) 1,395,928 57,810 2,525,197 67,930 192,408 5,513 1,474,355 50,69722 (10FY) 1,450,642 65,520 2,717,151 72,831 195,097 9,076 1,548,541 43,362
平成23年 1~3月 (Q1) 339,243 65,520 640,070 72,831 42,926 9,076 351,115 43,3624~6 (Q2) 364,922 64,174 694,554 76,149 52,832 8,056 408,542 41,6007~9 (Q3) 334,807 67,377 636,257 84,857 49,078 9,555 372,486 45,476
10~12 (Q4) 328,006 81,246 653,730 80,272 45,034 9,945 384,524 41,728
平成23年 1月 (Jan) 103,363 56,967 208,336 73,995 13,780 8,163 106,426 41,6922 (Feb) 121,228 60,591 219,576 72,052 16,063 9,164 119,340 42,9593 (Mar) 114,652 65,520 212,158 72,831 13,083 9,076 125,349 43,3624 (Apr) 124,768 69,145 228,580 75,612 17,578 9,149 136,887 39,0375 (May) 121,039 63,260 230,253 76,307 17,936 8,770 134,209 40,8456 (Jun) 119,115 64,174 235,721 76,149 17,318 8,056 137,446 41,600
7 (Jul) 122,074 60,266 232,711 81,133 19,413 6,817 133,294 41,8128 (Aug) 98,255 68,987 189,864 78,159 13,575 8,516 114,819 40,9289 (Sep) 114,478 67,377 213,682 84,857 16,090 9,555 124,373 45,476
10 (Oct) 120,242 73,058 226,377 84,365 14,729 11,333 134,618 43,06111 (Nov) 116,828 73,085 223,047 87,244 17,153 11,003 135,207 41,50912 (Dec) 90,936 81,246 204,306 80,272 13,152 9,945 114,699 41,728
Aluminum ingots Aluminum alloy ingots年 月Year and Month
Secondary aluminum ingots Aluminum scrap
158
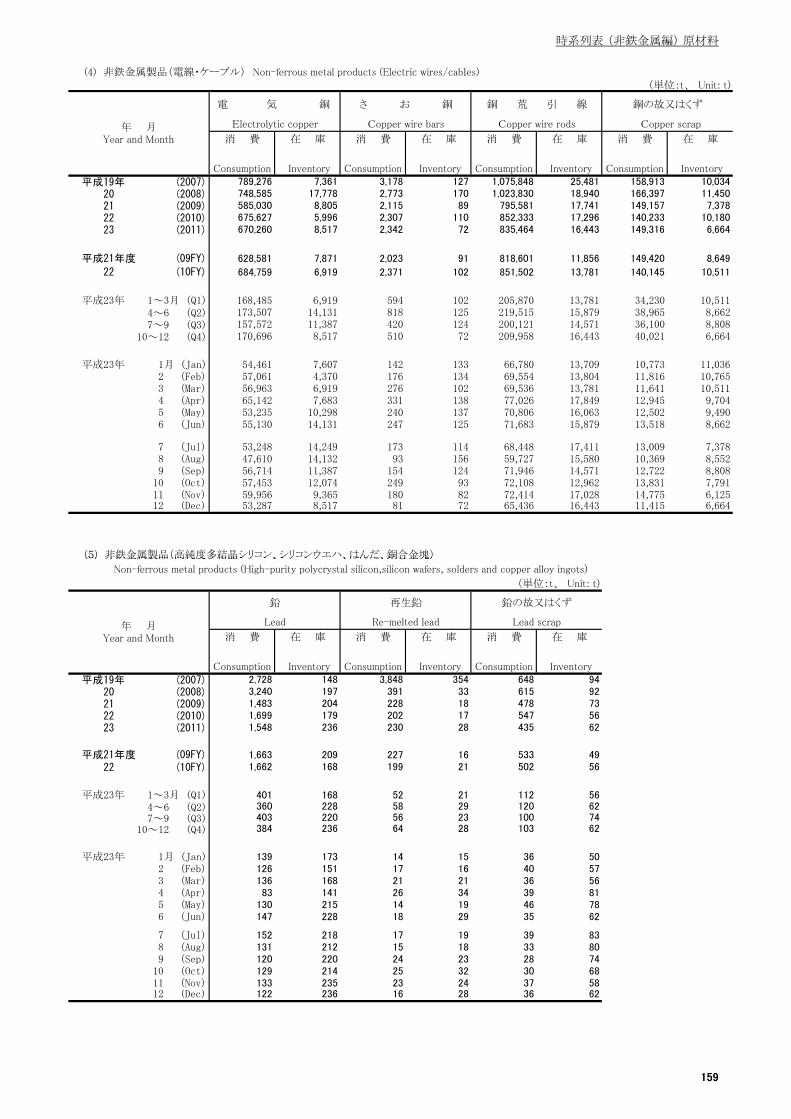
時系列表 (非鉄金属編) 原材料
(4) 非鉄金属製品(電線・ケーブル) Non-ferrous metal products (Electric wires/cables)(単位:t、 Unit: t)
電 気 銅 さ お 銅 銅 荒 引 線 銅の故又はくず
消 費 在 庫 消 費 在 庫 消 費 在 庫 消 費 在 庫
Consumption Inventory Consumption Inventory Consumption Inventory Consumption Inventory
平成19年 (2007) 789,276 7,361 3,178 127 1,075,848 25,481 158,913 10,03420 (2008) 748,585 17,778 2,773 170 1,023,830 18,940 166,397 11,45021 (2009) 585,030 8,805 2,115 89 795,581 17,741 149,157 7,37822 (2010) 675,627 5,996 2,307 110 852,333 17,296 140,233 10,18023 (2011) 670,260 8,517 2,342 72 835,464 16,443 149,316 6,664
平成21年度 (09FY) 628,581 7,871 2,023 91 818,601 11,856 149,420 8,649
22 (10FY) 684,759 6,919 2,371 102 851,502 13,781 140,145 10,511
平成23年 1~3月 (Q1) 168,485 6,919 594 102 205,870 13,781 34,230 10,5114~6 (Q2) 173,507 14,131 818 125 219,515 15,879 38,965 8,6627~9 (Q3) 157,572 11,387 420 124 200,121 14,571 36,100 8,808
10~12 (Q4) 170,696 8,517 510 72 209,958 16,443 40,021 6,664
平成23年 1月 (Jan) 54,461 7,607 142 133 66,780 13,709 10,773 11,0362 (Feb) 57,061 4,370 176 134 69,554 13,804 11,816 10,7653 (Mar) 56,963 6,919 276 102 69,536 13,781 11,641 10,5114 (Apr) 65,142 7,683 331 138 77,026 17,849 12,945 9,7045 (May) 53,235 10,298 240 137 70,806 16,063 12,502 9,4906 (Jun) 55,130 14,131 247 125 71,683 15,879 13,518 8,662
7 (Jul) 53,248 14,249 173 114 68,448 17,411 13,009 7,3788 (Aug) 47,610 14,132 93 156 59,727 15,580 10,369 8,5529 (Sep) 56,714 11,387 154 124 71,946 14,571 12,722 8,808
10 (Oct) 57,453 12,074 249 93 72,108 12,962 13,831 7,79111 (Nov) 59,956 9,365 180 82 72,414 17,028 14,775 6,12512 (Dec) 53,287 8,517 81 72 65,436 16,443 11,415 6,664
(5) 非鉄金属製品(高純度多結晶シリコン、シリコンウエハ、はんだ、銅合金塊)
Copper scrapElectrolytic copper Copper wire bars Copper wire rods年 月Year and Month
159
(5) 非鉄金属製品(高純度多結晶シリ ン、シリ ンウ ハ、はんだ、銅合金塊)
Non-ferrous metal products (High-purity polycrystal silicon,silicon wafers, solders and copper alloy ingots)
(単位:t、 Unit: t)
消 費 在 庫 消 費 在 庫 消 費 在 庫
Consumption Inventory Consumption Inventory Consumption Inventory
平成19年 (2007) 2,728 148 3,848 354 648 9420 (2008) 3,240 197 391 33 615 9221 (2009) 1,483 204 228 18 478 7322 (2010) 1,699 179 202 17 547 5623 (2011) 1,548 236 230 28 435 62
平成21年度 (09FY) 1,663 209 227 16 533 4922 (10FY) 1,662 168 199 21 502 56
平成23年 1~3月 (Q1) 401 168 52 21 112 564~6 (Q2) 360 228 58 29 120 627~9 (Q3) 403 220 56 23 100 74
10~12 (Q4) 384 236 64 28 103 62
平成23年 1月 (Jan) 139 173 14 15 36 502 (Feb) 126 151 17 16 40 573 (Mar) 136 168 21 21 36 564 (Apr) 83 141 26 34 39 815 (May) 130 215 14 19 46 786 (Jun) 147 228 18 29 35 62
7 (Jul) 152 218 17 19 39 838 (Aug) 131 212 15 18 33 809 (Sep) 120 220 24 23 28 74
10 (Oct) 129 214 25 32 30 6811 (Nov) 133 235 23 24 37 5812 (Dec) 122 236 16 28 36 62
Re-melted lead Lead scrap
鉛の故又はくず
Lead
鉛 再生鉛
年 月Year and Month
159

時系列表 (非鉄金属編) 生産能力
3. 生産能力 Production capacity
(kg) (kg) (t) (t) (t)平成19年末 (2007) 15,620 233,000 132,783 23,050 62,500 45,200 17,300
20 (2008) 15,620 233,000 136,283 23,050 62,700 46,300 16,40021 (2009) 16,100 233,000 136,283 23,050 62,700 46,300 16,40022 (2010) 16,300 233,000 149,283 23,150 62,760 46,360 16,40023 (2011) 16,300 233,000 149,283 23,150 62,760 46,360 16,400
平成21年度末 (09FY) 16,100 233,000 148,783 23,050 62,700 46,300 16,40022 (10FY) 16,300 233,000 149,283 23,150 62,760 46,360 16,400
平成23年 1~3月 (Q1) 16,300 233,000 149,283 23,150 62,760 46,360 16,4004~6 (Q2) 16,300 233,000 149,283 23,150 62,760 46,360 16,4007~9 (Q3) 16,300 233,000 149,283 23,150 62,760 46,360 16,400
10~12 (Q4) 16,300 233,000 149,283 23,150 62,760 46,360 16,400
平成23年 1月 (Jan) 16,300 233,000 149,283 23,150 62,760 46,360 16,4002 (Feb) 16,300 233,000 149,283 23,150 62,760 46,360 16,4003 (Mar) 16,300 233,000 149,283 23,150 62,760 46,360 16,4004 (Apr) 16,300 233,000 149,283 23,150 62,760 46,360 16,4005 (May) 16,300 233,000 149,283 23,150 62,760 46,360 16,4006 (Jun) 16,300 233,000 149,283 23,150 62,760 46,360 16,400
7 (Jul) 16,300 233,000 149,283 23,150 62,760 46,360 16,4008 (Aug) 16,300 233,000 149,283 23,150 62,760 46,360 16,4009 (Sep) 16,300 233,000 149,283 23,150 62,760 46,360 16,400
10 (Oct) 16,300 233,000 149,283 23,150 62,760 46,360 16,40011 (Nov) 16,300 233,000 149,283 23,150 62,760 46,360 16,40012 (Dec) 16,300 233,000 149,283 23,150 62,760 46,360 16,400
(2) 非鉄金属製品(伸銅製品) (3) 非鉄金属製品(アルミニウム圧延製品) Non-ferrous metal products (Elongated copper products) Non-ferrous metal products (Aluminum mill products)
Electrolytic zinc Distilled zinc
亜 鉛 計
Zinc total 電気亜鉛 蒸留亜鉛
(1) 非鉄金属 Non-ferrous metals
年 月Year and Month
電 気 金 電 気 銀 電 気 銅 電 気 鉛
Electrolytic gold Electrolytic silver Electrolytic copper Electrolytic lead
160
(t) (t) (t) (t)平成19年末 (2007) 101,651 120,120 96,795 11,855
20 (2008) 101,814 120,120 93,887 11,85521 (2009) 97,275 120,120 90,987 11,85522 (2010) 96,335 120,120 86,367 11,85523 (2011) 95,935 126,120 86,937 11,855
平成21年度末 (09FY) 97,325 120,120 90,987 11,85522 (10FY) 96,335 120,120 86,417 11,855
平成23年 1~3月 (Q1) 96,335 120,120 86,417 11,8554~6 (Q2) 95,935 126,120 86,537 11,8557~9 (Q3) 95,935 126,120 86,537 11,855
10~12 (Q4) 95,935 126,120 86,937 11,855
平成23年 1月 (Jan) 96,335 120,120 86,367 11,8552 (Feb) 96,335 120,120 86,367 11,8553 (Mar) 96,335 120,120 86,417 11,8554 (Apr) 95,935 126,120 86,537 11,8555 (May) 95,935 126,120 86,537 11,8556 (Jun) 95,935 126,120 86,537 11,855
7 (Jul) 95,935 126,120 86,537 11,8558 (Aug) 95,935 126,120 86,537 11,8559 (Sep) 95,935 126,120 86,537 11,855
10 (Oct) 95,935 126,120 86,737 11,85511 (Nov) 95,935 126,120 86,737 11,85512 (Dec) 95,935 126,120 86,937 11,855
年 月Year and Month
伸 銅 製 品Elongated copper
products
板、円板、条Plates and
sheets,circles, strips
管、棒・線、形材Tubes, rods and
bars/wires,shapes and
profiles
アルミニウムはく
Aluminum foils
160

時系列表 (非鉄金属編) 生産能力
(4) 非鉄金属製品(電線・ケーブル) Non-ferrous metal products (Electric wires/cables) (5) 光ファイバ製品 Optical fiber products
Telecommunication cables
(kmコア/月)(km core/month)
平成19年末 (2007) 70,097 85,316 13,133 1,590,71120 (2008) 70,067 85,200 13,133 1,588,48221 (2009) 70,053 84,664 13,133 1,605,23122 (2010) 69,893 85,216 13,983 1,636,23123 (2011) 70,573 83,890 14,183 1,635,782
平成21年度末 (09FY) 70,143 86,089 13,383 1,656,23122 (10FY) 70,673 85,025 14,883 1,635,782
平成23年 1~3月 (Q1) 70,673 85,025 14,883 1,635,7824~6 (Q2) 70,573 84,195 14,883 1,635,7827~9 (Q3) 70,573 84,190 14,883 1,635,782
10~12 (Q4) 70,573 83,890 14,183 1,635,782
平成23年 1月 (Jan) 70,673 85,025 14,883 1,635,7822 (Feb) 70,673 85,025 14,883 1,635,7823 (Mar) 70,673 85,025 14,883 1,635,7824 (Apr) 70,573 84,675 14,883 1,635,7825 (May) 70,573 84,595 14,883 1,635,7826 (Jun) 70,573 84,195 14,883 1,635,782
7 (Jul) 70,573 84,195 14,883 1,635,7828 (Aug) 70,573 84,190 14,883 1,635,7829 (Sep) 70,573 84,190 14,883 1,635,782
10 (Oct) 70,573 84,190 14,883 1,635,78211 (Nov) 70,573 83,890 14,883 1,635,78212 (Dec) 70,573 83,890 14,183 1,635,782
(6) 軽金属板製品 Light metal plate products
Copper insulated wires(導体t)
(metal core tons)
Aluminum wires(導体t)
(metal core tons)
年 月Year and Month
銅 裸 線 銅絶縁電線 アルミニウム線 通信用ケーブル
Bare copper wires(導体t)
(metal core tons)
161
Can bodies Can lids Aluminum cans for beverages
(t) (t) (t)平成19年末 (2007) 26,011 11,408 37,418
20 (2008) 26,011 11,408 37,41821 (2009) 26,488 10,975 37,46322 (2010) 26,595 10,740 37,33523 (2011) 26,743 10,740 37,483
平成21年度末 (09FY) 26,488 10,975 37,46322 (10FY) 26,743 10,740 37,483
平成23年 1~3月 (Q1) 26,743 10,740 37,4834~6 (Q2) 26,743 10,740 37,4837~9 (Q3) 26,743 10,740 37,483
10~12 (Q4) 26,743 10,740 37,483
平成23年 1月 (Jan) 26,743 10,740 37,4832 (Feb) 26,743 10,740 37,4833 (Mar) 26,743 10,740 37,4834 (Apr) 26,743 10,740 37,4835 (May) 26,743 10,740 37,4836 (Jun) 26,743 10,740 37,483
7 (Jul) 26,743 10,740 37,4838 (Aug) 26,743 10,740 37,4839 (Sep) 26,743 10,740 37,483
10 (Oct) 26,743 10,740 37,48311 (Nov) 26,743 10,740 37,48312 (Dec) 26,743 10,740 37,483
缶体 缶ふた 飲料用アルミニウム缶計
年 月Year and Month
161

時系列表 (非鉄金属編) 労務
4. 労 務 Labor
(1) 非鉄金属 Non-ferrous metals
(単位:人、 Unit: persons)
平成19年 (2007)20 (2008)21 (2009)22 (2010)23 (2011)
平成21年度 (09FY)22 (10FY)
平成23年 1~3月 (Q1)4~6 (Q2)7~9 (Q3)
10~12 (Q4)
平成23年 1月 (Jan)2 (Feb)3 (Mar)4 (Apr)5 (May)6 (Jun)
7 (Jul)8 (Aug)9 (Sep)
10 (Oct)11 (Nov)12 (Dec) 252 1,173 409 668 5,338
253 1,177 403 672 5,335253 1,198 407 674 5,354260 1,201 399 669 5,340260 1,203 403 671 5,344261 1,202 402 674 5,351
262 1,210 403 674 5,363261 1,210 404 688 5,353262 1,215 401 691 5,347253 1,195 402 674 5,260248 1,163 405 667 5,231255 1,162 405 666 5,239
252 1,173 409 668 5,338260 1,201 399 669 5,340262 1,210 403 674 5,363253 1,195 402 674 5,260
253 1,195 402 674 5,260253 1,167 414 560 5,247
252 1,173 409 668 5,338253 1,162 402 670 5,324254 1,154 400 563 5,254228 1,182 341 633 5,365220 1,187 354 622 5,295
Number of personsengaged
at the end of month
Number of personsengaged
at the end of month
Number of personsengaged
at the end of month
Number of personsengaged
at the end of month
Total for the
establishment
年 月Year and Month
金・銀Gold/silver
銅Copper
鉛Lead
亜鉛Zinc 事業所の
月末従事者数月末従事者数 月末従事者数 月末従事者数 月末従事者数
162
(3) 非鉄金属製品(伸銅製品)
(2) アルミニウム Aluminum Non-ferrous metal products (Elongated copper products)
(単位:人、 Unit: persons) (単位:人、 Unit: persons)
Number of persons Number of persons
平成19年 (2007)20 (2008)21 (2009)22 (2010)23 (2011)
平成21年度 (09FY)22 (10FY)
平成23年 1~3月 (Q1)4~6 (Q2)7~9 (Q3)
10~12 (Q4)
平成23年 1月 (Jan)2 (Feb)3 (Mar)4 (Apr)5 (May)6 (Jun)
7 (Jul)8 (Aug)9 (Sep)
10 (Oct)11 (Nov)12 (Dec) 3,176 5,610 7,552 18,412
3,181 5,616 7,596 18,4443,183 5,637 7,610 18,4183,200 5,666 7,613 18,4573,206 5,649 7,643 18,2903,228 5,663 7,654 18,523
3,213 5,668 7,663 18,6983,222 5,679 7,635 18,4763,238 5,703 7,632 18,3633,225 5,685 7,652 18,1443,183 5,609 7,721 18,1743,185 5,608 7,731 18,255
3,176 5,610 7,552 18,4123,200 5,666 7,613 18,4573,213 5,668 7,663 18,6983,225 5,685 7,652 18,144
3,225 5,685 7,652 18,1443,228 5,894 7,727 18,139
3,176 5,610 7,552 18,4123,217 5,686 7,739 18,3633,167 5,816 7,781 18,2023,336 6,311 8,300 18,8152,967 6,058 8,297 18,875
at end of month at end of monthengaged establishment engaged establishment
Total for the Total for the月末従事者数 月末従事者数年 月
Year and Month
月末従事者数 事業所の 月末従事者数 事業所の
162

時系列表 (非鉄金属編) 労務
(単位:人、 Unit: persons) (単位:人、 Unit: persons)
平成19年 (2007)20 (2008)21 (2009)22 (2010)23 (2011)
平成21年度 (09FY)22 (10FY)
平成23年 1~3月 (Q1)4~6 (Q2)7~9 (Q3)
10~12 (Q4)
平成23年 1月 (Jan)2 (Feb)3 (Mar)4 (Apr)5 (May)6 (Jun)
7 (Jul)8 (Aug)9 (Sep)
10 (Oct)11 (Nov)12 (Dec)
Non-ferrous metal products (Electric wires/cables)、and Optical fiber products
(5) 非鉄金属製品 (電線・ケーブル)、光ファイバ製品
(4) 非鉄金属製品 (アルミニウム圧延製品)
Non-ferrous metal products (Aluminum mill products)
13,218 28,339 17,677 3,108 32,98528,305 17,771 3,100 33,04213,262
13,324 28,332 17,861 3,070 33,13128,255 17,780 3,072 33,35913,334
13,377 28,329 17,802 3,067 33,40828,339 17,865 3,037 33,50313,364
13,358 28,328 17,816 3,135 33,57428,312 17,964 3,094 33,65913,283
13,285 28,319 17,855 3,124 33,89728,034 17,765 3,016 33,49213,129
13,003 27,940 17,752 3,016 33,34127,958 17,765 3,019 33,34213,016
13,218 28,339 17,677 3,108 32,98528,255 17,780 3,072 33,35913,334
13,358 28,328 17,816 3,135 33,57428,034 17,765 3,016 33,49213,129
13,129 28,034 17,765 3,016 33,49228,367 18,391 2,916 33,92613,161
13,218 28,339 17,677 3,108 32,98527,940 17,739 3,044 33,421
19,262 2,225 34,04812,975
2,266 35,13613,356 28,752
34,48514,070 30,187 19,48213,777 30,076 19,334 2,263
Number of personsengaged
at the end of month
Total for the Number of personsengaged
at the end of month
Number of personsengaged
at the end of month
Total for theestablishment establishment
年 月Year and Month
光ファイバ部門Optical fiber sections月末従事者数 事業所の
月末従事者数月末従事者数月末従事者数
事業所の月末従事者数
電線・ケーブル部門Electric wires/cables
sections
163
(7) 軽金属板製品
Light metal plate products
(単位:人、 Unit: persons) (単位:人、 Unit: persons)
Number of persons Number of persons
平成19年 (2007)20 (2008)21 (2009)22 (2010)23 (2011)
平成21年度 (09FY)22 (10FY)
平成23年 1~3月 (Q1)4~6 (Q2)7~9 (Q3)
10~12 (Q4)
平成23年 1月 (Jan)2 (Feb)3 (Mar)4 (Apr)5 (May)6 (Jun)
7 (Jul)8 (Aug)9 (Sep)
10 (Oct)11 (Nov)12 (Dec) 5,181 9,773
9,760
5,073 9,6705,082 9,7195,105
9,990 28,96310,311 29,86910,384 29,307
5,040 9,70610,439 29,604
5,044 9,71710,453 31,072
5,023 9,698
10,457 31,064
5,013 10,26510,432 31,018
5,023 9,75910,388 29,779
5,022 9,78110,398 30,668
5,013 9,75010,579 32,662
5,024 9,75710,777 34,694
5,181 9,773
10,819 33,941
5,105 9,7609,990 28,963
5,023 9,69810,439 29,604
5,022 9,78110,432 31,018
5,022 9,781
10,579 32,662
4,636 9,25310,579 32,662
5,181 9,773
10,841 38,955
4,619 9,3539,990 28,963
4,362 9,09311,013 34,978
4,555 9,15510,745 38,066
4,518 9,19611,551 41,86311,843 41,538
at end of month at end of monthengaged establishment engaged establishment
月末従事者数Total for the Total for the
月末従事者数 事業所の
月末従事者数
(6) 非鉄金属製品(高純度多結晶シリコン、シリコンウエハ、 はんだ、銅合金塊) Non-ferrous metal products (High-purity polycrystal silicon, silicon wafers, solders and copper alloy ingots)
年 月Year and Month
月末従事者数 事業所の
163

時系列表 (金属製品編) 製品
<金属製品編> Fabricated metals
1. 製品 Products (1) 鉄構物及び架線金物 Steel structures and transmission line hardware
鉄構物(1~6) 鉄骨(1)Steel structures Structural steel frames
生産 生産
Production Production
重量(t) 金額(百万円) 重量(t) 金額(百万円) 重量(t)
Weight (million yen) Weight (million yen) Weight平成19年 (2007) 2,198,705 542,245 1,402,761 232,584
20 (2008) 2,366,787 624,846 1,535,658 279,70921 (2009) 1,980,567 588,752 1,222,174 237,53322 (2010) 1,806,926 565,379 1,145,994 205,85523 (2011) 1,576,914 465,405 1,019,843 176,639
平成21年度 (09FY) 1,873,013 575,472 1,148,998 219,78622 (10FY) 1,799,895 552,726 1,156,386 205,342
平成23年 1~3月 (Q1) 451,956 146,917 274,490 49,0494~6 (Q2) 351,515 99,019 232,024 39,3957~9 (Q3) 390,833 112,372 255,691 43,980
10~12 (Q4) 382,610 107,097 257,638 44,215
平成23年 1月 (Jan) 132,362 37,246 90,828 16,3592 (Feb) 146,697 41,537 97,488 16,7783 (Mar) 172,897 68,134 86,174 15,9124 (Apr) 114,078 32,928 76,541 13,2755 (May) 109,490 29,489 73,266 12,5716 (Jun) 127,947 36,602 82,217 13,549
7 (Jul) 128,269 34,739 86,547 14,6798 (Aug) 130,600 38,767 85,016 14,4999 (Sep) 131,964 38,866 84,128 14,802
10 (Oct) 123,345 33,709 83,720 14,01411 (Nov) 134,128 37,598 88,662 15,35612 (Dec) 125,137 35,790 85,256 14,845 15,865 4,060
16,127 4,25315,649 4,16314,982 3,91015,724 3,96815,971 4,067
15,692 4,01414,799 3,77013,564 3,41411,850 3,04212,741 3,34713,470 3,594
47,641 12,47646,677 11,94544,055 11,19838,061 9,983
177,884 44,593176,053 42,369
176,434 45,602178,477 44,383176,291 41,715225,595 50,459
(million yen)233,502 47,983
Production
金額(百万円)
年 月Year and Month
*1 軽量鉄骨(2)Light structural steel frames
生産
164
*3 鉄塔(4) *4 水門(5)Steel towers Water gates
生産 生産 生産Production Production Production
重量(t) 金額(百万円) 重量(t) 金額(百万円) 重量(t) 金額(百万円)
Weight (million yen) Weight (million yen) Weight (million yen)平成19年 (2007) 406,496 188,454 105,283 32,739
20 (2008) 452,074 223,738 97,081 30,70221 (2009) 452,251 245,209 69,808 24,60522 (2010) 375,836 257,405 60,320 21,50023 (2011) 290,194 199,704 39,748 13,844
平成21年度 (09FY) 430,672 250,815 66,388 23,80422 (10FY) 361,560 251,135 55,519 19,766
平成23年 1~3月 (Q1) 105,064 72,389 10,773 4,0884~6 (Q2) 61,211 40,272 8,691 2,9547~9 (Q3) 69,174 47,226 8,445 2,920
10~12 (Q4) 54,745 39,817 11,839 3,882
平成23年 1月 (Jan) 19,675 13,463 3,690 1,2772 (Feb) 30,106 17,676 3,548 1,2973 (Mar) 55,283 41,250 3,535 1,5144 (Apr) 18,367 13,050 3,497 1,2565 (May) 17,474 10,722 2,389 7816 (Jun) 25,370 16,500 2,805 917
7 (Jul) 19,720 13,581 2,940 1,0028 (Aug) 24,331 16,877 2,676 9449 (Sep) 25,123 16,768 2,829 974
10 (Oct) 16,222 12,257 4,249 1,33111 (Nov) 22,192 14,576 3,599 1,28612 (Dec) 16,331 12,984 3,991 1,265
Note*1: Factories/workshops/buildings/warehouses, etc. *2: Highway bridges/aqueduct bridges, etc. *3: Transmission/radio/lighting/advertising, etc. *4: Including water gate winches.
注*1: 軽量形鋼・棒鋼などを加工したもの。 *2: 陸橋・水路橋・海洋橋等。 *3: 送配電用・通信用・照明用・広告用等。 *4: 水門巻上機を含む。
1,712 1,9851,490 1,5431,109 1,2301,145 1,2671,903 2,093
790 848
1,141 1,2401,112 1,4361,512 1,7492,811 4,0171,700 2,1241,541 1,843
4,311 4,7583,838 4,2083,765 4,4256,052 7,984
21,068 25,63625,653 32,354
17,966 21,37526,391 31,13123,507 30,52025,449 31,55623,781 32,576
年 月Year and Month
*2 橋りょう(3)Steel bridges
164

時系列表 (金属製品編) 製品
(1) 鉄構物及び架線金物 Steel structures and transmission line hardware
送変電用(7)For transmission lines and substations
生産
Production
数量(千個) 数量(千個) 金額(百万円)
Quantity(103n) Quantity(10
3n) (million yen)
平成19年 (2007) 22,951 7,64420 (2008) 23,624 8,18421 (2009) 18,729 8,10222 (2010) 22,236 6,40723 (2011) 12,784 5,107
平成21年度 (09FY) 19,913 7,85822 (10FY) 21,318 6,017
平成23年 1~3月 (Q1) 4,143 1,5364~6 (Q2) 4,700 1,3127~9 (Q3) 1,893 1,105
10~12 (Q4) 2,048 1,154
平成23年 1月 (Jan) 1,365 4042 (Feb) 940 4823 (Mar) 1,838 6504 (Apr) 1,312 5225 (May) 1,950 4896 (Jun) 1,438 301
7 (Jul) 830 3488 (Aug) 285 3229 (Sep) 778 435
10 (Oct) 943 46311 (Nov) 686 41012 (Dec) 419 281
12,128 3,630
注*5: ベンディングロールで成型したものに限る。 Notes*5: Only those formed by bending rollers.
1,982 651
14,618 4,1782,058 584 14,768 4,4212,396 714
13,302 3,8133,757 1,145 13,688 3,948
950 3862,301 562 13,780 3,942
14,997 4,038722 382 15,920 4,054450 209
17,347 4,890597 184 15,306 4,070
13,244 2,399
18,014 4,2141,114 315 17,264 4,2153,158 710
41,514 12,2296,436 1,949
46,223 12,1627,008 2,093 40,770 11,7031,769 775
17,516 3,424 52,625 13,319
204,733 53,20727,478 6,254 202,346 51,66925,249 6,344
181,132 49,41332,729 8,241
204,609 53,64019,908 5,105 201,448 51,36036,536 9,170
270,563 56,34330,930 8,682 248,652 56,416
Weight (million yen) (million yen)26,882 7,909
生産
Production Production
重量(t) 金額(百万円) 金額(百万円)
年 月Year and Month
*5 鋼管(6) 架線金物(7~9)Steel pipes Transmission line hardware
生産
165
配電用(8)For distribution lines
生産Production
数量(千個) 金額(百万円) 数量(千個)
Quantity(103n) (million yen) Quantity(10
3n)
平成19年 (2007)20 (2008)21 (2009)22 (2010)23 (2011)
平成21年度 (09FY)22 (10FY)
平成23年 1~3月 (Q1)4~6 (Q2)7~9 (Q3)
10~12 (Q4)
平成23年 1月 (Jan)2 (Feb)3 (Mar)4 (Apr)5 (May)6 (Jun)
7 (Jul)8 (Aug)9 (Sep)
10 (Oct)11 (Nov)12 (Dec) 5,303 2,038 6,406 1,311
6,550 2,280 7,532 1,7316,787 2,203 6,888 1,5126,437 2,148 6,473 1,3656,712 2,010 6,305 1,4816,212 2,079 6,738 1,515
6,961 2,230 7,521 1,5236,556 2,165 6,491 1,3846,325 2,226 7,669 1,3227,083 2,461 8,426 1,7797,840 2,464 8,484 1,2698,196 2,507 8,453 1,303
18,640 6,521 20,826 4,55419,361 6,237 19,516 4,36119,842 6,621 21,681 4,22923,119 7,432 25,363 4,351
93,139 29,349 87,889 16,30390,549 27,432 94,271 17,917
80,962 26,811 87,386 17,49592,528 29,003 86,684 15,95090,300 27,294 95,580 18,244
109,962 29,077 115,066 19,155
金額(百万円)
(million yen)123,381 30,668 124,231 18,031
年 月Year and Month
通信線路用・電車線用(9)For communications/electric railways
生産Production
165
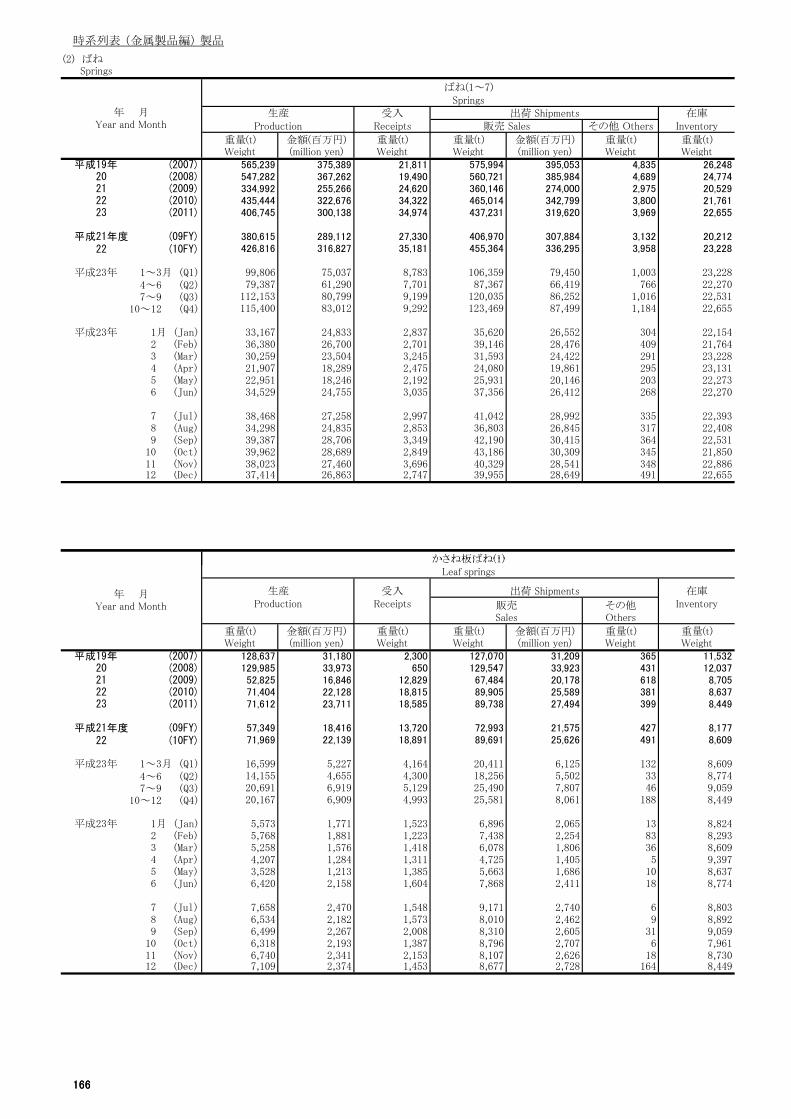
時系列表 (金属製品編) 製品
(2) ばね Springs
ばね(1~7)Springs
生産 受入 出荷 Shipments 在庫Production Receipts 販売 Sales その他 Others Inventory
重量(t) 金額(百万円) 重量(t) 重量(t) 金額(百万円) 重量(t) 重量(t)Weight (million yen) Weight Weight (million yen) Weight Weight
平成19年 (2007) 565,239 375,389 21,811 575,994 395,053 4,835 26,24820 (2008) 547,282 367,262 19,490 560,721 385,984 4,689 24,77421 (2009) 334,992 255,266 24,620 360,146 274,000 2,975 20,52922 (2010) 435,444 322,676 34,322 465,014 342,799 3,800 21,76123 (2011) 406,745 300,138 34,974 437,231 319,620 3,969 22,655
平成21年度 (09FY) 380,615 289,112 27,330 406,970 307,884 3,132 20,21222 (10FY) 426,816 316,827 35,181 455,364 336,295 3,958 23,228
平成23年 1~3月 (Q1) 99,806 75,037 8,783 106,359 79,450 1,003 23,2284~6 (Q2) 79,387 61,290 7,701 87,367 66,419 766 22,2707~9 (Q3) 112,153 80,799 9,199 120,035 86,252 1,016 22,531
10~12 (Q4) 115,400 83,012 9,292 123,469 87,499 1,184 22,655
平成23年 1月 (Jan) 33,167 24,833 2,837 35,620 26,552 304 22,1542 (Feb) 36,380 26,700 2,701 39,146 28,476 409 21,7643 (Mar) 30,259 23,504 3,245 31,593 24,422 291 23,2284 (Apr) 21,907 18,289 2,475 24,080 19,861 295 23,1315 (May) 22,951 18,246 2,192 25,931 20,146 203 22,2736 (Jun) 34,529 24,755 3,035 37,356 26,412 268 22,270
7 (Jul) 38,468 27,258 2,997 41,042 28,992 335 22,3938 (Aug) 34,298 24,835 2,853 36,803 26,845 317 22,4089 (Sep) 39,387 28,706 3,349 42,190 30,415 364 22,531
10 (Oct) 39,962 28,689 2,849 43,186 30,309 345 21,85011 (Nov) 38,023 27,460 3,696 40,329 28,541 348 22,88612 (Dec) 37,414 26,863 2,747 39,955 28,649 491 22,655
かさね板ばね(1)
年 月Year and Month
166
かさね板ばね(1)Leaf springs
生産 受入 出荷 Shipments 在庫Production Receipts 販売
Salesその他Others
Inventory
重量(t) 金額(百万円) 重量(t) 重量(t) 金額(百万円) 重量(t) 重量(t)Weight (million yen) Weight Weight (million yen) Weight Weight
平成19年 (2007) 128,637 31,180 2,300 127,070 31,209 365 11,53220 (2008) 129,985 33,973 650 129,547 33,923 431 12,03721 (2009) 52,825 16,846 12,829 67,484 20,178 618 8,70522 (2010) 71,404 22,128 18,815 89,905 25,589 381 8,63723 (2011) 71,612 23,711 18,585 89,738 27,494 399 8,449
平成21年度 (09FY) 57,349 18,416 13,720 72,993 21,575 427 8,17722 (10FY) 71,969 22,139 18,891 89,691 25,626 491 8,609
平成23年 1~3月 (Q1) 16,599 5,227 4,164 20,411 6,125 132 8,6094~6 (Q2) 14,155 4,655 4,300 18,256 5,502 33 8,7747~9 (Q3) 20,691 6,919 5,129 25,490 7,807 46 9,059
10~12 (Q4) 20,167 6,909 4,993 25,581 8,061 188 8,449
平成23年 1月 (Jan) 5,573 1,771 1,523 6,896 2,065 13 8,8242 (Feb) 5,768 1,881 1,223 7,438 2,254 83 8,2933 (Mar) 5,258 1,576 1,418 6,078 1,806 36 8,6094 (Apr) 4,207 1,284 1,311 4,725 1,405 5 9,3975 (May) 3,528 1,213 1,385 5,663 1,686 10 8,6376 (Jun) 6,420 2,158 1,604 7,868 2,411 18 8,774
7 (Jul) 7,658 2,470 1,548 9,171 2,740 6 8,8038 (Aug) 6,534 2,182 1,573 8,010 2,462 9 8,8929 (Sep) 6,499 2,267 2,008 8,310 2,605 31 9,059
10 (Oct) 6,318 2,193 1,387 8,796 2,707 6 7,96111 (Nov) 6,740 2,341 2,153 8,107 2,626 18 8,73012 (Dec) 7,109 2,374 1,453 8,677 2,728 164 8,449
年 月Year and Month
166

時系列表 (金属製品編) 製品
(2) ばね Springs
つるまきばね(2)Coil springs
生産 受入 出荷 Shipments 在庫Production Receipts 販売 Sales その他 Others Inventory
重量(t) 金額(百万円) 重量(t) 重量(t) 金額(百万円) 重量(t) 重量(t)Weight (million yen) Weight Weight (million yen) Weight Weight
平成19年 (2007) 129,092 29,313 1,004 128,443 28,926 1,182 3,68820 (2008) 127,560 31,501 869 127,535 31,535 1,242 3,33221 (2009) 78,331 20,776 581 78,449 21,085 740 2,87422 (2010) 103,541 26,378 952 102,882 26,675 1,346 3,19023 (2011) 96,228 25,636 922 95,421 25,633 1,466 3,426
平成21年度 (09FY) 88,882 22,955 764 88,635 23,387 866 2,96322 (10FY) 101,026 25,889 951 100,049 25,853 1,440 3,425
平成23年 1~3月 (Q1) 23,363 6,088 223 22,957 6,042 387 3,4254~6 (Q2) 18,047 5,017 211 18,296 5,122 350 3,0317~9 (Q3) 26,884 7,144 264 26,658 7,116 344 3,170
10~12 (Q4) 27,934 7,387 223 27,509 7,353 385 3,426
平成23年 1月 (Jan) 8,008 2,112 82 7,907 2,098 131 3,2392 (Feb) 8,641 2,259 73 8,646 2,285 163 3,1433 (Mar) 6,714 1,717 68 6,404 1,659 93 3,4254 (Apr) 4,118 1,191 84 4,080 1,190 156 3,3895 (May) 5,718 1,671 68 5,772 1,685 102 3,2996 (Jun) 8,211 2,155 60 8,445 2,246 92 3,031
7 (Jul) 9,208 2,435 89 8,999 2,400 121 3,2068 (Aug) 8,044 2,184 73 8,040 2,180 113 3,1699 (Sep) 9,631 2,525 102 9,620 2,536 111 3,170
10 (Oct) 10,017 2,611 79 9,747 2,578 126 3,39011 (Nov) 9,078 2,397 82 8,932 2,380 127 3,48812 (Dec) 8,840 2,378 62 8,830 2,395 132 3,426
ねじり棒ばね(3)
年 月Year and Month
167
ねじり棒ばね(3)Torsion bar springs
生産 受入 出荷 Shipments 在庫Production Receipts 販売
Salesその他Others
Inventory
重量(t) 金額(百万円) 重量(t) 重量(t) 金額(百万円) 重量(t) 重量(t)Weight (million yen) Weight Weight (million yen) Weight Weight
平成19年 (2007) 89,583 28,568 6 88,483 28,888 167 4,12120 (2008) 81,364 27,944 13 82,241 28,078 148 3,10921 (2009) 52,104 19,307 15 51,156 19,515 81 3,98722 (2010) 66,726 24,737 20 66,227 25,235 92 4,41423 (2011) 61,383 23,308 70 61,023 23,563 117 4,741
平成21年度 (09FY) 60,158 22,300 20 59,643 22,522 92 3,77222 (10FY) 64,025 23,669 33 62,966 24,037 90 4,781
平成23年 1~3月 (Q1) 14,468 5,388 22 14,107 5,380 24 4,7814~6 (Q2) 11,014 4,354 16 11,013 4,399 16 4,7847~9 (Q3) 17,520 6,584 10 17,751 6,784 48 4,517
10~12 (Q4) 18,381 6,982 23 18,153 7,000 30 4,741
平成23年 1月 (Jan) 4,907 1,866 9 4,925 1,908 7 4,4052 (Feb) 5,594 2,096 9 5,685 2,167 - 4,3223 (Mar) 3,967 1,426 4 3,497 1,305 16 4,7814 (Apr) 2,275 911 9 2,595 1,022 1 4,4685 (May) 3,296 1,346 3 3,154 1,311 6 4,6076 (Jun) 5,444 2,097 4 5,263 2,067 9 4,784
7 (Jul) 5,914 2,227 5 6,049 2,332 15 4,6398 (Aug) 5,419 2,037 4 5,391 2,055 9 4,6629 (Sep) 6,187 2,321 2 6,311 2,397 23 4,517
10 (Oct) 6,762 2,520 9 6,589 2,503 10 4,68911 (Nov) 5,874 2,198 3 5,809 2,201 12 4,74512 (Dec) 5,745 2,263 11 5,754 2,297 8 4,741
年 月Year and Month
167

時系列表 (金属製品編) 製品
(2) ばね Springs
線ばね(4~5)Wire springs
生産 受入 出荷 Shipments 在庫Production Receipts 販売 Sales その他 Others Inventory
重量(t) 金額(百万円) 重量(t) 重量(t) 金額(百万円) 重量(t) 重量(t)Weight (million yen) Weight Weight (million yen) Weight Weight
平成19年 (2007) 107,705 120,922 5,713 111,922 130,499 1,387 3,04720 (2008) 103,200 120,749 5,173 107,031 130,380 1,271 3,09521 (2009) 75,891 86,325 4,278 80,190 94,223 226 2,72522 (2010) 96,601 109,134 4,619 100,976 117,678 273 3,02123 (2011) 86,668 99,584 4,763 91,419 108,689 277 3,267
平成21年度 (09FY) 86,858 97,495 4,790 91,171 105,688 187 2,91122 (10FY) 93,276 105,944 4,732 97,840 114,448 274 3,370
平成23年 1~3月 (Q1) 21,684 24,568 1,428 23,028 26,754 69 3,3704~6 (Q2) 17,521 20,513 1,021 18,779 22,875 69 3,1297~9 (Q3) 23,213 26,579 1,149 24,312 28,908 69 3,160
10~12 (Q4) 24,251 27,924 1,166 25,301 30,152 69 3,267
平成23年 1月 (Jan) 7,081 8,138 381 7,587 8,884 23 3,1132 (Feb) 8,000 8,862 433 8,401 9,682 23 3,1673 (Mar) 6,603 7,568 614 7,039 8,189 23 3,3704 (Apr) 5,253 6,362 334 5,707 7,085 23 3,2545 (May) 5,107 6,123 239 5,534 6,968 23 3,0646 (Jun) 7,162 8,027 448 7,538 8,822 23 3,129
7 (Jul) 7,678 8,692 398 8,054 9,513 23 3,1498 (Aug) 7,014 8,104 348 7,415 8,940 23 3,0949 (Sep) 8,520 9,784 402 8,842 10,454 23 3,160
10 (Oct) 8,367 9,535 354 8,663 10,264 23 3,21611 (Nov) 8,122 9,212 445 8,473 9,833 23 3,28912 (Dec) 7,762 9,176 366 8,165 10,055 23 3,267
自動車用(4)
年 月Year and Month
168
自動車用(4)Wire springs for automobiles
生産 受入 出荷 Shipments 在庫Production Receipts 販売
Salesその他Others
Inventory
重量(t) 金額(百万円) 重量(t) 重量(t) 金額(百万円) 重量(t) 重量(t)Weight (million yen) Weight Weight (million yen) Weight Weight
平成19年 (2007) 60,721 64,112 2,768 61,991 67,685 1,354 2,42220 (2008) 59,162 63,356 2,506 60,434 67,354 1,239 2,38821 (2009) 42,163 43,941 2,009 44,186 47,272 217 2,14722 (2010) 56,228 57,897 2,402 58,321 61,786 265 2,49623 (2011) 52,573 54,969 2,521 54,924 59,478 268 2,658
平成21年度 (09FY) 48,897 50,277 2,294 50,758 53,567 178 2,35822 (10FY) 55,356 57,120 2,388 57,484 61,177 265 2,737
平成23年 1~3月 (Q1) 13,303 13,614 632 13,837 14,694 67 2,7374~6 (Q2) 10,317 10,893 536 11,035 12,196 67 2,5137~9 (Q3) 13,969 14,447 696 14,581 15,590 67 2,540
10~12 (Q4) 14,984 16,015 658 15,471 16,998 67 2,658
平成23年 1月 (Jan) 4,265 4,397 184 4,545 4,868 22 2,5212 (Feb) 4,775 4,815 212 4,958 5,251 22 2,5623 (Mar) 4,262 4,402 236 4,335 4,575 22 2,7374 (Apr) 3,159 3,493 160 3,416 3,875 22 2,6325 (May) 2,874 3,010 145 3,180 3,535 22 2,4566 (Jun) 4,284 4,390 231 4,440 4,785 22 2,513
7 (Jul) 4,624 4,735 199 4,800 5,170 22 2,5178 (Aug) 4,240 4,397 208 4,478 4,840 22 2,4749 (Sep) 5,105 5,315 288 5,303 5,580 22 2,540
10 (Oct) 5,197 5,527 230 5,357 5,854 22 2,59711 (Nov) 4,983 5,365 209 5,111 5,581 22 2,65112 (Dec) 4,803 5,123 219 5,003 5,563 22 2,658
注 : シート用ばねを除く。Note: Excluding seat springs
年 月Year and Month
168
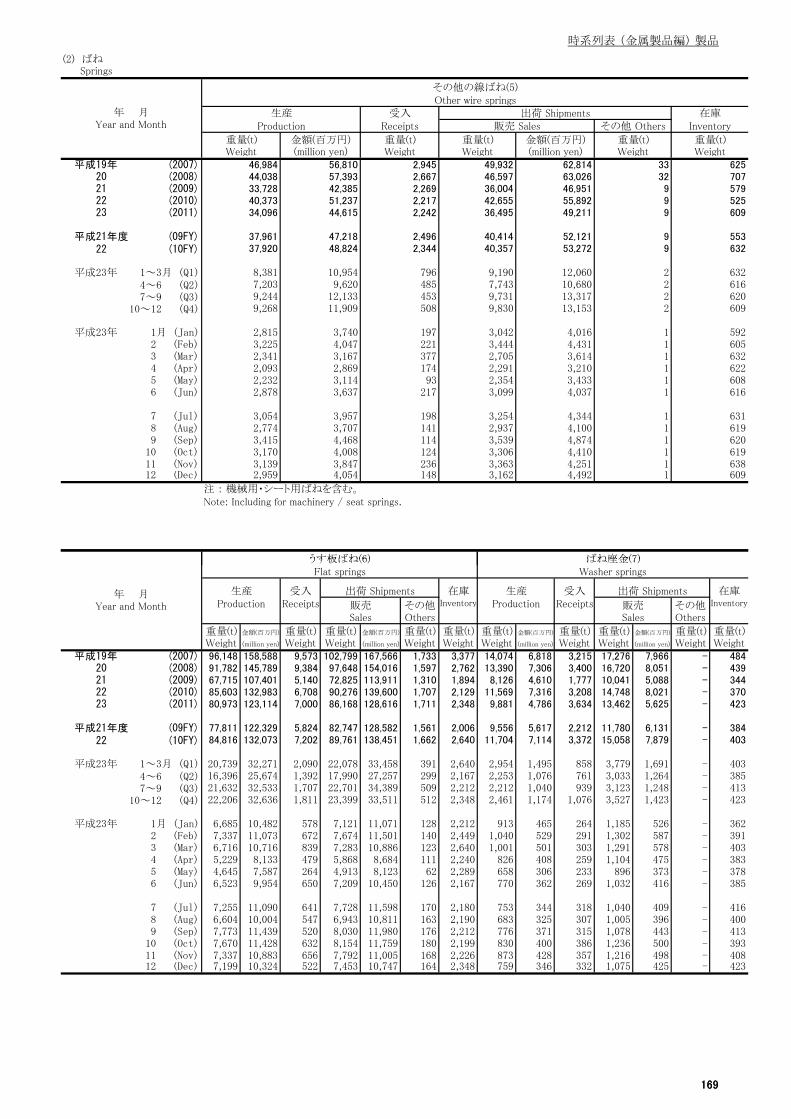
時系列表 (金属製品編) 製品
(2) ばね Springs
その他の線ばね(5)Other wire springs
生産 受入 出荷 Shipments 在庫Production 販売 Sales その他 Others Inventory
重量(t) 金額(百万円) 重量(t) 重量(t) 金額(百万円) 重量(t) 重量(t)Weight (million yen) Weight Weight (million yen) Weight Weight
平成19年 (2007)20 (2008)21 (2009)22 (2010)23 (2011)
平成21年度 (09FY)22 (10FY)
平成23年 1~3月 (Q1)4~6 (Q2)7~9 (Q3)
10~12 (Q4)
平成23年 1月 (Jan)2 (Feb)3 (Mar)4 (Apr)5 (May)6 (Jun)
7 (Jul)8 (Aug)9 (Sep)
10 (Oct)11 (Nov)12 (Dec)
注 : 機械用・シート用ばねを含む。Note: Including for machinery / seat springs.
うす板ばね(6) ばね座金(7)
625
3,162 4,492 1 6093,363 4,251 1 6383,306 4,410 1 6193,539 4,874 1 620
3,254 4,344 1 6312,937 4,100 1 619
3,099 4,037 1 616
2,291 3,210 1 6222,354 3,433 1 608
3,444 4,431 1 6052,705 3,614 1 632
3,042 4,016 1 592
13,317 2 6209,830 13,153 2 609
12,060 2 6327,743 10,680 2 616
40,414 52,121 9 553632
52536,495 49,211 9 609
70736,004 46,951 9 579
63,026 32
236
141114
37717493
217
198
62,814 33
124
55,892 9
53,272 9
221
148
49,93246,597
42,655
40,357
9,190
9,731453
2,496
508
197
2,344
796485
4,4684,0083,8474,054
2,9452,6672,2692,2172,242
2,8693,1143,637
3,9573,707
12,13311,909
3,7404,0473,167
47,21848,824
10,9549,620
2,7743,4153,1703,1392,959
56,81057,39342,38551,23744,615
2,3412,0932,2322,878
3,054
7,2039,2449,268
2,8153,225
34,096
37,96137,920
8,381
33,72840,373
Receipts
46,98444,038
年 月Year and Month
169
うす板ばね(6) ばね座金(7)Flat springs Washer springs
生産 受入 出荷 Shipments 在庫 生産 受入 出荷 Shipments 在庫Production Receipts 販売
Salesその他Others
Inventory Production Receipts 販売Sales
その他Others
Inventory
重量(t) 金額(百万円) 重量(t) 重量(t) 金額(百万円) 重量(t) 重量(t) 重量(t) 金額(百万円) 重量(t) 重量(t) 金額(百万円) 重量(t) 重量(t)Weight (million yen) Weight Weight (million yen) Weight Weight Weight (million yen) Weight Weight (million yen) Weight Weight
平成19年 (2007) 96,148 158,588 9,573 102,799 167,566 1,733 3,377 14,074 6,818 3,215 17,276 7,966 - 48420 (2008) 91,782 145,789 9,384 97,648 154,016 1,597 2,762 13,390 7,306 3,400 16,720 8,051 - 43921 (2009) 67,715 107,401 5,140 72,825 113,911 1,310 1,894 8,126 4,610 1,777 10,041 5,088 - 34422 (2010) 85,603 132,983 6,708 90,276 139,600 1,707 2,129 11,569 7,316 3,208 14,748 8,021 - 37023 (2011) 80,973 123,114 7,000 86,168 128,616 1,711 2,348 9,881 4,786 3,634 13,462 5,625 - 423
平成21年度 (09FY) 77,811 122,329 5,824 82,747 128,582 1,561 2,006 9,556 5,617 2,212 11,780 6,131 - 38422 (10FY) 84,816 132,073 7,202 89,761 138,451 1,662 2,640 11,704 7,114 3,372 15,058 7,879 - 403
平成23年 1~3月 (Q1) 20,739 32,271 2,090 22,078 33,458 391 2,640 2,954 1,495 858 3,779 1,691 - 4034~6 (Q2) 16,396 25,674 1,392 17,990 27,257 299 2,167 2,253 1,076 761 3,033 1,264 - 3857~9 (Q3) 21,632 32,533 1,707 22,701 34,389 509 2,212 2,212 1,040 939 3,123 1,248 - 413
10~12 (Q4) 22,206 32,636 1,811 23,399 33,511 512 2,348 2,461 1,174 1,076 3,527 1,423 - 423
平成23年 1月 (Jan) 6,685 10,482 578 7,121 11,071 128 2,212 913 465 264 1,185 526 - 3622 (Feb) 7,337 11,073 672 7,674 11,501 140 2,449 1,040 529 291 1,302 587 - 3913 (Mar) 6,716 10,716 839 7,283 10,886 123 2,640 1,001 501 303 1,291 578 - 4034 (Apr) 5,229 8,133 479 5,868 8,684 111 2,240 826 408 259 1,104 475 - 3835 (May) 4,645 7,587 264 4,913 8,123 62 2,289 658 306 233 896 373 - 3786 (Jun) 6,523 9,954 650 7,209 10,450 126 2,167 770 362 269 1,032 416 - 385
7 (Jul) 7,255 11,090 641 7,728 11,598 170 2,180 753 344 318 1,040 409 - 4168 (Aug) 6,604 10,004 547 6,943 10,811 163 2,190 683 325 307 1,005 396 - 4009 (Sep) 7,773 11,439 520 8,030 11,980 176 2,212 776 371 315 1,078 443 - 413
10 (Oct) 7,670 11,428 632 8,154 11,759 180 2,199 830 400 386 1,236 500 - 39311 (Nov) 7,337 10,883 656 7,792 11,005 168 2,226 873 428 357 1,216 498 - 40812 (Dec) 7,199 10,324 522 7,453 10,747 164 2,348 759 346 332 1,075 425 - 423
年 月Year and Month
169

時系列表 (金属製品編) 製品
(3)弁及び管継手 Valves and pipe fittings
バルブ及びコック(1~11) 一般用バルブ及びコック(1~4)Valves and cocks General valves and cocks
生産 生産Production Production
数量(千個) 重量(t) 金額(百万円) 数量(千個) 重量(t) 金額(百万円)
Quantity (103n) Weight (million yen) Quantity (103n) Weight (million yen)
平成19年 (2007) 115,067 182,375 458,257 26,145 89,406 190,99420 (2008) 104,062 172,159 432,028 24,509 86,269 172,46721 (2009) 87,963 148,547 370,569 19,198 78,135 149,45022 (2010) 97,306 152,720 392,193 21,889 74,970 160,76723 (2011) 104,091 160,846 397,466 23,538 76,497 162,645
平成21年度 (09FY) 90,820 147,583 372,819 19,690 76,273 150,44722 (10FY) 100,325 155,885 393,205 22,795 74,871 160,072
平成23年 1~3月 (Q1) 26,651 40,864 100,829 6,136 19,555 41,3204~6 (Q2) 27,458 39,761 100,436 6,281 17,888 40,9847~9 (Q3) 25,227 39,325 96,889 5,492 18,880 39,979
10~12 (Q4) 24,754 40,896 99,311 5,630 20,172 40,363
平成23年 1月 (Jan) 8,541 12,909 32,252 1,921 6,213 13,1072 (Feb) 9,029 14,056 33,760 1,995 6,663 13,8323 (Mar) 9,081 13,899 34,817 2,220 6,680 14,3814 (Apr) 8,899 12,828 32,836 2,147 5,876 13,4975 (May) 8,984 13,230 32,470 1,956 5,858 13,0676 (Jun) 9,575 13,703 35,130 2,178 6,154 14,420
7 (Jul) 8,779 12,781 33,021 1,986 6,057 13,6718 (Aug) 8,140 12,850 31,638 1,782 6,137 13,0569 (Sep) 8,308 13,694 32,230 1,724 6,687 13,252
10 (Oct) 8,138 13,481 32,178 1,824 6,776 13,06711 (Nov) 8,511 13,913 33,622 1,933 6,653 13,59512 (Dec) 8,105 13,502 33,511 1,872 6,743 13,702
テンレ 鋼製(1) 鋳鋼 鍛鋼製(2)
年 月Year and Month
170
* ステンレス鋼製(1) * 鋳鋼・鍛鋼製(2)Made of stainless steel Made of cast steel/forged steel
生産 生産Production Production
数量(千個) 重量(t) 金額(百万円) 数量(千個) 重量(t) 金額(百万円)
Quantity (103n) Weight (million yen) Quantity (103n) Weight (million yen)
平成19年 (2007) 4,756 10,044 78,572 639 10,352 20,76920 (2008) 4,034 9,046 61,521 651 10,202 21,26521 (2009) 2,601 6,508 45,963 423 9,008 21,17922 (2010) 5,030 6,415 61,988 393 6,815 16,91323 (2011) 4,576 7,335 59,760 404 7,189 17,566
平成21年度 (09FY) 3,204 6,090 49,080 392 8,165 19,58322 (10FY) 5,071 6,495 60,827 391 6,523 16,164
平成23年 1~3月 (Q1) 1,202 1,650 14,648 89 1,509 3,8244~6 (Q2) 1,304 1,872 16,389 109 1,976 4,6797~9 (Q3) 1,073 1,949 14,660 101 1,873 4,766
10~12 (Q4) 997 1,864 14,063 106 1,830 4,297
平成23年 1月 (Jan) 394 510 4,715 26 494 1,2142 (Feb) 388 562 4,699 30 469 1,2503 (Mar) 420 578 5,233 32 546 1,3604 (Apr) 440 630 5,548 34 588 1,3665 (May) 408 563 4,822 42 752 1,7536 (Jun) 456 679 6,019 33 636 1,560
7 (Jul) 430 632 5,417 33 624 1,5628 (Aug) 327 627 4,630 34 512 1,4819 (Sep) 317 690 4,613 34 738 1,723
10 (Oct) 296 588 4,224 36 598 1,43011 (Nov) 333 615 4,742 37 579 1,42412 (Dec) 368 662 5,097 34 653 1,444
注*: 自動調整弁・高温高圧弁を除く。
Note*: Excluding control valves/high-temperature, high-pressure valves.
年 月Year and Month
170

時系列表 (金属製品編) 製品
(3)弁及び管継手 Valves and pipe fittings
*1 鋳鉄製(3) *1 青銅・黄銅製(4)Made of cast iron Made of bronze/brass
生産 生産Production Production
数量(千個) 重量(t) 金額(百万円) 数量(千個) 重量(t) 金額(百万円)
Quantity (103n) Weight (million yen) Quantity (103n) Weight (million yen)
平成19年 (2007) 4,747 58,220 64,756 16,003 10,790 26,89620 (2008) 4,429 57,005 65,578 15,395 10,017 24,10421 (2009) 3,352 54,241 62,668 12,822 8,378 19,64022 (2010) 3,447 52,858 60,956 13,018 8,882 20,91023 (2011) 3,672 52,770 60,116 14,885 9,203 25,203
平成21年度 (09FY) 3,359 53,629 62,013 12,736 8,388 19,77122 (10FY) 3,533 52,730 60,669 13,800 9,124 22,412
平成23年 1~3月 (Q1) 950 14,007 16,263 3,895 2,389 6,5864~6 (Q2) 903 11,564 13,254 3,966 2,477 6,6617~9 (Q3) 883 12,917 14,775 3,435 2,141 5,778
10~12 (Q4) 937 14,283 15,824 3,589 2,195 6,179
平成23年 1月 (Jan) 308 4,475 5,155 1,193 733 2,0212 (Feb) 302 4,833 5,707 1,275 799 2,1763 (Mar) 340 4,698 5,401 1,428 858 2,3884 (Apr) 326 3,835 4,347 1,347 823 2,2355 (May) 279 3,752 4,391 1,227 791 2,1016 (Jun) 298 3,976 4,517 1,391 863 2,324
7 (Jul) 308 4,061 4,674 1,215 740 2,0188 (Aug) 291 4,261 5,003 1,130 737 1,9419 (Sep) 284 4,594 5,098 1,090 664 1,818
10 (Oct) 307 4,865 5,376 1,185 725 2,03711 (Nov) 319 4,707 5,261 1,245 752 2,16712 (Dec) 311 4,711 5,187 1,159 718 1,974
注*1: 自動調整弁を除く。
Note*1: Excluding control valves.
*2 高温高圧弁(5) 自動調整弁(6 9)
年 月Year and Month
171
*2 高温高圧弁(5) 自動調整弁(6~9)High temperature, high pressure valves Control valves
生産 生産Production Production
数量(千個) 重量(t) 金額(百万円) 数量(千個) 重量(t) 金額(百万円)
Quantity (103n) Weight (million yen) Quantity (103n) Weight (million yen)
平成19年 (2007) 30 1,685 5,908 35,142 59,883 148,72120 (2008) 32 2,344 8,199 33,090 58,118 138,34321 (2009) 24 1,971 7,495 26,321 46,498 107,29122 (2010) 19 1,627 6,262 33,270 52,375 121,12323 (2011) 20 2,021 6,004 35,100 55,589 124,493
平成21年度 (09FY) 20 1,670 6,517 28,852 47,621 108,73522 (10FY) 18 1,704 6,227 34,503 54,321 123,796
平成23年 1~3月 (Q1) 4 419 1,385 9,098 14,158 31,6444~6 (Q2) 5 505 1,444 9,656 14,582 32,5567~9 (Q3) 5 364 1,322 8,642 13,719 30,577
10~12 (Q4) 5 732 1,853 7,704 13,130 29,716
平成23年 1月 (Jan) 1 94 402 2,947 4,473 10,2632 (Feb) 1 120 358 3,158 4,897 10,5403 (Mar) 2 204 625 2,993 4,789 10,8414 (Apr) 2 139 470 3,084 4,702 10,6865 (May) 1 191 576 3,254 4,926 10,6256 (Jun) 2 175 398 3,318 4,954 11,245
7 (Jul) 2 138 450 3,020 4,488 10,3998 (Aug) 2 113 399 2,672 4,491 9,9839 (Sep) 2 113 473 2,950 4,740 10,195
10 (Oct) 1 143 526 2,597 4,374 9,64411 (Nov) 2 357 751 2,668 4,517 9,98212 (Dec) 2 233 576 2,439 4,239 10,090
注*2: 自動調整弁を除き圧力6.5MPa以上で温度350℃以上のものに限る。
年 月Year and Month
171

時系列表 (金属製品編) 製品
(3)弁及び管継手 Valves and pipe fittings
自力式(6~7) 安全弁・スチームトラップ(6)Self-contained control valves Safety valves/steam traps
生産 生産Production Production
数量(千個) 重量(t) 金額(百万円) 数量(千個) 重量(t) 金額(百万円)
Quantity (103n) Weight (million yen) Quantity (103n) Weight (million yen)
平成19年 (2007) 13,038 23,536 44,515 2,455 5,789 19,47820 (2008) 11,937 22,690 45,952 2,476 5,779 20,72621 (2009) 10,183 19,640 38,832 2,098 4,813 17,69922 (2010) 13,374 23,177 39,723 2,304 4,730 16,38023 (2011) 14,547 25,081 41,373 2,468 4,879 16,757
平成21年度 (09FY) 11,405 20,770 38,507 2,143 4,611 16,58822 (10FY) 13,929 24,006 40,387 2,337 4,814 16,543
平成23年 1~3月 (Q1) 3,682 6,281 10,423 614 1,218 4,1624~6 (Q2) 3,976 6,555 10,467 666 1,166 4,0587~9 (Q3) 3,553 6,137 10,127 606 1,175 3,935
10~12 (Q4) 3,336 6,108 10,356 582 1,319 4,602
平成23年 1月 (Jan) 1,228 2,044 3,288 212 366 1,2202 (Feb) 1,282 2,174 3,536 207 410 1,4073 (Mar) 1,172 2,062 3,599 195 442 1,5364 (Apr) 1,190 2,014 3,379 197 380 1,3725 (May) 1,415 2,312 3,546 226 401 1,3246 (Jun) 1,371 2,229 3,542 243 386 1,361
7 (Jul) 1,198 1,935 3,187 230 340 1,1698 (Aug) 1,137 2,057 3,463 192 432 1,4049 (Sep) 1,219 2,145 3,478 183 404 1,363
10 (Oct) 1,090 2,001 3,298 177 426 1,40111 (Nov) 1,182 2,122 3,503 201 436 1,53412 (Dec) 1,064 1,985 3,556 204 457 1,666
その他の自力式(7) 他力式(8 9)
年 月Year and Month
172
その他の自力式(7) 他力式(8~9)Other self-contained control valves Power-drive control valves
生産 生産Production Production
数量(千個) 重量(t) 金額(百万円) 数量(千個) 重量(t) 金額(百万円)
Quantity (103n) Weight (million yen) Quantity (103n) Weight (million yen)
平成19年 (2007) 10,583 17,747 25,036 22,104 36,348 104,20720 (2008) 9,461 16,911 25,226 21,153 35,428 92,39121 (2009) 8,085 14,827 21,133 16,138 26,859 68,46022 (2010) 11,070 18,447 23,343 19,896 29,198 81,40023 (2011) 12,079 20,202 24,617 20,554 30,507 83,120
平成21年度 (09FY) 9,262 16,159 21,919 17,447 26,852 70,22822 (10FY) 11,592 19,193 23,844 20,573 30,315 83,409
平成23年 1~3月 (Q1) 3,068 5,063 6,261 5,416 7,877 21,2214~6 (Q2) 3,309 5,389 6,410 5,680 8,026 22,0897~9 (Q3) 2,948 4,962 6,192 5,089 7,582 20,450
10~12 (Q4) 2,754 4,789 5,755 4,368 7,022 19,360
平成23年 1月 (Jan) 1,016 1,679 2,068 1,719 2,428 6,9752 (Feb) 1,075 1,764 2,129 1,876 2,722 7,0043 (Mar) 977 1,620 2,064 1,821 2,727 7,2424 (Apr) 993 1,634 2,007 1,894 2,688 7,3075 (May) 1,189 1,912 2,221 1,840 2,613 7,0806 (Jun) 1,128 1,843 2,181 1,947 2,725 7,703
7 (Jul) 967 1,595 2,018 1,823 2,554 7,2128 (Aug) 944 1,626 2,059 1,536 2,433 6,5209 (Sep) 1,036 1,741 2,115 1,731 2,595 6,718
10 (Oct) 913 1,574 1,896 1,507 2,373 6,34711 (Nov) 980 1,686 1,968 1,486 2,395 6,48012 (Dec) 860 1,529 1,890 1,375 2,254 6,533
年 月Year and Month
172

時系列表 (金属製品編) 製品
(3)弁及び管継手 Valves and pipe fittings
電磁弁(8) その他の他力式(9)Solenoid operated valves Other power-drive control valves
生産 生産Production Production
数量(千個) 重量(t) 金額(百万円) 数量(千個) 重量(t) 金額(百万円)
Quantity (103n) Weight (million yen) Quantity (103n) Weight (million yen)
平成19年 (2007) 15,016 17,739 46,255 7,087 18,609 57,95120 (2008) 14,781 16,962 37,155 6,372 18,465 55,23721 (2009) 11,061 12,771 25,929 5,077 14,088 42,53122 (2010) 13,912 16,838 38,918 5,984 12,360 42,48223 (2011) 13,555 16,590 38,627 6,999 13,918 44,493
平成21年度 (09FY) 11,936 13,831 29,182 5,510 13,021 41,04622 (10FY) 14,367 17,434 39,968 6,206 12,881 43,441
平成23年 1~3月 (Q1) 3,774 4,390 10,110 1,642 3,488 11,1114~6 (Q2) 3,781 4,527 10,338 1,900 3,500 11,7507~9 (Q3) 3,355 4,104 9,433 1,734 3,478 11,017
10~12 (Q4) 2,645 3,570 8,747 1,723 3,452 10,614
平成23年 1月 (Jan) 1,167 1,391 3,311 552 1,037 3,6642 (Feb) 1,293 1,504 3,398 583 1,219 3,6063 (Mar) 1,313 1,494 3,401 508 1,232 3,8414 (Apr) 1,275 1,526 3,412 619 1,162 3,8945 (May) 1,248 1,485 3,273 592 1,128 3,8076 (Jun) 1,258 1,515 3,653 689 1,210 4,049
7 (Jul) 1,182 1,372 3,342 640 1,182 3,8708 (Aug) 1,035 1,273 3,141 501 1,160 3,3799 (Sep) 1,138 1,459 2,950 592 1,136 3,768
10 (Oct) 941 1,248 2,817 566 1,125 3,53011 (Nov) 882 1,203 2,913 605 1,192 3,56612 (Dec) 822 1,119 3,016 552 1,135 3,518
給排水栓類(10 11) * 給水栓(10)
年 月Year and Month
173
給排水栓類(10~11) * 給水栓(10)Plumbing fixtures Faucets
生産 生産Production Production
数量(千個) 重量(t) 金額(百万円) 数量(千個) 重量(t) 金額(百万円)
Quantity (103n) Weight (million yen) Quantity (103n) Weight (million yen)
平成19年 (2007) 53,750 31,401 112,634 35,074 21,248 92,58120 (2008) 46,431 25,428 113,019 28,519 16,395 94,10321 (2009) 42,420 21,943 106,333 25,874 14,366 89,88022 (2010) 42,128 23,749 104,041 26,217 16,149 87,71623 (2011) 45,433 26,741 104,324 28,483 18,329 86,424
平成21年度 (09FY) 42,259 22,019 107,120 26,001 14,529 90,96522 (10FY) 43,009 24,990 103,111 26,703 17,082 86,320
平成23年 1~3月 (Q1) 11,413 6,732 26,480 7,167 4,668 22,2154~6 (Q2) 11,516 6,786 25,453 7,165 4,699 20,9447~9 (Q3) 11,088 6,362 25,012 6,953 4,349 20,715
10~12 (Q4) 11,415 6,862 27,379 7,197 4,614 22,550
平成23年 1月 (Jan) 3,672 2,129 8,480 2,297 1,472 7,0912 (Feb) 3,875 2,376 9,030 2,438 1,667 7,5243 (Mar) 3,866 2,227 8,969 2,432 1,529 7,5994 (Apr) 3,666 2,111 8,183 2,273 1,411 6,6955 (May) 3,772 2,254 8,202 2,359 1,602 6,8036 (Jun) 4,078 2,420 9,068 2,533 1,686 7,447
7 (Jul) 3,771 2,097 8,501 2,344 1,454 7,0638 (Aug) 3,684 2,109 8,200 2,342 1,463 6,8459 (Sep) 3,633 2,155 8,310 2,267 1,432 6,808
10 (Oct) 3,715 2,189 8,941 2,308 1,454 7,37711 (Nov) 3,908 2,386 9,294 2,500 1,627 7,68312 (Dec) 3,792 2,287 9,144 2,389 1,534 7,491
注*: 便器洗浄弁・ボールタップ・排水用トラップを含む。
Note*: Including flush valves/ball taps/traps.
年 月Year and Month
173
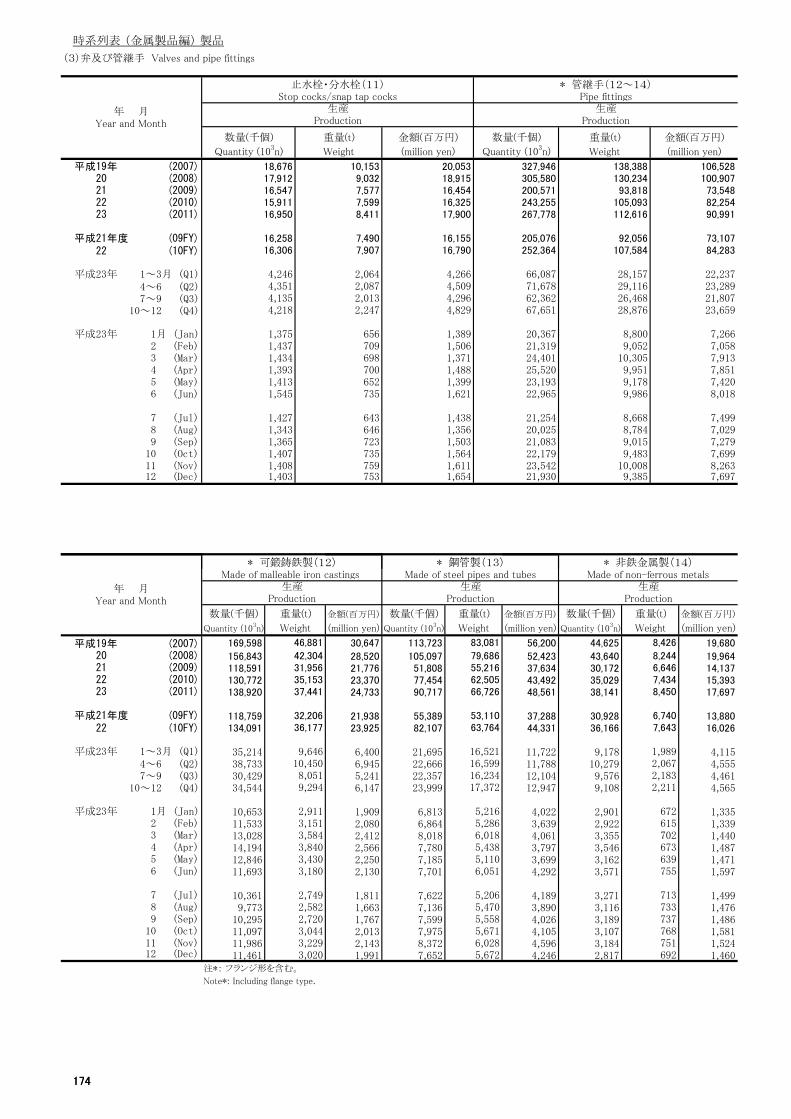
時系列表 (金属製品編) 製品
(3)弁及び管継手 Valves and pipe fittings
* 管継手(12~14)Pipe fittings
生産 生産Production Production
数量(千個) 重量(t) 金額(百万円) 数量(千個) 重量(t) 金額(百万円)
Quantity (103n) Weight (million yen) Quantity (103n) Weight (million yen)
平成19年 (2007)20 (2008)21 (2009)22 (2010)23 (2011)
平成21年度 (09FY)22 (10FY)
平成23年 1~3月 (Q1)4~6 (Q2)7~9 (Q3)
10~12 (Q4)
平成23年 1月 (Jan)2 (Feb)3 (Mar)4 (Apr)5 (May)6 (Jun)
7 (Jul)8 (Aug)9 (Sep)
10 (Oct)11 (Nov)12 (Dec)
可鍛鋳鉄製(12) 鋼管製(13) 非鉄金属製(14)
1,403 753 1,654 21,930 9,385 7,6971,408 759 1,611 23,542 10,008 8,2631,407 735 1,564 22,179 9,483 7,6991,365 723 1,503 21,083 9,015 7,2791,343 646 1,356 20,025 8,784 7,0291,427 643 1,438 21,254 8,668 7,499
1,545 735 1,621 22,965 9,986 8,0181,413 652 1,399 23,193 9,178 7,4201,393 700 1,488 25,520 9,951 7,8511,434 698 1,371 24,401 10,305 7,9131,437 709 1,506 21,319 9,052 7,0581,375 656 1,389 20,367 8,800 7,266
4,218 2,247 4,829 67,651 28,876 23,6594,135 2,013 4,296 62,362 26,468 21,8074,351 2,087 4,509 71,678 29,116 23,2894,246 2,064 4,266 66,087 28,157 22,237
16,306 7,907 16,790 252,364 107,584 84,28316,258 7,490 16,155 205,076 92,056 73,107
16,950 8,411 17,900 267,778 112,616 90,99115,911 7,599 16,325 243,255 105,093 82,25416,547 7,577 16,454 200,571 93,818 73,54817,912 9,032 18,915 305,580 130,234 100,90718,676 10,153 20,053 327,946 138,388 106,528
年 月Year and Month
止水栓・分水栓(11)Stop cocks/snap tap cocks
174
* 可鍛鋳鉄製(12) * 鋼管製(13) * 非鉄金属製(14)Made of malleable iron castings Made of steel pipes and tubes Made of non-ferrous metals
生産 生産 生産Production Production Production
数量(千個) 重量(t) 金額(百万円) 数量(千個) 重量(t) 金額(百万円) 数量(千個) 重量(t) 金額(百万円)
Quantity (103n) Weight (million yen) Quantity (103n) Weight (million yen) Quantity (103n) Weight (million yen)
平成19年 (2007) 169,598 30,647 113,723 56,200 44,625 19,68020 (2008) 156,843 28,520 105,097 52,423 43,640 19,96421 (2009) 118,591 21,776 51,808 37,634 30,172 14,13722 (2010) 130,772 23,370 77,454 43,492 35,029 15,39323 (2011) 138,920 24,733 90,717 48,561 38,141 17,697
平成21年度 (09FY) 118,759 21,938 55,389 37,288 30,928 13,88022 (10FY) 134,091 23,925 82,107 44,331 36,166 16,026
平成23年 1~3月 (Q1) 35,214 6,400 21,695 11,722 9,178 4,1154~6 (Q2) 38,733 6,945 22,666 11,788 10,279 4,5557~9 (Q3) 30,429 5,241 22,357 12,104 9,576 4,461
10~12 (Q4) 34,544 6,147 23,999 12,947 9,108 4,565
平成23年 1月 (Jan) 10,653 1,909 6,813 4,022 2,901 1,3352 (Feb) 11,533 2,080 6,864 3,639 2,922 1,3393 (Mar) 13,028 2,412 8,018 4,061 3,355 1,4404 (Apr) 14,194 2,566 7,780 3,797 3,546 1,4875 (May) 12,846 2,250 7,185 3,699 3,162 1,4716 (Jun) 11,693 2,130 7,701 4,292 3,571 1,597
7 (Jul) 10,361 1,811 7,622 4,189 3,271 1,4998 (Aug) 9,773 1,663 7,136 3,890 3,116 1,4769 (Sep) 10,295 1,767 7,599 4,026 3,189 1,486
10 (Oct) 11,097 2,013 7,975 4,105 3,107 1,58111 (Nov) 11,986 2,143 8,372 4,596 3,184 1,52412 (Dec) 11,461 1,991 7,652 4,246 2,817 1,460
注*: フランジ形を含む。
Note*: Including flange type.
3,229 6,028 7513,020 5,672 692
2,720 5,558 7373,044 5,671 768
2,749 5,206 7132,582 5,470 733
3,430 5,110 6393,180 6,051 755
3,584 6,018 7023,840 5,438 673
2,911 5,216 6723,151 5,286 615
8,051 16,234 2,1839,294 17,372 2,211
9,646 16,521 1,98910,450 16,599 2,067
32,206 53,110 6,74036,177 63,764 7,643
35,153 62,505 7,43437,441 66,726 8,450
83,081 8,42642,304 79,686 8,24431,956 55,216 6,646
年 月Year and Month
46,881
174

時系列表 (金属製品編) 製品
(4) 空気動工具、作業工具、のこ刃及び機械刃物 Pneumatic tools, machinist hand tools, saw blades and knives for machines
空気動工具(1)Pneumatic tools
生産 販売 在庫Production Sales Inventory
数量(台) 金額(百万円) 数量(台) 金額(百万円) 数量(台)
Quantity (n) (million yen) Quantity (n) (million yen) Quantity (n)
平成19年 (2007) 2,021,959 35,548 1,963,876 38,801 265,42220 (2008) 1,818,210 30,451 1,802,700 34,043 283,02921 (2009) 855,985 17,052 930,756 20,733 229,90422 (2010) 1,205,264 20,483 1,244,889 25,737 189,14723 (2011) 1,279,478 22,811 1,316,426 27,182 159,678
平成21年度 (09FY) 868,093 15,933 956,291 21,160 196,37422 (10FY) 1,241,731 21,138 1,277,348 26,274 165,619
平成23年 1~3月 (Q1) 298,540 4,991 326,853 6,811 165,6194~6 (Q2) 335,817 6,162 336,232 6,733 196,6507~9 (Q3) 336,159 5,875 330,509 6,873 171,761
10~12 (Q4) 308,962 5,783 322,832 6,765 159,678
平成23年 1月 (Jan) 97,460 1,595 109,030 2,151 178,9922 (Feb) 99,620 1,702 107,668 2,213 171,6973 (Mar) 101,460 1,695 110,155 2,448 165,6194 (Apr) 112,836 2,149 112,716 2,313 165,8595 (May) 101,766 1,858 104,279 2,112 162,3686 (Jun) 121,215 2,155 119,237 2,308 196,650
7 (Jul) 120,157 1,996 108,240 2,094 178,5488 (Aug) 110,383 2,026 111,875 2,195 176,6489 (Sep) 105,619 1,853 110,394 2,583 171,761
10 (Oct) 102,526 1,853 106,968 2,070 167,03011 (Nov) 108,219 1,902 105,521 2,298 170,86012 (Dec) 98,217 2,028 110,343 2,397 159,678
作業工具(2~5)
年 月Year and Month
175
Machinist hand tools
生産 販売 在庫Production Sales Inventory
数量(千個) 金額(百万円) 数量(千個) 金額(百万円) 数量(千個)
Quantity (103n) (million yen) Quantity (10
3n) (million yen) Quantity (10
3n)
平成19年 (2007) 127,946 48,070 129,674 49,854 15,65820 (2008) 119,553 46,199 122,275 48,045 14,98721 (2009) 76,526 27,704 79,902 29,768 12,89422 (2010) 97,879 35,523 102,529 37,917 11,67723 (2011) 100,095 40,051 104,303 41,716 10,945
平成21年度 (09FY) 80,149 28,260 84,932 31,114 12,98422 (10FY) 99,682 37,148 104,101 39,141 10,761
平成23年 1~3月 (Q1) 24,544 9,496 25,754 10,112 10,7614~6 (Q2) 24,115 10,362 25,283 10,793 10,5707~9 (Q3) 25,265 10,150 26,192 10,398 10,880
10~12 (Q4) 26,172 10,043 27,075 10,413 10,945
平成23年 1月 (Jan) 7,771 2,891 8,043 3,072 11,5462 (Feb) 8,167 3,134 8,850 3,362 11,3593 (Mar) 8,606 3,472 8,861 3,678 10,7614 (Apr) 7,664 3,563 8,196 3,898 10,5215 (May) 7,516 3,201 7,690 3,298 10,7416 (Jun) 8,935 3,597 9,398 3,597 10,570
7 (Jul) 8,329 3,341 8,746 3,378 10,6638 (Aug) 7,879 3,380 8,204 3,484 10,6789 (Sep) 9,056 3,430 9,241 3,536 10,88010 (Oct) 8,193 3,309 8,483 3,311 10,99311 (Nov) 9,134 3,407 9,414 3,556 11,08712 (Dec) 8,845 3,327 9,177 3,547 10,945
年 月Year and Month
175

時系列表 (金属製品編) 製品
(4) 空気動工具、作業工具、のこ刃及び機械刃物 Pneumatic tools, machinist hand tools, saw blades and knives for machines
レンチ・スパナ(2)Wrenches/spanners
生産 販売 在庫Production Sales Inventory
数量(千個) 金額(百万円) 数量(千個) 金額(百万円) 数量(千個)
Quantity (103n) (million yen) Quantity (10
3n) (million yen) Quantity (10
3n)
平成19年 (2007) 58,090 16,463 57,736 17,332 10,09720 (2008) 53,822 16,003 54,533 17,127 9,21221 (2009) 31,960 9,689 33,202 11,020 7,97522 (2010) 42,149 12,242 44,252 13,363 7,31823 (2011) 41,282 13,071 42,899 13,885 6,678
平成21年度 (09FY) 33,977 10,151 35,752 11,649 8,08222 (10FY) 42,609 12,375 44,600 13,412 6,650
平成23年 1~3月 (Q1) 10,380 3,037 10,911 3,420 6,6504~6 (Q2) 9,531 3,298 9,864 3,375 6,5427~9 (Q3) 10,782 3,452 11,102 3,676 6,708
10~12 (Q4) 10,589 3,283 11,022 3,414 6,678
平成23年 1月 (Jan) 3,433 924 3,577 1,011 7,2622 (Feb) 3,359 1,011 3,658 1,128 7,1463 (Mar) 3,588 1,103 3,677 1,281 6,6504 (Apr) 2,798 1,016 2,970 1,087 6,4935 (May) 2,991 1,033 3,037 1,082 6,5976 (Jun) 3,742 1,250 3,857 1,206 6,542
7 (Jul) 3,324 1,176 3,445 1,173 6,5948 (Aug) 3,393 1,123 3,505 1,206 6,6289 (Sep) 4,064 1,153 4,152 1,296 6,70810 (Oct) 3,381 1,112 3,490 1,115 6,73711 (Nov) 3,863 1,101 4,044 1,169 6,68212 (Dec) 3,345 1,070 3,487 1,130 6,678
プライヤ・ペンチ(3)
年 月Year and Month
176
Pliers/cutting pliers
生産 販売 在庫Production Sales Inventory
数量(千個) 金額(百万円) 数量(千個) 金額(百万円) 数量(千個)
Quantity (103n) (million yen) Quantity (10
3n) (million yen) Quantity (10
3n)
平成19年 (2007) 9,991 5,263 10,033 5,488 66720 (2008) 9,578 5,099 9,344 5,274 86821 (2009) 5,694 3,239 5,840 3,562 70822 (2010) 7,640 4,384 7,844 4,988 69523 (2011) 8,218 4,791 8,311 5,350 650
平成21年度 (09FY) 6,037 3,364 6,392 3,902 80722 (10FY) 7,888 4,552 8,009 5,120 611
平成23年 1~3月 (Q1) 1,891 1,094 1,941 1,265 6114~6 (Q2) 2,009 1,217 2,077 1,389 5977~9 (Q3) 2,206 1,253 2,203 1,360 608
10~12 (Q4) 2,111 1,226 2,090 1,336 650
平成23年 1月 (Jan) 594 339 593 375 6862 (Feb) 587 344 623 404 6543 (Mar) 710 412 726 485 6114 (Apr) 641 395 692 494 6005 (May) 614 382 642 427 5826 (Jun) 754 441 743 468 597
7 (Jul) 777 417 791 463 5908 (Aug) 706 398 698 430 6059 (Sep) 724 438 714 468 60810 (Oct) 738 429 711 442 62311 (Nov) 696 406 682 444 66412 (Dec) 676 390 696 450 650
注: ニッパー等を含む。Note: Including cutting nippers.
年 月Year and Month
176

時系列表 (金属製品編) 製品
(4) 空気動工具、作業工具、のこ刃及び機械刃物 Pneumatic tools, machinist hand tools, saw blades and knives for machines
ドライバ(4)Screwdrivers
生産 販売 在庫Production Sales Inventory
数量(千個) 金額(百万円) 数量(千個) 金額(百万円) 数量(千個)
Quantity (103n) (million yen) Quantity (10
3n) (million yen) Quantity (10
3n)
平成19年 (2007) 45,841 3,904 47,992 4,386 2,70120 (2008) 43,269 3,939 45,579 4,377 2,65421 (2009) 31,054 2,911 32,699 3,246 2,52122 (2010) 38,421 3,466 40,759 3,890 1,96523 (2011) 39,921 3,773 42,547 4,249 1,792
平成21年度 (09FY) 32,352 2,998 34,536 3,391 2,43522 (10FY) 39,226 3,582 41,482 3,995 1,882
平成23年 1~3月 (Q1) 9,654 889 10,207 987 1,8824~6 (Q2) 9,858 949 10,496 1,068 1,9427~9 (Q3) 9,556 898 10,411 1,039 1,829
10~12 (Q4) 10,853 1,037 11,433 1,156 1,792
平成23年 1月 (Jan) 2,968 291 2,991 308 2,0102 (Feb) 3,348 285 3,655 331 2,0123 (Mar) 3,338 313 3,560 347 1,8824 (Apr) 3,285 342 3,476 382 1,9285 (May) 3,059 298 3,169 329 2,0536 (Jun) 3,513 309 3,852 357 1,942
7 (Jul) 3,346 289 3,633 335 1,9578 (Aug) 2,917 299 3,188 344 1,8999 (Sep) 3,293 309 3,590 360 1,82910 (Oct) 3,238 328 3,471 366 1,87311 (Nov) 3,575 337 3,718 370 1,95112 (Dec) 4,040 373 4,243 420 1,792
注: 硬鋼線使用のものに限る。Note: Only those used hard drawn steel wires.
その他の作業工具(5)
年 月Year and Month
177
Other machinist hand tools
生産 販売 在庫Production Sales Inventory
数量(千個) 金額(百万円) 数量(千個) 金額(百万円) 数量(千個)
Quantity (103n) (million yen) Quantity (10
3n) (million yen) Quantity (10
3n)
平成19年 (2007) 14,025 22,439 13,913 22,648 2,19220 (2008) 12,884 21,158 12,819 21,267 2,25321 (2009) 7,817 11,865 8,162 11,940 1,69022 (2010) 9,669 15,431 9,674 15,676 1,70023 (2011) 10,674 18,416 10,546 18,232 1,825
平成21年度 (09FY) 7,783 11,747 8,251 12,172 1,66022 (10FY) 9,960 16,639 10,010 16,614 1,618
平成23年 1~3月 (Q1) 2,618 4,475 2,694 4,440 1,6184~6 (Q2) 2,717 4,897 2,846 4,960 1,4887~9 (Q3) 2,721 4,548 2,476 4,324 1,735
10~12 (Q4) 2,619 4,496 2,530 4,508 1,825
平成23年 1月 (Jan) 775 1,337 882 1,377 1,5882 (Feb) 873 1,494 914 1,498 1,5473 (Mar) 969 1,644 899 1,564 1,6184 (Apr) 940 1,811 1,058 1,935 1,4995 (May) 852 1,489 842 1,459 1,5096 (Jun) 925 1,597 946 1,567 1,488
7 (Jul) 882 1,458 877 1,408 1,5238 (Aug) 864 1,560 814 1,505 1,5469 (Sep) 975 1,530 785 1,411 1,73510 (Oct) 836 1,440 811 1,388 1,76011 (Nov) 999 1,562 970 1,573 1,79112 (Dec) 784 1,494 750 1,547 1,825
注: その他の作業工具には金床、パイプねじ切器、ボルトクリッパ、パイプカッタ、手動研磨機、ラチェットボール、手廻しタップホルダ、 携帯電気ドリル用チャック、トーチランプ、ハンドドリル、ハンド溶接切断器、万力(クランプを含み、マシンバイスを除く)等が含まれる。
Note: Other machinist hand tools including anvils, die stocks (for pipe threading), bolt clippers, pipe cutters, hand grinders, ratchet bores (hand bores), hand tap holders, chucks for portable electric drill, blow torch, hand drill, vices, etc.
年 月Year and Month
177

時系列表 (金属製品編) 製品
(4) 空気動工具、作業工具、のこ刃及び機械刃物 Pneumatic tools, machinist hand tools, saw blades and knives for machines
のこ刃(6)Saw blades
生産 販売 在庫Production Sales Inventory
重量(t) 金額(百万円) 重量(t) 金額(百万円) 重量(t)
Weight (million yen) Weight (million yen) Weight
平成19年 (2007) 3,849 9,701 3,751 9,532 21120 (2008) 3,697 9,791 3,555 9,413 21921 (2009) 1,729 5,375 1,769 5,432 9822 (2010) 2,163 7,379 2,149 7,317 6823 (2011) 2,482 8,376 2,441 8,272 66
平成21年度 (09FY) 1,734 5,594 1,800 5,744 8522 (10FY) 2,296 7,662 2,255 7,564 75
平成23年 1~3月 (Q1) 635 1,981 609 1,943 754~6 (Q2) 655 2,193 658 2,166 687~9 (Q3) 617 2,138 603 2,058 72
10~12 (Q4) 575 2,064 570 2,106 66
平成23年 1月 (Jan) 179 542 179 565 642 (Feb) 223 666 200 634 833 (Mar) 233 773 230 743 754 (Apr) 218 762 224 733 695 (May) 216 652 215 664 696 (Jun) 220 779 219 769 68
7 (Jul) 210 721 203 703 728 (Aug) 198 669 197 624 719 (Sep) 209 748 203 730 7210 (Oct) 207 707 205 706 7011 (Nov) 186 712 180 682 6912 (Dec) 182 645 185 718 66
機械刃物(7~9)
年 月Year and Month
178
Knives for industry (machines)
生産 販売 在庫Production Sales Inventory
重量(t) 金額(百万円) 重量(t) 金額(百万円) 重量(t)
Weight (million yen) Weight (million yen) Weight
平成19年 (2007) 14,053 24,618 13,214 27,438 2,00620 (2008) 13,134 23,524 12,648 26,722 2,03021 (2009) 10,347 17,274 9,644 20,610 1,05022 (2010) 11,806 20,732 10,882 22,844 1,03523 (2011) 10,129 20,032 9,258 22,755 718
平成21年度 (09FY) 10,517 17,592 9,827 20,864 1,02222 (10FY) 11,571 20,829 10,621 22,911 772
平成23年 1~3月 (Q1) 2,662 5,064 2,451 5,610 7724~6 (Q2) 2,528 5,010 2,290 5,738 7797~9 (Q3) 2,527 5,016 2,311 5,830 750
10~12 (Q4) 2,412 4,941 2,207 5,576 718
平成23年 1月 (Jan) 802 1,477 734 1,698 9912 (Feb) 921 1,711 848 1,861 9943 (Mar) 939 1,876 869 2,050 7724 (Apr) 824 1,640 753 1,851 7705 (May) 802 1,582 734 1,833 7586 (Jun) 903 1,788 803 2,054 779
7 (Jul) 859 1,715 805 1,991 7668 (Aug) 853 1,662 732 1,857 8079 (Sep) 816 1,639 774 1,982 75010 (Oct) 798 1,595 734 1,813 74011 (Nov) 788 1,662 713 1,842 72812 (Dec) 825 1,685 759 1,922 718
年 月Year and Month
178

時系列表 (金属製品編) 製品
(4) 空気動工具、作業工具、のこ刃及び機械刃物 Pneumatic tools, machinist hand tools, saw blades and knives for machines
鋼板せん断用刃物(7)Shear blades
生産 販売 在庫Production Sales Inventory
重量(t) 金額(百万円) 重量(t) 金額(百万円) 重量(t)
Weight (million yen) Weight (million yen) Weight
平成19年 (2007) 1,580 3,205 1,370 2,988 4820 (2008) 1,491 3,410 1,453 3,353 4721 (2009) 876 2,022 848 1,904 6522 (2010) 965 2,312 961 2,256 7123 (2011) 1,048 2,475 1,044 2,437 67
平成21年度 (09FY) 818 1,901 792 1,818 6722 (10FY) 999 2,375 987 2,302 76
平成23年 1~3月 (Q1) 248 595 242 581 764~6 (Q2) 242 607 245 610 737~9 (Q3) 272 643 275 634 67
10~12 (Q4) 286 630 283 611 67
平成23年 1月 (Jan) 66 162 70 169 672 (Feb) 81 190 76 179 733 (Mar) 101 243 96 233 764 (Apr) 83 192 92 214 695 (May) 77 209 68 179 736 (Jun) 82 205 86 217 73
7 (Jul) 80 193 81 192 698 (Aug) 90 210 88 204 719 (Sep) 102 240 106 239 67
10 (Oct) 95 215 95 207 6711 (Nov) 84 187 82 183 6712 (Dec) 108 228 106 221 67
合板機械用・木工機械用刃物(8)
年 月Year and Month
179
Knives for veneer machinery/wood-working machinery
生産 販売 在庫Production Sales Inventory
重量(t) 金額(百万円) 重量(t) 金額(百万円) 重量(t)
Weight (million yen) Weight (million yen) Weight
平成19年 (2007) 6,384 10,045 6,354 9,726 1,41020 (2008) 5,517 8,850 5,649 8,712 1,43921 (2009) 3,645 6,380 3,699 6,505 50322 (2010) 4,685 8,033 4,498 7,803 51723 (2011) 3,901 7,366 3,682 7,095 262
平成21年度 (09FY) 3,914 6,696 3,905 6,750 50622 (10FY) 4,589 8,047 4,402 7,837 291
平成23年 1~3月 (Q1) 1,086 1,971 1,045 1,914 2914~6 (Q2) 979 1,801 903 1,704 3097~9 (Q3) 976 1,833 919 1,768 288
10~12 (Q4) 860 1,761 814 1,709 262
平成23年 1月 (Jan) 312 558 292 544 4882 (Feb) 394 697 380 667 4913 (Mar) 380 715 373 703 2914 (Apr) 312 590 294 569 2995 (May) 291 520 283 516 2856 (Jun) 376 691 327 619 309
7 (Jul) 334 619 334 628 2978 (Aug) 347 623 282 518 3379 (Sep) 296 590 303 621 28810 (Oct) 290 581 278 571 27511 (Nov) 281 595 261 572 26312 (Dec) 290 585 275 566 262
年 月Year and Month
179

時系列表 (金属製品編) 製品
(4) 空気動工具、作業工具、のこ刃及び機械刃物 Pneumatic tools, machinist hand tools, saw blades and knives for machines
その他の機械刃物(9)Other knives for industry (machines)
Production Sales Inventory
平成19年 (2007)20 (2008)21 (2009)22 (2010)23 (2011)
平成21年度 (09FY)22 (10FY)
平成23年 1~3月 (Q1)4~6 (Q2)7~9 (Q3)
10~12 (Q4)
平成23年 1月 (Jan)2 (Feb)3 (Mar)4 (Apr)5 (May)6 (Jun)
7 (Jul)8 (Aug)9 (Sep)
10 (Oct)11 (Nov)12 (Dec)
424 880 370 1,087 398428 872 379 1,134 389
418 809 364 1,122 394414 799 361 1,035 397
445 903 390 1,171 400416 828 362 1,135 399
434 852 384 1,138 400445 892 391 1,218 397
458 918 400 1,114 405429 858 367 1,068 401
424 756 372 984 436446 824 391 1,015 431
1,279 2,540 1,117 3,428 3941,266 2,551 1,110 3,257 389
1,328 2,498 1,164 3,114 4051,308 2,602 1,142 3,424 397
5,786 8,996 5,130 12,296 4495,983 10,408 5,231 12,773 405
6,155 10,386 5,423 12,785 4475,180 10,191 4,532 13,223 389
6,126 11,263 5,546 14,657 5455,825 8,872 5,097 12,201 482
Weight (million yen) Weight (million yen) Weight
6,089 11,368 5,490 14,723 548
生産 販売 在庫
重量(t) 金額(百万円) 重量(t) 金額(百万円) 重量(t)
年 月Year and Month
180180

時系列表 (金属製品編) 製品
(5)ガス機器、石油機器及び太陽熱温水器 Gas and oil equipment for cooking, boiling and heating, and solar water heaters
平成19年 (2007)20 (2008)21 (2009)22 (2010)23 (2011)
平成21年度 (09FY)22 (10FY)
平成23年 1~3月 (Q1)4~6 (Q2)7~9 (Q3)
10~12 (Q4)
平成23年 1月 (Jan)2 (Feb)3 (Mar)4 (Apr)5 (May)6 (Jun)
7 (Jul)8 (Aug)9 (Sep)
10 (Oct)11 (Nov)12 (Dec)
ガス機器(1 7)
49,235 49,57150,889 54,74647,006 59,287
40,555 29,75639,949 32,13042,190 43,999
40,090 27,65844,889 30,888
36,567 33,26536,611 36,84935,368 31,005
147,130 163,604
38,034 37,677
111,212 107,791120,347 89,551122,694 105,885
434,051 423,074466,369 445,977
457,485 439,944501,383 466,831
430,240 450,091426,017 422,984428,871 416,385
Gas and oil equipment for cooking, boiling and heating, and solar water heaters
生産 販売
Production Sales
年 月Year and Month
ガス機器、石油機器及び太陽熱温水器(1~13)
金額(百万円) 金額(百万円)
(million yen) (million yen)
181
平成19年 (2007)20 (2008)21 (2009)22 (2010)23 (2011)
平成21年度 (09FY)22 (10FY)
平成23年 1~3月 (Q1)4~6 (Q2)7~9 (Q3)
10~12 (Q4)
平成23年 1月 (Jan)2 (Feb)3 (Mar)4 (Apr)5 (May)6 (Jun)
7 (Jul)8 (Aug)9 (Sep)
10 (Oct)11 (Nov)12 (Dec)
862,795732,882 34,212 155,198 1,040,016 37,466 146,104 564,755875,721 36,859 163,642 955,512 35,473 162,251
892,232890,844 35,402 160,059 841,515 31,302 160,426 941,194747,908 29,986 147,977 773,096 28,595 142,450
850,137695,159 28,397 134,865 634,773 24,150 133,495 911,893759,522 30,687 128,247 618,075 24,687 136,627
717,070849,454 34,609 128,321 649,193 26,023 139,700
392,798745,876 31,680 126,213 606,068 23,742 130,631 528,188691,327 28,422 120,648 736,833 26,590 121,783
593,188714,429 30,362 128,090 864,787 30,652 131,440 439,439678,014 30,109 129,316 675,925 27,558 132,861643,068 30,105 124,574 636,499 27,145 120,395 594,644
892,2322,499,447 106,473 478,899 2,837,043 104,241 468,781 564,7552,202,589 89,070 411,089 2,025,944 77,432 412,572
439,4392,286,657 94,711 375,182 1,992,094 76,355 392,114 717,0702,035,511 90,576 381,980 2,177,211 85,355 384,696
439,4398,679,714 366,964 1,623,839 8,890,439 339,690 1,585,5458,577,960 352,085 1,681,816 8,855,230 331,452 1,698,737 634,190
605,6069,024,204 380,830 1,647,150 9,032,292 343,383 1,658,163 564,7558,736,574 362,670 1,644,343 8,894,040 339,572 1,618,814
1,003,6248,530,734 348,383 1,686,518 8,789,378 326,865 1,688,397 737,1389,121,623 353,386 1,943,791 8,863,294 335,520 1,937,414
Quantity (n)
9,324,805 333,856 2,125,507 9,746,069 350,133 1,888,401 748,786
Quantity (n) (million yen) Quantity (n) Quantity (n) (million yen) Quantity (n)
Inventory
数量(台) 金額(百万円) 数量(台) 数量(台) 金額(百万円) 数量(台) 数量(台)
Gas appliances
生産 受入 出荷 Shipments 在庫年 月Year and Month
ガス機器(1~7)
Production Receipts 販売 Sales その他 Others
181

時系列表 (金属製品編) 製品
(5)ガス機器、石油機器及び太陽熱温水器 Gas and oil equipment for cooking, boiling and heating, and solar water heaters
ガスこんろ(1)
Gas cooking appliances
生産 受入 出荷 Shipments 在庫
Production Receipts 販売 Sales その他 Others Inventory
数量(台) 金額(百万円) 数量(台) 数量(台) 金額(百万円) 数量(台) 数量(台)
Quantity (n) (million yen) Quantity (n) Quantity (n) (million yen) Quantity (n) Quantity (n)
平成19年 (2007) 4,418,204 76,710 787,353 4,465,210 81,734 746,913 344,71620 (2008) 4,423,742 98,516 596,816 4,144,185 98,149 720,574 493,82821 (2009) 4,297,518 102,772 563,919 4,225,919 107,767 694,727 428,79922 (2010) 4,288,267 104,154 509,847 4,278,543 108,806 605,589 342,78123 (2011) 4,412,897 105,136 621,977 4,293,438 108,050 770,805 313,088
平成21年度 (09FY) 4,266,461 102,476 540,388 4,230,089 107,897 670,709 406,93022 (10FY) 4,255,562 103,865 512,511 4,270,845 108,386 600,066 303,768
平成23年 1~3月 (Q1) 992,215 22,815 118,809 991,382 23,218 158,331 303,7684~6 (Q2) 1,122,918 25,546 125,316 967,477 23,601 163,565 420,9607~9 (Q3) 1,057,930 25,653 176,157 962,532 25,217 207,453 485,062
10~12 (Q4) 1,239,834 31,122 201,695 1,372,047 36,014 241,456 313,088
平成23年 1月 (Jan) 299,828 6,930 38,614 236,675 5,966 46,655 397,5692 (Feb) 323,083 7,383 37,252 291,055 7,067 49,902 416,9473 (Mar) 369,304 8,502 42,943 463,652 10,185 61,774 303,7684 (Apr) 355,052 8,154 41,258 386,379 8,759 52,994 260,7055 (May) 364,442 8,241 42,361 285,439 6,914 54,182 327,8876 (Jun) 403,424 9,151 41,697 295,659 7,928 56,389 420,960
7 (Jul) 358,045 8,642 52,434 316,610 8,214 63,878 450,9518 (Aug) 330,644 7,992 60,215 308,701 7,903 69,882 463,2279 (Sep) 369,241 9,019 63,508 337,221 9,100 73,693 485,062
10 (Oct) 446,903 11,025 66,679 374,489 10,230 81,314 542,84111 (Nov) 429,205 10,817 68,421 451,215 12,555 84,039 505,21312 (Dec) 363,726 9,280 66,595 546,343 13,229 76,103 313,088
注: 液化石油ガスこんろ、普通鋳物製七輪を除く。
ガス湯沸器(2 3)
年 月Year and Month
182
ガス湯沸器(2~3)
Gas-fired water heaters
生産 受入 出荷 Shipments 在庫
Production Receipts 販売 Sales その他 Others Inventory
数量(台) 金額(百万円) 数量(台) 数量(台) 金額(百万円) 数量(台) 数量(台)
Quantity (n) (million yen) Quantity (n) Quantity (n) (million yen) Quantity (n) Quantity (n)
平成19年 (2007) 2,259,502 72,402 943,991 2,573,463 84,751 742,338 168,55620 (2008) 2,392,003 75,997 970,018 2,396,467 77,122 851,240 281,46521 (2009) 1,906,624 62,042 764,584 2,171,860 66,848 626,199 154,26122 (2010) 2,082,097 66,428 771,960 2,224,820 69,699 647,820 135,56323 (2011) 2,258,440 76,430 821,235 2,379,966 73,204 689,512 145,760
平成21年度 (09FY) 1,953,992 63,726 780,205 2,210,541 68,865 650,718 109,26622 (10FY) 2,092,728 67,934 783,646 2,254,489 70,369 661,585 69,451
平成23年 1~3月 (Q1) 551,293 19,011 209,127 651,018 20,234 175,514 69,4514~6 (Q2) 639,049 21,108 199,967 594,386 18,239 179,511 134,5707~9 (Q3) 524,368 17,678 188,922 496,588 15,732 157,667 193,605
10~12 (Q4) 543,730 18,633 223,219 637,974 18,999 176,820 145,760
平成23年 1月 (Jan) 177,786 5,998 66,228 222,521 6,737 55,510 101,5462 (Feb) 185,959 6,249 73,414 213,626 6,690 65,550 81,7433 (Mar) 187,548 6,764 69,485 214,871 6,807 54,454 69,4514 (Apr) 189,858 6,255 62,902 203,422 6,139 52,573 66,2165 (May) 211,562 7,210 66,497 184,424 5,788 60,212 99,6396 (Jun) 237,629 7,643 70,568 206,540 6,312 66,726 134,570
7 (Jul) 198,796 6,644 61,738 166,318 5,427 56,247 172,5398 (Aug) 163,022 5,569 59,922 156,720 5,092 48,935 189,8289 (Sep) 162,550 5,465 67,262 173,550 5,213 52,485 193,605
10 (Oct) 188,884 6,177 75,608 189,721 5,685 62,282 206,09411 (Nov) 186,016 6,275 76,841 212,315 6,377 61,202 195,43412 (Dec) 168,830 6,181 70,770 235,938 6,937 53,336 145,760
年 月Year and Month
182

時系列表 (金属製品編) 製品
(5)ガス機器、石油機器及び太陽熱温水器 Gas and oil equipment for cooking, boiling and heating, and solar water heaters
瞬間形(元止式)(2)
Instantaneous type(main stop system)
生産 受入 出荷 Shipments 在庫
Production Receipts 販売 Sales その他 Others Inventory
数量(台) 金額(百万円) 数量(台) 数量(台) 金額(百万円) 数量(台) 数量(台)
Quantity (n) (million yen) Quantity (n) Quantity (n) (million yen) Quantity (n) Quantity (n)
平成19年 (2007) 580,991 5,560 378,299 653,314 7,638 379,659 29,03120 (2008) 601,289 6,965 356,179 538,996 7,453 359,361 88,14121 (2009) 437,915 4,997 266,430 492,651 7,153 267,637 32,19822 (2010) 484,703 5,730 275,495 476,955 6,927 276,623 38,81723 (2011) 470,061 5,610 277,570 472,707 6,909 279,311 34,430
平成21年度 (09FY) 415,063 4,732 264,061 490,393 7,129 265,178 17,31422 (10FY) 485,164 5,739 277,515 490,047 7,116 278,534 11,411
平成23年 1~3月 (Q1) 114,892 1,342 71,916 141,907 2,066 72,307 11,4114~6 (Q2) 107,366 1,278 60,578 74,935 1,098 60,767 43,6537~9 (Q3) 94,530 1,142 48,953 66,807 990 49,719 70,610
10~12 (Q4) 153,273 1,848 96,123 189,058 2,755 96,518 34,430
平成23年 1月 (Jan) 37,086 431 23,740 54,223 788 23,810 21,6102 (Feb) 39,729 454 27,267 44,411 644 27,341 16,8543 (Mar) 38,077 457 20,909 43,273 634 21,156 11,4114 (Apr) 39,360 465 22,774 36,437 534 22,781 14,3275 (May) 37,346 443 21,589 20,128 296 21,659 31,4756 (Jun) 30,660 370 16,215 18,370 268 16,327 43,653
7 (Jul) 28,396 347 12,430 16,885 259 12,601 54,9938 (Aug) 28,054 341 14,152 19,141 280 14,693 63,3659 (Sep) 38,080 454 22,371 30,781 451 22,425 70,610
10 (Oct) 54,018 668 33,230 51,167 747 33,367 73,32411 (Nov) 53,471 628 34,250 60,807 887 34,522 65,71612 (Dec) 45,784 552 28,643 77,084 1,121 28,629 34,430
注: 給湯配管の出来ないもの。
瞬間形(先止式) 貯湯形(3)
年 月Year and Month
183
瞬間形(先止式)・貯湯形(3)
Instantaneous type (end stop system)/storage type
生産 受入 出荷 Shipments 在庫
Production Receipts 販売 Sales その他 Others Inventory
数量(台) 金額(百万円) 数量(台) 数量(台) 金額(百万円) 数量(台) 数量(台)
Quantity (n) (million yen) Quantity (n) Quantity (n) (million yen) Quantity (n) Quantity (n)
平成19年 (2007) 1,678,511 66,842 565,692 1,920,149 77,113 362,679 139,52520 (2008) 1,790,714 69,032 613,839 1,857,471 69,669 491,879 193,32421 (2009) 1,468,709 57,045 498,154 1,679,209 59,695 358,562 122,06322 (2010) 1,597,394 60,698 496,465 1,747,865 62,772 371,197 96,74623 (2011) 1,788,379 70,820 543,665 1,907,259 66,295 410,201 111,330
平成21年度 (09FY) 1,538,929 58,994 516,144 1,720,148 61,736 385,540 91,95222 (10FY) 1,607,564 62,195 506,131 1,764,442 63,253 383,051 58,040
平成23年 1~3月 (Q1) 436,401 17,669 137,211 509,111 18,168 103,207 58,0404~6 (Q2) 531,683 19,830 139,389 519,451 17,141 118,744 90,9177~9 (Q3) 429,838 16,536 139,969 429,781 14,742 107,948 122,995
10~12 (Q4) 390,457 16,785 127,096 448,916 16,244 80,302 111,330
平成23年 1月 (Jan) 140,700 5,567 42,488 168,298 5,949 31,700 79,9362 (Feb) 146,230 5,795 46,147 169,215 6,046 38,209 64,8893 (Mar) 149,471 6,307 48,576 171,598 6,173 33,298 58,0404 (Apr) 150,498 5,790 40,128 166,985 5,605 29,792 51,8895 (May) 174,216 6,767 44,908 164,296 5,492 38,553 68,1646 (Jun) 206,969 7,273 54,353 188,170 6,044 50,399 90,917
7 (Jul) 170,400 6,297 49,308 149,433 5,168 43,646 117,5468 (Aug) 134,968 5,228 45,770 137,579 4,812 34,242 126,4639 (Sep) 124,470 5,011 44,891 142,769 4,762 30,060 122,995
10 (Oct) 134,866 5,509 42,378 138,554 4,938 28,915 132,77011 (Nov) 132,545 5,647 42,591 151,508 5,490 26,680 129,71812 (Dec) 123,046 5,629 42,127 158,854 5,816 24,707 111,330
注: 給湯配管の出来るもの。 貯蔵形を含み、伝熱面積8㎡以下で0.1MPa以下のもの。
年 月Year and Month
183

時系列表 (金属製品編) 製品
(5)ガス機器、石油機器及び太陽熱温水器 Gas and oil equipment for cooking, boiling and heating, and solar water heaters
ガス温水給湯暖房機(4)
Gas-fired water heaters and space heaters
生産 受入 出荷 Shipments 在庫
Production Receipts 販売 Sales その他 Others Inventory
数量(台) 金額(百万円) 数量(台) 数量(台) 金額(百万円) 数量(台) 数量(台)
Quantity (n) (million yen) Quantity (n) Quantity (n) (million yen) Quantity (n) Quantity (n)
平成19年 (2007) 187,162 27,332 16,514 207,231 29,833 5,756 21,36320 (2008) 171,258 24,580 16,017 183,997 26,355 4,027 20,20821 (2009) 296,478 43,051 11,829 311,914 40,186 3,994 18,61922 (2010) 285,990 43,443 15,083 299,822 42,255 3,912 16,11623 (2011) 316,092 49,734 17,113 326,675 46,276 3,467 19,180
平成21年度 (09FY) 294,126 43,356 12,785 307,897 40,636 4,584 18,05622 (10FY) 288,899 44,121 16,034 306,691 43,257 3,385 12,724
平成23年 1~3月 (Q1) 79,734 11,964 4,933 86,951 12,008 1,108 12,7244~6 (Q2) 72,805 11,794 3,162 67,589 9,663 781 20,3217~9 (Q3) 65,557 10,367 3,356 68,736 10,190 678 19,820
10~12 (Q4) 97,996 15,609 5,662 103,399 14,415 900 19,180
平成23年 1月 (Jan) 28,005 4,253 1,859 31,383 4,367 456 14,1412 (Feb) 27,195 3,992 1,600 27,531 3,809 256 15,1493 (Mar) 24,534 3,719 1,474 28,037 3,832 396 12,7244 (Apr) 22,396 3,521 1,011 23,935 3,450 274 11,9225 (May) 24,398 4,013 1,143 21,636 3,105 259 15,5686 (Jun) 26,011 4,260 1,008 22,018 3,108 248 20,321
7 (Jul) 22,373 3,447 869 22,407 3,429 282 20,8748 (Aug) 20,724 3,288 800 21,149 3,133 183 21,0669 (Sep) 22,460 3,632 1,687 25,180 3,628 213 19,820
10 (Oct) 30,101 4,724 1,785 31,016 4,413 278 20,41211 (Nov) 34,393 5,536 2,018 34,463 4,763 284 22,07712 (Dec) 33,502 5,349 1,859 37,920 5,239 338 19,180
注: 伝熱面積8㎡以下で0.1MPa以下及び伝熱面積2㎡以下で0.2MPa以下のもの。
ガス風呂がま(5)
年 月Year and Month
184
ガス風呂がま(5)
Gas bath boilers
生産 受入 出荷 Shipments 在庫
Production Receipts 販売 Sales その他 Others Inventory
数量(台) 金額(百万円) 数量(台) 数量(台) 金額(百万円) 数量(台) 数量(台)
Quantity (n) (million yen) Quantity (n) Quantity (n) (million yen) Quantity (n) Quantity (n)
平成19年 (2007) 1,218,832 112,375 166,788 1,239,338 105,622 172,483 77,91620 (2008) 1,207,525 113,256 172,515 1,194,181 94,543 162,226 101,12821 (2009) 1,128,610 109,330 161,439 1,172,935 87,715 162,582 55,30622 (2010) 1,259,819 119,902 173,854 1,255,514 94,771 180,197 53,00323 (2011) 1,320,628 132,731 186,825 1,307,005 99,797 192,235 61,216
平成21年度 (09FY) 1,181,850 111,829 168,623 1,198,246 89,563 176,777 44,14722 (10FY) 1,263,184 123,929 173,751 1,275,845 95,908 175,967 29,005
平成23年 1~3月 (Q1) 354,582 34,750 49,111 378,711 27,703 48,980 29,0054~6 (Q2) 333,802 33,565 46,737 305,969 23,249 47,602 55,9737~9 (Q3) 298,272 29,594 42,654 273,059 21,505 46,478 77,362
10~12 (Q4) 333,972 34,822 48,323 349,266 27,340 49,175 61,216
平成23年 1月 (Jan) 122,078 12,315 17,873 123,541 9,387 17,636 51,7772 (Feb) 121,528 11,767 17,050 123,097 9,275 17,006 50,2523 (Mar) 110,976 10,668 14,188 132,073 9,041 14,338 29,0054 (Apr) 96,024 9,719 15,477 98,605 7,531 15,696 26,2055 (May) 110,246 11,386 16,212 98,593 7,488 15,753 38,3176 (Jun) 127,532 12,460 15,048 108,771 8,230 16,153 55,973
7 (Jul) 109,657 10,380 13,206 87,194 6,918 16,122 75,5208 (Aug) 95,932 9,670 13,928 84,584 6,662 14,399 86,3979 (Sep) 92,683 9,544 15,520 101,281 7,925 15,957 77,362
10 (Oct) 104,002 10,719 15,987 101,446 7,930 16,388 79,51711 (Nov) 114,416 11,865 16,362 117,329 9,066 16,542 76,42412 (Dec) 115,554 12,238 15,974 130,491 10,344 16,245 61,216
注:バーナ付の一体のものを含む。
年 月Year and Month
184

時系列表 (金属製品編) 製品
(5)ガス機器、石油機器及び太陽熱温水器 Gas and oil equipment for cooking, boiling and heating, and solar water heaters
ガスストーブ(6)
Gas space heaters
生産 受入 出荷 Shipments 在庫
Production Receipts 販売 Sales その他 Others Inventory
数量(台) 金額(百万円) 数量(台) 数量(台) 金額(百万円) 数量(台) 数量(台)
Quantity (n) (million yen) Quantity (n) Quantity (n) (million yen) Quantity (n) Quantity (n)
平成19年 (2007) 729,886 13,625 51 711,801 13,278 5,449 97,32320 (2008) 391,310 8,112 - 442,087 9,002 3,688 41,95321 (2009) 325,328 7,100 - 326,359 6,943 1,336 39,58622 (2010) 326,356 6,521 - 334,380 7,089 2,347 29,21523 (2011) 443,905 8,448 - 457,875 8,639 1,222 14,023
平成21年度 (09FY) 330,815 7,292 - 335,715 7,147 1,390 24,42622 (10FY) 329,524 6,572 - 339,255 7,144 2,362 12,333
平成23年 1~3月 (Q1) 33,582 916 - 49,886 1,107 578 12,3334~6 (Q2) 67,643 1,161 - 23,910 504 297 55,7697~9 (Q3) 151,975 2,882 - 146,873 2,671 167 60,704
10~12 (Q4) 190,705 3,489 - 237,206 4,357 180 14,023
平成23年 1月 (Jan) 9,876 267 - 16,871 340 76 22,1442 (Feb) 12,996 353 - 15,219 375 94 19,8273 (Mar) 10,710 296 - 17,796 392 408 12,3334 (Apr) 11,199 296 - 10,613 261 105 12,8145 (May) 19,808 320 - 8,403 166 173 24,0466 (Jun) 36,636 545 - 4,894 77 19 55,769
7 (Jul) 43,315 821 - 14,767 299 64 84,2538 (Aug) 47,155 877 - 41,433 713 55 89,9209 (Sep) 61,505 1,184 - 90,673 1,659 48 60,704
10 (Oct) 78,656 1,496 - 92,136 1,807 60 47,16411 (Nov) 75,005 1,328 - 83,129 1,502 69 38,97112 (Dec) 37,044 665 - 61,941 1,048 51 14,023
注: 排気筒のないもの。
ガス温風暖房機(7)
年 月Year and Month
185
ガス温風暖房機(7)
Gas heaters with circulating fan
生産 受入 出荷 Shipments 在庫
Production Receipts 販売 Sales その他 Others Inventory
数量(台) 金額(百万円) 数量(台) 数量(台) 金額(百万円) 数量(台) 数量(台)
Quantity (n) (million yen) Quantity (n) Quantity (n) (million yen) Quantity (n) Quantity (n)
平成19年 (2007) 201,725 22,314 19 220,854 23,497 2,750 15,01020 (2008) 215,277 23,848 1 211,956 19,967 1,652 16,68021 (2009) 305,671 16,455 - 298,529 7,529 10,156 8,21822 (2010) 236,936 14,257 3 234,323 7,092 3,919 7,54223 (2011) 272,242 8,351 - 267,333 7,417 922 11,488
平成21年度 (09FY) 295,470 15,869 2 294,043 7,392 10,054 11,20122 (10FY) 241,499 14,385 1 236,630 7,220 3,872 12,158
平成23年 1~3月 (Q1) 24,105 1,120 - 19,263 1,085 185 12,1584~6 (Q2) 50,440 1,537 - 32,763 1,099 358 29,4777~9 (Q3) 104,487 2,896 - 78,156 2,117 129 55,679
10~12 (Q4) 93,210 2,798 - 137,151 3,116 250 11,488
平成23年 1月 (Jan) 5,495 342 - 5,508 348 62 7,4672 (Feb) 7,253 365 - 5,397 342 53 9,2703 (Mar) 11,357 413 - 8,358 395 70 12,1584 (Apr) 16,798 477 - 13,879 450 141 14,9365 (May) 15,420 510 - 7,573 281 52 22,7316 (Jun) 18,222 550 - 11,311 368 165 29,477
7 (Jul) 27,336 753 - 10,779 400 34 46,0008 (Aug) 37,682 1,001 - 22,186 647 41 61,4559 (Sep) 39,469 1,142 - 45,191 1,070 54 55,679
10 (Oct) 42,298 1,261 - 52,707 1,237 104 45,16611 (Nov) 36,686 1,038 - 57,061 1,210 115 24,67612 (Dec) 14,226 499 - 27,383 669 31 11,488
注: 暖房方式が強制対流のもの。
年 月Year and Month
185

時系列表 (金属製品編) 製品
(5)ガス機器、石油機器及び太陽熱温水器 Gas and oil equipment for cooking, boiling and heating, and solar water heaters
石油機器(8~12)
Oil appliances
生産 受入 出荷 Shipments 在庫
Production Receipts 販売 Sales その他 Others Inventory
数量(台) 金額(百万円) 数量(台) 数量(台) 金額(百万円) 数量(台) 数量(台)
Quantity (n) (million yen) Quantity (n) Quantity (n) (million yen) Quantity (n) Quantity (n)
平成19年 (2007) 4,882,441 93,679 986,029 4,787,681 96,682 592,543 1,343,87620 (2008) 3,293,588 69,303 601,702 4,243,932 83,204 443,181 551,93621 (2009) 4,366,949 78,249 524,315 4,621,392 86,475 432,779 378,95122 (2010) 4,855,536 92,949 599,512 4,869,096 97,424 520,154 454,84823 (2011) 6,464,564 118,434 675,261 6,475,786 120,130 572,814 545,777
平成21年度 (09FY) 4,379,042 79,818 496,446 4,653,078 88,637 425,698 559,26522 (10FY) 5,142,209 97,471 626,603 5,257,038 103,159 529,676 545,238
平成23年 1~3月 (Q1) 914,842 20,220 96,612 884,584 21,706 36,353 545,2384~6 (Q2) 1,215,804 24,870 83,633 304,335 12,150 80,647 1,459,5647~9 (Q3) 1,919,725 33,048 197,852 1,557,390 27,562 192,487 1,827,262
10~12 (Q4) 2,414,193 40,296 297,164 3,729,477 58,712 263,327 545,777
平成23年 1月 (Jan) 397,787 7,837 30,706 525,053 10,372 15,747 342,4872 (Feb) 254,859 6,325 31,919 162,185 5,430 12,262 454,8173 (Mar) 262,196 6,058 33,987 197,346 5,904 8,344 545,2384 (Apr) 335,430 6,646 29,210 118,607 4,018 28,103 763,0395 (May) 365,420 8,158 27,720 46,984 3,571 26,377 1,082,8186 (Jun) 514,954 10,066 26,703 138,744 4,561 26,167 1,459,564
7 (Jul) 544,808 9,663 43,822 198,935 4,742 45,619 1,803,6408 (Aug) 647,477 11,374 78,723 442,634 7,696 76,833 2,010,3739 (Sep) 727,440 12,011 75,307 915,821 15,124 70,035 1,827,262
10 (Oct) 803,855 13,666 94,150 1,122,485 18,012 88,287 1,514,45511 (Nov) 833,692 13,931 103,727 1,199,640 19,055 91,871 1,160,36812 (Dec) 776,646 12,699 99,287 1,407,352 21,645 83,169 545,777
石油スト ブ(8 9)
年 月Year and Month
186
石油ストーブ(8~9)
Oil-burning space heaters
生産 受入 出荷 Shipments 在庫
Production Receipts 販売 Sales その他 Others Inventory
数量(台) 金額(百万円) 数量(台) 数量(台) 金額(百万円) 数量(台) 数量(台)
Quantity (n) (million yen) Quantity (n) Quantity (n) (million yen) Quantity (n) Quantity (n)
平成19年 (2007) 4,353,284 48,539 871,094 4,251,520 49,717 484,225 1,271,78920 (2008) 2,865,461 32,909 503,300 3,795,995 44,474 349,262 495,24521 (2009) 3,949,861 42,249 420,058 4,168,939 47,522 345,163 350,87922 (2010) 4,323,032 49,354 481,828 4,314,872 51,017 423,737 421,54623 (2011) 5,822,798 62,078 556,063 5,860,336 67,738 462,394 477,503
平成21年度 (09FY) 3,935,256 41,705 390,760 4,179,225 47,936 338,562 515,54922 (10FY) 4,584,242 51,936 509,798 4,681,105 55,083 429,274 503,572
平成23年 1~3月 (Q1) 755,517 7,074 63,785 729,998 8,749 7,224 503,5724~6 (Q2) 1,048,561 10,295 56,799 179,052 1,403 54,969 1,374,7917~9 (Q3) 1,764,246 19,464 173,939 1,413,308 15,276 168,302 1,731,366
10~12 (Q4) 2,254,474 25,245 261,540 3,537,978 42,310 231,899 477,503
平成23年 1月 (Jan) 343,941 3,467 17,849 470,383 5,793 4,141 308,7582 (Feb) 199,918 1,816 20,754 115,075 1,537 2,701 411,6543 (Mar) 211,658 1,791 25,182 144,540 1,419 382 503,5724 (Apr) 286,962 2,483 19,831 77,414 574 18,548 714,2835 (May) 307,866 3,155 18,419 6,144 54 18,049 1,016,3756 (Jun) 453,733 4,657 18,549 95,494 775 18,372 1,374,791
7 (Jul) 492,739 5,222 36,727 160,180 1,378 35,748 1,708,3298 (Aug) 597,751 6,767 71,069 397,559 3,894 70,416 1,909,1749 (Sep) 673,756 7,475 66,143 855,569 10,004 62,138 1,731,366
10 (Oct) 750,504 8,639 82,856 1,056,418 12,403 78,561 1,429,74711 (Nov) 777,979 8,712 92,620 1,140,351 13,927 81,649 1,078,34612 (Dec) 725,991 7,894 86,064 1,341,209 15,980 71,689 477,503
年 月Year and Month
186

時系列表 (金属製品編) 製品
(5)ガス機器、石油機器及び太陽熱温水器 Gas and oil equipment for cooking, boiling and heating, and solar water heaters
しん式(8)
Wick type
生産 受入 出荷 Shipments 在庫
Production Receipts 販売 Sales その他 Others Inventory
数量(台) 金額(百万円) 数量(台) 数量(台) 金額(百万円) 数量(台) 数量(台)
Quantity (n) (million yen) Quantity (n) Quantity (n) (million yen) Quantity (n) Quantity (n)
平成19年 (2007) 1,673,963 13,835 91,901 1,548,524 12,238 7,347 343,65720 (2008) 1,073,648 8,935 52,597 1,320,786 10,575 8,582 140,67821 (2009) 1,370,036 11,942 20,262 1,404,405 11,119 2,675 123,89222 (2010) 1,385,876 12,042 25,058 1,455,262 11,269 1,235 82,74523 (2011) 2,345,255 20,220 27,506 2,386,672 19,050 - 68,831
平成21年度 (09FY) 1,381,774 11,742 17,866 1,420,613 11,266 2,675 220,38222 (10FY) 1,477,964 12,691 21,820 1,589,709 12,239 1,235 133,635
平成23年 1~3月 (Q1) 263,661 2,165 7,842 220,610 1,717 - 133,6354~6 (Q2) 402,754 3,674 436 148,924 1,030 - 387,9017~9 (Q3) 755,803 6,212 2,369 848,642 6,827 - 297,431
10~12 (Q4) 923,037 8,169 16,859 1,168,496 9,476 - 68,831
平成23年 1月 (Jan) 92,489 804 2,391 94,906 731 - 82,7162 (Feb) 82,309 655 1,804 19,911 186 - 146,9183 (Mar) 88,863 706 3,647 105,793 800 - 133,6354 (Apr) 93,640 796 283 70,618 486 - 156,9405 (May) 107,121 1,046 78 4,986 37 - 259,1536 (Jun) 201,993 1,832 75 73,320 507 - 387,901
7 (Jul) 236,762 1,951 63 106,322 740 - 518,4048 (Aug) 240,837 1,986 127 274,865 2,160 - 484,5039 (Sep) 278,204 2,275 2,179 467,455 3,927 - 297,431
10 (Oct) 300,598 2,702 1,943 439,250 3,514 - 160,72211 (Nov) 316,675 2,771 6,374 381,354 3,126 - 102,41712 (Dec) 305,764 2,696 8,542 347,892 2,836 - 68,831
注: 排気筒のないもの。
気化式(9)
年 月Year and Month
187
気化式(9)
Vaporizing type
生産 受入 出荷 Shipments 在庫
Production Receipts 販売 Sales その他 Others Inventory
数量(台) 金額(百万円) 数量(台) 数量(台) 金額(百万円) 数量(台) 数量(台)
Quantity (n) (million yen) Quantity (n) Quantity (n) (million yen) Quantity (n) Quantity (n)
平成19年 (2007) 2,679,321 34,704 779,193 2,702,996 37,479 476,878 928,13220 (2008) 1,791,813 23,974 450,703 2,475,209 33,899 340,680 354,56721 (2009) 2,579,825 30,307 399,796 2,764,534 36,403 342,488 226,98722 (2010) 2,937,156 37,312 456,770 2,859,610 39,748 422,502 338,80123 (2011) 3,477,543 41,858 528,557 3,473,664 48,688 462,394 408,672
平成21年度 (09FY) 2,553,482 29,963 372,894 2,758,612 36,670 335,887 295,16722 (10FY) 3,106,278 39,245 487,978 3,091,396 42,844 428,039 369,937
平成23年 1~3月 (Q1) 491,856 4,909 55,943 509,388 7,032 7,224 369,9374~6 (Q2) 645,807 6,621 56,363 30,128 373 54,969 986,8907~9 (Q3) 1,008,443 13,252 171,570 564,666 8,449 168,302 1,433,935
10~12 (Q4) 1,331,437 17,076 244,681 2,369,482 32,834 231,899 408,672
平成23年 1月 (Jan) 251,452 2,663 15,458 375,477 5,062 4,141 226,0422 (Feb) 117,609 1,161 18,950 95,164 1,351 2,701 264,7363 (Mar) 122,795 1,085 21,535 38,747 619 382 369,9374 (Apr) 193,322 1,687 19,548 6,796 88 18,548 557,3435 (May) 200,745 2,109 18,341 1,158 17 18,049 757,2226 (Jun) 251,740 2,825 18,474 22,174 268 18,372 986,890
7 (Jul) 255,977 3,271 36,664 53,858 638 35,748 1,189,9258 (Aug) 356,914 4,781 70,942 122,694 1,734 70,416 1,424,6719 (Sep) 395,552 5,200 63,964 388,114 6,077 62,138 1,433,935
10 (Oct) 449,906 5,937 80,913 617,168 8,889 78,561 1,269,02511 (Nov) 461,304 5,941 86,246 758,997 10,801 81,649 975,92912 (Dec) 420,227 5,198 77,522 993,317 13,144 71,689 408,672
注: 排気筒のないもの。
年 月Year and Month
187

時系列表 (金属製品編) 製品
(5)ガス機器、石油機器及び太陽熱温水器 Gas and oil equipment for cooking, boiling and heating, and solar water heaters
石油温風暖房機(強制給排気・排気式)(10)
Oil-burning warm air furnaces(forced intake/exhaust type)
生産 受入 出荷 Shipments 在庫
Production Receipts 販売 Sales その他 Others Inventory
数量(台) 金額(百万円) 数量(台) 数量(台) 金額(百万円) 数量(台) 数量(台)
Quantity (n) (million yen) Quantity (n) Quantity (n) (million yen) Quantity (n) Quantity (n)
平成19年 (2007) 147,617 12,544 11,664 151,636 12,131 4,229 36,95520 (2008) 102,890 8,647 6,572 114,384 9,319 3,627 28,37621 (2009) 89,970 7,909 6,730 108,788 8,881 2,646 11,04822 (2010) 161,789 12,049 16,589 178,414 13,634 2,613 13,00123 (2011) 216,755 15,833 11,964 195,669 15,174 6,794 39,156
平成21年度 (09FY) 101,056 8,595 9,650 121,345 9,884 2,458 19,66022 (10FY) 178,703 13,003 12,840 185,401 14,084 2,791 22,939
平成23年 1~3月 (Q1) 49,395 3,457 2,279 41,075 3,143 592 22,9394~6 (Q2) 53,929 3,557 509 20,016 1,428 369 56,9837~9 (Q3) 58,680 4,305 2,112 58,959 4,670 1,299 57,517
10~12 (Q4) 54,751 4,514 7,064 75,619 5,933 4,534 39,156
平成23年 1月 (Jan) 13,425 956 849 12,486 975 265 14,5242 (Feb) 16,357 1,213 707 13,794 998 176 17,6183 (Mar) 19,613 1,288 723 14,795 1,170 151 22,9394 (Apr) 15,009 939 382 6,993 472 262 31,0665 (May) 18,353 1,203 46 4,534 327 60 44,8716 (Jun) 20,567 1,415 81 8,489 629 47 56,983
7 (Jul) 16,833 1,221 60 9,767 761 33 64,0768 (Aug) 19,434 1,625 63 18,952 1,487 32 64,5899 (Sep) 22,413 1,459 1,989 30,240 2,422 1,234 57,517
10 (Oct) 19,483 1,631 2,453 32,557 2,556 1,502 45,37111 (Nov) 20,244 1,635 2,467 21,680 1,720 1,581 44,82112 (Dec) 15,024 1,248 2,144 21,382 1,657 1,451 39,156
石油温水給湯暖房機(11 12)
年 月Year and Month
188
石油温水給湯暖房機(11~12)
Oil-fired water heaters and space heaters
生産 受入 出荷 Shipments 在庫
Production Receipts 販売 Sales その他 Others Inventory
数量(台) 金額(百万円) 数量(台) 数量(台) 金額(百万円) 数量(台) 数量(台)
Quantity (n) (million yen) Quantity (n) Quantity (n) (million yen) Quantity (n) Quantity (n)
平成19年 (2007) 381,540 32,596 103,271 384,525 34,834 104,089 35,13220 (2008) 325,237 27,747 91,830 333,553 29,411 90,292 28,31521 (2009) 327,118 28,091 97,527 343,665 30,072 84,970 17,02422 (2010) 370,715 31,546 101,095 375,810 32,773 93,804 20,30123 (2011) 425,011 40,523 107,234 419,781 37,218 103,626 29,118
平成21年度 (09FY) 342,730 29,518 96,036 352,508 30,817 84,678 24,05622 (10FY) 379,264 32,532 103,965 390,532 33,992 97,611 18,727
平成23年 1~3月 (Q1) 109,930 9,689 30,548 113,511 9,814 28,537 18,7274~6 (Q2) 113,314 11,018 26,325 105,267 9,319 25,309 27,7907~9 (Q3) 96,799 9,279 21,801 85,123 7,616 22,886 38,379
10~12 (Q4) 104,968 10,537 28,560 115,880 10,469 26,894 29,118
平成23年 1月 (Jan) 40,421 3,414 12,008 42,184 3,604 11,341 19,2052 (Feb) 38,584 3,296 10,458 33,316 2,895 9,385 25,5453 (Mar) 30,925 2,979 8,082 38,011 3,315 7,811 18,7274 (Apr) 33,459 3,224 8,997 34,200 2,972 9,293 17,6905 (May) 39,201 3,800 9,255 36,306 3,190 8,268 21,5726 (Jun) 40,654 3,994 8,073 34,761 3,157 7,748 27,790
7 (Jul) 35,236 3,220 7,035 28,988 2,603 9,838 31,2358 (Aug) 30,292 2,982 7,591 26,123 2,315 6,385 36,6109 (Sep) 31,271 3,077 7,175 30,012 2,698 6,663 38,379
10 (Oct) 33,868 3,396 8,841 33,510 3,053 8,224 39,33711 (Nov) 35,469 3,584 8,640 37,609 3,408 8,641 37,20112 (Dec) 35,631 3,557 11,079 44,761 4,008 10,029 29,118
注: 伝熱面積8㎡以下で0.1MPa以下及び伝熱面積2㎡以下で0.2MPa以下のもの。
年 月Year and Month
188

時系列表 (金属製品編) 製品
(5)ガス機器、石油機器及び太陽熱温水器 Gas and oil equipment for cooking, boiling and heating, and solar water heaters
石油小形給湯機(11)
Oil-burning water heaters for residential use
生産 受入 出荷 Shipments 在庫
Production Receipts 販売 Sales その他 Others Inventory
数量(台) 金額(百万円) 数量(台) 数量(台) 金額(百万円) 数量(台) 数量(台)
Quantity (n) (million yen) Quantity (n) Quantity (n) (million yen) Quantity (n) Quantity (n)
平成19年 (2007) 266,584 19,799 54,570 225,676 18,326 99,655 25,54120 (2008) 224,396 16,715 49,658 193,771 15,529 85,668 20,16921 (2009) 223,399 16,794 51,069 198,871 15,905 78,688 14,46922 (2010) 251,674 18,789 53,255 211,395 16,779 91,352 16,74023 (2011) 285,044 22,318 55,822 238,288 19,280 96,816 22,491
平成21年度 (09FY) 233,627 17,629 51,361 202,696 16,203 81,446 19,16422 (10FY) 256,564 19,179 55,035 221,088 17,551 95,109 14,146
平成23年 1~3月 (Q1) 74,367 5,624 16,902 66,201 5,268 27,659 14,1464~6 (Q2) 76,715 6,055 13,347 58,634 4,723 24,156 21,4187~9 (Q3) 63,589 5,216 11,826 50,099 4,092 19,109 27,625
10~12 (Q4) 70,373 5,423 13,747 63,354 5,197 25,892 22,491
平成23年 1月 (Jan) 27,151 1,999 6,409 23,940 1,893 10,865 15,4952 (Feb) 26,622 2,016 5,831 18,784 1,489 9,157 20,0073 (Mar) 20,594 1,609 4,662 23,477 1,886 7,637 14,1464 (Apr) 23,731 1,807 4,460 19,794 1,581 8,710 13,8335 (May) 26,327 2,043 4,506 20,151 1,595 8,076 16,4396 (Jun) 26,657 2,205 4,381 18,689 1,547 7,370 21,418
7 (Jul) 21,746 1,850 4,050 16,524 1,345 6,321 24,3698 (Aug) 20,419 1,650 3,981 16,054 1,305 6,272 26,4439 (Sep) 21,424 1,716 3,795 17,521 1,442 6,516 27,625
10 (Oct) 22,578 1,725 4,141 17,664 1,455 8,002 28,67011 (Nov) 23,108 1,798 3,874 20,579 1,691 8,092 26,98112 (Dec) 24,687 1,900 5,732 25,111 2,051 9,798 22,491
注: 急速加熱方式で熱交換器容量30ℓ以下のもの。
石油温水給湯機(12)
年 月Year and Month
189
石油温水給湯機(12)
Oil-burning water heaters
生産 受入 出荷 Shipments 在庫
Production Receipts 販売 Sales その他 Others Inventory
数量(台) 金額(百万円) 数量(台) 数量(台) 金額(百万円) 数量(台) 数量(台)
Quantity (n) (million yen) Quantity (n) Quantity (n) (million yen) Quantity (n) Quantity (n)
平成19年 (2007) 114,956 12,797 48,701 158,849 16,508 4,434 9,59120 (2008) 100,841 11,032 42,172 139,782 13,882 4,624 8,14621 (2009) 103,719 11,297 46,458 144,794 14,167 6,282 2,55522 (2010) 119,041 12,757 47,840 164,415 15,994 2,452 3,56123 (2011) 139,967 18,205 51,412 181,493 17,938 6,810 6,627
平成21年度 (09FY) 109,103 11,889 44,675 149,812 14,614 3,232 4,89222 (10FY) 122,700 13,353 48,930 169,444 16,441 2,502 4,581
平成23年 1~3月 (Q1) 35,563 4,065 13,646 47,310 4,546 878 4,5814~6 (Q2) 36,599 4,963 12,978 46,633 4,596 1,153 6,3727~9 (Q3) 33,210 4,063 9,975 35,024 3,524 3,777 10,754
10~12 (Q4) 34,595 5,114 14,813 52,526 5,272 1,002 6,627
平成23年 1月 (Jan) 13,270 1,415 5,599 18,244 1,711 476 3,7102 (Feb) 11,962 1,280 4,627 14,532 1,406 228 5,5383 (Mar) 10,331 1,370 3,420 14,534 1,429 174 4,5814 (Apr) 9,728 1,417 4,537 14,406 1,391 583 3,8575 (May) 12,874 1,757 4,749 16,155 1,595 192 5,1336 (Jun) 13,997 1,789 3,692 16,072 1,610 378 6,372
7 (Jul) 13,490 1,370 2,985 12,464 1,258 3,517 6,8668 (Aug) 9,873 1,332 3,610 10,069 1,010 113 10,1679 (Sep) 9,847 1,361 3,380 12,491 1,256 147 10,754
10 (Oct) 11,290 1,671 4,700 15,846 1,598 222 10,66711 (Nov) 12,361 1,786 4,766 17,030 1,717 549 10,22012 (Dec) 10,944 1,657 5,347 19,650 1,957 231 6,627
注:「石油小形給湯機」以外の暖房・給湯に用いる石油温水小型ボイラのもの。
年 月Year and Month
189

時系列表 (金属製品編) 製品
(5)ガス機器、石油機器及び太陽熱温水器 Gas and oil equipment for cooking, boiling and heating, and solar water heaters
太陽熱温水器(13)
Solar water heaters
生産 受入 出荷 Shipments 在庫
Production Receipts 販売 Sales その他 Others Inventory
数量(台) 金額(百万円) 数量(台) 数量(台) 金額(百万円) 数量(台) 数量(台)
Quantity (n) (million yen) Quantity (n) Quantity (n) (million yen) Quantity (n) Quantity (n)
平成19年 (2007) 37,973 2,705 8,781 46,362 3,276 347 1,80920 (2008) 45,416 3,328 15,456 59,693 4,260 306 2,68221 (2009) 27,005 2,239 12,813 39,605 3,045 335 1,76122 (2010) 23,303 1,866 15,965 37,832 2,948 879 2,31823 (2011) 26,961 2,119 16,259 43,048 3,318 371 2,119
平成21年度 (09FY) 26,075 2,148 12,996 39,193 2,985 851 1,42322 (10FY) 24,266 1,934 16,710 39,688 3,128 436 2,275
平成23年 1~3月 (Q1) 5,263 416 4,066 9,238 730 134 2,2754~6 (Q2) 9,673 766 5,223 13,825 1,046 94 3,2527~9 (Q3) 7,379 576 4,309 11,828 891 104 3,008
10~12 (Q4) 4,646 361 2,661 8,157 651 39 2,119
平成23年 1月 (Jan) 1,206 92 1,269 2,009 160 29 2,7552 (Feb) 1,635 133 1,670 3,373 277 47 2,6403 (Mar) 2,422 191 1,127 3,856 293 58 2,2754 (Apr) 3,680 300 1,869 5,111 397 33 2,6805 (May) 3,260 252 1,939 4,787 345 41 3,0516 (Jun) 2,733 214 1,415 3,927 304 20 3,252
7 (Jul) 2,657 205 1,538 4,405 327 22 3,0208 (Aug) 2,311 178 1,450 3,806 284 62 2,9139 (Sep) 2,411 193 1,321 3,617 280 20 3,008
10 (Oct) 2,238 167 1,123 3,357 257 13 2,99911 (Nov) 1,232 99 947 2,674 218 12 2,49212 (Dec) 1,176 95 591 2,126 176 14 2,119
年 月Year and Month
190190

時系列表 (金属製品編) 製品
(6)粉末や金製品(超硬チップを除く)
重量(t) 金額(百万円) 重量(t) 金額(百万円) 重量(t) 金額(百万円) 重量(t) 金額(百万円) 重量(t) 金額(百万円)
Weight (million yen) Weight (million yen) Weight (million yen) Weight (million yen) Weight (million yen)
平成19年 (2007) 175,389 339,449 119,415 156,906 7,954 15,821 4,619 8,495 3,335 7,32520 (2008) 166,227 331,456 112,412 152,717 7,722 15,561 4,535 8,607 3,187 6,95521 (2009) 109,134 207,166 75,047 103,248 4,887 10,370 2,906 5,611 1,982 4,75922 (2010) 150,292 284,403 103,102 136,619 6,630 13,698 4,070 7,735 2,560 5,96323 (2011) 140,676 321,161 97,836 131,727 6,389 13,250 3,853 7,622 2,536 5,628
平成21年度 (09FY) 128,738 241,259 88,522 119,123 5,816 12,087 3,548 6,722 2,268 5,36522 (10FY) 148,488 285,672 101,716 135,291 6,564 13,536 4,006 7,708 2,558 5,828
平成23年 1~3月 (Q1) 35,205 71,140 24,164 32,316 1,603 3,240 982 1,901 621 1,3394~6 (Q2) 31,198 69,829 21,044 29,164 1,530 3,204 878 1,718 652 1,4867~9 (Q3) 36,548 81,234 26,009 34,884 1,618 3,390 972 1,934 646 1,456
10~12 (Q4) 37,725 98,957 26,618 35,363 1,638 3,416 1,021 2,069 618 1,347
平成23年 1月 (Jan) 11,419 23,095 7,888 10,553 507 1,009 314 605 193 4032 (Feb) 12,489 24,745 8,690 11,466 548 1,102 340 658 208 4453 (Mar) 11,298 23,300 7,586 10,297 548 1,129 328 638 220 4914 (Apr) 10,072 22,862 6,644 9,321 514 1,094 293 580 221 5155 (May) 9,252 21,128 6,085 8,551 457 942 263 515 194 4276 (Jun) 11,873 25,839 8,315 11,292 559 1,168 322 624 237 544
7 (Jul) 12,326 26,805 8,804 11,694 546 1,124 324 633 222 4908 (Aug) 11,284 25,886 7,990 10,847 500 1,047 296 588 204 4589 (Sep) 12,938 28,543 9,216 12,343 571 1,220 352 713 219 507
10 (Oct) 13,268 33,591 9,394 12,377 553 1,139 343 702 210 43611 (Nov) 12,501 33,242 8,800 11,765 562 1,178 346 706 216 47212 (Dec) 11,955 32,123 8,424 11,222 523 1,099 331 661 191 439
生産 Production 生産 Production 生産 Production 生産 Production 生産 Production
Sintered products Machine materials Bearings For transport equipment For others
Sintered products (excluding cemented carbide tips)
年 月Year and Month
粉末や金製品(1~9) 機械材料(1~5) 軸受合金(1~2) 輸送機械用(1) その他用の軸受合金(2)
191
重量(t) 金額(百万円) 重量(t) 金額(百万円) 重量(t) 金額(百万円) 重量(t) 金額(百万円) 重量(t) 金額(百万円)
Weight (million yen) Weight (million yen) Weight (million yen) Weight (million yen) Weight (million yen)
平成19年 (2007) 110,673 134,988 101,387 115,915 9,286 19,072 788 6,098 92 4,96720 (2008) 103,952 130,683 94,168 111,493 9,784 19,191 738 6,473 77 3,83221 (2009) 69,768 89,390 65,048 77,896 4,720 11,494 392 3,488 51 2,42622 (2010) 95,895 117,904 88,323 102,536 7,572 15,368 577 5,017 73 2,88723 (2011) 90,718 112,711 82,864 97,117 7,854 15,594 729 5,766 77 3,501
平成21年度 (09FY) 82,296 103,420 76,703 90,550 5,593 12,870 410 3,616 58 2,68722 (10FY) 94,512 116,425 86,788 100,822 7,724 15,604 640 5,329 75 2,832
平成23年 1~3月 (Q1) 22,378 27,671 20,453 23,853 1,925 3,818 183 1,404 19 7294~6 (Q2) 19,329 24,580 17,287 20,549 2,042 4,031 186 1,379 18 8877~9 (Q3) 24,210 30,033 22,199 25,964 2,011 4,069 181 1,461 20 968
10~12 (Q4) 24,801 30,426 22,925 26,751 1,876 3,676 179 1,521 19 916
平成23年 1月 (Jan) 7,324 9,096 6,719 7,883 605 1,212 57 449 6 2402 (Feb) 8,079 9,897 7,408 8,567 671 1,330 64 466 6 2363 (Mar) 6,976 8,679 6,327 7,403 649 1,276 62 490 7 2524 (Apr) 6,066 7,755 5,418 6,458 648 1,297 64 471 6 2815 (May) 5,573 7,189 4,919 5,930 654 1,259 55 420 5 2796 (Jun) 7,690 9,636 6,950 8,162 740 1,474 67 488 7 327
7 (Jul) 8,193 10,073 7,505 8,709 687 1,365 65 497 7 3468 (Aug) 7,437 9,363 6,799 8,026 638 1,336 52 438 6 2949 (Sep) 8,580 10,597 7,895 9,229 685 1,368 64 526 7 329
10 (Oct) 8,781 10,705 8,139 9,429 642 1,276 60 533 7 33211 (Nov) 8,176 10,077 7,562 8,840 614 1,237 62 510 7 32012 (Dec) 7,844 9,644 7,224 8,481 620 1,163 57 478 6 264
生産 Production 生産 Production 生産 Production 生産 Production 生産 Production
Machine parts For transport equipment For others Friction materialsSintered electric contact
materials年 月Year and Month
機械部品(3~4) 輸送機械用(3) その他用の機械部品(4) 摩擦材料(5) 電気接点(6)
191

時系列表 (金属製品編) 製品
(6)粉末や金製品(超硬チップを除く)
平成19年 (2007)20 (2008)21 (2009)22 (2010)23 (2011)
平成21年度 (09FY)22 (10FY)
平成23年 1~3月 (Q1)4~6 (Q2)7~9 (Q3)
10~12 (Q4)
平成23年 1月 (Jan)2 (Feb)3 (Mar)4 (Apr)5 (May)6 (Jun)
7 (Jul)8 (Aug)9 (Sep)
10 (Oct)11 (Nov)12 (Dec) 3,410 18,936 2,735 16,329
3,743 18,940 3,032 16,2913,571 19,249 2,874 16,535
3,176 12,909 2,362 9,9813,604 13,960 2,802 10,999
3,426 12,150 2,538 8,829
3,405 12,808 2,595 9,819
3,302 11,373 2,453 8,0163,061 10,529 2,204 7,208
3,670 11,072 2,808 8,0323,580 10,715 2,758 7,571
10,724 57,125 8,642 49,156
3,425 10,536 2,593 7,402
9,788 34,052 7,196 24,05210,185 39,677 7,758 30,799
45,505 125,641 33,811 84,056
10,675 32,323 8,159 23,005
41,372 163,176 31,755 127,012
39,110 100,170 29,854 64,540
33,082 84,818 24,966 53,39845,955 123,072 34,269 80,619
54,231 143,332 40,735 89,44551,946 141,177 39,142 91,743
生産 Production
重量(t) 金額(百万円) 重量(t) 金額(百万円)
Weight (million yen) Weight (million yen)
生産 Production
硬質(7)
Magnetic materials Hard magnetic materials
Sintered products (excluding cemented carbide tips)
年 月Year and Month
磁性材料(7~8)
192
平成19年 (2007)20 (2008)21 (2009)22 (2010)23 (2011)
平成21年度 (09FY)22 (10FY)
平成23年 1~3月 (Q1)4~6 (Q2)7~9 (Q3)
10~12 (Q4)
平成23年 1月 (Jan)2 (Feb)3 (Mar)4 (Apr)5 (May)6 (Jun)
7 (Jul)8 (Aug)9 (Sep)
10 (Oct)11 (Nov)12 (Dec)
675 2,606 116 1,702
710 2,649 125 1,942697 2,714 123 1,909
814 2,927 112 1,837802 2,961 112 1,911
887 3,321 126 2,070
810 2,989 110 1,957
849 3,357 120 1,887857 3,322 101 1,768
862 3,039 122 1,972822 3,144 125 2,036
2,082 7,969 363 5,553
832 3,134 99 1,766
2,593 10,000 347 5,7262,426 8,878 335 5,705
11,693 41,584 1,192 21,909
2,515 9,318 347 5,774
9,617 36,164 1,392 22,757
9,256 35,629 1,048 19,279
8,116 31,421 954 16,67311,686 42,454 1,162 21,825
(million yen)13,496 53,887 1,652 34,24312,804 49,433 1,792 33,730
生産 Production年 月
Year and Month
軟質(8)
重量(t) 金額(百万円) 重量(t) 金額(百万円)
Weight (million yen) Weight
生産 Production
その他の粉末や金製品(9)
Soft magnetic materials(超硬チップを除く)
Other sintered products
192

時系列表 (金属製品編) 製品
(7)鍛工品 Forgings from billets and bars
平成19年 (2007)20 (2008)21 (2009)22 (2010)23 (2011)
平成21年度 (09FY)22 (10FY)
平成23年 1~3月 (Q1)4~6 (Q2)7~9 (Q3)
10~12 (Q4)
平成23年 1月 (Jan)2 (Feb)3 (Mar)4 (Apr)5 (May)6 (Jun)
7 (Jul)8 (Aug)9 (Sep)
10 (Oct)11 (Nov)12 (Dec)
年 月Year and Month
584,510382,335338,618234,330
r 513,056
生産Production
消費Consumption
生産Production
金額(百万円)(million yen)
重量(t)Weight
重量(t)金額(百万円)(million yen)
2,605,8632,523,8751,439,829
532,215
r 426,254516,676
602,788378,506
127,635116,017141,161147,402
41,28845,60040,74736,46533,52146,031
48,48742,83149,84251,39449,454
r 2,086,4662,145,137
r 1,664,7712,112,250
520,295467,279566,280
198,938
591,283
168,157186,412165,726145,742
185,851135,686
194,385171,196200,699206,265
24,602
278,143
284,035303,499
65,72057,228
634,384652,873410,833
r 555,396574,913
26,814
75,36179,834
22,39325,377
49,662
27,01021,538
44,34839,883
27,29128,518
17,94917,13515,491
174,657
171,558189,964169,221149,084
r 461,868559,873
138,251126,287
36,742
鉄系(1~11)
Ferrous forgings
鍛工品(1~15)
Forgings from billets and bars
320,890
52,347
152,307158,068
44,72049,182
601,752
r 1,700,0712,155,769
530,743477,174
2,652,3212,569,7551,470,287
r 2,129,8632,186,874
49,859 24,025 186,080
重量(t)Weight
189,385
198,196
577,204
Weight
138,705
53,124
46,38653,57455,086
204,351209,876202,498189,378 46,553
193
重量(t)Weight
平成19年 (2007)20 (2008)21 (2009)22 (2010)23 (2011)
平成21年度 (09FY)22 (10FY)
平成23年 1~3月 (Q1)4~6 (Q2)7~9 (Q3)
10~12 (Q4)
平成23年 1月 (Jan)2 (Feb)3 (Mar)4 (Apr)5 (May)6 (Jun)
7 (Jul)8 (Aug)9 (Sep)
10 (Oct)11 (Nov)12 (Dec)
年 月Year and Month
産業機械・土木建設機械用(1)型鍛造品(1~3)熱間鍛造品(1~9)
Hot forgings
生産Production
生産Production
26,614
6,23541,008 135,247 35,276
160,521178,066158,752140,366
131,245
42,1657,186
6,983
47,309 158,985 40,752 25,77249,238
158,243 25,804
130,859178,421
186,387
40,81747,637163,796
145,278
154,953
497,339449,646542,482566,715
44,489
39,387
192,299197,977
178,221190,517
2,475,4282,401,9201,362,802
r 1,991,7202,056,182
r 1,577,3012,017,209
44,241
46,408
43,52138,87535,10132,244
111,586135,053141,036
509,458
r 405,058492,797
121,783
555,511574,860359,608
r 489,492
128,655110,985
405,919360,002448,443470,641
146,019
38,354
33,666
163,813
147,843
103,739
2,019,1531,933,2251,108,246
r 1,658,8491,685,005
r 1,319,5811,670,842
37,392
39,998
37,36732,76929,05326,798
93,243116,090121,271
434,405
r 347,612423,048
103,802
463,685471,547299,271
r 421,645
25,07422,887
22,37424,66025,12123,156
72,15571,14673,76575,169
7,327
6,399
5,959
22,783
21,64826,342
348,114345,324129,002
r 253,634292,235
r 151,075274,911
7,097
6,792
6,6226,7866,3625,955
19,41320,01120,913
79,704
r 43,69872,866
19,367
r 67,66338,978
78,76785,613
生産Production
For industrial machinery/engineering andconstruction machinery
Closed die forgings
重量(t)金額(百万円)Weight
重量(t)Weight
金額(百万円)(million yen)
金額(百万円)(million yen)(million yen)
193

時系列表 (金属製品編) 製品
(7)鍛工品 Forgings from billets and bars
重量(t) 金額(百万円) 重量(t) 金額(百万円) 重量(t) 金額(百万円)Weight (million yen) Weight (million yen) Weight (million yen)
平成19年 (2007) 1,547,634 347,030 123,405 37,887 139,052 33,75620 (2008) 1,459,695 344,676 128,206 41,257 137,876 35,75121 (2009) 904,975 231,977 74,269 28,316 86,182 24,11722 (2010) r 1,308,008 r 321,943 97,207 32,039 76,821 20,87623 (2011) 1,280,391 319,634 112,379 35,068 83,676 21,778
平成21年度 (09FY) r 1,089,584 r 275,241 78,922 28,674 77,259 21,57922 (10FY) 1,293,517 317,578 102,414 32,604 78,261 20,964
平成23年 1~3月 (Q1) 306,670 75,927 27,094 8,508 19,728 5,1794~6 (Q2) 261,652 64,995 27,204 8,834 21,094 5,5967~9 (Q3) 345,905 87,432 28,773 8,647 19,810 5,216
10~12 (Q4) 366,164 91,279 29,308 9,079 23,044 5,788
平成23年 1月 (Jan) 100,794 25,188 8,077 2,519 6,305 1,6372 (Feb) 112,072 27,884 9,287 2,860 6,902 1,7903 (Mar) 93,804 22,854 9,730 3,128 6,521 1,7514 (Apr) 78,379 19,483 9,450 3,208 7,198 1,9275 (May) 73,889 18,290 8,202 2,553 6,268 1,6456 (Jun) 109,384 27,222 9,552 3,073 7,628 2,024
7 (Jul) 120,158 30,341 9,721 2,865 6,855 1,8318 (Aug) 103,354 26,271 9,006 2,770 5,807 1,5029 (Sep) 122,393 30,821 10,046 3,013 7,148 1,883
10 (Oct) 127,229 31,698 9,970 3,139 7,885 1,94911 (Nov) 123,303 30,567 9,910 2,998 7,757 1,96712 (Dec) 115,632 29,014 9,428 2,941 7,402 1,871
年 月Year and Month
自由鍛造品(4~6)自動車用(2) その他用の型鍛造品(3)
生産Production
生産Production
For automobiles For others Open die forgings
生産Production
194
重量(t) 金額(百万円) 重量(t) 金額(百万円) 重量(t) 金額(百万円)Weight (million yen) Weight (million yen) Weight (million yen)
平成19年 (2007) 71,606 18,406 46,752 9,709 20,694 5,64020 (2008) 74,455 19,425 42,520 10,097 20,901 6,22821 (2009) 40,861 12,178 32,787 8,073 12,534 3,86622 (2010) 38,931 11,112 28,967 6,760 8,923 3,00423 (2011) 45,811 11,912 27,345 6,452 10,520 3,414
平成21年度 (09FY) 35,468 10,758 31,071 7,517 10,720 3,30422 (10FY) 41,108 11,338 27,478 6,412 9,675 3,214
平成23年 1~3月 (Q1) 10,833 2,825 6,038 1,441 2,857 9134~6 (Q2) 11,779 3,182 6,992 1,597 2,323 8177~9 (Q3) 10,484 2,772 6,890 1,665 2,436 779
10~12 (Q4) 12,715 3,133 7,425 1,749 2,904 905
平成23年 1月 (Jan) 3,586 920 1,843 439 876 2782 (Feb) 3,743 973 2,097 489 1,062 3283 (Mar) 3,504 932 2,098 513 919 3074 (Apr) 3,904 1,038 2,474 571 820 3185 (May) 3,609 985 1,947 415 712 2466 (Jun) 4,266 1,159 2,571 612 791 253
7 (Jul) 3,610 986 2,306 552 939 2938 (Aug) 3,070 783 2,066 500 671 2199 (Sep) 3,804 1,003 2,518 613 826 267
10 (Oct) 4,251 1,018 2,608 603 1,026 32811 (Nov) 4,222 1,067 2,455 577 1,080 32312 (Dec) 4,242 1,048 2,362 569 798 254
年 月Year and Month 生産
Production
For industrial machinery/engineering andconstruction machinery
産業機械・土木建設機械用(4) 輸送機械用(5) その他用の自由鍛造品(6)
For othersFor transport equipment
生産Production
生産Production
194

時系列表 (金属製品編) 製品
(7)鍛工品 Forgings from billets and bars
重量(t) 金額(百万円) 重量(t) 金額(百万円) 重量(t) 金額(百万円)Weight (million yen) Weight (million yen) Weight (million yen)
平成19年 (2007) 317,223 58,070 191,923 32,598 76,184 15,52820 (2008) 330,819 67,562 203,922 39,531 75,258 16,49621 (2009) 168,374 36,220 81,135 17,153 48,367 10,47322 (2010) 256,050 46,971 134,792 22,652 74,257 14,20223 (2011) 287,501 53,275 165,317 27,933 70,967 14,144
平成21年度 (09FY) 180,461 35,867 78,292 14,371 60,462 12,37122 (10FY) 268,106 48,786 148,086 24,551 72,153 13,953
平成23年 1~3月 (Q1) 71,692 12,803 42,021 6,808 17,435 3,3704~6 (Q2) 68,550 12,747 41,262 7,014 14,997 2,9977~9 (Q3) 74,229 13,747 42,148 7,078 19,345 3,872
10~12 (Q4) 73,030 13,978 39,886 7,034 19,190 3,905
平成23年 1月 (Jan) 22,971 4,084 13,477 2,188 5,687 1,0892 (Feb) 25,145 4,364 14,907 2,295 6,483 1,2603 (Mar) 23,576 4,355 13,637 2,325 5,265 1,0214 (Apr) 22,183 4,122 13,518 2,294 4,819 9755 (May) 20,852 3,800 13,230 2,207 3,816 7556 (Jun) 25,515 4,825 14,514 2,513 6,362 1,266
7 (Jul) 24,579 4,579 13,861 2,340 6,502 1,3028 (Aug) 22,742 4,231 12,887 2,180 5,983 1,2109 (Sep) 26,908 4,937 15,400 2,557 6,860 1,359
10 (Oct) 26,279 5,124 14,416 2,561 6,882 1,46911 (Nov) 23,775 4,590 12,915 2,353 6,287 1,24412 (Dec) 22,976 4,264 12,555 2,120 6,021 1,192
その他用のリングロール品(9) 冷間鍛造品(10~11) 自動車用(10)
生産Production
Ring rolling年 月
Year and Month
リングロール品(7~9) 産業機械・土木建設機械用(7) 自動車用(8)
For industrial machinery/engineering andconstruction machinery
For automobiles
生産Production
生産Production
195
重量(t) 金額(百万円) 重量(t) 金額(百万円) 重量(t) 金額(百万円)Weight (million yen) Weight (million yen) Weight (million yen)
平成19年 (2007) 49,116 9,944 130,435 28,999 108,607 25,03820 (2008) 51,639 11,535 121,955 27,928 101,394 24,16621 (2009) 38,872 8,595 77,027 18,897 62,551 16,19722 (2010) 47,001 10,117 94,746 23,563 78,615 20,71023 (2011) 51,217 11,198 88,955 22,757 72,024 19,761
平成21年度 (09FY) 41,707 9,125 87,470 21,196 72,567 18,47822 (10FY) 47,867 10,282 95,041 23,878 77,752 20,837
平成23年 1~3月 (Q1) 12,236 2,625 22,956 5,851 18,181 5,0144~6 (Q2) 12,291 2,737 17,633 4,431 13,825 3,7547~9 (Q3) 12,736 2,797 23,798 6,108 19,957 5,427
10~12 (Q4) 13,954 3,038 24,568 6,366 20,061 5,567
平成23年 1月 (Jan) 3,807 808 7,636 1,901 6,107 1,6282 (Feb) 3,755 809 8,346 2,079 6,701 1,7933 (Mar) 4,674 1,009 6,974 1,872 5,373 1,5924 (Apr) 3,846 853 5,376 1,364 3,959 1,1175 (May) 3,806 838 4,827 1,277 3,659 1,0676 (Jun) 4,639 1,046 7,430 1,790 6,207 1,569
7 (Jul) 4,216 937 7,998 2,080 6,733 1,8518 (Aug) 3,872 840 7,400 1,823 6,256 1,6209 (Sep) 4,648 1,021 8,400 2,205 6,968 1,956
10 (Oct) 4,981 1,094 8,288 2,156 6,790 1,88911 (Nov) 4,573 992 8,421 2,146 6,838 1,86712 (Dec) 4,400 952 7,859 2,065 6,433 1,811
生産Production
生産Production
年 月Year and Month
その他用のリングロール品(9) 冷間鍛造品(10~11) 自動車用(10)
For others Cold forgings For automobiles
生産Production
195

時系列表 (金属製品編) 製品
(7)鍛工品 Forgings from billets and bars
重量(t) 金額(百万円) 重量(t) 金額(百万円) 重量(t) 金額(百万円) 重量(t) 金額(百万円)Weight (million yen) Weight (million yen) Weight (million yen) Weight (million yen)
平成19年 (2007) 21,828 3,961 46,458 49,875 31,201 35,411 24,725 24,52220 (2008) 20,561 3,762 45,880 50,085 31,111 36,161 24,793 25,05721 (2009) 14,476 2,700 30,458 32,327 20,622 23,094 16,309 14,51422 (2010) 16,131 2,854 43,397 42,340 28,651 29,964 22,562 19,30923 (2011) 16,931 2,995 41,737 42,698 27,398 30,646 21,812 18,790
平成21年度 (09FY) 14,903 2,718 35,300 35,614 23,931 25,383 19,251 16,75822 (10FY) 17,289 3,041 43,519 43,198 28,719 30,805 22,397 19,211
平成23年 1~3月 (Q1) 4,775 838 10,448 10,616 6,781 7,578 5,143 4,4384~6 (Q2) 3,808 677 9,895 10,270 6,393 7,350 4,808 4,1487~9 (Q3) 3,841 681 10,924 11,146 7,330 8,181 6,023 5,220
10~12 (Q4) 4,507 799 10,469 10,666 6,893 7,536 5,839 4,985
平成23年 1月 (Jan) 1,529 273 3,401 3,432 2,199 2,446 1,708 1,4902 (Feb) 1,645 286 3,552 3,583 2,322 2,546 1,795 1,5203 (Mar) 1,601 280 3,495 3,602 2,260 2,586 1,640 1,4284 (Apr) 1,417 247 3,342 3,418 2,146 2,419 1,583 1,3465 (May) 1,168 209 3,019 3,221 1,936 2,304 1,437 1,2626 (Jun) 1,223 221 3,534 3,631 2,311 2,626 1,788 1,540
7 (Jul) 1,265 229 3,811 3,860 2,611 2,874 2,151 1,8338 (Aug) 1,144 203 3,461 3,555 2,292 2,606 1,863 1,6199 (Sep) 1,432 249 3,652 3,731 2,427 2,701 2,009 1,767
10 (Oct) 1,498 267 3,611 3,691 2,408 2,644 2,029 1,72511 (Nov) 1,583 279 3,560 3,669 2,392 2,624 2,032 1,73212 (Dec) 1,426 254 3,298 3,306 2,094 2,268 1,778 1,527
その他用の冷間鍛造品(15)その他用の熱間鍛造品(13) 冷間鍛造品(14~15) 自動車用(14)
生産Production
生産Production
生産Production
生産Production
For others Aluminum forgings Hot forgings For automobiles
その他用の冷間鍛造品(11) アルミニウム系(12~15) 熱間鍛造品(12~13) 自動車用(12)
年 月Year and Month
196
その他用の冷間鍛造品(15)
For others
重量(t) 金額(百万円) 重量(t) 金額(百万円) 重量(t) 金額(百万円) 重量(t) 金額(百万円)Weight (million yen) Weight (million yen) Weight (million yen) Weight (million yen)
平成19年 (2007) 6,476 10,889 15,257 14,464 8,688 8,477 6,569 5,98620 (2008) 6,318 11,104 14,770 13,924 8,233 8,114 6,537 5,81021 (2009) 4,313 8,580 9,837 9,234 5,661 5,473 4,175 3,76122 (2010) 6,089 10,655 14,746 12,376 7,470 7,143 7,276 5,23323 (2011) 5,586 11,855 14,339 12,053 7,981 7,347 6,358 4,706
平成21年度 (09FY) 4,680 8,625 11,369 10,232 6,248 6,000 5,121 4,23222 (10FY) 6,322 11,594 14,800 12,392 7,629 7,238 7,172 5,154
平成23年 1~3月 (Q1) 1,639 3,140 3,667 3,038 1,906 1,773 1,761 1,2654~6 (Q2) 1,586 3,202 3,502 2,920 1,850 1,741 1,652 1,1797~9 (Q3) 1,307 2,961 3,594 2,965 1,989 1,810 1,605 1,156
10~12 (Q4) 1,055 2,552 3,576 3,130 2,236 2,023 1,340 1,106
平成23年 1月 (Jan) 491 956 1,202 986 619 571 583 4152 (Feb) 527 1,026 1,230 1,037 648 616 582 4213 (Mar) 621 1,158 1,235 1,016 639 586 596 4294 (Apr) 564 1,073 1,196 999 645 613 551 3865 (May) 499 1,043 1,083 917 562 539 521 3786 (Jun) 523 1,086 1,223 1,004 643 590 580 415
7 (Jul) 460 1,041 1,200 986 663 605 537 3818 (Aug) 429 987 1,170 949 616 556 554 3939 (Sep) 419 934 1,225 1,030 710 649 515 382
10 (Oct) 379 919 1,204 1,047 733 666 471 38111 (Nov) 360 892 1,169 1,045 753 686 415 35912 (Dec) 316 741 1,204 1,038 750 672 454 366
生産Production
生産Production
生産Production
生産Production
For others Cold forgings For automobiles 年 月
Year and Month
その他用の熱間鍛造品(13) 冷間鍛造品(14~15) 自動車用(14)
196

時系列表 (金属製品編) 製品
(8)銑鉄鋳物
Iron castings
平成19年 (2007)20 (2008)21 (2009)22 (2010)23 (2011)
平成21年度 (09FY)22 (10FY)
平成23年 1~3月 (Q1)4~6 (Q2)7~9 (Q3)
10~12 (Q4)
平成23年 1月 (Jan)2 (Feb)3 (Mar)4 (Apr)5 (May)6 (Jun)
7 (Jul)8 (Aug)9 (Sep)
10 (Oct)11 (Nov)12 (Dec) 306,018 64,485 95,857 212,644 88,835
324,364 68,471 100,794 222,024 90,584334,581 69,793 107,252 226,996 86,972337,234 72,791 105,905 227,113 87,255287,752 62,451 91,020 197,045 87,994316,983 67,871 101,365 215,631 87,520
309,187 66,257 95,516 214,242 85,214223,304 49,657 52,512 171,323 85,046251,241 52,076 78,782 169,695 89,250256,550 52,873 74,997 179,267 84,833302,765 61,089 96,971 206,059 87,694278,369 56,032 87,792 188,990 93,031
964,963 202,749 303,903 661,664 88,835941,969 203,113 298,290 639,789 87,255783,732 167,990 226,810 555,260 85,214837,684 169,994 259,760 574,316 84,833
3,471,759 728,225 1,104,101 2,372,575 84,8332,913,849 604,384 1,022,885 1,909,293 85,553
3,528,348 743,846 1,088,763 2,431,029 88,8353,469,408 735,642 1,130,639 2,349,421 95,0842,614,427 546,918 907,034 1,739,409 85,1824,314,694 910,269 1,260,718 3,062,505 111,6834,483,800 870,056 1,321,228 3,168,762 117,631
Weight (million yen) Weight Weight Weight重量(t) 金額(百万円) 重量(t) 重量(t) 重量(t)
販売Sales
在庫Inventory
年 月Year and Month
銑鉄鋳物(1~12)
生産Production
消費Consumption
Iron castings
197
平成19年 (2007)20 (2008)21 (2009)22 (2010)23 (2011)
平成21年度 (09FY)22 (10FY)
平成23年 1~3月 (Q1)4~6 (Q2)7~9 (Q3)
10~12 (Q4)
平成23年 1月 (Jan)2 (Feb)3 (Mar)4 (Apr)5 (May)6 (Jun)
7 (Jul)8 (Aug)9 (Sep)
10 (Oct)11 (Nov)12 (Dec) 85,783 21,186 46,246 10,714 11,254 2,184
91,118 22,368 49,285 11,458 12,008 2,34789,086 22,054 47,127 11,147 11,441 2,26892,334 22,464 49,810 11,496 12,276 2,38582,347 20,293 44,345 10,253 10,602 2,05987,371 21,682 46,726 10,839 10,594 2,072
93,243 22,807 49,221 11,309 11,981 2,28080,936 19,796 43,147 9,864 10,291 1,99784,907 20,872 46,026 10,599 10,858 2,08286,758 20,853 46,687 10,697 11,643 2,13384,854 20,447 45,898 10,514 10,837 1,99379,288 19,114 42,477 9,525 9,735 1,834
265,987 65,608 142,658 33,319 34,703 6,799262,052 64,439 140,881 32,588 33,472 6,516259,086 63,475 138,394 31,772 33,130 6,359250,900 60,414 135,062 30,736 32,215 5,960
972,057 251,189 521,507 120,426 113,833 21,420681,030 186,386 361,892 84,957 65,870 13,470
1,038,025 253,936 556,995 128,415 133,520 25,634924,585 247,675 496,479 115,561 101,725 19,369636,799 175,034 331,946 78,712 66,384 13,456
1,266,421 319,500 669,603 152,390 170,673 34,8651,317,589 303,222 688,706 147,043 183,212 34,912
Weight (million yen) Weight (million yen) Weight (million yen)重量(t) 金額(百万円) 重量(t) 金額(百万円) 重量(t)
生産Production
生産Production
生産Production
For general/electrical machinery For industrial machine parts For metal cutting/forming machinery年 月
Year and Month
一般・電気機械用(1~3・7~9) 産業機械器具用(1・7) 金属工作・加工機械用(2・8)
金額(百万円)
197197

時系列表 (金属製品編) 製品
(8)銑鉄鋳物
Iron castings
重量(t) 重量(t) 金額(百万円) 金額(百万円)Weight Weight (million yen) (million yen)
平成19年 (2007) 445,671 2,969,120 517,883 469,20320 (2008) 426,145 2,859,732 540,219 485,76321 (2009) 238,469 1,844,596 336,088 305,27022 (2010) 326,381 2,398,466 448,829 408,34623 (2011) 347,510 2,327,989 444,873 393,405
平成21年度 (09FY) 253,268 2,100,667 382,781 351,00922 (10FY) 336,717 2,348,178 436,417 393,585
平成23年 1~3月 (Q1) 83,623 547,975 99,124 87,8614~6 (Q2) 87,562 484,670 93,733 81,2047~9 (Q3) 87,699 639,113 126,564 112,980
10~12 (Q4) 88,626 656,231 125,452 111,360
平成23年 1月 (Jan) 27,076 186,702 33,655 29,8142 (Feb) 28,119 204,318 36,989 33,1953 (Mar) 28,428 156,955 28,480 24,8524 (Apr) 28,023 152,736 27,559 23,5885 (May) 27,498 130,110 26,518 22,5826 (Jun) 32,041 201,824 39,656 35,034
7 (Jul) 30,051 215,910 42,393 38,1338 (Aug) 27,400 192,809 37,722 33,8189 (Sep) 30,248 230,394 46,449 41,029
10 (Oct) 30,518 230,723 43,729 39,09711 (Nov) 29,825 218,244 42,042 37,20312 (Dec) 28,283 207,264 39,681 35,0608,288 184,364
194,1168,5638,639 207,5258,583 204,1357,981 173,337
194,3478,771
9,218 178,7447,935 110,2818,191 132,895
138,3418,0237,940 184,8087,755 167,237
25,490 586,005571,81925,335
25,344 421,92023,718 490,386
109,343 2,126,7501,935,90787,959
99,887 2,070,130112,745 2,188,82582,866 1,685,064
2,552,394132,245121,267 2,664,277
Weight(million yen)金額(百万円) 重量(t)
生産Production
生産Production
生産Production
年 月Year and Month
その他の一般・電気機械用(3・9) 輸送機械用(4・5・10・11) 自動車用(4・10)
For other general/electrical machinery For transport equipment For automobiles
198
平成19年 (2007)20 (2008)21 (2009)22 (2010)23 (2011)
平成21年度 (09FY)22 (10FY)
平成23年 1~3月 (Q1)4~6 (Q2)7~9 (Q3)
10~12 (Q4)
平成23年 1月 (Jan)2 (Feb)3 (Mar)4 (Apr)5 (May)6 (Jun)
7 (Jul)8 (Aug)9 (Sep)
10 (Oct)11 (Nov)12 (Dec) 22,900 4,621 12,971 3,618
24,128 4,839 15,002 4,06123,198 4,632 14,772 4,01026,259 5,420 14,506 3,87819,472 3,904 12,596 4,43621,563 4,260 13,702 3,796
23,080 4,622 14,120 3,79419,829 3,936 12,258 3,34319,841 3,971 13,598 3,64518,614 3,628 12,837 3,54019,510 3,794 13,593 3,65319,465 3,841 12,379 3,263
70,226 14,092 42,745 11,68967,294 13,584 40,804 12,11062,750 12,529 39,976 10,78257,589 11,263 38,809 10,456
221,428 42,832 151,524 40,619164,760 31,772 132,152 35,217
257,859 51,468 162,334 45,037209,641 40,483 146,357 39,138159,532 30,818 133,032 35,796307,338 54,456 188,541 50,550304,843 48,680 197,091 48,951
(million yen) Weight (million yen)重量(t) 金額(百万円)
生産Production
生産Production
For other transport equipment For others年 月
Year and Month
その他の輸送機械用(5・11)
重量(t) 金額(百万円)Weight
その他用の銑鉄鋳物(6・12)
198198

時系列表 (金属製品編) 製品
(8)銑鉄鋳物
Iron castings
平成19年 (2007)20 (2008)21 (2009)22 (2010)23 (2011)
平成21年度 (09FY)22 (10FY)
平成23年 1~3月 (Q1)4~6 (Q2)7~9 (Q3)
10~12 (Q4)
平成23年 1月 (Jan)2 (Feb)3 (Mar)4 (Apr)5 (May)6 (Jun)
7 (Jul)8 (Aug)9 (Sep)
10 (Oct)11 (Nov)12 (Dec)
52,447187,684 35,845 64,222 126,109199,319 38,455 68,614 131,159 53,529
71,553 134,717 52,341206,312 39,21041,100 70,844 133,926 53,040208,478
177,615 34,844 61,012 118,343 52,824196,748 38,938 68,329 128,627 53,399
65,592 128,911 51,641193,947 38,09429,237 39,349 101,952 51,330141,566
155,985 30,807 55,073 101,794 52,115157,107 30,629 50,872 105,041 52,192
65,343 121,945 53,963186,812 35,87332,847 58,664 111,514 55,328171,240
593,315 113,510 204,389 391,985 52,447582,841 114,882 200,185 380,896 53,040
160,014 332,657 51,641491,498 98,13899,349 174,879 338,500 52,192515,159
2,153,579 438,420 743,899 1,417,091 52,1921,827,961 371,225 685,357 1,151,111 48,672
739,467 1,444,038 52,4472,182,813 425,879447,962 760,535 1,406,856 54,5512,157,514
1,653,901 338,476 613,265 1,055,898 48,6362,753,476 562,487 872,735 1,885,712 59,099
66,9662,856,064 522,811 912,829 1,940,581
Weight (million yen) Weight Weight Weight重量(t) 重量(t) 重量(t)
消費Consumption
販売Sales
在庫Inventory
年 月Year and Month
銑鉄鋳物(除く、球状黒鉛鋳鉄)(1~6)
重量(t) 金額(百万円)
生産Production
Iron castings (excluding ductile iron castings)
199
平成19年 (2007)20 (2008)21 (2009)22 (2010)23 (2011)
平成21年度 (09FY)22 (10FY)
平成23年 1~3月 (Q1)4~6 (Q2)7~9 (Q3)
10~12 (Q4)
平成23年 1月 (Jan)2 (Feb)3 (Mar)4 (Apr)5 (May)6 (Jun)
7 (Jul)8 (Aug)9 (Sep)
10 (Oct)11 (Nov)12 (Dec) 26,245 5,945 10,272 1,99054,092 13,275
27,935 6,333 11,043 2,15557,677 13,95227,171 6,320 10,486 2,07456,957 14,08628,265 6,346 11,396 2,20558,474 14,13825,569 5,782 9,808 1,89852,799 12,98627,066 6,160 9,792 1,91056,478 14,022
28,135 6,406 11,153 2,10559,932 14,64324,814 5,638 9,509 1,83451,715 12,71926,925 6,024 10,064 1,92454,878 13,43426,708 6,025 10,624 1,92855,580 13,19225,508 5,770 9,848 1,79753,066 12,77123,398 5,207 8,909 1,66549,227 11,979
81,351 18,598 31,801 6,219168,726 41,31380,900 18,288 30,996 6,013167,751 41,14679,874 18,068 30,726 5,863166,525 40,79675,614 17,002 29,381 5,390157,873 37,942
293,664 67,901 104,178 19,411614,919 162,847207,426 48,996 58,802 11,912438,005 124,812
317,739 71,956 122,904 23,485660,875 161,197280,147 65,771 93,283 17,590586,391 162,973192,738 45,930 58,993 11,772415,548 118,189399,615 89,399 158,041 31,840837,627 212,713413,706 85,392 171,059 31,595868,741 198,064
(million yen) Weight (million yen)Weight (million yen) Weight重量(t) 金額(百万円) 重量(t) 金額(百万円)
生産Production
生産Production
生産Production
For general/electrical machinery For industrial machine parts For metal cutting/forming machinery
一般・電気機械用(1~3) 産業機械器具用(1) 金属工作・加工機械用(2)
金額(百万円) 重量(t)
年 月Year and Month
199199

時系列表 (金属製品編) 製品
(8)銑鉄鋳物
Iron castings
重量(t) 重量(t) 金額(百万円) 金額(百万円)Weight Weight (million yen) (million yen)
平成19年 (2007) 283,976 1,908,439 305,648 275,08520 (2008) 279,971 1,836,656 329,067 295,11821 (2009) 163,817 1,185,703 206,554 185,59222 (2010) 212,961 1,510,881 269,695 247,18623 (2011) 220,232 1,456,472 247,276 220,366
平成21年度 (09FY) 171,777 1,338,037 233,262 212,95422 (10FY) 217,077 1,476,313 259,531 236,137
平成23年 1~3月 (Q1) 52,878 341,357 57,307 51,3344~6 (Q2) 55,925 308,663 53,057 46,4997~9 (Q3) 55,855 398,573 69,190 61,896
10~12 (Q4) 55,574 407,879 67,722 60,637
平成23年 1月 (Jan) 16,920 116,704 19,557 17,6032 (Feb) 17,710 128,104 21,659 19,6293 (Mar) 18,248 96,549 16,091 14,1024 (Apr) 17,889 95,504 15,894 13,7965 (May) 17,392 84,886 15,189 13,1166 (Jun) 20,644 128,273 21,974 19,587
7 (Jul) 19,620 134,599 23,353 21,1298 (Aug) 17,422 119,750 20,338 18,3449 (Sep) 18,813 144,224 25,499 22,423
10 (Oct) 19,300 143,654 23,609 21,21611 (Nov) 18,699 135,854 22,999 20,57412 (Dec) 17,575 128,371 21,114 18,847
5,340 114,8105,464 121,3805,692 129,4645,587 127,062
107,8395,3065,952 121,331
6,132 113,9865,247 72,555
83,1395,4865,239 84,4475,204 115,6375,107 104,805
365,65416,49616,845 356,23216,865 269,68015,550 304,889
1,333,26975,53563,904 1,218,740
65,756 1,296,45579,612 1,373,796
1,065,05960,48791,474 1,609,57981,077 1,678,437
(million yen) Weight金額(百万円) 重量(t)
生産Production
生産Production
輸送機械用(4・5) 自動車用(4)
生産Production
年 月Year and Month
その他の一般・電気機械用(3)
For transport equipment For autmobilesFor other general/electrical machinery
200
平成19年 (2007)20 (2008)21 (2009)22 (2010)23 (2011)
平成21年度 (09FY)22 (10FY)
平成23年 1~3月 (Q1)4~6 (Q2)7~9 (Q3)
10~12 (Q4)
平成23年 1月 (Jan)2 (Feb)3 (Mar)4 (Apr)5 (May)6 (Jun)
7 (Jul)8 (Aug)9 (Sep)
10 (Oct)11 (Nov)12 (Dec) 1,45613,561 2,267 5,221
5,788 1,50414,474 2,4255,701 1,51514,190 2,3935,780 1,46317,162 3,0765,066 1,52011,911 1,9945,671 1,56313,268 2,224
5,742 1,47714,287 2,3874,965 1,32912,331 2,0735,603 1,47912,365 2,0984,978 1,34612,102 1,9895,642 1,44312,467 2,0305,309 1,31111,899 1,954
16,710 4,47542,225 7,08516,517 4,54642,341 7,29416,310 4,28538,983 6,55815,929 4,10036,468 5,973
62,347 16,042143,044 23,39451,919 13,151119,297 20,308
65,466 17,406160,017 26,91060,242 15,294137,085 22,50952,650 13,733120,644 20,96279,193 20,707227,077 33,94978,884 19,099230,002 30,563
(million yen)Weight (million yen) Weight重量(t) 金額(百万円)重量(t) 金額(百万円)
生産Production
For other transport equipment年 月
Year and Month
その他の輸送機械用(5) その他用の銑鉄鋳物(6)
For others
生産Production
200200

時系列表 (金属製品編) 製品
(8)銑鉄鋳物
Iron castings
平成19年 (2007)20 (2008)21 (2009)22 (2010)23 (2011)
平成21年度 (09FY)22 (10FY)
平成23年 1~3月 (Q1)4~6 (Q2)7~9 (Q3)
10~12 (Q4)
平成23年 1月 (Jan)2 (Feb)3 (Mar)4 (Apr)5 (May)6 (Jun)
7 (Jul)8 (Aug)9 (Sep)
10 (Oct)11 (Nov)12 (Dec) 86,535 36,388118,334 28,640 31,635
37,055125,045 30,016 32,180 90,86530,583 35,699 92,279 34,631128,269
128,756 31,691 35,061 93,187 34,215110,137 27,607 30,008 78,702 35,170
34,121120,235 28,933 33,036 87,004
28,163 29,924 85,331 33,573115,24081,738 20,420 13,163 69,371 33,71695,256 21,269 23,709 67,901 37,135
32,64199,443 22,244 24,125 74,22625,216 31,628 84,114 33,731115,953
107,129 23,185 29,128 77,476 37,703
371,648 89,239 99,514 269,679 36,38834,215359,128 88,231 98,105 258,893
69,852 66,796 222,603 33,573292,234322,525 70,645 84,881 235,816 32,641
1,318,180 289,805 360,202 955,484 32,64136,8811,085,888 233,159 337,528 758,182
317,967 349,296 986,991 36,3881,345,5351,311,894 287,680 370,104 942,565 40,533
960,526 208,442 293,769 683,511 36,54652,5841,561,218 347,782 387,983 1,176,793
1,228,181 50,6651,627,736 347,245 408,399
WeightWeight (million yen) Weight Weight金額(百万円) 重量(t) 重量(t) 重量(t)重量(t)
生産Production
消費Consumption
販売Sales
在庫Inventory
年 月Year and Month
球状黒鉛鋳鉄(7~12)
Ductile iron castings
201
平成19年 (2007)20 (2008)21 (2009)22 (2010)23 (2011)
平成21年度 (09FY)22 (10FY)
平成23年 1~3月 (Q1)4~6 (Q2)7~9 (Q3)
10~12 (Q4)
平成23年 1月 (Jan)2 (Feb)3 (Mar)4 (Apr)5 (May)6 (Jun)
7 (Jul)8 (Aug)9 (Sep)
10 (Oct)11 (Nov)12 (Dec) 19431,691 7,911 20,001 4,769 982
965 19233,441 8,416 21,350 5,125955 19432,129 7,968 19,956 4,827880 18033,860 8,326 21,545 5,150794 16129,548 7,307 18,776 4,471802 16230,893 7,660 19,660 4,679
828 17533,311 8,164 21,086 4,903782 16329,221 7,077 18,333 4,226794 15830,029 7,438 19,101 4,575
1,019 20531,178 7,661 19,979 4,672989 19631,788 7,676 20,390 4,744826 16930,061 7,135 19,079 4,318
2,902 58097,261 24,295 61,307 14,7212,476 50394,301 23,293 59,981 14,3002,404 49692,561 22,679 58,520 13,7042,834 57093,027 22,472 59,448 13,734
9,655 2,009357,138 88,342 227,843 52,5257,068 1,558243,025 61,574 154,466 35,961
10,616 2,149377,150 92,739 239,256 56,4598,442 1,779338,194 84,702 216,332 49,7907,391 1,684221,251 56,845 139,208 32,782
12,632 3,025428,794 106,787 269,988 62,99112,153 3,317448,848 105,158 275,000 61,651
Weight (million yen) Weight (million yen) Weight重量(t)
年 月Year and Month
一般・電気機械用(7~9) 産業機械器具用(7) 金属工作・加工機械用(8)
金額(百万円)(million yen)
生産Production
生産Production
重量(t) 金額(百万円) 重量(t) 金額(百万円)
生産Production
For general/electrical machinery For industrial machine parts For metal cutting/forming machinery
201201

時系列表 (金属製品編) 製品
(8)銑鉄鋳物
Iron castings
重量(t) 重量(t) 金額(百万円) 金額(百万円)Weight Weight (million yen) (million yen)
平成19年 (2007) 161,695 1,060,681 212,235 194,11820 (2008) 146,174 1,023,076 211,152 190,64521 (2009) 74,652 658,893 129,534 119,67822 (2010) 113,420 887,585 179,134 161,16023 (2011) 127,278 871,517 197,597 173,039
平成21年度 (09FY) 81,491 762,630 149,519 138,05522 (10FY) 119,640 871,865 176,886 157,448
平成23年 1~3月 (Q1) 30,745 206,618 41,817 36,5274~6 (Q2) 31,637 176,007 40,676 34,7057~9 (Q3) 31,844 240,540 57,374 51,084
10~12 (Q4) 33,052 248,352 57,730 50,723
平成23年 1月 (Jan) 10,156 69,998 14,098 12,2112 (Feb) 10,409 76,214 15,330 13,5663 (Mar) 10,180 60,406 12,389 10,7504 (Apr) 10,134 57,232 11,665 9,7925 (May) 10,106 45,224 11,329 9,4666 (Jun) 11,397 73,551 17,682 15,447
7 (Jul) 10,431 81,311 19,040 17,0048 (Aug) 9,978 73,059 17,384 15,4749 (Sep) 11,435 86,170 20,950 18,606
10 (Oct) 11,218 87,069 20,120 17,88111 (Nov) 11,126 82,390 19,043 16,62912 (Dec) 10,708 78,893 18,567 16,2132,948 69,554
3,099 72,7362,947 78,061
77,0732,9962,675 65,4982,819 73,016
3,086 64,75837,7262,688
2,705 49,7562,784 53,8942,736 69,171
62,4322,648
8,994 220,3518,490 215,5878,479 152,240
185,4978,168
33,808 793,48124,055 717,167
34,131 773,675815,02933,133
22,379 620,00540,771 942,81540,190 985,840
(million yen)
年 月Year and Month
その他の一般・電気機械用(9)
Weight金額(百万円) 重量(t)
生産Production
生産Production
生産Production
輸送機械用(10・11) 自動車用(10)
For other general/electrical machinery For transport equipment For autmobiles
202
平成19年 (2007)20 (2008)21 (2009)22 (2010)23 (2011)
平成21年度 (09FY)22 (10FY)
平成23年 1~3月 (Q1)4~6 (Q2)7~9 (Q3)
10~12 (Q4)
平成23年 1月 (Jan)2 (Feb)3 (Mar)4 (Apr)5 (May)6 (Jun)
7 (Jul)8 (Aug)9 (Sep)
10 (Oct)11 (Nov)12 (Dec) 9,339 2,354 7,750 2,162
9,654 2,414 9,214 2,5579,008 2,239 9,071 2,4959,097 2,344 8,726 2,4157,561 1,910 7,530 2,9168,295 2,036 8,031 2,233
8,793 2,235 8,378 2,3177,498 1,863 7,293 2,0147,476 1,873 7,995 2,1666,512 1,639 7,859 2,1947,043 1,764 7,951 2,2107,566 1,887 7,070 1,952
28,001 7,007 26,035 7,21424,953 6,290 24,287 7,56423,767 5,971 23,666 6,49721,121 5,290 22,880 6,356
78,384 19,438 89,177 24,57745,463 11,464 80,233 22,066
97,842 24,558 96,868 27,63172,556 17,974 86,115 23,84438,888 9,856 80,382 22,06380,261 20,507 109,348 29,84374,841 18,117 118,207 29,852
Weight (million yen) Weight
年 月Year and Month
その他の輸送機械用(11)
(million yen)重量(t) 金額(百万円) 重量(t) 金額(百万円)
生産Production
生産Production
For others
その他用の球状黒鉛鋳鉄(12)
For other transport equipment
202202

時系列表 (金属製品編) 製品
(9)可鍛鋳鉄及び精密鋳造品 Malleable iron castings and precision castings
生産 消費 生産
Production Consumption Production
重量(t) 金額(百万円) 重量(t) 重量(kg) 金額(百万円)
Weight (million yen) Weight Weight (million yen)
平成19年 (2007) 53,294 25,278 48,147 593,950 15,33520 (2008) 48,082 23,196 43,007 759,732 19,78621 (2009) 37,235 18,058 33,045 844,073 22,01122 (2010) 39,057 18,482 35,191 682,094 18,25523 (2011) 39,513 18,705 36,048 633,307 16,254
平成21年度 (09FY) 37,643 18,105 33,509 817,500 21,53922 (10FY) 39,717 18,760 35,691 652,450 17,029
平成23年 1~3月 (Q1) 10,380 4,959 9,295 152,744 3,6784~6 (Q2) 10,907 5,278 9,839 160,113 4,1677~9 (Q3) 8,431 3,850 7,627 159,620 4,221
10~12 (Q4) 9,795 4,619 9,287 160,830 4,189
平成23年 1月 (Jan) 3,206 1,499 2,882 48,722 1,2422 (Feb) 3,200 1,532 2,817 59,083 1,2563 (Mar) 3,974 1,927 3,596 44,939 1,1804 (Apr) 4,001 1,941 3,613 55,857 1,4655 (May) 3,327 1,647 2,979 48,181 1,2146 (Jun) 3,579 1,689 3,247 56,075 1,488
7 (Jul) 2,925 1,331 2,587 47,157 1,1838 (Aug) 2,786 1,266 2,475 47,773 1,2829 (Sep) 2,720 1,253 2,565 64,690 1,757
10 (Oct) 3,138 1,502 2,979 55,212 1,41111 (Nov) 3,416 1,612 3,253 52,959 1,41512 (Dec) 3,241 1,504 3,055 52,659 1,363
自動車用( ) 航空機 武器用( ) そ 他用 精密鋳造品( )般機械用( )
610,188 4,679613,006 4,328548,872 4,256
574,869 4,332562,553 4,416593,423 4,854
480,402 3,959564,531 4,592
480,616 4,098541,968 4,150530,396 4,477
1,772,066 13,263
480,970 4,123
1,503,554 12,3711,575,329 13,0281,730,845 13,602
4,761,393 45,9275,963,932 51,215
4,335,587 43,4265,898,511 51,3506,581,794 52,264
7,421,021 53,6957,532,492 60,020
Production
重量(kg) 金額(百万円)
Malleable iron castings Precision castings For gas turbines
年 月Year and Month
可鍛鋳鉄(1) 精密鋳造品(2~6) ガスタービン用(2)
生産
Weight (million yen)
203
自動車用(4) 航空機・武器用(5) その他用の精密鋳造品(6)
生産 生産 生産 生産
Production Production Production Production
重量(kg) 金額(百万円) 重量(kg) 金額(百万円) 重量(kg) 金額(百万円) 重量(kg) 金額(百万円)
Weight (million yen) Weight (million yen) Weight (million yen) Weight (million yen)
平成19年 (2007) 1,967,777 8,871 3,831,645 19,864 3,533 868,852 6,09120 (2008) 1,759,226 8,698 3,995,503 21,679 3,805 870,586 6,05121 (2009) 846,459 4,813 2,033,435 9,891 3,239 488,068 3,47322 (2010) 1,030,947 6,034 3,571,466 19,739 2,915 518,744 4,40723 (2011) 1,046,302 6,242 4,272,837 22,488 3,183 511,046 4,096
平成21年度 (09FY) 821,710 4,960 2,531,266 12,810 3,045 480,361 3,57222 (10FY) 1,087,007 6,320 3,613,326 20,559 2,933 511,034 4,374
平成23年 1~3月 (Q1) 287,647 1,631 915,758 5,404 712 119,634 9464~6 (Q2) 272,397 1,616 988,855 5,421 792 121,814 1,0337~9 (Q3) 244,362 1,488 1,162,824 5,862 929 134,433 1,102
10~12 (Q4) 241,896 1,508 1,205,400 5,802 749 135,165 1,015
平成23年 1月 (Jan) 87,198 503 293,809 1,805 219 42,831 3552 (Feb) 100,238 569 274,138 1,730 250 37,371 2933 (Mar) 100,211 559 347,811 1,870 244 39,432 2984 (Apr) 87,526 528 333,650 1,843 271 41,488 3695 (May) 89,335 514 294,453 1,649 283 37,937 2996 (Jun) 95,536 573 360,752 1,928 239 42,389 365
7 (Jul) 77,864 481 397,941 2,006 304 42,393 3598 (Aug) 81,921 499 379,207 1,949 330 43,443 3569 (Sep) 84,577 507 385,676 1,907 295 48,597 387
10 (Oct) 83,162 527 416,639 2,104 239 46,603 39711 (Nov) 82,925 492 423,248 1,860 278 42,325 28412 (Dec) 75,809 489 365,513 1,838 232 46,237 333
11,5498,654
9,8838,572
9,51410,209
10,4969,779
9,57511,875
8,4109,786
29,60628,775
27,77132,150
110,556100,115
95,260118,302
147,445123,552
158,797
年 月Year and Month
一般機械用(3)
For general machinery For automobiles For aircraft/weapons For others
203

時系列表 (金属製品編) 製品
(9)可鍛鋳鉄及び精密鋳造品 Malleable iron castings and precision castings
平成19年 (2007) 7,421,021 86,12620 (2008) 7,532,492 88,16921 (2009) 4,335,587 60,71222 (2010) 5,898,511 x23 (2011) 6,581,794 x
平成21年度 (09FY) 4,761,393 72,84922 (10FY) 5,963,932 x
平成23年 1~3月 (Q1) 1,503,554 x4~6 (Q2) 1,575,329 x7~9 (Q3) 1,730,845 19,014
10~12 (Q4) 1,772,066 20,039
平成23年 1月 (Jan) 480,970 x2 (Feb) 480,616 x3 (Mar) 541,968 x4 (Apr) 530,396 x5 (May) 480,402 3,4836 (Jun) 564,531 5,359
7 (Jul) 574,869 6,2338 (Aug) 562,553 5,8999 (Sep) 593,423 6,882
10 (Oct) 610,188 7,02011 (Nov) 613,006 6,78612 (Dec) 548,872 6,233
合金鋼 炭素鋼( ) ア ミ ウム合金( ) そ 他 非鉄合金( )
Weight Weight
生産
Production Production
重量(kg) 重量(kg)
鋳鉄(7)
Precision castings Cast iron
年 月Year and Month
精密鋳造品(材質別生産)(7~10)
生産
204
合金鋼・炭素鋼(8) アルミニウム合金(9)
生産 生産
Production Production
重量(kg) 重量(kg)
Weight Weight
平成19年 (2007)20 (2008)21 (2009)22 (2010)23 (2011)
平成21年度 (09FY)22 (10FY)
平成23年 1~3月 (Q1)4~6 (Q2)7~9 (Q3)
10~12 (Q4)
平成23年 1月 (Jan)2 (Feb)3 (Mar)4 (Apr)5 (May)6 (Jun)
7 (Jul)8 (Aug)9 (Sep)
10 (Oct)11 (Nov)12 (Dec)
422,274 51,496 132,450423,953 47,111 71,575
408,033 60,779 117,729432,625 59,593 110,950
357,970 60,078 150,588362,752 65,041 128,861
324,619 58,911 93,389381,514 67,236 110,422
389,563 x 86,740350,379 x 118,961
334,457 x 77,743345,302 x 73,402
1,128,755 185,898 397,1781,278,852 158,200 314,975
1,069,322 x 237,8851,056,512 x 322,772
2,962,907 468,600 1,257,0374,125,354 x 1,115,254
3,990,639 x 1,230,8144,533,441 x 1,272,810
5,081,357 887,175 1,475,7912,570,764 466,923 1,237,188
Other non-ferrous alloys
生産
Production
重量(kg)
Weight
5,217,372 967,229 1,150,294
年 月Year and Month
その他の非鉄合金(10)
Alloy steel/carbon steel Aluminum alloys
204

時系列表 (金属製品編) 製品
(10)非鉄金属鋳物 Non-ferrous metal castings
銅・銅合金鋳物(1~5) 一般機械用(1~3) 産業機械器具用(1)
Copper/copper alloy castings For general machinery For industrial machinery
生産 消費 生産 生産Production Consumption Production Production
重量(t) 金額(百万円) 重量(t) 重量(t) 金額(百万円) 重量(t) 金額(百万円)Weight (million yen) Weight Weight (million yen) Weight (million yen)
平成19年 (2007)20 (2008)21 (2009)22 (2010)23 (2011)
平成21年度 (09FY)22 (10FY)
平成23年 1~3月 (Q1)4~6 (Q2)7~9 (Q3)
10~12 (Q4)
平成23年 1月 (Jan)2 (Feb)3 (Mar)4 (Apr)5 (May)6 (Jun)
7 (Jul)8 (Aug)9 (Sep)
10 (Oct)11 (Nov)12 (Dec)
軸受メタル用(2) バルブコック用(3) 輸送機械用(4) その他用の銅・銅合金鋳物(5)
6,611 8,415 1,801 3,978 4,971 1,220 1,5986,951 8,881 1,900 4,130 5,240 1,235 1,660
1,413 1,8446,985 9,613 1,940 4,211 5,3876,851 9,164 1,791 4,001 5,155 1,289 1,7746,815 8,859 1,874 4,164 5,409 1,284 1,804
1,302 1,8047,199 9,351 1,991 4,492 5,710
7,352 9,652 2,087 4,621 5,989 1,247 1,8226,792 8,924 1,890 4,347 5,560 1,152 1,653
1,308 1,7347,154 9,240 2,080 4,554 5,7117,247 9,329 2,101 4,465 5,757 1,279 1,8256,845 8,570 2,011 4,259 5,393 1,196 1,705
1,135 1,5606,361 8,021 1,812 3,998 5,016
20,547 26,909 5,641 12,319 15,599 3,868 5,10220,864 27,374 5,656 12,657 16,274 3,875 5,383
3,708 5,20921,298 27,816 6,057 13,521 17,25920,453 25,919 5,924 12,723 16,166 3,609 5,090
80,076 98,551 22,947 50,035 59,962 14,516 19,04311,031 13,22675,842 85,279 25,122 43,829 47,369
83,163 108,018 23,279 51,220 65,298 15,060 20,78479,293 95,758 23,236 49,030 57,014 14,035 17,775
11,025 13,47675,284 83,906 25,163 43,608 46,47398,782 129,101 43,633 61,564 76,310 20,044 27,084
年 月Year and Month
106,932 132,464 48,200 70,635 83,911 19,564 25,471
205
軸受メタ 用( ) ブ ック用( ) 輸送機械用( ) そ 他用 銅 銅合金鋳物( )(管継手用を含む)
For bearing metal For valves and cocks For transport equipment Copper/copper alloy castings(including for pipe fittings)
生産 生産 生産 生産Production Production Production Production
重量(t) 金額(百万円) 重量(t) 金額(百万円) 重量(t) 金額(百万円) 重量(t) 金額(百万円)Weight (million yen) Weight (million yen) Weight (million yen) Weight (million yen)
平成19年 (2007)20 (2008)21 (2009)22 (2010)23 (2011)
平成21年度 (09FY)22 (10FY)
平成23年 1~3月 (Q1)4~6 (Q2)7~9 (Q3)
10~12 (Q4)
平成23年 1月 (Jan)2 (Feb)3 (Mar)4 (Apr)5 (May)6 (Jun)
7 (Jul)8 (Aug)9 (Sep)
10 (Oct)11 (Nov)12 (Dec) 650 820606 825 2,152 2,548 1,983 2,624
668 917 2,228 2,664 2,126 2,752 695 889712 924632 908 2,166 2,636 2,062 3,302
664 925 2,049 2,456 2,121 3,065 728 944720 975613 873 2,267 2,732 1,931 2,474
785 1,045 2,405 2,861 1,971 2,687 736 954
779 1,014714 1,003 2,660 3,165 1,953 2,649759 1,035 2,435 2,872 1,706 2,412 739 953
745 1,020730 952 2,515 3,025 1,856 2,509813 1,059 2,373 2,873 2,012 2,556 770 1,015
803 957717 941 2,346 2,747 1,782 2,219657 888 2,207 2,568 1,588 2,046 775 959
2,057 2,6331,906 2,649 6,545 7,848 6,172 8,6782,062 2,842 6,720 8,050 6,023 8,226 2,184 2,873
2,262 2,9872,204 2,989 7,610 9,062 5,515 7,5702,187 2,887 6,926 8,188 5,382 6,822 2,348 2,932
9,559 11,7288,657 11,171 26,862 29,749 20,483 26,8617,343 8,128 25,455 26,015 21,368 25,926 10,645 11,983
8,851 11,4258,358 11,368 27,802 33,147 23,091 31,2958,352 10,625 26,643 28,614 20,306 26,721 9,957 12,023
10,038 11,4717,464 7,816 25,119 25,181 21,638 25,96210,113 12,877 31,407 36,349 24,608 35,691 12,609 17,100
13,345 17,53510,059 12,811 41,012 45,629 22,952 31,017
年 月Year and Month
for others
205

時系列表 (金属製品編) 製品
(10)非鉄金属鋳物 Non-ferrous metal castings
アルミニウム鋳物(6~9) 一般機械用(6) 輸送機械用(7~8)
Aluminum alloy castings For general machinery For transport equipment
生産 消費 生産 生産Production Consumption Production Production
重量(t) 金額(百万円) 重量(t) 重量(t) 金額(百万円) 重量(t) 金額(百万円)Weight (million yen) Weight Weight (million yen) Weight (million yen)
平成19年 (2007)20 (2008)21 (2009)22 (2010)23 (2011)
平成21年度 (09FY)22 (10FY)
平成23年 1~3月 (Q1)4~6 (Q2)7~9 (Q3)
10~12 (Q4)
平成23年 1月 (Jan)2 (Feb)3 (Mar)4 (Apr)5 (May)6 (Jun)
7 (Jul)8 (Aug)9 (Sep)
10 (Oct)11 (Nov)12 (Dec)
自動車用(7) その他の輸送機械用(8) その他用のアルミニウム鋳物(9)
19,066 691 862 32,758 21,46922,411
34,357 23,15636,386 24,208 20,149 726 899 34,684
884 37,030 23,95438,656 25,687 21,930 73621,910 691 864 36,649 23,830
20,17538,181 25,50132,211 21,864 18,242 671 829 30,608
869 33,906 22,05835,559 23,802 20,208 712
18,372 758 920 30,617 20,06112,315
32,344 21,91420,076 13,965 9,273 689 841 18,604
884 23,027 14,52524,596 16,262 13,418 76013,702 747 905 23,767 15,480
21,48925,377 17,28634,509 23,267 19,249 710 856 32,854
824 30,083 19,65231,725 21,342 17,573 687
61,145 2,153 2,644 104,472 67,83366,063
109,400 73,051105,951 71,168 60,361 2,074 2,563 101,162
2,645 72,248 46,90077,017 52,142 41,063 2,20750,525 2,143 2,584 86,704 56,622
238,597
91,611 61,895
382,860 259,954 208,332 8,708 10,398 363,1768,772 319,173 213,511336,851 232,142 174,459 7,224
213,094 8,577 10,436 364,587 237,418241,997
383,978 258,255386,812 263,108 212,033 8,589 10,255 367,407
8,438 274,211 188,926291,923 207,365 141,651 6,851185,967 11,959 15,076 387,490 280,227
291,870414,004 308,507431,982 320,302 192,340 12,087 15,131 405,356
年 月Year and Month
206
自動車用( ) そ 他 輸送機械用( ) そ 他用 ア ミ ウ 鋳物( )
For automobiles For others Aluminum alloy castings for others
生産 生産 生産Production Production Production
重量(t) 金額(百万円) 重量(t) 金額(百万円) 重量(t) 金額(百万円)Weight (million yen) Weight (million yen) Weight (million yen)
平成19年 (2007)20 (2008)21 (2009)22 (2010)23 (2011)
平成21年度 (09FY)22 (10FY)
平成23年 1~3月 (Q1)4~6 (Q2)7~9 (Q3)
10~12 (Q4)
平成23年 1月 (Jan)2 (Feb)3 (Mar)4 (Apr)5 (May)6 (Jun)
7 (Jul)8 (Aug)9 (Sep)
10 (Oct)11 (Nov)12 (Dec) 909 82532,285 20,479 473 990
34,163 21,410 521 1,001 976 899890 85036,520 22,992 510 961
36,143 22,837 506 993 841 808932 86030,164 19,239 444 936
33,385 21,010 521 1,049 941 875
969 93330,115 19,017 503 1,04418,219 11,535 385 780 783 809
809 85422,662 13,752 365 77323,366 14,689 401 791 863 902
946 92232,367 20,567 487 92229,607 18,738 476 915 955 866
2,775 2,574102,967 64,881 1,504 2,95299,691 63,086 1,471 2,977 2,715 2,542
2,561 2,59670,996 44,303 1,253 2,59785,340 53,995 1,364 2,627 2,763 2,690
10,977 10,959357,658 227,931 5,517 10,666314,560 204,324 4,613 9,187 10,454 9,859
10,814 10,402358,994 226,265 5,592 11,152361,923 231,454 5,484 10,543 10,816 10,856
10,861 10,001269,924 179,836 4,288 9,090380,427 265,370 7,064 14,857 14,554 13,204
14,539 13,301397,617 275,737 7,739 16,133
年 月Year and Month
206

時系列表 (金属製品編) 製品
(11)ダイカスト Die castings
ダイカスト(1~8)
生産 消費 生産 消費
Production Consumption Production Consumption
重量(t) 金額(百万円) 重量(t) 重量(t) 金額(百万円) 重量(t)
Weight (million yen) Weight Weight (million yen) Weight平成19年 (2007) 1,158,360 731,729 322,832 1,117,622 669,465 308,950
20 (2008) 1,093,806 696,420 313,702 1,057,689 641,027 301,36021 (2009) 758,316 443,456 241,311 733,584 406,725 233,31422 (2010) 980,850 576,470 309,168 949,118 528,401 297,89423 (2011) 930,474 557,736 285,792 902,028 513,386 275,695
平成21年度 (09FY) 874,797 502,451 278,002 846,656 460,568 269,00622 (10FY) 960,886 570,873 299,061 929,801 523,280 287,838
平成23年 1~3月 (Q1) 227,050 137,041 67,787 219,702 125,845 65,1424~6 (Q2) 187,587 112,276 56,083 181,419 102,566 53,6627~9 (Q3) 251,549 151,086 78,816 244,201 139,363 76,341
10~12 (Q4) 264,288 157,333 83,107 256,707 145,612 80,549
平成23年 1月 (Jan) 76,836 45,970 23,334 74,415 42,183 22,4522 (Feb) 84,210 50,356 25,769 81,584 46,212 24,8513 (Mar) 66,005 40,715 18,683 63,703 37,450 17,8384 (Apr) 56,594 34,289 18,041 54,715 31,451 17,2585 (May) 51,771 31,157 13,870 49,906 28,140 13,1036 (Jun) 79,222 46,830 24,171 76,798 42,975 23,301
7 (Jul) 86,545 51,318 27,078 84,076 47,307 26,2148 (Aug) 76,616 46,647 23,291 74,300 42,971 22,5429 (Sep) 88,388 53,121 28,446 85,824 49,085 27,586
10 (Oct) 92,603 54,980 29,509 89,901 50,900 28,57511 (Nov) 88,182 52,463 27,504 85,671 48,618 26,63112 (Dec) 83,503 49,890 26,094 81,135 46,094 25,343
一般機械用(1) 電気機械用(2) 自動車用(3)
年 月Year and Month
アルミニウム(1~5)
Die castings Aluminum alloy die castings
207
一般機械用(1) 電気機械用(2) 自動車用(3)
生産 生産 生産
Production Production Production
重量(t) 金額(百万円) 重量(t) 金額(百万円) 重量(t) 金額(百万円)
Weight (million yen) Weight (million yen) Weight (million yen)
平成19年 (2007) 60,730 45,368 30,832 32,836 936,670 528,36420 (2008) 55,166 41,910 26,760 30,447 895,229 511,72521 (2009) 32,644 24,501 17,019 18,553 639,065 331,38322 (2010) 43,041 33,171 19,909 21,368 824,095 427,51723 (2011) 41,717 32,014 18,946 20,665 780,694 417,176
平成21年度 (09FY) 36,685 26,680 18,814 19,843 740,856 377,95022 (10FY) 42,856 33,508 19,559 21,131 806,066 423,124
平成23年 1~3月 (Q1) 10,588 8,183 4,734 4,978 189,516 101,9044~6 (Q2) 9,972 7,460 4,458 4,755 153,610 80,8817~9 (Q3) 10,328 8,126 4,911 5,387 213,531 114,785
10~12 (Q4) 10,830 8,244 4,842 5,544 224,038 119,605
平成23年 1月 (Jan) 3,357 2,592 1,561 1,655 64,558 34,2972 (Feb) 3,629 2,830 1,652 1,747 71,120 37,8023 (Mar) 3,602 2,761 1,521 1,577 53,838 29,8044 (Apr) 3,208 2,430 1,532 1,564 45,825 24,5285 (May) 3,175 2,294 1,320 1,409 41,383 21,5756 (Jun) 3,589 2,736 1,606 1,782 66,402 34,779
7 (Jul) 3,484 2,758 1,675 1,775 73,479 38,9278 (Aug) 3,290 2,544 1,549 1,695 64,810 35,3559 (Sep) 3,554 2,825 1,687 1,916 75,243 40,503
10 (Oct) 3,659 2,795 1,594 1,871 79,106 42,19911 (Nov) 3,832 2,854 1,654 1,845 74,254 39,71512 (Dec) 3,339 2,594 1,595 1,829 70,678 37,691
年 月Year and Month
For general machinery For electrical machinery For automobiles
207

時系列表 (金属製品編) 製品
(11)ダイカスト Die castings
平成19年 (2007)20 (2008)21 (2009)22 (2010)23 (2011)
平成21年度 (09FY)22 (10FY)
平成23年 1~3月 (Q1)4~6 (Q2)7~9 (Q3)
10~12 (Q4)
平成23年 1月 (Jan)2 (Feb)3 (Mar)4 (Apr)5 (May)6 (Jun)
7 (Jul)8 (Aug)9 (Sep)
10 (Oct)11 (Nov)12 (Dec) 751
自動車用(6) その他用の亜鉛(7) その他(8)
3,076 2,183 2,447 1,796 1,931 3,410
9343,399 2,353 2,533 1,851 2,056 3,439 8733,173 2,243 2,369 1,793 2,228 3,695
7492,974 2,051 2,366 1,791 2,116 3,630 8612,561 1,779 2,091 1,598 1,944 3,3202,925 1,994 2,514 1,852 2,063 3,669 864
7672,804 1,848 2,397 1,830 2,073 3,509 8692,015 1,357 2,014 1,505 1,610 2,715
8452,199 1,386 1,951 1,543 1,654 2,548 7842,623 1,692 2,119 1,616 1,926 2,898
8822,912 2,012 2,271 1,820 2,199 3,746 9182,702 1,900 2,237 1,740 2,031 3,398
2,5589,648 6,779 7,349 5,439 6,215 10,544
2,4208,460 5,824 6,971 5,241 6,123 10,619 2,4757,018 4,591 6,362 4,878 5,338 8,7738,237 5,604 6,627 5,176 6,156 10,042 2,645
8,99633,772 23,574 27,548 21,944 26,190 42,772 11,22326,252 17,829 24,050 18,266 23,495 37,182
10,09833,362 22,798 27,309 20,734 23,831 39,978
7,99633,942 24,099 28,131 22,247 26,772 43,103 11,27423,306 15,692 21,549 16,595 20,563 32,378
13,88145,338 30,095 35,196 26,849 30,206 48,320 12,34251,070 34,353 38,320 28,544 34,240 54,039
重量(t)
Weight (million yen) Weight (million yen) Weight (million yen) Weight
重量(t) 金額(百万円) 重量(t) 金額(百万円) 重量(t) 金額(百万円)
Zinc alloy die castings
生産 生産 生産 消費
Production Production Production Consumpution
年 月Year and Month
二輪自動車用(4) その他用のアルミニウム(5) 亜鉛(6~7)
For motorcycles For others
208
平成19年 (2007)20 (2008)21 (2009)22 (2010)23 (2011)
平成21年度 (09FY)22 (10FY)
平成23年 1~3月 (Q1)4~6 (Q2)7~9 (Q3)
10~12 (Q4)
平成23年 1月 (Jan)2 (Feb)3 (Mar)4 (Apr)5 (May)6 (Jun)
7 (Jul)8 (Aug)9 (Sep)
10 (Oct)11 (Nov)12 (Dec) 1,218 2,874 712 537 437 386
1,233 2,863 824 576 455 4061,419 3,069 809 626 474 3851,334 3,019 782 611 448 4061,240 2,710 704 610 372 3561,241 2,996 822 673 406 343
1,177 2,773 896 737 351 345709 2,012 901 703 255 302768 1,882 886 666 225 290
1,045 2,249 880 649 376 3671,324 3,039 875 707 427 3981,222 2,757 809 641 390 389
3,871 8,806 2,345 1,738 1,366 1,1773,814 8,725 2,308 1,894 1,225 1,1042,654 6,666 2,683 2,106 831 9373,591 8,045 2,565 1,997 1,193 1,154
15,290 34,290 10,900 8,483 4,894 4,82115,188 30,046 8,307 7,136 4,646 4,700
13,930 32,242 9,901 7,735 4,615 4,37315,856 34,569 10,916 8,534 4,960 4,96613,048 25,968 7,516 6,410 4,169 4,35318,825 37,183 11,381 11,136 5,911 7,07321,133 40,108 13,107 13,931 6,498 8,225
Weight (million yen) Weight (million yen) Weight (million yen)
重量(t) 金額(百万円) 重量(t) 金額(百万円) 重量(t) 金額(百万円)
For others Other die castings
生産 生産 生産
Production Production Production
年 月Year and Month
自動車用(6) その他用の亜鉛(7) その他(8)
For automobiles
208

時系列表 (金属製品編) 原材料
2. 原材料 Raw materials
銑鉄鋳物 可鍛鋳鉄 銅・銅合金鋳物
Iron castings Malleable iron castingsCopper/copperalloy castings
消費Consumption
消費Consumption
消費Consumption
消費Consumption
消費Consumption
消費Consumption
消費Consumption
消費Consumption
平成19年 (2007) 632,777 637,395 2,793,334 2,790,951 1,753 58,728 80,875 105,16420 (2008) 619,098 565,830 2,702,184 2,656,295 1,394 52,643 71,126 98,87121 (2009) 309,034 286,712 1,754,607 1,710,583 606 40,858 53,501 73,57522 (2010) 391,600 373,055 2,361,922 2,236,335 754 40,894 56,808 77,48723 (2011) 401,757 405,109 2,367,757 2,204,416 462 45,177 58,739 83,886
平成21年度 (09FY) 324,088 305,955 1,984,718 1,934,639 614 40,978 54,573 74,00022 (10FY) 393,758 385,165 2,357,638 2,216,499 725 42,598 58,477 79,325
平成23年 1~3月 (Q1) 91,679 99,090 564,957 534,931 90 11,909 15,992 20,7434~6 (Q2) 102,661 89,673 510,792 466,001 147 12,607 16,693 21,6447~9 (Q3) 103,849 107,272 633,309 585,234 125 9,709 12,041 20,891
10~12 (Q4) 103,568 109,074 658,699 618,250 100 10,952 14,013 20,609
平成23年 1月 (Jan) 30,004 32,520 188,665 175,434 19 3,671 4,743 6,5792 (Feb) 30,545 35,907 206,311 189,077 30 3,647 4,987 7,0513 (Mar) 31,130 30,663 169,981 170,420 41 4,591 6,262 7,1124 (Apr) 34,928 28,757 159,673 148,638 67 4,476 5,911 7,4295 (May) 31,641 27,136 141,580 128,172 46 4,062 5,629 6,7916 (Jun) 36,092 33,780 209,539 189,191 34 4,069 5,153 7,423
7 (Jul) 35,240 36,316 213,265 197,009 49 3,327 4,202 7,2728 (Aug) 32,504 33,461 194,873 179,154 42 3,153 3,965 6,9059 (Sep) 36,105 37,495 225,171 209,071 34 3,229 3,874 6,71410 (Oct) 35,484 37,815 227,255 217,900 31 3,288 4,723 7,05811 (Nov) 35,521 36,299 221,659 203,434 35 3,900 4,702 6,93412 (Dec) 32,563 34,960 209,785 196,916 34 3,764 4,588 6,616
重量(t)Weight
重量(t)Weight
鋼くずSteel scrap
返りくずReturn scrap
銅合金地金Copper-basealloy ingots
重量(t)Weight
重量(t)Weight
重量(t)Weight
重量(t)Weight
重量(t)Weight
重量(t)Weight
年 月Year and Month
銑鉄Pig iron
銑くずPig iron scrap
鋼くずSteel scrap
返りくずReturn scrap
銑鉄Pig iron
209
アルミニウム鋳物 ダイカスト
Aluminum alloy castings Die castings
アルミニウム合金新地金
アルミニウム二次合金地金
アルミニウム合金新地金
アルミニウム二次合金地金
マグネシウム合金地金
亜鉛合金新地金
亜鉛二次合金地金
銅合金地金
Aluminum-basealloy ingots
Secondaryaluminum-base
alloy ingots
Aluminum-basealloy ingots
Secondaryaluminum-base
alloy ingots
Magnesium-base alloy
ingots
Zinc-basealloy ingots
Secondaryzinc-base
alloy ingots
Copper-basealloy ingots
消費Consumption
消費Consumption
消費Consumption
消費Consumption
消費Consumption
消費Consumption
消費Consumption
消費Consumption
平成19年 (2007) 196,593 335,108 84,713 1,088,282 4,114 27,106 5,878 2,15320 (2008) 168,451 346,508 80,456 1,023,692 3,806 23,504 5,262 2,18321 (2009) 129,904 235,597 57,972 708,277 2,474 16,913 3,201 1,75722 (2010) 161,944 301,809 70,553 919,265 3,272 21,866 4,279 1,86423 (2011) 156,440 268,625 64,414 870,808 2,915 19,638 3,651 1,904
平成21年度 (09FY) 143,396 275,803 65,080 819,738 2,957 19,183 3,802 1,78722 (10FY) 160,005 287,496 68,186 899,824 3,215 21,441 4,092 1,873
平成23年 1~3月 (Q1) 37,833 64,534 15,709 213,318 790 5,067 930 4764~6 (Q2) 32,609 50,692 12,894 172,325 402 4,444 778 4707~9 (Q3) 42,260 76,538 17,174 237,499 843 5,013 981 430
10~12 (Q4) 43,738 76,860 18,637 247,666 879 5,114 961 527
平成23年 1月 (Jan) 13,033 22,358 5,374 72,397 226 1,656 307 1632 (Feb) 14,083 24,665 5,934 78,430 294 1,819 328 1593 (Mar) 10,716 17,511 4,401 62,491 270 1,592 296 1534 (Apr) 10,178 16,546 3,831 51,906 65 1,363 250 1695 (May) 9,201 11,552 3,868 46,819 120 1,334 258 1506 (Jun) 13,231 22,595 5,194 73,600 217 1,747 269 150
7 (Jul) 14,109 25,506 5,806 81,497 267 1,704 316 1388 (Aug) 13,337 23,214 5,099 72,389 233 1,558 348 1369 (Sep) 14,814 27,818 6,269 83,613 343 1,751 317 15610 (Oct) 15,398 27,716 6,467 87,363 314 1,823 360 17011 (Nov) 14,323 25,005 6,287 82,444 287 1,667 337 19012 (Dec) 14,017 24,139 5,883 77,859 279 1,624 264 168
重量(t)Weight
重量(t)Weight
年 月Year and Month
重量(t)Weight
重量(t)Weight
重量(t)Weight
重量(t)Weight
重量(t)Weight
重量(t)Weight
209

時系列表 (金属製品編) 労務
3. 労務 Labor
月末従事者数 Nummber of persons engaged at the end of month (単位:人、Unit:Persons)
平成19年 (2007) 19,824 12,451 15,843 6,701 13,191 7,952
20 (2008) 19,568 12,245 15,387 6,650 12,714 7,699
21 (2009) 18,326 11,817 15,051 6,700 12,798 7,347
22 (2010) 17,739 11,911 15,037 6,698 12,745 7,360
23 (2011) 16,691 11,825 14,894 5,908 12,811 7,385
平成23年 1月 (Jan) 17,219 11,733 15,130 5,961 12,446 7,496
2 (Feb) 17,153 11,781 14,990 5,967 12,045 7,494
3 (Mar) 17,090 11,709 14,915 5,906 11,921 7,502
4 (Apr) 16,938 11,811 14,982 5,891 12,151 7,526
5 (May) 16,872 11,732 14,987 5,946 12,239 7,490
6 (Jun) 16,959 11,779 14,999 5,973 12,496 7,463
7 (Jul) 17,242 11,792 15,041 5,973 12,517 7,470
8 (Aug) 16,982 11,797 14,993 6,033 12,719 7,458
9 (Sep) 16,727 11,783 14,983 5,884 12,950 7,436
10 (Oct) 16,704 11,836 14,931 5,868 12,864 7,428
11 (Nov) 16,714 11,788 14,857 5,888 12,870 7,420
12 (Dec) 16,691 11,825 14,894 5,908 12,811 7,385注*: 平成23年1月より調査票改正に伴い、自動車用機械工具を除く。Note*: "machine tools for automobiles" is not including after Questionnaire revision in 2011.
粉末や金製品(51)
Steel structures andtransmission line
hardwareSprings
Valves and pipefittings
Pneumatic tools,machinist hand tools,saw blades and knives
for machines
Gas and oil equipmentfor cooking, boiling
and heating, and solarwater heaters
Sintered products
年 月Year and Month
鉄構物及び架線金物(21)
ばね(22) 弁及び管継手(25)* 空気動工具、作業工具、のこ刃
及び機械刃物(26)
ガス機器、石油機器及び
太陽熱温水器(27)
210
平成19年 (2007) 15,259 26,208 613 2,119 12,536 17,094
20 (2008) 14,960 26,065 572 2,343 12,254 16,352
21 (2009) 13,645 23,537 560 2,331 11,205 15,230
22 (2010) 13,705 24,056 539 2,135 11,175 15,340
23 (2011) 13,895 25,605 500 2,177 11,122 15,469
平成23年 1月 (Jan) 13,716 25,107 556 2,118 11,029 15,388
2 (Feb) 13,727 25,098 554 2,129 11,018 15,397
3 (Mar) 13,836 25,083 554 2,136 10,976 15,364
4 (Apr) 13,866 25,304 555 2,135 10,900 15,468
5 (May) 13,803 24,395 550 2,138 10,883 15,370
6 (Jun) 13,845 25,427 552 2,178 10,922 15,279
7 (Jul) 13,820 25,433 544 2,154 10,950 15,370
8 (Aug) 13,836 25,495 543 2,149 11,045 15,364
9 (Sep) 13,847 25,578 541 2,146 11,089 15,335
10 (Oct) 13,858 25,594 506 2,160 11,031 15,270
11 (Nov) 13,908 25,636 501 2,177 11,087 15,430
12 (Dec) 13,895 25,605 500 2,177 11,122 15,469
ダイカスト(56)
Forgings from billetsand bars
Iron castingsMalleable iron
castingsPrecision castings
Non-ferrous metalcastings
Die castings
年 月Year and Month
鍛工品(52) 銑鉄鋳物(53) 可鍛鋳鉄(54) 精密鋳造品(54) 非鉄金属鋳物(55)
210

単年表 (鉄鋼編)
211
Pi i f teel king
Ⅳ 単年表 Annual commodities (平成23年) 〈鉄鋼編〉 〈Iron and steel〉
1. 銑鉄 Pig iron (1) 生産者分受払 Receipts and shipments by producers (単位:t、 Unit: t)
品 目Commodity
生産Production
受入Receipts
製鋼用消費Consumption
for steel-making
出荷 Shipments年末在庫
Inventory販売Sales
その他Others
計Total
81,028,352 231,242 76,866,509 3,348,153 282,608 1,068,013
製 鋼 用 銑Pig iron for steel-making
80,714,878 231,242 76,863,704 3,032,796 281,629 1,017,129
鋳 物 用 銑Foundry pig iron
313,474 - 2,805 315,357 979 50,884
(2) 消費者分(鉄鋼業)受払 Receipts and shipments by consumers (steel manufacturers)(単位:t、 Unit: t)
品 目Commodity
受入Receipts
製鋼用消費Consumption
for steel-making
年末在庫
Inventory
計Total
3,175,649 3,054,639 119,048
製 鋼 用 銑Pig iron for steel-makingg ron or s -ma
3,155,494 3,034,444 118,792
鋳 物 用 銑Foundry pig iron
20,155 20,195 256
(3) 製鋼用消費内訳 Breakdown of consumption for steel-making(単位:t、 Unit: t)
品 目Commodity
製鋼用消費 Consumption for steel-making
計Total
転 炉LD converters
電気炉Electric furnaces
計Total
79,921,148 79,548,117 373,031
(76,866,509) (76,756,861) (109,648)
製 鋼 用 銑Pig iron for steel-making
79,898,148 79,545,312 352,836
(76,863,704) (76,754,056) (109,648)
鋳 物 用 銑Foundry pig iron
23,000 2,805 20,195
(2,805) (2,805) (-)
注: ()内は生産業者分で内数。製鋼用銑には低りん銑、低銅銑を含む
Note: Figures in brackets are those of producers and are included in the main figures. Pig iron for steel production includes
low-phosphorus pig iron and low-copper pig iron.
211

単年表 (鉄鋼編)
2. フェロアロイ Ferro-alloys (1) 生産者分受払 Receipts and shipments by producers
(単位:t、 Unit: t)
注:1. フェロニッケルにはニッケルルッペを、フェロタングステンにはタングステン酸カルシウムクリンカーを、その他のフェロアロイには カルシウムシリコン、シリコクロム、フェロニオブを含む。Notes:1. Ferro-nickel includes nickel-luppe; ferro-tungsten includes calcium tungstate clinker; other ferro-alloys include calcium silicon,
silico-chromium and ferro-niobium.
1,854
その他のフェロアロイ Other ferro-alloys 20,913 5,234 6,412 20,519 17 7,430
フェロバナジウム Ferro-vanadium 3,980 146 326 3,022 -
-
512フェロモリブデン Ferro-molybdenum 5,167 46 38 5,088 -
フェロタングステン Ferro-tungsten - - - - -
2,242
フェロニッケル Ferro-nickel 279,944 1,238 3,388 225,158 49,139 18,729
低炭素 Low-carbon ferro-chromium 17,217 2,003 3,214 16,610 -
- 8,200 6,711 2,803 - 290
1,617
フェロクロムFerro-
chromium
計 Total 17,217 10,203 9,925 19,413 - 2,532
高炭素 High-carbon ferro-chromium
フェロシリコン Ferro-silicon - 30,149 29,212 1,063 80
24,192
シリコマンガン Silico-manganese 49,798 7,690 56,961 22,777 2,612 22,461
低炭素 Low-carbon ferro-manganese 124,115 12,126 52,286 119,797 2
332,683 119,225 143,206 410,202 11,050 77,823
157,150
フェロマンガン Ferro-
manganese
計 Total 456,798 131,351 195,492 529,999 11,052 102,015
高炭素 High-carbon ferro-manganese
合計 Grand total 833,817 186,057 301,754 827,039 62,900
(平成23年)
品 目Commodity
生産Production
受入Receipts
消費Consumption
出荷 Shipments
年末在庫Inventory販売
Salesその他Others
212
(2) 製鋼業者分受払 Receipts and shipments by steel manufacturers(単位:t、 Unit: t)
その他のフェロアロイ Other ferro-alloys 98,997 95,723 12,653
注: フェロニッケルにはニッケルルッペを、フェロタングステンにはタングステン酸カルシウムクリンカーを、その他のフェロアロイにはカルシウムシリコン、 シリコクロム、フェロニオブを含む。
Note: Ferro-nickel includes nickel-luppe; ferro-tungsten includes calcium tungstate clinker; other ferro-alloys include calcium silicon, silico-chromium and ferro-niobium.
フェロモリブデン Ferro-molybdenum 5,745 5,265 1,238
フェロバナジウム Ferro-vanadium 6,578 6,452 1,026
フェロニッケル Ferro-nickel 223,163 221,486 17,368
フェロタングステン Ferro-tungsten 1,563 1,559 274
695,391 675,082 90,566
低炭素 Low-carbon ferro-chromium 46,903 45,326 5,923
フェロシリコン Ferro-silicon 374,258 372,684 21,291
フェロクロムFerro-chromium
計 Total 742,294 720,408 96,489
高炭素 High-carbon ferro-chromium
シリコマンガン Silico-manganese 250,961 251,996 24,252
フェロマンガン Ferro-
manganese
計 Total 487,222 18,754
高炭素 High-carbon ferro-manganese 409,304 405,250 12,903
77,918 80,726 5,851低炭素 Low-carbon ferro-manganese
品 目Commodity
受入Receipts
消費Consumption
年末在庫Inventory
合計 Grand total 2,190,781 2,161,549 193,345
485,976
212

単年表 (鉄鋼編)
3. 粗鋼 Crude steel (1) 受払 Receipts and shipments
(単位:t、 Unit: t)
(2) 生産内訳 Breakdown of production (単位:t、 Unit: t)
連続鋳造によるもの
15,666連続鋳造によるものContinuous casting 82,831,886 65,721,180 17,110,706
特殊鋼S i l l
インゴットケースによるもの Ingot-case 988,419 143,505 844,914鋼塊Steel ingots
圧延用 For rolling
小計 Sub-total 106,608,386 82,741,997 23,866,389
普通鋼Ordinary
steel
インゴットケースによるもの Ingot-case 97,084 81,418
普通鋼 Ordinary steel 82,999,648 65,804,004 17,195,644
特殊鋼 Special steel 24,178,726 16,939,432 7,239,294
品 目Commodity
生産 Production
計Total
転炉LD converters
電気炉Electricfurnaces
合計Grand total
計 Total 107,178,374 82,743,436 24,434,938
798
特殊鋼 Special steel 205,801 5,682 211,277 101 - 364 364
- 1,162 1,162
普通鋼 Ordinary steel 217,019 11,499 212,665 15,782 - 798鋳鋼鋳込
Liquid steel forcastings
計 Total 422,820 17,181 423,942 15,883
8,597
特殊鋼 Special steel 24,178,726 475,131 24,561,849 26,529 56,028 81,574 79,753
57,644 91,468 88,350
普通鋼 Ordinary steel 82,999,648 25,437 82,995,979 31,313 1,616 9,894鋼塊
Steel ingots
計 Total 107,178,374 500,568 107,557,828 57,842
10,692 9,395
特殊鋼 Special steel 24,384,527 480,813 24,773,126 26,630 56,028 81,938 80,117
普通鋼 Ordinary steel 83,216,667 36,936 83,208,644 47,095 1,616
内生産者分By-producers
合計Grand total
計 Total 107,601,194 517,749 107,981,770 73,725 57,644 92,630 89,512
(平成23年)
品 目Commodity
生産Production
受入Receipts
消費Consumption
出荷 Shipments 年末在庫 Inventory
販売Sales
その他Others
計Total
213
4. 鋼半製品 (受払) Semi-finished steel (Receipts and shipments) (単位:t、 Unit: t)
5. 鍛鋼品及び鋳鋼品(受払) Steel forgings and castings (Receipts and shipments) (単位:t、 Unit: t)
9,174特殊鋼 Special steel castings 101,145 104 42,252 58,407 540
129,224 8 45,514 83,041 292 10,173
12,963
鋳鋼品(鋳放)Steel castings
計Total 230,369 112 87,766 141,448 832 19,347
普通鋼 Ordinary steel castings
特殊鋼 Special steel forgings 459,981 23 152,549 300,269 5,179
22,698
普通鋼 Ordinary steel forgings 162,750 15 48,549 111,756 2,588 9,735
年末在庫Inventory販売
Salesその他Others
鍛鋼品(打放) Steel forgings
計Total 622,731 38 201,098 412,025 7,767
1,282,068 1,282,068
品 目Commodity
生産Production
受入Receipts
消費Consumption
出荷 Shipments
特殊鋼 Special steel 22,258,049 2,574,953 24,509,190 1,210,580 3,137,666
3,915,665 3,915,665
普通鋼 Ordinary steel 82,335,467 4,425,285 75,465,406 7,047,583 3,846,547 2,633,597 2,633,597
計 Total 104,593,516 7,000,238 99,974,596 8,258,163 6,984,213
品 目Commodity
生産Production
受入Receipts
消費Consumption
出荷 Shipments 年末在庫 Inventory
販売Sales
その他Others
計Total
内生産者分By-producers
70,678 1,406 69,272
特殊鋼 Special steel 499,310 33 499,277
連続鋳造によるものContinuous casting 22,690,997 16,795,894 5,895,103
鍛鋼用For steelforgings
小計 Sub-total 569,988 1,439 568,549
普通鋼 Ordinary steel
Special steelSteel ingots
213

単年表 (鉄鋼編)
(平成23年)(単位:t、 Unit: t)
計Total
一般General
再生 Recycling
販売Sales
その他Others
74,492,268 74,433,812 58,456 1,315,999 21,721,052 49,005,382 4,924,240 2,723,360
575,219 575,219 - - - 574,543 5,593 28,396
538,954 538,954 - - - 539,785 5,593 23,601
36,265 36,265 - - - 34,758 - 4,795
527,431 527,431 - 105,667 999 517,570 109,509 39,765
5,482,120 5,482,120 - 217,565 745 5,460,266 227,151 300,915
3,364,592 3,364,592 - 214,809 745 3,354,757 221,676 166,886
1,039,721 1,039,721 - 2,756 - 1,040,819 3,511 55,655
1,077,807 1,077,807 - - - 1,064,690 1,964 78,374
9,590,394 9,531,938 58,456 90,554 - 9,523,471 82,514 696,646
408,336 408,336 - 674 - 404,888 649 40,174
480,059 480,059 - 9,129 - 467,466 15,239 61,120
8,701,999 8,643,543 58,456 80,751 - 8,651,117 66,626 595,352
8,095,009 8,055,075 39,934 52,022 - 8,071,234 37,081 535,007
606,990 588,468 18,522 28,729 - 579,883 29,545 60,345
657,552 657,552 - 11,084 8,626 350,713 291,007 18,376
1,810,777 1,810,777 - 150,584 30,765 1,740,173 191,444 96,515
448,369 448,369 - 73,786 - 485,064 73,640 25,088
260,742 260,742 - 4,871 - 260,966 4,958 11,502
187,627 187,627 - 68,915 - 224,098 68,682 13,586
628,940 628,940 - 47,783 - 582,544 51,539 31,376
733,468 733,468 - 29,015 30,765 672,565 66,265 40,051
105,457 105,457 - - 8,962 34,362 62,307 3,169
628,011 628,011 - 29,015 21,803 638,203 3,958 36,882
12,507,589 12,507,589 - 68,877 214,277 12,302,514 84,855 486,738
12,296,388 12,296,388 - 68,877 214,277 12,100,993 81,288 471,240
211,201 211,201 - - - 201,521 3,567 15,498
43 272 311 43 272 311 - 671 668 21 395 794 18 536 132 3 932 167 1 053 198
6.普通鋼熱間圧延鋼材 Ordinary hot-rolled steel (1) 生産者分受払 Receipts and shipments by producers
品 目Commodity
生産Production受入
Receipts消費
Consumption
出荷 Shipments年末在庫Inventory
合計 Grand total
軌条Rails
計 Total
重軌条(含付属品) Heavy rails and accessories
軽軌条(含付属品) Light rails and accessories
鋼矢板 Steel pilings
形鋼Steel
shapes
計 Total
H形鋼 Wide flange beams
大形 Heavy shapes
中小形 Medium and light shapes
棒鋼Steelbars
計 Total
大形 Heavy bars
中形 Medium bars
小形 Light bars
小計 Sub-total
鉄筋用 For reinforcing
その他用 For others
管材 Rounds for tubes
線材 Steelwirerods
計 Total
バーインコイル
Bars in coil
小計 Sub-total
鉄筋用 For reinforcing
その他用 For others
普通線材 Ordinary wire rods
特殊線材Special wire
rods
小計 Sub-total
低炭素 Low-carbon wire rods
高炭素 High-carbon wire rods
鋼板Steelsheetsand
plates
計 Total
厚板 Heavy plates
中板・薄板 Medium plates/light sheets
計 Total
214
43,272,311 43,272,311 - 671,668 21,395,794 18,536,132 3,932,167 1,053,198
42,649,745 42,649,745 - 623,307 20,975,480 18,318,682 3,899,221 1,041,576
2,122,066 2,122,066 - 1,949 1,957,748 11,465 130,905 23,362
40,527,679 40,527,679 - 621,358 19,017,732 18,307,217 3,768,316 1,018,214
622,566 622,566 - 48,361 420,314 217,450 32,946 11,622
68,875 68,875 - - 69,846 - - 2,811
(2)消費内訳(品目別) Breakdown of consumption (by commodity) (単位:t、 Unit: t)
214,277
-
420,314
(3)圧延鋼材用原材料(鋼塊、鋼半製品)受払 Raw materials for rolled steel (steel ingots/semi-finished steel) recepits and shipments (単位:t、 Unit: t)
1,962 2,000 158
2,469,854 2,458,893 146,762
(4)再生鋼材用原材料(鋼くず、発生品)受払 Raw materials for reclaimed steel (steel scrap, generated steel) receipts and shipments (単位:t、 Unit: t)
21,963 21,336 2,356
42,873 41,098 8,284
鋼帯Steelstrips
計 Total
幅600㎜以上
Wide strips(600 mm or
more inwidth)
小計 Sub-total
冷延電気鋼帯用Cold-rolled electrical sheets andstrips
その他用 For others
幅600㎜未満Narrow strips (less than 600 mm in width)
外輪 Tyres and wheels
品 目Commodity
鋼管用・冷延用・亜鉛めっき鋼板用・冷間ロール成型形鋼用消費 Consumption for steel pipes and tubes/steel-rolled products/galvanized sheets and
plates/cold-formed steel shapes
鋼板 Steel sheets and
plates
厚板 Heavy plates
中板・薄板 Medium plates/light sheets
鋼帯 Steel strips
幅600㎜以上(冷延電気鋼帯用を除く) Wide strips (600 mm or more in width) excluding those for
cold-rolled electrical sheets and strips19,017,732
幅600㎜未満Narrow strips (less than 600 mm in width)
品 目 Commodity 受入 Receipts 消費 Consumption
鋼くず(再生用) Steel scrap (for reclamation)
発生品(ミスロールを含む) Generated steel (including miss rolls)
年末在庫 Inventory
鋼塊 Steel ingots
鋼半製品 Semi-finished steel
品 目 Commodity 受入 Receipts 消費 Consumption 年末在庫 Inventory
214214

単年表 (鉄鋼編)
(平成23年)
(1)受払 Receipts and shipments (単位:t、 Unit: t)
販売Sales
その他Others
計Total
内生産者分By-producers
93,864 - 42 87,743 63 38,640 38,640
20,934,265 935,082 14,178,531 7,122,342 610,073 405,577 386,671
23,024 10,313 10,130 20,374 3,126 847 257
1,949,391 - - 1,963,083 2,354 67,794 67,794
978,533 230 - 983,086 5,573 60,988 60,988
818,147 183 - 819,130 2,800 53,963 53,963
計 Total 12,220,456 138,344 128,550 12,067,347 237,307 602,011 590,536
溶融めっきHot-dip zinc-coated
sheets9,918,385 138,279 118,091 9,754,792 199,825 527,083 515,608
電気めっきElectric zinc-coated
sheets2,302,071 65 10,459 2,312,555 37,482 74,928 74,928
1,129,900 7,756 - 1,105,597 19,179 183,646 183,646
10,165 - - 10,007 - 1,321 1,321
501,328 2,115 26 491,576 8,832 21,594 21,594
(2)消費内訳(品目別・用途別) Breakdown of consumption (by commodity/use)
計Total
再冷延用For re-cold-
rolling
鋼管用For pipes and
tubes
ブリキ用For tinplates
ティンフリースチール用For tin-free
steel
亜鉛めっき鋼板用 For
galvanizedsheets
その他の金属めっき鋼板用
For othermetallic-
coated sheets
冷間ロール成型形鋼用For cold-
formed steelshapes
その他Others
42 - - - - 42 - - -
14,178,531 *64,210 - 1,092,048 847,552 10,954,069 1,250,451 - 34,411
10,130 - - - - 10,130 - - -
注:再冷延用の*印は生産及び消費から差し引いてある。Note: Figures in the "for re-cold-rolling" column marked with "*" have been subtracted from production and consumption.
(3)消費内訳(品目別) Breakdown of consumption (by commodity) (単位:t、 Unit: t)
品 目 鋼管用・冷間ロール成型形鋼用
冷間ロール成型形鋼Cold-formed steel
shapes
簡易鋼矢板 Cold-formed sheet pilings
軽量形鋼Cold-formed shapes
(単位:t、 Unit: t)
品 目Commodity
冷間仕上鋼材Cold-finished steel
磨帯鋼 Cold-rolled narrow strips
冷延広幅帯鋼 Cold-rolled wide strips
冷延鋼板Cold-rolled sheets and strips
冷間仕上鋼材 Cold-finished steel
磨帯鋼 Cold-rolled narrow strips
冷延広幅帯鋼Cold-rolled wide strips
冷延鋼板 Cold-rolled sheets and strips
冷延電気鋼帯Cold-rolled electrical sheets and strips
めっき鋼材Metallic-coated steel
ブリキ Tin plates
ティンフリースチール Tin-free steel
亜鉛めっき鋼板 Galvanized
sheets
その他の金属めっき鋼板Other metallic-coated sheets
7. 普通鋼冷間仕上鋼材、めっき鋼材、冷間ロール成型形鋼(磨棒鋼・線類を除く) Ordinary cold-finished, metallic-coated, cold-formed steel sheets and shapes (excluding cold-finished steel bars/wires)
品 目Commodity
生産Production
受入Receipts
消費Consumption
出荷 Shipments 年末在庫 Inventory
215
118,091
118,091
-
(4)原材料(専業者分) Raw materials (by specialized manufacturers) (単位:t、 Unit: t)
厚板Heavy plates
705 -
中板・薄板Medium plates/
light sheets7,020 -
5,103,344 221,978
(5) 普通鋼圧延鋼材消費内訳(品目別・用途別) Consumption of ordinary rolled steel (by commodity/use) (単位:t、 Unit: t)
計Total
ブリキ用For tin steel
ティンフリースチール用For tin-free
steel
その他の金属めっき鋼板用
For othermetallic-
coated sheets
厚板Heavy plates
417,470 417,470 - - -
中板・薄板 Medium plates/
light sheets7,020 7,020 - - -
27,006,928 27,006,928 - - -
871,168 871,168 - - -
13,282 13,282 - - -
14,144,120 10,954,069 1,092,048 847,552 1,250,451
10,130 10,130 - - -
359,415 359,415 - - -
普通鋼冷間仕上鋼材Ordinary cold-finished
steel
磨帯鋼Cold-rolled narrow strips
冷延広幅帯鋼Cold-rolled wide strips
冷延鋼板Cold-rolled sheets and strips
亜鉛めっき鋼板 Galvanized sheets
品 目Commodity
鋼管用・冷延用・亜鉛めっき鋼板用・冷間ロール成型形鋼用For pipes and tubes/cold-rolled products/galvanized
sheets/cold-formed steel shapes
普通鋼熱間圧延鋼材Ordinary hot-rolled
steel
鋼板Steel sheets and
plates
鋼帯(除冷電用)Steel strips (excluding for cold-rolled
electrical sheets and strips)
普通鋼鋼管 Ordinary steel pipes and tubes
品 目Commodity
消費 Consumption年末在庫Inventory冷延用・亜鉛めっき鋼板用・冷間ロール成型形鋼用
For cold-rolled products/galvanized sheets/cold-formed steel shapes
普通鋼熱間圧延鋼材Ordinary hot-rolled
steel
鋼板Steel sheets and
plates
鋼帯 Steel strips
品 目Commodity
鋼管用 冷間ロ ル成型形鋼用For pipe and tubes/cold-formed steel shapes
亜鉛めっき鋼板Galvanized sheets
計Total
溶融めっきHot-dip zinc-coated sheets
電気めっきElectric zinc-coated sheets
215215

単年表 (鉄鋼編)
(1) 受払 Receipts and shipments
計Total
内冷延用及び再冷延用
For cold-rollingand re-cold-
rolling
内鋼管用For steel
pipesand tubes
販売 Sales
その他Others
計Total
内生産者分By-producers
20,339,859 2,935,277 5,799,574 3,598,353 1,926,097 15,247,406 2,030,211 829,780 761,783
500,334 2,984 253 … … 490,156 3,306 46,560 46,560
6,256,373 262,572 153,039 … … 6,057,992 192,199 217,430 214,449
1,498,992 931,801 1,017,131 … 1,017,131 1,027,632 351,806 77,614 30,455
4,163,728 143,762 121,832 … … 4,080,547 114,602 199,712 199,712
2,087,517 8,089 688,202 3,887 684,315 1,343,153 33,079 102,969 102,969
5,832,915 1,586,069 3,819,117 3,594,466 224,651 2,247,926 1,335,219 185,495 167,638
294,245 - 262 - - 291,838 243 16,802 16,802
2,465,147 159,588 76,999 *105,387 - 2,377,609 169,126 139,345 139,345
102,579 42 - - - 101,698 193 6,276 6,276
内平鋼Flat steel
20,339,859 500,334 6,256,373 219,709 1,498,992 4,163,728 2,087,517 5,832,915 688,202 3,819,117 761,783
249,273 … 102,134 26,580 4 15,245 2,491 129,399 1,926 143,090 8,488
126,016 … 11,166 2,613 4 3,765 54 111,027 2 124,214 3,770
106 650 … 80 424 22 450 - 6 119 1 745 18 362 1 232 18 862 4 046
8. 特殊鋼圧延鋼材 Special rolled steel (平成23年)
(単位:t、Unit: t)
品 目Commodity
生産Production
受入Receipts
消費 Consumption 出荷 Shipments 年末在庫 Inventory
熱間圧延鋼材
Hot-rolledsteel
計 Total
形鋼 Steel shapes
棒鋼 Steel bars
管材 Rounds for tubes
線材 Steel wire rods
鋼板 Steel sheets and plates
鋼帯 Steel strips
冷間仕上鋼材 Cold-finishedsteel
磨帯鋼 Cold-rolled narrow strips
冷延広幅帯鋼Cold-rolled wide strips
冷延鋼板 Cold-rolled sheets and strips
注:再冷延用の*印は生産及び消費計から差し引いてある。
Note: Figures in the "for re-cold-rolling" column marked with "*" have been subtracted from production and consumption.
(2) 熱間圧延鋼材の生産・消費・在庫内訳(鋼種別・形状別)
Production/consumption/inventory of hot-rolled steel (by kind of steel/configuration) (単位:t、Unit: t)
鋼 種Kind of steel
生産 Production 消費 Consumption
年末在庫Inventory計
Total
形鋼 Steelshapes
棒鋼 Steel bars 管材Rounds
for tubes
線材 Steel
wire rods
鋼板Steel sheetsand plates
鋼帯Steelstrips
鋼板Steel
sheets andplates
鋼帯Steelstrips
合計 Grand total
工具鋼
計 Total
炭素工具鋼 Carbon tool steel
合金工具鋼
216
106,650 … 80,424 22,450 - 6,119 1,745 18,362 1,232 18,862 4,046
16,504 … 10,441 1,517 - 5,361 692 10 692 10 672
103 … 103 - - - - - - 4 -
8,655,769 231,391 4,513,855 104,944 938,076 2,213,842 113,235 645,370 67 354,996 307,196
4,616,659 24,429 2,415,162 95,391 41,543 1,542,112 77,044 516,369 18 318,603 190,227
4,039,110 206,962 2,098,693 9,553 896,533 671,730 36,191 129,001 49 36,393 116,969
11,434,817 268,943 1,640,384 88,185 560,912 1,934,641 1,971,791 5,058,146 686,209 3,321,031 446,099
427,775 … 143,659 65,858 - 280,399 - 3,717 - 1,287 24,614
1,117,301 - 700,076 183 135,866 272,054 3,307 5,998 - 258 38,099
Cr系Cr stainless steel
1,149,682 93 43,427 3,247 151,172 38,502 4,858 911,630 60 734,868 41,292
Cr-Mo系Cr-Mo stainless steel
203,131 42 8,451 96 - 12,328 1,868 180,442 - 176,630 8,427
Cr-Mn系Cr-Mn stainless steel
57,219 - 333 - - 10,585 - 46,301 - 34,035 557
Cr-Ni系Cr-Ni stainless steel
1,240,384 33,840 65,810 15,244 73,557 100,023 128,360 838,794 1,696 687,617 59,967
Cr-Ni-Mo系Cr-Ni-Mo stainless steel
281,071 1,529 33,229 959 42,076 70,596 58,064 75,577 156 45,830 12,441
744,318 - 503,448 - 77 240,793 - - - 12 30,553
751,709 … … … … 751,709 … … - - 28,872
5,380,181 233,439 138,725 2,492 156,044 88,118 1,774,430 2,989,425 684,297 1,637,269 197,768
82,046 - 3,226 106 2,120 69,534 904 6,262 - 3,225 3,509
63,010 … … … … … 61,920 1,090 - - 1,024
Tool steel Alloy tool steel
高速度工具鋼High-speed tool steel
その他の工具鋼Other tool steel
構造用鋼Structural
steel
計 Total
機械構造用炭素鋼Carbon steel for machine structure
構造用合金鋼 Alloy steel for structure
特 殊用途鋼
Steel forspecial
purposes
計 Total
ばね鋼Spring steel
軸受鋼Bearing steel
ステンレス鋼Stainless
steel
快削鋼Free-cutting steel
ピアノ線材Piano wire rods
高抗張力鋼High-tensile-strength steel
その他の特殊用途鋼Other steel for special purposes
合わせ鋼材 Clad steel
216

単年表 (鉄鋼編)
Production/consumption of cold-finished steel (by kind of steel/configuration)
294,245 2,465,147 102,579 - 105,387 - -
38,536 31,555 24,531 - 40,412 - -
32,169 26,288 19,178 - 35,141 - -
6,353 5,267 4,847 - 5,271 - -
10 - 506 - - - -
4 - - - - - -
132,935 169,253 48,655 - 64,975 - -
118,075 155,976 45,319 - 59,343 - -
14,860 13,277 3,336 - 5,632 - -
122,774 2,264,339 29,393 - - - -
1,455 732 177 - - - -
319 - - - - - -
Cr系Cr stainless steel
48,387 597,838 6,078 - - - -
Cr-Mo系Cr-Mo stainless steel
1,183 153,512 503 - - - -
(3) 冷間仕上鋼材の生産・消費内訳(鋼種別・形状別) (平成23年)
(単位:t、Unit: t)
鋼 種Kind of steel
生産Production
再冷延用消費Consumption for re-cold -rolling
鋼管用消費冷延広幅帯鋼Consumptionof cold-rolledwide strips forsteel pipes and
tubes
磨帯鋼Cold-rolled
narrow strips
冷延広幅帯鋼
Cold-rolledwide strips
冷延鋼板Cold-rolledsheets and
strips
磨帯鋼Cold-rolled
narrow strips
冷延広幅帯鋼
Cold-rolledwide strips
冷延鋼板 Cold-rolledsheets and
strips
合計 Grand total
工具鋼 Tool steel
計 Total
炭素工具鋼 Carbon tool steel
合金工具鋼Alloy tool steel
高速度工具鋼High-speed tool steel
その他の工具鋼Other tool steel
構造用鋼Structural
steel
計 Total
機械構造用炭素鋼Carbon steel for machine structure
構造用合金鋼Alloy steel for structure
特 殊
計 Total
ばね鋼Spring steel
軸受鋼Bearing steel
217
Cr-Mn系Cr-Mn stainless steel
437 30,165 - - - - -
Cr-Ni系Cr-Ni stainless steel
68,637 488,546 19,811 - - - -
Cr-Ni-Mo系Cr-Ni-Mo stainless steel
921 28,895 2,767 - - - -
10 - - - - - -
- 961,880 30 - - - -
1,425 2,771 27 - - - -
- 32 - - - - -
注:再冷延用消費は外数である。 Note: Consumption for re-cold rolling is uncounted.
(4) 特殊鋼熱間圧延鋼材消費内訳(品目別・用途別) (5) 特殊鋼冷間仕上鋼材消費内訳(品目別・用途別)
(冷間仕上鋼材用・鋼管用合計消費数量) Consumption of special cold-finished steel (by commodity/use)
Consumption of special hot-rolled steel (by commodity/use)
(for cold-finished steel/steel pipes and tubes) (単位:t、Unit: t) (単位:t、Unit: t)
計Total
冷延用For cold-
rolledproducts
鋼管用For steelpipes and
tubes
計Total
冷延用For cold-
rolledproducts
鋼管用For steelpipes and
tubes
694,639 3,887 690,752 - - -
4,104,799 3,594,466 510,333 - *105,387 -
注:鋼管専業者の消費を含む。 注:冷延用の*印は消費計から差し引いてある。
Note: Consumption by manufacturers specializing in pipes and tubes is included. Note: Figures in the "for cold-rolled products" column marked
with "*" have been subtracted from production and consumption.
(6) 特殊鋼熱間圧延鋼材用原材料 Inventory of raw materials for special hot-rolled steel
注:圧延専業事業者のみの在庫である。 Note: Inventory by manufacturers specializing in rolled steel products.
特 殊用途鋼Steel forspecial
purposes
ステンレス鋼Stainless
steel
快削鋼Free-cutting steel
品 目 Commodity 年末在庫 Inventory
高抗張力鋼High-tensile-strength steel
その他の特殊用途鋼Other steel for special purposes
合わせ鋼材 Clad steel
品 目 Commodity
品 目 Commodity
鋼板 Sheets and plates
磨帯鋼Cold-rolled narrow strips
鋼塊 Steel ingots 4,713
鋼半製品 Semi-finished steel 65,965
鋼帯 Steel strips
冷延広幅帯鋼Cold-rolled wide strips
(単位:t、Unit: t)
217

単年表 (鉄鋼編)
(1) 受払 Receipts and shipments
計Total
内冷けん・めっき用
For cold-drawing/galvanizing
販売Sales
その他Others
計Total
内生産者分By-producers
4,428,269 680,688 871,168 871,168 3,977,640 208,435 331,455 313,129
265,610 306 - - 266,059 3,767 11,040 11,040
579,500 140,335 - … 531,579 176,812 47,933 47,933
2,359,666 48,795 231,606 231,207 2,123,618 19,553 215,017 212,155
171,107 30 5,314 … 156,946 2,758 10,691 10,691
Production of ordinary hot-steel pipes and tubes by production process
(単位:t、Unit: t)
2,359,666 5 37,921 656,071 112,276 398,940 - 1,152,707 1,746
9.鋼管 Steel pipes and tubes (平成23年)(単位:t、Unit: t)
品 目Commodity
生産Production
受入Receipts
消費 Consumption 出荷 Shipments 年末在庫 Inventory
普通鋼Ordinary
steel
熱間鋼管(含溶鍛接鋼管)Hot-steel pipes and tubes
冷けん鋼管(含再生引抜鋼管) Cold-drawn steel pipes and tubes
めっき鋼管Metallic-coated steel pipes and tubes
特殊鋼Specialsteel
熱間鋼管(含溶接鋼管) Hot-steel pipes and tubes
冷けん鋼管 Cold-drawn steel pipes and tubes
(2) 普通鋼熱間鋼管製法別生産内訳
(単位:t、Unit: t)
品 目 Commodity生産
Production
普通鋼 Ordinary
steel
熱間鋼管Hot-steelpipes and
tubes
計 Total4,428,269
継目無鋼管Seamless pipes and tubes 616,608
鍛接鋼管Butt welded pipes and tubes 165,399
電縫鋼管Electric-welded pipes and tubes 2,881,780
電弧溶接鋼管Arc-welded pipes and tubes 764,482
(3) 特殊鋼鋼管生産内訳(製法別・鋼種別)及び消費内訳(鋼種別) Production (by production process/kind of steel ) and consumption (by kind of steel) of special steel pipes and tubes
品 目 Commodity 計 Total
工具鋼Tool steel
構造用鋼Structural steel
特殊用途鋼Steel for special purposes
合金工具鋼Alloy tool
steel
機械構造用炭素鋼
Carbon steel for machine structure
構造用合金鋼Alloy steel
for structure
軸受鋼Bearing steel
ステンレス鋼Stainless steel
快削鋼Free-cutting
steel
高抗張力鋼High-tensile
-strength steel
その他の特殊用途鋼Other steelfor specialpurposes
熱間鋼管
計 Total
継目無鋼管
218
1,225,689 5 37,866 637,363 112,276 272,215 - 165,048 916内ユージン・セジュルネ法Ugine-Sejournet process 75,902 5 72 1,619 2,787 70,503 - - 916
394,091 - - 18,708 - 47,272 - 327,767 344
739,886 - 55 - - 79,453 - 659,892 486
171,107 - 2,209 34,294 83,249 44,726 - 5,984 645
231,207 1 9,749 68,936 85,517 60,194 - 6,347 463
Consumption of raw materials for special steel pipes and tubes
厚板Heavy plates
鋼帯Steel stripss
3,990,407 299,193 6,437 285,682
3,216,046 244,302 43 -
293,456 14,922 - 19,718
202,488 9,446 5,877 130,121
2,465,538 200,677 - 135,843
13,240 813 517 -
241,324 18,444 注:管材を除く。
774,361 54,891 Note: Tube materials are excluded.
482,242 31,334
6,437 138
285,682 23,419
生産内訳Production
熱間鋼管Special
hot-steelpipes and
tubes
継目無鋼管Seamless pipes and tubes
電縫鋼管Electric-welded pipes and tubes
電弧溶接鋼管Arc-welded pipes and tubes
冷けん鋼管Cold-drawn steel pipes and tubes
熱間鋼管冷けん用消費Consumption of hot-steel pipes and tubes for cold-drawn
(4) 原材料(鋼管専業者分) (5) 特殊鋼鋼管用原材料の鋼種別消費内訳(鋼管専業者分) Raw materials (by manufacturers specializing in steel pipes and tubes)
by kind of steel (by manufacturers specializing in steel pipes and tubes)
(単位:t、Unit: t) (単位:t、Unit: t)
品 目Commodity
消費Consumption
年末在庫Inventory
鋼 種 Kind of steel
消費 Consumption
合計 Grand total 計 Total
機械構造用炭素鋼 Carbon steel for machine
管材Round for tubes
構造用合金鋼Alloy steel for structure
厚板Heavy plates
特殊用途鋼Steel for special
purposes
ステンレス鋼Stainless steel
鋼帯Steel strips
高抗張力鋼 High-tensile-strength steel
磨帯鋼Cold-rolled narrow strips
その他の特殊用途鋼Other steel for special purposes
亜鉛めっき鋼板Galvanized sheets
特殊鋼Specialsteel
計 Total
管材Round for tubes
厚板Heavy plates
鋼帯Steel strips
普通鋼 Ordinary
steel
計 Total構造用鋼
Structural steel
218

単年表 (鉄鋼編)
(平成23年)(1) 受払 Receipts and shipments (単位:t、Unit: t)
販売Sales
その他Others
磨棒鋼Cold-finished bars 153,599 3,407 160,500 1,265 19,883
鉄線Steel wires 673,662 226,790 443,763 404 27,062
冷間圧造用炭素鋼線Carbon steel wires for cold
heading and cold forging313,492 4,927 300,056 11,090 7,424
硬鋼線Hard-drawn wires 319,414 155,330 161,663 2,228 9,145
溶接棒心線Core wires for welding rods 155,232 155,444 30 - 2,331
針金Galvanized steel wires 90,881 5,587 86,777 8 14,006
亜鉛めっき硬鋼線Galvanized hard-drawn wires 107,302 68,679 38,716 1,043 4,593
磨棒鋼Cold-finished bars 728,146 14,277 710,341 16,137 43,717
PC鋼線PC wires 70,501 55,653 14,880 - 828
ピアノ線Piano wires 40,195 - 39,949 - 2,868
ステンレス鋼線Stainless steel wires 83,614 1,387 80,534 481 6,242
冷間圧造用炭素鋼線Carbon steel wires for cold heading
and cold forging721,116 29,169 689,785 23,536 12,057
その他の特殊鋼線Other special steel wires 441,474 38,504 384,071 33,298 9,445
299,916 … 306,009 3,079 54,171
(1) 受払 Receipts and shipments (単位:t、Unit: t)
販売Sales
その他Others
381,750 243,414 137,987 30,879
11. 鉄鋼加工製品 Secondary steel products
品 目Commodity
生産Production
出荷 Shipments 年末在庫Inventory
鋼索 Wire ropes
普通鋼Ordinary steel
冷間仕上鋼材Cold-finished
steel
めっき鋼材Coated steel
特殊鋼
Specialsteel
冷間仕上鋼材Cold-finished
steel
鋳鉄管 Cast iron pipes and tubes
10. 磨棒鋼、線類、鋳鉄管 Cold-finished steel bars, wires, and cast iron pipes and tubes
品 目Commodity
生産Production
消費Consumption
出荷 Shipments 年末在庫Inventory
295,892 162,691 132,855 14,257
53,584 53,814 24 5,021
42,569 42,668 327 2,320
11,755 11,833 - 1,435
198,583 198,727 2,655 7,833
6,124 6,212 28 921
43,601 43,245 468 2,345
254,962 254,910 1,235 13,111
343,390 343,605 - 2,988
195,458 192,024 3,354 4,726
516,049 454,161 141,125 32,903
81,806 79,496 1,779 7,010
Raw materials for cast iron pipes and tubes (単位:t、Unit: t)
鋳鉄管用For cast iron pipes and
tubes
その他Others
22,522 … 24,000 128 6,111
26,799 28,081 47,243 4,086 6,148
264,409 67 262,902 1,600 14,678
銑鉄Pig iron銑くず
Pig iron scrap鋼くず
Steel scrap
食缶 Food cans
一般缶 General cans
(2) 鋳鉄管用原材料
品 目Commodity
受入Receipts
発生Generation
消費 Consumption年末在庫Inventory
鉄くぎSteel nails
鉄丸くぎRound wire nails
特殊くぎSpecial wire nails
電気溶接棒 Electrical welding rods
ドラム缶 Steel drums
18リットル缶 18 l cans
内鋼より線 Strand wires
PC鋼より線PC strand wires
金網Wire netting
一般金網General wire netting
蛇かごWire cylinders
溶接金網Welded wire netting
219

単年表 (鉄鋼編)
(1) 受払 Receipts and shipments (単位:t、 Unit: t)
項 目Item
520,296 37,844 387,289 786,982 63,021 225,378
計 Total 26,956,113 1,295,719 11,396,040 36,944,807 385,783 3,393,017
炭素鋼くず Carbon steel scrap 25,799,883 1,068,927 9,839,447 34,278,135 338,793 2,963,519
合金鋼くず Alloy steel scrap 1,156,230 226,792 1,556,593 2,666,672 46,990 429,498
注: 鋳鉄管業者分を除く。
Notes: Figures relating to cast iron pipe business proprietors are excluded.
(2) 鉄鋼部門消費内訳 Consumption of iron and steel sections (単位:t、 Unit: t)
項 目 Item
製銑用For
iron-making
高炉Blast
furnaces
計Total
転炉LD
converters
電気炉Electricfurnaces
786,919 - 16,825 844 769,250 267,854 501,396
焼結用For
sintering
フェロアロイ用For
ferro-alloys
受入 Receipts 生産又は
発生 Production
andgeneration
消費 Consumption
年末在庫Inventory購入
Purchaseその他Others
鉄鋼部門 Iron and steel
sections
その他Others
製鋼用 For steel-making
原材料名 Kind of raw materials
銑くず Pig iron scrap
12. 銑鉄・フェロアロイ・粗鋼・鋼半製品・鍛鋼品・鋳鋼品用原材料 Raw materials for pig iron,ferro-alloys,crude steel,semi-finished steel,steel forgings,and steel castings
(平成23年)
原材料名 Kind of raw materials
銑くず Pig iron scrap
鋼くず(溶解用)Steel scrap(for melting)
合計Grand total
220
計 Total 36,923,157 64,708 371,543 9,850 36,477,056 10,953,335 25,523,721
炭素鋼くず Carbon steel scrap 34,256,485 64,708 371,543 9,850 33,810,384 10,376,495 23,433,889
合金鋼くず Alloy steel scrap 2,666,672 - - - 2,666,672 576,840 2,089,832
注: 平成14年調査票改正により、消費内訳のうち「その他の鉄鋼部門」の調査項目は廃止された。
Notes: The "other steel sections" item in the consumption by iron and steel sections was abolished in the revision of the questionnaire in 2002.
鋼くず(溶解用)Steel scrap(for melting)
220

単年表 (非鉄金属編)
<非鉄金属編>
1.非 鉄 金 属 Non-ferrous metals (平成23年)
(1) 製 品 Products
出 荷 Shipments生 産 受 入 消 費 販 売 Sales 年末在庫
品 目 単位 数 量 金額(百万円) その他Unit Value
Commodity Production Receipts Consumption Quantity (million yen) Others Inventory
電 気 金 g 131,886,688 … 4,468 130,291,983 477,610 6,000 8,194,790 Electrolytic gold電 気 銀 kg 1,724,218 … 1,068 1,685,965 143,115 - 143,951 Electrolytic silver粗 銅 t 1,662,305 … 1,492,258 13,424 10,671 156,623 - Blister copper電 気 銅 〃 1,328,288 206,418 226,926 1,241,903 833,853 64,783 56,694 Electrolytic copper銅 ケ ー ク 〃 236,000 28 60,181 176,752 133,800 - 5,309 Copper cake銅 ビ レ ッ ト 〃 72,645 - 15,972 56,136 42,319 - 1,894 Copper billets粗 鉛 ( 副 産 粗 鉛 含 む ) 〃 243,457 … 213,682 30,902 7,064 - 1,641 Lead bullion (including
crude lead sub-product )電 気 鉛 〃 215,064 - 5,056 211,027 47,571 - 7,555 Electrolytic lead亜 鉛 計 〃 544,674 - - 527,232 84,897 - 37,157 Zinc total 電 気 亜 鉛 〃 425,930 - - 410,825 62,395 - 25,658 (精 留 亜 鉛 を 含む) Electrolytic zinc (including
reflux refined zinc) 蒸 留 亜 鉛 〃 118,744 - - 116,407 22,502 - 11,499
Distilled zinc
(2)用途別原材料消費・在庫 Raw materials: Consumption/Inventory
221
(2)用途別原材料消費 在庫 Raw materials: Consumption/Inventory
①粗銅用 Blister copper
鉱量(乾量) 含 有 金 属 量 Metal content 区 分 Gross 金 銀 銅
dry tons (t) Gold (g) Silver (kg) Copper (t)
消 費 5,410,319 92,423,645 1,089,718 1,651,305 Consumption
銅 鉱 4,191,979 51,690,849 334,917 1,173,275 Copper ores
粗 銅 28,228 757,178 16,380 27,585 Blister copper
ス ク ラ ッ プ 251,492 10,941,279 273,141 151,406 Scrap
そ の 他 938,620 29,034,339 465,280 299,039 Others
年 末 在 庫 277,618 5,529,631 84,494 83,558 Inventory
銅 鉱 190,081 2,154,104 18,483 53,306 Copper ores
粗 銅 847 2,712 5 816 Blister copper
ス ク ラ ッ プ 33,672 1,569,110 44,637 14,774 Scrap
そ の 他 53,018 1,803,705 21,369 14,662 Others
Classification
221221

単年表 (非鉄金属編)
②電気銅用 Electrolytic copper
鉱量(乾量) 含 有 金 属 量 Metal content Gross dry tons (t) 金 Gold (g) 銀 Silver (kg) 銅 Copper (t)
消 費 1,629,453 93,740,386 971,152 1,603,030 Consumption
* 国 内 粗 銅 1,628,587 84,364,386 923,245 1,602,799 Domestic
金 銀 殿 物 等 773 9,376,000 47,907 154 Cement gold and silver
そ の 他 93 - - 77 Others
年 末 在 庫 65,883 4,237,091 51,319 64,027 Inventory
* 国 内 粗 銅 63,592 3,610,991 42,974 63,164 Domestic
金 銀 殿 物 等 2,284 626,100 8,345 857 Cement gold and silver
そ の 他 7 - - 6 Others
注:国内粗銅には①表に記載してある海外粗銅を再精製し、生産された粗銅を含む。Note: Blister copper, domestic marked with "*", includes the blister copper obtained by re-smelting the imported blister copper mention in ① table.
③粗鉛用 Lead bullion
区 分 鉱量(乾量) 含 有 金 属 量 Metal contentClassification Gross dry tons (t) 金 Gold (g) 銀 Silver (kg) 銅 Copper (t) 鉛 Lead (t)
消 費 327,579 2,140,085 446,425 815 205,195 Consumption 鉛 鉱 151,775 111,011 378,032 639 96,514 Lead ores ス ク ラ ッ プ 125,453 1,130,201 25,414 143 78,592 Scrap そ の 他 50,351 898,873 42,979 33 30,089 Others
(平成23年)
区 分 Classification
222
年 末 在 庫 61,413 133,191 59,946 191 32,814 Inventory 鉛 鉱 39,728 11,861 53,012 96 25,071 Lead ores ス ク ラ ッ プ 13,973 59,554 2,792 85 5,337 Scrap そ の 他 7,712 61,776 4,142 10 2,406 Others
注:ISP製錬による原料を含み、副産粗鉛の原料は含まない。 Note: Includes materials obtained by ISP smelting, and does not include materials for lead bullion obtained as by-products.
④電気鉛用 Electrolytic lead
区 分 鉱量(乾量) 含 有 金 属 量 Metal contentClassification Gross dry tons (t) 金 Gold (g) 銀 Silver (kg) 銅 Copper (t) 鉛 Lead (t)
消 費 222,129 1,499,416 653,112 242 214,865 Consumption 粗 鉛 206,441 1,052,386 542,460 242 200,285 Lead ores そ の 他 15,688 447,030 110,652 - 14,580 Others
年 末 在 庫 1,790 9,262 4,214 4 1,758 Inventory 粗 鉛 1,161 8,857 3,422 4 1,134 Lead ores そ の 他 629 405 792 - 624 Others
222222

単年表 (非鉄金属編)
(平成23年)
⑤電気亜鉛用 Electrolytic zinc
区 分 鉱量(乾量) 含 有 金 属 量 Metal contentClassification Gross dry tons (t) 金 Gold (g) 銀 Silver (kg) 銅 Copper (t) 鉛 Lead (t) 亜鉛 Zinc (t)
消 費 734,913 226,852 186,257 2,439 10,640 389,228 Consumption 亜 鉛 鉱 666,114 226,852 186,257 2,439 10,640 343,388 Zinc ores ス ク ラ ッ プ 848 - - - - 835 Scrap そ の 他 67,951 - - - - 45,005 Others
年 末 在 庫 38,286 9,611 8,448 87 828 19,614 Inventory 亜 鉛 鉱 38,286 9,611 8,448 87 828 19,614 Zinc ores ス ク ラ ッ プ - - - - - - Scrap そ の 他 - - - - - - Others
⑥蒸留亜鉛・精留亜鉛用 Distilled zinc/Reflux refined zinc
区 分 鉱量(乾量) 含 有 金 属 量 Metal contentClassification Gross dry tons (t) 金 Gold (g) 銀 Silver (kg) 銅 Copper (t) 鉛 Lead (t) 亜鉛 Zinc (t)
消 費 314,646 169,447 73,289 2,374 7,943 159,711 Consumption 亜 鉛 鉱 187,245 153,123 45,229 1,254 5,155 95,489 Zinc ores ス ク ラ ッ プ 1,603 - - - - 179 Scrap そ の 他 125,798 16,324 28,060 1,120 2,788 64,043 Others
223
年 末 在 庫 57,315 40,126 15,563 406 1,438 29,004 Inventory 亜 鉛 鉱 44,847 36,276 10,092 330 1,248 24,341 Zinc ores ス ク ラ ッ プ - - - - - - Scrap そ の 他 12,468 3,850 5,471 76 190 4,663 Others注:蒸留亜鉛の原料にはISP製錬による原料を含む。Note: Distilled zinc includes that obtained by ISP smelting.
(3)労務 Labor (単位:人、 Unit: persons)
区 分 非 鉄 金 属 部 門 Non-ferrous metal section 事業所Classification 金・銀 Gold/Silver 銅 Copper 鉛 Lead 亜鉛 Zinc Total for the establishment年末従事者数
252 1,173 409 668 5,338
注:鉱種別の分類は主体鉱種による。Note: Classification of ores is based on the dominant ore body.
(4)生産能力・稼働率 Production capacity/Operating ratio ( 単位:t、%、 Units: t、%)
区 分 電 気 金 電 気 銀 粗 銅 電 気 銅 粗 鉛 Electrolytic gold Electrolytic silver Blister copper Electrolytic copper Lead bullion
Classification (kg) (kg)能 力(年末) 16,300 233,000 166,300 149,283 28,450
Capacity(year-end)稼 働 率(年平均) 67.4 61.7 83.3 74.1 71.3
Operating ratio(average)
区 分 電 気 鉛 亜 鉛Classification Electrolytic lead Zinc total
能 力(年末) 23,150 62,760Capacity(year-end)稼 働 率(年平均) 77.4 72.3
Operating ratio(average)
注:亜鉛の能力には精留亜鉛の能力を含む。 Note: Zinc total includes that capacity of reflux refined zinc
Number of persons engagedat the end of year
223223

単年表 (非鉄金属編)
2.アルミニウム Aluminum (平成23年)
(1) 製品 Products (単 位:t、 Unit: t)
生 産 受 入 消 費 販 売 Sales 年末在庫
品 目 数 量 金額(百万円) その他
Commodity Production Receipts Consumption Quantity Value Others Inventory
(million yen)
精 製 ア ル ミ ニ ウ ム 地 金 43,324 10 17,538 25,665 10,353 130 2,938
High-grade aluminum metal
ア ル ミ ニ ウ ム 合 金 地 金 計 304,585 658 … 301,121 72,930 2,867 8,813
Total of aluminum alloy ingots
鋳 物 用・ダ イ カ ス ト 用 92,597 658 … 92,410 25,593 213 5,190
For castings/die castings
そ の 他 用 211,988 - … 208,711 47,338 2,654 3,623
For others
ア ル ミ ニ ウ ム 二 次 地 金 計 141,789 11,305 … 137,688 26,247 15,347 2,754
Total of secondary aluminum ingots
脱 酸 用 75,025 11,210 … 76,560 15,804 9,421 1,831
For deoxidizing
そ の 他 用 66,764 95 … 61,128 10,444 5,926 923
For others
ア ル ミ ニ ウ ム 二 次 合 金 地 金 計 915,450 31,214 … 894,815 196,018 32,705 33,279
Total of secondary aluminum alloy ingots
鋳 物 用・ダ イ カ ス ト 用 826,813 20,979 … 826,538 181,902 18,632 30,802
For castings/die castings
そ の 他 用 88,637 10,235 … 68,277 14,115 14,073 2,477
For others
出 荷 Shipments
224
For others
ア ル ミ ニ ウ ム 粉 12,882 - 19 12,623 15,792 - 1,816
Aluminum powder
(2)原材料 Raw materials (単 位:t、 Unit: t)
Consumption Inventory
ア ル ミ ニ ウ ム 地 金 343,046 11,078
ア ル ミ ニ ウ ム 二 次 地 金 267,955 23,161 Secondary aluminum ingots
ア ル ミ ニ ウ ム の く ず 884,634 53,232 Aluminum scrap and secondary alumium-base alloy scrap
ア ル ミ ニ ウ ム 滓 ( ド ロ ス ・ 灰 ) 118,586 2,238 Aluminum dross
銅 及 び 銅 の 故 又 は く ず 9,223 968 Copper and copper scrap
(3)労務 Labor (単位:人、 Unit: persons)
区 分
Classification
ア ル ミ ニ ウ ム 部 門
Aluminum sections
事 業 所
Total for the establishment
年末従事者数
Number of persons engaged atthe end of year
3,176
5,610
品 目
消 費 年 末 在 庫
Commodity
Aluminum metal
224

単年表 (非鉄金属編)
3.非鉄金属製品(伸銅製品) Non-ferrous metal products (Elongated copper products) (平成23年)
(1) 製 品 Products (単位:t、 Unit: t)
出 荷 Shipments
品 目 生 産 受 入 消 費 年末在庫
数 量 金額(百万円) そ の 他
Commodity Production Receipts Consumption Quantity Value Others Inventory(million yen)
合 計 824,431 5,646 15,899 808,432 743,635 3,651 35,809
Total
銅 製 品 計 424,210 1,556 - 422,641 429,688 2,050 13,663
Total of copper products
板 16,184 172 - 16,397 15,563 - 768
Plates and sheets
条 237,197 102 - 234,849 245,900 2,050 8,653
Strips
管 133,201 1,081 - 133,831 129,506 - 3,014
Pipes and tubes
棒 ・線 37,628 201 - 37,564 38,719 - 1,228
Rods and bars/wires
黄 銅 製 品 計 345,844 3,261 14,532 332,114 238,544 1,599 17,622
Total of brass products
板 8,036 25 49 7,933 6,766 1 511
Plates and sheets
条 106,003 275 781 104,766 81,649 791 4,669
Strips
管 10,617 13 - 10,493 10,615 - 171
Pipes and tubes
販 売 Sales
225
Pipes and tubes
棒 191,281 2,948 9,219 183,854 118,427 797 8,749
Rods and bars
線 29,907 - 4,483 25,068 21,088 10 3,522
Wires
その他の伸銅製品計 54,377 829 1,367 53,677 75,402 2 4,524
板・条 45,884 798 149 46,362 67,721 - 4,192
Plates and sheets/strips
棒・線 8,493 31 1,218 7,315 7,681 2 332
Rods and bars/wires
Total of other non-ferrous metal products
225

単年表 (非鉄金属編)
(平成23年)(2) 原材料 Raw materials
品 目 単位 生 産 (発生) 消 費 年 末 在 庫
Commodity Unit Production Consumption Inventory(by-production)
電 気 銅 t … 376,209 6,468
Electrolytic copper
銅 の 故 又 は く ず t 158,505 184,333 6,515
Copper scrap
銅 合 金 の 故 又 は く ず t 175,310 332,529 11,459
Copper base alloy scrap
亜 鉛 t … 52,692 1,143
Zinc
再 生 亜 鉛 t 2,422 8,699 353
Re-melted zinc
(3) 労務 Labor (単位:人、 Unit: persons)
Classification 区 分年末従事者数
Number of persons engaged at the end of year
伸 銅 部 門 7,552 Elongated copper sections
事 業 所 18,412 Total for the establishment
226
(4) 生産能力・稼働率 Production capacity/Operating ratio
伸 銅 品
Classification区 分単位
Unit Elongated copper
products
95,935 Production capacity (year-end)
稼 働 率 (年平均) % 71.5 Operating ratio (average)
生 産 能 力 (年末) t
226

単年表 (非鉄金属編)
(平成23年)
(1) 製品 Products (単位:t、Unit: t)
品 目 生 産 受 入 消 費 販 売 Sales 年末在庫
金額(百万円) その他Commodity Production Receipts Consumption Value Others Inventory
(million yen)
合計 (はくを除く) 1,975,125 34,366 454,737 1,520,219 678,287 29,723 57,923
Total (excluding foils)
板製品 1,192,726 7,254 39,996 1,149,986 451,735 8,177 45,653
Flat rolled products
板 151,405 2,839 - 152,287 69,461 1,874 4,812 Plates and sheets
円 板 20,449 - 126 19,941 12,700 285 697 Circles
条 1,020,872 4,415 39,870 977,758 369,574 6,018 40,144 Strips
押出製品 782,399 27,112 414,741 370,233 226,552 21,546 12,270
Extruded products
管 51,380 8 837 48,935 35,717 1,840 1,015 Pipes and tubes
棒 ・ 線 48,119 11,507 222 56,089 24,474 2,213 2,916
Rods and bars/wires
形 材 682,900 15,597 413,682 265,209 166,361 17,493 8,339 Shapes and profiles
は く 118,327 7,132 - 116,395 113,179 8,497 5,782 Foils
(2) 原材料 Raw materials (単位:t、Unit: t)
生産(発生) 消 費 年末在庫Production
(by-Consumption Inventory
出 荷 Shipments
数 量Quantity
品 目 Commodity
4. 非鉄金属製品(アルミニウム圧延製品) Non-ferrous metal products (Aluminum mill products)
227
361,339 1,366,978 81,246 Aluminum ingots
2,125,013 2,624,611 80,272 Aluminum alloy ingots
7,564 189,870 9,945 Secondary aluminum ingots
1,384,006 1,516,667 41,728 Aluminum scrap
(3) 労務 Labor (単位:人、Unit: persons)
Number of persons engagedat the end of year
13,218 Aluminum mill sections
28,339 Total for the establishment
(4) 生産能力・稼働率 Production capacity/Operating ratio (単位:t/月・%、Unit:t/month・%)能力(年末) 稼働率(年平均)
Capacity(year-end)
Operatingratio
(average)
アルミニウム圧延製品 (はくを除く) 213,057 77.9 Aluminum mill products (excluding foils)
板、円板、条 126,120 79.8 Plates and sheets, circles, strips
管、棒・線、形材 86,937 75.3 Pipes and tubes, rods and bars/wires, shapes and profiles
アルミニウムはく 11,855 83.2 Aluminum foils
ア ル ミ ニ ウ ム 地 金
ア ル ミ ニ ウ ム 合 金 地 金
事 業 所
区 分 Classification
ア ル ミ ニ ウ ム 二 次 地 金
ア ル ミ ニ ウ ム く ず
区 分年末従事者数
Classification
ア ル ミ ニ ウ ム 圧 延 部 門
227

単年表 (非鉄金属編)
(平成23年)
(1)-1 製 品 Products
品 目 単位 生 産 受 入 年末在庫
金額(百万円) そ の 他
Commodity Unit Production Receipts Value Others Inventory
(million yen)
銅裸線(電線メーカー向け心線) 導体t 471,683 29,970 439,518 259,727 63,814 5,840 Bare copper wires(for electric wire manufactures)
metal core tons
銅線(完成品)合計 〃 646,941 260,381 700,620 1,221,877 201,133 46,667 Copper wires (complete) total
裸線(ユーザー向け) 〃 60,055 7,208 60,799 55,049 6,404 1,125 Bare copper wires (for users)
絶縁電線計 〃 586,886 253,173 639,821 1,166,828 194,729 45,542 Insulated wires total
巻線 〃 136,839 95,064 133,289 135,766 97,875 11,408 Winding wires
機器用電線 〃 44,197 3,181 45,013 161,699 2,476 3,856 Appliance wires
輸送機器用電線 〃 45,340 36,335 44,962 364,687 36,532 1,237 Wires and cables for transport equipment
通信用電線・ケーブル 〃 25,262 5,552 25,933 54,903 4,510 5,644 Telecommunication wires/cables
電力用電線・ケーブル 〃 192,625 89,158 242,379 247,692 38,546 12,364 Power wires/cables
その他の絶縁電線 〃 142,623 23,883 148,245 202,081 14,790 11,033 Miscellaneous insulated wires
and cables
5.非鉄金属製品(電線・ケーブル)、光ファイバ製品 Non-ferrous metal products(Electric wires/cables) ,and optical fiber products
出 荷 Shipments
販 売 Sale
数 量Quantity
228
and cables
アルミニウム線 〃 31,999 7,588 24,754 16,850 14,887 1,017 Aluminum wires
光 フ ァ イ バ 製 品 kmコア 34,798,808 148,554 34,507,857 102,603 356,234 712,585 Optical fiber products km core
通 信 用 ケ ー ブ ル 計 〃 11,987,781 148,554 11,728,979 … 320,971 482,599 Total of telecommunication cables
光ファイバケ-ブル(通信複合ケ-ブルを含む) 〃 11,770,388 148,553 11,525,142 … 316,596 461,535 Optical fiber cables (including lecommunication composite cables)
そ の 他 の 光 ケ ー ブ ル 〃 217,393 1 203,837 … 4,375 21,064 Other optical fiber products
光ファイバ心線(ユーザー向け) 〃 22,811,027 - 22,778,878 … 35,263 229,986 Optical fiber core wires (for users)
(1)-2 光ファイバ製品販売先内訳 Sales breakdown by industrial sector of optical fiber products
品 目 単位 合 計 通信・電力業 建設・設備施工業 電気機械工業 輸送機械工業 その他
Telecommunications Construction/ Electrical Transport
Commodity Unit Total /electric power facility installation machinery equipment Others
companies industries
光 フ ァ イ バ 製 品 kmコア 34,507,857 8,996,367 390,276 638,738 2,586 24,479,890 Optical fiber products km core
通信用ケーブル計 〃 11,728,979 8,970,517 382,617 291,461 2,579 2,081,805 Total of telecommunication cables
光ファイバケ-ブル(通信複合ケ-ブルを含む) 〃 11,525,142 8,848,535 382,197 235,013 2,534 2,056,863 Optical fiber cables (including lecommunication composite cables)
その他の光ケーブル 〃 203,837 121,982 420 56,448 45 24,942 Other optical fiber products
光ファイバ心線(ユーザー向け) 〃 22,778,878 25,850 7,659 347,277 7 22,398,085
Optical fiber core wires (for users)
228

単年表 (非鉄金属編)
(平成23年)
品 目
Commodity
電 気 銅 … Electrolytic copper
さ お 銅
Copper wire bars
銅 荒 引 線 Copper wire rods
銅 の 故 又 は く ず Copper scrap
(3) 労務 Labor (単位:人、 Unit:persons)
(4) 生産能力・稼働率 Production capacity/Operating ratio
事 業 所 32,985 Total for the establishment
電 線 ・ ケ - ブ ル 部 門 17,677 Electric wires/cables sections
光 フ ァ イ バ 部 門 3,108 Optical fiber sections
区 分年 末 従 事 者 数
Number of persons engagedat the end of year
Classification
68,773 149,316 6,664
2,204 2,342 72
598,510 835,464 16,443
(by-production) Consumption Inventory
670,260 8,517
Production
(2) 電線・ケーブル原材料 Raw materials of Electric wires/cables (単位:t、Unit:t)
生 産(発生) 消 費 年末在庫
229
(4) 生産能力 稼働率 Production capacity/Operating ratio
ア ル ミ ニ ウ ム 線Aluminum wires
〃 14,183 18.0
通信用ケーブル光ファイバ製品Optical fiber products
for telecommunication cables
kmコアkm core
1,635,782 61.1
銅 裸 線Bare copper wires
導体tmetal core tons
70,573 62.8
銅 絶 縁 電 線Copper insulated wires
〃 83,890 58.0
区 分Classification
単 位Unit
生 産 能 力(年末)Production capacity
(year-end)
稼 働 率 (年平均)(%)Operating ratio(average)(%)
229

単年表 (非鉄金属編)
(平成23年)
(1) 製 品 Products
出 荷 Shipments
販 売 Sales
品 目 単 位 生 産 受 入 消 費 金 額 その他 年末在庫
数 量 (百万円)
Commodity Unit Production Receipts Consumption Quantity Value Others Inventory
(million yen)
高 純 度 多 結 晶 シ リ コ ン kg 12,132,997 - 251,161 10,108,184 66,080 4,639 2,669,977
High-purity polycrystal silicon
シ リ コ ン ウ エ ハ 計 ㎡ 2,849,334 1,832,569 - 3,097,235 447,221 1,574,871 156,318
Silicon wafers
〃 (103sq. in.) (4,418,268) (2,841,629) (-) (4,802,642) … (2,442,043) (242,393)
5 イ ン チ ( 1 2 5 m m ) 以 下 ㎡ 86,211 118,021 - 135,340 … 69,917 8,275
< 5in.
〃 (103sq. in.) (133,684) (183,013) (-) (209,856) … (108,417) (12,832)
6 イ ン チ ( 1 5 0 m m ) ㎡ 242,564 220,012 - 311,700 … 155,752 8,976
6in.
〃 (103sq. in.) (376,125) (341,153) (-) (483,326) … (241,517) (13,919)
8 イ ン チ ( 2 0 0 m m ) ㎡ 671,414 409,472 - 712,157 … 372,538 36,976
8in.
〃 (103sq. in.) (1,041,121) (634,932) (-) (1,104,286) … (577,667) (57,338)
1 2 イ ン チ ( 3 0 0 m m ) 以 上 ㎡ 1,849,145 1,085,064 - 1,938,038 … 976,664 102,091
12in. <
6.非鉄金属製品(高純度多結晶シリコン,シリコンウエハ、はんだ、銅合金塊) Non-ferrous metal products (High-purity polycrystal silicon, silicon wafers, solders and copper alloy ingots)
〃 (103sq. in.) (2,867,338) (1,682,531) (-) (3,005,174) … (1,514,442) (158,304)
は ん だ t 16,415 128 14 16,167 71,751 11 2,403
Solders
銅 合 金 塊 t 82,524 2,963 1,005 82,861 58,349 1,595 3,121
Copper alloy ingot
注: ( )内は、「sq.in.」単位の数値である。「sq.in.」とはスクエアインチを表し、「sq.in.」単位の数値に換算係数を乗じたものが「㎡」単位の数値である。
Note: The unit of numbers in parentheses is square inch (sq. in.). The unit "m3" is "sq. in." multiplied by a conversion coefficient.
(2) 原材料 Raw materials
品 目 単 位
Commodity Unit
鉛 t … 1,548 236
Lead
再 生 鉛 t 26 230 28
Re-melted lead
鉛 の 故 又 は く ず t 173 435 62
Lead scrap
(3) 労務 Labor (単位:人、 Unit: persons)
年 末 従 事 者 数Number of persons engaged at the end of year
9,990
28,963
生産(発生)Production
(by-production)
消 費
Consumption
年末在庫
Inventory
区 分Classification
高純度多結晶シリコン、シリコンウエハ、はんだ、銅合金塊部門
High-purity polycrystal silicon,silicon wafers, solders, and copper alloy ingots sections
事 業 所
Total for the establishment
230

単年表 (非鉄金属編)
7. 軽金属板製品 Light metal plate products
(1)製品 Products
(平成23年)
生 産 受 入 年末在庫品 目 (製 品)
Commodity Production Receipts その他 Inventory数 量 金額 (百万円) OthersQuantity Value (million yen)
合 計 361,460 39,892 330,339 367,095 68,675 29,647 Total
日用品 1,195 141 1,486 3,612 54 308Daily necessities
産業用品計 360,265 39,751 328,853 363,483 68,620 29,339For industry
電気器具用品 2,684 - 2,678 4,648 - 79Parts for electric equipment
船舶・車両用品 4,740 - 4,722 11,951 - 125Parts for ships
飲料用缶計 342,182 39,004 310,980 312,710 67,692 28,940Cans for beverages
缶体 242,916 15,727 229,535 218,176 29,171 14,503Can bodies
缶ふた 99,266 23,276 81,445 94,534 38,522 14,437Can lids
(単位:t、 Unit:t)
出 荷 Shipments
販 売 Sales
231
Can lids
その他の産業用品 10,658 747 10,473 34,174 928 194Others
*産業用アルミニウム製品 18,083 747 17,873 50,773 928 398
*Industrial aluminum
注:*産業用アルミニウム製品は、電気器具用品、船舶・車両用品、その他産業用品の計である。
(2) 労務 Labor (単位:人、 Unit: persons)
軽 金 属 板 製 品 部 門
事 業 所
(3) 生産能力 Production capacity
能 力 (年 末) tCapacity
(year-end)
Classification Cans for beverages
缶 体 Can bodies 缶 ふ た Can lids
26,743 10,740
5,181Light metal plate productssections
9,773 Total for the establishment
区 分単 位
Unit
飲 料 用 缶
区 分年 末 従 事 者 数
ClassificationNumber of persons engaged at the end of year
231

単年表 (金属製品編)
(平成23年)
1. 鉄構物及び架線金物Steel structures and transmission line hardware
鉄構物
Steel structures
鉄骨
Structural steel frames
軽量鉄骨
Light structural steel frames
橋りょう(陸橋・水路橋・海洋橋等)
Steel bridges (highway bridges/aqueduct bridges/other steel briges)
鉄塔(送配電用・通信用・照明用・広告用等)
Steel towers (transmission/radio/lighting/advertising, etc)
水門(水門巻上機を含む)
Water gates (including water gate winches)
鋼管(ベンディングロールで成型したものに限る)
Steel pipes (only those formed by bending rollers)
架線金物
Transmission line hardware
39,748(〃)
8,241
49,413
(103n)
17,966(〃)
32,729(〃)
181,132(千個)
176,434(〃)
290,194(〃) 199,704
金額(百万円)Value
(million yen)
176,639
(1) 製品 Products
1,019,843(〃)
重量・数量weight/Quantity
(t),(103n)
465,4051,576,914 t
品 目Commodity
生産 Production
<金属製品編> Fabricated metal
13,844
45,602
21,375
232
Transmission line hardware
送変電用
For transmission lines and substations
配電用
For distribution lines
通信線路用・電車線用
For communications/electric railways
(2) 労務 Labor
5,107
17,495
鉄構物及び架線金物部門
区 分Classification
年末従事者数Number of persons engaged
at the end of year
(10 n)
12,784(〃)
26,811
Total for the establishment
Steel structures and transmission line hardware sections
事業所
単位:人、Unit:Persons
16,691
35,560
80,962(〃)
87,386(〃)
232

単年表 (金属製品編)
2. ばね (平成23年)
Springs
受 入 出 荷 Shipments 年末在庫
Receipts 販売 Salesその他Others Inventory
重量(t) 金額(百万円) 重量(t) 重量(t) 金額(百万円) 重量(t) 重量(t)
Weight Value Weight Weight Value Weight Weight
(t) (million yen) (t) (t) (million yen) (t) (t)
406,745 300,138 34,974 437,231 319,620 3,969 22,655
かさね板ばね 71,612 23,711 18,585 89,738 27,494 399 8,449
Leaf springs
つるまきばね 96,228 25,636 922 95,421 25,633 1,466 3,426
Coil springs
ねじり棒ばね 61,383 23,308 70 61,023 23,563 117 4,741
Torsion bar springs
線ばね 86,668 99,584 4,763 91,419 108,689 277 3,267
Wire springs
自動車用(シート用ばねを除く) 52,573 54,969 2,521 54,924 59,478 268 2,658Wire springs for automobiles (excluding seatsprings)
(1)製品 Products
品 目Commodity
生 産
Production
ばね
Springs
233
springs)
その他の線ばね(機械用・シート用ばねを含む) 34,096 44,615 2,242 36,495 49,211 9 609Other wire springs(Including for machinery / seat springs)
うす板ばね 80,973 123,114 7,000 86,168 128,616 1,711 2,348
Flat springs
ばね座金 9,881 4,786 3,634 13,462 5,625 - 423
Washer springs
(2)労務 Labor 単位:人、Unit:Persons
区 分年末従事者数
Number of persons engagedClassification at the end of year
ば ね 部 門11,825
Springs sections
事 業 所17,439
Total for the establishment
233233

単年表 (金属製品編)
3. 弁及び管継手 (平成23年) Valves and pipe fittings
(1)製品 Products生 産 Production
数量(千個) 重量(t) 金額(百万円)Quantity Weight Value
(103n) (t) (million yen)
104,091 160,846 397,466
23,538 76,497 162,645
4,576 7,335 59,760
404 7,189 17,566
3,672 52,770 60,116
14,885 9,203 25,203
20 2,021 6,004
35,100 55,589 124,493
14,547 25,081 41,373
2,468 4,879 16,757
12,079 20,202 24,617
20,554 30,507 83,120
13 555 16 590 38 627
品 目Commodity
バルブ及びコック Valves and cocks
一般用バルブ及びコック General valves and cocks
ステンレス鋼製(自動調整弁・高温高圧弁を除く) Made of stainless steel (excluding control valves/high-temperature, high-pressure valves)
鋳鋼・鍛鋼製 ( 〃 ) Made of cast steel/forged steel (excluding control valves/high-temperature, high-pressure valves)
鋳鉄製(自動調整弁を除く) Made of cast iron (excluding control valves)
青銅・黄銅製( 〃 ) Made of bronze/brass (excluding control valves)
高温高圧弁(自動調整弁を除き圧力6.5MPa以上で温度350℃以上のものに限る)
High-temperature, high-pressure valves
自動調整弁 Control valves
自力式 Self-contained control valves
安全弁・スチームトラップ Safety valves/steam traps
その他の自力式 Other self-contained control valves
他力式 Power-drive control valves
電磁弁 Solenoid operated valves
234
13,555 16,590 38,627
6,999 13,918 44,493
45,433 26,741 104,324
28,483 18,329 86,424
16,950 8,411 17,900
267,778 112,616 90,991
138,920 37,441 24,733
90,717 66,726 48,561
38,141 8,450 17,697
(2)労務 Labor 単位:人、Unit:Persons
弁及び管継手部門 Valves and pipe fittings sections
事 業 所 Total for the establishment
電磁弁 Solenoid operated valves
その他の他力式 Other power-drive control valves
給排水栓類 Plumbing fixtures
給水栓(便器洗浄弁・ボールタップ・排水用トラップを含む) Faucets (including flush valves/ball taps/traps)
止水栓・分水栓 Stop cocks/snap tap cocks
14,894
29,041
管継手(フランジ形を含む) Pipe fittings (including flange type)
可鍛鋳鉄製 Made of malleable iron castings
鋼管製 Made of steel pipes and tubes
非鉄金属製 Made of non-ferrous metals
区 分 Classification
年末従事者数
Number of persons engaged
at the end of year
234

単年表 (金属製品編)
4. 空気動工具、作業工具、のこ刃及び機械刃物 (平成23年)
Pneumatic tools, machinist hand tools, saw blades and knives for machines
(1)製品 Products
年末在庫Inventory
数量・重量 金額(百万円) 数量・重量 金額(百万円) 数量・重量
Quantity/weight Value Quantity/weight Value Quantity/weight
(103n),(n),(t) (million yen) (103n),(n),(t) (million yen) (103n),(n),(t)
空気動工具 Pneumatic tools 1,279,478(台) 22,811 1,316,426(台) 27,182 159,678(台)
作業工具 Machinist hand tools 100,095(千個) 40,051 104,303(千個) 41,716 10,945(千個)(10
3n) (10
3n) (10
3n)
レンチ・スパナ Wrenches/spanners
41,282(〃) 13,071 42,899(〃) 13,885 6,678(〃)
プライヤ・ペンチ(ニッパー等を含む) Pliers/cutting pliers (including cutting nippers)
8,218(〃) 4,791 8,311(〃) 5,350 650(〃)
ドライバ(硬鋼線使用のものに限る) Screwdrivers (only those used hard drawn steel wires)
39,921(〃) 3,773 42,547(〃) 4,249 1,792(〃)
その他の作業工具 * Other machinist hand tools *
10,674(〃) 18,416 10,546(〃) 18,232 1,825(〃)
のこ刃 Saw blades 2,482( t ) 8,376 2,441( t ) 8,272 66( t )
機械刃物 Knives for industry (machines) 10,129(〃) 20,032 9,258(〃) 22,755 718(〃)
鋼板せん断用刃物(シャーブレード) Shear blades
1,048(〃) 2,475 1,044(〃) 2,437 67(〃)
合板機械用 木工機械用刃物
品 目Commodity
生 産Production
販 売Sales
235
合板機械用・木工機械用刃物 Knives for veneer machinery/for wood-working machinery
3,901(〃) 7,366 3,682(〃) 7,095 262(〃)
その他の機械刃物 Other knives for industry (machines) 5,180(〃) 10,191 4,532(〃) 13,223 389(〃)
(2)労務 Labor 単位:人、Unit:Persons
空気動工具、作業工具、のこ刃及び機械刃物部門
Pneumatic tools, machinist hand tools, saw bladesand knives for machines
事 業 所
Total for the establishment
年末従事者数
Number of persons engaged
at the end of year
5,908
13,119
注*: その他の作業工具には、金床、パイプねじ切り器、ボルトクリッパ、パイプカッタ、手動研磨機、ラチェットボール、手廻しタップホルダ、 携帯電気ドリル用チャック、トーチランプ、ハンドドリル、ハンド溶接切断機、万力等が含まれる。
Note*: Other machinist hand tools include anvils, die stocks (for pipe threading), bolt clippers, pipe cutters, hand grinders, ratchet bores (hand bores), hand tap holders, chucks for portable electric drill, blow torch, hand drills, vices, etc.
区 分Classification
235

単年表 (金属製品編)
5.ガス機器、石油機器及び太陽熱温水器 (平成23年) Gas and oil equipment for cooking, boiling and heating, and solar water heaters
(1)製品 Products出 荷 Shipments
販 売 Sales その他 Others
数量(台) 数量(台) 数量(台) 金額(百万円) 数量(台) 数量(台)
Quantity Quantity Quantity Value Quantity Quantity
(n) (n) (n) (million yen) (n) (n)
ガス機器 9,024,204 1,647,150 9,032,292 343,383 1,658,163 564,755
ガスこんろ(液化石油ガスこんろ、普通鋳物製七輪を除く) 4,412,897 621,977 4,293,438 108,050 770,805 313,088
ガス湯沸器 2,258,440 821,235 2,379,966 73,204 689,512 145,760
瞬間形(元止式(給湯配管の出来ないもの)) 470,061 277,570 472,707 6,909 279,311 34,430
瞬間形(先止式(給湯配管の出来るもの))・貯湯形(注1) 1,788,379 543,665 1,907,259 66,295 410,201 111,330
ガス温水給湯暖房機(注2) 316,092 17,113 326,675 46,276 3,467 19,180
ガス風呂がま(バーナ付きの一体のものを含む) 1,320,628 186,825 1,307,005 99,797 192,235 61,216
ガスストーブ(排気筒のないもの) 443,905 - 457,875 8,639 1,222 14,023
ガス温風暖房機(暖房方式が強制対流のもの) 272,242 - 267,333 7,417 922 11,488
Gas heaters with circulating fan
Gas-fired water heaters and space heaters
132,731
Gas bath boilers
8,448
Gas space heaters
8,351
Gas-fired water heaters
5,610
Instantaneous type (main stop system)
70,820
Instantaneous type (end stop system)/storage type
49,734
380,830
Gas appliances
105,136
Gas cooking appliances
76,430
品目Commodity
生 産 Production 受入 Receipts年末在庫Inventory
金額(百万円)
Value
(million yen)
石油機器 6,464,564 675,261 6,475,786 120,130 572,814 545,777
石油ストーブ 5,822,798 556,063 5,860,336 67,738 462,394 477,503
Oil-burning space heaters
しん式(排気筒のないもの) 2,345,255 27,506 2,386,672 19,050 - 68,831
Wick type
気化式(排気筒のないもの) 3,477,543 528,557 3,473,664 48,688 462,394 408,672
石油温風暖房機(強制給排気・排気式) 216,755 11,964 195,669 15,174 6,794 39,156
石油温水給湯暖房機(注2) 425,011 107,234 419,781 37,218 103,626 29,118
Oil-burning water heaters for residential use
石油温水給湯機(注4) 139,967 51,412 181,493 17,938 6,810 6,627
太陽熱温水器 26,961 16,259 43,048 3,318 371 2,119
(2)労務 Labor
注1.貯蔵形を含み、伝熱面積8㎡以下で0.1MPa以下のもの。
注2.伝熱面積8㎡以下で0.1MPa以下及び伝熱面積2㎡以下で 0.2MPa以下のもの。
注3.急速加熱方式で熱交換器容量30l以下のもの。
注4.石油小形給湯機以外の暖房・給湯に用いる石油温水小型
ボイラのもの。
Classification Number of persons engaged
at the end of year
ガス機器、石油機器及び太陽熱温水器部門
12,811Gas and oil equipment for cooking, boiling and heating,and solar water heaters sections
事 業 所18,189
Total for the establishment
Oil-burning water heaters
2,119
Solar water heaters 注.「ガス機器」は、平成23年調査票改正により、一部調査品目を削除したため、平成22年以前の数値とは連続していません。
区 分 年末従事者数
55,822 238,288 19,280 96,816 22,491
18,205
Vaporizing type
15,833
Oil-burning warm air furnaces (forced intake/exhaust type)
40,523
Oil-fired water heaters and space heaters
石油小形給湯機(注3) 285,044 22,318
118,434
Oil appliances
62,078
20,220
41,858
236

単年表 (金属製品編)
6.粉末や金製品(超硬チップを除く) Sintered products (excluding cemented carbide tips)
(1)製品 Products
For others
摩擦材料
Machine parts
輸送機械用 82,864 97,117
For transport equipment
その他用の機械部品 7,854 15,594
For transport equipment
その他用の軸受合金 2,536 5,628
For others
機械部品 90,718 112,711
Machine materials
軸受合金 6,389 13,250
Bearings
輸送機械用 3,853 7,622
粉末や金製品 140,676 321,161
Sintered products
機械材料 97,836 131,727
(平成23年)
品 目Commodity
生産Production
重量(t) 金額(百万円)Weight Value
(t) (million yen)
単位:人、Unit:Persons
粉末や金製品部門7,385
Sintered products sections
事 業 所122,567
Total for the establishment
Other sintered products (excluding cemented carbide tips)
(2)労務 Labor
区 分Classification
年末従事者数
Number of persons engagedat the end of year
Hard magnetic materials
軟質 9,617 36,164
Soft magnetic materials
その他の粉末や金製品(超硬チップを除く) 1,392 22,757
Sintered electric contact materials
磁性材料 41,372 163,176
Magnetic materials
硬質 31,755 127,012
摩擦材料 729 5,766
Friction materials
電気接点 77 3,501
237

単年表 (金属製品編)
7.鍛工品 Forgings from billets and bars
(1) 製品 Products
鍛工品 Forgings from billets and bars
鉄系 Ferrous forgings
熱間鍛造品 Hot forgings
型鍛造品 Closed die forgings
産業機械・土木建設機械用 … For industrial machinery/engineering and construction machinery
自動車用 … For automobiles
その他用の型鍛造品 … For others
自由鍛造品 Open die forgings
産業機械・土木建設機械用 … For industrial machinery/engineering and construction machinery
輸送機械用 … For transport equipment
その他用の自由鍛造品 … For others
リングロール品 Ring rolling
産業機械・土木建設機械用 … For industrial machinery/engineering and construction machinery
自動車用 … For automobiles
その他用のリングロール品 … For others
冷間鍛造品 Cold forgings
(平成23年)
51,217
88,955
11,198
22,757
165,317
70,967
27,933
14,144
287,501
10,520 3,414
53,275
45,811
27,345
11,912
6,452
83,676
112,379 35,068
21,778
278,143
1,685,005
2,056,182 509,458
434,405
x
(t)
2,145,137
1,280,391
79,704
319,634
2,186,874
By use
消費 Consumption
重量(t)
Weight
(t)
292,235
(million yen)
Weight
用途別 重量(t)
生産 Production
金額(百万円)
Value
574,913
532,215
自動車用 … For automobiles
その他用の冷間鍛造品 … For others
アルミニウム系 x Aluminum forgings
自動車用 … For automobiles
その他用 … For others
熱間鍛造品 Hot forgings
自動車用 … For automobiles
その他用の熱間鍛造品 … For others
冷間鍛造品 Cold forgings
自動車用 … For automobiles
その他用の冷間鍛造品 … For others
(2) 労務 Labor (単位:人、Unit: persons)
鍛工品部門 Forgings from billets and bars sections
事 業 所 Total for the establishment
4,706
11,944
5,586 11,855
27,398
16,561
12,053
区 分
6,358
14,339
7,981 7,347
30,646
21,812 18,790
42,698
29,793 26,137
41,737
72,024
16,931
19,761
2,995
Classification
13,895
133,050
年末従事者数
Number of persons engaged at the end of year
238

単年表 (金属製品編)
8.銑鉄鋳物 Iron castings
(1)製品 Products生 産 消 費 販 売 年末在庫
Production Consumption Sales Inventory
重量(t) 金額(百万円) 重量(t) 重量(t) 重量(t)Weight Value Weight Weight Weight
(t) (million yen) (t) (t) (t)
銑鉄鋳物
Iron castings
銑鉄鋳物(球状黒鉛鋳鉄を除く)
Iron castings (excluding ductile iron castings)
一般・電気機械用
For general/electrical machinery
産業機械器具用
For industrial machine parts
金属工作・加工機械用
For metal cutting/forming machinery
その他の一般・電気機械用
For others
輸送機械用
For transport equipment
自動車用
For automobiles
その他の輸送機械用
For others
その他用の銑鉄鋳物
For others
球状黒鉛鋳鉄
Ductile iron castings
一般・電気機械用
For general/electrical machinery
産業機械器具用
For industrial machine parts
金属工作・加工機械用
239,256 56,459 … … …
10,616 2,149 … … …
1,345,535 317,967 349,296 986,991 36,388
377,150 92,739 … … …
160,017 26,910 … … …
65,466 17,406 … … …
1,456,472 247,276 … … …
1,296,455 220,366 … … …
122,904 23,485 … … …
220,232 65,756 … … …
660,875 161,197 … … …
317,739 71,956 … … …
2,182,813 425,879 739,467 1,444,038 52,447
(平成23年)
品 目Commodity
3,528,348 743,846 1,088,763 2,431,029 88,835
金属 作 加 機械用
For metal cutting/forming machinery
その他の一般・電気機械用
For others
輸送機械用
For transport equipment
自動車用
For automobiles
その他の輸送機械用
For others
その他用の球状黒鉛鋳鉄 … … …
For others
(2)原材料 Raw materials
単位:人、Unit:Persons
Classification Number of persons engaged at the end of year
銑鉄鋳物部門25,605
Iron castings sections
事 業 所194,119
Total for the establishment
返りくず2,204,416
Return scrap
(3)労務 Labor
区 分 年末従事者数
銑くず405,109
Pig iron scrap
鋼くず2,367,757
Steel scrap
品 目 消 費
Commodity Consumption
銑鉄401,757
Pig iron
96,868 27,631
単位:t 、Unit:t
773,675 173,039 … … …
97,842 24,558 … … …
127,278 34,131 … … …
871,517 197,597 … … …
, ,
239

単年表 (金属製品編)
9.可鍛鋳鉄及び精密鋳造品 (平成23年) Malleable iron castings and precision castings
(1)-1製品 Products
36,048(t)
x
…
…
…
…
…
(1)-2材質別生産内訳 By material (2)原材料 Raw materials 単位:t、Unit:t生 産
その他用の精密鋳造品 511,046(〃) 4,096
For others
For automobiles
航空機・武器用 118,302(〃) 3,183
For aircraft/weapons
一般機械用 1,046,302(〃) 6,242
For general machinery
自動車用 4,272,837(〃) 22,488
Precision castings
ガスタービン用 633,307(〃) 16,254
For gas turbines
Malleable iron castings
精密鋳造品 6,581,794(kg) 52,264
Value Weight(t), (kg) (million yen) (t), (kg)
可鍛鋳鉄 39,513(t) 18,705
品目・用途別By commodity/use
生 産 消 費Production Consumption
重 量 金額(百万円) 重 量Weight
Production
重量(kg)Weight
精密鋳造品 6,581,794 可鍛鋳鉄用
Precision castings For malleable iron castings
鋳鉄 x 銑鉄 462
Cast iron Pig iron
合金鋼・炭素鋼 4,533,441 鋼くず 45,177
Alloy steel/carbon steel Steel scrap
アルミニウム合金 x 返りくず 58,739
Aluminum alloy Return scrap
その他の非鉄合金 1,272,810
Other non-ferrous alloys
(3)労務 Labor 単位:人、Unit:Persons
事 業 所 100,318Total for the establishment
可鍛鋳鉄部門 500Malleable iron castings sections
精密鋳造品部門2,177
Precision castings sections
区 分Classification
品 目Commodity
消 費Consumption
区 分 年末従事者数
Classification Number of persons engaged at the end of year
240

単年表 (金属製品編)
10.非鉄金属鋳物 Non-ferrous metal castings
(1) 製品 Products
用途別
銅・銅合金鋳物
一般機械用
産業機械器具用
軸受メタル用
バルブコック用(管継手用を含む)
輸送機械用
その他用の銅・銅合金鋳物
アルミニウム鋳物
一般機械用
輸送機械用
自動車用
その他の輸送機械用
358,994 226,265 … For automobiles
5,592 11,152 … For others
8,577 10,436 … For general machinery
364,587 237,418 … For transport equipment
8,851 11,425 … For others
383,978 258,255 213,094 Aluminum alloy castings
27,802 33,147 … For valves and cocks (including for pipe fittings)
23,091 31,295 … For transport equipment
15,060 20,784 … For industrial machinery
8,358 11,368 … For bearing metal
83,163 108,018 23,279 Copper/copper alloy castings
51,220 65,298 … For general machinery
(平成23年)
生産 Production 消費 Consumption
By use重量 (t) 金額 (百万円) 重量 (t)
Weight (t) Value (million yen) Weight (t)
241
その他用のアルミニウム鋳物
(2) 原材料 Raw materials(単位:t、Unit: t)
品 目 消費 Consumption Commodity
銅合金地金 83,886 Copper-base alloy ingots
アルミニウム合金新地金 156,440 Aluminum-base alloy ingots
アルミニウム二次合金地金 268,625 Secondary aluminum-base alloy ingots
(3) 労務 Labor (単位:人、Unit: persons)
非鉄金属鋳物部門 11,122 Non-ferrous metal castings sections
事 業 所 153,126 Total for the establishment
10,814 10,402 … For others
区 分年末従事者数
Classification Number of persons engaged
at the end of year
241241

単年表 (金属製品編)
11.ダイカスト Die castings
(1) 製品 Products
用途別
ダイカスト
アルミニウム Aluminum alloy die castings
一般機械用 For general machinery
電気機械用 For electrical machinery
自動車用 For automobiles
二輪自動車用 For motorcycles
その他用のアルミニウム For others
亜鉛 Zinc alloy die castings
自動車用 For automobiles
その他用の亜鉛 For others
その他 Other die castings
(平成23年)
生産 Production 消費 Consumption
By use重量 (t) 金額 (百万円) 重量 (t)
Weight (t) Value (million yen) Weight (t)
930,474 557,736 285,792 Die castings
902,028 513,386 275,695
41,717 32,014 …
18,946 20,665 …
780,694 417,176 …
33,362 22,798 …
27,309 20,734 …
23,831 39,978 10,098
13,930 32,242 …
9,901 7,735 …
4,615 4,373 …
242
(2) 原材料 Raw materials(単位:t、Unit: t)
品 目 消費 Consumption Commodity
アルミニウム合金新地金 64,414 Aluminum-base alloy ingots
アルミニウム二次合金地金 Secondary aluminum-base alloy ingots
マグネシウム合金地金 2,915 Magnesium-base alloy ingots
亜鉛合金新地金 19,638 Zinc-base alloy ingots
亜鉛二次合金地金 3,651 Secondary zinc-base alloy ingots
銅合金地金 1,904 Copper-base alloy ingots
(3) 労務 Labor (単位:人、Unit: persons)
ダ イ カ ス ト 部 門 15,469 Non-ferrous metal castings sections
事 業 所 206,871 Total for the establishment
870,808
区 分年末従事者数
Classification Number of persons engaged
at the end of year
242242

243

参 考 統 計
Ⅴ.参考統計 Referencce table1.鉄鋼需給統計 Iron and steel supply and demand statistics(1)普通鋼鋼材品目別出荷 Shipments of ordinary rolled steel products by commodity
平成 23年
平成 22年 平成 23年 平成 21年 平成 22年 1 月 2 月 3 月
2010 2011 2009 2010 Jan.2011 Feb. March
75,119,592 72,775,246 67,995,044 75,102,510 6,294,042 6,057,555 6,700,108
642,622 580,049 504,798 641,698 37,109 48,468 62,217
645,703 523,741 686,465 579,436 49,832 43,782 53,509
10,310 10,009 10,647 10,323 937 984 1,442
5,696,684 5,961,120 5,565,594 5,818,495 463,919 512,273 565,468
3,203,458 3,358,491 3,068,906 3,314,378 247,782 301,557 328,492
998,582 1,041,087 1,044,436 984,113 79,820 75,026 98,816
1,016,318 1,064,484 967,565 1,027,516 92,567 92,030 93,313
478,326 497,058 484,687 492,488 43,750 43,660 44,847
9,189,266 9,533,801 9,121,856 9,320,704 765,342 756,389 807,045
387,606 402,063 369,394 399,339 33,787 35,020 37,638
438,085 466,966 386,014 451,940 38,920 43,894 37,942
8,363,575 8,664,772 8,366,448 8,469,425 692,635 677,475 731,465
1,860,795 1,813,306 1,833,858 1,882,709 176,788 174,213 163,750
458,578 445,494 419,786 468,910 43,004 45,190 40,986
653,234 627,329 702,914 663,644 61,477 64,006 63,630
暦 年 Calendar year 年 度 Fiscal year
品 目 Commodity
合計 Grand total
軌条(含付属品)
Rails (including accessories)
鋼矢板 Sheet pilings
簡易鋼矢板Clod-formed sheet pilings
形鋼Steel
shapes
計 Total
H形鋼Wide flange beams
大形形鋼Heavy shapes
中小形形鋼Medium and light shapes
軽量形鋼Cold-formed steel shapes
棒鋼Steelbars
計 Total
大形棒鋼Heavy bars
中形棒鋼Medium bars
小形棒鋼Light bars
線材Steel wire
rods
計 Total
バーインコイル Bars in coil
普通 Ordinary wire rods
特殊線材
244
748,983 740,483 711,158 750,155 72,307 65,017 59,134
12,135,780 12,115,757 10,896,740 12,286,104 1,054,568 955,007 1,125,838
熱 延薄板類
Hot-rolledsteel strips
14,953,509 14,100,841 13,563,387 14,805,974 1,256,919 1,186,107 1,363,738
7,562,335 6,893,296 6,603,508 7,459,665 632,643 615,133 623,871
98,868 75,583 84,108 87,988 5,990 5,773 6,826
7,456,004 6,804,785 6,484,392 7,368,520 628,705 607,220 618,601
7,463 12,928 35,008 3,157 ▲2,052 2,140 ▲1,556
2,009,811 1,953,720 1,598,990 2,036,429 173,781 155,960 207,269
1,039,125 991,004 998,066 1,043,982 84,976 92,557 102,435
831,337 823,505 775,278 840,577 72,690 61,319 83,395
13,045,499 11,844,775 11,029,110 12,750,345 1,058,179 967,069 1,005,789
1,171,359 1,115,699 996,374 1,173,596 93,078 98,182 109,726
4,261,538 4,444,777 3,747,484 4,387,756 367,587 383,576 419,144
63,919 69,846 62,889 64,717 5,694 6,536 5,472
資料出所:製造産業局 鉄鋼課
注:1.本表の合計は次の算式による。合計=生産±在庫増減(生産工場、生産業者本社営業所、鋼材次工程業者及び販売業者)
注:2.自工場消費を含む。
注:3.リムリングバー、サッシバーは小形形鋼に含む。
注:4.薄板は電気鋼板を含む。
特殊線材Special wire rods
鋼板 Steel plates
鋼帯Steel strips
冷 延薄板類
Cold-rolledsteel
sheetsand strips
計 Total
磨帯鋼Cold-rolled narrow strips
冷延広幅帯鋼Cold-rolled wide strips
冷延鋼板Cold-rolled sheets and strips
外輪(圧延輪心、圧延車輪を含む)Tyres and wheels
冷延電気鋼帯Cold-rolled electrical sheets and strips
ブリキ Tin plates
ティンフリースチールTin-free steel
亜鉛めっき鋼板Galvanized sheets
その他の金属めっき鋼板Other metallic-coated sheets
鋼管 Steel pipes and tubes
244

参 考 統 計
4 月 5 月 6 月 7 月 8 月 9 月 10 月 11 月 12 月
April May June July Aug. Sep. Oct. Nov. Dec.
5,676,944 5,621,213 6,393,849 6,105,741 5,897,555 6,125,663 6,283,694 5,742,423 5,876,459
45,635 36,167 65,585 58,882 51,536 53,974 28,214 39,240 53,022
39,353 39,793 29,706 26,504 21,265 32,491 49,984 67,715 69,807
624 520 430 597 319 1,139 911 1,150 956
529,235 520,568 522,835 444,978 450,089 470,424 509,750 479,531 492,050
302,921 299,885 301,655 236,787 238,983 256,733 289,454 267,714 286,528
81,430 92,350 97,505 89,236 86,749 89,036 85,022 86,516 79,581
98,464 94,371 86,422 81,204 85,052 85,492 89,581 81,475 84,513
46,420 33,962 37,253 37,751 39,305 39,163 45,693 43,826 41,428
807,999 742,913 787,877 804,792 773,594 817,751 851,508 841,755 776,836
30,472 31,994 34,357 35,741 29,013 33,715 31,147 38,768 30,411
41,612 37,927 42,686 36,994 35,971 34,653 37,400 38,500 40,467
735,915 672,992 710,834 732,057 708,610 749,383 782,961 764,487 705,958
147,247 141,577 147,191 147,512 135,564 133,046 158,143 152,390 135,885
36,217 33,192 31,415 29,399 33,199 27,835 41,680 41,207 42,170
53,586 47,191 44,407 53,089 41,659 46,417 54,465 56,387 41,015
(単位:t、Unit: t)
245
57,444 61,194 71,369 65,024 60,706 58,794 61,998 54,796 52,700
1,016,262 1,021,688 1,069,157 942,552 940,265 992,896 1,092,860 968,661 936,003
1,047,367 1,009,945 1,269,536 1,242,778 1,200,481 1,181,891 1,151,616 999,963 1,190,500
464,340 495,350 604,595 612,093 592,950 593,675 613,507 519,788 525,351
4,970 5,495 6,747 6,892 6,083 7,137 9,079 5,229 5,362
460,285 488,165 593,594 603,321 584,298 584,350 604,289 515,212 516,745
▲915 1,690 4,254 1,880 2,569 2,188 139 ▲653 3,244
151,760 159,675 200,030 160,845 156,096 165,173 151,506 132,669 138,956
90,018 77,694 88,399 79,344 72,250 89,103 73,812 64,565 75,851
71,283 74,887 70,148 65,714 53,903 73,338 66,416 67,397 63,015
802,531 856,358 1,054,180 1,040,898 1,005,238 1,038,081 1,084,544 950,505 981,403
86,397 80,030 100,298 92,469 100,290 93,580 87,226 89,586 84,837
371,532 358,294 377,246 379,396 338,078 383,279 357,920 362,400 346,325
5,361 5,754 6,636 6,387 5,637 5,822 5,777 5,108 5,662
source: Iron and Steel Division, Manufacturing Industries Bureau
Notes: 1. Totals in this table are based on the following formula: Total = production ± increase of inventories (producing
plants, producers' main business office, steel subsequent processes business proprientors and dealers)
2. Consumption by self-establishment is included.
3. Light steel shapes include sash bars and rim ring bars.
4. Sheets include electric steel plates.
245

参 考 統 計
246246
(2)普通鋼鋼材部門別出荷 Shipments of ordinary rolled steel products by industrial sections
暦 年 Calendar year 年 度 Fiscal year平成 23年
部 門 平成 22年 平成 23年 平成 21年 平成 22年 1 月 2 月 3 月
2010 2011 2009 2010 Jan.2011 Feb. March
合 計 75,119,592 72,775,246 67,995,044 75,102,510 6,294,042 6,057,555 6,700,108
輸 出 28,101,124 26,250,935 24,879,259 27,987,768 2,331,422 2,242,419 2,678,936
計 47,018,468 46,524,311 43,115,785 47,114,742 3,962,620 3,815,136 4,021,172
需給調査対象以外の販売業者等 9,366,258 13,180,903 9,561,708 11,046,332 1,173,059 976,321 1,211,819
生産業者工場
小 計 1,685,485 1,604,017 1,487,286 1,656,922 139,240 146,213 123,571
建 設 業 545,085 571,233 491,490 560,698 47,667 45,235 46,478
国
製造業
鉄鋼業
鉄鋼生産関連設備の拡充 ・ 補充用
307,797 331,878 221,600 319,772 26,965 24,866 28,677
そ の 他 681,053 555,543 642,369 626,978 53,205 65,226 35,016
そ 125,829の 他 の 製 造 業 123,198 107,848 125,000 9,234 10,049 10,157
そ の 他 の 諸 産 業 25,721 22,165 23,979 24,474 2,169 837 3,243
小 計 35,966,725 31,739,391 32,066,791 34,411,488 2,650,321 2,692,602 2,685,782
建 設 業 3,187,705 3,022,491 3,170,681 3,074,186 238,309 236,950 262,174
鉄鋼業
シャー・スリット業 5,860,557 5,325,425 3,397,886 5,732,729 456,915 451,492 459,798
販 その他の鉄鋼業 3,117,531 3,173,909 2,326,703 3,123,923 247,056 253,839 261,363
内 売製
造
業
一般機械器具製造業(精密機械器具を含む) 1,170,165 1,001,756 1,091,991 1,136,024 80,425 74,983 83,654
業 電気機械器具製造業 1,292,038 884,267 1,771,637 1,205,949 76,368 76,895 78,525
者 自 動 車 製 9,344,300造 業 7,319,958 8,661,270 8,672,557 615,110 670,441 509,053
船 舶 製 造 ・ 修 理 業 3,164,063 2,508,531 2,766,812 3,043,605 254,352 200,689 231,234
そ 4,373,247の 他 の 製 造 業 3,428,351 4,256,164 3,888,469 295,418 284,983 299,771
そ の 他 の 諸 産 業 4,457,119 5,074,703 4,623,647 4,534,046 386,368 442,330 500,210
資料出所:製造産業局 鉄鋼課
注1:本表の合計は次の算式による。合計=生産±在庫増減(生産工場、生産業者本社営業所、鋼材次工程業者及び販売業者)
注2:需給調査対象以外の販売業者等には自工場消費を含む。
注3:輸出は需給統計調査の生産業者の輸出向けによる。

参 考 統 計
247247
(単位:t、Unit: t)
4 月 5 月 6 月 7 月 8 月 9 月 10 月 11 月 12 月 Industrial sectionsApril May June July Aug. Sep. Oct. Nov. Dec.
5,676,944 5,621,213 6,393,849 6,105,741 5,897,555 6,125,663 6,283,694 5,742,423 5,876,459 Grand total
2,142,470 1,985,701 2,451,864 2,217,280 2,203,796 2,147,328 2,074,922 1,701,136 2,073,661 Exports
3,534,474 3,635,512 3,941,985 3,888,461 3,693,759 3,978,335 4,208,772 4,041,287 3,802,798 Total
1,176,144 1,182,191 1,051,870 997,739 991,959 985,747 1,204,242 1,137,829 1,091,983 Dealers not polled by
supply and demand survey
108,777 137,872 134,597 124,708 121,154 139,742 136,625 144,995 146,523
Pro
ducer's
facto
ry
Sub-total
44,138 45,746 52,378 50,199 43,771 53,882 47,386 46,154 48,199 Construction
25,905 25,860 26,458 27,762 29,813 30,286 28,599 29,372 27,315
Man
ufa
ctu
ring
Iron a
nd
steel Expansion / re-
pair of productionequipment
27,768 51,276 42,845 34,156 37,206 43,732 48,978 57,151 58,984 Others
9,016 13,181 9,831 10,263 9,408 9,244 10,911 11,380 10,524 Other manufacturing
1,950 1,809 3,085 2,328 956 2,598 751 938 1,501D
om
est
ic Other industries
2,249,553 2,315,449 2,755,518 2,766,014 2,580,646 2,852,846 2,867,905 2,758,463 2,564,292 Sub-total
230,645 229,460 263,394 253,362 258,072 276,736 268,520 263,217 241,652 Construction
346,126 385,883 454,651 464,270 449,816 481,834 484,945 454,152 435,543
Iron a
nd
steel
Shearing/ slitting
252,555 271,136 292,083 280,967 262,838 266,638 281,744 255,161 248,529 Others
66,029 71,789 85,067 81,869 80,562 89,685 98,675 98,012 91,006
Deal
er
Man
ufa
ctu
ring General machinery
equipment
66,072 74,246 83,770 77,402 69,755 76,367 69,470 67,578 67,819 Electrical machineryequipment
420,707 417,915 605,934 671,571 604,570 733,115 720,716 696,478 654,348 Cars
218,360 216,639 201,703 213,692 185,810 192,134 232,548 204,399 156,971 Ship-building/ repairing
276,014 267,460 297,149 275,507 272,228 277,021 303,767 287,996 291,037 Other manufacturing
373,045 380,921 471,767 447,374 396,995 459,316 407,520 431,470 377,387 Other industries
Note:1.Totals in this table are based on the following formula:Total = Production ± increase or decrease of inventories (producing
plants, producers' main business offices, steel subsequent processes business proprietors and dealers)
Note:2.Consumption by self-establishment is included.
Note:3.Exports are based on the "for export" figures of producers in supply and demand statistical research.

参 考 統 計
(3)普通鋼鋼材部門別、品目別出荷 ( 平成 23 年 ) Shipments of ordinary rolled steel products by industrial sections and by commodity(CY2011)
合計 軌条 鋼矢板 簡易鋼矢板 形鋼 Steel shapes
Grand (付属品を含む) Sheet Cold-formed 計 H形鋼 大形形鋼 中小形形鋼 軽量形鋼
total Rails (including
accessories)pilings sheet pilings Total Wide flange
beamsHeavy shapes Medium and
light shapesCold-formedsteel shapes
72,775,246 580,049 523,741 10,009 5,961,120 3,358,491 1,041,087 1,064,484 497,058
26,250,935 366,216 101,181 - 812,491 362,523 345,455 104,513 -
46,524,311 213,833 422,560 10,009 5,148,629 2,995,968 695,632 959,971 497,058
13,180,903 158,379 ▲73,513 9,277 3,574,823 2,067,634 387,385 783,102 336,702
1,604,017 19,863 107,248 - 230,434 201,070 2,585 - 26,779
571,233 - - - 10,884 - - - 10,884
国鉄鋼生産関連設備の拡充 ・ 補充用
331,878 1,114 1,247 - 17,923 1,904 124 - 15,895
そ の 他 555,543 - 106,001 - 201,627 199,166 2,461 - -
123,198 - - - - - - - -
22,165 18,749 - - - - - - -
31,739,391 35,591 388,825 732 1,343,372 727,264 305,662 176,869 133,577
部 門
合 計
輸 出
計
需給調査対象以外の販売業者等
そ の 他 の 諸 産 業
鉄鋼業製
造業
小 計
生産業者工場
小 計
そ の 他 の 製 造 業
建 設 業
248
3,022,491 2,878 348,921 552 559,030 411,656 15,426 37,617 94,331
シャー・スリット業 5,325,425 205 2,239 2 75,304 52,078 9,849 7,041 6,336
販 その他の鉄鋼業 3,173,909 2,209 1,405 3 86,451 57,693 12,824 10,296 5,638
内 売 1,001,756 243 523 7 30,954 7,271 8,051 9,152 6,480
業 884,267 11,357 - - 9,467 648 1,603 5,362 1,854
者 7,319,958 - - - 32,400 1,637 24,989 5,513 261
2,508,531 419 - - 230,279 13,558 187,149 29,534 38
3,428,351 904 1,698 - 144,493 84,577 13,842 31,279 14,795
5,074,703 17,376 34,039 168 174,994 98,146 31,929 41,075 3,844
資料出所:製造産業局 鉄鋼課
注1:本表の合計は次の式による。合計=生産±在庫増減(生産工場、生産業者本社営業所、鋼材次工程業者及び販売業者)
注2:輸出は需給統計調査の生産業者の輸出向けによる。
注3:リムリングバー、サッシバーは小形形鋼に含む。
建 設 業
鉄鋼業
製
造
業
一般機械器具製造業(精密機械器具を含む)
電気機械器具製造業
自 動 車 製 造 業
船 舶 製 造 ・ 修 理 業
そ の 他 の 製 造 業
そ の 他 の 諸 産 業
248

参 考 統 計
(単位:t、Unit: t)
鋼板
計 大形棒鋼 中形棒鋼 小形棒鋼 計ハ ゙ ー イ ン コ イ ル普 通 線 材 特殊線材
Total Heavy bars Medium bars Light bars Total Bars in coil,ordinary wire rods
Specialwire rods
9,533,801 402,063 466,966 8,664,772 1,813,306 1,072,823 740,483 12,115,757
248,049 4,985 6,509 236,555 397,220 21,397 375,823 3,386,214
9,285,752 397,078 460,457 8,428,217 1,416,086 1,051,426 364,660 8,729,543
6,866,762 224,179 351,121 6,291,462 ▲640,684 ▲295,409 ▲345,275 985,621
300,470 627 10,516 289,327 76,584 13,670 62,914 51,201
264,492 - 9,247 255,245 - - - -
2,504 627 1,265 612 1,875 1,807 68 20,523Expansion / re-pair of productionequipment
33,326 - - 33,326 74,709 11,863 62,846 23,943 Others
148 - 4 144 - - - 6,735
- - - - - - - -
2,118,520 172,272 98,820 1,847,428 1,980,186 1,333,165 647,021 7,692,721
Steel sheetsand plates
Industrial sections
棒鋼 Steel bars 線材 Steel wire rods
Grand total
Exports
Total
Dealers not polled bysupply and demand survey
Dom
est
ic
Man
ufa
ctu
ring
Iron a
nd s
teel
Pro
ducer's
facto
ry
Sub-total
Other manufacturing
Construction
Other industries
Sub-total
249
1,166,008 23,816 15,034 1,127,158 157,827 7,601 150,226 343,031
63,592 6,745 5,940 50,907 12,423 12,370 53 1,635,971 Shearing/ slitting
173,891 11,359 19,055 143,477 1,100,045 717,640 382,405 205,739 Others
22,553 4,365 8,536 9,652 28,591 27,509 1,082 600,546
4,117 1 385 3,731 102 84 18 61,533
33,445 3,746 9,848 19,851 278,236 243,998 34,238 589,144
72,619 65,510 4,314 2,795 1,416 1,416 - 2,158,281
214,475 30,752 10,605 173,118 254,867 176,031 78,836 654,753
367,820 25,978 25,103 316,739 146,679 146,516 163 1,443,723
Source: Iron and Steel Division, Manufacturing Industries Bureau
Notes:1.The totals in this table are based on the following formula:Total = production ± increase or decrease of inventories
Notes:1.(producing plants, producers' main business offices, steel subsequent processes business proprietors and dealers)
Notes:2.Exports are based on “for export” of producers in supply and demand statistical research.
Notes:3.Light steel shapes, include sash bars and rim ring bars.
D
Construction
Iron a
nd s
teel
Deal
er
Man
ufa
ctu
ring General machinery
equipment
Electrical machineryequipment
Cars
Ship-building/ repairing
Other manufacturing
Other industries
249

参 考 統 計
(3)普通鋼鋼材部門別、品目別出荷 ( 平成 23 年 ) Shipments of ordinary rolled steel products by industrial sections and by commodity(CY2011)
冷延薄板類 Cold-rolled steel sheets and strips
計 鋼帯幅600mm以上鋼帯幅600mm未満 計 磨帯鋼 冷延広幅帯鋼 冷延鋼板
Total Steel strips
600mm or morein width
Steel stripsless than 600mm
in width
Total Cold-rollednarrow strips
Cold-rolledwide strips
Cold-rolledsheets and strips
14,100,841 … … 6,893,296 … … …
9,566,094 9,562,456 3,638 3,525,983 6,762 3,510,564 8,657
4,534,747 … … 3,367,313 … … …
▲130,643 … … ▲1,246,613 … … …
91,200 58,254 32,946 79,460 2,692 56,190 20,578
- - - - - - -
国鉄鋼生産関連設備の拡充 ・ 補充用
85,783 52,839 32,944 27,386 - 26,956 430
そ の 他 5,373 5,371 2 30,493 2,317 23,344 4,832
44 44 - 21,581 375 5,890 15,316
- - - - - - -
4,574,190 3,575,587 998,603 4,534,466 335,886 3,447,626 750,954
部 門
熱延薄板類 Hot-rolled steel sheets and strips
合 計
輸 出
計
建 設 業
そ の 他 の 諸 産 業
需給調査対象以外の販売業者等
生産業者工場
そ の 他 の 製 造 業
小 計
製造業
小 計
鉄鋼業
250
21,315 17,742 3,573 6,837 275 6,397 165
シャー・スリット業 180,476 *2,385,065 180,476 1,530,238 44,229 1,361,105 124,904
販 その他の鉄鋼業 880,652 864,313 16,339 102,332 6,811 65,005 30,516
内 売 96,218 69,909 26,309 54,632 16,625 22,852 15,155
業 73,281 52,245 21,036 87,641 27,171 44,432 16,038
者 1,699,042 1,093,554 605,488 1,792,016 195,766 1,158,564 437,686
184 42 142 36 - 35 1
387,087 276,737 110,350 471,850 33,592 341,768 96,490
1,235,935 1,201,045 34,890 488,884 11,417 447,468 29,999
建 設 業
鉄鋼業
製
造
業
一般機械器具製造業(精密機械器具を含む)
電気機械器具製造業
自 動 車 製 造 業
船 舶 製 造 ・ 修 理 業
そ の 他 の 製 造 業
そ の 他 の 諸 産 業
注: *の数値は、せん断したあと再び問屋に戻り、他の品目となって再出荷されるとみられるため、計から除いてある。
250

参 考 統 計
(単位:t、Unit: t)
electrical sheetsand strips
Tin Plates Tin-free steel Galvanizedsheets
Other metalliccoated sheets
Steel pipesand tubes
Tyres andwheels
1,953,720 991,004 823,505 11,844,775 1,115,699 4,444,777 69,846
1,427,820 590,199 262,151 4,411,316 310,387 845,614 -
525,900 400,805 561,354 7,433,459 805,312 3,599,163 69,846
82,922 51,181 234,483 1,568,912 483,630 1,186,520 69,846
156 5,460 2,787 75,183 1,028 562,943 -
- - - 1,382 233 294,242 -
156 5,446 2,705 31,017 157 134,042 -Expansion / re-pair of productionequipment
- 6 8 39,515 328 40,214 - Others
- 8 74 3,269 310 91,029 -
- - - - - 3,416 -
442,822 344,164 324,084 5,789,364 320,654 1,849,700 -
その他の金属めっき鋼板
鋼管 外輪ブリキ テ ィ ン フ リ ース チ ー ル
冷延電気鋼帯Cold-rolled Industrial sections
Grand total
Exports
亜鉛めっき鋼 板
Total
Dealers not polled bysupply and demand survey
Other manufacturing
Pro
ducer's
facto
ry
Sub-total
Man
ufa
ctu
ring
Construction
Dom
est
ic Other industries
Sub-total
Iron a
nd s
teel
251
10 - - 105,253 10,239 300,590 -
101,531 10,210 14,550 1,531,245 81,964 85,475 - Shearing/ slitting
8,780 778 969 242,390 23,877 344,388 - Others
14,806 12 - 119,747 5,348 27,576 -
195,984 624 - 389,210 40,167 10,784 -
25,786 158 1 2,306,343 88,978 474,409 -
1 - - 6 1,482 43,808 -
22,788 283,139 271,794 497,454 39,302 183,747 -
73,136 49,243 36,770 597,716 29,297 378,923 -
Note: As figures marked with "*" are considered to be returned to wholesalers after being sheared and then resold as other
Note: items, they are excluded from the totals.
D
ConstructionIron a
nd s
teel
Deal
er
Man
ufa
ctu
ring General machinery
equipment
Electrical machineryequipment
Cars
Ship-building/ repairing
Other manufacturing
Other industries
251

参 考 統 計
(4)普通鋼鋼材部門別、品目別出荷 ( 平成 22 年度 ) Shipments of ordinary rolled steel products by industrial sections and by commodity(FY2010)
合計 軌条 鋼矢板 簡易鋼矢板 形鋼 Steel shapes
Grand (付属品を含む) Sheet Cold-formed 計 H形鋼 大形形鋼 中小形形鋼 軽量形鋼
total Rails (including
accessories)pilings sheet pilings Total Wide flange
beamsHeavy shapes Medium and
light shapesCold-formedsteel shapes
75,102,510 641,698 579,436 10,323 5,818,495 3,314,378 984,113 1,027,516 492,488
27,987,768 390,879 229,815 - 825,511 425,698 304,263 95,041 509
47,114,742 250,819 349,621 10,323 4,992,984 2,888,680 679,850 932,475 491,979
11,046,332 193,062 ▲210,697 10,062 3,368,180 1,963,812 311,498 754,345 338,525
1,656,922 23,848 116,645 - 266,306 237,041 3,181 2 26,082
560,698 - - - 10,478 - - - 10,478
国鉄鋼生産関連設備の拡充 ・ 補充用
319,772 1,062 1,089 - 18,518 2,586 328 - 15,604
そ の 他 626,978 - 115,556 - 237,308 234,455 2,853 - -
125,000 - - - 2 - - 2 -
24,474 22,786 - - - - - - -
34,411,488 33,909 443,673 261 1,358,498 687,827 365,171 178,128 127,372
部 門
合 計
輸 出
計
需給調査対象以外の販売業者等
そ の 他 の 諸 産 業
鉄鋼業製
造業
小 計
生産業者工場
小 計
そ の 他 の 製 造 業
建 設 業
252
3,074,186 2,399 381,630 250 532,634 391,141 17,478 41,833 82,182
シャー・スリット業 5,732,729 3 2,614 2 79,457 52,500 10,615 9,301 7,041
販 その他の鉄鋼業 3,123,923 1,521 634 - 72,744 43,658 15,290 7,617 6,179
内 売 1,136,024 209 195 7 36,886 8,955 11,976 10,192 5,763
業 1,205,949 10,950 - - 7,825 770 1,613 5,305 137
者 8,672,557 - - - 32,635 1,742 24,575 6,044 274
3,043,605 147 1 - 283,576 15,402 237,969 30,155 50
3,888,469 371 2,311 - 151,493 91,011 9,714 28,757 22,011
4,534,046 18,309 56,288 2 161,248 82,648 35,941 38,924 3,735
資料出所:製造産業局 鉄鋼課
注1:本表の合計は次の式による。合計=生産±在庫増減(生産工場、生産業者本社営業所、鋼材次工程業者及び販売業者)
注2:輸出は需給統計調査の生産業者の輸出向けによる。
注3:リムリングバー、サッシバーは小形形鋼に含む。
建 設 業
鉄鋼業
製
造
業
一般機械器具製造業(精密機械器具を含む)
電気機械器具製造業
自 動 車 製 造 業
船 舶 製 造 ・ 修 理 業
そ の 他 の 製 造 業
そ の 他 の 諸 産 業
252

参 考 統 計
(単位:t、Unit: t)
鋼板
計 大形棒鋼 中形棒鋼 小形棒鋼 計ハ ゙ ー イ ン コ イ ル普 通 線 材 特殊線材
Total Heavy bars Medium bars Light bars Total Bars in coil,ordinary wire rods
Specialwire rods
9,320,704 399,339 451,940 8,469,425 1,882,709 1,132,554 750,155 12,286,104
293,103 3,093 7,441 282,569 390,702 32,339 358,363 3,370,673
9,027,601 396,246 444,499 8,186,856 1,492,007 1,100,215 391,792 8,915,431
6,756,483 244,801 341,474 6,170,208 ▲661,675 ▲214,437 ▲447,238 623,466
285,553 512 8,171 276,870 76,384 16,682 59,702 51,778
252,363 - 6,787 245,576 - - - -
2,670 512 1,384 774 1,626 1,548 78 21,852Expansion / re-pair of productionequipment
30,403 - - 30,403 74,758 15,134 59,624 22,055 Others
117 - - 117 - - - 7,871
- - - - - - - -
1,985,565 150,933 94,854 1,739,778 2,077,298 1,297,970 779,328 8,240,187
Steel sheetsand plates
Industrial sections
棒鋼 Steel bars 線材 Steel wire rods
Grand total
Exports
Total
Dealers not polled bysupply and demand survey
Dom
est
ic
Man
ufa
ctu
ring
Iron a
nd s
teel
Pro
ducer's
facto
ry
Sub-total
Other manufacturing
Construction
Other industries
Sub-total
253
1,055,073 13,008 13,136 1,028,929 259,785 4,977 254,808 357,600
62,819 5,761 6,151 50,907 14,646 10,361 4,285 1,656,170 Shearing/ slitting
183,367 11,071 19,477 152,819 1,112,676 725,781 386,895 175,081 Others
26,327 5,571 11,074 9,682 35,658 29,397 6,261 676,834
1,666 1 299 1,366 233 116 117 93,172
35,972 4,336 7,934 23,702 299,347 252,944 46,403 641,971
68,890 60,666 4,356 3,868 1,140 1,140 - 2,632,461
202,210 32,262 8,473 161,475 259,288 179,024 80,264 685,483
349,241 18,257 23,954 307,030 94,525 94,230 295 1,321,415
Source: Iron and Steel Division, Manufacturing Industries Bureau
Notes:1.The totals in this table are based on the following formula:Total = production ± increase or decrease of inventories
Notes:1.(producing plants, producers' main business offices, steel subsequent processes business proprietors and dealers)
Notes:2.Exports are based on “for export” of producers in supply and demand statistical research.
Notes:3.Light steel shapes, include sash bars and rim ring bars.
D
Construction
Iron a
nd s
teel
Deal
er
Man
ufa
ctu
ring General machinery
equipment
Electrical machineryequipment
Cars
Ship-building/ repairing
Other manufacturing
Other industries
253
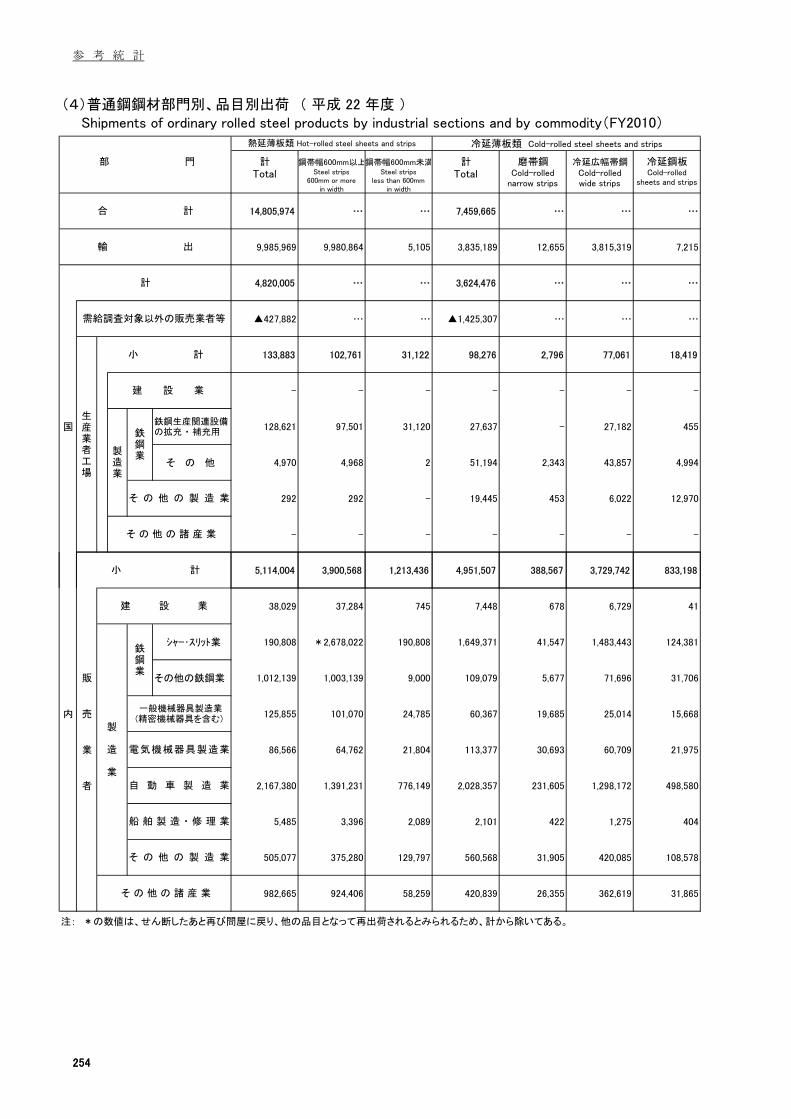
参 考 統 計
(4)普通鋼鋼材部門別、品目別出荷 ( 平成 22 年度 ) Shipments of ordinary rolled steel products by industrial sections and by commodity(FY2010)
冷延薄板類 Cold-rolled steel sheets and strips
計 鋼帯幅600mm以上鋼帯幅600mm未満 計 磨帯鋼 冷延広幅帯鋼 冷延鋼板
Total Steel strips
600mm or morein width
Steel stripsless than 600mm
in width
Total Cold-rollednarrow strips
Cold-rolledwide strips
Cold-rolledsheets and strips
14,805,974 … … 7,459,665 … … …
9,985,969 9,980,864 5,105 3,835,189 12,655 3,815,319 7,215
4,820,005 … … 3,624,476 … … …
▲427,882 … … ▲1,425,307 … … …
133,883 102,761 31,122 98,276 2,796 77,061 18,419
- - - - - - -
国鉄鋼生産関連設備の拡充 ・ 補充用
128,621 97,501 31,120 27,637 - 27,182 455
そ の 他 4,970 4,968 2 51,194 2,343 43,857 4,994
292 292 - 19,445 453 6,022 12,970
- - - - - - -
5,114,004 3,900,568 1,213,436 4,951,507 388,567 3,729,742 833,198
部 門
熱延薄板類 Hot-rolled steel sheets and strips
合 計
輸 出
計
建 設 業
そ の 他 の 諸 産 業
需給調査対象以外の販売業者等
生産業者工場
そ の 他 の 製 造 業
小 計
製造業
小 計
鉄鋼業
254
38,029 37,284 745 7,448 678 6,729 41
シャー・スリット業 190,808 *2,678,022 190,808 1,649,371 41,547 1,483,443 124,381
販 その他の鉄鋼業 1,012,139 1,003,139 9,000 109,079 5,677 71,696 31,706
内 売 125,855 101,070 24,785 60,367 19,685 25,014 15,668
業 86,566 64,762 21,804 113,377 30,693 60,709 21,975
者 2,167,380 1,391,231 776,149 2,028,357 231,605 1,298,172 498,580
5,485 3,396 2,089 2,101 422 1,275 404
505,077 375,280 129,797 560,568 31,905 420,085 108,578
982,665 924,406 58,259 420,839 26,355 362,619 31,865
建 設 業
鉄鋼業
製
造
業
一般機械器具製造業(精密機械器具を含む)
電気機械器具製造業
自 動 車 製 造 業
船 舶 製 造 ・ 修 理 業
そ の 他 の 製 造 業
そ の 他 の 諸 産 業
注: *の数値は、せん断したあと再び問屋に戻り、他の品目となって再出荷されるとみられるため、計から除いてある。
254

参 考 統 計
(単位:t、Unit: t)
electrical sheetsand strips
Tin Plates Tin-free steel Galvanizedsheets
Other metalliccoated sheets
Steel pipesand tubes
Tyres andwheels
2,036,429 1,043,982 840,577 12,750,345 1,173,596 4,387,756 64,717
1,524,291 609,671 282,493 5,017,594 386,501 845,377 -
512,138 434,311 558,084 7,732,751 787,095 3,542,379 64,717
▲65,631 21,955 148,997 1,001,895 375,778 1,272,929 64,717
184 5,511 2,329 85,251 1,786 509,188 -
- - - 1,393 233 296,231 -
184 5,495 2,217 33,718 322 74,761 -Expansion / re-pair of productionequipment
- - 8 45,697 1,131 43,898 - Others
- 16 104 4,443 100 92,610 -
- - - - - 1,688 -
577,585 406,845 406,758 6,645,605 409,531 1,760,262 -
その他の金属めっき鋼板
鋼管 外輪ブリキ テ ィ ン フ リ ース チ ー ル
冷延電気鋼帯Cold-rolled Industrial sections
Grand total
Exports
亜鉛めっき鋼 板
Total
Dealers not polled bysupply and demand survey
Other manufacturing
Pro
ducer's
facto
ry
Sub-total
Man
ufa
ctu
ring
Construction
Dom
est
ic Other industries
Sub-total
Iron a
nd s
teel
255
- - - 116,666 9,160 313,512 -
153,586 12,107 23,181 1,695,582 104,597 87,786 - Shearing/ slitting
9,896 838 680 195,250 58,337 191,681 - Others
13,789 - - 112,595 5,097 42,205 -
241,717 1,531 - 577,734 56,526 14,652 -
23,864 248 11 2,873,697 100,590 468,485 -
957 - - 12,844 1,211 34,792 -
20,667 349,945 342,545 544,597 43,917 219,997 -
113,109 42,176 40,341 516,640 30,096 387,152 -
Note: As figures marked with "*" are considered to be returned to wholesalers after being sheared and then resold as other
Note: items, they are excluded from the totals.
D
ConstructionIron a
nd s
teel
Deal
er
Man
ufa
ctu
ring General machinery
equipment
Electrical machineryequipment
Cars
Ship-building/ repairing
Other manufacturing
Other industries
255

参 考 統 計
(5)普通鋼鋼材在庫 Inventory of ordinary rolled steel products ① 総在庫 (生産業者分+需給調査対象の販売業者分) The total inventory (by producers + by dealers)
平成 23年
平成 22年 平成 23年 平成 21年 平成 22年 1 月 2 月 3 月
2010 2011 2009 2010 Jan.2011 Feb. March
6,337,351 6,377,674 5,845,809 6,285,762 6,495,846 6,606,180 6,285,762
35,399 30,569 51,322 29,768 38,592 35,412 29,768
39,782 43,472 43,686 23,738 40,326 37,476 23,738
1,165 1,321 585 746 1,158 647 746
413,985 436,313 441,369 437,772 445,280 461,412 437,772
228,492 234,593 270,965 243,781 261,150 262,887 243,781
72,159 70,793 60,742 70,912 73,232 74,298 70,912
82,258 95,581 74,945 87,250 79,726 90,749 87,250
31,076 35,346 34,717 35,829 31,172 33,478 35,829
678,261 734,854 622,236 671,107 667,658 699,574 671,107
40,068 46,341 32,839 37,174 39,985 34,480 37,174
52,459 65,552 45,207 57,800 54,777 56,746 57,800
鉄筋用Reinforced bars
519,801 551,854 488,220 514,489 507,408 544,753 514,489
その他Other light bars
65,933 71,107 55,970 61,644 65,488 63,595 61,644
132,856 130,327 119,295 117,214 136,706 128,747 117,214
31 114 33 989 32 301 27 437 32 484 30 836 27 437
暦年 Calendar year 年度 Fiscal year
品 目
Commodity
合計 Grand total
軌条(含付属品)
Rails (including accessories)
鋼矢板 Sheet pilings
簡易鋼矢板 Cold-formed sheet pilings
形鋼Steel
shapes
計 Total
H形鋼Wide flange beams
大形形鋼Heavy shapes
中小形形鋼Medium and light shapes
軽量形鋼Cold-formed steel shapes
棒鋼Steelbars
計 Total
大形棒鋼Heavy bars
中形棒鋼Medium bars
小形棒鋼Light bars
線材
計 Total
バーインコイル Bars in coil
256
31,114 33,989 32,301 27,437 32,484 30,836 27,437
48,537 50,148 41,011 45,202 53,449 55,081 45,202
53,205 46,190 45,983 44,575 50,773 42,830 44,575
661,234 628,576 643,089 678,999 671,721 724,717 678,999
1,679,154 1,721,630 1,491,951 1,637,608 1,726,903 1,754,941 1,637,608
幅600mm以上600mm or more in width
1,638,516 1,676,938 1,451,789 1,584,296 1,681,753 1,709,692 1,584,296
幅600mm未満Less than 600mm in width
40,638 44,692 40,162 53,312 45,150 45,249 53,312
670,246 660,571 643,784 719,950 721,132 734,921 719,950
42,121 47,120 39,470 43,931 43,103 43,920 43,931
597,406 582,766 577,748 639,711 643,954 657,029 639,711
30,719 30,685 26,566 36,308 34,075 33,972 36,308
105,971 101,642 96,004 108,323 109,917 118,208 108,323
102,006 89,535 75,690 89,969 112,944 96,777 89,969
91,654 86,296 67,718 76,836 92,583 91,198 76,836
1,017,526 1,033,792 908,366 1,001,778 1,015,734 1,014,838 1,001,778
192,539 206,740 150,577 187,156 196,416 194,811 187,156
511,791 469,225 487,318 502,615 513,029 508,195 502,615
3,782 2,811 2,819 2,183 5,747 4,306 2,183
資料出所:製造産業局 鉄鋼課
注:「販売業者分」とは「需給調査対象の販売業者分」のことである。
線材Steel
wire rods
ハ ーインコイル Bars in coil
普通 Ordinary wire rods
特殊 Special wire rods
鋼板 Plates
熱 延薄板類Hot-rolledsteelstrips
計 Total
鋼帯Strips
冷 延薄板類Cold-rolledsteel
sheetsand strips
計 Total
磨帯鋼Cold-rolled narrow strips
冷延広幅帯鋼Cold-rolled wide strips
冷延鋼板Cold-rolled sheets and strips
外輪 Tyres and wheels
冷延電気鋼帯Cold-rolled electrical sheets and strips
ブリキ Tin plates
ティンフリースチールTin-free steel
亜鉛めっき鋼板Galvanized sheets
その他の金属めっき鋼板Other metallic coated sheets
鋼管 Steel pipes and tubes
256

参 考 統 計
(単位:t、Unit: t)
4 月 5 月 6 月 7 月 8 月 9 月 10 月 11 月 12 月
April May June July Aug. Sep. Oct. Nov. Dec.
6,514,929 7,032,743 6,759,259 6,606,096 6,804,386 6,657,836 6,509,881 6,594,423 6,377,674
45,024 58,072 50,966 41,035 45,683 18,695 33,334 43,058 30,569
33,988 25,165 26,403 20,245 34,443 41,655 42,851 42,939 43,472
768 710 858 777 909 972 1,111 1,307 1,321
487,538 535,578 502,996 471,113 471,022 444,190 438,870 436,745 436,313
262,760 289,472 267,529 244,115 253,158 232,021 228,164 234,013 234,593
81,703 93,605 82,655 86,491 86,961 83,449 75,751 71,520 70,793
105,192 113,521 115,921 105,817 97,739 94,797 100,177 96,397 95,581
37,883 38,980 36,891 34,690 33,164 33,923 34,778 34,815 35,346
688,599 781,853 758,519 725,321 671,646 638,184 672,680 699,683 734,854
41,736 50,282 44,215 43,082 38,343 38,566 42,266 39,352 46,341
55,297 67,712 59,192 60,758 54,559 58,436 56,945 64,755 65,552
525,332 595,101 578,080 544,953 505,110 472,574 504,824 524,287 551,854
66,234 68,758 77,032 76,528 73,634 68,608 68,645 71,289 71,107
132,009 142,052 127,935 127,202 116,838 120,243 115,698 114,083 130,327
33 093 34 810 30 172 29 903 29 032 33 155 31 752 32 523 33 989
257
33,093 34,810 30,172 29,903 29,032 33,155 31,752 32,523 33,989
46,706 54,152 54,159 49,557 44,279 44,687 45,944 41,941 50,148
52,210 53,090 43,604 47,742 43,527 42,401 38,002 39,619 46,190
679,046 731,665 669,751 671,104 740,194 747,421 679,754 732,184 628,576
1,648,998 1,811,178 1,798,388 1,787,222 1,862,784 1,816,614 1,760,017 1,754,523 1,721,630
1,593,073 1,758,210 1,751,305 1,742,836 1,813,692 1,769,075 1,714,139 1,708,583 1,676,938
55,925 52,968 47,083 44,386 49,092 47,539 45,878 45,940 44,692
725,785 766,349 766,768 731,536 753,010 745,522 743,805 710,664 660,571
45,959 46,542 45,979 45,997 45,321 46,520 45,904 45,996 47,120
641,778 683,093 687,697 653,348 676,730 669,023 666,794 631,962 582,766
38,048 36,714 33,092 32,191 30,959 29,979 31,107 32,706 30,685
118,698 141,285 108,075 107,902 119,540 115,687 100,921 112,692 101,642
90,996 108,590 92,322 93,475 105,706 100,011 91,901 93,965 89,535
76,805 77,189 76,948 80,051 92,686 87,091 87,543 83,182 86,296
1,084,473 1,125,950 1,062,384 1,070,890 1,097,248 1,106,154 1,055,097 1,095,529 1,033,792
182,985 196,729 199,667 200,222 206,904 205,279 210,989 201,944 206,740
516,008 527,156 514,701 475,887 483,189 466,786 473,587 469,942 469,225
3,209 3,222 2,578 2,114 2,584 3,332 1,723 1,983 2,811
Source: Iron and Steel Division, Manufacturing Industries Bureau
Note:“Relating to dealers” means “relating to dealers covered by the supply and demand research”.
257

参 考 統 計
(5)普通鋼鋼材在庫 Inventory of ordinary rolled steel products ② 生産業者分 (本社営業所及び鋼材次工程業者を含む) By producers (include producer's main business offices
平成 23年
平成 22年 平成 23年 平成 21年 平成 22年 1 月 2 月 3 月
2010 2011 2009 2010 Jan.2011 Feb. March
5,140,617 4,983,952 4,646,298 4,958,954 5,245,349 5,381,370 4,958,954
33,375 28,396 39,795 27,857 36,558 33,582 27,857
36,830 40,925 35,268 22,515 38,731 35,847 22,515
1,165 1,321 585 746 1,158 647 746
314,789 322,509 316,570 318,181 342,287 353,446 318,181
169,637 166,886 187,296 170,430 200,373 198,376 170,430
57,987 55,655 46,221 54,514 57,375 59,305 54,514
68,106 78,374 61,932 70,617 64,302 74,634 70,617
19,059 21,594 21,121 22,620 20,237 21,131 22,620
645,392 696,646 582,974 636,165 634,111 665,982 636,165
36,456 40,174 28,997 32,433 36,524 30,876 32,433
48,872 61,120 41,671 53,271 50,869 52,533 53,271
鉄筋用Reinforced bars
504,337 535,007 467,609 498,880 491,400 529,307 498,880
その他Other light bars
55,727 60,345 44,697 51,581 55,318 53,266 51,581
103,128 96,515 95,060 88,218 105,532 98,896 88,218
暦年 Calendar year 年度 Fiscal year
品 目
Commodity
合計 Grand total
軌条(含付属品)
Rails (including accessories)
鋼矢板 Sheet pilings
簡易鋼矢板 Cold-formed sheet pilings
形鋼Steel
shapes
計 Total
H形鋼Wide flange beams
大形形鋼Heavy shapes
中小形形鋼Medium and light shapes
軽量形鋼Cold-formed steel shapes
棒鋼Steelbars
計 Total
大形棒鋼Heavy bars
中形棒鋼Medium bars
小形棒鋼Light bars
線材
計 Total
゙
258
22,883 25,088 26,078 19,667 23,521 23,608 19,667
33,074 31,376 28,186 30,162 36,535 37,776 30,162
47,171 40,051 40,796 38,389 45,476 37,512 38,389
532,369 496,184 530,657 548,574 558,352 611,723 548,574
1,461,736 1,452,491 1,278,749 1,388,122 1,493,094 1,528,604 1,388,122
幅600mm以上600mm or more in width
1,449,773 1,440,869 1,267,008 1,372,925 1,480,608 1,516,791 1,372,925
幅600mm未満Less than 600mm in width
11,963 11,622 11,741 15,197 12,486 11,813 15,197
502,462 446,109 479,770 519,749 541,672 564,223 519,749
33,703 39,482 30,053 34,286 34,120 34,725 34,286
468,019 405,780 449,108 483,940 506,420 528,050 483,940
740 847 609 1,523 1,132 1,448 1,523
83,953 67,805 76,414 81,848 86,023 92,978 81,848
82,375 69,465 59,085 69,850 93,732 77,561 69,850
74,965 66,996 48,113 60,473 75,812 74,121 60,473
690,747 621,305 615,382 640,975 669,395 682,322 640,975
171,576 183,885 132,512 163,246 173,900 172,262 163,246
401,973 390,589 352,545 390,252 389,245 384,870 390,252
3,782 2,811 2,819 2,183 5,747 4,306 2,183
資料出所:製造産業局 鉄鋼課
注:「鋼材次工程業者分」とは、熱間圧延鋼材、冷間仕上鋼材及びめっき鋼材を原料として鋼管、冷間圧延製品、ブリキ、亜鉛めっき
鋼板、その他の金属めっき鋼板、冷間ロール成型形鋼等を製造する業者のことである。
線材Steel
wire rods
バーインコイル Bars in coil
普通 Ordinary wire rods
特殊 Special wire rods
鋼板 Plates
熱 延薄板類Hot-rolledsteelstrips
計 Total
鋼帯Strips
冷 延薄板類Cold-rolledsteel
sheetsand strips
計 Total
磨帯鋼Cold-rolled narrow strips
冷延広幅帯鋼Cold-rolled wide strips
冷延鋼板Cold-rolled sheets and strips
外輪 Tyres and wheels
冷延電気鋼帯Cold-rolled electrical sheets and strips
ブリキ Tin plates
ティンフリースチールTin-free steel
亜鉛めっき鋼板Galvanized sheets
その他の金属めっき鋼板Other metallic coated sheets
鋼管 Steel pipes and tubes
258

参 考 統 計
and steel subsequent processes business proprietors) (単位:t、Unit: t)
4 月 5 月 6 月 7 月 8 月 9 月 10 月 11 月 12 月
April May June July Aug. Sep. Oct. Nov. Dec.
5,158,307 5,630,684 5,350,992 5,284,153 5,414,682 5,271,726 5,150,010 5,233,591 4,983,952
42,265 54,963 47,586 37,995 42,849 15,386 29,377 39,807 28,396
30,295 21,517 22,757 18,110 32,321 39,562 40,860 40,893 40,925
768 710 858 777 909 972 1,111 1,307 1,321
362,121 398,448 354,103 330,507 338,507 315,151 321,924 323,721 322,509
186,001 202,922 169,309 155,117 172,302 154,886 159,629 167,784 166,886
63,653 75,203 63,728 67,123 67,698 64,494 59,034 55,738 55,655
85,984 93,921 95,182 84,397 76,692 74,785 80,691 77,671 78,374
26,483 26,402 25,884 23,870 21,815 20,986 22,570 22,528 21,594
652,910 740,516 719,147 688,741 635,696 601,410 636,618 665,207 696,646
37,465 42,964 38,041 37,600 32,865 31,324 36,204 33,986 40,174
50,665 63,115 54,974 56,603 50,199 53,897 52,718 60,428 61,120
509,897 579,367 562,340 530,506 491,782 459,986 490,311 510,341 535,007
54,883 55,070 63,792 64,032 60,850 56,203 57,385 60,452 60,345
104,768 112,909 97,864 103,012 90,613 95,304 89,703 88,714 96,515
259
25,595 27,252 23,581 23,173 22,275 26,438 25,067 25,111 25,088
32,394 37,313 34,626 36,101 29,777 31,741 31,928 29,198 31,376
46,779 48,344 39,657 43,738 38,561 37,125 32,708 34,405 40,051
560,603 601,915 523,952 545,710 611,213 608,575 556,175 606,832 496,184
1,383,274 1,544,119 1,529,396 1,535,586 1,591,383 1,548,692 1,493,671 1,490,819 1,452,491
1,366,178 1,527,680 1,516,148 1,523,887 1,576,196 1,535,962 1,480,384 1,478,102 1,440,869
17,096 16,439 13,248 11,699 15,187 12,730 13,287 12,717 11,622
515,607 556,994 558,327 528,177 534,517 535,645 528,683 492,193 446,109
36,444 36,605 36,158 36,599 35,841 37,173 38,079 38,157 39,482
477,433 519,368 521,235 489,625 497,752 496,986 489,377 453,205 405,780
1,730 1,021 934 1,953 924 1,486 1,227 831 847
92,002 112,889 79,429 80,236 89,237 87,120 71,825 80,476 67,805
72,633 90,471 71,677 73,983 86,116 78,422 72,335 75,233 69,465
59,814 60,760 61,364 62,755 68,423 68,033 69,096 64,919 66,996
708,728 736,881 688,541 705,549 706,089 710,099 659,649 693,079 621,305
156,479 169,391 175,607 177,225 184,352 183,441 188,178 178,273 183,885
412,831 424,979 417,806 393,676 399,873 380,582 389,082 390,135 390,589
3,209 3,222 2,578 2,114 2,584 3,332 1,723 1,983 2,811
Source: Iron and Steel Division, Manufacturing Industries Bureau
Note:"Relating to steel subsequent process business proprietors" means makers who produce steel pipes, cold-rolled steel
products, tinplates, galvanized steel sheets, other metallic coated sheets, cold-rolled steel shapes and others from hot-rolled
steel, cold-rolled steel and coated steel.
259

参 考 統 計
(5)普通鋼鋼材在庫 Inventory of ordinary rolled steel products ③ 需給調査対象の販売業者分 Dealers by supply and demand survey
平成 23年
平成 22年 平成 23年 平成 21年 平成 22年 1 月 2 月 3 月
2010 2011 2009 2010 Jan.2011 Feb. March
1,196,734 1,393,722 1,199,511 1,326,808 1,250,497 1,224,810 1,326,808
2,024 2,173 11,527 1,911 2,034 1,830 1,911
2,952 2,547 8,418 1,223 1,595 1,629 1,223
- - - - - - -
99,196 113,804 124,799 119,591 102,993 107,966 119,591
58,855 67,707 83,669 73,351 60,777 64,511 73,351
14,172 15,138 14,521 16,398 15,857 14,993 16,398
14,152 17,207 13,013 16,633 15,424 16,115 16,633
12,017 13,752 13,596 13,209 10,935 12,347 13,209
32,869 38,208 39,262 34,942 33,547 33,592 34,942
3,612 6,167 3,842 4,741 3,461 3,604 4,741
3,587 4,432 3,536 4,529 3,908 4,213 4,529
鉄筋用Reinforced bars
15,464 16,847 20,611 15,609 16,008 15,446 15,609
その他Other light bars
10,206 10,762 11,273 10,063 10,170 10,329 10,063
29,728 33,812 24,235 28,996 31,174 29,851 28,996
8 231 8 901 6 223 7 770 8 963 7 228 7 770
暦年 Calendar year 年度 Fiscal year
品 目
Commodity
合計 Grand total
軌条(含付属品)
Rails (including accessories)
鋼矢板 Sheet pilings
簡易鋼矢板 Cold-formed sheet pilings
形鋼Steel
shapes
計 Total
H形鋼Wide flange beams
大形形鋼Heavy shapes
中小形形鋼Medium and light shapes
軽量形鋼Cold-formed steel shapes
棒鋼Steelbars
計 Total
大形棒鋼Heavy bars
中形棒鋼Medium bars
小形棒鋼Light bars
線材
計 Total
バーインコイル Bars in coil
260
8,231 8,901 6,223 7,770 8,963 7,228 7,770
15,463 18,772 12,825 15,040 16,914 17,305 15,040
6,034 6,139 5,187 6,186 5,297 5,318 6,186
128,865 132,392 112,432 130,425 113,369 112,994 130,425
217,418 269,139 213,202 249,486 233,809 226,337 249,486
幅600mm以上600mm or more in width
188,743 236,069 184,781 211,371 201,145 192,901 211,371
幅600mm未満Less than 600mm in width
28,675 33,070 28,421 38,115 32,664 33,436 38,115
167,784 214,462 164,014 200,201 179,460 170,698 200,201
8,418 7,638 9,417 9,645 8,983 9,195 9,645
129,387 176,986 128,640 155,771 137,534 128,979 155,771
29,979 29,838 25,957 34,785 32,943 32,524 34,785
22,018 33,837 19,590 26,475 23,894 25,230 26,475
19,631 20,070 16,605 20,119 19,212 19,216 20,119
16,689 19,300 19,605 16,363 16,771 17,077 16,363
326,779 412,487 292,984 360,803 346,339 332,516 360,803
20,963 22,855 18,065 23,910 22,516 22,549 23,910
109,818 78,636 134,773 112,363 123,784 123,325 112,363
- - - - - - -
資料出所:製造産業局 鉄鋼課
注:「販売業者分」とは「需給調査対象の販売業者分」のことである。
線材Steel
wire rods
ハ ーインコイル Bars in coil
普通 Ordinary wire rods
特殊 Special wire rods
鋼板 Plates
熱 延薄板類Hot-rolledsteelstrips
計 Total
鋼帯Strips
冷 延薄板類Cold-rolledsteel
sheetsand strips
計 Total
磨帯鋼Cold-rolled narrow strips
冷延広幅帯鋼Cold-rolled wide strips
冷延鋼板Cold-rolled sheets and strips
外輪 Tyres and wheels
冷延電気鋼帯Cold-rolled electrical sheets and strips
ブリキ Tin plates
ティンフリースチールTin-free steel
亜鉛めっき鋼板Galvanized sheets
その他の金属めっき鋼板Other metallic coated sheets
鋼管 Steel pipes and tubes
260

参 考 統 計
(単位:t、Unit: t)
4 月 5 月 6 月 7 月 8 月 9 月 10 月 11 月 12 月
April May June July Aug. Sep. Oct. Nov. Dec.
1,356,622 1,402,059 1,408,267 1,321,943 1,389,704 1,386,110 1,359,871 1,360,832 1,393,722
2,759 3,109 3,380 3,040 2,834 3,309 3,957 3,251 2,173
3,693 3,648 3,646 2,135 2,122 2,093 1,991 2,046 2,547
- - - - - - - - -
125,417 137,130 148,893 140,606 132,515 129,039 116,946 113,024 113,804
76,759 86,550 98,220 88,998 80,856 77,135 68,535 66,229 67,707
18,050 18,402 18,927 19,368 19,263 18,955 16,717 15,782 15,138
19,208 19,600 20,739 21,420 21,047 20,012 19,486 18,726 17,207
11,400 12,578 11,007 10,820 11,349 12,937 12,208 12,287 13,752
35,689 41,337 39,372 36,580 35,950 36,774 36,062 34,476 38,208
4,271 7,318 6,174 5,482 5,478 7,242 6,062 5,366 6,167
4,632 4,597 4,218 4,155 4,360 4,539 4,227 4,327 4,432
15,435 15,734 15,740 14,447 13,328 12,588 14,513 13,946 16,847
11,351 13,688 13,240 12,496 12,784 12,405 11,260 10,837 10,762
27,241 29,143 30,071 24,190 26,225 24,939 25,995 25,369 33,812
7 498 7 558 6 591 6 730 6 757 6 717 6 685 7 412 8 901
261
7,498 7,558 6,591 6,730 6,757 6,717 6,685 7,412 8,901
14,312 16,839 19,533 13,456 14,502 12,946 14,016 12,743 18,772
5,431 4,746 3,947 4,004 4,966 5,276 5,294 5,214 6,139
118,443 129,750 145,799 125,394 128,981 138,846 123,579 125,352 132,392
265,724 267,059 268,992 251,636 271,401 267,922 266,346 263,704 269,139
226,895 230,530 235,157 218,949 237,496 233,113 233,755 230,481 236,069
38,829 36,529 33,835 32,687 33,905 34,809 32,591 33,223 33,070
210,178 209,355 208,441 203,359 218,493 209,877 215,122 218,471 214,462
9,515 9,937 9,821 9,398 9,480 9,347 7,825 7,839 7,638
164,345 163,725 166,462 163,723 178,978 172,037 177,417 178,757 176,986
36,318 35,693 32,158 30,238 30,035 28,493 29,880 31,875 29,838
26,696 28,396 28,646 27,666 30,303 28,567 29,096 32,216 33,837
18,363 18,119 20,645 19,492 19,590 21,589 19,566 18,732 20,070
16,991 16,429 15,584 17,296 24,263 19,058 18,447 18,263 19,300
375,745 389,069 373,843 365,341 391,159 396,055 395,448 402,450 412,487
26,506 27,338 24,060 22,997 22,552 21,838 22,811 23,671 22,855
103,177 102,177 96,895 82,211 83,316 86,204 84,505 79,807 78,636
- - - - - - - - -
Source: Iron and Steel Division, Manufacturing Industries Bureau
Note:“Relating to dealers” means “relating to dealers covered by the supply and demand research”.
261

参 考 統 計
(6)特殊鋼鋼材受払 (平成23年)
Receipts and shipments of special steel products (CY2011)
計Total
生産工場Manufacturing
plants
販売業者Dealers
計Total
消費者Users
販売業者Dealers
計 Total 58,676 442,313 274,644 167,669 441,844 247,937 193,907 59,145
炭 素 工 具 鋼Carbon tool steel
17,059 240,340 133,696 106,644 235,864 124,847 111,017 21,535
合 金 工 具 鋼Alloy tool steel
37,582 178,094 121,285 56,809 181,436 112,510 68,926 34,240
高 速 度 工 具 鋼High-speed tool steel
637 5,651 3,994 1,657 5,490 3,990 1,500 798
その他の工具鋼 Other tool steel
3,398 18,228 15,669 2,559 19,054 6,590 12,464 2,572
計 Total 387,187 8,661,150 6,903,448 1,757,702 8,620,793 4,556,219 4,064,574 427,544
機械構造用炭素鋼Carbon steel for machine structure
233,045 3,987,005 2,777,341 1,209,664 3,966,807 2,030,578 1,936,229 253,243
構 造 用 合 金 鋼Alloy steel for structure
154,142 4,674,145 4,126,107 548,038 4,653,986 2,525,641 2,128,345 174,301
計 Total 245,132 4,845,301 3,382,520 1,462,781 4,810,155 1,449,568 3,360,587 280,278
年末在庫Inventory
(Year-end)
工具鋼Toolsteel
構造用鋼
Steel forstructural
uses
前年末在庫Inventory
(Last year-end)
受 入 Receipts 販 売 Sales
(単位:t、Unit:t)
鋼 種Kind of steel
262
ば ね 鋼 Spring steel
20,594 274,681 48,817 225,864 273,757 86,856 186,901 21,518
軸 受 鋼 Bearing steel
53,478 552,254 319,315 232,939 547,952 396,825 151,127 57,780
44,346 524,933 384,630 140,303 504,941 294,735 210,206 64,338
99,614 3,131,199 2,393,304 737,895 3,121,608 418,988 2,702,620 109,205
快 削 鋼Free-cutting steel
17,731 200,117 194,173 5,944 200,660 192,891 7,769 17,188
ピ ア ノ 線 材Piano wire rods
103 8,140 2,754 5,386 8,090 2,784 5,306 153
高 抗 張 力 鋼High-tensile-strength steel
7,227 82,995 28,906 54,089 82,191 50,320 31,871 8,031
その他の特殊用途鋼Other steel for special purposes
2,039 70,982 10,621 60,361 70,956 6,169 64,787 2,065
690,995 13,948,764 10,560,612 3,388,152 13,872,792 6,253,724 7,619,068 766,967
40,572 155,921 121,060 34,861 152,187 106,151 46,036 44,306
資料出所:製造産業局 鉄鋼課 Source: Iron and Steel Division, Manufacturing Industries Bureau
特 殊用途鋼 Steel forspecial
purposes
合 計 Grand total
特 殊 鋼 鋼 管(軸受鋼を除く。)Special steel pipes and tubes
(excluding bearing steel)
ステンレス鋼 Stainless steel
Cr系
Ni系
262

参 考 統 計
2.鉄鋼生産内訳統計 Production by kind of iron and steel (1)鍛鋼品及び鋳鋼品 Steel forging and steel casting ①鍛鋼品(打放) Steel forging
平 成 23 年 暦 年
機 種 別 合計 普通鋼 特殊鋼 Special steel
Kind of machine Grand Ordinary 計 低合金鋼 ステンレス鋼 耐熱鋼 その他合金鋼
total steel Total Low‐alloy Stainless Heat‐resisting Other alloy
steel steel steel steel
合計 Grand total 623,180 162,804 460,376 380,398 16,070 2,603 61,305
ロール Rolls 37,392 37 37,355 35,700 - - 1,655
型用鋼 38,248 1,004 37,244 8,712 - - 28,532
Steel for dies and molds
容器類 7,830 42 7,788 7,788 - - -
Containers
自動車 240,653 94,351 146,302 146,302 - - -
Motor vehicles
鉄道車両(車軸を含む) 11,867 5,795 6,072 6,072 - - -Railroad vehicles (including axles)
船舶 Ships 93,961 39,400 54,561 54,474 87 - -
土木建設・鉱山機械 25,179 13,916 11,263 11,263 - - -Machinery for civil engineering,
construction / mining
産業機械・産業設備 17,772 5,391 12,381 10,982 1,059 340 -
(単位:t、Unit: t )
A.機種別・鋼種別生産内訳 Production by kind of machine / kind of steel
263
Industrial machinery / equipment
発電用機器 62,746 1,282 61,464 59,751 1,713 - -
Generators
武器・航空機 757 53 704 196 - 508 -
Arms / airplanes
各種施設 605 397 208 200 8 - -
Various facilities
その他(ブルームを含む) 86,170 1,136 85,034 38,958 13,203 1,755 31,118
Others( including blooms)
計 Total 内 需 Domestic demand 輸 出 Exports
623,180 12,515 499,684 110,981
資料出所:製造産業局 素形材産業室Source: Machine Parts and Tooling Industries Office , Manufacturing Industries Bureau
For in-house use 外販用 For sales
(単位:t、Unit: t)
B.内需・輸出別生産内訳 Production by domestic demand/exports
自社用
263

参 考 統 計
②鋳鋼品(鋳放) Steel castings
(単位:t、Unit: t)
平 成 23 年 暦 年
機 種 別 合計 普通鋼 特殊鋼 Special steel
Kind of machine Grand Ordinary 計 低合金鋼 高マンガン鋼 ステンレス鋼 耐熱鋼 磁石鋼 その他合金鋼
total steel Total Low‐alloy High‐manganese Stainless Heat‐resisting Magnetic Other alloy
steel steel steel steel steel steel
合計 Grand total 218,181 130,373 87,808 49,318 10,954 10,858 10,683 140 5,855
ロール Rolls 6,045 16 6,029 3,841 - - - - 2,188
金型 5,060 2,631 2,429 2,059 - - 11 - 359
Steel for dies and molds
鋳鋼管 12,337 6,864 5,473 3 - 1,614 3,856 - -
Steel pipes and tubes
バルブ・コック 11,489 5,365 6,124 1,016 - 5,099 - - 9
Valves / cocks
自動車 9,472 7,049 2,423 1,106 - 1,018 289 - 10
Motor vehicles
鉄道車両 2,930 2,295 635 635 - - - - -
Railroad vehicles
船舶 43,922 38,046 5,876 5,490 17 369 - - -
Ships( including dredgers)
土木建設・鉱山機械 58,819 43,366 15,453 15,229 224 - - - -Machinery for civil engineering,
construction / mining
運搬機械 6,342 1,991 4,351 4,191 7 122 31 - -
Transportation machinery
破砕機・摩砕機・選別機 13,101 1,082 12,019 2,516 8,248 216 - - 1,039
Crushers/ frictional crushers/ selectors
ポンプ・圧縮機・送風機 5,236 2,263 2,973 1,585 - 1,282 37 - 69
Pumps/ compressors/ ventilators
プレス・せん断機 8,805 7,443 1,362 1,355 2 1 - - 4
Presses shearing machines
圧延機 3,407 3,094 313 262 - - 19 - 32
Rolling mills
発電用機器 10 733 2 461 8 272 7 631 272 357 1 11
A.機種別・鋼種別生産内訳 Production by kind of machine / kind of steel
264
発電用機器 10,733 2,461 8,272 7,631 - 272 357 1 11
Generators
工業炉 4,250 898 3,352 483 232 55 2,439 - 143
Industrial furnaces
武器・航空機 461 5 456 443 9 - 2 - 2
Arms / airplanes
成形機械 696 472 224 179 - - 8 - 37
Molding machinery
各種施設 5,189 2,387 2,802 221 2,162 26 375 - 18
Various facilities
その他 9,887 2,645 7,242 1,073 53 784 3,259 139 1,934
Others
計 Total 内 需 Domestic demand 輸 出 Exports
218,181 40,394 172,807 4,980
資料出所:製造産業局 素形材産業室Source: Machine Parts and Tooling Industries Office , Manufacturing Industries Bureau
自社用 外販用 For in-house use For sales
B.内需・輸出別生産内訳 Production by domestic demand/exports ( 単位:t、Unit: t )
264

参 考 統 計
(平成23年分)
①生産内訳(製法別・用途別) Production (by manufacturing method/use) (単位:t、Unit: t)
計 TotalうちコラムColumn
計 Total
4,428,269 503,493 633,879 83,314 113,130 49,890 2,644,575 564,059 341,199 58,789
継目無鋼管Seamless
pipesand tubes
616,608 6,766 287,032 70,749 58,581 - 70,261 - 108,423 14,796
鍛接鋼管Butt-welded
pipes andtubes
165,399 165,390 9 - - - - - - -電縫鋼管Electric-welded
pipes andtubes 2,881,780 264,172 264,236 12,467 54,549 49,890 2,009,623 384,443 182,850 43,993
電弧溶接鋼管
Arc-weldedpipes and
tubes 764,482 67,165 82,602 98 - - 564,691 179,616 49,926 -
265,610 15,886 12,317 4,834 307 - 215,270 - 16,996 -
579,500 213,034 1,993 - - 57,655 306,164 - 654 -
2,359,666 - 940,176 60,031 - - 225,242 - 928,064 206,153
その他Others
冷けん用原管
Pipes forcold drawing
普通鋼 Ordinary
steelpipes and
tubes
特殊鋼Special steel
pipes andtubes
熱間鋼管Special hot steel pipes
and tubes
冷けん鋼管C ld d i l t l
熱間鋼管 Ordinaryhot steelpipes &tubes
冷けん鋼管Cold-drawn ordinarysteel pipes and tubes
めっき鋼管Metallic-coated ordinary
steel pipes and tubes
(2)鋼管 Steel pipes and tubes
品目 Commodity 計 Total配管用管Pipes forplumbing
特殊配管用管
Pipes forspecial
plumbing
缶用管Tubes for
cans
油井管Pipes foroil wells
電線管Tubes forconduits
構造用管Pipes for structures
265
171,107 - 13,018 27,169 - - 127,417 - 3,503 -
資料出所:製造産業局 鉄鋼課Source: Iron and Steel Division, Manufacturing Industries Bureau
Cold-drawn special steelpipes and tubes
265

参 考 統 計
(2)鋼管 Steel pipes and tubes
(単位:t Unit: t)
計 Totalうちコラム
Column
平成19年 (2007) 5,861,226 665,328 781,357 100,164 122,059 56,874 3,424,489 786,218 578,818 132,137
20 (2008) 5,589,267 644,118 685,068 89,091 137,689 60,607 3,396,252 779,629 502,700 73,742
21 (2009) 3,654,832 414,718 486,108 68,257 92,844 42,327 2,246,470 465,253 262,123 41,985
22 (2010) 4,297,279 523,942 578,616 87,022 97,068 45,509 2,578,760 474,501 326,158 60,204
23 (2011) 4,428,269 503,493 633,879 83,314 113,130 49,890 2,644,575 564,059 341,199 58,789
平成21年度 (FY2009) 3,751,441 402,677 496,033 70,418 83,711 43,870 2,333,912 422,301 271,356 49,464
22年度 (FY2010) 4,418,437 539,996 603,934 86,256 94,814 45,499 2,643,258 519,664 345,078 59,602
平成23年 1~3月(Q1) 1,167,623 127,980 182,181 20,115 26,132 13,228 692,108 144,869 91,359 14,520
4~6 (Q2) 1,123,610 154,421 177,769 17,128 31,073 12,603 633,782 141,572 84,086 12,748
7~9 (Q3) 1,061,639 115,776 158,337 23,133 31,809 12,278 626,857 134,656 78,394 15,055
10~12 (Q4) 1,075,397 105,316 115,592 22,938 24,116 11,781 691,828 142,962 87,360 16,466
平成23年 1月(Jan) 371,268 45,832 53,476 6,063 10,463 3,158 220,385 46,817 26,531 5,360
2 (Feb) 380,486 44,306 53,975 7,136 6,199 6,560 227,794 45,793 29,889 4,627
3 (Mar) 415,869 37,842 74,730 6,916 9,470 3,510 243,929 52,259 34,939 4,533
4 (Apr) 385,848 50,542 63,540 6,084 6,958 3,797 221,122 48,218 29,281 4,524
5 (May) 371,240 53,543 61,285 6,012 8,706 4,426 203,921 46,324 29,034 4,313
6 (Jun) 366,522 50,336 52,944 5,032 15,409 4,380 208,739 47,030 25,771 3,911
7 (Jul) 343,525 38,905 48,583 8,886 11,663 3,631 201,158 46,381 26,096 4,603
8 (Aug) 347,644 40,780 53,957 8,042 11,349 4,106 198,677 41,577 25,468 5,265
9 (Sep) 370,470 36,091 55,797 6,205 8,797 4,541 227,022 46,698 26,830 5,187
10 (Oct) 367,316 35,878 41,080 7,232 9,929 4,253 234,851 45,977 28,177 5,916
11 (Nov) 360,148 33,672 35,778 7,196 6,854 4,535 238,018 49,260 29,087 5,008
12 (Dec) 347,933 35,766 38,734 8,510 7,333 2,993 218,959 47,725 30,096 5,542
計配管用管
特殊配管用管 缶用管 油井管 構造用管 その他
油井管Pipes foroil wells
電線管Tubes forconduits
構造用管Pipes for structure その他
Others
冷けん用原管
Pipes forcold
drawing
Year and Month
普通鋼冷けん鋼管 Ordinary steel cold-drawn pipes and tubes 年 月
Year and Month
②用途別生産内訳 Production by use 普 通 鋼 熱 間 鋼 管 Ordinary hot steel pipes and tubes
年 月
計Total
配管用管Pipes forplumbing
特殊配管用管Pipes forspecialplumbing
缶用管Tubes for
cans
266
計Total
管用管Pipes forplumbing
配管用管Pipes forspecialplumbing
缶用管Tubes for
cans
油井管Pipes foroil wells
構造用管Pipes forstructures
その他Others
平成19年 (2007) 358,795 19,283 16,737 6,541 109 294,298 21,827
20 (2008) 346,048 19,505 15,230 5,472 103 276,550 29,188
21 (2009) 187,308 12,579 8,969 3,851 65 151,815 10,029
22 (2010) 270,594 16,247 13,138 3,498 233 222,029 15,449
23 (2011) 265,610 15,886 12,317 4,834 307 215,270 16,996
平成21年度 (FY2009) 217,297 14,467 10,881 3,770 63 177,475 10,641
22年度 (FY2010) 270,675 15,853 12,205 3,343 442 222,446 16,386
平成23年 1~3月(Q1) 66,851 3,719 2,993 887 227 54,662 4,363
4~6 (Q2) 58,690 3,428 3,396 1,393 31 46,705 3,737
7~9 (Q3) 69,044 4,452 3,051 1,554 11 55,356 4,620
10~12 (Q4) 71,025 4,287 2,877 1,000 38 58,547 4,276
平成23年 1月(Jan) 21,351 1,180 998 224 54 17,586 1,309
2 (Feb) 23,081 1,366 1,030 284 96 18,743 1,562
3 (Mar) 22,419 1,173 965 379 77 18,333 1,492
4 (Apr) 20,749 941 1,072 754 11 16,628 1,343
5 (May) 17,253 1,107 1,117 249 14 13,689 1,077
6 (Jun) 20,688 1,380 1,207 390 6 16,388 1,317
7 (Jul) 22,188 1,482 1,003 491 5 17,804 1,403
8 (Aug) 21,681 1,350 927 526 3 17,343 1,532
9 (Sep) 25,175 1,620 1,121 537 3 20,209 1,685
10 (Oct) 24,380 1,518 1,083 196 13 20,086 1,484
11 (Nov) 24,312 1,498 868 466 8 20,195 1,277
12 (Dec) 22,333 1,271 926 338 17 18,266 1,515
資料出所:製造産業局 鉄鋼課Source: Iron and Steel Division, Manufacturing Industries Bureau
Year and Month
266

参 考 統 計
(2)鋼管 Steel pipes and tubes
(単位:t Unit: t)
平成19年 (2007) 665,026 310,810 1,042 67,446 285,072 656 2,825,454 1,219,110 94,830
20 (2008) 633,545 283,290 804 69,673 279,240 538 2,952,923 1,319,522 93,107
21 (2009) 479,474 160,897 716 48,765 268,759 337 1,737,245 766,175 44,333
22 (2010) 563,344 203,391 1,675 51,195 306,494 589 2,399,846 1,060,797 48,951
23 (2011) 579,500 213,034 1,993 57,655 306,164 654 2,359,666 940,176 60,031
平成21年度 (FY2009) 508,010 171,048 1,196 50,397 284,916 453 1,847,269 856,452 37,654
22年度 (FY2010) 562,120 199,613 1,426 51,778 308,695 608 2,378,898 994,383 52,267
平成23年 1~3月(Q1) 138,917 46,686 363 15,218 76,483 167 608,815 251,129 15,116
4~6 (Q2) 160,973 65,457 551 14,961 79,869 135 444,558 130,672 12,241
7~9 (Q3) 139,125 56,663 597 13,886 67,844 135 583,129 226,811 15,723
10~12 (Q4) 140,485 44,228 482 13,590 81,968 217 723,164 331,564 16,951
平成23年 1月(Jan) 44,057 16,118 96 3,607 24,180 56 194,573 79,892 5,014
2 (Feb) 50,481 17,020 65 7,359 25,981 56 217,061 102,412 4,290
3 (Mar) 44,379 13,548 202 4,252 26,322 55 197,181 68,825 5,812
4 (Apr) 54,053 20,043 150 4,477 29,336 47 136,045 32,056 3,597
5 (May) 54,011 22,817 93 5,283 25,790 28 150,587 42,316 3,757
6 (Jun) 52,909 22,597 308 5,201 24,743 60 157,926 56,300 4,887
7 (Jul) 46,360 20,044 317 4,296 21,684 19 186,208 66,852 5,810
8 (Aug) 45,194 18,839 128 4,492 21,679 56 195,938 77,113 4,265
9 (Sep) 47,571 17,780 152 5,098 24,481 60 200,983 82,846 5,648
10 (Oct) 49,062 15,902 193 4,931 27,924 112 241,244 112,185 5,547
11 (Nov) 46,366 13,636 169 5,230 27,284 47 219,629 90,044 4,666
12 (Dec) 45,057 14,690 120 3,429 26,760 58 262,291 129,335 6,738
構造用管Pipes for
structures
その他Others
冷けん用原管Pipes for
cold drawing
計Total
特殊配管用Pipes forspeciall bi
缶用管Tubes for
cans
構造用管Pipes for
structures
その他Others
②用途別生産内訳 Production by use 普通鋼めっき鋼管 Metallic-coated ordinary hot steel pipes and tubes 特殊鋼熱間鋼管 Special hot-steel pipes and tubes
年 月計
Total
配管用管Pipes forplumbing
特殊配管用管
Pipes forspecial
電線管Tubes forconduits
構造用管Pipes for
structures
その他Others
年 月Year and Month
計Total
特殊配管用管
Pipes forspecial
缶用管Tubes for
cans
Year and Month
特殊鋼熱間鋼管 Special hot-steel pipes and tubes 特殊鋼冷けん鋼管 Cold drawn special steel pipes and tubes
267
structures cold drawingplumbing
cans structures
平成19年 (2007) 278,868 1,002,698 229,948 184,810 16,452 30,574 130,894 6,890
20 (2008) 280,537 1,016,020 243,737 199,967 15,330 38,778 140,677 5,182
21 (2009) 155,063 641,723 129,951 113,465 5,962 26,950 77,871 2,682
22 (2010) 226,942 867,963 195,193 159,080 10,959 22,821 119,907 5,393
23 (2011) 225,242 928,064 206,153 171,107 13,018 27,169 127,417 3,503
平成21年度 (FY2009) 171,763 637,949 143,451 122,253 6,259 24,338 88,696 2,960
22年度 (FY2010) 233,754 901,831 196,663 162,892 12,258 23,735 121,565 5,334
平成23年 1~3月(Q1) 56,289 238,591 47,690 41,324 3,412 7,109 29,902 901
4~6 (Q2) 49,260 204,724 47,661 40,548 3,340 5,761 30,830 617
7~9 (Q3) 55,253 232,354 52,988 40,973 3,264 6,897 29,863 949
10~12 (Q4) 64,440 252,395 57,814 48,262 3,002 7,402 36,822 1,036
平成23年 1月(Jan) 17,971 75,966 15,730 12,921 1,009 1,928 9,614 370
2 (Feb) 17,867 77,631 14,861 13,109 1,111 2,374 9,392 232
3 (Mar) 20,451 84,994 17,099 15,294 1,292 2,807 10,896 299
4 (Apr) 16,156 68,525 15,711 13,317 1,093 1,939 10,095 190
5 (May) 15,990 71,893 16,631 13,858 1,076 2,085 10,474 223
6 (Jun) 17,114 64,306 15,319 13,373 1,171 1,737 10,261 204
7 (Jul) 18,023 77,863 17,660 13,093 1,224 2,350 9,283 236
8 (Aug) 17,040 81,222 16,298 12,864 1,095 2,338 9,095 336
9 (Sep) 20,190 73,269 19,030 15,016 945 2,209 11,485 377
10 (Oct) 23,170 80,777 19,565 16,532 979 2,418 12,689 446
11 (Nov) 21,078 85,658 18,183 15,301 1,006 2,468 11,456 371
12 (Dec) 20,192 85,960 20,066 16,429 1,017 2,516 12,677 219
資料出所:製造産業局 鉄鋼課Source: Iron and Steel Division, Manufacturing Industries Bureau
267

参 考 統 計
3.非鉄金属需給統計 Non-ferrous metal supply and demand statistics
(1)品目別需給 Supply and demand by commodity
①電気銅 Electrolytic copper
供給 1,646,335 1,646,884 1,606,478 1,699,009 1,565,136 241,578 243,627 237,174 221,727
月初在庫 115,090 97,663 124,379 104,409 110,279 110,279 127,156 131,209 103,379
生産 1,491,125 1,500,131 1,439,843 1,548,688 1,328,288 127,657 113,062 103,239 93,198
輸入 40,120 49,090 42,256 45,912 126,569 3,642 3,409 2,726 25,150
需要 1,593,835 1,581,071 1,534,614 1,633,207 1,480,883 110,768 117,655 138,551 125,637
内需 1,002,749 1,108,657 907,929 1,104,823 1,058,646 84,560 88,666 88,293 102,055
電線 628,599 684,748 585,210 675,606 670,398 54,438 57,060 56,995 65,206
伸銅品 361,565 410,440 309,064 415,522 376,459 29,352 30,605 30,346 35,738
製錬 - - - - - - - - -
その他 12,585 13,469 13,655 13,695 11,789 770 1,001 952 1,111
輸出 591,086 472,414 626,685 528,384 422,237 26,208 28,989 50,258 23,582
月末在庫 97,663 103,379 104,409 110,279 124,578 127,156 131,209 103,379 111,053
生産業者 74,622 89,472 75,237 89,940 97,295 114,757 122,088 89,472 97,597
販売業者 11,718 3,505 9,941 9,508 9,950 5,799 8,695 3,505 10,161
消費者 11,323 10,402 19,231 10,831 17,333 6,600 426 10,402 3,295
②銅の故またはくず Copper scrap
供給 469,024 527,919 441,708 508,268 514,685 90,907 75,102 76,134 78,350
月初在庫 40 564 32 469 42 021 33 278 35 940 35 940 38 210 37 168 36 977
4月April
区分 22年計CY 2010
21年計CY 2009
21年度計FY 2009
21年度計FY 2009
3月March
22年計CY 2010
1月Jan.
区分 3月March
22年度計FY 2010
22年度計FY 2010
21年計CY 2009
23年計CY 2011
1月Jan.
2月Feb.
2月Feb.
23年計CY 2011
4月April
268
月初在庫 40,564 32,469 42,021 33,278 35,940 35,940 38,210 37,168 36,977
発生 234,423 256,719 220,986 256,619 250,332 19,063 21,477 22,480 22,066
回収 132,300 144,556 123,727 129,534 149,348 27,561 9,496 9,934 12,555
輸入 61,737 94,175 54,974 88,837 79,065 8,343 5,919 6,552 6,752
需要 841,645 819,838 810,103 815,394 813,818 60,515 70,083 73,166 76,155
内需 491,321 527,272 450,641 528,453 525,425 38,584 43,802 44,702 47,162
電線 149,412 140,145 149,149 140,233 149,316 10,773 11,816 11,641 12,945
伸銅品 310,977 354,192 273,018 355,039 344,347 25,100 29,239 30,485 31,605
その他 30,932 32,935 28,474 33,181 31,762 2,711 2,747 2,576 2,612
輸出 350,324 292,566 359,462 286,941 288,393 21,931 26,281 28,464 28,993
月末在庫 32,469 36,977 33,278 35,940 33,464 38,210 37,168 36,977 36,857
生産業者 - - - - - - - - -
販売業者 15,316 15,996 15,790 15,329 15,168 15,189 15,248 15,996 15,361
消費者 17,153 20,981 17,488 20,611 18,296 23,021 21,920 20,981 21,496
資料出所:資源エネルギー庁 資源・燃料部 鉱物資源課
Source:Mineral and Natural Resources Division, Natural Resources and Fuel Department, Agency for Natural Resources and Energy
注1.「発生」とは、 (1)製造加工を行う工程中に発生した非鉄金属のくず (2)再生地金生産を専業とする事業所以外で非鉄金属の故、くず、若しくは滓類等を原料として副業的に生産したもの 2.「回収」とは、 (1)「故又はくず」以外の品目については、還元剤又は触媒として投入されたものを設備から回収したもの (2)「故又はくず」については非鉄金属消費者の国内回収分 3.電気銅には、さお銅、銅ケーク及び銅ビレットを含む。 4.電気鉛の輸入は粗鉛を差引いて計上してある。 5.電気銀の生産は、電気銀を計上し、それ以外の項目は再生銀地金を含む。
268

参 考 統 計
(単位: t, Unit: t)
249,459 236,346 255,594 259,552 261,231 263,582 245,926 228,243 Supply
111,053 123,252 133,531 132,975 141,348 141,343 128,487 105,170 Start-of-month inventory
104,624 99,970 104,991 114,544 116,057 118,777 112,763 119,406 Production
33,782 13,124 17,072 12,033 3,826 3,462 4,676 3,667 Imports
114,024 119,671 120,976 102,536 134,719 139,915 135,554 120,877 Demand
90,260 92,184 87,723 76,328 88,123 89,610 89,276 81,568 Domestic demand
53,236 55,142 53,259 47,568 56,746 57,483 59,968 53,297 Electric wire
36,106 35,977 33,608 27,643 30,409 31,161 28,362 27,152 Electric copper products
- - - - - - - - Refining
918 1,065 856 1,117 968 966 946 1,119 Others
23,764 27,487 33,253 26,208 46,596 50,305 46,278 39,309 Exports
123,252 133,531 132,975 141,348 141,343 128,487 105,170 124,578 End-of-month Inventory
105,206 109,866 111,713 117,398 119,761 107,915 91,584 97,295 Producers
13,866 16,725 14,506 11,427 11,964 9,609 5,927 9,950 Sellers
4,180 6,940 6,756 12,523 9,618 10,963 7,659 17,333 Consumers
(単位: t, Unit: t)
75,443 73,997 73,000 71,605 72,769 73,304 71,085 67,402 Supply
36 857 34 642 33 795 32 311 34 850 34 773 33 408 31 422 Start-of-month inventory
12月Dec.
9月Sep.
Classification
12月Dec.
5月May
5月May
7月July
8月Aug.
6月June
7月July
6月June
11月Nov.
9月Sep.
10月Oct.
11月Nov.
10月Oct.
8月Aug.
Classification
269
36,857 34,642 33,795 32,311 34,850 34,773 33,408 31,422 Start-of-month inventory
20,703 22,476 21,346 19,100 21,562 20,886 20,653 18,520 By-production
11,244 10,721 9,920 10,999 10,158 12,056 12,358 12,346 Collection
6,639 6,158 7,939 9,195 6,199 5,589 4,666 5,114 Imports
66,014 78,644 71,795 61,298 61,633 60,573 69,794 64,148 Demand
46,520 47,352 45,795 37,592 43,758 45,787 45,910 38,461 Domestic demand
12,502 13,518 13,009 10,369 12,722 13,831 14,775 11,415 Electric wire
31,492 31,090 30,029 24,770 28,174 29,058 28,524 24,781 Electric copper products
2,526 2,744 2,757 2,453 2,862 2,898 2,611 2,265 Others
19,494 31,292 26,000 23,706 17,875 14,786 23,884 25,687 Exports
34,642 33,795 32,311 34,850 34,773 33,408 31,422 33,464 End-of-month inventory
- - - - - - - - Producers
14,895 14,587 14,702 14,930 15,130 14,617 14,670 15,168 Sellers
19,747 19,208 17,609 19,920 19,643 18,791 16,752 18,296 Consumers
Notes 1. “By-production” means: (1) non-ferrous metal scraps occurring in manufacturing or processing steps. (2) ancillary production by works other than those specializing in the recycling of metals, using non-ferrous metals, scrap or slag as materials. 2. “Collection” means: (1) the collection of the metal used as a reducing agent or catalyst from manufacturing facilities, for items other than used metal or scrap. (2) used metal and scraps collected domestically by consumers of non-ferrous metals. 3. Electrolytic copper includes copper for electric wire-bars, copper cakes and billets. 4. Imports of electrolytic lead excludes crude lead. 5. Production of electrolytic silver refers to that of electrolytic silver alone, but remelted silver is included in all other classification.
269

参 考 統 計
③銅合金の故又はくず Copper base alloy scrap
供給 747,556 828,286 709,622 819,295 800,335 134,421 119,507 119,862 120,272
月初在庫 54,783 47,462 80,959 53,781 58,780 58,780 57,648 58,095 57,987
発生 180,290 203,763 157,718 208,072 192,972 14,646 15,218 16,841 18,229
回収 463,253 501,004 428,175 485,153 486,704 54,087 41,510 39,448 38,689
輸入 49,230 76,057 42,770 72,289 61,879 6,908 5,131 5,478 5,367
需要 786,198 855,500 709,815 855,120 816,975 70,163 69,185 68,036 70,130
内需 786,198 855,500 709,815 855,120 816,975 70,163 69,185 68,036 70,130
電線 - - - - - - - - -
伸銅品 462,798 523,385 401,278 528,720 508,931 40,066 42,711 43,133 48,969
製錬 265,225 273,941 252,262 268,447 251,492 25,403 21,331 20,148 16,961
その他 58,175 58,174 56,275 57,953 56,552 4,694 5,143 4,755 4,200
輸出 - - - - - - - - -
月末在庫 47,462 57,987 53,781 58,780 62,641 57,648 58,095 57,987 62,039
生産業者 - - - - - - - - -
販売業者 5,521 5,383 5,806 5,531 6,057 5,535 5,512 5,383 5,247
消費者 41,941 52,604 47,975 53,249 56,584 52,113 52,583 52,604 56,792
④電気鉛 Electrolytic lead
供給 226 831 242 025 223 474 244 257 253 634 37 562 35 777 27 408 32 664
3月March
21年計CY 2009
23年計CY 2011
区分 22年計CY 2010
1月Jan.
2月Feb.
21年度計FY 2009
22年度計FY 2010
21年計CY 2009
21年度計FY 2009
23年計CY 2011
4月April
3月March
22年度計FY 2010
区分 22年計CY 2010
1月Jan.
2月Feb.
4月April
270
供給 226,831 242,025 223,474 244,257 253,634 37,562 35,777 27,408 32,664
月初在庫 22,704 14,405 22,134 17,303 16,521 16,521 17,293 15,341 12,146
生産 195,826 216,108 192,196 215,828 215,064 19,729 17,736 10,862 17,487
輸入 8,301 11,512 9,144 11,126 22,049 1,312 748 1,205 3,031
需要 223,173 230,578 214,614 233,171 225,168 18,480 18,359 15,966 15,246
内需 173,812 191,104 159,093 192,710 191,801 15,405 14,801 13,639 13,431
蓄電池 155,804 171,855 142,675 172,372 175,351 13,699 13,798 12,610 12,323
無機薬品 5,451 4,679 5,047 5,179 4,347 311 174 360 506
再生 1,611 1,624 1,340 1,722 1,312 108 92 105 71
鉛管板 2,052 2,372 1,875 2,513 687 228 236 37 14
はんだ・銅合金塊 1,663 1,662 1,483 1,699 1,548 139 126 136 83
製錬 - - - - - - - - -
その他 7,231 8,912 6,673 9,225 8,556 920 375 391 434
輸出 49,361 39,474 55,521 40,461 33,367 3,075 3,558 2,327 1,815
月末在庫 14,405 12,146 17,303 16,521 15,168 17,293 15,341 12,146 14,469
生産業者 7,797 5,437 8,943 9,344 8,166 10,441 8,805 5,437 7,133
販売業者 50 456 556 476 410 475 483 456 581
消費者 6,558 6,253 7,804 6,701 6,592 6,377 6,053 6,253 6,755
270

参 考 統 計
(単位: t, Unit: t)
124,162 119,719 120,365 122,979 129,832 118,406 118,458 125,079 Supply
62,039 55,878 57,432 61,439 72,983 61,268 63,285 64,673 Start-of-month inventory
17,766 17,007 16,369 15,361 16,702 15,833 15,650 13,350 By-production
38,813 41,539 41,321 40,734 35,699 36,912 35,217 42,735 Collection
5,544 5,295 5,243 5,445 4,448 4,393 4,306 4,321 Imports
73,026 72,100 69,434 67,437 66,283 63,876 62,472 64,833 Demand
73,026 72,100 69,434 67,437 66,283 63,876 62,472 64,833 Domestic demand
- - - - - - - - Electric wire
46,771 45,730 42,504 38,777 43,334 39,279 41,663 35,994 Electric copper products
21,429 21,647 21,783 23,597 18,676 19,490 17,109 23,918 Refining
4,826 4,723 5,147 5,063 4,273 5,107 3,700 4,921 Others
- - - - - - - - Exports
55,878 57,432 61,439 72,983 61,268 63,285 64,673 62,641 End-of-month inventory
- - - - - - - - Producers
5,173 5,374 5,235 5,680 5,918 5,841 6,012 6,057 Sellers
50,705 52,058 56,204 67,303 55,350 57,444 58,661 56,584 Consumers
(単位: t, Unit: t)
35 219 39 844 39 771 40 420 41 738 36 486 37 827 36 209 Supply
Classification11月Nov.
Classification9月Sep.
10月Oct.
10月Oct.
7月July
8月Aug.
6月June
7月July
8月Aug.
9月Sep.
11月Nov.
12月Dec.
12月Dec.
5月May
6月June
5月May
271
35,219 39,844 39,771 40,420 41,738 36,486 37,827 36,209 Supply
14,469 19,627 20,133 19,397 21,011 14,470 17,487 15,917 Start-of-month inventory
18,861 16,855 18,158 19,343 18,505 19,748 18,957 18,823 Production
1,889 3,362 1,480 1,680 2,222 2,268 1,383 1,469 Imports
15,129 17,800 18,751 18,810 21,643 22,148 22,209 20,627 Demand
13,296 15,720 16,269 15,640 18,151 18,830 18,878 17,741 Domestic demand
12,279 14,672 15,120 14,258 16,315 17,194 17,277 15,806 Storage cells
356 423 370 306 398 332 427 384 Industrial inorganic chemicals
84 140 161 78 141 98 115 119 Re-melting
20 29 21 23 6 17 20 36 Lead,tube and sheet
130 147 152 131 120 129 133 122 Solder/copper alloy blocks
- - - - - - - - Anti-friction alloys
427 309 445 844 1,171 1,060 906 1,274 Others
1,833 2,080 2,482 3,170 3,492 3,318 3,331 2,886 Exports
19,627 20,133 19,397 21,011 14,470 17,487 15,917 15,168 End-of-month inventory
11,131 11,342 12,586 13,751 11,655 10,756 8,692 8,166 Producers
772 867 461 469 466 488 485 410 Sellers
7,724 7,924 6,350 6,791 2,349 6,243 6,740 6,592 Consumers
271

参 考 統 計
⑤再生鉛 Re-melted lead
供給 65,215 53,376 65,144 60,317 50,621 7,760 5,789 5,631 5,669
月初在庫 4,568 3,584 5,058 4,568 4,658 4,658 3,814 2,927 3,804
生産 54,981 45,195 55,438 51,378 37,498 2,393 1,505 2,485 1,448
発生 22 28 31 17 12 0 12 0 0
輸入 5,644 4,569 4,617 4,354 8,453 709 458 219 417
需要 73,423 75,796 71,908 75,614 69,207 6,682 5,568 5,713 5,087
内需 53,074 54,732 50,239 56,434 54,629 3,827 4,121 3,995 3,816
蓄電池 36,323 41,111 34,039 41,298 42,833 2,655 3,463 3,474 3,026
無機薬品 - - - - - - - - -
再生 15,465 12,253 15,031 13,707 9,904 1,093 579 411 673
鉛管板 150 203 129 198 71 20 10 25 1
はんだ・銅合金塊 227 199 228 202 230 14 17 21 26
製錬 - - - - - - - - -
その他 909 966 812 1,029 1,591 45 52 64 90
輸出 20,349 21,064 21,669 19,180 14,578 2,855 1,447 1,718 1,271
月末在庫 3,584 3,804 4,568 4,658 5,108 3,814 2,927 3,804 3,168
生産業者 - - - - - - - - -
販売業者 149 172 184 156 101 153 152 172 161
消費者 3,435 3,632 4,384 4,502 5,007 3,661 2,775 3,632 3,007
⑥鉛の故またはくず Lead scrap
4月April
1月Jan.
2月Feb.
区分 22年計CY 2010
21年計CY 2009
21年度計FY 2009
22年度計FY 2010
23年計CY 2011
3月March
272
供給 87,033 73,492 88,458 71,655 60,652 21,113 19,713 18,400 19,341
月初在庫 16,181 18,604 18,167 10,688 16,147 16,147 17,322 15,589 16,989
発生 17,775 15,903 16,128 18,603 12,755 1,459 550 538 386
回収 53,057 38,985 54,157 42,350 31,726 3,507 1,841 2,273 1,966
輸入 20 - 6 14 24 - - - -
需要 162,589 170,292 161,096 174,525 157,343 14,145 13,770 8,987 11,566
内需 158,847 167,061 156,971 171,527 153,962 13,978 13,273 8,747 11,268
蓄電池 5,543 5,765 4,959 5,819 5,768 468 507 385 245
無機薬品 - - - - - - - - -
再生 48,686 30,503 51,274 36,384 22,111 2,612 569 864 617
鉛管板 243 281 224 292 61 8 17 14 5
はんだ・銅合金塊 538 502 487 547 435 36 40 36 39
製錬 103,407 129,836 99,600 128,362 125,453 10,813 12,137 7,429 10,358
その他 430 174 427 123 134 41 3 19 4
輸出 3,742 3,231 4,125 2,998 3,381 167 497 240 298
月末在庫 18,604 16,989 10,688 16,147 16,855 17,322 15,589 16,989 16,672
生産業者 - - - - - - - - -
販売業者 70 111 107 83 84 136 133 111 107
消費者 18,534 16,878 10,581 16,064 16,771 17,186 15,456 16,878 16,565
21年度計FY 2009
22年度計FY 2010
21年計CY 2009
区分 22年計CY 2010
1月Jan.
2月Feb.
3月March
4月April
23年計CY 2011
272

参 考 統 計
(単位: t, Unit: t)
5,459 5,269 8,023 10,405 9,683 8,965 9,930 10,003 Supply
3,168 3,021 3,102 4,464 4,539 3,391 4,503 5,232 Start-of-month inventory
1,300 1,806 4,207 4,072 4,269 4,909 4,843 4,261 Production
0 0 0 0 0 0 0 0 By‐production
991 442 714 1,869 875 665 584 510 Imports
4,775 5,918 5,894 5,954 5,594 6,670 5,827 5,525 Demand
3,616 4,715 4,589 4,518 5,236 5,903 5,281 5,012 Domestic demand
3,108 3,917 3,700 3,483 3,997 4,237 4,082 3,691 Storage cells
- - - - - - - - Industrial inorganic chemicals
438 531 710 806 983 1,561 988 1,131 Re-melting
6 2 1 1 1 1 1 2 Lead, tubes, sheets
14 18 17 15 24 25 23 16 Solder/copper alloy blocks
- - - - - - - - Refining
50 247 161 213 231 79 187 172 Others
1,159 1,203 1,305 1,436 358 767 546 513 Exports
3,021 3,102 4,464 4,539 3,391 4,503 5,232 5,108 End-of-month inventory
- - - - - - - - Producers
152 156 178 122 138 102 125 101 Sellers
2,869 2,946 4,286 4,417 3,253 4,401 5,107 5,007 Consumers
(単位: t, Unit: t)
10月Oct.
8月Aug.
9月Sep.
5月May
6月June
7月July
11月Nov.
12月Dec.
Classification
273
18,276 17,242 17,169 19,529 19,407 19,277 19,564 19,642 Supply
16,672 15,297 12,711 14,403 15,035 14,303 15,140 14,560 Start-of-month inventory
365 615 1,429 1,491 833 1,670 1,724 1,695 By-production
1,239 1,330 3,029 3,626 3,539 3,304 2,700 3,372 Collection
- - - 9 - - - 15 Imports
12,598 13,740 14,396 14,325 14,640 12,923 12,848 13,405 Demand
12,171 13,361 13,943 14,149 14,436 12,776 12,640 13,220 Domestic demand
326 526 538 445 570 657 541 560 Storage cells
- - - - - - - - Industrial inorganic chemicals
445 541 2,847 2,894 2,348 2,973 3,019 2,382 Re-melting
2 2 - 2 2 1 3 5 Lead, tubes, sheets
46 35 39 33 28 30 37 36 Solder/copper alloy blocks
11,351 12,256 10,508 10,766 11,485 9,108 9,016 10,226 Refining
1 1 11 9 3 7 24 11 Others
427 379 453 176 204 147 208 185 Exports
15,297 12,711 14,403 15,035 14,303 15,140 14,560 16,855 Month0end Inventory
- - - - - - - - Producers
100 116 79 118 126 122 100 84 Sellers
15,197 12,595 14,324 14,917 14,177 15,018 14,460 16,771 Consumers
5月May
6月June
11月Nov.
12月Dec.
Classification7月July
8月Aug.
9月Sep.
10月Oct.
273

参 考 統 計
⑦電気亜鉛又は蒸留亜鉛 Electrolytic zinc and Distilled zinc
供給 681,068 664,876 662,658 671,418 688,110 121,797 118,347 105,862 116,975
月初在庫 109,287 68,379 94,521 65,555 65,555 65,555 73,851 70,165 57,883
生産 546,115 560,770 540,604 574,008 544,674 53,662 43,281 31,734 27,716
輸入 25,666 35,727 27,533 31,855 77,881 2,580 1,215 3,963 31,376
需要 489,543 475,023 474,907 486,781 447,126 38,969 36,978 34,187 34,494
内需 353,963 380,750 318,922 389,036 351,848 31,246 29,597 26,743 29,447
亜鉛めっき鋼板 174,529 183,278 151,056 190,367 173,665 15,783 13,401 12,498 12,930
その他のめっき 56,523 58,047 56,576 58,796 53,476 4,479 4,755 4,093 4,185
無機薬品 30,595 32,810 27,422 34,000 33,079 2,546 2,672 2,354 2,720
亜鉛ダイカスト 33,217 36,992 31,242 35,713 24,558 3,528 3,422 2,605 3,428
亜鉛板 1,377 1,997 2,535 2,017 1,897 149 157 156 192
伸銅品 45,813 53,456 38,347 54,495 52,674 3,529 4,224 3,844 4,578
その他 11,909 14,170 11,744 13,648 12,499 1,232 966 1,193 1,414
輸出 135,580 94,273 155,985 97,745 95,278 7,723 7,381 7,444 5,047
月末在庫 68,379 57,883 73,600 65,555 92,265 73,851 70,165 57,883 66,177
生産業者 54,273 42,849 57,933 50,439 74,568 59,064 56,414 42,849 47,261
販売業者 87 160 113 66 898 47 63 160 898
消費者 14,019 14,874 15,554 15,050 16,799 14,740 13,688 14,874 18,018
⑧再生亜鉛 Re-melted zinc
4月April
1月Jan.
2月Feb.
区分 22年計CY 2010
21年度計
21年計CY 2009
21年度計FY 2009
22年度計FY 2010
22年度計 21年計
23年計CY 2011
3月March
区分 22年計 1月 2月 3月 4月23年計
274
供給 40,722 44,573 38,612 43,538 47,587 9,226 10,593 9,464 11,558
月初在庫 6,864 7,394 5,911 6,129 6,129 6,129 7,407 7,033 6,099
生産 30,380 33,071 29,491 33,576 31,931 2,712 2,747 2,063 3,062
発生 2,877 2,883 2,654 3,070 2,889 279 276 68 360
輸入 601 1,225 556 763 6,638 106 163 300 2,037
需要 53,704 52,001 49,336 53,934 44,351 3,627 4,133 3,843 3,223
内需 34,065 36,429 30,430 38,244 30,341 2,657 2,694 2,887 2,870
亜鉛めっき鋼板 6,765 8,332 6,324 8,117 6,497 671 646 615 544
その他のめっき 4,852 4,293 4,514 5,103 2,406 304 175 166 163
無機薬品 9,857 10,825 8,667 11,244 9,112 798 847 977 866
亜鉛ダイカスト 1,533 1,354 1,315 1,485 1,005 94 100 94 87
亜鉛板 - - - - - - - - -
伸銅品 6,787 7,931 6,200 7,499 8,699 605 705 947 988
その他 4,271 3,694 3,410 4,796 2,622 185 221 88 222
輸出 19,639 15,572 18,906 15,690 14,010 970 1,439 956 353
月末在庫 7,394 6,099 8,040 6,129 10,103 7,407 7,033 6,099 7,354
生産業者 - - - - - - - - -
販売業者 1,512 1,695 1,453 735 2,565 1,578 1,896 1,695 1,552
消費者 5,882 4,404 6,587 5,394 7,538 5,829 5,137 4,404 5,802
21年度計FY 2009
22年度計FY 2010
21年計CY 2009
区分 22年計CY 2010
1月Jan.
2月Feb.
3月March
4月April
23年計CY 2011
274

参 考 統 計
(単位: t, Unit: t)
122,240 124,978 129,767 129,655 131,013 136,621 138,104 142,606 Supply
66,177 75,261 81,382 80,252 78,101 79,782 82,494 84,507 Start-of-month inventory
43,866 41,276 43,187 44,388 50,161 54,776 53,482 57,145 By-production
12,197 8,441 5,198 5,015 2,751 2,063 2,128 954 Imports
36,418 34,908 35,575 36,333 39,597 38,525 42,557 38,585 Demand
30,513 30,201 28,896 28,488 29,814 29,747 30,844 26,312 Domestic demand
14,072 14,889 14,731 15,040 15,435 15,196 15,584 14,106 Galvanized sheet
5,153 4,540 4,152 4,571 4,149 4,733 4,482 4,184 Other galvanizing
3,134 3,107 3,441 2,386 2,830 2,369 3,137 2,383 Industrial inorganic chemicals
1,702 1,641 1,273 1,576 1,650 1,849 1,703 181 Zinc die casts
143 147 184 152 162 152 184 119 Zinc plates
5,046 5,063 4,301 3,892 4,423 4,657 4,730 4,387 Copper and copper base alloys
1,263 814 814 871 1,165 791 1,024 952 Others
5,905 4,707 6,679 7,845 9,783 8,778 11,713 12,273 Exports
75,261 81,382 80,252 78,101 79,782 82,494 84,507 92,265 End-of-month inventory
55,203 60,596 60,840 59,532 60,740 65,572 67,646 74,568 Producers
1,449 2,714 2,336 2,026 1,748 1,548 1,130 898 Sellers
18,609 18,072 17,076 16,543 17,294 15,374 15,731 16,799 Consumers
(単位: t, Unit: t)
10月Oct.
8月Aug.
9月Sep.
5月May
6月June
7月July
11月Nov.
12月Dec.
Classification
5月 6月 11月 12月 Classification7月 8月 9月 10月
275
12,061 12,293 11,979 11,497 13,191 13,777 11,245 12,975 Supply
7,354 7,434 9,135 8,943 10,312 10,399 7,902 10,254 Start-of-month inventory
2,851 3,118 2,429 2,189 2,556 2,897 2,890 2,417 Production
278 262 160 173 218 312 281 222 By-production
1,578 1,479 255 192 105 169 172 82 Imports
4,697 3,825 3,623 3,795 3,721 3,443 3,557 2,864 Demand
3,263 2,599 2,300 2,482 2,351 1,899 2,229 2,110 Domestic demand
732 536 389 337 463 638 489 437 Galvanized sheet
165 295 178 176 211 224 163 186 Other galvanizing
958 655 922 872 725 131 613 748 Industrial inorganic chemicals
87 37 56 99 88 90 89 84 Zinc die casts
- - - - - - - - Zinc plates
1,083 861 571 710 628 610 587 404 Copper and copper base alloys
238 215 184 288 236 206 288 251 Others
1,434 1,226 1,323 1,313 1,370 1,544 1,328 754 Exports
7,434 9,135 8,943 10,312 10,399 7,902 10,254 10,103 End-of-month inventory
- - - - - - - - Producers
1,570 2,416 2,269 3,943 3,605 3,220 2,769 2,565 Sellers
5,864 6,719 6,674 6,369 6,794 4,682 7,485 7,538 Consumers
5月May
6月June
11月Nov.
12月Dec.
Classification7月July
8月Aug.
9月Sep.
10月Oct.
275

参 考 統 計
⑨亜鉛の故又はくず Zinc scrap
供給 118,092 129,166 282,158 128,935 128,908 31,006 30,117 30,255 30,773
月初在庫 21,374 21,211 186,015 22,350 22,047 22,047 21,306 21,307 22,311
発生 40,191 45,071 37,896 45,187 42,697 3,840 3,345 3,674 3,157
回収 55,849 62,104 57,642 60,688 63,122 5,019 5,386 5,214 5,205
輸入 678 780 605 710 1,042 100 80 60 100
需要 54,808 62,848 52,760 61,516 59,626 5,248 5,636 5,221 4,738
内需 51,627 57,878 49,690 57,043 55,207 4,827 5,163 4,884 4,522
亜鉛めっき鋼板 - - - - - - - - -
その他のめっき 2,276 2,460 2,061 2,447 2,544 211 271 144 270
無機薬品 9,222 8,869 9,702 9,004 8,815 751 622 841 703
亜鉛ダイカスト - 150 - 150 200 - - - -
亜鉛板 - - - - - - - - -
伸銅品 - - - - - - - - -
製錬 1,213 2,011 1,229 1,239 3,128 320 426 292 314
その他 38,916 44,388 36,698 44,203 40,520 3,545 3,844 3,607 3,235
輸出 3,181 4,970 3,070 4,473 4,419 421 473 337 216
月末在庫 21,211 22,311 22,350 22,047 26,089 21,306 21,307 22,311 23,154
生産業者 - - - - - - - - -
販売業者 71 55 104 60 83 66 44 55 82
消費者 21,140 22,256 22,246 21,987 26,006 21,240 21,263 22,256 23,072
⑩すず Tin
区分 22年計CY 2010
1月Jan.
2月Feb.
21年計CY 2009
21年度計FY 2009
23年計CY 2011
22年度計FY 2010
3月March
4月April
276
⑩すず Tin
供給 28,400,817 37,631,954 24,476,122 37,422,815 28,961,890 5,017,532 3,044,850 3,772,699 3,366,489
月初在庫 1,489,057 981,220 1,559,544 1,103,303 1,139,372 1,139,372 1,188,264 1,030,262 1,197,273
生産 748,192 893,895 757,121 840,592 947,449 81,742 73,500 97,172 89,298
発生 162,894 213,024 139,918 209,396 207,827 12,077 13,860 25,472 16,653
輸入 26,000,674 35,543,815 22,019,539 35,269,524 26,667,242 3,784,341 1,769,226 2,619,793 2,063,265
需要 5,900,508 7,126,544 5,258,277 6,851,203 7,238,943 738,481 524,936 611,828 662,764
内需 5,657,728 6,584,649 4,982,672 6,480,203 6,612,666 561,942 498,372 588,727 615,168
輸出 242,780 541,895 275,605 371,000 626,277 176,539 26,564 23,101 47,596
月末在庫 981,220 1,197,273 1,103,303 1,139,372 1,311,340 1,188,264 1,030,262 1,197,273 1,294,945
生産業者 37,139 58,195 39,211 50,552 62,537 72,770 61,663 58,195 89,298
販売業者 27,468 37,777 32,450 28,456 47,213 28,062 27,073 37,777 51,802
消費者 916,613 1,101,301 1,031,642 1,060,364 1,201,590 1,087,432 941,526 1,101,301 1,153,845
3月March
区分 22年計CY 2010
1月Jan.
2月Feb.
21年計CY 2009
21年度計FY 2009
23年計CY 2011
22年度計FY 2010
4月April
276

参 考 統 計
(単位: t, Unit: t)
31,480 31,873 32,317 32,332 33,929 33,963 34,340 33,721 Supply
23,154 22,526 23,523 23,572 24,637 24,783 25,164 24,915 Start-of-month inventory
3,260 3,523 3,363 3,679 3,726 3,853 3,650 3,627 By-production
4,985 5,687 5,370 5,000 5,445 5,247 5,425 5,139 Collection
81 137 61 81 121 80 101 40 Imports
4,573 5,504 4,785 4,701 4,537 5,451 4,757 4,475 Demand
4,367 5,090 4,288 4,260 4,207 5,202 4,443 3,954 Domestic demand
- - - - - - - - Galvanized sheet
149 172 121 214 181 227 317 267 Other galvanizing
794 751 800 606 665 819 720 743 Industrial inorganic chemicals
- 100 100 - - - - - Zinc die casts
- - - - - - - - Zinc plates
- - - - - - - - Copper and copper base alloys
308 379 227 196 129 94 213 230 Refining
3,116 3,688 3,040 3,244 3,232 4,062 3,193 2,714 Others
206 414 497 441 330 249 314 521 Exports
22,526 23,523 23,572 24,637 24,783 25,164 24,915 26,089 End-of-month inventory
- - - - - - - - Producers
62 40 61 77 61 85 132 83 Sellers
22,464 23,483 23,511 24,560 24,722 25,079 24,783 26,006 Consumers
(単位: kg Unit: kg)
8月Aug.
9月Sep.
12月Dec.
5月May
10月Oct.
6月June
7月July
Classification11月Nov.
277
(単位: kg, Unit: kg)
4,344,526 3,323,782 3,466,363 3,424,494 3,457,085 3,936,782 2,859,410 2,996,673 Supply
1,294,945 1,288,044 1,373,849 1,351,142 1,362,981 1,261,705 1,410,524 1,289,806 Start-of-month inventory
57,358 79,791 88,989 71,401 70,457 91,866 68,338 77,537 Production
16,474 23,596 17,240 14,784 15,811 21,894 14,509 15,457 By-production
2,975,749 1,932,351 1,986,285 1,987,167 2,007,836 2,561,317 1,366,039 1,613,873 Imports
687,861 614,495 597,789 546,917 549,232 605,147 581,048 518,445 Demand
665,116 584,479 539,916 527,596 521,518 484,319 560,876 464,637 Domestic demand
22,745 30,016 57,873 19,321 27,714 120,828 20,172 53,808 Exports
1,288,044 1,373,849 1,351,142 1,362,981 1,261,705 1,410,524 1,289,806 1,311,340 End-of-month inventory
92,879 96,596 116,250 105,358 68,408 80,972 50,468 62,537 Producers
67,314 95,234 83,903 55,081 36,777 69,079 59,129 47,213 Sellers
1,127,851 1,182,019 1,150,989 1,202,542 1,156,520 1,260,473 1,180,209 1,201,590 Consumers
5月May
12月Dec.
Classification6月June
7月July
8月Aug.
9月Sep.
10月Oct.
11月Nov.
277

参 考 統 計
⑪すずの故又はくず Tin scrap
供給 1,120,490 1,540,436 1,119,032 1,514,339 1,405,489 199,275 258,377 216,750 282,768
月初在庫 32,310 58,200 70,412 64,033 123,528 123,528 106,888 124,811 96,062
発生 882,903 1,194,094 819,068 1,180,175 1,122,881 65,652 114,291 75,760 176,937
回収 119,658 130,716 122,369 125,527 115,981 9,564 16,259 10,502 9,470
輸入 85,619 157,426 107,183 144,604 43,099 531 20,939 5,677 299
需要 826,261 1,009,600 834,279 1,038,143 1,006,951 65,764 70,621 82,593 106,932
内需 681,372 912,856 594,695 886,327 965,858 65,764 70,621 82,593 102,913
輸出 144,889 96,744 239,584 151,816 41,093 - - - 4,019
月末在庫 58,200 96,062 64,033 123,528 172,986 106,888 124,811 96,062 123,021
生産業者 - - - - - - - - -
販売業者 16,202 62,038 24,380 90,578 68,282 80,077 87,296 62,038 83,253
消費者 41,998 34,024 39,653 32,950 104,704 26,811 37,515 34,024 39,768
⑫アンチモン Antimony metal
供給 5,592,681 7,894,317 4,500,440 7,429,011 7,749,348 1,171,117 922,362 981,493 916,739
月初在庫 261,413 266,488 416,952 240,270 386,029 386,029 321,873 389,559 391,388
生産 273,440 365,434 238,810 303,685 434,617 44,800 25,720 49,625 27,525
輸入 5,057,828 7,262,395 3,844,678 6,885,056 6,928,702 740,288 574,769 542,309 497,826
需要 1 206 755 1 357 227 1 173 075 1 357 840 1 182 979 84 704 91 947 118 959 86 260
区分 22年計CY 2010
区分 22年計CY 2010
3月March
1月Jan.
2月Feb.
21年度計FY 2009
22年度計FY 2010
23年計CY 2011
22年度計FY 2010
4月April
21年計CY 2009
3月March
21年度計FY 2009
23年計CY 2011
1月Jan.
2月Feb.
21年計CY 2009
4月April
278
需要 1,206,755 1,357,227 1,173,075 1,357,840 1,182,979 84,704 91,947 118,959 86,260
内需 629,578 695,101 590,327 695,641 640,815 44,597 47,309 77,458 40,446
蓄電池 292,743 330,148 276,942 323,763 311,380 13,256 28,845 40,070 13,289
硬鉛鋳物 20,929 19,339 25,111 20,137 21,069 1,473 1,279 1,497 1,515
特殊鋼 266,125 294,130 229,170 299,280 268,825 27,985 14,820 30,320 23,510
減摩合金 56 211 143 208 333 - - 3 304
その他 49,725 51,273 58,961 52,253 39,208 1,883 2,365 5,568 1,828
輸出 577,177 662,126 582,748 662,199 542,164 40,107 44,638 41,501 45,814
月末在庫 266,488 391,388 240,270 386,029 244,881 321,873 389,559 391,388 327,270
生産業者 1,920 3,870 5,220 2,775 4,380 2,884 3,415 3,870 4,030
販売業者 151,864 293,044 137,880 286,811 170,955 240,698 292,122 293,044 225,574
消費者 112,704 94,474 97,170 96,443 69,546 78,291 94,022 94,474 97,666
278

参 考 統 計
(単位: kg, Unit: kg)
222,051 210,168 176,495 152,844 198,787 325,618 319,105 270,505 Supply
123,021 107,036 104,594 84,925 79,749 222,017 207,528 170,623 Start-of-month inventory
89,100 94,194 62,401 54,918 108,934 86,272 102,852 91,570 Production
9,930 8,472 9,212 7,626 10,104 8,149 8,570 8,123 Collection
- 466 288 5,375 - 9,180 155 189 Imports
85,598 67,622 57,167 70,669 118,732 81,809 116,405 83,039 Demand
85,598 67,622 56,600 45,831 107,063 81,809 116,405 83,039 Domestic demand
- - 567 24,838 11,669 - - - Exports
107,036 104,594 84,925 79,749 222,017 207,528 170,623 172,986 End-of-month inventory
- - - - - - - - Producers
64,190 72,263 56,854 49,930 39,483 70,203 47,337 68,282 Sellers
42,846 32,331 28,071 29,819 182,534 137,325 123,286 104,704 Consumers
(単位: kg, Unit: kg)
1,316,796 1,256,295 834,337 826,677 754,885 814,854 772,824 551,270 Supply
327,270 353,992 299,623 346,395 281,860 238,026 234,281 186,034 Start-of-month inventory
107,400 99,435 7,026 23,153 27,762 17,063 4,868 240 Production
882,126 802,868 527,688 457,129 445,263 559,765 533,675 364,996 Imports
85 147 83 944 120 624 99 555 114 840 96 871 116 557 83 571 Demand
11月Nov.
12月Dec.
9月Sep.
12月Dec.
Classification
Classification
10月Oct.
11月Nov.
9月Sep.
5月May
6月June
8月Aug.
7月July
8月Aug.
10月Oct.
5月May
6月June
7月July
279
85,147 83,944 120,624 99,555 114,840 96,871 116,557 83,571 Demand
46,110 43,553 66,579 57,700 70,406 52,973 53,539 40,145 Domestic demand
24,238 22,118 40,093 25,744 43,006 24,348 21,878 14,495 Batteries
1,507 1,380 1,264 1,275 2,244 2,230 2,824 2,581 Casts of hardened lead
18,690 17,685 22,094 25,836 21,485 19,715 26,060 20,625 Special steel
- - - - - - 26 - Anti-frinction alloys
1,675 2,370 3,128 4,845 3,671 6,680 2,751 2,444 Others
39,037 40,391 54,045 41,855 44,434 43,898 63,018 43,426 Exports
353,992 299,623 346,395 281,860 238,026 234,281 186,034 244,881 End-of-month inventory
6,100 5,915 4,715 4,305 4,180 6,663 4,335 4,380 Producers
245,119 199,725 248,244 192,620 160,428 143,725 96,612 170,955 Sellers
102,773 93,983 93,436 84,935 73,418 83,893 85,087 69,546 Consumers
279

参 考 統 計
⑬水銀 Mercury
供給 6,034 1,525 6,848 63 2,359 2,357 2,165 3,833 23
月初在庫 5,032 1,518 5,851 50 2,357 2,357 2,165 3,833 23
回収 - - - - - - - - -
輸入 1,002 7 997 13 2 - - - -
需要 133,097 75,796 144,857 94,611 96,404 1,398 767 189 10,915
内需 3,736 3,863 3,289 3,964 6,649 698 448 93 651
無機薬品 - - - - - - - - -
計量器 - - - - - - - - -
電池材料 600 464 530 537 370 58 49 - 42
電気機器 742 766 655 721 819 63 72 93 71
その他 2,394 2,633 2,104 2,706 5,460 577 327 - 538
輸出 129,361 71,933 141,568 90,647 89,755 700 319 96 10,264
月末在庫 1,518 23 50 2,357 7,377 2,165 3,833 23 8,785
生産業者 - - - - - - - - -
販売業者 - - - - - - - - -
消費者 1,518 23 50 2,357 7,377 2,165 3,833 23 8,785
⑭ニッケル Nickel
供給 84 929 719 101 816 054 77 172 785 101 611 600 102 083 443 21 855 567 22 299 512 20 689 725 20 079 751
区分 22年計CY 2010
1月Jan.
2月Feb.
21年計CY 2009
3月March
3月March
21年度計FY 2009
23年計CY 2011
22年度計FY 2010
区分 22年計CY 2010
1月Jan.
2月Feb.
4月April
4月April
21年計CY 2009
21年度計FY 2009
23年計CY 2011
22年度計FY 2010
280
供給 84,929,719 101,816,054 77,172,785 101,611,600 102,083,443 21,855,567 22,299,512 20,689,725 20,079,751
月初在庫 17,026,555 10,516,615 16,021,625 12,654,758 13,922,462 13,922,462 15,653,250 12,959,583 13,090,095
生産 33,946,758 41,420,131 30,159,934 40,238,691 41,727,633 3,966,972 3,475,692 3,748,531 3,496,228
輸入 33,956,406 49,879,308 30,991,226 48,718,151 46,433,348 3,966,133 3,170,570 3,981,611 3,493,428
需要 45,075,611 60,404,464 35,983,869 60,683,626 58,980,648 4,335,070 4,832,308 5,710,684 4,675,794
内需 39,964,373 49,342,416 34,228,324 49,302,098 46,444,550 3,827,330 3,678,007 4,191,690 3,786,411
特殊鋼 31,063,634 41,026,482 25,872,915 40,675,077 38,320,391 3,172,733 3,020,023 3,436,876 3,122,901
めっき 1,835,409 2,248,722 1,690,851 2,306,360 1,916,636 154,028 137,530 174,659 146,015
蓄電池 2,113,431 1,935,907 2,276,402 2,072,518 1,610,550 139,543 145,776 147,379 137,552
磁性材料 2,255,761 1,820,790 1,819,697 1,906,671 1,922,143 187,126 191,787 209,709 193,956
触媒 349,911 336,935 343,411 316,935 369,477 20,000 43,000 39,500 9,000
その他 2,346,227 1,973,580 2,225,048 2,024,537 2,305,353 153,900 139,891 183,567 176,987
輸出 5,111,238 11,062,048 1,755,545 11,381,528 12,536,098 507,740 1,154,301 1,518,994 889,383
月末在庫 10,516,615 13,090,095 12,654,758 13,922,462 15,179,356 15,653,250 12,959,583 13,090,095 12,919,264
生産業者 2,483,908 3,408,921 3,650,028 2,694,657 2,927,385 3,447,488 3,384,607 3,408,921 4,159,723
販売業者 1,790,591 2,609,670 1,467,974 3,613,091 4,432,118 4,443,291 2,202,112 2,609,670 2,309,660
消費者 6,242,116 7,071,504 7,536,756 7,614,714 7,819,853 7,762,471 7,372,864 7,071,504 6,449,881
280

参 考 統 計
(単位: kg, Unit: kg)
8,785 6,733 6,760 7,042 9,457 10,354 3,889 3,522 Supply
8,785 6,733 6,760 7,042 9,457 10,352 3,889 3,522 Start-of-month inventory
- - - - - - - - By-production
- - - - - 2 - - Imports
3,825 18,003 10,720 9,413 6,988 12,601 14,712 6,873 Demand
255 712 265 631 571 1,289 582 454 Domestic demand
- - - - - - - - Inorganic chemicals
- - - - - - - - Measuring instruments
32 53 19 26 34 28 17 12 Batteries materials
60 93 53 44 56 50 50 114 Electric appliances
163 566 193 561 481 1,211 515 328 Others
3,570 17,291 10,455 8,782 6,417 11,312 14,130 6,419 Exports
6,733 6,760 7,042 9,457 10,352 3,889 3,522 7,377 End-of-month inventory
- - - - - - - - Producers
- - - - - - - - Sellers
6,733 6,760 7,042 9,457 10,352 3,889 3,522 7,377 Consumers
(単位: kg, Unit: kg)
19 224 105 19 898 799 20 283 247 20 910 534 20 927 388 22 285 342 21 835 538 21 981 170 Supply
11月Nov.
12月Dec.
12月Dec.
6月June
7月July
8月Aug.
Classification11月Nov.
Classification
5月May
9月Sep.
10月Oct.
10月Oct.
5月May
8月Aug.
9月Sep.
6月June
7月July
281
19,224,105 19,898,799 20,283,247 20,910,534 20,927,388 22,285,342 21,835,538 21,981,170 Supply
12,919,264 12,753,067 13,122,632 13,062,527 13,106,149 14,086,406 14,811,351 14,622,911 Start-of-month inventory
2,967,647 3,050,366 3,285,667 3,681,331 3,616,814 3,919,409 3,117,763 3,401,213 Production
3,337,194 4,095,366 3,874,948 4,166,676 4,204,425 4,279,527 3,906,424 3,957,046 Imports
5,148,587 5,362,705 4,893,235 4,477,159 5,071,183 4,727,558 4,735,350 5,011,015 Demand
3,914,729 4,021,822 3,873,862 3,369,635 4,258,376 3,857,927 3,819,654 3,845,107 Domestic demand
3,255,197 3,326,587 3,199,459 2,789,927 3,590,459 3,135,451 3,086,641 3,184,137 Special steel
140,640 168,959 156,289 139,970 186,127 169,331 170,638 172,450 Plating
113,550 153,100 145,075 111,225 131,200 140,525 141,325 104,300 Batteries
167,717 180,909 158,056 128,655 127,555 123,748 141,064 111,861 Magnetic steel
67,500 13,000 35,500 23,000 40,477 31,000 32,500 15,000 Catalysts
170,125 179,267 179,483 176,858 182,558 257,872 247,486 257,359 Others
1,233,858 1,340,883 1,019,373 1,107,524 812,807 869,631 915,696 1,165,908 Exports
12,753,067 13,122,632 13,062,527 13,106,149 14,086,406 14,811,351 14,622,911 15,179,356 End-of-month inventory
3,842,438 3,051,930 2,522,802 2,359,679 2,637,849 2,779,284 2,677,591 2,927,385 Producers
2,420,080 4,064,682 4,460,106 4,139,838 4,226,194 4,112,580 3,816,076 4,432,118 Sellers
6,490,549 6,006,020 6,079,619 6,606,632 7,222,363 7,919,487 8,129,244 7,819,853 Consumers
281

参 考 統 計
⑮ニッケル又はニッケル合金の故又はくず Nickel or Nickel alloy scrap
供給 1,064,222,129 1,137,992,887 962,772,307 1,128,383,953 1,113,886,308 185,470,688 175,136,149 180,124,634 180,712,508
月初在庫 172,331,770 76,427,271 172,893,938 100,796,001 92,481,037 92,481,037 91,030,330 83,417,085 86,564,609
発生 233,090,639 263,073,819 224,310,544 255,062,075 273,224,201 22,501,084 23,668,295 23,615,344 23,690,611
回収 654,307,784 792,619,968 561,652,860 766,936,750 742,418,964 69,995,872 59,937,024 72,517,198 69,933,796
輸入 4,491,936 5,871,829 3,914,965 5,589,127 5,762,106 492,695 500,500 575,007 523,492
需要 950,594,736 1,012,793,858 826,438,380 994,985,536 971,008,066 90,711,370 89,411,866 89,613,320 92,860,199
内需 949,120,557 1,010,742,018 825,338,867 992,829,610 968,939,344 90,612,205 89,258,788 89,359,945 92,638,906
特殊鋼 941,330,897 1,003,532,660 818,198,001 985,284,894 961,246,638 90,075,421 88,933,447 88,351,628 91,718,559
めっき 1,556 2,376 1,382 2,317 2,296 198 189 168 147
蓄電池 62,860 75,980 52,600 77,320 26,200 6,040 5,800 7,000 7,360
磁性材料 165,716 - 124,747 40,969 - - - - -
触媒 - - - - - - - - -
その他 7,559,528 7,131,002 6,962,137 7,424,110 7,664,210 530,546 319,352 1,001,149 912,840
輸出 1,474,179 2,051,840 1,099,513 2,155,926 2,068,722 99,165 153,078 253,375 221,293
月末在庫 76,427,271 86,564,609 100,796,001 92,481,037 95,877,695 91,030,330 83,417,085 86,564,609 84,551,682
生産業者 - - - - - - - - -
販売業者 378,863 694,549 417,468 658,158 872,839 635,671 635,807 694,549 685,028
消費者 76,048,408 85,870,060 100,378,533 91,822,879 95,004,856 90,394,659 82,781,278 85,870,060 83,866,654
⑯コバルト Cobalt
供給 13,375,407 14,187,208 12,448,768 14,421,012 14,949,736 2,274,218 2,150,683 1,987,155 2,046,165
月初在庫 926,208 722,106 856,744 470,960 1,196,453 1,196,453 1,109,751 877,736 908,740
1月Jan.
2月Feb.
3月March
区分 22年計CY 2010
21年度計FY 2009
21年計CY 2009
21年度計FY 2009
22年度計FY 2010
22年度計FY 2010
区分 22年計CY 2010
21年計CY 2009
23年計CY 2011
4月April
23年計CY 2011
1月Jan.
2月Feb.
3月March
4月April
282
月初在庫 926,208 722,106 856,744 470,960 1,196,453 1,196,453 1,109,751 877,736 908,740
生産 1,637,643 1,858,751 1,331,813 1,935,038 2,007,298 164,144 152,563 160,993 189,046
輸入 10,811,556 11,606,351 10,260,211 12,015,014 11,745,985 913,621 888,369 948,426 948,379
需要 1,882,836 2,319,943 1,610,700 2,313,174 2,162,334 183,842 171,959 180,218 187,044
内需 1,882,836 2,319,943 1,610,700 2,313,174 2,162,334 183,842 171,959 180,218 187,044
特殊鋼 563,200 762,425 493,137 770,637 731,960 50,898 38,409 54,563 51,887
磁性材料 186,256 175,221 140,897 175,342 191,903 20,304 16,672 20,190 16,577
管板棒線 264,992 222,638 225,368 242,413 274,808 17,852 19,884 10,082 27,590
超硬工具 261,918 377,244 201,332 379,278 294,665 31,970 26,065 28,171 23,365
触媒 249,961 271,258 202,447 263,173 255,896 21,777 23,935 28,249 17,017
その他 356,509 511,157 347,519 482,331 413,102 41,041 46,994 38,963 50,608
輸出 - - - - - - - - -
月末在庫 722,106 908,740 470,960 1,196,453 1,043,417 1,109,751 877,736 908,740 868,997
生産業者 158,953 149,172 102,118 147,748 215,120 138,891 154,254 149,172 185,483
販売業者 255,494 189,869 91,500 562,001 304,050 464,379 262,864 189,869 147,939
消費者 307,659 569,699 277,342 486,704 524,247 506,481 460,618 569,699 535,575
282

参 考 統 計
(単位: kg, Unit: kg)
168,987,134 183,333,961 171,692,860 172,810,792 177,105,894 182,937,342 179,878,562 166,378,866 Supply
84,551,682 91,533,682 87,896,298 86,776,585 92,125,192 98,018,979 101,591,003 107,177,637 Start-of-month inventory
22,713,731 23,813,715 22,485,404 22,189,865 24,961,094 21,770,921 21,033,215 20,780,922 By-production
61,379,778 67,487,483 60,923,926 63,172,496 59,671,306 62,623,020 56,774,764 38,002,301 Collection
341,943 499,081 387,232 671,846 348,302 524,422 479,580 418,006 Imports
67,888,725 88,642,095 80,984,568 77,609,319 80,362,562 75,832,860 69,321,530 67,769,652 Demand
67,762,370 88,478,648 80,842,679 77,460,436 80,221,405 75,669,793 69,111,816 67,522,353 Domestic demand
66,975,332 87,475,531 80,176,308 77,212,195 79,679,837 75,389,963 68,306,404 66,952,013 Special steel
148 376 105 60 80 172 562 91 Plating
- - - - - - - - Batteries
- - - - - - - - Magnetic steel
- - - - - - - - Catalysts
786,890 1,002,741 666,266 248,181 541,488 279,658 804,850 570,249 Others
126,355 163,447 141,889 148,883 141,157 163,067 209,714 247,299 Exports
91,533,682 87,896,298 86,776,585 92,125,192 98,018,979 101,591,003 107,177,637 95,877,695 End-of-month inventory
- - - - - - - - Producers
545,908 571,906 581,707 734,395 675,160 646,851 622,838 872,839 Sellers
90,987,774 87,324,392 86,194,878 91,390,797 97,343,819 100,944,152 106,554,799 95,004,856 Consumers
(単位: kg, Unit: kg)
2,246,075 2,121,591 1,891,097 2,059,649 2,030,302 1,966,698 2,056,096 2,024,947 Supply
868,997 988,408 831,866 883,211 872,756 814,861 806,851 941,763 Start-of-month inventory
12月Dec.
8月Aug.
9月Sep.
10月Oct.
Classification11月Nov.
5月May
6月June
7月July
Classification7月July
8月Aug.
9月Sep.
10月Oct.
12月Dec.
5月May
6月June
11月Nov.
283
868,997 988,408 831,866 883,211 872,756 814,861 806,851 941,763 Start of month inventory
122,143 137,311 178,400 158,750 199,742 165,359 205,538 173,309 Production
1,254,935 995,872 880,831 1,017,688 957,804 986,478 1,043,707 909,875 Imports
173,356 185,388 173,655 195,260 200,535 189,159 183,880 138,038 Demand
173,356 185,388 173,655 195,260 200,535 189,159 183,880 138,038 Domestic demand
48,174 57,849 45,694 74,401 94,140 77,111 72,486 66,348 Special steel
17,183 16,723 16,756 12,674 15,532 14,958 14,334 10,000 Magnetic steel
29,164 27,650 28,212 26,804 21,912 21,811 30,743 13,104 Tubes, plates, bars, wires
24,880 29,409 24,565 19,308 20,147 24,569 24,066 18,150 Hard-metal products
23,644 22,435 16,135 13,611 23,265 27,237 19,366 19,225 Catalysts
30,311 31,322 42,293 48,462 25,539 23,473 22,885 11,211 Others
- - - - - - - - Exports
988,408 831,866 883,211 872,756 814,861 806,851 941,763 1,043,417 End-of-month inventory
142,116 127,127 127,672 118,962 151,454 159,928 202,446 215,120 Producers
269,292 169,224 237,413 260,348 183,053 179,230 248,070 304,050 Sellers
577,000 535,515 518,126 493,446 480,354 467,693 491,247 524,247 Consumers
283

参 考 統 計
⑰タングステン Tungsten
供給 2,904,103 4,502,011 2,131,081 4,405,254 4,880,539 1,145,737 1,006,654 1,090,381 1,108,994
月初在庫 647,857 530,940 540,450 488,190 801,364 801,364 783,313 718,592 773,518
生産 2,039,734 3,319,543 1,400,461 3,360,792 3,298,617 257,318 183,516 305,842 277,123
輸入 216,512 651,528 190,170 556,272 780,558 87,055 39,825 65,947 58,353
需要 3,797,226 5,719,742 2,917,877 5,565,607 5,738,086 491,188 394,042 531,417 459,291
内需 3,508,901 5,517,028 2,677,409 5,354,273 5,502,827 486,371 384,548 497,815 437,000
超硬工具 3,285,045 5,134,419 2,470,803 5,041,775 5,138,072 395,856 364,602 475,309 408,755
線板棒 122,128 181,002 106,871 181,170 161,468 12,447 12,774 11,316 13,318
接点 36,056 112,853 30,813 46,545 108,438 71,396 1,961 3,747 4,334
特殊鋼 19,586 28,301 22,661 25,021 48,465 3,215 1,510 2,988 5,593
その他 46,086 60,453 46,261 59,762 46,384 3,457 3,701 4,455 5,000
輸出 288,325 202,714 240,468 211,334 235,259 4,817 9,494 33,602 22,291
月末在庫 530,940 773,518 488,190 801,364 909,823 783,313 718,592 773,518 766,360
生産業者 162,711 156,354 149,832 159,107 372,778 139,709 136,546 156,354 181,192
販売業者 - - - - - - - - -
消費者 368,229 617,164 338,358 642,257 537,045 643,604 582,046 617,164 585,168
⑱タングステン鉱 Tungsten ore
供給 508 868 879 158 505 253 748 270 1 146 536 797 536 848 850 796 909 860 545
区分 22年計CY 2010
21年計CY 2009
21年度計FY 2009
区分 22年計CY 2010
22年度計FY 2010
21年計CY 2009
21年度計FY 2009
22年度計FY 2010
3月March
4月April
3月March
23年計CY 2011
23年計CY 2011
1月Jan.
2月Feb.
1月Jan.
2月Feb.
4月April
284
供給 508,868 879,158 505,253 748,270 1,146,536 797,536 848,850 796,909 860,545
月初在庫 498,868 777,158 495,253 728,270 777,536 777,536 806,850 776,909 839,545
生産 - - - - - - - - -
輸入 10,000 102,000 10,000 20,000 369,000 20,000 42,000 20,000 21,000
需要 373,145 294,525 322,397 280,628 402,511 34,897 29,941 267 29,752
内需 331,145 294,525 280,397 280,628 402,511 34,897 29,941 267 29,752
金属タングステン 163,372 780 163,372 780 - - - - -
フェロタングステン - - - - - - - - -
その他 2,598 1,145 2,815 1,118 7,603 3 - 267 892
輸出 42,000 - 42,000 - - - - - -
月末在庫 777,158 839,545 728,270 777,536 1,001,712 806,850 776,909 839,545 861,265
生産業者 714,919 837,779 633,245 754,879 979,226 774,879 774,879 837,779 859,229
販売業者 - - - - - - - - -
消費者 62,239 1,766 95,025 22,657 22,486 31,971 2,030 1,766 2,036
394,908 -165,175 292,600 114,210 278,730 34,894 29,941 28,860カルシウムタングステンクリンカ-
284

参 考 統 計
(単位: kg, Unit: kg)
1,110,921 1,112,258 1,120,845 1,090,270 1,140,380 1,283,154 1,249,938 1,222,097 Supply
766,360 766,434 725,199 714,449 774,921 950,708 915,901 911,695 Start-of-month inventory
279,158 251,969 315,477 315,418 300,515 260,665 297,981 253,635 Production
65,403 93,855 80,169 60,403 64,944 71,781 36,056 56,767 Imports
443,267 546,815 503,557 505,640 367,378 534,296 524,458 436,737 Demand
407,175 511,352 470,738 494,264 342,999 521,133 517,400 432,032 Domestic demand
387,881 491,398 443,792 454,907 323,439 490,320 493,048 408,765 Hard-metal products
9,387 8,441 14,072 27,508 9,190 15,748 13,923 13,344 Wires, plates, bars
4,201 3,173 4,423 3,273 2,687 3,385 3,388 2,470 Contact points
4,592 4,287 3,155 5,056 4,232 6,653 3,171 4,013 Special steel
1,114 4,053 5,296 3,520 3,451 5,027 3,870 3,440 Others
36,092 35,463 32,819 11,376 24,379 13,163 7,058 4,705 Exports
766,434 725,199 714,449 774,921 950,708 915,901 911,695 909,823 End-of-month inventory
183,892 156,399 179,669 196,916 360,694 350,658 362,103 372,778 Producers
- - - - - - - - Sellers
582,542 568,800 534,780 578,005 590,014 565,243 549,592 537,045 Consumers
(単位: kg, Unit: kg)
861 265 944 848 881 188 943 285 941 933 984 240 987 312 982 669 Supply
Classification
5月May
7月July
8月Aug.
9月Sep.
5月May
10月Oct.
11月Nov.
12月Dec.
6月June
11月Nov.
10月Oct.
12月Dec.
Classification6月June
7月July
8月Aug.
9月Sep.
285
861,265 944,848 881,188 943,285 941,933 984,240 987,312 982,669 Supply
861,265 861,848 881,188 902,285 921,933 922,240 947,312 962,669 Start-of-month inventory
- - - - - - - - Production
- 83,000 - 41,000 20,000 62,000 40,000 20,000 Imports
29,846 37,941 52,960 43,813 39,623 7,216 48,099 48,156 Demand
29,846 37,941 52,960 43,813 39,623 7,216 48,099 48,156 Domestic demand
- - - - - - - - Metallic tungsten
- - - - - - - - Ferro-tungsten
197 1,099 461 352 1,086 775 1,327 1,144 Others
- - - - - - - - Exports
861,848 881,188 902,285 921,933 922,240 947,312 962,669 1,001,712 End-of-month inventory
859,226 879,226 899,220 919,220 919,226 939,226 959,226 979,226 Producers
- - - - - - - - Sellers
2,622 1,962 3,065 2,713 3,014 8,086 3,443 22,486 Consumers
47,01229,649 36,842 52,499 43,461 38,537 6,441 46,772 Calcium tungsten clinkers
285

参 考 統 計
⑲モリブデン Molybdenium
供給 2,640,547 3,166,438 1,806,689 3,405,806 3,123,403 1,176,390 1,251,533 1,248,332 1,376,975
月初在庫 1,131,478 975,508 700,949 1,073,467 1,023,932 1,023,932 1,173,437 1,044,350 1,216,188
生産 801,150 1,211,508 694,554 1,153,673 1,234,024 87,184 40,476 111,860 99,674
輸入 707,919 979,422 411,186 1,178,666 865,447 65,274 37,620 92,122 61,113
需要 2,984,329 4,263,262 2,442,146 4,154,844 4,400,677 371,876 223,730 399,748 416,363
内需 2,831,560 4,200,097 2,301,314 4,086,896 4,276,071 368,301 220,430 396,388 380,698
特殊鋼 2,269,160 3,543,233 1,870,196 3,430,755 3,680,901 322,539 163,235 320,106 306,776
線板棒 515,372 589,704 414,358 584,663 519,024 45,335 51,160 56,054 57,260
磁性材料 3,686 5,016 3,084 5,423 2,866 259 354 73 949
その他 43,342 62,144 13,676 66,055 73,280 168 5,681 20,155 15,713
輸出 152,769 63,165 140,832 67,948 124,606 3,575 3,300 3,360 35,665
月末在庫 975,508 1,216,188 1,073,467 1,023,932 947,601 1,173,437 1,044,350 1,216,188 1,005,631
生産業者 82,678 246,312 166,209 190,418 395,055 218,601 226,645 246,312 248,010
販売業者 - - - - - - - - -
消費者 892,830 969,876 907,258 833,514 552,546 954,836 817,705 969,876 757,621
⑳モリブデン鉱 Molybdenum ore
供給 28,925,186 39,527,973 27,526,598 37,651,786 43,959,257 6,792,574 6,448,690 6,010,446 6,412,043
月初在庫 4 304 239 2 429 557 4 424 545 2 107 021 3 393 231 3 393 231 3 640 647 2 484 103 3 202 583
23年計CY 2011
3月March
22年計CY 2010
22年度計FY 2010
22年度計FY 2010
1月Jan.
2月Feb.
4月April
23年計CY 2011
区分 22年計CY 2010
21年計CY 2009
21年度計FY 2009
21年計CY 2009
21年度計FY 2009
区分 1月Jan.
2月Feb.
3月March
4月April
286
月初在庫 4,304,239 2,429,557 4,424,545 2,107,021 3,393,231 3,393,231 3,640,647 2,484,103 3,202,583
生産 - - - - - - - - -
輸入 24,620,947 37,098,416 23,102,053 35,544,765 40,566,026 3,399,343 2,808,043 3,526,343 3,209,460
需要 8,281,433 10,589,922 7,912,880 10,145,621 10,929,656 943,404 740,300 1,037,711 1,055,713
内需 8,222,338 10,323,268 7,834,015 10,013,557 10,648,631 864,644 699,050 996,961 971,733
フェロモリブデン 4,482,659 5,712,255 4,132,661 5,605,445 5,913,578 496,093 268,444 573,100 547,803
無機薬品 2,017,400 2,359,140 2,014,920 2,289,140 2,519,000 187,000 224,000 233,000 210,000
金属モリブデン 1,069,822 1,265,989 832,902 1,242,130 1,109,546 94,089 127,538 117,452 99,344
ブリケットクリンカー 53,965 52,504 52,879 52,744 52,208 3,762 2,540 5,025 5,847
その他 598,492 933,380 800,653 824,098 1,054,299 83,700 76,528 68,384 108,739
輸出 59,095 266,654 78,865 132,064 281,025 78,760 41,250 40,750 83,980
月末在庫 2,429,557 3,202,583 2,107,021 3,393,231 2,969,059 3,640,647 2,484,103 3,202,583 3,323,507
生産業者 933,013 1,153,446 735,198 1,316,997 1,229,718 1,392,681 1,266,398 1,153,446 1,225,357
販売業者 - - - - - - - - -
消費者 1,496,544 2,049,137 1,371,823 2,076,234 1,739,341 2,247,966 1,217,705 2,049,137 2,098,150
286

参 考 統 計
(単位: kg, Unit: kg)
1,278,673 954,244 1,240,852 715,818 934,773 1,227,948 1,188,938 1,165,786 Supply
1,005,631 815,337 1,055,007 515,059 788,237 993,407 1,033,805 996,401 Start-of-month inventory
127,215 106,000 115,556 108,281 109,152 106,751 119,454 102,421 Production
145,827 32,907 70,289 92,478 37,384 127,790 35,679 66,964 Imports
313,128 375,342 241,735 415,666 420,113 457,963 469,615 295,398 Demand
297,963 362,362 228,166 402,271 407,618 452,771 467,865 291,238 Domestic demand
277,337 288,107 204,135 353,041 371,810 406,023 423,519 244,273 Special steel
19,290 59,079 18,805 45,114 35,550 44,549 43,035 43,793 Wire, plate, bars
109 92 342 277 183 98 69 61 Magnetic materials
1,227 15,084 4,884 3,839 75 2,101 1,242 3,111 Others
15,165 12,980 13,569 13,395 12,495 5,192 1,750 4,160 Exports
815,337 1,055,007 515,059 788,237 993,407 1,033,805 996,401 947,601 End-of-month inventory
285,306 301,101 326,255 328,904 346,850 366,105 386,319 395,055 Producers
- - - - - - - - Sellers
530,031 753,906 188,804 459,333 646,557 667,700 610,082 552,546 Consumers
(単位: kg, Unit: kg)
6,784,307 6,775,206 5,848,496 6,337,848 6,160,933 6,590,471 5,935,411 6,402,016 Supply
3 323 507 3 022 883 3 355 839 2 650 628 2 867 327 2 344 285 2 738 585 2 908 797 Start-of-month inventory
5月May
7月July
Classification
Classification7月July
6月June
9月Sep.
10月Oct.
5月May
8月Aug.
6月June
12月Dec.
8月Aug.
9月Sep.
10月Oct.
11月Nov.
12月Dec.
11月Nov.
287
3,323,507 3,022,883 3,355,839 2,650,628 2,867,327 2,344,285 2,738,585 2,908,797 Start-of-month inventory
- - - - - - - - Production
3,460,800 3,752,323 2,492,657 3,687,220 3,293,606 4,246,186 3,196,826 3,493,219 Imports
908,389 943,660 708,380 785,732 958,300 1,064,628 993,321 790,118 Demand
887,098 941,037 706,719 782,922 955,550 1,063,968 991,571 787,378 Domestic demand
597,614 486,192 364,608 468,284 557,721 629,881 516,331 407,507 Ferro-molybdenum
217,000 216,000 250,000 154,000 208,000 197,000 241,000 182,000 Industrial inorganic chemicals
- 144,703 - 79,301 97,055 124,673 130,311 95,080 Metallic molybdenum
5,498 3,769 3,315 4,403 4,126 4,414 5,056 4,453 Bricketed clinkers
66,986 90,373 88,796 76,934 88,648 108,000 98,873 98,338 Others
21,291 2,623 1,661 2,810 2,750 660 1,750 2,740 Exports
3,022,883 3,355,839 2,650,628 2,867,327 2,344,285 2,738,585 2,908,797 2,969,059 End-of-month inventory
1,326,771 1,317,747 1,142,004 1,099,016 904,875 1,203,221 1,291,030 1,229,718 Producers
- - - - - - - - Sellers
1,696,112 2,038,092 1,508,624 1,768,311 1,439,410 1,535,364 1,617,767 1,739,341 Consumers
287

参 考 統 計
21 銀 Silver
供給 4,705,832 5,199,004 4,496,033 5,172,085 5,041,517 1,327,146 1,343,259 1,378,715 1,347,226
月初在庫 931,564 1,088,926 959,905 872,325 1,062,722 1,062,722 1,020,810 1,031,949 1,006,960
生産 1,875,697 1,816,721 1,865,936 1,898,208 1,724,218 148,053 138,095 113,635 99,422
発生 306,459 317,290 326,487 313,931 325,373 23,338 25,313 43,039 25,077
輸入 1,592,112 1,976,067 1,343,705 2,087,621 1,929,204 93,033 159,041 190,092 215,767
需要 3,714,491 4,878,069 3,089,408 4,611,903 4,571,160 309,598 642,360 381,532 424,072
内需 1,601,858 2,024,423 1,392,946 1,878,619 1,737,564 123,077 361,339 153,049 176,847
写真感光用硝酸銀 490,940 432,231 445,219 503,705 464,462 22,525 26,801 32,290 69,571
その他の硝酸銀 152,418 215,118 126,155 207,827 159,633 14,372 15,502 20,119 18,772
接点 128,959 136,832 108,590 146,195 123,038 9,313 9,153 9,439 9,770
展伸材 163,701 209,909 134,279 210,076 175,075 17,725 16,640 14,460 13,846
銀ろう 93,755 106,523 77,357 111,262 75,791 6,854 8,209 8,521 8,246
その他 572,085 923,810 501,346 699,554 739,565 52,288 285,034 68,220 56,642
輸出 2,112,633 2,853,646 1,696,462 2,733,284 2,833,596 186,521 281,021 228,483 247,225
月末在庫 1,088,926 1,006,960 872,325 1,062,722 999,120 1,020,810 1,031,949 1,006,960 1,024,027
生産業者 80,523 52,240 68,346 72,395 92,520 70,774 66,655 52,240 59,583
販売業者 272,163 321,266 228,960 379,570 308,582 317,808 314,569 321,266 311,407
消費者 736,240 633,454 575,019 610,757 598,018 632,228 650,725 633,454 653,037
(参考)調査票回収状況
生産業者 99% 100% 95% 100% 100% 100% 95% 100% 100%
22年計CY 2010
21年計CY 2009
21年度計FY 2009
区分 22年度計FY 2010
1月Jan.
2月Feb.
3月March
4月April
6月調査対象業種 23年平均 1月 2月 3月 4月 5月 7月 8月
23年計CY 2011
288
生産業者 99% 100% 95% 100% 100% 100% 95% 100% 100%
販売業者 84% 86% 86% 86% 83% 86% 86% 86% 86%
消費者 87% 91% 88% 89% 88% 88% 83% 85% 87%
平均 90% 92% 90% 92% 90% 91% 88% 90% 91%
288
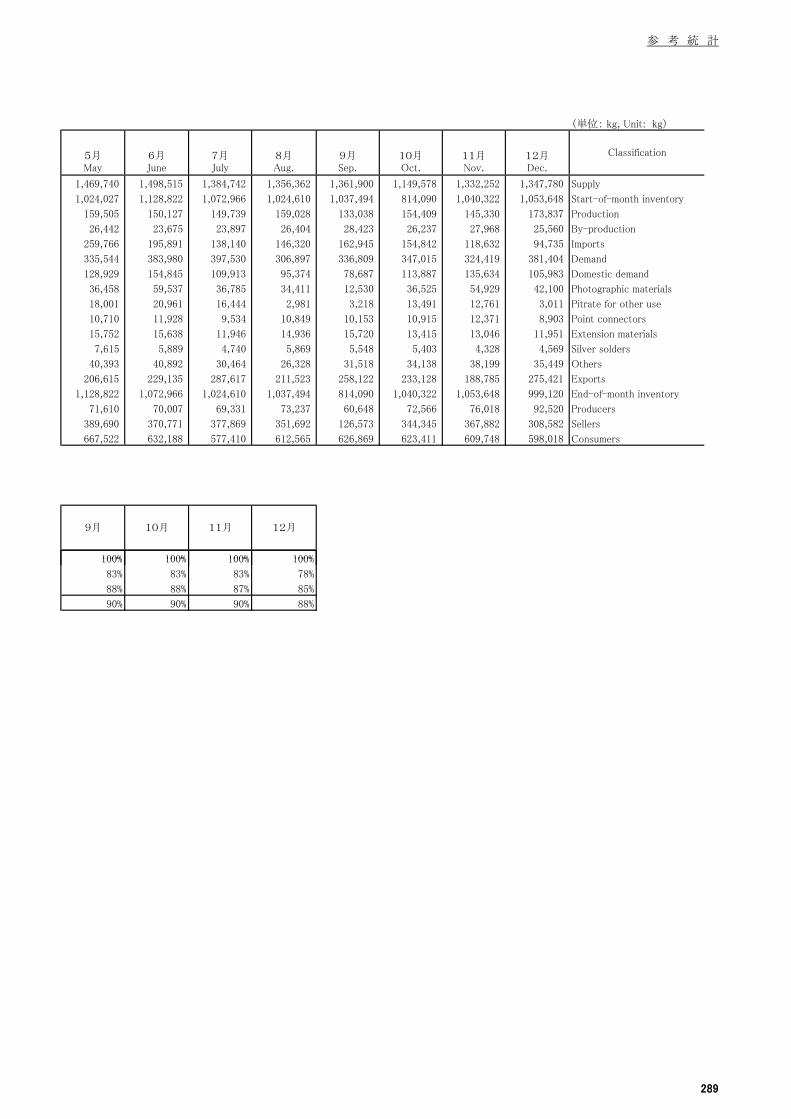
参 考 統 計
(単位: kg, Unit: kg)
1,469,740 1,498,515 1,384,742 1,356,362 1,361,900 1,149,578 1,332,252 1,347,780 Supply
1,024,027 1,128,822 1,072,966 1,024,610 1,037,494 814,090 1,040,322 1,053,648 Start-of-month inventory
159,505 150,127 149,739 159,028 133,038 154,409 145,330 173,837 Production
26,442 23,675 23,897 26,404 28,423 26,237 27,968 25,560 By-production
259,766 195,891 138,140 146,320 162,945 154,842 118,632 94,735 Imports
335,544 383,980 397,530 306,897 336,809 347,015 324,419 381,404 Demand
128,929 154,845 109,913 95,374 78,687 113,887 135,634 105,983 Domestic demand
36,458 59,537 36,785 34,411 12,530 36,525 54,929 42,100 Photographic materials
18,001 20,961 16,444 2,981 3,218 13,491 12,761 3,011 Pitrate for other use
10,710 11,928 9,534 10,849 10,153 10,915 12,371 8,903 Point connectors
15,752 15,638 11,946 14,936 15,720 13,415 13,046 11,951 Extension materials
7,615 5,889 4,740 5,869 5,548 5,403 4,328 4,569 Silver solders
40,393 40,892 30,464 26,328 31,518 34,138 38,199 35,449 Others
206,615 229,135 287,617 211,523 258,122 233,128 188,785 275,421 Exports
1,128,822 1,072,966 1,024,610 1,037,494 814,090 1,040,322 1,053,648 999,120 End-of-month inventory
71,610 70,007 69,331 73,237 60,648 72,566 76,018 92,520 Producers
389,690 370,771 377,869 351,692 126,573 344,345 367,882 308,582 Sellers
667,522 632,188 577,410 612,565 626,869 623,411 609,748 598,018 Consumers
100% 100% 100% 100%
Classification7月July
8月Aug.
9月Sep.
10月Oct.
5月May
11月 12月9月 10月
11月Nov.
12月Dec.
6月June
289
100% 100% 100% 100%
83% 83% 83% 78%
88% 88% 87% 85%
90% 90% 90% 88%
289

参 考 統 計
2.生産業者の品目別受払 Producers' receipts and shipments by commodity(1)総括 Summary (単位:t、すず以下はkg)(Units: t above Tin, kg - for Tin and below)
自社生産 委託生産 その他 国内販売 その他Productionquantity
電 気 銅 1,071,550 330,862 220,410 284,082 772,196 477,089 76,468Electrolyticcopper
銅 ケ ー ク 及び銅ビレット
103,598 96,574 - 78,935 103,246 18,841 20,827Copper cakeand billets
電 気 鉛 190,027 36,520 19,223 21,329 201,022 9,654 8,166Electrolyticlead
電 気 亜 鉛又 は蒸 留 亜 鉛
309,079 248,161 59,938 61,509 415,871 100,508 74,568Electrolyticzinc anddistilled zinc
す ず 947,449 - - - 933,456 2,008 62,537 Tin
ニ ッ ケ ル 41,291,000 - 5,860,623 - 33,175,971 10,886,000 2,927,385 Nickel
タングステン 3,403,653 - - 2,788,842 455,852 2,227 372,778 Tungsten
モ リ ブ デ ン 1,296,374 - - 510,967 617,736 39,376 395,055 Molybdenum
銀 1,489,340 444,910 - 153,761 1,605,910 184,393 92,520 Silver
Others
Classification受 入 Receipts 出 荷 Shipments
Consignment production
Others Consumption Domestic sales Ending stocks
年末在庫消 費区分
290
(2)出荷 Shipments
電気銅 電気鉛電気亜鉛又は蒸留亜鉛
ニッケル 銀
Electrolytic Electrolytic leadElectrolytic
zinc andDistilled zinc
Nickel Silver
(t) (t) (t) (kg) (kg) Year and Month1,391,722 191,515 553,106 36,894,746 1,959,413 FY 20091,374,660 212,682 542,947 42,744,165 1,944,189 FY 2010
平成21年 1,359,746 190,607 536,807 31,092,414 1,989,993 CY 20091,428,424 208,296 550,479 43,248,604 1,996,772 CY 20101,249,285 210,676 516,379 44,061,971 1,790,303 CY 2011
平成23年 1~3月 315,020 51,108 129,655 10,748,962 457,161 Ⅰ 20114~6月 273,347 45,855 114,969 10,070,127 423,760 Ⅱ7~9月 309,581 54,162 130,039 11,967,556 448,431 Ⅲ
10~12月 351,337 59,551 141,716 11,275,326 460,951 Ⅳ
平成23年 1月 94,045 18,157 42,629 3,327,070 162,882 Jan.-112 95,617 19,423 43,657 3,632,805 153,022 Feb.3 125,358 13,528 43,369 3,789,087 141,257 March4 85,018 15,215 38,598 2,903,201 114,653 April5 89,917 14,601 37,210 3,300,135 153,970 May6 98,412 16,039 39,161 3,866,791 155,137 June
7 101,274 16,542 40,863 4,076,204 151,906 July.8 101,231 17,555 42,874 4,175,367 149,010 Aug.9 107,076 20,065 46,302 3,715,985 147,515 Sep.
10 121,620 20,160 45,726 4,039,590 153,873 Oct.11 122,064 20,505 48,038 3,651,179 149,736 Nov.12 107,653 18,886 47,952 3,584,557 157,342 Dec.
資料出所:資源エネルギー庁 資源・燃料部 鉱物資源課Source Mineral and Natural Resources Division, Natural Resources and Fuel Department, Agency for Natural Resources and Energy
平成23年
区分
Classification
平成22年
平成21年度平成22年度
Source Mineral and Natural Resources Division, Natural Resources and Fuel Department, Agency for Natural Resources and Energy
290

291

参 考 統 計
3.販売業者の出荷 Shipments of sellers
区分 電気銅銅の故
又はくず銅合金の故又
はくず電気鉛 再生鉛
鉛の故又はくず
電気亜鉛又は蒸留亜鉛
再生亜鉛
ClassificationElectrolytic
copperCopper scrap
Copper alloyscrap
Electrolyticlead
Re-meltedlead
Lead scrapElectrolyticzinc and
distilled zinc
Re-meltedzinc
平成21年度 229,383 67,647 65,711 45,280 21,453 5,157 44,776 7,511
平成22年度 324,187 81,653 60,016 56,585 22,217 6,771 43,094 13,977
平成21年 220,425 58,172 69,841 41,659 21,585 4,616 41,910 5,830
平成22年 311,612 79,371 63,287 56,891 22,683 6,696 43,654 13,138
平成23年 318,450 75,948 65,006 55,242 13,913 4,532 46,603 17,725
平成23年 1~3月 66,104 20,971 13,787 14,173 5,165 1,363 10,414 3,252
4~6月 84,939 21,400 13,233 12,849 1,874 987 13,908 5,555
7~9月 83,694 17,770 22,146 14,560 3,767 851 10,922 4,582
10~12月 83,713 15,807 15,840 13,660 3,107 1,331 11,359 4,336
平成23年 1月 20,645 7,173 4,307 4,772 1,926 563 3,603 876
2 22,660 7,819 4,943 4,839 1,955 418 3,628 1,234
3 22,799 5,979 4,537 4,562 1,284 382 3,183 1,142
4 27,927 8,735 4,983 2,714 674 307 7,031 2,616
5 26,271 5,992 3,869 4,231 569 368 3,435 1,452
6 30,741 6,673 4,381 5,904 631 312 3,442 1,487
7 28,232 5,974 14,085 4,594 1,190 326 3,989 1,559
8 26,482 5,980 3,947 4,788 1,085 257 3,756 1,469
9 28,980 5,816 4,114 5,178 1,492 268 3,177 1,554
10 30,425 5,435 4,246 5,992 1,292 319 3,806 1,563
11 28,489 5,280 7,538 2,920 542 742 3,640 1,316
12 24,799 5,092 4,056 4,748 1,273 270 3,913 1,457
292
(単位:kg, Unit: kg)
区分ニッケル又はニッケル合金の故又はくず
コバルト タングステンタングステン
鉱モリブデン モリブデン鉱 銀
ClassificationNickel andNickel alloy
scrapCobalt Tungsten Tungsten or Molybudenum
Molybudenumor
Silver
平成21年度 28,904,186 4,450,038 115,868 - 16,178 2,003,210 2,067,785 FY 2009
平成22年度 35,843,302 4,898,922 338,740 - 8,655 3,493,930 1,729,504 FY 2010
平成21年 23,236,103 3,768,769 86,667 - 15,897 2,201,194 2,099,551 CY 2009
平成22年 33,680,195 4,850,689 312,166 - 8,754 3,447,679 1,798,635 CY 2010
平成23年 36,251,925 5,273,465 340,885 - 126,642 3,076,684 2,112,266 CY 2011
平成23年 1~3月 9,444,433 1,213,747 75,271 - 456 805,326 462,748 Ⅰ 2011
4~6月 8,528,986 1,128,635 77,627 - 28,714 723,805 575,183 Ⅱ
7~9月 9,422,902 1,540,897 85,941 - 48,659 683,171 602,799 Ⅲ
10~12月 8,855,604 1,390,186 102,046 - 48,813 864,382 471,536 Ⅳ
平成23年 1月 2,892,801 402,326 26,214 - 1 318,977 155,652 Jan.-11
2 2,898,497 417,765 29,279 - 352 271,382 112,993 Feb.
3 3,653,135 393,656 19,778 - 103 214,967 194,103 March
4 3,777,538 226,880 25,838 - 18,404 187,993 204,175 April
5 1,745,870 405,360 28,636 - 301 293,875 200,044 May
6 3,005,578 496,395 23,153 - 10,009 241,937 170,964 June
7 3,010,539 505,271 24,772 - 12,258 211,669 204,967 July
8 3,163,629 494,436 39,964 - 18,390 195,227 225,975 Aug.
9 3,248,734 541,190 21,205 - 18,011 276,275 171,857 Sep.
10 3,068,549 651,551 43,783 - 12,457 351,616 109,669 Oct.
11 2,982,626 358,085 31,539 - 6,355 228,050 182,968 Nov.
12 2,804,429 380,550 26,724 - 30,001 284,716 178,899 Dec.
資料出所:資源エネルギー庁 資源・燃料部 鉱物資源課
Source: Mineral and Natural Resources Division, Natural Resources and Fuel Department, Agency for Natural Resources and Energy
292

参 考 統 計
(単位:t、すず以下はkg)(Units: t above Tin, kg - for Tin and below)
亜鉛の故又はくず
すずすずの故又はくず
アンチモン 水銀 ニッケル
Zinc scrap Tin Tin scrap Antimony Mercury Nickel
10,524 1,650,657 2,914,758 1,605,428 232,246 39,702,338 FY 2009
13,149 2,520,300 3,477,671 2,441,097 111,361 55,716,918 FY 2010
8,866 1,877,449 2,277,368 1,420,540 252,395 31,206,676 CY 2009
12,497 2,388,369 3,354,538 2,517,611 139,643 56,663,205 CY 2010
19,393 2,373,889 3,398,307 2,240,126 104,256 58,278,683 CY 2011
3,513 556,996 887,586 529,982 4,834 12,188,688 Ⅰ 2011
3,325 583,033 862,253 780,547 44,671 12,701,472 Ⅱ
9,102 618,415 815,079 547,744 21,329 16,878,954 Ⅲ
3,453 615,445 833,389 381,853 33,422 16,509,569 Ⅳ
1,125 123,685 286,698 226,973 2,093 3,794,680 Jan.-11
1,256 229,202 338,841 137,749 1,246 4,171,058 Feb.
1,132 204,109 262,047 165,260 1,495 4,222,950 March
982 215,510 273,722 264,509 11,407 3,929,739 April
1,085 155,327 238,595 209,707 4,033 3,752,731 May
1,258 212,196 349,936 306,331 29,231 5,019,002 June
6,453 183,536 248,948 153,187 10,203 5,881,798 July
1,338 204,399 227,786 193,258 10,721 6,075,019 Aug.
1,311 230,480 338,345 201,299 405 4,922,137 Sep.
1,269 164,325 238,293 154,741 12,265 5,654,413 Oct.
1,216 228,731 346,566 175,858 14,846 5,495,658 Nov.
968 222,389 248,530 51,254 6,311 5,359,498 Dec.
293293

参 考 統 計
4.消費者品目別受払 Consumers' receipts and shipments(単位:t、すず以下はkg)(Units: t above Tin, kg - for Tin and below)
自家発生 受入 消費 出荷
自家生産
In-house Receipts Consumption Shipments
By-production
電 気 銅 2,204 15,223 1,058,646 4,815 Electrolytic copper
銅 の 故 又 は く ず 250,332 29,848 525,425 27,422 Copper scrap
銅 合 金 の 故 又 は く ず 192,972 66,534 816,975 21,010 Copper alloy scrap
電 気 鉛 - 195,057 192,023 19,136 Electrolytic lead
再 生 鉛 37,510 46,291 54,629 28,539 Re-melted lead
鉛 の 故 又 は く ず 12,755 31,402 153,962 20,564 Lead scrap
電気亜鉛又は蒸留亜鉛 - 304,398 351,867 5,280 Electrolytic zinc and distilled zinc
再 生 亜 鉛 34,820 21,434 30,341 30,554 Re-melted zinc
亜 鉛 の 故 又 は く ず 42,697 59,994 55,207 46,336 Zinc scrap
す ず 207,827 7,560,769 6,612,666 1,043,119 Tin
す ず の 故 又 は く ず 1,122,881 115,981 965,858 382,888 Tin scrap
ア ン チ モ ン - 618,029 640,815 - Antimony
水 銀 - 15,166 6,649 - Mercury
ニ ッ ケ ル - 46,914,557 46,444,617 258,405 Nickel
ニッケル又はニッケル合
Classification区 分
294
ニッケル又はニッケル合金 の 故 又 は く ず
273,224,201 742,418,964 968,939,344 41,591,534 Nickel scrap and nickel alloy scraps
コ バ ル ト - 2,248,016 2,170,417 36,722 Cobalt
タ ン グ ス テ ン - 4,590,937 5,502,827 192,962 Tungsten
タ ン グ ス テ ン 鉱 - #VALUE! 402,511 - Tungsten ore
モ リ ブ デ ン - 3,741,158 4,276,071 - Molybdenum
モ リ ブ デ ン 鉱 - 15,125,607 10,648,631 - Molybdenum ore
銀 325,373 2,172,040 1,737,564 851,137 Silver
資料出所:資源エネルギー庁 資源・燃料部 鉱物資源課
Source: Mineral and Natural Resources Division, Natural Resources and Fuel Department, Agency for Natural Resources and Energy
294

参 考 統 計
5 金属加工統計 Metal processing statistics (1) 金属熱処理加工 Metal heat-treatment
製品加工別生産 Production by kind of process
平成19年 (2007) 20 (2008) 21 (2009) 22 (2010) 23 (2011)
平成21年度(FY09) 22 (FY10)
平成23年1月(Jan)2 (Feb)3 (Mar)4 (Apr)5 (May)6 (Jun)
7 (Jul)8 (Aug)9 (Sep)
10 (Oct)11 (Nov)12 (Dec)
製品用用途別加工金額 Applications of products (単位:百万円、Unit:million yen)
合計 一般機械用 電気機械用 輸送機械用 精密機械用 金属製品用
Total General machinery Electric machinery Transport equipment Precision machinery Metal products
平成19年 (2007) 20 (2008) 21 (2009) 22 (2010) 23 (2011)
平成21年度(FY09) 22 (FY10)
平成23年1月(Jan)2 (Feb)3 (Mar)
9,4416,2687,830
58,039 2,343 15,613
9,450
1,008
6,437
816 4,725
年 月Year and Month
年 月Year and Month
393449451
8,522
6,7197,936
594693701
5,9893,4344,8445,287
3,8124,997
4,0463,804
55,03753,27131,85744,23146,254
36,15345,050
3,544
2,238
176193203
2,8443,0451,6422,1872,304
1,800
2,813
29,21233,187
22,26130,737
2,4372,7518,132
7,973
88,30595,554
70,74690,959
7,145
108,965108,88964,063
35,19637,14320,862
64,681 2,604
1,437,241
120,582137,454133,509
902 4,84016,613 968 5,627 989
6,0811,045 6,275
18,083 1,07115,907 2,248
885 4,932 1,034809 62,244 2,534 17,047 2,402
6,296 902 4,946 1,038861 62,300 2,530 17,207 2,437 17,677
60,819 2,469 17,015 2,415 17,545 1,03215,292 890 5,436 771 4,365 901
970 6,153 830 4,904 986822 49,640 2,016 14,335 2,061816 57,420 2,331 15,854 2,279 17,043
736 4,487 93114,541
8406,062
822 5,211742
2,250 17,019 96213,620
4,441 940649 3,7674,962 781
938 9744,6885,283 821
663 47,612 1,926 11,947 1,701723 50,391 2,078 14,482 2,096
16,54456,390 2,302 15,198 2,173795 56,609 2,372 15,488 931
744 3,975 8241,979 14,643
47,98010,741 67,423 9,710
853 4,4056,416853 6,169
180,957
2,224 16,765 955
9,749 54,475 11,336
635,591 26,133 178,066 25,446 10,2456,214 449,394 19,714 139,352 8,415
69,971
20,004 132,018 8,224
45,878
8,175 38,11757,468
65,166 9,584 9,8739,425 675,238 27,532 184,325 26,265 195,385 11,248
53,364 7,460 33,917 7,685607,666 25,312 173,766 24,911 171,500 10,395
86,285 52,704 11,5305,725 411,210 17,856 124,243 17,837 121,425 7,500
244,145 14,507 90,880 12,881780,896 31,497 205,589 29,157 235,601 13,683
780
10,746765,449 30,549 208,571 29,125
717 49,094 2,028 14,232
38,74839,28837,77536,796
10,790
8,229
8,684
765
807
867
35,40633,09830,19437,582
37,40335,140
8,7258,406
511,360503,395252,833373,265431,668
271,263400,348
37,7708,132
8,2117,4608,7228,792
6,462
144,349
108,965108,88964,06388,30595,554
70,74690,959
8,141
7,145
11,11312,276
重量
(t)
122,210
1,873,5181,864,470
7,9737,385
32,468
(t)
重量
Vacuum heat treating/Sulfurizing, etc
金額(百万円)
(million yen)
金額(百万円)
(t)
53,113
Normalizing andAnnealing
Quenching andTempering
(million yen)(t)金額(百万円)
(million yen)
重量
(t)
金額(百万円)
(million yen)
窒化、軟窒化
Carburizing Quenching andTempering
Induction hardening andTempering
Nitriding andNitrocarburizing
真空熱処理・浸硫等焼入、焼戻し
重量
焼ならし、焼なまし 焼入、焼戻し 浸炭焼入、焼戻し
重量
合計
Total
高周波焼入、焼戻し
(t)
金額(百万円)
(million yen)
金額(百万円)
(million yen)
重量 重量
138,777124,208145,369147,678146,069
112,102
(t)金額(百万円)
(million yen)
138,756
996,992
1,611,062
1,087,6121,510,364
295
3 (Mar)4 (Apr)5 (May)6 (Jun)
7 (Jul)8 (Aug)9 (Sep)
10 (Oct)11 (Nov)12 (Dec)
原材料(燃料消費量) Raw materials (fuels、power)
焼入油 重油 灯油 都市ガス LPガス 電力 月末従業員数 月間労働延人数
Quench oil Heavy oil Kerosene City gas LPG Electricity (人) (千人)
金額 金額 金額 金額 金額 金額
(million yen) (million yen) (million yen) (million yen) (million yen) (million yen)
平成19年 (2007) 20 (2008) 21 (2009) 22 (2010) 23 (2011)
平成21年度(FY09) 22 (FY10)
平成23年1月(Jan)2 (Feb)3 (Mar)4 (Apr)5 (May)6 (Jun)
7 (Jul)8 (Aug)9 (Sep)
10 (Oct)11 (Nov)12 (Dec)
資料出所:製造産業局 素形材産業室Source: Machine Parts and Tooling Industries Office, Manufacturing Industries Bureau
年 月Year and Month
46,196166 11 174 111,383
6617,883 613 1,289 10667546,978671
67 157 10 190 12 8,245 613 1138,600 637 1,3778,483 47,148600 1,353 119
117 47,499159 10 197 12 718
69 168 11 172 10
7,715 533 1,265 108 42,970 613539 1,421 122 46,331 634
66 159 11 150 9
1,297 128 44,199 589
61 169 12 164 10 8,056
158 12 171 11 7,473 4896,928 443 1,082 101 36,868 526
468 1,253 113 41,553 55548 144 11 148 10
1,332 118 45,295 58757 175 14 160 11 7,304
194 14 179 12 7,867 4877,737 467 1,354 131 45,746 589
442 1,193 113 42,120 55560 184 12 180 11
16,476 1,386 515,027 6,971
59 172 11 159 9 7,216
1,999 118 2,100 114 87,356 5,40460,329 3,309 17,107 1,270 430,363 6,006
6,331 15,598 1,387 532,905 7,373
547 604 29 3,776 175
17,534 1,447 504,850 6,802782 2,005 138 2,042 127 93,508
1,625 92 2,346 122 81,826 4,98256,242 3,344 15,902 1,061 406,173 6,067
5,496 24,721 2,623 571,148 8,030478 651 29 3,931 180
28,000 2,403 563,426 7,559899 1,792 149 8,283 658 88,396
2,658 155 12,342 780 85,996 4,500
311423
802
750
775
74
60
73
89
243
315359324
3,875
296
4,4844,4912,4613,7983,810
2,851
125124126120
294367273
309
295
117107122
122112
5,857
1,2461,3221,417
1,2431,349
105
117120
5,7865,7925,859
6,2775,864
5,6235,6605,6775,7515,7615,751
103kWh
5,3255,6035,857
5,3105,677
772783772753
5,6915,753
1,4881,445
453479
729
718675
451
703628
451 701431355
481
411476
3,608
4,333
456
4,3424,3174,258
3,8043,2932,8563,840
4,013
205195
196
192183201
206
203189167
2,9402,9792,9512,746
2,8132,7702,4572,926
2,8322,584
7,4608,722
8,7928,7258,406
7,9737,3856,4628,141
8,211
Number of regularemployees
Total number of
employees (103n)
労務 Labor
kl kl kl 103m3 t
295

参 考 統 計
(2) 金属プレス加工Metal stamping
製品用途別販売額内訳 Value by use (単位:百万円、 Unit: million yen)
合計 自動車用 家具・建築用 その他用
平成19年 (2007) 20 (2008) 21 (2009) 22 (2010) 23 (2011)
平成21年度(FY09) 22 (FY10)
平成23年1月(Jan)2 (Feb)3 (Mar)4 (Apr)5 (May)6 (Jun)
7 (Jul)8 (Aug)9 (Sep)
10 (Oct)11 (Nov)12 (Dec)
原材料 Raw materials合計 普通鋼熱間圧延鋼材 普通鋼冷間圧延鋼材Total Hot-rolled steel Cold-rolled steel
消費量(t) 金額(百万円) 消費量(t) 金額(百万円) 消費量(t) 金額(百万円)Consumption (million yen) Consumption (million yen) Consumption (million yen)
平成19年 (2007) 20 (2008) 21 (2009) 22 (2010) 23 (2011)
平成21年度(FY09)22 (FY10)
年 月Year and Month
年 月Year and Month
19,11010,48449,323
30,44612,39013,08153,448
41,3145,14010,836 31,086
32,154 8,45150,236 583,732 7,804 31,922
82,867
81,46960,72988,33461,020
71,145
786,948550,832790,518529,258
635,194759,10264,425
53,70640,01162,64863,441
45,967
635,700433,013697,172638,416
504,948705,739273,399
276,301197,844277,076252,294
226,9621,892,656
3,001,561 384,453 802,206
2,274,735
2,407,7321,639,6812,317,1661,944,779
62,897 1,035,396
3973,528 767
106,057
74,393306 3,050 2,699
3,017 364 2,515396853 3,084
7543,164 853 329 3,599 2,69975,534
3,180
3,280 830 326 3,357 69,581 928
3,3743,681 963 342 2,864 74,438 948 2,862 392 2,656
523 3,0122,821 883 323 3,388 66,181 831 2,619 365
2,855 583 2,831
3,063 890 380 3,846 71,911 937 2,762
3,602 931 525 4,670 69,575 1,065
3,2902,633 872 397 3,482 63,095 1,110 2,259 530 2,740
598 3,9702,702 856 277 3,436 54,858 720 2,328 557
2,742 599 3,4542,675 1,003 244 2,914 57,961 643 2,3312,780 808 255 3,265 73,983 7752,777 751 244 3,325 71,835 751 2,543 526 2,165
7,128 40,12731,788 12,198 35,782
34,866 11,304 3,707 50,874 933,995 9,177 31,76130,744 10,865 4,286 53,111 665,866 7,893
55,295 915,627 8,3493,84011,625
87,324
89,074
80,78589,14684,19890,511
33,10266,032
1,112,339999,734
852,533
897,751 8,963 36,196
35,684
1,142,5281,141,846
763,685
79,033 877,457 12,152
Furniture/construction
Others
9,765 52,10211,497 42,48812,483
Agriculturalmachinery and
equipment
Officemachinery and
equipment
Electricappliances/
communicationsequipment
AutomobilesPrecisionmachinery
Heatingequipment
35,40536,706 10,407 3,948 41,196 823,345 10,315 32,582 5,830
1,122,939
84,91788,66172,33969,02477,11886,637
精密機器用厨暖房機器用
産業機械器具用
農業用機械器具用
事務用機械器具用
電気機器・通信機器用
TotalIndustrial
machinery andtools
296
22 (FY10)
平成23年1月(Jan)2 (Feb)3 (Mar)4 (Apr)5 (May)6 (Jun)
7 (Jul)8 (Aug)9 (Sep)
10 (Oct)11 (Nov)12 (Dec)
原材料 Raw materials 労務 Labor
その他Stainless Non-ferrous metal Others
消費量(t) 金額(百万円) 消費量(t) 金額(百万円) 消費量(t) 金額(百万円)Consumption (million yen) Consumption (million yen) Consumption (million yen)
平成19年 (2007) 20 (2008) 21 (2009) 22 (2010) 23 (2011)
平成21年度(FY09) 22 (FY10)
平成23年1月(Jan)2 (Feb)3 (Mar)4 (Apr)5 (May)6 (Jun)
7 (Jul)8 (Aug)9 (Sep)
10 (Oct)11 (Nov)12 (Dec)
資料出所: 製造産業局 素形材産業室
Source: Machine Parts and Tooling Industries Office, Manufacturing Industries Bureau
年 月Year and Month
599524595581597
28,304 67528,19428,040
28,899
7,2277,548
566
627
28,51028,355
26,20229,53329,39929,526
32,952
576535
26,202
30,11129,875 611
553
33,263 9,24832,27130,965
7,5206,872
98,277
1,871 2,272 1,391 60,674 8,341
19,759 21,398 16,834 699,415
72,060 65,779 45,162 915,079
1,560 2,062 1,354 59,544
1,451 1,594
9,0962,065 1,863 1,530 67,204 8,9042,014 1,963 1,548 71,153
1,410 59,220
7,4462,050 1,547 1,497 67,795 11,098
1,289 1,420 1,150 37,363
7,338
1,665 1,901 1,573 63,656 7,879
1,637 2,337 1,565 62,757
4,5181,029 1,071 991 42,495 5,343
1,478 57,202
1,347 50,352 6,138
723,41227,383
87,28878,956
7,3431,875
20,421 742,45030,989
18,685 891,07120,572 15,065 600,18938,057
6,130
13,22418,977
3,050
1,514
1,614
4,2485,185
3,444
5,846
183,101
6,80325,1485,238
20,99411,95917,987
5,704
55,95635,07556,03756,292
39,99858,811
6,040
4,700
3,7164,880
5,2794,8835,7205,858
82,867
7,3975,2423,4903,471
42,562
46,17142,19749,34550,04549,974
759,102
63,460
3,8215,130
5,678
46,86131,94629,51032,197
5,3416,0636,124
64,425
5,0415,4514,3303,630
52,601
58,16954,40461,04161,58462,068
705,739
52,036
14,90020,209
22,074
55,57746,16737,46839,023
273,399
22,87321,69116,81914,058
187,239
20,58426,42824,640
159,900
134,350109,205117,836
171,918 22,870 58,278 6,029 44,990
172,396
174,509162,455184,913190,785
2,274,735
179,273
Total number ofemployees
(103n)
月末常用従業者数(人)
月間実働延人員(千人)
Number of regularemployees
3,923
4,612
7,7961,493
17,670 685,13327,671 19,842
4,8644,392
101,44770,080
91,24031,01028,304
7,7417,040
87,686
ステンレス鋼板 非鉄金属板
296

Ⅵ. 調査票の改正及び品目別接続係数について
1. 調査票の改正について
平成23年1月分から次のとおり調査票(月報)を改正しました。
【全月報共通】
改 正 前 改 正 後 摘 要
月末常用従業者数 月末従事者数 名称変更
月末従業者数
月間実働延人員 削除
【鉄鋼月報 (その9) 労務・設備】
【鉄構物及び架線金物月報】改 正 前 改 正 後 摘 要
橋りょう
生産内訳
2000t未満
2000t以上
進ちょく量
2000t以上の製品の進ちょく量の合計
【空気動工具、作業工具、のこ刃及び機械刃物月報】
3. 労務
区 分
【空気動工具、作業工具、のこ刃、機械刃物及び自動車用機械工具月報】は 【空気動工具、作業工具、のこ刃及び機械刃物月報】に名称変更
区 分
【鉄鋼月報 (その9) 従業者・設備】は 【鉄鋼月報 (その9) 労務・設備】に名称変更
全表削除1-2.生産内訳及び月間進ちょく量
297
改 正 前 改 正 後 摘 要
自動車用機械工具
洗浄機器
公害測定機器
一酸化炭素・窒素化合物・炭化水素・電波
雑音測定器・スモークメーター・騒音計等
空気動工具、作業工具、のこ刃、機械刃物 空気動工具、作業工具、のこ刃及び
及び自動車用機械工具部門 機械刃物部門
【ガス機器、石油機器及び太陽熱温水器月報】改 正 前 改 正 後 摘 要
ガスオーブン(対流ファン付を含む) 削除
ガスレンジ 削除(二口以上のこんろとオーブンを組み合わせたもの)
ガス炊飯器(10ℓ以下のもの) 削除
【可鍛鋳鉄及び精密鋳造品月報】
区 分 改 正 前 改 正 後 摘 要
4. 生産能力 可鍛鋳鉄(焼鈍炉の能力) 削除
1. 製品
3. 労務
1. 製品
名称変更
統合(機械器具統計「機械器具月報(その46)計測機器」の「環境計測機」に含めて調査)
移設(機械器具統計「機械器具月報(その19)業務用サービス機器」に移設し、「自動車用洗浄機器」として調査)
区 分
区 分
297

【非鉄金属製品月報(伸銅製品)】区 分 改 正 前 改 正 後 摘 要
電力
灯油
重油 全表削除
液化石油ガス
都市ガス
【非鉄金属製品月報(アルミニウム圧延製品)】区 分 改 正 前 改 正 後 摘 要
電力
灯油
重油
液化石油ガス
液化天然ガス
都市ガス
【非鉄金属製品(電線・ケーブル)、光ファイバ製品月報】区 分 改 正 前 改 正 後 摘 要
電力
灯油
重油 全表削除
液化石油ガス
都市ガス
全表削除
2-2.電力・燃料
2-2.電力・燃料
2-2.電力・燃料
298298

299299
2.品目別接続係数について
対象事業所の見直し等に伴い、当年と前年の数値をそのまま比較できない品目があります。
下記の品目について、前年同月比を求める場合は、接続係数を前年の数値に乗じて計算してください。
また、複数月で接続係数がある品目については、その月の係数とその月以前の係数とを掛け合わせて計算してください。
平成21年12月以前の数値を使用して前年同月比を求める場合は、下記の係数を前の数値に乗じて計算してください。
調査票番号 調査票・品目名称 生産 出荷 在庫
2520 鍛工品月報 数量 重量 金額 数量 重量 金額 重量
* 2520 鍛工品 計 0.993 1.002
* 2520 鉄系 計 0.993 1.001
* 2520 熱間鍛造品 計 0.993 1.002
* 2520 型鍛造品 計 0.995 1.005
* 2520 産業機械・土木建設機械用 0.997 1.012
* 2520 自動車用 0.995 1.005
2520 自由鍛造品 計 0.951 0.970
2520 その他用の自由鍛造品 0.721 0.850
2520 アルミニウム系 熱間鍛造品 その他用の熱間鍛造品 0.955
2520 アルミニウム系 冷間鍛造品 その他用の冷間鍛造品 1.589 1.264
*は、平成24年4月分にて平成24年2月分以前について過去修正を行ったため、平成21年に遡及して接続係数を付け替えています。
平成22年12月以前の数値を使用して前年同月比を求める場合は、下記の係数を前の数値に乗じて計算してください。
調査票番号 調査票・品目名称 生産 出荷 在庫
1070 鉄鋼月報(その7) 磨棒鋼・線類・鋳鉄管・鉄鋼加工製品 数量 重量 金額 数量 重量 金額 重量
1070 溶接棒心線 0.781 0.417
1070 ステンレス鋼線 1.122 1.143 1.165
1070 金網 計 0.961
1070 溶接金網 0.944
1070 一般缶 0.990 0.992 0.992
2210 鉄構物及び架線金物月報 数量 重量 金額 数量 重量 金額 数量
2210 鉄骨 0.995
2210 軽量鉄骨 0.977
2210 水門(水門巻上機を含む) 0.968
2220 ばね月報 数量 重量 金額 数量 重量 金額 重量
2220 線ばね 計 1.009 1.008 1.044
2220 自動車用(シート用ばねを除く) 1.007 1.006 1.034
2220 その他の線ばね(機械用・シート用ばねを含む) 1.011 1.009 1.086
2220 うす板ばね 1.016 1.015 1.021
2250 弁及び管継手月報 数量 重量 金額 数量 重量 金額 重量
2250 バルブ及びコック 計 1.009 0.998 1.006
2250 一般用バルブ及びコック 計 1.040 0.999 1.022
2250 鋳鋼・鍛鋼製(自動調整弁・高温高圧弁を除く) 0.962
2250 青銅・黄銅製(自動調整弁・高温高圧弁を除く) 1.067 0.997 1.162
2250 高温高圧弁 0.910 0.996 0.997
2250 自動調整弁 0.996
2270 ガス機器、石油機器及び太陽熱温水器月報 数量 重量 金額 数量 重量 金額 数量
2270 ガスこんろ 0.981 0.966 0.999
2270 ガス温風暖房機(暖房方式が強制対流のもの) 0.722

300300
平成22年12月以前の数値を使用して前年同月比を求める場合は、下記の係数を前の数値に乗じて計算してください。
調査票番号 調査票・品目名称 生産 出荷 在庫
2510 粉末や金製品月報(超硬チップを除く) 数量 重量 金額 数量 重量 金額 重量
2510 粉末や金製品 計 1.007 1.040
2510 磁性材料 計 1.025 1.092
2510 磁性材料(硬質) 1.033 1.135
2530 銑鉄鋳物月報 数量 重量 金額 数量 重量 金額 重量
2530 銑鉄鋳物 計 0.999 0.950
2530 銑鉄鋳物(球状黒鉛鋳鉄を除く) 0.982
2530 球状黒鉛鋳鉄 0.904
2550 非鉄金属鋳物月報 数量 重量 金額 数量 重量 金額 重量
2550 アルミニウム鋳物 計 1.030 1.033
2550 輸送機械用 計 1.031 1.036
2550 自動車用 1.032 1.038
2560 ダイカスト月報 数量 重量 金額 数量 重量 金額 重量
2560 ダイカスト 計 1.017
2560 アルミニウム 計 1.017
2560 一般機械用 0.962 0.965
2560 自動車用 1.023
9080 非鉄金属製品(電線・ケーブル)、光ファイバ製品月報 数量 重量 金額 数量 重量 金額 重量
9080 機器用電線 1.004 1.004 1.007
9080 通信用電線・ケーブル 1.002 1.002 1.001
9080 電力用電線・ケーブル 1.001
9080 非鉄金属製品(電線・ケーブル)、光ファイバ製品月報 生産能力 生産実績
9080 銅絶縁電線 1.003

Ⅵ. Revision of questionnaires and Continuity Coefficients by Commodity
1. Revision of questionnaires
The following revisions to the questionnaire were made from January 2011.
【All questionnaires 】Former item New item Notes
3. Labor Number of employees at the end of month
Monthly total number of employees
Number of persons engaged at the end of month
Name change
Delete
【Iron and steel (No. 9) Labor and production equipment】 【Iron and steel (No. 9) Employees and production equipment】
→ 【Iron and steel (No. 9) Labor and production equipment】 Name change
【Steel structures and transmission line hardware】Former item New item Notes
1-2. Production breakdown and amount of progress per month
Steel bridges Production breakdown Less than 2,000t 2,000t and over Amount of progress in products exceeding 2,000t
Delete
【Pneumatic tools, machinist hand tools, saw blades and knives for machines】 【Pneumatic tools, machinist hand tools, saw blades, knives for machines, and machine tools for automobiles】
→ 【Pneumatic tools, machinist hand tools, saw blades and knives for machines】 Name change
Former item New item NotesMachine tools for automobiles Cleaning equipment
Transfer(Machinery andequipmentStatistics(No.19) Business
i
301
1. Products Pollution measuring machines and instruments
serviceequipment:Cleaningequipment forautomobiles)
Combine(Machinery andequipmentStatistics(No.46) Measuringequipment andinstruments:Monitoringinstruments forenvironomentaleqality)
3. LoborPneumatic tools, machinist hand tools, sawblades, knives for machines, and machine toolsfor automobiles
Pneumatic tools, machinist hand tools, sawblades and knives for machines
Name change
【Gas and oil equipment for cooking, boiling and heating, and solar water heaters】Former item New item Notes
1. Products
Gas ovensGas ranges with ovensGas rice cookers (10ℓ or less)
Delete
【Malleable iron castings and precision castings】Former item New item Notes
4. Production capacity Malleable iron castings Delete
301

【Non-ferrous metal products (Elongated copper products)】Former item New item Notes
2-2. Electricity and Fuel
ElectricityKeroseneHeavy fuel oilLiquefied petroleum gasCity gas
Delete
【Non-ferrous metal products (Aluminum mill products)】Former item New item Notes
2-2. Electricity and Fuel
ElectricityKeroseneHeavy fuel oilLiquefied petroleum gasLiquefied natural gasCity gas
Delete
【Non-ferrous metal products (Electric wires / cables),and optical fiber products】Former item New item Notes
2-2. Electricity and Fuel
ElectricityKeroseneHeavy fuel oilLiquefied petroleum gasCity gas
Delete
302302

303303
2 . Continuity Coefficients by Commodity
Because of review of the scopes ,there is discontinuity for some consecutive data of the commodity.
Please use to calculate the following continuity coefficients ,when you compare with the same month of the last year.
For using before January,2010(include January)
Commodity name Production Shipments Inventory
2520 Forgings from billets and bars Quantity Weight Value Quantity Weight Value Weight
* 2520 Forgings from billets and bars 0.993 1.002
* 2520 Ferrous forgings 0.993 1.001
* 2520 Hot forgings 0.993 1.002
* 2520 Closed die forgings 0.995 1.005
* 2520 For industrial machinery/engineering and construction machinery 0.997 1.012
* 2520 For automobiles 0.995 1.005
2520 Open die forgings 0.951 0.970
2520 For others 0.721 0.850
2520 Aluminum forgings/Hot forgings/For others 0.955
2520 Cold forgings/For others 1.589 1.264
For using before January,2011(include January)
Commodity name Production Shipments Inventory
1070 Iron and steel (No.7) Quantity Weight Value Quantity Weight Value Weight
1070 Core wires for welding rods 0.781 0.417
1070 Stainless steel wires 1.122 1.143 1.165
1070 Wire netting 0.961
1070 Welded wire netting 0.944
1070 General cans 0.990 0.992 0.992
2210 Steel structures and transmission line hardware Quantity Weight Value Quantity Weight Value Weight
2210 Structural steel frames 0.995
2210 Light structural steel frames 0.977
2210 Water gates (including water gate winches) 0.968
2220 Springs Quantity Weight Value Quantity Weight Value Weight
2220 Wire springs 1.009 1.008 1.044
2220 For automobiles (excluding seat springs) 1.007 1.006 1.034
2220 Other wire springs (Including for machinery / seat springs) 1.011 1.009 1.086
2220 Flat springs 1.016 1.015 1.021
2250 Valves and pipe fittings Quantity Weight Value Quantity Weight Value Weight
2250 Valves and cocks 1.009 0.998 1.006
2250 General valves and cocks 1.040 0.999 1.022
2250 Made of cast steel/forged steel (excluding control valves/high-temperature, high-pressure valves)
0.962
2250 Made of bronze/brass (excluding control valves) 1.067 0.997 1.162
2250 High-temperature, high-pressure valves 0.910 0.996 0.997
2250 Control valves 0.996
2270Gas and oil equipment for cooking, boiling and heating,and solar water heaters
Quantity Weight Value Quantity Weight Value Weight
2270 Gas cooking appliances 0.981 0.966 0.999
2270 Gas heaters with circulating fan 0.722

304304
9080 Production capacity
For using before January,2011(include January)
Commodity name Production Shipments Inventory
2510 Sintered products (excluding cemented carbide tips) Quantity Weight Value Quantity Weight Value Weight
2510 Sintered products 1.007 1.040
2510 Magnetic materials 1.025 1.092
2510 Hard magnetic materials 1.033 1.135
2530 Iron castings Quantity Weight Value Quantity Weight Value Weight
2530 Iron castings 0.999 0.950
2530 Iron castings (excluding ductile iron castings) 0.982
2530 Ductile iron castings 0.904
2550 Non-ferrous metal castings Quantity Weight Value Quantity Weight Value Weight
2550 Aluminum alloy castings 1.030 1.033
2550 For transport equipment 1.031 1.036
2550 For automobiles 1.032 1.038
2560 Die castings Quantity Weight Value Quantity Weight Value Weight
2560 Die castings 1.017
2560 Aluminum alloy die castings 1.017
2560 For general machinery 0.962 0.965
2560 For automobiles 1.023
9080Non-ferrous metal products (Electric wires/cables)、and Optical fiberproducts
Quantity Weight Value Quantity Weight Value Weight
9080 Appliance wires 1.004 1.004 1.007
9080 Telecommunication wires/cables 1.002 1.002 1.001
9080 Power wires/cables 1.001
9080Non-ferrous metal products (Electric wires/cables)、and Optical fiberp pproducts
Production capacity Production resultsProduction results
9080 Copper insulated wires 1.003

一部事業所で誤報告があったため、以下のとおり過去に遡及し修正しました。
1..製品
(7)鍛工品 (※年報の193ページ~194ページ)
品目名
年 月 修正前 修正後 修正前 修正後 修正前 修正後 修正前 修正後 修正前 修正後 修正前 修正後
平成22年 (2010) 2,131,044 2,129,863 553,349 555,396 2,087,647 2,086,466 511,009 513,056 1,992,901 1,991,720 487,446 489,492
平成21年度 (09FY) 1,701,849 1,700,071 461,334 461,868 1,666,549 1,664,771 425,720 426,254 1,579,079 1,577,301 404,524 405,058
平成22年1~3月(Q1) 506,615 504,837 133,240 133,774 496,289 494,511 123,481 124,015 473,628 471,850 117,944 118,478
4~6月(Q2) 520,702 520,337 134,044 134,338 509,559 509,194 123,461 123,756 485,919 485,554 117,620 117,914
7~9月(Q3) 541,114 541,576 139,374 139,992 530,119 530,581 128,564 129,182 506,021 506,483 122,572 123,190
10~12月(Q4) 562,613 563,113 146,692 147,292 551,680 552,180 135,503 136,103 527,333 527,833 129,310 129,910
平成22年1月 (Jan) 154,849 153,796 40,491 40,740 151,563 150,510 37,390 37,639 144,442 143,389 35,656 35,905
2 (Feb) 170,104 169,273 44,554 44,733 166,753 165,922 41,381 41,560 159,215 158,384 39,571 39,750
3 (Mar) 181,662 181,768 48,195 48,301 177,973 178,079 44,709 44,815 169,971 170,077 42,718 42,824
4 (Apr) 172,498 173,131 44,463 44,685 168,604 169,237 40,846 41,068 160,758 161,391 38,940 39,161
5 (May) 159,388 158,085 41,177 41,089 156,046 154,743 37,910 37,821 148,693 147,390 36,118 36,029
6 (Jun) 188,816 189,121 48,404 48,565 184,909 185,214 44,705 44,866 176,468 176,773 42,562 42,723
7 (Jul) 192,349 192,871 49,425 49,616 188,428 188,950 45,631 45,822 179,836 180,358 43,475 43,666
8 (Aug) 159 026 159 334 41 025 41 421 155 579 155 887 37 641 38 037 148 685 148 993 35 976 36 372
金額(百万円)
<金属製品編>
製品欄の項目のうち「生産(重量、金額)」
鍛工品(1~15) 鉄系(1~11) 熱間鍛造品(1~9)
重量(t) 金額(百万円) 重量(t) 金額(百万円) 重量(t)
Ⅶ.公表値の修正について Revision
<修 正 し た 品 目>
品目名及び項目名 修 正 期 間
鍛工品 製品欄 平成22年1月~平成22年12月
305
8 (Aug) 159,026 159,334 41,025 41,421 155,579 155,887 37,641 38,037 148,685 148,993 35,976 36,372
9 (Sep) 189,739 189,371 48,925 48,956 186,112 185,744 45,292 45,323 177,500 177,132 43,121 43,152
10 (Oct) 187,036 186,448 48,449 48,535 183,360 182,772 44,716 44,802 175,427 174,839 42,710 42,797
11 (Nov) 194,682 194,805 50,703 50,897 190,997 191,120 46,879 47,074 182,676 182,799 44,767 44,962
12 (Dec) 180,895 181,860 47,541 47,859 177,323 178,288 43,909 44,227 169,230 170,195 41,832 42,151
品目名
年 月 修正前 修正後 修正前 修正後 修正前 修正後 修正前 修正後 修正前 修正後 修正前 修正後
平成22年 (2010) 1,660,030 1,658,849 419,599 421,645 253,532 253,634 66,983 67,663 1,309,291 1,308,008 320,576 321,943
平成21年度 (09FY) 1,321,359 1,319,581 347,078 347,612 151,228 151,075 43,546 43,698 1,091,209 1,089,584 274,859 275,241
平成22年1~3月(Q1) 395,704 393,926 101,865 102,399 51,031 50,878 14,011 14,164 322,786 321,161 79,911 80,292
4~6月(Q2) 404,430 404,065 101,075 101,369 62,984 62,842 16,375 16,476 317,988 317,765 77,041 77,234
7~9月(Q3) 422,970 423,432 105,405 106,023 57,321 67,400 17,464 17,636 331,378 331,761 80,115 80,561
10~12月(Q4) 436,926 437,426 111,254 111,854 72,196 72,514 19,133 19,387 337,139 337,321 83,510 83,856
平成22年1月 (Jan) 119,903 118,850 30,682 30,931 15,369 15,194 4,083 4,176 98,013 97,135 24,287 24,443
2 (Feb) 133,998 133,167 34,322 34,501 16,759 16,820 4,871 4,914 109,813 108,921 26,838 26,974
3 (Mar) 141,803 141,909 36,861 36,967 18,903 18,864 5,058 5,075 114,960 115,105 28,786 28,875
4 (Apr) 132,968 133,601 33,414 33,635 19,384 19,638 5,124 5,213 105,475 105,854 25,600 25,734
5 (May) 123,710 122,407 30,982 30,893 20,196 19,680 5,182 5,137 96,349 95,562 23,433 23,389
6 (Jun) 147,752 148,057 36,679 36,840 23,404 23,524 6,068 6,126 116,164 116,349 28,008 28,112
7 (Jul) 151,148 151,670 37,601 37,792 22,809 22,967 5,904 5,955 119,760 120,124 29,060 29,200
8 (Aug) 123,248 123,556 30,654 31,050 20,603 20,817 5,274 5,416 95,017 95,111 22,853 23,107
9 (Sep) 148,574 148,206 37,150 37,181 23,909 23,616 6,285 6,265 116,601 116,526 28,202 28,254
10 (Oct) 145,647 145,059 36,687 36,774 24,143 23,964 6,236 6,280 112,611 112,202 27,673 27,716
11 (Nov) 151,649 151,772 38,571 38,765 25,079 25,038 6,632 6,696 116,942 117,106 28,921 29,052
12 (Dec) 139,630 140,595 35,997 36,315 22,974 23,512 6,265 6,411 107,586 108,013 26,915 27,088
注.平成21年以前の数値に用いる接続係数は、299ページに掲載しています。
型鍛造品(1~3) 産業機械・土木建設機械用(1) 自動車用(2)
重量(t) 金額(百万円) 重量(t) 金額(百万円) 重量(t) 金額(百万円)
305