introduction to ms-excel introduction to ms-excel entering data in excel entering data in excel ...
TRANSCRIPT

MS-EXCEL

To be discussed…
Introduction to MS-Excel Entering data in EXCEL Formulas & Functions in EXCEL Formatting text in EXCEL Applying styles in EXCEL
Excel Basics
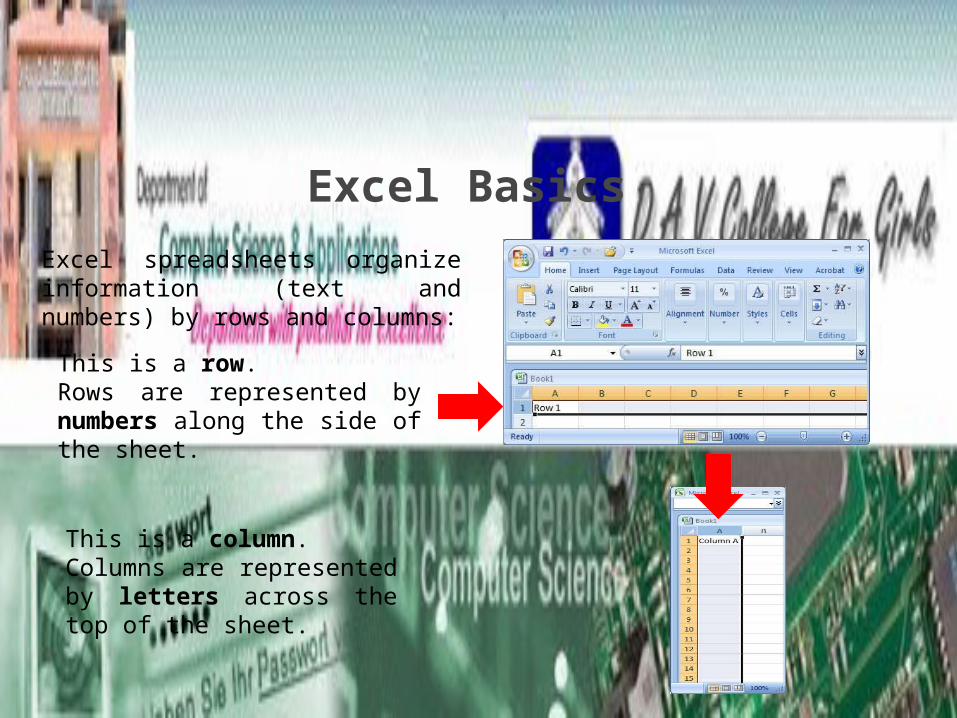
This is a row. Rows are represented by numbers along the side of the sheet.
This is a column. Columns are represented by letters across the top of the sheet.
Excel spreadsheets organize information (text and numbers) by rows and columns:
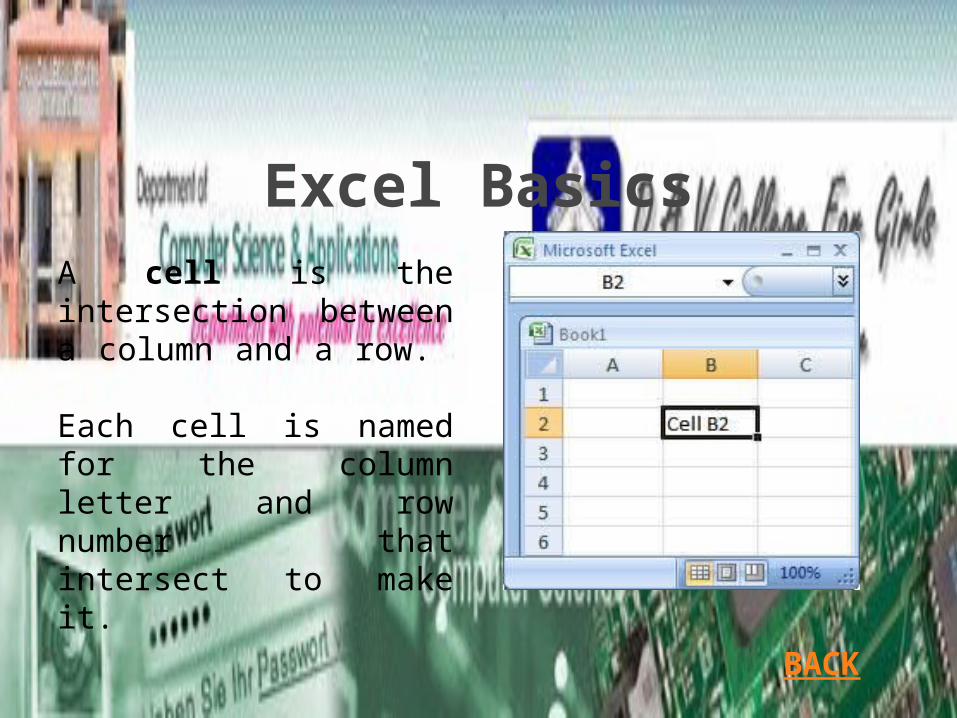
Excel BasicsA cell is the intersection between a column and a row.
Each cell is named for the column letter and row number that intersect to make it.
BACK
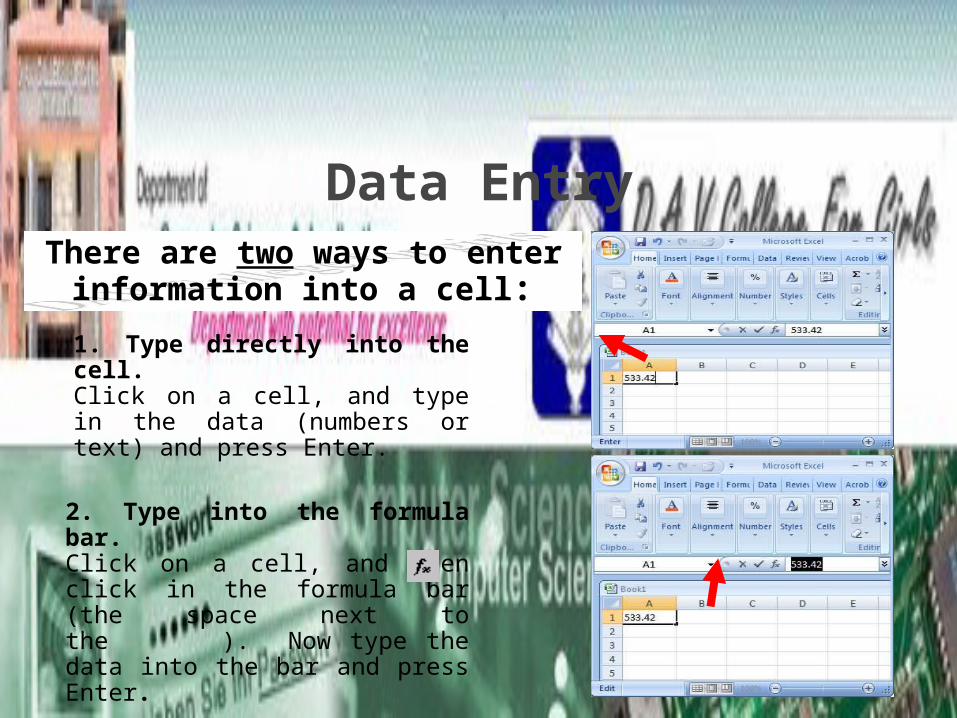
Data EntryThere are two ways to enter
information into a cell:
1. Type directly into the cell.Click on a cell, and type in the data (numbers or text) and press Enter.
2. Type into the formula bar.Click on a cell, and then click in the formula bar (the space next to the ). Now type the data into the bar and press Enter.
Data Entry
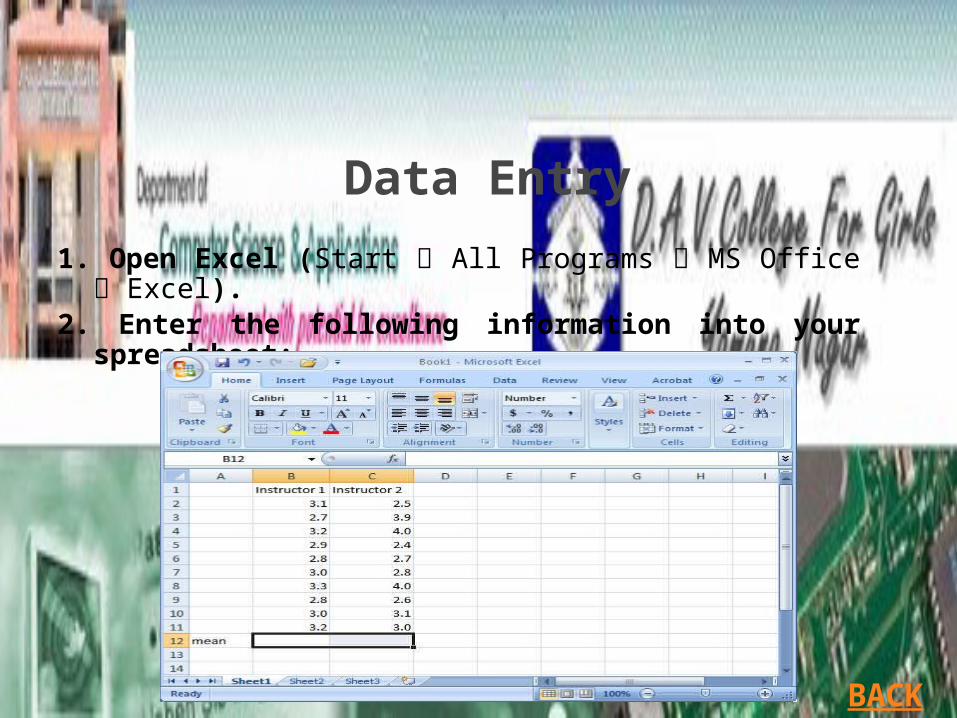
1. Open Excel (Start All Programs MS Office Excel).2. Enter the following information into your spreadsheet:
BACK
Formulas and Functions
Formulas are equations that perform calculations in your spreadsheet. Formulas always begin with an equals sign (=). When you enter an equals sign into a cell, you are basically telling Excel to “calculate this.”
Functions are Excel-defined formulas. They take data you select and enter, perform calculations on them, and return value(s).

More on Functions All functions have a common format – the equals sign followed by the function
name followed by the input in parentheses. The input for a function can be either:
◦ A set of numbers (e.g., “=AVERAGE(2, 3, 4, 5)”) This tells Excel to calculate the average of these numbers.
◦ A reference to cell(s) (e.g., “=AVERAGE(B1:B18) or “=AVERAGE (B1, B2, B3, B4, B5, B6, B7, B8)” This tells Excel to calculate the average of the data that appear in all the cells
from B1 to B8. You can either type these cell references in by hand or by clicking and
dragging with your mouse to select the cells.
BACK

Formatting Workbooks Formatting is the process of changing a workbook’s
appearance by defining the fonts, styles, colors, and decorative features
A theme is a collection of formatting that specifies the fonts, colors, and graphical effects used throughout the workbook.
New Perspectives on Microsoft Office Excel 2007
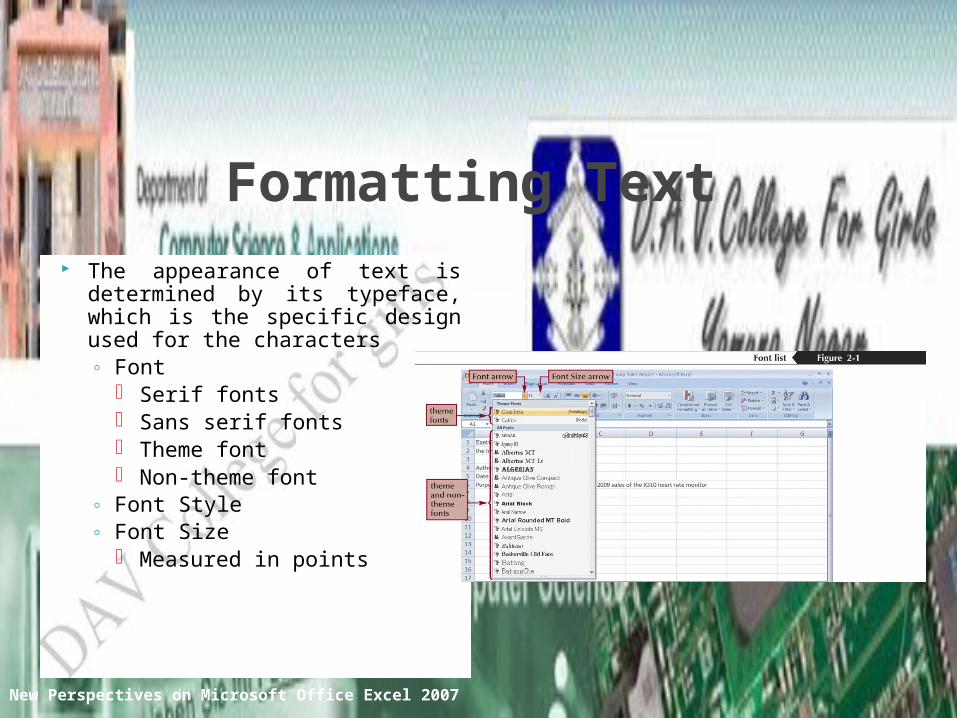
Formatting Text The appearance of text is determined by its
typeface, which is the specific design used for the characters◦ Font
Serif fonts Sans serif fonts Theme font Non-theme font
◦ Font Style◦ Font Size
Measured in points
New Perspectives on Microsoft Office Excel 2007
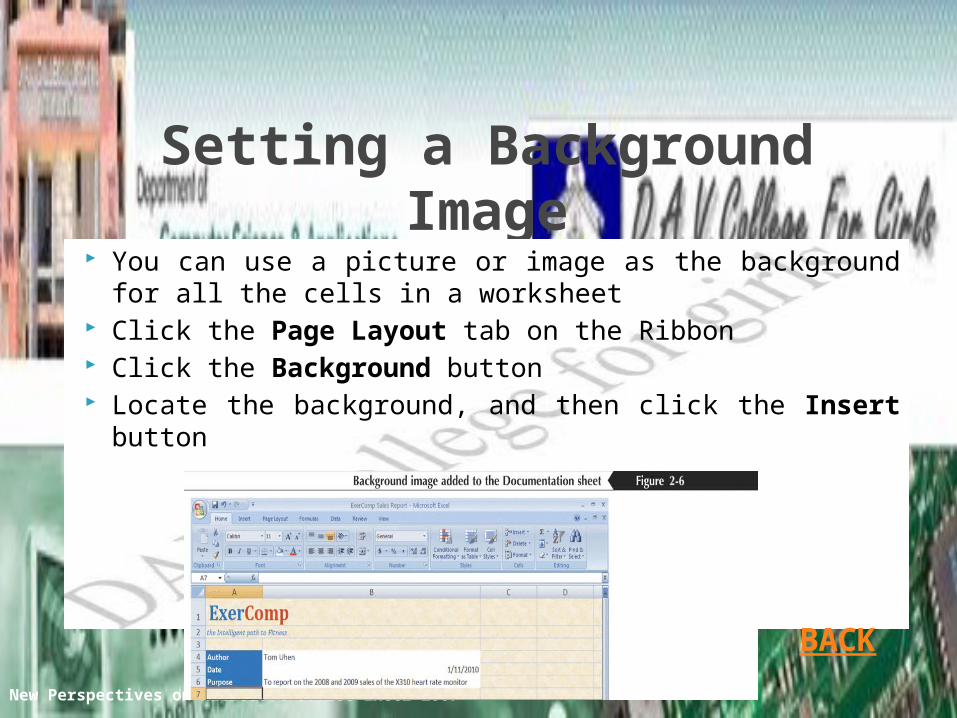
Setting a Background Image You can use a picture or image as the background for all the cells in a
worksheet Click the Page Layout tab on the Ribbon Click the Background button Locate the background, and then click the Insert button
New Perspectives on Microsoft Office Excel 2007
BACK
Applying Styles A style is a collection of formatting
Select the cell or range to which you want to apply a style
In the Styles group on the Home tab, click the Cell Styles button
Point to each style in the Cell Styles gallery to see a Live Preview of that style on the selected cell or range
Click the style you want to apply to the selected cell or range
New Perspectives on Microsoft Office Excel 2007
BACK
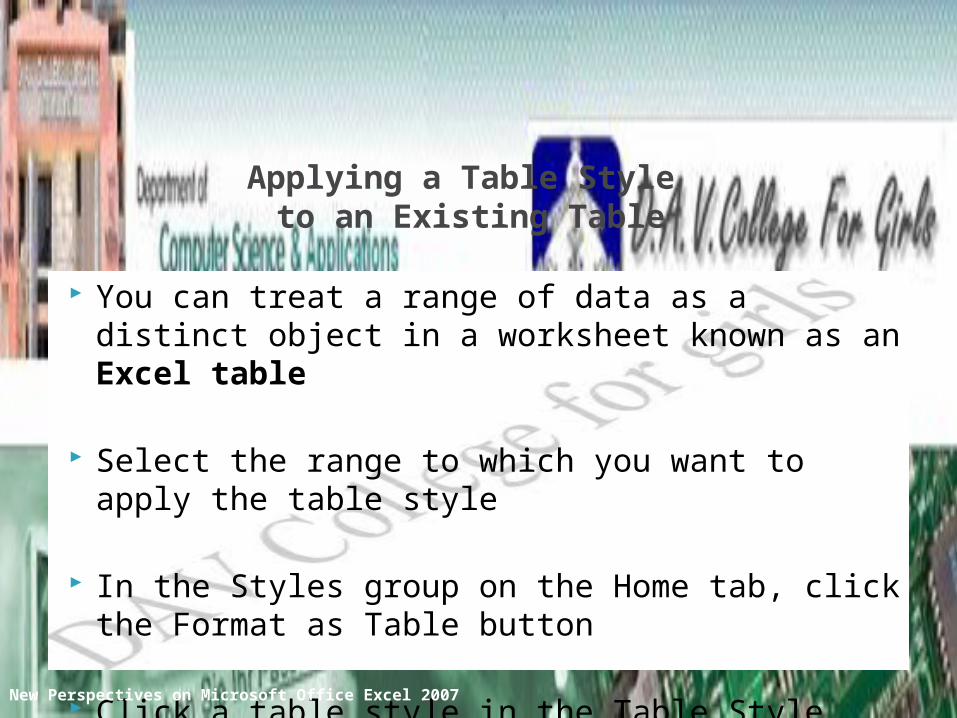
Applying a Table Style to an Existing Table
You can treat a range of data as a distinct object in a worksheet known as an Excel table
Select the range to which you want to apply the table style
In the Styles group on the Home tab, click the Format as Table button
Click a table style in the Table Style gallery
New Perspectives on Microsoft Office Excel 2007
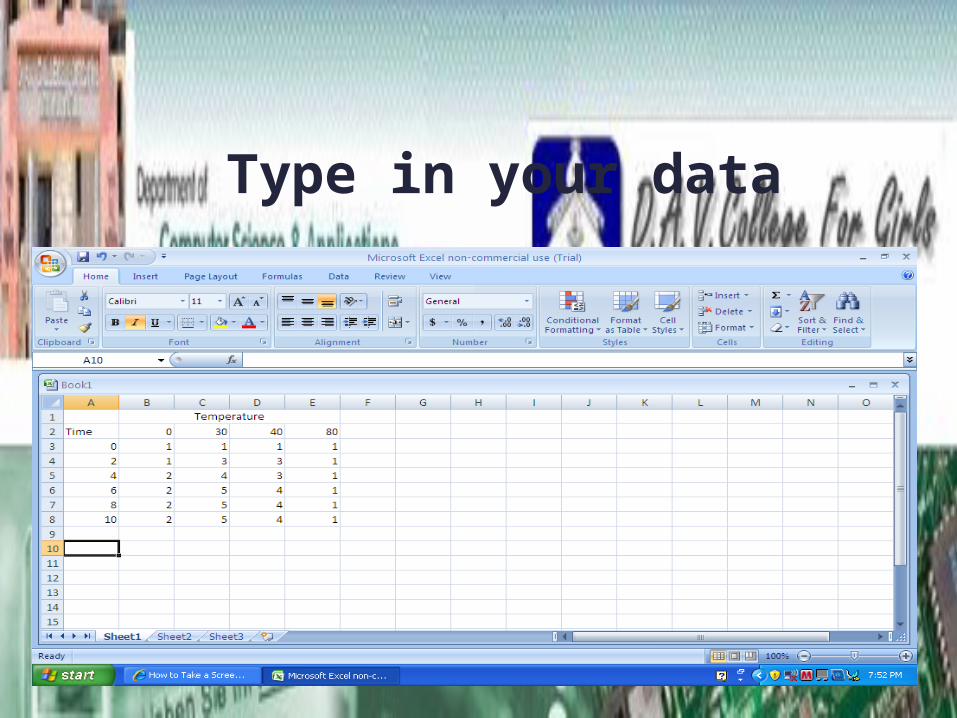
Type in your data
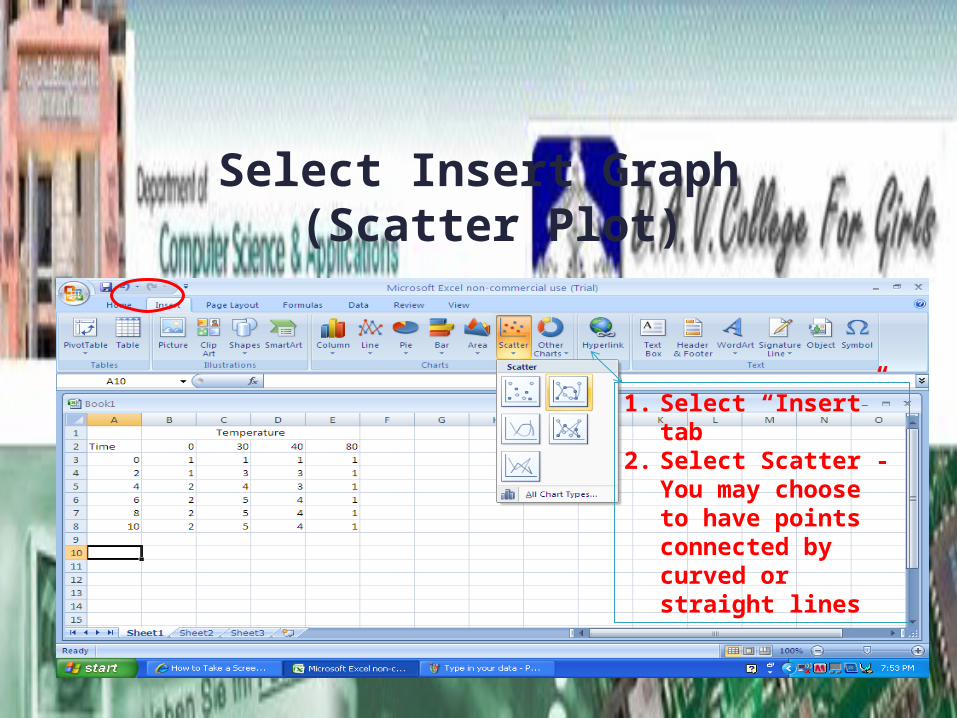
Select Insert Graph (Scatter Plot)
1. Select “Insert” tab
2. Select Scatter -You may choose to have points connected by curved or straight lines

Insert Graph
Once you select your type of graph, you will get a box that will likely be empty but may have a graph depending on what you had selected prior to inserting the graph
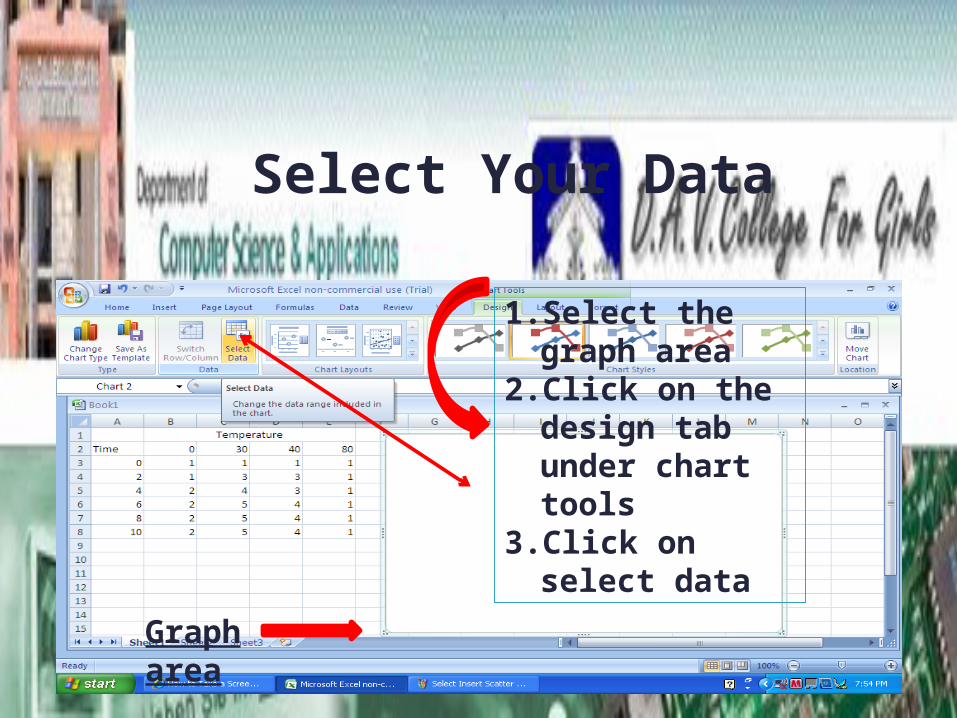
Select Your Data
1.Select the graph area
2.Click on the design tab under chart tools
3.Click on select data
Graph area
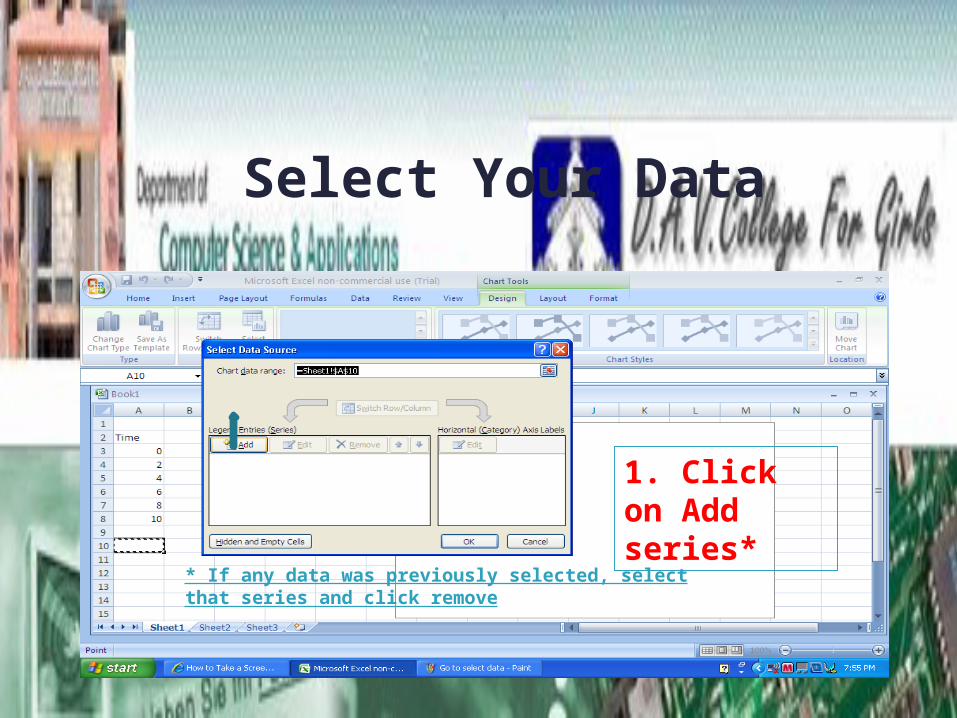
Select Your Data
1. Click on Add series*
* If any data was previously selected, select that series and click remove
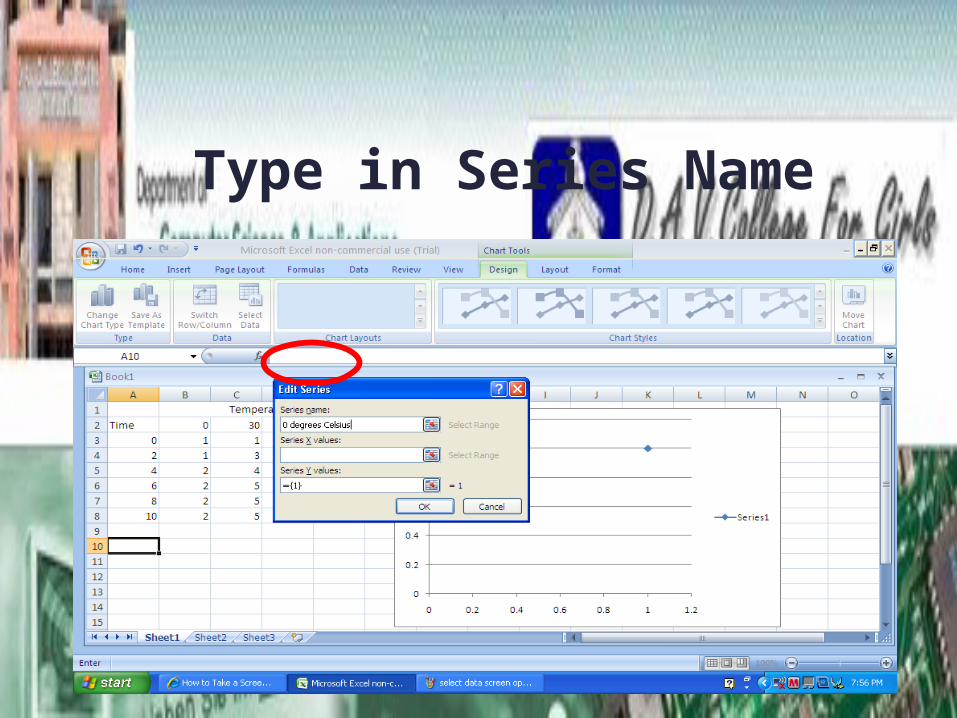
Type in Series Name
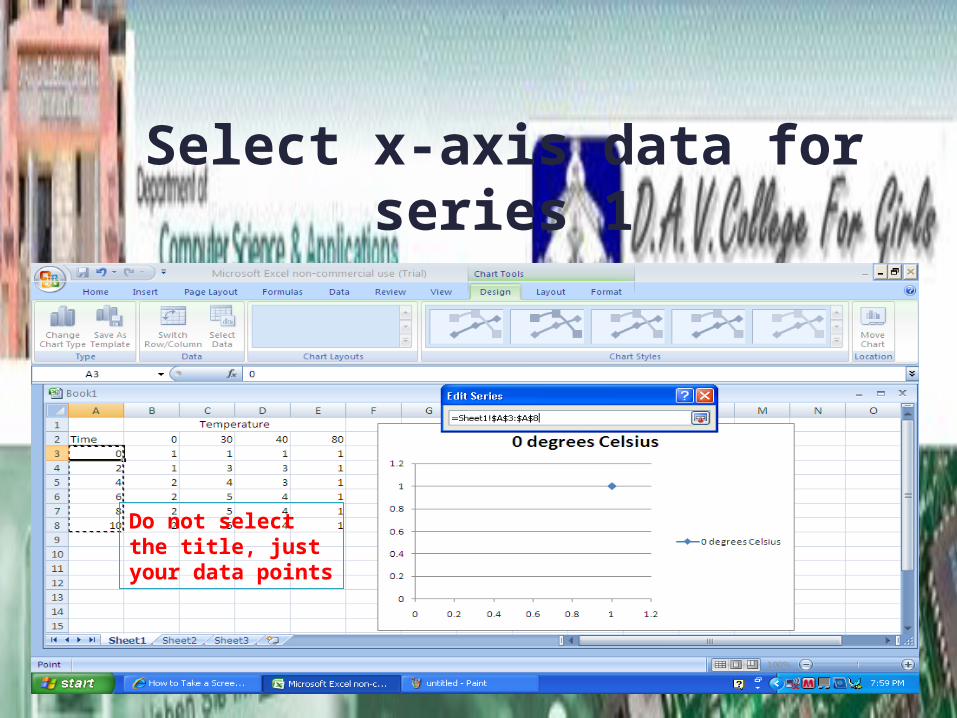
Select x-axis data for series 1
Do not select the title, just your data points
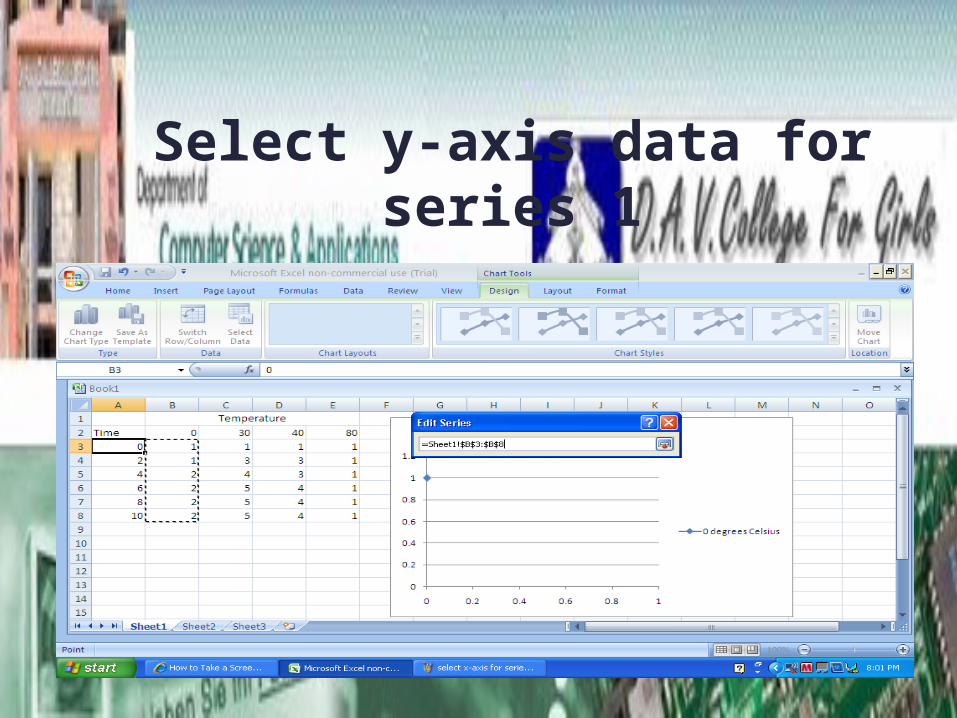
Select y-axis data for series 1
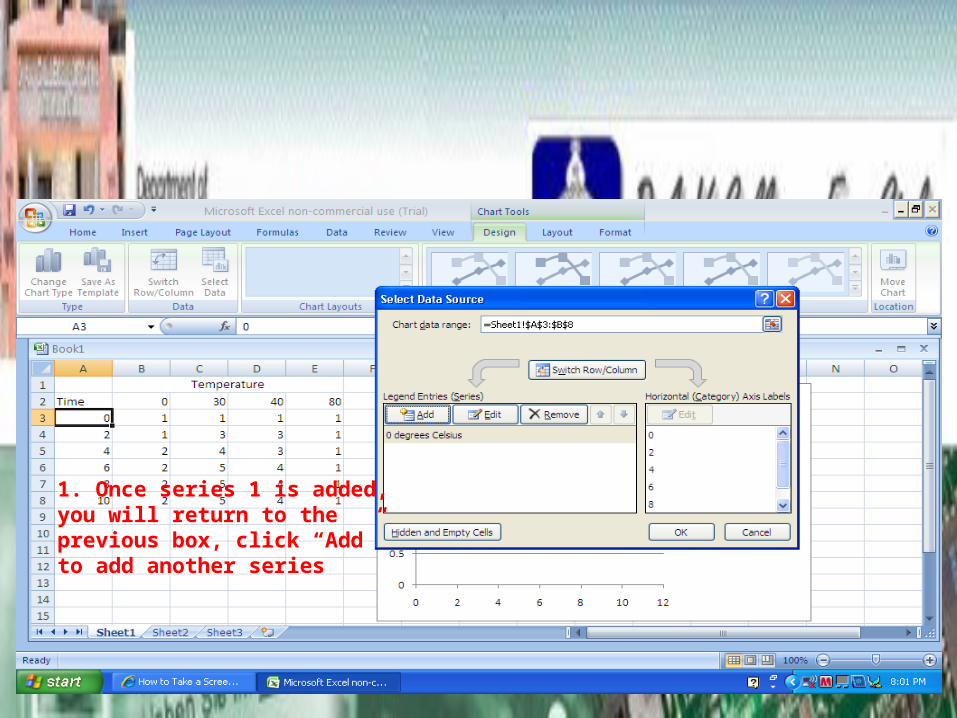
1. Once series 1 is added, you will return to the previous box, click “Add” to add another series

Thankyou
BACK