“ i dream of rain i dream of gardens in the desert sand i wake in pain i dream of love as time...
TRANSCRIPT
““I dream of rainI dream of rainI dream of gardens in the desert sandI dream of gardens in the desert sand
I wake in painI wake in painI dream of love as time runs through my I dream of love as time runs through my
handhand
I dream of rainI dream of rainI lift my gaze to empty skies aboveI lift my gaze to empty skies aboveI close my eyes, this rare perfumeI close my eyes, this rare perfume
Is the sweet intoxication of her loveIs the sweet intoxication of her love…”…”
Sting – Sting – Desert RoseDesert Rose

•PrecipitationPrecipitation• Condensation, rainfall (spatial & temporal)Condensation, rainfall (spatial & temporal)
• Streams & FloodsStreams & Floods (Nature and cause of floods)(Nature and cause of floods)•The hydrographThe hydrograph
• Discharge Discharge vsvs. time. time•Flood predictionFlood prediction
• Flood routingFlood routing• Flood frequency analysisFlood frequency analysis
Case Studies:Case Studies:•Spatial variability in streamflowSpatial variability in streamflow•Impervious surface area (ISA) and streamflowImpervious surface area (ISA) and streamflow•Watershed hydrology and contaminant transportWatershed hydrology and contaminant transport
U6115: Climate & WaterU6115: Climate & WaterTuesday, Aug. 09 2004Tuesday, Aug. 09 2004

Scheffer et al., 2001. Catastrophic shifts in ecosystems. Nature 413:591-596.
Perturbations & Catastrophic Shifts in Perturbations & Catastrophic Shifts in EcosystemsEcosystems
Hysteresis in a Shallow LakeHysteresis in a Shallow LakeResponse of macrophyte
vegetation in Lake Veluwe to P
Scheffer et al., 2001. Catastrophic shifts in ecosystems. Nature 413:591-596.

Water – Precipitation/EvaporationWater – Precipitation/Evaporation1)1) Temporal and spatial change in energy of atmosphere Temporal and spatial change in energy of atmosphere
will affect the amount of moisture and thus heat transferwill affect the amount of moisture and thus heat transfer2)2) Regional water mass balance will be affectedRegional water mass balance will be affected..3)3) Precipitation is the primary input of water to a Precipitation is the primary input of water to a
catchmentcatchment4)4) Evaporation is (often) the primary output from a Evaporation is (often) the primary output from a
catchmentcatchment..

CatchmentCatchmentCatchementCatchement (drainage basin, watershed): the basic unit of (drainage basin, watershed): the basic unit of volume (control) which is an area of land in which water volume (control) which is an area of land in which water flowing across the land surface drains into a particular flowing across the land surface drains into a particular stream and ultimately flows a single point or outlet.stream and ultimately flows a single point or outlet.
dV/dt = p - rso - et = 0
on average p = rso + et

CatchmentCatchment
Our concern with Our concern with precipitationprecipitation and and evapotranspirationevapotranspiration is in knowing is in knowing the the ratesrates, timing, and spatial , timing, and spatial distribution of these water fluxes distribution of these water fluxes between the land and the between the land and the atmosphere.atmosphere.
dV/dt = p - rso - et = 0

Water in the atmosphere - thermodynamic properties of moist
airDescribing amounts of water vapor in the atmosphere. There are a few ways to report the concentration of water
vapor in the atmosphere. 1. Vapor pressure (denoted e): is the partial pressure of
water vapor molecules in the atmosphere. 2. Relative humidity: is the ratio of actual vapor pressure
to saturation vapor pressure 3. Mixing ratio: is the mass of water vapor in grams per
kilogram of air. 4. Dew point temperature: the temperature at which the
vapor in a cooled parcel of air begins to condense.
Water Vapour Pressure vs. Temperature
Three primary steps in the generation of precipitable water in atmosphere:
1) Creation of saturated conditions
2) Condensation of water vapor
3) Growth of small droplets by collision and coalescence

Dew Point Temperature
Air parcel 50% relative humidity
Dew point
Precipitation/EvaporationPrecipitation/EvaporationWhy?Why?1)1) Precipitation Precipitation Supply of freshwater (surface water system) Supply of freshwater (surface water system)2)2) Evaporation Evaporation Reduction in supply (and effect on quality!) Reduction in supply (and effect on quality!)
Water managementWater management1)1) Prediction of precipitationPrediction of precipitation2)2) Estimates of evaporation (water-Estimates of evaporation (water-
agriculture)agriculture)3)3) Estimates of runoffEstimates of runoff
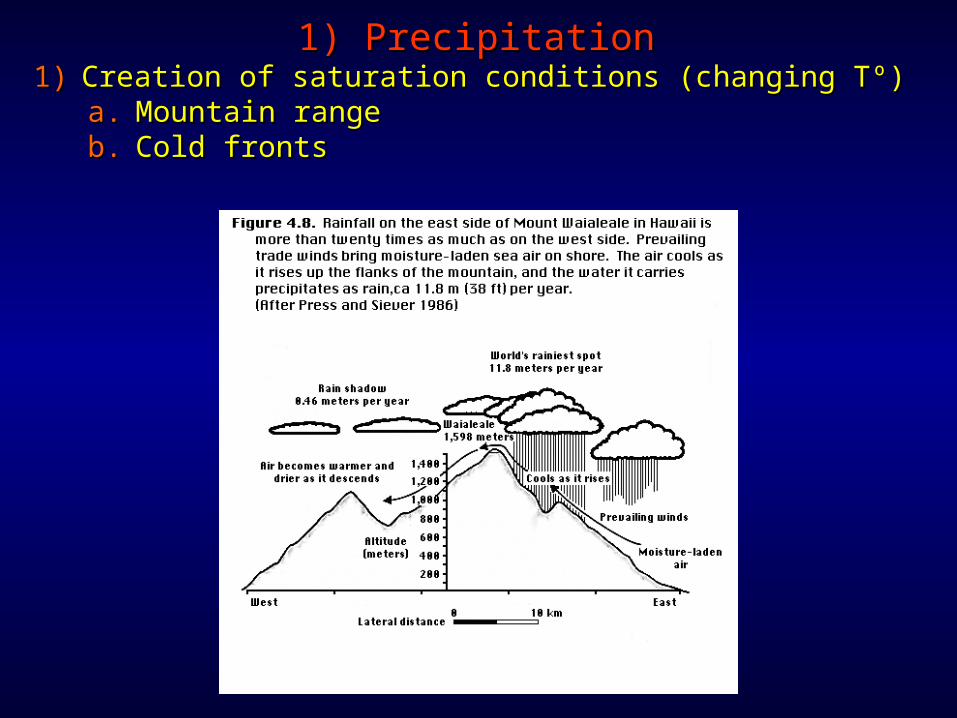
1) Precipitation1) Precipitation1)1) Creation of saturation conditions (changing Tº)Creation of saturation conditions (changing Tº)
a.a. Mountain rangeMountain rangeb.b. Cold frontsCold fronts

1) Precipitation1) Precipitation2)2) Condensation of water vapor into liquid waterCondensation of water vapor into liquid water
a.a. The importance of nuclei (salts, particles, water The importance of nuclei (salts, particles, water droplets)droplets)
1) Precipitation1) Precipitation
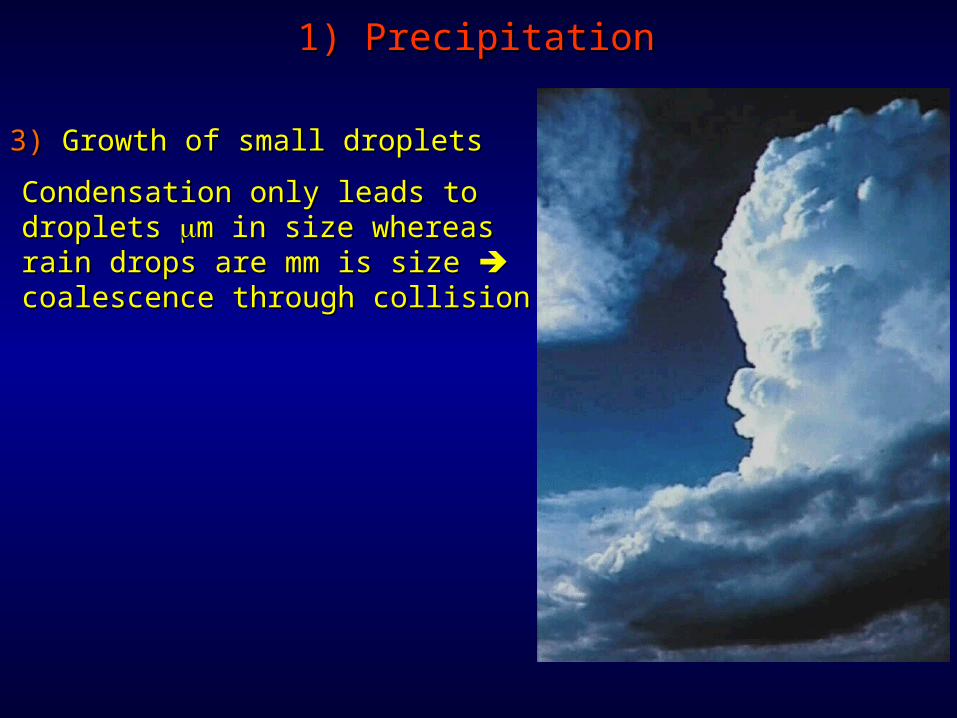
3)3) Growth of small dropletsGrowth of small droplets
Condensation only leads to droplets Condensation only leads to droplets m in size whereas rain drops are m in size whereas rain drops are mm is size mm is size coalescence through coalescence through collision collision
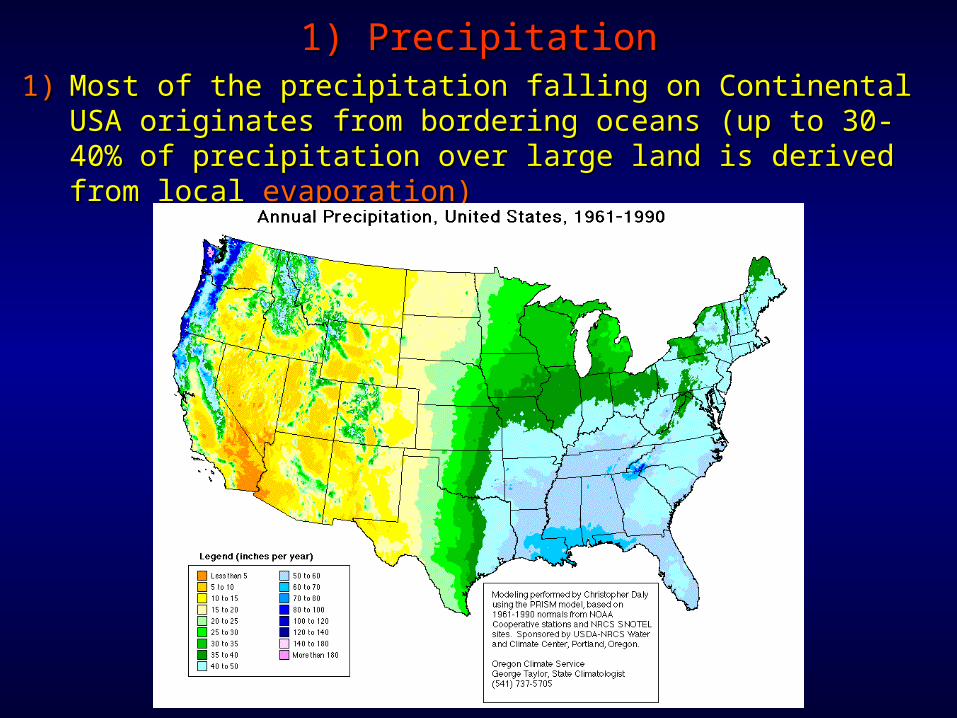
1) Precipitation1) Precipitation1)1) Most of the precipitation falling on Continental USA Most of the precipitation falling on Continental USA
originates from bordering oceans (up to 30-40% of originates from bordering oceans (up to 30-40% of precipitation over large land is derived from local precipitation over large land is derived from local evaporation)evaporation)

Spatial distribution dependent on:Spatial distribution dependent on:• LatitudeLatitude• ElevationElevation• Distance from moisture source (position Distance from moisture source (position
within continental land mass)within continental land mass)• Prevailing windsPrevailing winds• Relation to mountain rangesRelation to mountain ranges• Relative Tº of land and bordering oceansRelative Tº of land and bordering oceans
1) Precipitation1) Precipitation
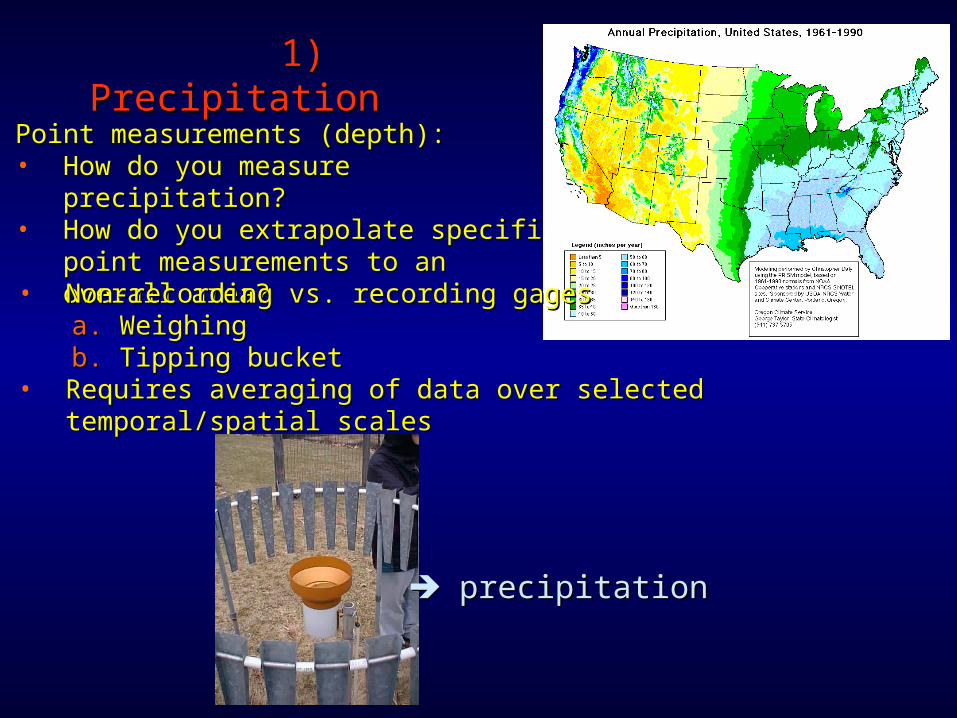
Point measurements (depth):Point measurements (depth):• How do you measure precipitation?How do you measure precipitation?• How do you extrapolate specific point How do you extrapolate specific point
measurements to an overall area?measurements to an overall area?
1) 1) PrecipitationPrecipitation
• Non-recording vs. recording gagesNon-recording vs. recording gagesa.a. WeighingWeighingb.b. Tipping bucketTipping bucket
• Requires averaging of data over selected temporal/spatial Requires averaging of data over selected temporal/spatial scalesscales
precipitationprecipitation

Hydrologic Observations and ParametersHydrologic Observations and Parameters
The value of hydrologic observation over time or location (i.e. The value of hydrologic observation over time or location (i.e. precipitation) cannot be known exactly.precipitation) cannot be known exactly.
Thus virtually all hydrologic quantities are Thus virtually all hydrologic quantities are random variablesrandom variables and and hydrologic observation must be regarded as hydrologic observation must be regarded as samplessamples taken from taken from some some probability distributionprobability distribution (which is a theoretical relation (which is a theoretical relation between magnitude and probability)between magnitude and probability)
Statistical analysis (particularly estimation of the probability Statistical analysis (particularly estimation of the probability distributions that quantify magnitude-frequency relations) distributions that quantify magnitude-frequency relations) constitutes the principal means by which hydrologic observations constitutes the principal means by which hydrologic observations are transformed into terms that are useful for water-resource are transformed into terms that are useful for water-resource management.management.

• Record at any given point tends to be tremendously Record at any given point tends to be tremendously variable in time!variable in time!
• Temporal record (hourly, daily) precipitation over time Temporal record (hourly, daily) precipitation over time hyetographhyetograph
1) Precipitation1) Precipitation
Precipitation is Precipitation is commonly organized into commonly organized into discrete discrete storm eventsstorm events of of varying intensity and varying intensity and duration!duration! Our ability to forecast Our ability to forecast temporal variation to temporal variation to within a few hours is within a few hours is limited (depending on the limited (depending on the system), and is almost system), and is almost zero for a few days in zero for a few days in advance!advance!
Event-based processes: uniformitarianism vs catastrophismEvent-based processes: uniformitarianism vs catastrophism

• Temporal/Spatial Temporal/Spatial variability!variability!
1) Precipitation1) Precipitation

Temporal variability Temporal variability Need for averages (graphical or Need for averages (graphical or numerical)numerical)
1) Precipitation1) Precipitation
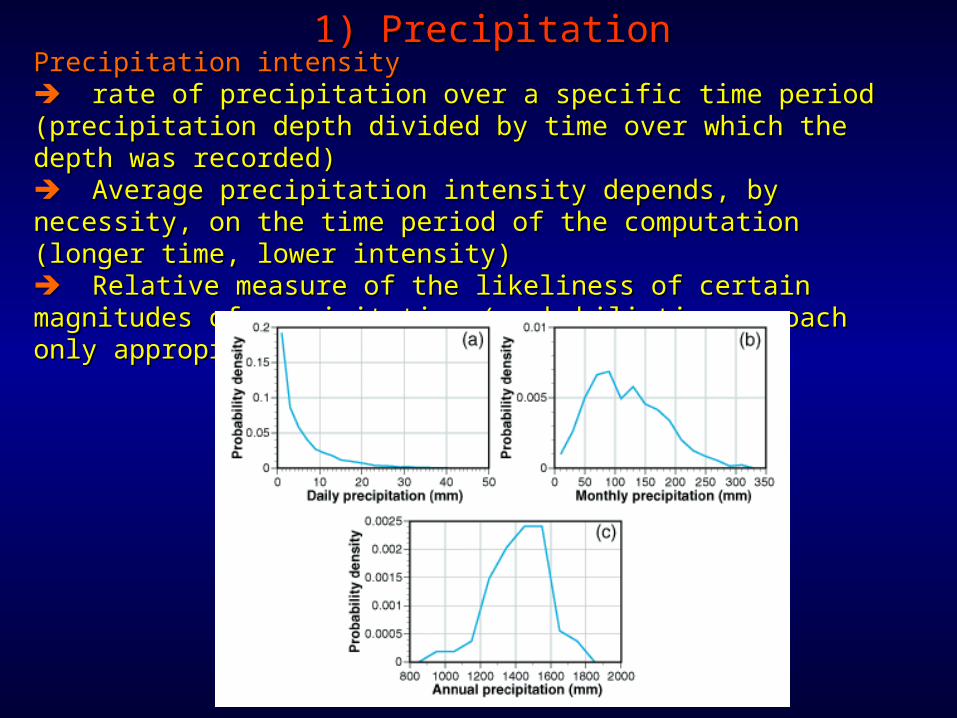
Precipitation intensityPrecipitation intensity rate of precipitation over a specific time period (precipitation rate of precipitation over a specific time period (precipitation depth divided by time over which the depth was recorded)depth divided by time over which the depth was recorded) Average precipitation intensity depends, by necessity, on the Average precipitation intensity depends, by necessity, on the time period of the computation (longer time, lower intensity)time period of the computation (longer time, lower intensity) Relative measure of the likeliness of certain magnitudes of Relative measure of the likeliness of certain magnitudes of precipitation (probabilistic approach only appropriate under precipitation (probabilistic approach only appropriate under certain conditions).certain conditions).
1) Precipitation1) Precipitation
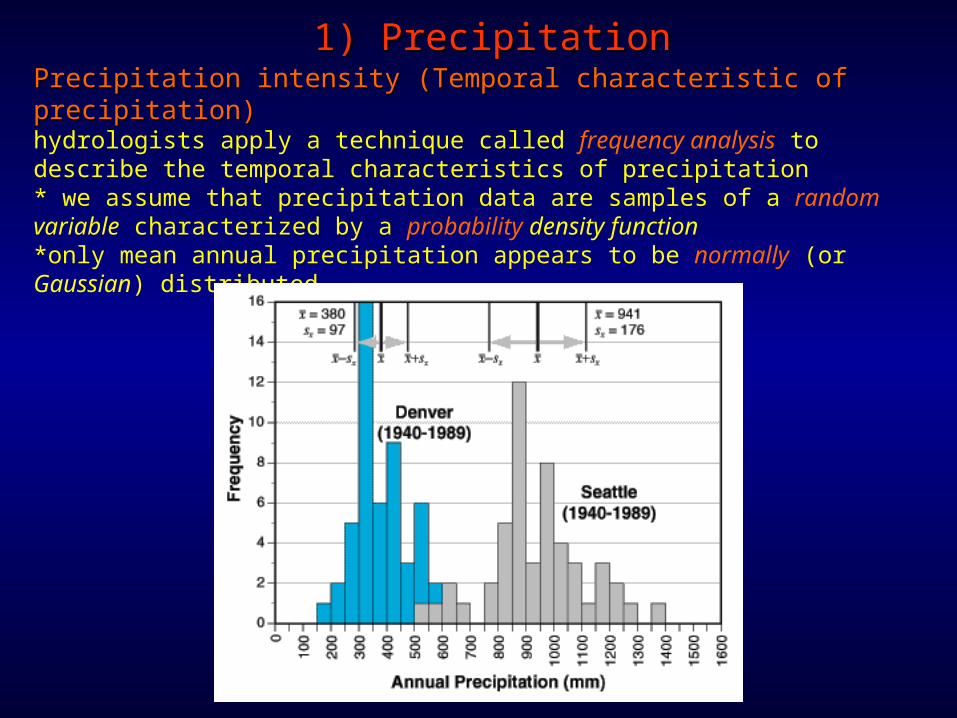
Precipitation intensity (Temporal characteristic of precipitation)Precipitation intensity (Temporal characteristic of precipitation)hydrologists apply a technique called frequency analysis to describe the temporal characteristics of precipitation* we assume that precipitation data are samples of a random variable characterized by a probability density function*only mean annual precipitation appears to be normally (or Gaussian) distributed
1) Precipitation1) Precipitation
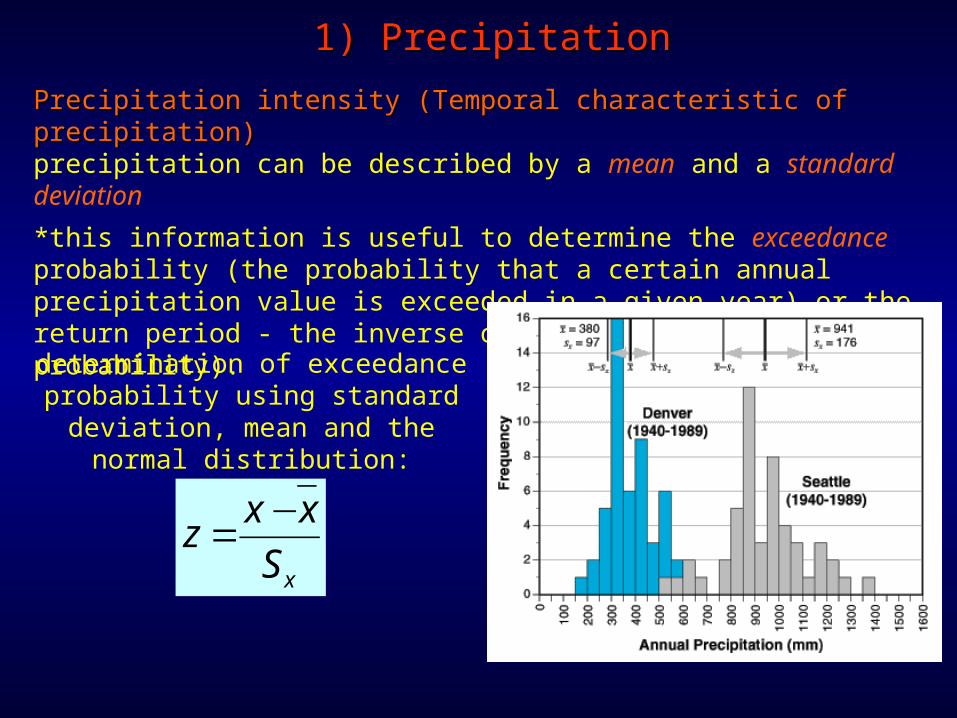
Precipitation intensity (Temporal characteristic of precipitation)Precipitation intensity (Temporal characteristic of precipitation)precipitation can be described by a mean and a standard deviation
*this information is useful to determine the exceedance probability (the probability that a certain annual precipitation value is exceeded in a given year) or the return period - the inverse of the exceedance probability).
1) Precipitation1) Precipitation
determination of exceedance probability using standard
deviation, mean and the normal distribution:
xS
xxz
−=

1) Precipitation1) Precipitationdetermination of exceedance probability using standard
deviation, mean, the normal distribution, and the normalization of the data:
xS
xxz
−=
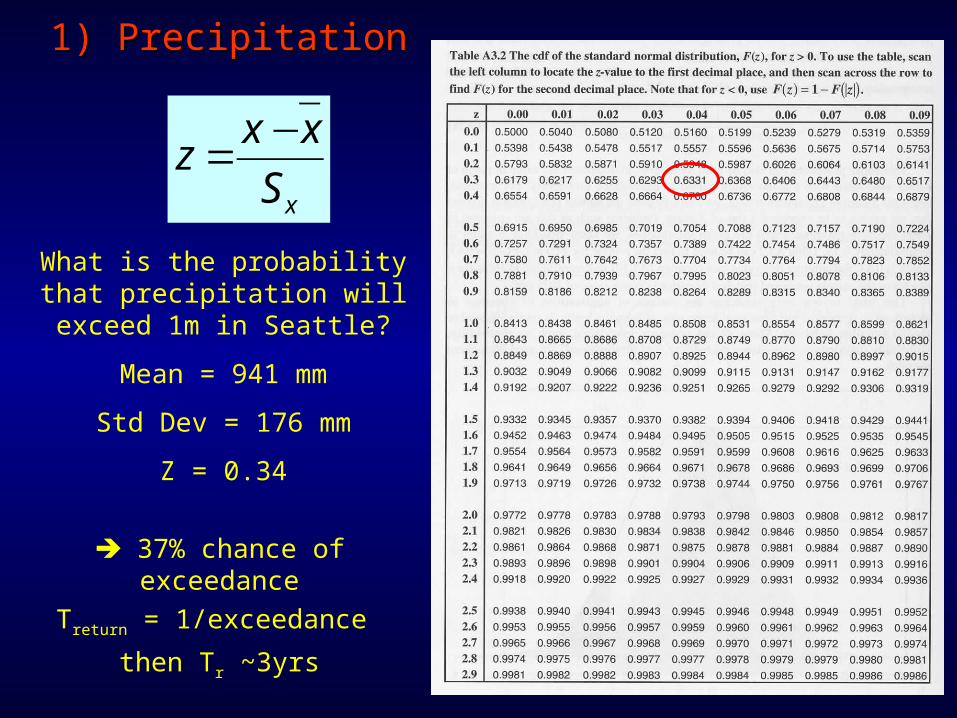
What is the probability that precipitation will exceed 1m in Seattle?
Mean = 941 mmStd Dev = 176 mm

1) Precipitation1) Precipitation
xS
xxz
−=
The cumulative distribution function (cdf) for a chosen
value is the probability that a random process (x) will be less
than or equal to the chosen value
What is the probability that precipitation will exceed 1m
in Seattle?
Mean = 941 mm
Std Dev = 176 mm
Z = 0.34
1) Precipitation1) Precipitation
xS
xxz
−=
37% chance of exceedance
Treturn = 1/exceedance
then Tr ~3yrs
What is the probability that precipitation will exceed 1m
in Seattle?
Mean = 941 mm
Std Dev = 176 mm
Z = 0.34

1) Precipitation1) Precipitation
xS
xxz
−=
What is the 100-year rain event in Seattle?
cdf = 0.99
Z = 2.33
Mean = 896 mm
Std Dev = 183 mm
X = 1322 mm
1900-2003 Once!
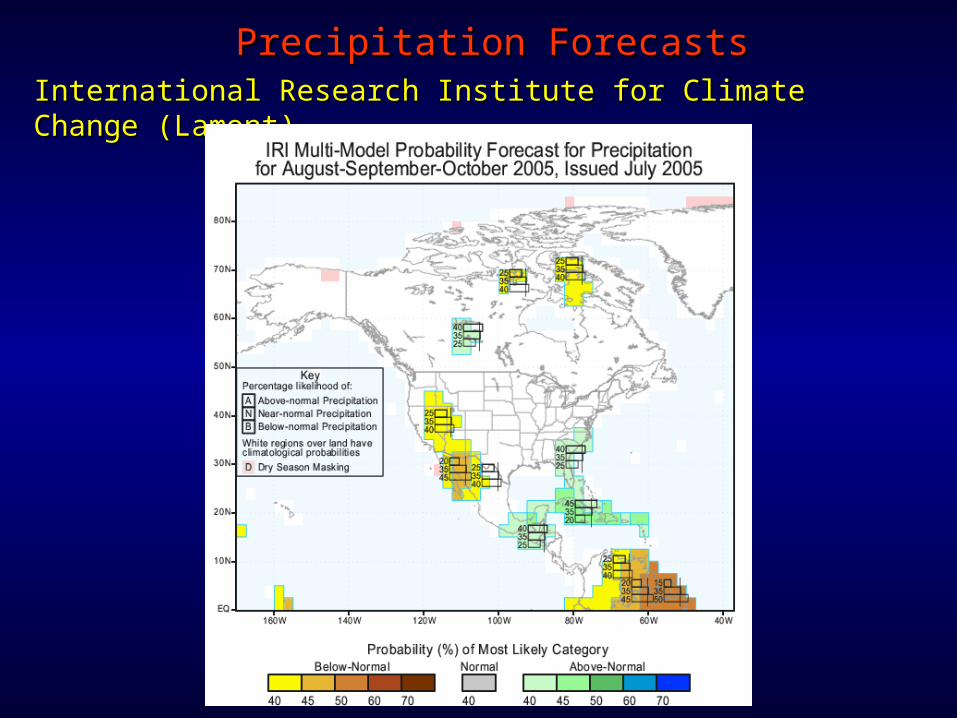
International Research Institute for Climate Change International Research Institute for Climate Change (Lamont)(Lamont)
Precipitation ForecastsPrecipitation Forecasts
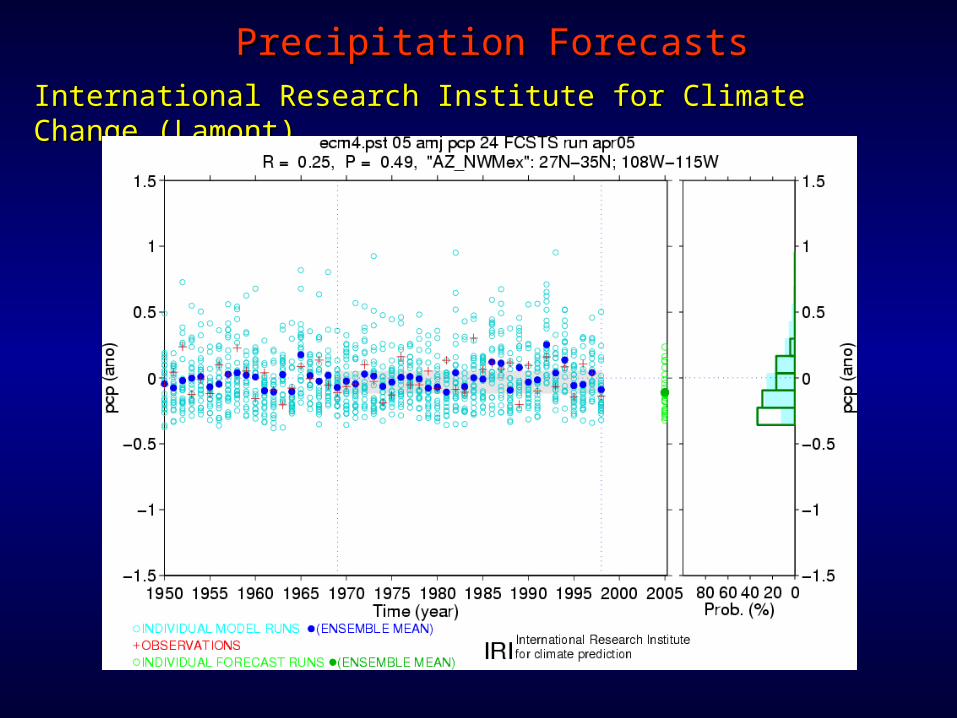
International Research Institute for Climate Change International Research Institute for Climate Change (Lamont)(Lamont)
Precipitation ForecastsPrecipitation Forecasts

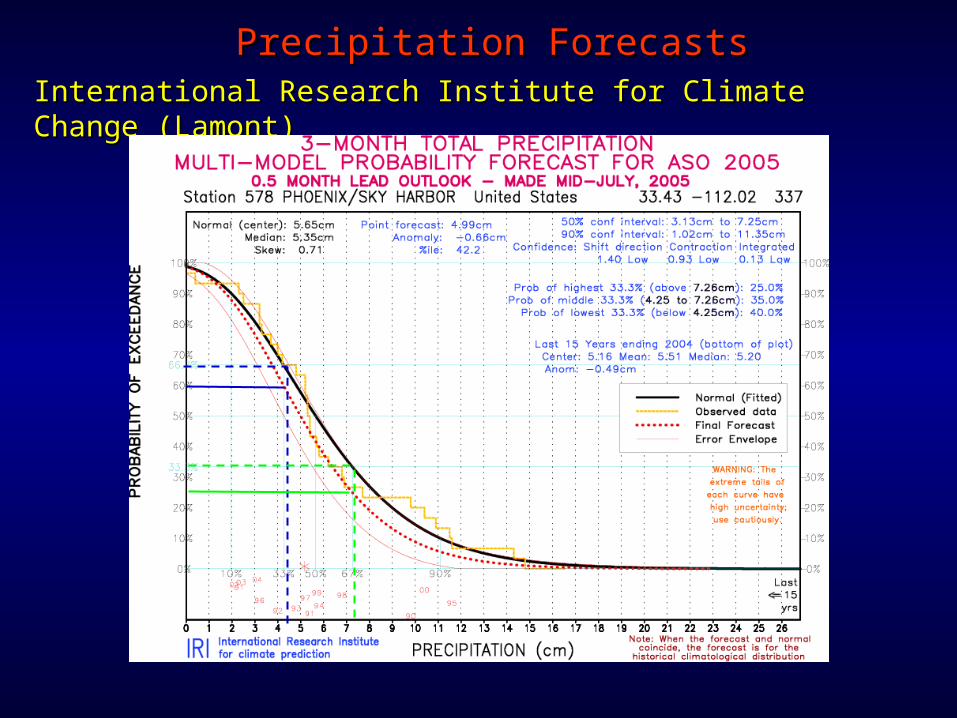
International Research Institute for Climate Change International Research Institute for Climate Change (Lamont)(Lamont)
Precipitation ForecastsPrecipitation Forecasts
International Research Institute for Climate Change International Research Institute for Climate Change (Lamont)(Lamont)
Precipitation ForecastsPrecipitation Forecasts

1)1) InterceptionInterception2)2) InfiltrationInfiltration3)3) EvaporationEvaporation4)4) RunoffRunoff
Fate of PrecipitationFate of Precipitation
Infiltration is influenced by type of soil and vegetation
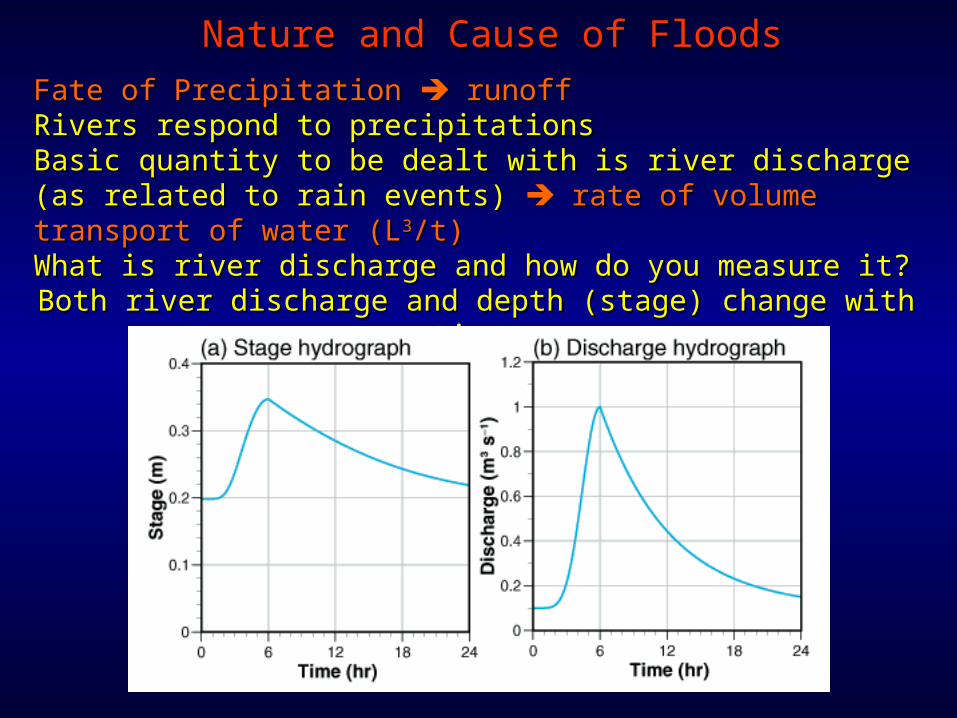
Fate of Precipitation Fate of Precipitation runoff runoffRivers respond to precipitationsRivers respond to precipitationsBasic quantity to be dealt with is river discharge (as related Basic quantity to be dealt with is river discharge (as related to rain events) to rain events) rate of volume transport of water (L rate of volume transport of water (L33/t)/t)What is river discharge and how do you measure it?What is river discharge and how do you measure it?
Both river discharge and depth (stage) change with time.Both river discharge and depth (stage) change with time.
Nature and Cause of FloodsNature and Cause of Floods
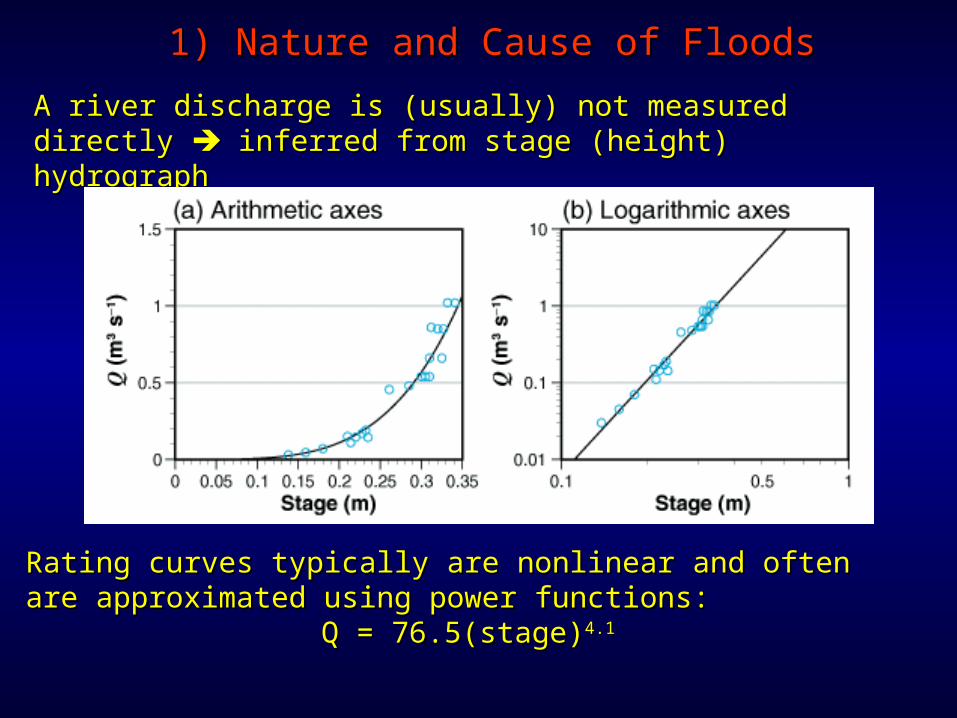
A river discharge is (usually) not measured directly A river discharge is (usually) not measured directly inferred from stage (height) hydrographinferred from stage (height) hydrograph
1) Nature and Cause of Floods1) Nature and Cause of Floods
Rating curves typically are nonlinear and often are Rating curves typically are nonlinear and often are approximated using power functions:approximated using power functions:
Q = 76.5(stage)Q = 76.5(stage)4.14.1

Nature and Cause of FloodsNature and Cause of Floods
Rating curves typically are nonlinear and often are approximated Rating curves typically are nonlinear and often are approximated using power functions:using power functions:
Q = 76.5(stage)Q = 76.5(stage)4.14.1
e.g. If stage peaks at 0.35m (at t = 6 hours), then the e.g. If stage peaks at 0.35m (at t = 6 hours), then the corresponding peak discharge is Q = 76.5(0.35)corresponding peak discharge is Q = 76.5(0.35)4.1 4.1 = 1.0 m= 1.0 m33.s.s-1-1
This way, a continuous measurement of river stage is used, in This way, a continuous measurement of river stage is used, in conjunction with conjunction with established rating curveestablished rating curve, to determine discharge as , to determine discharge as a function of time (almost all discharge hydrographs are determined a function of time (almost all discharge hydrographs are determined this way)this way)
Nature and Cause of FloodsNature and Cause of Floods
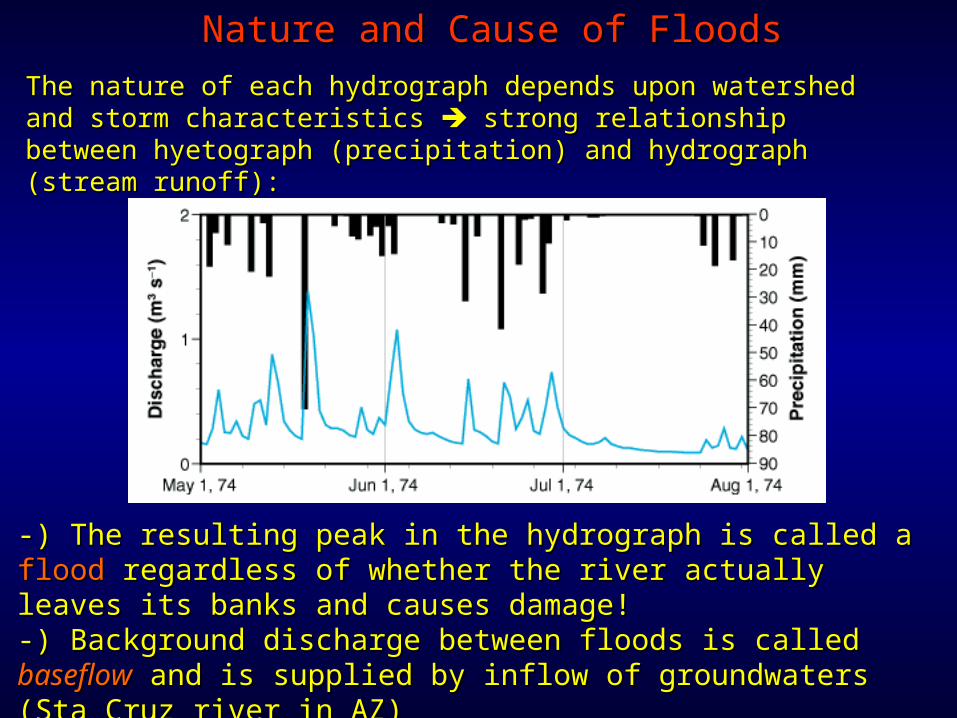
The nature of each hydrograph depends upon watershed and The nature of each hydrograph depends upon watershed and storm characteristics storm characteristics strong relationship between hyetograph strong relationship between hyetograph (precipitation) and hydrograph (stream runoff):(precipitation) and hydrograph (stream runoff):
-) The resulting peak in the hydrograph is called a -) The resulting peak in the hydrograph is called a floodflood regardless of whether the river actually leaves its banks and regardless of whether the river actually leaves its banks and causes damage!causes damage!-) Background discharge between floods is called -) Background discharge between floods is called baseflowbaseflow and is supplied by inflow of groundwaters (Sta Cruz river in and is supplied by inflow of groundwaters (Sta Cruz river in AZ)AZ)

Nature and Cause of FloodsNature and Cause of Floods
• in rivers, floods and low flows are expressions of the temporal variability in rainfall or snowmelt interacting with river basin characteristics (basin form, hillslope properties, channel network properties)
• flooding may also be the result of sudden release of water from dams or lakes, ice jams

Nature and Cause of FloodsNature and Cause of FloodsFloods cause the biggest natural hazard damage in the US
QuickTime™ and aTIFF (Uncompressed) decompressor
are needed to see this picture.
QuickTime™ and aTIFF (Uncompressed) decompressor
are needed to see this picture.
QuickTime™ and aTIFF (Uncompressed) decompressor
are needed to see this picture.
QuickTime™ and aTIFF (Uncompressed) decompressor
are needed to see this picture.
Mississippi flood, 1993
Honduras, Hurricane Mitch (1998)
Bangladesh Monsoon (2004)

Flood Flood may be thought as wave that propagates downstream. may be thought as wave that propagates downstream.In an ideal channel (frictionless fluid) flood wave travels with no changeIn an ideal channel (frictionless fluid) flood wave travels with no changeHowever:However:a)a) Mechanical energy is lost (dissipated) due to friction (roughness of Mechanical energy is lost (dissipated) due to friction (roughness of
bed)bed)b)b) Water also stored in pools, wetlands, and backwaters, and is Water also stored in pools, wetlands, and backwaters, and is
subsequently released (delay)subsequently released (delay)
Movement of flood waveMovement of flood wave
Thus magnitude of flood wave is Thus magnitude of flood wave is reduced and its transfer is reduced and its transfer is delayed as it travels downstream:delayed as it travels downstream:Attenuation by friction and Attenuation by friction and storagestorage
(normalization is critical practice)(normalization is critical practice)
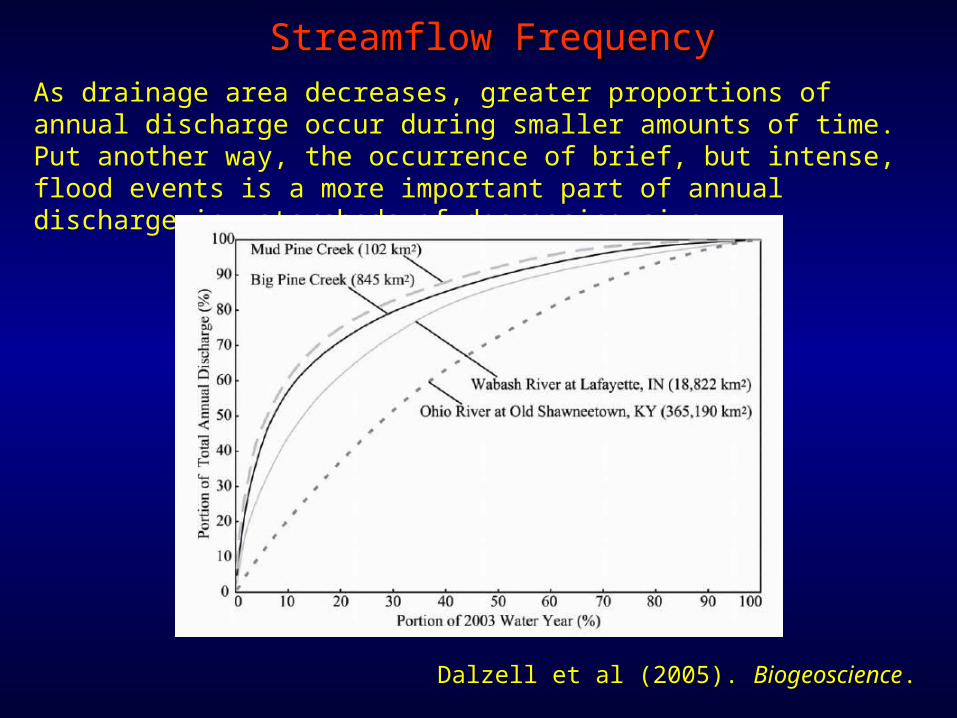
As drainage area decreases, greater proportions of annual discharge occur during smaller amounts of time. Put another way, the occurrence of brief, but intense, flood events is a more important part of annual discharge in watersheds of decreasing size
Streamflow FrequencyStreamflow Frequency
Dalzell et al (2005). Dalzell et al (2005). BiogeoscienceBiogeoscience..
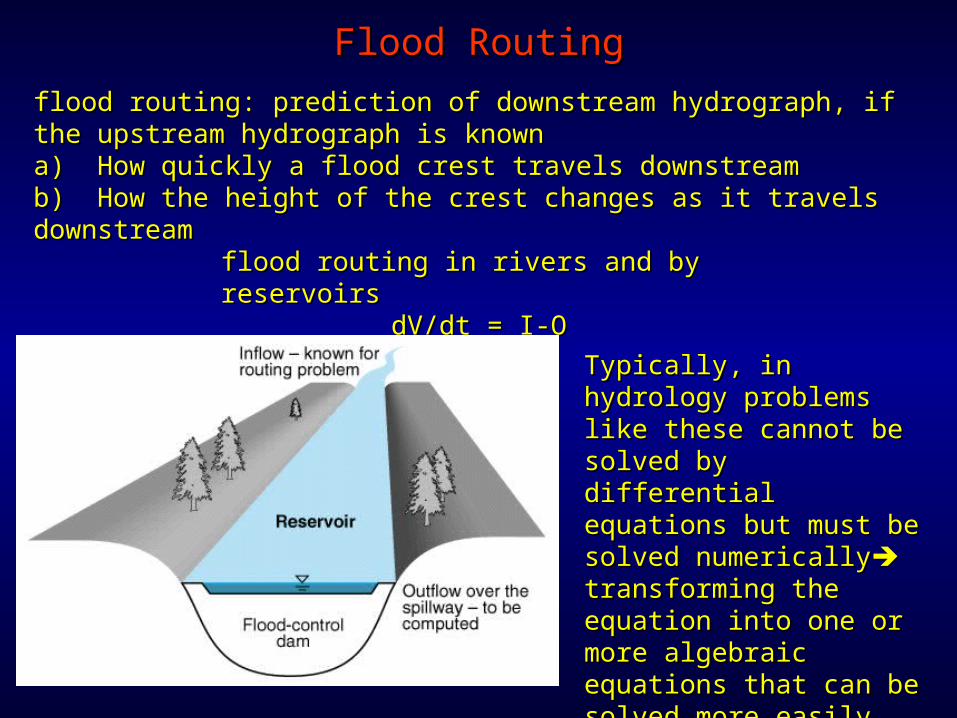
flood routing: prediction of downstream hydrograph, if the flood routing: prediction of downstream hydrograph, if the upstream hydrograph is knownupstream hydrograph is knowna)a) How quickly a flood crest travels downstreamHow quickly a flood crest travels downstreamb)b) How the height of the crest changes as it travels downstreamHow the height of the crest changes as it travels downstream
Flood RoutingFlood Routing
flood routing in rivers and by flood routing in rivers and by reservoirsreservoirs
dV/dt = I-OdV/dt = I-O
Typically, in hydrology Typically, in hydrology problems like these problems like these cannot be solved by cannot be solved by differential equations but differential equations but must be solved must be solved numericallynumerically transforming the transforming the equation into one or equation into one or more algebraic more algebraic equations that can be equations that can be solved more easily.solved more easily.

Prediction of downstream hydrographs requiresa) An estimate of speed of wave crestb) An estimate of the volume added by inflowc) Influence of frictiond) A complete understanding of hydrology & hydraulics of drainage
basin
Flood RoutingFlood Routing
Solving this equation requires 2 equations-) statement of conservation of mass-) conservation of momentumNeed numerical method to transform DFQ into algebraic one:
The 2 most important variables:a) Depthb) velocity
dV/dt = I-O
€
Vn +1 −Vn
Δt=
In + In +1
2−
On − On +1
2

Reservoirs’ size and volume affect the routing very rapidly. When reservoirs increase in size (and volume) store more water and rise in water (h) is smaller increase in outflow is smaller (delay and reduction of O).
Flood RoutingFlood Routing

A flood wave in rivers, on the other hand, must move through a long stretch of river before peak discharge is reduced as much as moderate-size reservoirs can accomplish in a relative short distance
Flood RoutingFlood Routing

Folsom Reservoir:In 1995, a partial failure of a spillway gate at Folsom Dam increased flows into the Lower American River from 6,500 cubic feet per second to about 40,000cfs.
Flood RoutingFlood Routing
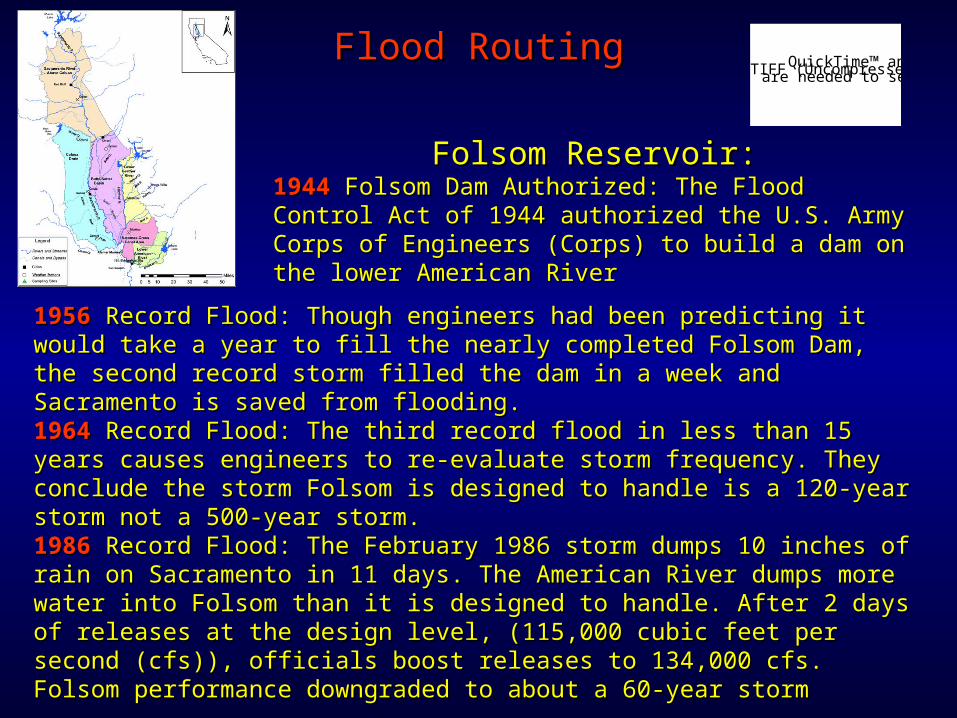
19561956 Record Flood: Though engineers had been predicting it would take Record Flood: Though engineers had been predicting it would take a year to fill the nearly completed Folsom Dam, the second record storm a year to fill the nearly completed Folsom Dam, the second record storm filled the dam in a week and Sacramento is saved from flooding.filled the dam in a week and Sacramento is saved from flooding.19641964 Record Flood: The third record flood in less than 15 years causes Record Flood: The third record flood in less than 15 years causes engineers to re-evaluate storm frequency. They conclude the storm engineers to re-evaluate storm frequency. They conclude the storm Folsom is designed to handle is a 120-year storm not a 500-year storm.Folsom is designed to handle is a 120-year storm not a 500-year storm.19861986 Record Flood: The February 1986 storm dumps 10 inches of rain Record Flood: The February 1986 storm dumps 10 inches of rain on Sacramento in 11 days. The American River dumps more water into on Sacramento in 11 days. The American River dumps more water into Folsom than it is designed to handle. After 2 days of releases at the Folsom than it is designed to handle. After 2 days of releases at the design level, (115,000 cubic feet per second (cfs)), officials boost design level, (115,000 cubic feet per second (cfs)), officials boost releases to 134,000 cfs. Folsom performance downgraded to about a 60-releases to 134,000 cfs. Folsom performance downgraded to about a 60-year stormyear storm
Flood RoutingFlood Routing QuickTime™ and aTIFF (Uncompressed) decompressorare needed to see this picture.
Folsom Reservoir:Folsom Reservoir:19441944 Folsom Dam Authorized: The Flood Control Act Folsom Dam Authorized: The Flood Control Act of 1944 authorized the U.S. Army Corps of Engineers of 1944 authorized the U.S. Army Corps of Engineers (Corps) to build a dam on the lower American River(Corps) to build a dam on the lower American River

simplest approach: Is the past record the key for the future?Statistical techniques use worst event on record:
highest discharges (peak flow) recorded in each year are listed the floods are ranked according to magnitude, the largest flood is assigned a
rank 1, the second largest rank 2, etc
Flood Frequency AnalysisFlood Frequency Analysis
The flood statistics are estimated graphically by plotting the logarithm of discharge for each flood in the annual series against the fraction of floods greater than or equal to that flood; this fraction is given by r/(n+1), where r is the rank of the particular flood and n is the number of observations (years)
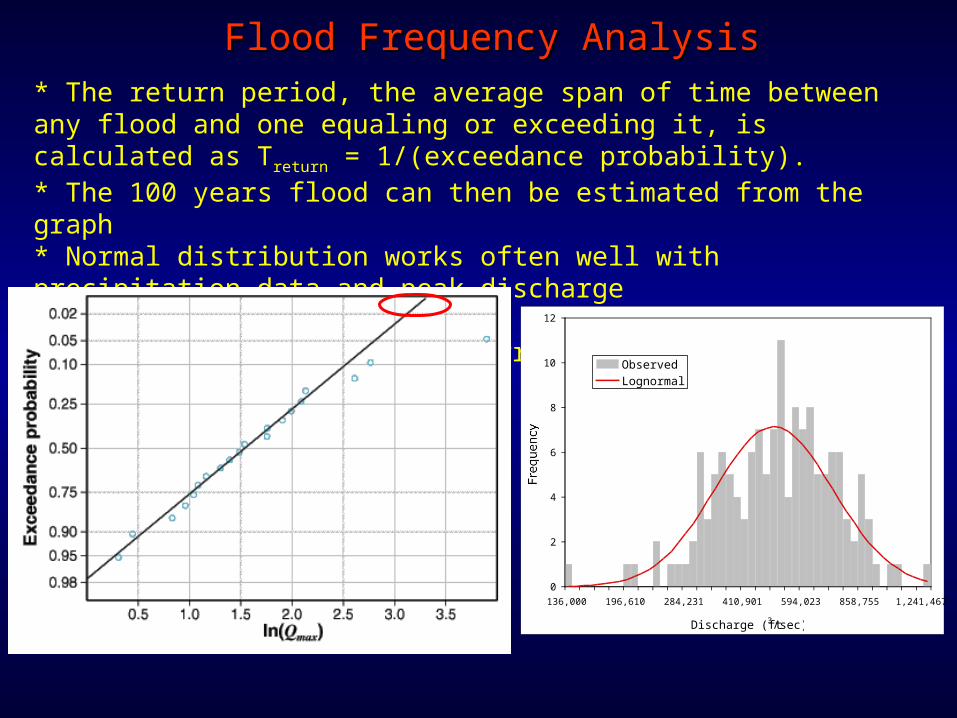
* The return period, the average span of time between any flood and one equaling or exceeding it, is calculated as Treturn = 1/(exceedance probability).* The 100 years flood can then be estimated from the graph* Normal distribution works often well with precipitation data and peak discharge* Problems: not deterministic, based usually on non-adequate data, climate and terrestrial environment is variable
Flood Frequency AnalysisFlood Frequency Analysis
0
2
4
6
8
10
12
136,000 196,610 284,231 410,901 594,023 858,755 1,241,467
Discharge (ft3/sec)
Frequency
ObservedLognormal

* Not all peak streamflow data are lognormally distributed skewness
Flood Frequency AnalysisFlood Frequency Analysis
0
2
4
6
8
10
12
13,700.0 19,444.5 27,597.7 39,169.5 55,593.6 78,904.3 111,989.3
Discharge (ft3/sec)
Frequency
Observed
Lognormal

The amount of ISA in the conterminous U.S. now covers an are equivalent to Ohio.
Impervious Surface Area and StreamflowImpervious Surface Area and Streamflow

There exists a relationship between increase in ISA extent and streamflow.
Impervious Surface Area and StreamflowImpervious Surface Area and Streamflow

In this case, the increase in streamflow is independent of rainfall
Impervious Surface Area and StreamflowImpervious Surface Area and Streamflow

Streamflowand Contaminant TransportStreamflowand Contaminant Transport