j12290.files.wordpress.com · foreword first, let me thank mr. anakala vijay bhaskar reddy, cpim,...
TRANSCRIPT


BASICS OF
SUPPLY CHAIN MANAGEMENT
APICS CPIM Certification Course
Study Guide
Institute of Manufacturing Resource Management of India

Copyright © by IMRMI All rights reserved by IMRMI. No portion of this publication may be reproduced in whole or in part.

Foreword First, let me thank Mr. Anakala Vijay Bhaskar Reddy, CPIM, and Mr. Pradeep V. Khetan, CPIM for giving me the opportunity to write this foreword. I feel honoured and flattered. It is my mission, vision and dream to see my country, India, attain back the leadership position in the world. I am quite confident that we as a nation will do it. Towards achieving this mission, I found APICS body of knowledge quite powerful. I decided to bring this body of knowledge to India, when I took my APICS certification exams in 1985 in the US. The APICS certification programme started in India in 1992. The beginning was tough. Mr. Anand Mahindra may not remember, but I am still grateful to him for sponsoring senior managers of Mahindra & Mahindra and Mahindra Ugine in this programme, as the first few APICS certification candidates. Then came the support of BaaN Company. Mr. S. Ramanathan, then heading BaaN, was (and is) our well-wisher. We received a lot of support from Arthur Anderson (Accenture now). I have not forgotten the support I received from Mr. J. A. Choudhary, who was the chairman of STPI, Hyderabad at that time. I know that I am forgetting many names but the whole success is attributed to lots and lots of people who provided their selfless support to this programme and to me. I am also thankful to each and everyone at APICS head quarters in USA, who gave us tremendous support at every step. Last but not the least, I must thank my wife Shashi, CPIM herself and my brother-in-law Pradeep Khetan, CPIM, who became responsible for running this show, for holding this torch tight and making progress under all adverse conditions. Even though, the programme was highly appreciated from day one, I felt that the cost was little high for an average Indian, which I saw as an impediment in achieving our mission and propagating this body of knowledge at a bigger level. Therefore we tried to keep the cost as low as possible. A significant part of the cost was spent in study material that is imported at a high cost. I always wanted that the study material be made available at a cost that my fellow Indians could easily afford. This was possible if an Indian author developed the study material. I wanted to write a book on APICS body of knowledge myself, but my busy schedule never permitted me to make my dream a reality. The same is true for most APICS certified professionals who lead lives of meeting project deadlines and constantly under pressure. One day, in the year 2002, Mr. Deepak Shikarpur of Computer Society of India, encouraged us to develop some indigenous material on APICS body of knowledge that CSI could use to impart supply chain management domain knowledge to young and budding IT professionals of India. This will help them in taking their services up in the value chain globally. I knew that this task was difficult. So, we invited the individuals with the missionary zeal to come forward and help us in developing this material. Many came forward and provided their invaluable time and knowledge. Among them, it is worth praising few individuals for their selfless dedication and commitment:

Ms. Renu Lata Rajani, CPIM Mr. Anakala Vijay Bhaskar Reddy, CPIM Mr. Satyendra Pal, CPIM Mr. Ismail Dawood Patel, CPIM Mr. Mahiyar Faredoon Adajania, CPIM Mr Shashank Deshpande, CPIM Mr M V U Nageshwara Sharma, CPIM Mr Zubair Haroon Safdar, CPIM Mr Vijay Sambhaji Chavan, CPIM Mr T Venkata Krishna, CPIM Mr Ranjit Gangadharan, CPIM Mr. R V Ramakrishnan Mr C Ravindran, CPIM, CIRM This material is the result of their contribution and effort. I must once again mention here that these individuals are highly successful in their lives and are very busy. In spite of that, they have taken out time to fulfill their duty towards the society. Please join me in saluting these men and thanking them for the gift of knowledge they have given to their fellow professionals. I am sure that this material will be quite useful for all supply chain management professionals whether they are appearing for APICS certification or not. I wish them all the best. Ravindra K. Tulsyan, CFPIM CIRM President Institute of Manufacturing Resource Management of India

Authors
Renu Rajani, CPIM Author : Chapter 4 (Design) Chapter 7 (Execution and Control) Chapter 8 (Performance Measurement) Renu Rajani is Principal Consultant and head of Software Testing Business at vMoksha Technologies for the last 2 years. Earlier she worked for KPMG Management Consulting India for 5 years in the areas of Supply Chain Management, eBusiness, Business Process Reengineering, IT Strategy, IT Outsourcing and Enterprise Resource Planning. Renu is on the Executive Committees of Bangalore Management Association, Indian Institute of Materials Management (Bangalore Branch) and Operations Research Society of India. She is an MBA from Purdue University, USA, a B.Tech in Computer Science and Holds CFA, ACS (Inter), CFP, CPIM, CSTE and PMP Professional Certifications Renu Rajani can be reached at [email protected]
Anakala Vijay Bhaskar Reddy, CPIM Author : Chapter 6 (Planning) Chapter 12 (Physical Distribution) Vijay Bhaskar Reddy is currently working with the R&D Division of Baan Info Systems India as a functional Engineer for Baan ERP and Baan E-enterprise Products. He is with Baan Since Nov 1999 and has contributed to the functional areas of Baan ERP – Order Management (Sales and Purchase), Warehousing, Enterprise Planning, Manufacturing, iBaan e-Sourcing and iBaan e-Procurement. Prior to joining Baan, Vijay served the Indian Navy for three years. He was commissioned in the Indian Navy in 1995. In his tenure in the Navy, he contributed to the areas of Materials Management, Refit coordination and Staff duties. He is a graduate of Industrial and Production Engineering from Nagarjuna University, Andhra Pradesh, and is Certified in Production and Inventory Management (CPIM) by American Production and Inventory Control Society (APICS) Vijay can be reached at [email protected]
Dedication : To my parents ‘(Late) Shri A. Guruva Reddy’ and ‘Smt. A. Rama Lakshmi’.

Satyendra Pal, CPIM Author : Chapter 9 (Fundamentals of Inventory Management) Chapter10 (Inventory Management) Chapter 11 (Purchasing) Satyendra has been working in Supply Chain Management field for more than six years. His experience spreads across Industry, Product and Management Consulting. He is an alumnus of NITIE, Mumbai and is Certified in Production and Inventory Management (CPIM) by American Production and Inventory Control Society (APICS) Satyendra Pal can be reached at [email protected] UTH
Dedication : To my wife ‘Poonam Pal’ for her support during the preparation of the course material.
Ismail D. Patel, CPIM Author : Chapter 3 (Demand Planning) Chapter 5 (Capacity Management) Tumu Venkata Krishna, CPIM Co-Author : Chapter 5 (Capacity Management) Ismail D. Patel has 13 years of professional experience in Manufacturing and Supply Chain Management. His experience in the manufacturing area includes Production planning and control, Process control, Productivity improvement, Automation, Time Study, Method Study, Waste elimination, ISO 9000 QMS documentation and training. His experience in the Supply Chain Management area includes Vendor Selection, Vendor Management, Production part approval process (PPAP), Vendor audit and performance rating, Vendor Improvements, Acceptance Sampling plans, Master scheduling, Inventory management, Stores management, Vendor Capacity Planning, Material Requirement Planning (MRP), Kanban Scheduling. Professional courses to his credit include “ISO 9001 Internal Auditor”, “Six Sigma Black Belt”, “Technical Leadership Program (TLP) from GE (USA)”, “Strategic Cost Manage-ment”, “Activity Based Costing”, “TOC” and “Logistic and Operations Management”.

He is an Industrial Engineering Graduate, holds a Diploma in Materials Management, has done his specialization in Operations Management from (Godrej – S.P. Jain Institute of Management Science) and is Certified in Production and Inventory Management (CPIM) by American Production and Inventory Control Society (APICS) Ismail D. Patel can be reached at [email protected]
- - - - - - - - - - - - - - - - - - - - - - - - - - - - - - - - - - - - - - - - - Venkata Krishna has 6 years of professional experience in various aspects of Supply Chain and Financial Management. He is presently working as Product Analyst with Oracle and is responsible for Financials and Financial Intelligence Tools. Before joining Oracle, he worked as Product Owner in Baan for 2 years. Prior to Baan, he worked with Strabus Software Soluitions where he was instrumental in defining and designing the ‘Production Activity and Control’ and ‘Capacity Management’ products for automobile OEMs. Venkata Krishna has done his MBA in Systems and Finance from Osmania University and is Certified in Production and Inventory Management (CPIM) by American Production and Inventory Control Society (APICS) Venkata Krishna can be reached at [email protected] UTH
Dedication : To all my Teachers. M F Adajania, CPIM Author : Chapter 2 (Management Approaches) M F Adajania is a Senior Manager in the Production Department of Godrej and Boyce. He has 14 years of experience in the production function and is well versed with different enabling techniques viz., ISO 9001, ISO 14001. TQC, JIT, SCM, ERP, PLM having helped implement them at various stages. He is a Mechanical Engineering Graduate from College of Engineering, Pune and is Certified in Production and Inventory Management (CPIM) by American Production and Inventory Control Society (APICS) M F Adajania can be reached at [email protected] UTH

Shashank Deshpande, CPIM
M.V.U. Nageshwara Sharma, CPIM Co-Authors : Chapter 1 (Business Concepts) Shashank Deshpande has 17 years of professional experience in various aspects of Supply Chain Management. He is presently working with Pidilite Industries Limited as Logistics Manager and is responsible for Finished Goods Distribution, Sales Administration and Warehouse Management. He has in-depth experience in Inbound and Outbound Logistics, C&FA Management and Inventory Control. He has successfully implemented IT enabled process improvements and ISO9002 standards. Prior to Pidilite Industries Limited, he has worked with Cadbury for 12 years, Larsen and Toubro for 3 years and 2 years with RPG Cables. He has published articles on various aspects of Supply Chain Management in “Logistics vision” an Indian Express Publication and the topics include VMI, New Products Launch Process, ABC (Activity Based Costing) of Logistics, S&OP (Sales and Operations Planning), Supply Chain Efficiencies in Retailing, etc., Shashank Deshpande can be reached at [email protected] UTH
- - - - - - - - - - - - - - - - - - - - - - - - - - - - - - - - - - - - - - - - - M.V.U. Nageshwara Sharma has 8 years of professional experience in various aspects of Supply Chain Management. He is presently working as Product Analyst with Oracle and is responsible for Warehouse Management Systems (WMS). Before joining Oracle, he worked as Product Consultant for Baan for 5 years. He was instrumental in defining and designing the e-procurement and strategic sourcing products in Baan. Prior to Baan, he worked with MICO where he gained in-depth experience in Inbound Logistics and Inventory Control areas. Nageshwara Sharma had done his BE (Hons) in Metallurgical Engineering from NIT Jaipur, his PGDIE from NITIE Mumbai and is Certified in Production and Inventory Management (CPIM) by American Production and Inventory Control Society (APICS) Nageshwara Sharma can be reached at [email protected]

Reviewers Mr. M V U Nageshwara Sharma, CPIM Reviewer : Chapter 6 (Planning) Mr. Zubair H Safdar, CPIM Reviewer : Chapter 9 (Fundamentals of Inventory Management) Chapter 10 (Inventory Management) Mr. A Vijay Bhaskar Reddy, CPIM Reviewer : Chapter 11 (Purchasing) Chapter 12 (Physical Distribution) Mr. Vijay S Chawan, CPIM Reviewer : Chapter 8 (Performance Measurement) Mr. T Venkata Krishna, CPIM Reviewer : Chapter 5 (Capacity Management) Mr. Ranjit Gangadharan, CPIM Reviewer : Chapter 7 (Execution and Control) Mr. R V Ramakrishnan Reviewer : Chapter 4 (Design) Mr. C Ravindran, CPIM, CIRM Reviewer : Chapter 3 (Demand Planning) A special mention of Thanks to Mr. Vijay S Chawan (chapter 8) Mr. Zubair H Safdar (chapters 9, 10) For their involvement in enhancing the content for the chapters indicated, in addition to the reviews.
Contents Session 1. Business Concepts 1 1.1 Definition of Supply Chain 2 1.2 Elements of Supply Chain 3 1.3 Organizational Dynamics 4
1.4 Impact of Market Environment 5 1.5 Manufacturing Process Choices 7 1.6 Production Environment 8 1.7 Financial Statements 11 1.8 Costs Analysis 13 1.9 Key Terminology 16 1.10 Practice Questions 17
Session 2. Management Approaches 20 2.1 Objectives of MRP II 21 2.2 Principles and Characteristics of MRP II 23 2.3 Objectives of Just-in-time (JIT) 24
2.4 Concepts of Waste and Value added activity 24 2.5 Principles and Characteristics of JIT 25 2.6 Objectives of Total Quality Management (TQM) 28 2.7 Principles and Characteristics of TQM 29 2.8 TQM Impact on System Design and Deployment 32 2.9 Key Terminology 34 2.10 Practice Questions 35
Session 3. Demand Planning 38 3.1 Marketplace – a key driver 39 3.2 Customer Expectations 40 3.3 Customer Relationship 41
3.4 Sources of Demand 41 3.5 Kinds of Demand 41 3.6 Forecast Management 43 3.7 DRP Logic 51 3.8 Key Terminology 52 3.9 Practice Questions 53

Contents Session 4. Design 56 4.1 New Product Design and Introduction 57 4.2 Process Design 58 4.3 Manufacturing and Purchasing Lead Time 61
4.4 Order Quantity / Lot Size / Batch 63 4.5 Safety Stock and / or Capacity 65 4.6 Bill of Materials (BOM) 66 4.7 Item Master / Material Master 67 4.8 Routing / Process 68 4.9 Work Center / Flow Line 68 4.10 Key Terminology 70 4.11 Practice Questions 71
Session 5. Capacity Management 74 5.1 Definition of Capacity Management 76 5.2 Objectives of Capacity Management 76 5.3 Resources 78
5.4 Measuring Available Capacity 79 5.5 Factors affecting Capacity 79 5.6 Capacity Measuring Units 79 5.7 Ways of determining Capacity 81 5.8 Determining Required Capacity 81 5.9 Capacity Requirement Planning (CRP) 83 5.10 Resolving the Differences 86 5.11 Key Terminology 88 5.12 Practice Questions 89
Session 6. Planning 92 6.1 Strategic Planning 95 6.2 Business Planning 98 6.3 Production and Resource Planning 100
6.4 Sales and Operations Planning 116 6.5 Master Scheduling 117 6.6 Rough-Cut Capacity Planning 124 6.7 Material Requirements Planning (MRP) 126

Contents
6.8 Capacity Requirements Planning (CRP) 137 6.9 MRP / CRP in Repetitive Production 141
6.10 Basics of Final Assembly Scheduling (FAS) 143 6.11 Key Terminology 144 6.12 Practice Questions 146
Session 7. Execution and Control 149 7.1 Order Processing 150 7.2 Order Promising 150 7.3 Push / Pull Systems 150
7.4 Scheduling Techniques 151 7.5 Information Docket for Execution 155 7.6 Priority Control 161 7.7 Production Reporting 163 7.8 Measuring Quality 166 7.9 Process Variation 167 7.10 Process Capability 167 7.11 Process Control 167 7.12 Sample Inspection 169 7.13 Key Terminology 170 7.14 Practice Questions 171
Session 8. Performance Measurement 174 8.1 General Principles of Performance Measurements 175 8.2 Types of Measurements 183 8.3 Accounting Based Measures 185
8.4 Activity Based Cost Measures 185 8.5 Productivity Measures 187 8.6 Other Financially Based Measures 188 8.7 Strategic Measures 189 8.8 Performance Measuring Model 194 8.9 MRP / CRP Performance Measurements 195 8.10 Key Terminology 197 8.11 Practice Questions 198

Contents Session 9. Fundamentals of Inventory Management 201 9.1 Introduction to Inventory 202 9.2 Inventory Classification by Categories 205 9.3 Inventory Classification by Functions 207
9.4 Item Costs 208 9.5 Carrying Costs 209 9.6 Ordering Costs 209 9.7 Stock out Costs 210 9.8 Capacity Related Costs 210 9.9 Cost Balancing 211 9.10 Key Terminology 212 9.11 Practice Questions 213
Session 10.Inventory Management 216 10.1 ABC Analysis 217 10.2 Obsolescence of Inventory 219 10.3 Accounting Principles 220 10.4 Physical Inventory Control 222 10.5 Quantity Based Replenishment System 225 10.6 Time Based Replenishment System 227 10.7 Order Quantity Considerations 228 10.8 Economic Order Quantity (EOQ) 229 10.9 Methods for Order Quantity Determination 233 10.10 Demand and Supply Uncertainty 235 10.11 Concept of Safety Stock 235 10.12 Concept of Service Level 236 10.13 Key Terminology 238 10.14 Practice Questions 239 Session 11.Purchasing 242 11.1 Objectives and Importance of Purchasing 243 11.2 Receiving and Analyzing notification of Need 244 11.3 Establishing Specifications 245 11.4 Selecting Suppliers 246 11.5 Supplier Agreements 248 11.6 Order Management 249 11.7 Establishing Performance Criteria 250

Contents 11.8 Key Terminology 252 11.9 Practice Questions 253 Session 12.Physical Distribution 256 12.1 Introduction to Physical Distribution 257 12.2 Distribution Channels 258 12.3 Transportation 262 12.4 Warehousing 265 12.5 Distribution Inventory 268 12.6 Materials Handling 272 12.7 Protective Packaging 273 12.8 Order Processing and Communication 275 12.9 Interfaces 276 12.10 Transportation Costs 277 12.11 Key Terminology 281 12.12 Practice Questions 282 Solutions – Practice Questions 285
BSCM – Sample Test 288
BSCM – Sample Test (Solutions) 319
1
Institute of Manufacturing Resource Management of India
SESSION 1
BUSINESS
CONCEPTS
Session 1 – Business Concepts 2
Institute of Manufacturing Resource Management of India
Organizational Fundamentals In any manufacturing company, material flow can be basically classified into three phases. Flow of raw material from suppliers into the manufacturing facility. Flow of material within the manufacturing facility as they are processed. Flow of finished goods from the manufacturing facility to the end customers.
To be responsive to the global competition, Organizations must be able to manage the complete flow of material from the suppliers, through manufacturing, till the end product reaches the customers. Hence organizations must be involved in the management of management of suppliers who provide direct and indirect material inputs, must increase the manufacturing competitiveness and must effectively manage the network of distribution systems responsible for delivery of the product to end customers. From this realization emerged the concept of supply Chain.
Definition of Supply Chain Supply Chain : The supply chain encompasses all activities associated with the flow and transformation of goods from the raw materials stage (extraction), through to end users, as well as the associated information flows. Material and information flows both up and down the supply chain. The supply chain includes new product development, systems management, operations and assembly, purchasing, production scheduling, order processing, inventory management, transportation, warehousing, and customer service. Supply chains are essentially a series of linked suppliers and customers; every customer is in turn a supplier to the next downstream organization until a finished product reaches the ultimate end user. What is SCM ? Supply Chain Management (SCM) : SCM is the integration of all the activities in the supply chain to achieve a sustainable competitive advantage. Supply Chain can be broadly classified of comprising of three networks – Supplier, Firm and Distribution. The supplier network consists of all organizations that provide inputs, either directly or indirectly, to the focal firm (i.e., the purchaser). Focal firms network is involved in the conversion of input material to the output material. The distributive network consists of

Session 1 – Business Concepts 3
all downstream organizations from the focal firm that ensure that the right quantity of goods is delivered to the appropriate customer location in a timely manner. SCM Vs Logistics Logistics : Logistics, also called as Physical distribution, focuses on the physical movement and storage of goods and materials. Logistics is that part of the supply chain process that plans, implements, and controls the efficient, effective forward and reverse flow and storage of goods, services, and related information between the point of origin and the point of consumption. Typical issues in logistics are evaluation of various transportation options, packaging options, inventory management for different channels, develop and manage networks of warehouses when needed, and manage the physical flow of materials into and out of the organization. Therefore, logistics is a subset in the broader scope of SCM.
Elements of Supply Chain Suppliers, Producers, Distributors, Customers etc., Following are the key elements in Supply Chain Management: Customers Producers (includes Retailer, Distributor, Manufacturer) Suppliers
Customers, Producers and Suppliers can be interconnected in the Supply chain as follows:
r Customer Manufacturing Facility
Supplier
r ------------- Supplier
r
Supplier
r Manufacturing Facility r
r
Supplier
Manufacturing Facility
Supplier ------------- r
r
SupplieInsti
Supplie
Supplie
tute of Manufacturing Resource Mana
Customer
Custome
Custome
gement of India
Custome
Custome
Custome

Session 1 – Business Concepts 4
Institute of Manufacturing Resource Management of India
Interrelationship of the elements A number of companies can be linked in the supply chain network. A supplier to one manufacturing facility can be a customer to another
manufacturing facility and so on.. hence a number of supplier / customer relationships exist in the supply chain network.
A number of intermediaries (distributors, wholesalers, retailers etc.,) form part of the supply chain network.
In defining the supply chain network and the integrations between the elements, the following decisions must be made Identifying the key supply chain elements in the network to link the processes. Identifying the processes that are to be linked with the key elements. Identifying the level of integration and management control to be applied for each
of the processes
Organizational Dynamics Three phases in the evolution of SCM Organizational structure from the fifties to the late eighties was marked by the functional silos where the decisions were made keeping in mind the narrow view of the business functions and the repercussions of the decisions on the other functions were ignored. These often created conflicting objectives within the various functions of a company. The late eighties saw the advent of Business Process Reengineering and ERP concepts. The corporate houses started analyzing the importance of aligning their business with the developments in the information technology capabilities to collaborate effectively with its stakeholders, integrate its functions and decision making and to remain competitive in the market. There are three distinct phases in evolution of SCM: Pre-1970 era : Supply Chain was not considered as a competitive unit. Companies seek more
profit by maneuvering their suppliers and customers. Scientific methods like EOQ and SPC were applied. Companies attempted at Vertical integration – themselves.

Session 1 – Business Concepts 5
Institute of Manufacturing Resource Management of India
1970 – 1980 era : Holding inventory becomes key due to Oil shock TQM and JIT practice becomes popular in Japan Distribution is not yet the focus area MRP systems gain popularity in US and Europe
Post 1980 era : Inventory profits dry up as inflation reigns in US manufacturers embrace JIT philosophy. JIT pushes inventory upstream. Lower setup times, lower batch quantities result in reduction in lead times and
drastic improvement in customer responsiveness. Suppliers and customers considered as part of the organization network. We
against them philosophy fades away. MRP systems give way to MRP II systems, ERP and then to advanced supply
chain systems involving optimization.
Operating Environments
Business Process that connect various elements in SCM Following are the typical business that connect various elements in the SCM: Product Development Order Fulfillment Demand Management Customer Relationship Management
Product Development Process : As customer demands are ever increasing with respect to quality, delivery and options, organizations are increasingly finding it difficult to meet the customer’s expectations. It is often noted that customers want: Faster delivery Least price 0 % rejection rate
Session 1 – Business Concepts 6
Institute of Manufacturing Resource Management of India
And as customer’s preference keeps changing, organizations are forced to reduce the product development lead-time as well as costs. Organizations are increasingly employing the following strategies in the Product Development Process: Integrate customers and suppliers early in the development process Reduce time to market Incorporate supply chain considerations into product design Employ Concurrent Product Development Practices
Order Fulfillment Process : Organizations need to deploy appropriate production systems depending on the Product and demand environment in which they operate. Main objectives, which need to be considered, are: Production must shift from a supply/ push method of operation to a demand / pull
method based on customer needs. Manufacturing process must flexibly respond to market changes with rapid
changeover possibilities for mass customizations. Minimum lot sizes are planned to move toward a make to order environment. Required delivery dates rather than EOQ drive production priorities. Specific supply strategies are developed for each customer segment. Customer needs dates and requirements drive the process. Manufacturing, distribution and transportation plans are integrated.
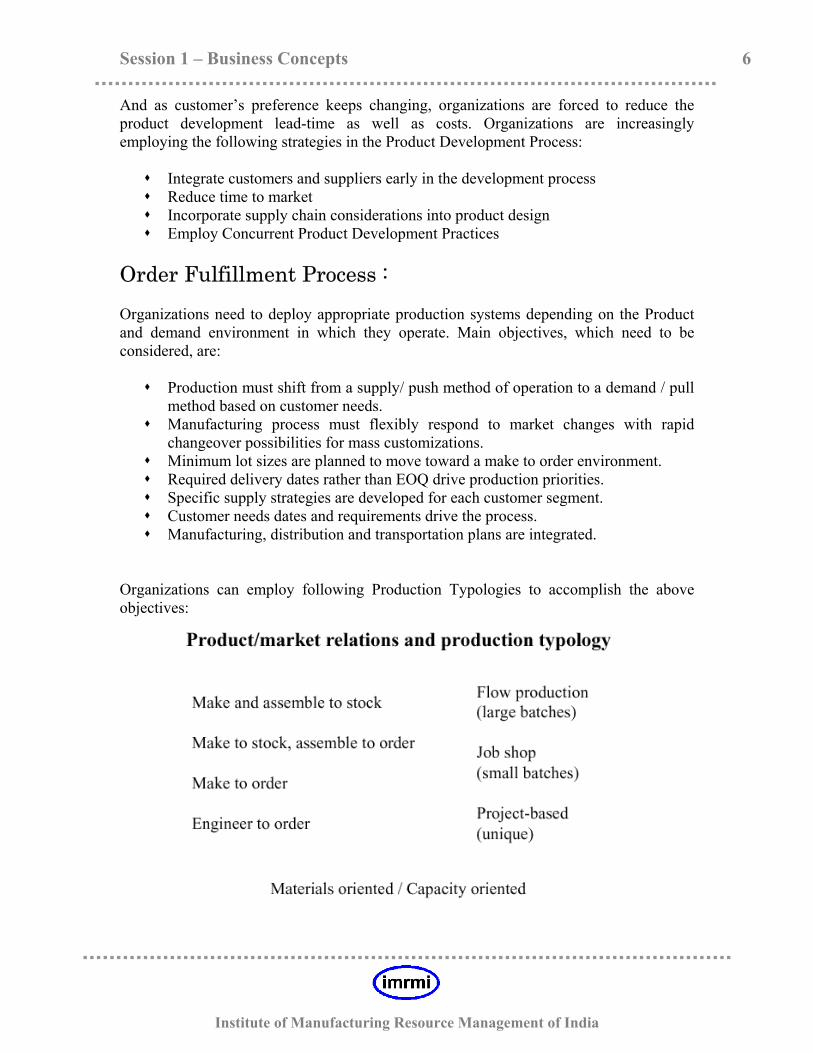
Organizations can employ following Production Typologies to accomplish the above objectives:

Session 1 – Business Concepts 7
Institute of Manufacturing Resource Management of India
Manufacturing process Choices : Considering the demand for the items, range of products, product design, equipment, material movement, etc., manufacturing process choices can be categorized as follows : Lot/Batch/Intermittent Flow Line / Repetitive / Continuous Project
Lot/Batch/Intermittent : In the batch / intermittent process, goods are produced in batches / lots. Work centres are generally organized into groups / departments having the similar equipment an skills. Ex., all milling machines in one group, all Lathe machines in one group etc., These work centers can perform a variety of operations due to the different machine’s and skills present and hence are capable of producing different products. The products move along the various machines in the work centers based on the required operations to be performed on them. These work centers hence comprise of general purpose machinery with the flexibility of making a variety of products. Control of work is managed through the individual work centers for each lot. A B C Flow Line / Repetitive / Continuous : In a flow line / repetitive / continuous manufacturing process, workstations are organized in the sequence needed to make the product. The product moves from one work station to the next along the defined sequence at an almost constant rate. In Out
Work Station 1
Work Station 2
Work Station 3
1 2 3
4 5 6
7 8 9

Session 1 – Business Concepts 8
Institute of Manufacturing Resource Management of India
If the products are discrete ex., automobiles, Refrigerators etc., the process is called repetitive manufacturing process. If the products are not discrete ex., gasoline, oils etc., the process is called continuous manufacturing process. The repetitive / continuous manufacturing process has the following characteristics : Setting up of a flow line is justified only if the demand of the product is large
enough. Only a limited range of products can be produced in each flow line The work stations comprise of specialized machinery and tooling required for the
product Since the flow of products between the work stations is balanced and is nearly
constant, there is a minimal build up of work in process inventory. Project : The Project manufacturing process choice is applicable to huge complex projects. In most cases, the product is developed at a particular location with all the necessary resources and equipment moving to the product development location. Large aircrafts, ship building and construction are examples. Production Environments : On-Time Delivery is one of the key attributes in meeting customer expectations. To cater to the varying needs of different customers, operations must device the required production environment / strategy which will help in minimizing the lead times. Production environment can be classified into Design / Engineer to Order Make to Order Assemble / Package to Order Make to Stock
Design / Engineer - to - Order : ETO environment caters to specific customers’ requirements. The process starts with the preparation of unique / highly customized engineering designs of the product, with the close involvement of the customer. After the designs are finalized, required material is purchased and the components and subassemblies are manufactured. Its during this process that inventories, mostly work in process are maintained. The goods are then assembled and shipped to the customer. Hence the total delivery lead time that has to be optimized in this environment to provide a faster customer service include Delivery Lead Time Designing Purchasing Manufacturing Assembling Shipping

Session 1 – Business Concepts 9
Instit
Make - To - Order : In this environment, the final product is made after the receipt of the customer order. Standard components are purchased / manufactured and are usually stocked as raw material inventory. On receipt of customer orders, the product is made from these standard components and the process may include minor customizations of the design. The main activities contributing to the delivery lead time in this environment include the manufacturing time, assembling time and shipping. Delivery Lead Time Assemble / Package - To - Order : In this environment, the standard components and sub-assemblies are manufactured and stocked in the form of component / sub-assembly inventories. On the receipt of the customer orders, these standard components / sub-assemblies are assembled according to the configurable options specified by the customer. There is no design and product manufacturing activity involved and hence the delivery lead time includes the time to assemble and ship. Delivery Lead Time Make - To - Stock : In this environment, the products are completely manufactured and the finished goods are stocked as end item / finished goods inventory. On the receipt of customer orders, the goods are packed and shipped to the customers and hence the delivery lead time in this environment comprises of only the shipping time. Delivery Lead Time
Manufacturing Assembling Shipping Raw material Inventory
Assembling Shipping
Standard Components /
Sub-assemblies Inventory
Shipping
Finished Goods
Inventory
ute of Manufacturing Resource Management of India

Session 1 – Business Concepts 10
Institute of Manufacturing Resource Management of India
Demand Management Process : Organizations have to forecast demand accurately. This will result in Synchronized flow of products and materials to customer demand Reduction of variability
Organizations should combine accurate demand forecasting with marketing plans, inventory management and sales projections to gain an advantage over the competitors. Better demand management process utilizes information resources to reduce costs, improve customer service and tap into hidden value throughout the supply chain. In this process customer demand is continuously gathered, complied and renewed in order to match the organization’s supply capability with the requirements of the market. The process has the following main objectives: Demand requirements and Supply capabilities are continuously modeled using
point of sale and “key” customer demand data. Market requirements and production plans are coordinated on an enterprise-wide
basis. Multiple sourcing and routing options are considered at the time of receipt of the
order. Demand and production rates are synchronized and inventories need to be
managed. Customer Relationship Management Process : Organizations should maximize customer service as a means of providing focused point of contact for all customer enquiries in order to insulate them from the complexity of a large, multi-divisional corporation. Main objectives of a Customer Relationship Management process are: Customer service provides a single source of customer information, a point of
contact for administration of the product / service agreement. Instant promising / availability information is available for the customer On-line/real-time access to product and pricing information assists customers with
quick order placement. On-line/real-time access to order status information is available to support
customer order enquiries. Procurement Process : Organizations maintain relationships with major suppliers, which are corporately managed; in strategic alliances while purchase order transactions become simplified and integrated with supply process.
Session 1 – Business Concepts 11
Institute of Manufacturing Resource Management of India
Main objectives of an efficient Purchase Process are: Strategic plans of suppliers and organization are aligned to focus on resources on
holding down costs and developing new products. Supplier categorization and management is implemented on a corporate global
basis, with purchasing in a strategic contracting role. Purchase Order transactions are integrated with supply process to improve
productivity and all areas of supplier performance.
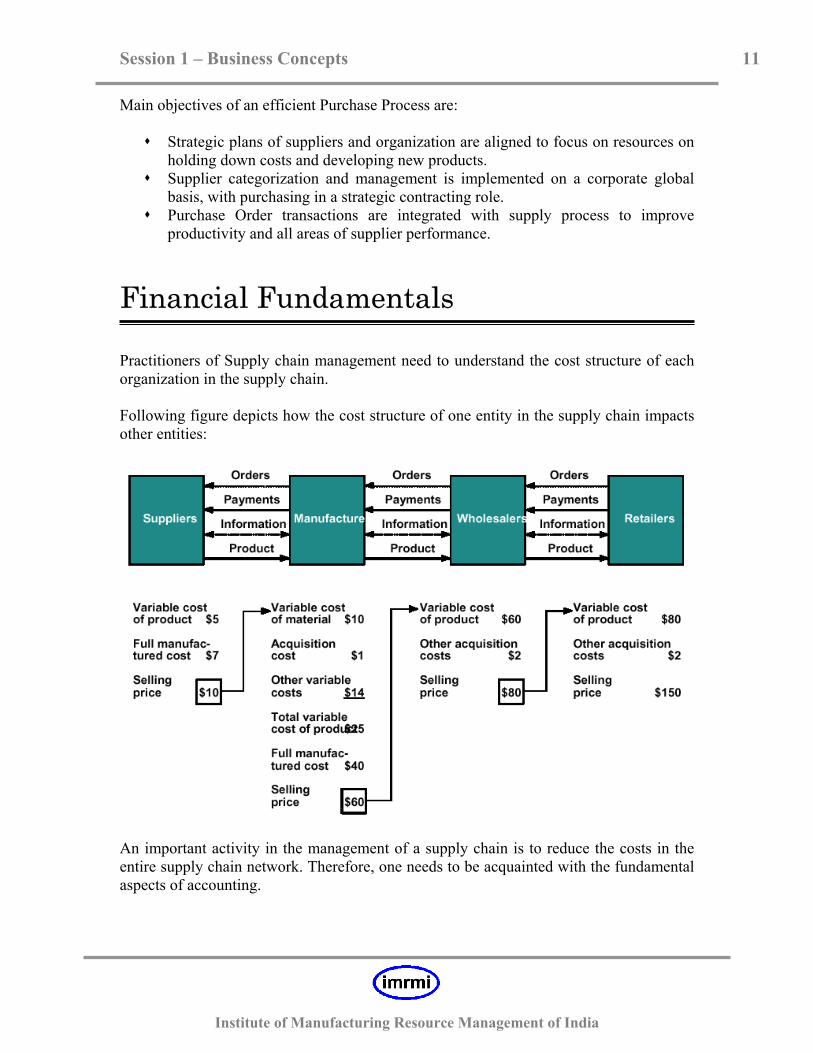
Financial Fundamentals Practitioners of Supply chain management need to understand the cost structure of each organization in the supply chain. Following figure depicts how the cost structure of one entity in the supply chain impacts other entities:
An important activity in the management of a supply chain is to reduce the costs in the entire supply chain network. Therefore, one needs to be acquainted with the fundamental aspects of accounting.

Session 1 – Business Concepts 12
Institute of Manufacturing Resource Management of India
Accounting Cycle : Major steps of Accounting cycle are: Analyze Business Transactions Record entries in Journal Post entries to Ledger Prepare a Trial Balance Prepare Adjusting entries and Post to the Ledger Accounts Prepare Adjusted Trial Balance Prepare Financial Statements ▫ Profit and Loss Statement ▫ Balance Sheet Statement
Closing entries are made Balance Sheet It is a financial statement that summarizes organization’s financial position at a specific point of time. It’s a numeric illustration of the balance between a firm’s assets on one hand and its liabilities and owner’s equity on the other hand in a given point of time. Assets: The resources the business owns. Assets are listed in the order of their liquidity – the speed which they can be converted into cash. Types of Assets are: Current Assets – Assets that can be quickly converted into Cash. Ex: Inventory Fixed Assets – Assets that are held or used for a period longer than a year. Ex:
Plant and machinery. Intangible Assets – Assets that do not exist physically but have a value based on
rights or privileges they confer on the firm. Ex: Brand Value. Liabilities: What a firm owes, its obligations Liabilities are listed in the order that they are scheduled to be paid. Types of liabilities are: Current liability ▫ Debts to be re-paid within a year or less. ▫ Ex: Accounts payable, Income Tax payable, Current portion of long term debt
Long term liability ▫ Debts that need not to be paid within a year ▫ Ex: Mortgages, bonds and long-term loans.

Session 1 – Business Concepts 13
Institute of Manufacturing Resource Management of India
Owner’s equity : The owners investment after all obligations have been met. Accounting equation : Assets = Liabilities + Owner’s Equity The Income Statement This summarizes the firm’s revenues and expenses and shows total loss or profit during a specified accounting period. This is also called as Profit and Loss Statement or Earnings Statement. Revenues : All of the amount earned by a firm from all sources (e.g., selling goods, providing services, investing on stocks etc.,). Gross sales – Total value of all goods and services sold during accounting period. Net Sales – The adjusted value after subtracting sales returns, sales allowances
and sales discounts. Expenses :
Cost of Goods Sold ▫ Beginning inventory plus net purchases less ending inventory
Operating Expenses ▫ All other business Costs ▫ Selling Costs – Marketing related activities cost ▫ General Expenses – Costs for managing the business
Net Profit or Loss : The profit earned (cash surplus) or the loss (cash deficit) suffered by the organization during an accounting period, after all expenses have been deducted from revenues. Financial Analysis Financial Analysis enables SCM practitioner to analyze the cost structure of the supply network.

Session 1 – Business Concepts 14
Institute of Manufacturing Resource Management of India
Some of the financial ratios widely used are: Liquidity ratios Profitability ratios Activity ratios Leverage ratios Valuation ratios
Liquidity Ratios : Liquidity Ratios are used to examine the firm’s ability to meet short-term cash outflow needs. Current Ratio: indicator of company’s ability to pay it’s short term liabilities
Current Ratio = current assets/current liabilities Quick (acid test) Ratio: Measures ability to pay off short term obligations excluding
inventory Quick (acid test) Ratio = (current assets-inventory)/current liabilities
Inventory to net working capital: Measure of inventory balance, shows if balance
can be threatened by unfavorable changes in inventory. Inventory to net working capital = Inventory/(current assets-current liabilities)
Cash Ratio: Shows how much of the current obligations can be paid from cash or
near-cash assets. Cash Ratio = (cash + cash equivalents)/current liabilities
Profitability Ratios : Profitability Ratios are ratios used to measure the profitability of the firm. Net Profit Margin: shows how much after tax profits are generated by each dollar of
sales. Net Profit Margin = Net profit after taxes/net sales
Gross Profit Margin: Indicates the total margin available to cover other expenses
beyond cost of goods sold, and still yield a profit. Gross Profit Margin = (sales-cost of goods sold)/net sales
Return on Investment (ROI): a measure of a company’s efficiency, it shows the
return on all assets under it’s control. Return on Investment (ROI) = Net profit after taxes/total assets
Return on Equity (ROE): measures rate of return on the book value of shareholder’s total investment in the company. Return on Equity (ROE) = Net profit after taxes/shareholder’s equity

Session 1 – Business Concepts 15
Institute of Manufacturing Resource Management of India
Earnings Per Share (EPS): Shows the after-tax earnings generated for each share of common stock. EPS = (Net profit after taxes-preferred stock dividends) / (Average number of common shares)
Activity Ratios : Activity Ratios are ratios used to measure the efficiency with which the firm conducts its business. Inventory Turnover: measures number of times that average inventory turned over
during a period of time. Inventory Turnover Ratio = Cost of Goods Sold (COGS) / Average Inventory (inventory of finished goods)
Accounts Receivable Turnover: the average length of time it takes to collect the sales made on credit. Accounts Receivable Turnover =Sales/Average Accounts Receivable (Sales/Accounts receivable)
Days (Inventory/Receivable) Outstanding: measures number of days each is outstanding. Days (Inventory/Receivable) Outstanding =365/Inventory Turnover; 365/Accounts Receivable Turnover
Total Asset Turnover: a measure of the utilization of all the firm’s assets. Total Asset Turnover = Sales/total assets during period
Leverage Ratios : Leverage Ratios are ratios used to measure firm’s ability to meet its long-run debt service obligation. Debt-to-assets ratio: measures extent to which borrowed funds have been used to
finance the firm’s operations. Includes long term, short-term debt. Debt-to-assets ratio = Total debt/total assets
Debt-to-equity ratio: Provides another measure of the funds provided by creditors
vs. funds provided by owners. Debt-to-equity ratio = Total debt/total stockholder’s equity
Valuation Ratios : Valuation Rules are used to describe the way the market values the firm and the way that certain characteristics are related to the value of the firm. • Price per Earnings Ratio = Current market price per share/after tax earning per
share

Session 1 – Business Concepts 16
Institute of Manufacturing Resource Management of India
Key Terminology 01) Activity Ratios 02) Assets 03) Assemble / Package – to – Order 04) Balance Sheet 05) Customer 06) Customer Relationship Management 07) Distributors 08) Design / Engineer – to – Order 09) Delivery Lead Time 10) Demand Management 11) Expenses / Costs 12) Flow line / Repetitive / Continuous Manufacturing 13) Income Statement 14) Logistics 15) Lot / Batch / Intermittent Manufacturing 16) Liabilities 17) Liquidity Ratios 18) Leverage Ratios 19) Manufacturer / Producer 20) Make – to – Order 21) Make – to – Stock 22) Order Fulfillment 23) Owner’s Equity 24) Product Development 25) Project Manufacturing 26) Procurement 27) Profit and Loss 28) Profitability Ratios 29) Revenues 30) Supplier 31) Supply Chain 32) Supply Chain Management 33) Valuation Ratios

Session 1 – Business Concepts 17
Institute of Manufacturing Resource Management of India
Practice Questions – Session 1 Question 1 : Which of the following are elements of a supply chain ? A) Customers
B) Manufacturers C) Distributors D) All the above
Correct Answer is: ------------------------------------------------------------------------------------------------------------ Question 2 : Which of the following is not true about a supply chain :
A) A number of companies can be linked in the supply chain network B) A supplier to one manufacturing facility cannot be a customer to another
manufacturing facility C) A number of intermediaries (distributors, wholesalers, retailers etc., )
form part of the supply chain D) All the above are true
Correct Answer is: ------------------------------------------------------------------------------------------------------------ Question 3 : Strategies for the product development process to meet customer expectations does not include ?
A) Decoupling customers and suppliers early in the development process B) Reducing time to market C) Incorporating supply chain considerations into the product design D) Employing concurrent product development practices
Correct Answer is: ------------------------------------------------------------------------------------------------------------ Question 4 : The manufacturing process choice in which the work centers are organized into groups / departments having the similar equipments and skills is :
A) Flow line B) Repetitive C) Intermittent D) Project
Correct Answer is: ------------------------------------------------------------------------------------------------------------

Session 1 – Business Concepts 18
Institute of Manufacturing Resource Management of India
Question 5 : Which of the following is not a characteristic of repetitive / continuous manufacturing process ?
A) Setting up of a flow line is justified only if the demand for the product is large enough
B) Broad range of products can be produced in each flow line C) Work stations comprise of specialized machinery and tooling required for
the products D) Since flow of products between the workstations is balanced, there is
minimal build up of inventory Correct Answer is: ------------------------------------------------------------------------------------------------------------ Question 6 : Delivery lead time in a Engineer-to-order environment consists of :
A) Only Designing B) Designing and Manufacturing C) Designing, Purchasing, Manufacturing, Assembling and Shipping D) Designing, Manufacturing, Assembling and Shipping
Correct Answer is: ------------------------------------------------------------------------------------------------------------ Question 7 : In which of the following environments, there is no / least involvement of the customer in the product design :
A) Engineer to order B) Make to order C) Make to stock D) Assemble to order
Correct Answer is: ------------------------------------------------------------------------------------------------------------ Question 8 : Manufacturing, Assembling and Shipping constitute the deliver lead time for which of the following environments:
A) Engineer to order B) Make to order C) Assemble to order D) Make to stock
Correct Answer is: ------------------------------------------------------------------------------------------------------------

Session 1 – Business Concepts 19
Institute of Manufacturing Resource Management of India
Question 9 : Which of the following accounting equation is correct :
A) Assets = Liabilities – Owners’ Equity B) Assets = Liabilities + Owners’ Equity C) Owners’ Equity = Assets + Liabilities – Cost of Goods Sold D) Owners’ Equity = Assets + Liabilities + Cost of Goods Sold
Correct Answer is: ------------------------------------------------------------------------------------------------------------ Question 10 : Inventory Turnover Ratio is :
A) Cost of Goods Sold / Average Inventory B) Average Inventory / Cost of Goods Sold C) (Cost of Goods Sold + Net Sales) / Average Inventory D) (Cost of Goods Sold – Net Sales) / Average Inventory
Correct Answer is: ------------------------------------------------------------------------------------------------------------
20
Institute of Manufacturing Resource Management of India
SESSION 2
MANAGEMENT
APPROACHES

Session 2 – Management Approaches 21
Institute of Manufacturing Resource Management of India
Management Approaches - Overview In today’s world there are plenty of approaches to run a business. Some focus on quality, some on customers, some on HR. But of all these solutions, three approaches stand out as the most encompassing, covering the entire gamut of a company’s operation. You could not term them as solutions to your current problems, for they are more than solutions, they are a way of life. These are MRP-II, Just in Time (JIT), Total Quality Management (TQM). Judiciously applied in tandem these approaches can create wonders. In this session we will touch upon the salient features of each of these, and in the end learn which approach is more suitable under a particular environment.
Manufacturing Resource Planning (MRP II)
Objectives The base block of any company is the strategic business plan. The strategic business plan incorporates the plans of marketing, finance, and production. Marketing must agree that its plans are realistic and achievable. Finance must agree that the marketing plan is financially viable, and production must agree that it can meet the desired demand. The manufacturing planning and control system is a master game plan for all functions of the company. This fully integrated planning and control system is called “manufacturing resource planning-II” or MRP-II. “II” to differentiate it from MRP i.e. Materials requirement planning. The MRP-II activities in the below diagram can be roughly broken up in to three parts. The front end : These activities consist of production planning and Master production schedule. These are basically the plans on which your whole system will be based. The engine : These consist of Materials requirement planning (MRP), Detailed capacity planning (CRP), and its result detailed material and capacity plans. The Back End : It consists of the shop floor control system and the vendor plans. This is where the action takes place, and all the detailed planned is brought into fruition. Monitoring is very important and any deviation has to report “up” to keep priorities current.

Session 2 – Management Approaches 22
Institute of Manufacturing Reso
Process flow Feedback flow Closed loop MRP
BUSINESS PLAN
SALES AND OPERATING PLAN
M’KT PLAN PROD’N PLAN
SALES PLAN MA
MATERIALS REQU
R
RESOURCE OK
PURCHASING
PERFORMANCE M
Y
NO
YESurce Management of India
STER SCHEDULE
IREMENT PLAN
ESOURCE OK
PROD ACTIVITY CONTROL
EASURES
ES
NO

Session 2 – Management Approaches 23
Institute of Manufacturing Resource Management of India
Principles and Characteristics Integrated Planning Structure Fully integrated: The MRP-II system is intended to be a fully integrated system that works from top down and has feedback from bottom up. Taken up with simulations it is a top management-planning tool. MRP-II requires all functions to interact through this system, any change in plan in any of the functions requires validation through MRP-II. Cross-functional Integration Coordinate between functions: MRP-II is fully integrated and cross functional in nature. MRP-II provides coordination between marketing and production. All the functions viz. Marketing, Finance and Production agree on a workable plan, which is the production plan. Marketing and production must work together on a daily or weekly basis to adjust the plan as changes occur. Generally this kind of changes is made through MPS, however care must be taken to respect the time fences when any changes are made to meet the customer demand. The nature of changes could be from changing the batch size to order cancellation or delivery dates. Closed Loop – Feedback Feed back loop: As seen from the diagram MRP-II provides feedback from within its various parts, making it closed loop. At every stage resource availability, through modules like, Rough cut capacity planning (RCCP), Capacity resource planning (CRP) is checked. Any deficit or inability to make the priority true calls for a change in plan or some alternate means to meet the demand. What – if Simulation Simulations: Another ability of MRP-II system is a what-if analysis. This tool can be used early in the planning stage to find out what resources are required beforehand. Forewarned being forearmed. This can be done by simulating the desired conditions and getting to know the effect of pre-supposed conditions down the line on say a critical resource like material, or a work center or for that matter on capacity.

Session 2 – Management Approaches 24
Institute of Manufacturing Resource Management of India
Just – in – Time (JIT)
Objectives As a philosophy initially it is difficult to understand what is JIT. JIT is linked with the idea of high velocity manufacturing. Basically if factory is a pipe and raw material is water, which you want to flow from one end to the other, then our aim is to reduce the time gap of payment to the supplier on one end and receipts from the dealer at the other. Hence we need to move materials and assemblies through the pipeline more and more quickly. Which basically means reducing the diameter of the pipe. With a narrower pipe we can have the same rate of shipments if we accelerate the velocity of “water” through the pipe. A faster throughput time also allows us to be more responsive to any change in customer demands. Ideally we would like to have the “diameter of the pipe” as low as possible, in the ultimate situation a single piece flow made instantaneously. Till we as mortals reach that goal we have to pass through some intermediate phase. As we go on reducing we invariably come across constraints. First that constraint must be resolved before we proceed to do any further reduction. We must therefore employ methods that determine the location and cause of constraints. Once we remove that constraint we can safely move ahead on our journey. This “continuous improvement” is an important arm of JIT. Embedded in this endeavor is “elimination of waste”. So basically JIT philosophy is nothing but making as much as possible with as little resources. To achieve that, various methods like pull systems, work cells, flexible manufacturing, etc are used in JIT.
Concepts of Waste and Value added Activity Before we go on to have a look at the various principles and characteristics of JIT, we must understand what constitutes wastes, understanding wastes in manufacturing is understanding the core of JIT. Waste can be defined as any activity that does not add value for the customer. It is the use of resources in excess of theoretical minimum, be it manpower, material, equipment, time, space etc. Waste can be excess inventory, setup times, inspection, material movement etc.

Session 2 – Management Approaches 25
Institute of Manufacturing Resource Management of India
Shingeo Shingo, one of Japan’s founding fathers of improved manufacturing techniques, lists his Famous Seven Wastes. They are…
◊ Waste of over production…. Making products which are not needed in the immediate future. This leads to locked inventory, extra material handling, ageing, and can be very costly.
◊ Waste of waiting….. These are of two kinds, that of the operator and that of the
material.
◊ Waste of transportation… Moving and storing components add cost not value, and hence should avoided as far as possible.
◊ Waste of stocks… Any inventory costs money to carry.
◊ Waste of motion… Waste is added if the method of working by the operator
needs unnecessary motions like searching for tool, walking, are all wastes of motion.
◊ Waste of making defects… This not only costs money but also interrupts the
flow of production.
◊ Waste of processing itself… When the product should not be made or the process should not be used. The best process is the one that consistently makes the product with an absolute minimum of scrap in the quantities needed.
Added to this is the waste caused due to poor product specification and design. It is the responsibility of the management to establish policy for the market segment, which the company wants to serve. A mistake in this fundamental decision can sound the death knell of the company even if its other functions are working efficiently.
Principles and Characteristics Due to application of JIT and its philosophy, a way of doing things differently than previous one emerges, these give rise to many elements which are a part of JIT environment. Remember these elements are not the ends in itself, but rather the means in achieving the JIT philosophy. Broadly these can be grouped as follows. Flow Manufacturing Flow manufacturing: Repetitive manufacturing is the production of discrete units on a flow basis. In these types of systems machines needed to make a unit are arranged close

Session 2 – Management Approaches 26
together and the work flows from one stage to another. These are suitable for repetitive manufacturing type of environment where the process stages are fairly constant.
WORKSTATIONS Proc Flexibdesirabmix ofpiece fchange Quick advanta
◊ ◊ ◊ ◊ ◊
Qual Qualitstoppinrespons Cont Contin“How as simpat a timanswerstock, processof the improv
INPUT
Institute of Manufacturing Resource Management
ess Flexibility ility: In changing times where it is difficult to forecasle to have systems where the company can react swiftly to their product. To achieve this operators and machine muslow in JIT aids in achieving flexibility and to achieve m over are essential.
change over means shorter set up times. Shorter setup timges :
Reduced order quantity Reduced queue and manufacturing lead time Reduced WIP Improved quality Improved process flow.
ity at Source y at source: Means doing it right for the first time and ifg the process and fixing it. People become their ownible for the quality of what they produce.
inuous Improvement uous Improvement: The ultimate goal of JIT is to elimina
can we use JIT to continuously improve quality delivery anle as the philosophy of JIT. We must learn to economicale. The starting point is the question “Is the inventory g
is yes then what stops us from making the same quality mand so we proceed on our journey till we remove bottle n, quality problems, maintenance problems, setup problemsjourney i.e. zero inventory. This approach unleashes thement since as we go on we expose layer after layer of con
1 2 3 4
OUTPUTof India
t customer tastes it is changes in volume and t be flexible. The single achine flexibility quick
es have the following
something goes wrong inspectors, personally
te waste the question is d cost?” The answer is
ly manufacture one less rater than one?”, if the aterial with one less in
ecks like uneconomical , until we reach the end e power of continuous straints.

Session 2 – Management Approaches 27
Institute of Manufacturing Resource Management of India
Supplier Partnerships Supplier improvements: In JIT supplier is not somebody to be squeezed to get the lowest price or the best bargain. Those are important, but the approach is to treat suppliers as partners in the journey of improvement. The result is long term commitment, trust and shared vision. The JIT Company could go as far ahead as whetting the suppliers operation and suggest beneficial improvements, on the other side the supplier could suggest beneficial changes in the product. This type of mutual working results in a win-win type of situation. Employee Involvement Employee involvement: A successful JIT environment can only be achieved by the cooperation and involvement of everybody in the organization. Instead of receiving orders the employee takes responsibility in improving processes, correcting deviations, suggesting changes, doing preventive maintenance. An important aspect in a JIT environment is flexibility, which brings up the question of training. De-skilling of operation can also help. Total Productive Maintenance Total Productive Maintenance: The general tendency for maintaining a machine is to adopt a strategy of “If it ain’t broke don’t fix it”. This leads to disruption in production, defective parts, delayed deliveries and added costs. The next stage is “Preventive maintenance” where using some statistical means or historical data failure of machine parts is predicted and before that actually happens you go ahead and replace that part e.g. A bearing or a tool. Anyway it is important in the sense that JIT means minimum inventory and little buffer is available. The concept of “Total productive maintenance” is one stage above total preventive maintenance it is “preventive maintenance plus continuing effort to adapt, modify, and refine equipment to increase flexibility reduce material handling and promote continuous flow” Pull System Pull systems: In the general way of working one work center produces to keep it in stock and the subsequent work center takes material from stock. In the pull systems the first work center will not make any thing until it gets a signal from the subsequent work center, this signal could be a “kanban” card an empty trolley or location. Basically it is a two bin, fixed order quantity replenishment system.

Session 2 – Management Approaches 28
Institute of Manufacturing Resource
Work Cells Work cells: Many companies do not have the volumThe layout used is a functional type of layout. Theseconsiderable material handling. Such type of layouused process flow. Like if say even in a batch type eof the flow is in a particular sequence then you can aparticular sequence to mimic flow manufacturing, theunique arrangements of machines that resemble flowof environment is known as work cells and has all the
Total Quality Manageme
Objectives In today’s world customer is king. You can ignore tthe monopolistic days where customer would take wToday he wants goods on his own terms and that toomeans doing things that add value to the product, means “meeting or exceeding customer’s exp“conformance to requirement” (Crosby’s definition)that define quality. And why “Total”? Total means bnot just in product or manufacturing, be it in saleschallans. Every activity has to be viewed from custoof waste, and ‘filled ‘ with quality--- “TOTAL”. Quality does not mean “best” in any sense, but “besta matter of fact JIT and TQM go hand in hand togecoin, one uncovers problem and the other solves it. I
W/C A
STOCK
W/CB
W/CB
W/CA
Empty container –signal to makeManagement of India
e to justify setting up a line layout. involve long queues, high WIP, and t can be improved using commonly nvironment if it is detected that 80% rrange most of your machines in that rest can form a separate unit. These manufacturing in a batch shop type advantages of flow manufacturing.
nt (TQM)
he king at your own peril. Gone are hatever the manufacturer dishes out. if he sees value in it. Ultimately that from customer’s viewpoint. Which ectation” (Juran’s definition), or . These are only some of the words ringing quality into every aspect and or even a lowly operator punching mer’s perspective and hence devoid
” for certain customer conditions. As ther. They are two sides of the same t would be foolish to implement JIT

Session 2 – Management Approaches 29
Institute of Manufacturing Resource Management of India
without TQM. There is no sense to arouse a lion if you cannot make it disappear. TQM is the process that makes the lion of constraints disappear. You can implement TQM without JIT but experts agree that it is not as effective. Implementing JIT alone will give you paises whereas implemented together will give you rupees. The sum of the power of both these processes is greater than their individual parts.
Principles and Characteristics Problem Solving Tools So as we have seen in the last section TQM is a way of overcoming obstacles. Now the principle behind problem solving is simple, basically it consists of four steps
◊ Measure ◊ Record ◊ Analyze ◊ Do
This cycle is also known by many other names like Shewart cycle (PDCA) etc. The cycle can be used via the following statements:
◊ We will take no measurements without recording the results. ◊ We will not record results without analysing them. ◊ We will not analyse results without acting on them. ◊ We will not act without measuring the results of our actions.

Session 2 – Management Approaches 30
Institute of Manufacturing Resource Management of India
This cycle provides the formal method for improving every aspect of our business based on evidence and analysis. It can be used in all areas of the company. Now there are some formal, time tested methods for gathering evidence and analysis, and are in the region of identifying a problem and analyzing, and they are known as “The Seven Quality Tools”.
A brief description of each is as follows – Flow Charts… It is possible to create a flow chart of any process or operation to show how work happens. This is particularly useful for quality improvement because when you can see what happens in a process you can begin to improve the process. Check Sheets… One of the problems of identification is that we rarely know where to begin, we all tend to have ideas but there is little hard evidence and we act on hunches rather than on evidence. The action cycle says that we shall not measure without recording and check sheets provide an easy way to record and analyse your results. A check sheet is basically a form that you fill in with the results of your observations. It must include who collected the data as well as the time it was collected. Check sheets also act as the start to the analysis process and can help to structure your data prior to the analysis process Pareto Principle…This is the classic 80:20 rule that many of you will be familiar with i.e. in broad terms: 80% of your installation problems concerns will come from 20% of the jobs, 80% of your concerns will come from 20% of your operators (or operations or products), 80% of your profits will come from 20% of your customers. Identification and analysis via Pareto enables us to separate the 'the vital few' from the 'trivial many' and to take action for the best returns. Pareto is probably the most powerful tool you can find for making a hero of yourself in quality improvement.

Session 2 – Management Approaches 31
Institute of Manufacturing Resource Management of India
Cause and Effect Charts…These are also known as Fishbone Diagrams or Ishikawa Diagrams and are used to list possible causes and to rate their importance. The basic idea is to take a range of broad headings (such as Men, Materials, Methods, Machines and Measures) and to use these to group possible influences on the end result. The method is a very specific development of 'brainstorming' that is targeted on improving an effect by listing all the possible causes. Cause and effect charts are best used by actual operators who have real knowledge of the process. The method can be used as a sophisticated way of 'picking the brains' of the best operators to give real process improvements. Statistical Process Control (SPC)… Statistical process control recognizes that any manufacturing process is naturally variable and that it is impossible to predict the value of any one characteristic at any one time. Statistical methods take simple process data and use it to describe the process itself rather than describing each individual article. Control the process quality and the product quality automatically follows. SPC is a unique tool to give confidence that parts are being produced within tolerance, without having to measure every part. SPC hands control back to the operator and acts as a 'feed forward' control. Scatter Plots… Scatter plots are a quick and dirty way of seeing if two variables are related. The idea is not to plot a graph and establish a direct relationship but simply to get some points on a piece of paper and see if the cause and effect are related. Histograms… Histograms are a form of graph that can communicate a lot of information at a glance. They are basically a form of bar chart based on the recorded values of a variable and are probably the easiest graph type to under-stand. The value of histograms lies in the ease of understanding for all levels of the workforce. Cost of Quality Quality costs fall into two categories, the cost of failure to control quality and the cost of controlling quality. Cost of Failure : The cost of failing to control quality are the cost of producing material that do not confirm to quality standards, they are again of two types
◊ Internal failure costs : The cost of correcting quality problems while the product is in the plant. Generally this cost includes cost of scrap, rework, spoilage etc.
◊ External failure costs : These are the costs of correcting problem after goods
having been delivered to the customer. These are the warranty cost, field servicing cost, cost of replacement and all other costs associated in trying to keep a customer satisfied. In real terms external cost is nothing but a reflection of internal cost. If internally there are so many defects that it becomes humanely impossible to trap, these reflect in high external costs.

Session 2 – Management Approaches 32
Institute of Manufacturing Resource Management of India
Cost of controlling Quality : These can again be broken down into two parts.
◊ Preventive costs : This is the cost of doing avoiding trouble by doing job right the first time. They include training costs, costs associated with SPC, machine maintenance, and quality planning costs. If any cost is desirable this is it.
◊ Appraisal costs : The costs associated with checking, auditing quality in an
organization. Inspection is a non value added activity, and hence costs added in inspection are also of no value.
Employee Empowerment TQM is organization wide and everybody’s responsibility. In a TQM environment, people come to work not only to do their jobs but also work to improve their jobs. To get commitment from an employee and to gain confidence, a organization has to work for the employee on the following fronts
◊ Training ◊ Organization ◊ Local ownership
Impact of Environment on System Design and Deployment Now after learning about management choices, their philosophies and their principles, the question naturally arises which choice to apply in which circumstance. Today customer is king, reams and reams of paper have been written about him. So when an organization ignores quality it does so at its own peril. Naturally under these circumstances TQM becomes the most favored tool of the management. You can say that whatever the environment, be it service or manufacturing, TQM can be and should be applied. Today quality is no longer an order winner, it has to be considered as an order qualifier i.e. among the basic must’s in a product necessary before a customer will even consider it for buying. However TQM in application with JIT gives many fold returns. So the question now is when to apply JIT or when to apply MRP or can they be jointly applied? MRP : MRP is a forward looking system, it is based on MPS, which tells which end products to make, while the MRP projects the components required for making them. MRP can be very effective in a system where there is great deal of variability and uncertainty. It is

Session 2 – Management Approaches 33
Institute of Manufacturing Resource Management of India
also effective in process or product design changes. However it is very data dependent, lots of data need to be fed, and the data fed should be accurate too. Another major drawback of an MRP system is in designing it. MRP can be designed to accept inefficiencies. Like if we expect late deliveries, we can use safety stock, if we expect to pull up the MPS, we use safety lead time. MRP is just a planning tool and certainly not an improvement tool. JIT : JIT calls for smoothening of product flow on the shop floor, and hence prefer a stable environment (as opposed to MRP). This is natural as kanban is in a way a reactive system and very little is planned ahead. This can work to its disadvantage in case of environment with high volatility like quickly changing products, changing customer demands, extensive and frequent changes in product design. Hybrid Systems : To get the best of both worlds the combination of these two systems is quiet common. An MRP system is used for advance planning, including long lead time parts, adding resources, and introducing new products. Once the MRP has the material and resources lined up. I.e. having taken care of the front end, JIT can take care of the back end, by being used as an execution system, bringing with it the characteristics of rapid response to customer orders, improved inventory levels, continuous improvement, people involvement throughout the process
Session 2 – Management Approaches 34
Institute of Manufacturing Resource Management of India
Key Terminology 01) Adding Value 02) Empowerment 03) External Failure Cost 04) Flexibility 05) Internal Failure Cost 06) Kanban 07) Performance 08) Prevention Cost 09) Pull System 10) Quality 11) Quality at Source 12) Quick Changeover 13) Statistical Quality Control (SQC) 14) Total Productive Maintenance (TPM) 15) Work Cells

Session 2 – Management Approaches 35
Institute of Manufacturing Resource Management of India
Practice Questions – Session 2 Question 1 : Which of the following is a characteristic of MRP II : A) Integrated Planning Structure
B) Close-loop feedback C) Cross-functional integration D) All the above
Correct Answer is: ------------------------------------------------------------------------------------------------------------ Question 2 : Which of the following is not a characteristic of JIT :
A) High Inventory Levels B) Quality at Source C) Continuous Improvement D) Supplier Partnerships
Correct Answer is: ------------------------------------------------------------------------------------------------------------ Question 3 : Which of the following represents the cost of quality :
A) Cost of failure to control quality B) Cost of controlling quality C) Both A and B D) None of the above
Correct Answer is: ------------------------------------------------------------------------------------------------------------ Question 4 : In MRP II, the correct top-down planning sequence is?
I. Business Plan II. Material Requirements Plan III. Production Plan IV. Master Production Schedule V. Production Activity Control
A) I, II, III, IV, V B) I, IV, III, II, V C) I, III, IV, II, V D) I, II, V, III, IV
Session 2 – Management Approaches 36
Institute of Manufacturing Resource Management of India
Correct Answer is: ------------------------------------------------------------------------------------------------------------ Question 5 : Shorter set up times have the following advantages except :
A) Reduced Manufacturing Lead Time B) Reduced Work in Process
C) Increased Order Quantity D) Improved Process Flow Correct Answer is: ------------------------------------------------------------------------------------------------------------ Question 6 : Which of the following statements is true regarding JIT : A) It is a philosophy that relates to the way in which a manufacturing
company organizes and operates its business. B) It involves getting the goods to the customer as fast as possible at all costs. C) It is a culturally based method of management. D) It is concerned with adding cost to the product.
Correct Answer is: ------------------------------------------------------------------------------------------------------------ Question 7 : TQM can reduce batch sizes by : A) Reducing lead time. B) Using statistical analysis and destructive testing. C) Increasing per-order costs. D) Lowering fixed costs associated with batch-size calculations. Correct Answer is: ------------------------------------------------------------------------------------------------------------ Question 8 : Which of the following is an advantage of work cells : A) Maximum machine utilization. B) Simplified production activity control. C) Larger batches and lower unit costs. D) Reduced worker skills required. Correct Answer is: ------------------------------------------------------------------------------------------------------------ Question 9 : Sales and Operations plan is the combination of :

Session 2 – Management Approaches 37
Institute of Manufacturing Resource Management of India
A) Marketing Plan and Strategic Business Plan B) Sales Plan and Master Schedule D) Marketing Plan and Production Plan D) Purchasing Plan and Production Activity Control
Correct Answer is: ------------------------------------------------------------------------------------------------------------ Question 10 : Which of the following is not a quality tool :
A) Check Sheets B) Cause and Effect Charts C) Scatter Plots D) Kanban Cards
Correct Answer is: ------------------------------------------------------------------------------------------------------------

38
Institute of Manufacturing Resource Management of India
SESSION 3
DEMAND
PLANNING

Session 3 – Demand Planning 39
Institute of Manufacturing Resource Management of India
Introduction Demand Management is a function of recognizing and managing all of the demands for products to ensure that the master scheduler is aware of them. The two main components of Demand Management are: Forecast (Uncertainty) and Order Service (Certainty). Demand Management encompasses the activities of Forecasting, Handle order receipt & entry, Order promising, Branch warehouse requirements, Interplant Orders and Service parts requirement and would cover demand from the following:
◊ Customers – domestic & foreign ◊ Other plants in the same corporate family ◊ Branch warehouse in other locations ◊ Consigned stocks in customers’ locations.
Demand planning is vital to every business & every significant management decision.. It also helps in long-term & short-term process selection, Capacity planning & facility planning. Market place, customer expectations, and customer relationship drives planning.
Key Demand Drivers
Marketplace a Key Driver Market place basically consists of customers, competitors and economic & regulatory policies. Customers Customers are considered as a king in today’s fierce competition. The preferences of customer changes due to various factors beyond the control of the organization viz change in customer’s need based in his experience with the product , general perception of a product, word of mouth etc. All these factors play an important role in future demand of the product. Competitors Entry of new competition, competitor’s differentiation in product and technological innovation/revolution by competitor causes major threats on firm’s existing product line.

Session 3 – Demand Planning 40
Institute of Manufacturing Resource Management of India
An organization has to continuously innovate to sustain competitive advantage in the market place. Economy and Regulatory Policy Economic Policies : Economic policies declared by states & central government has major effect on demand. Increase in individual taxes & on product itself may discourages customer from spending. On the other hand removal of taxes may boosts demand for the product. Regulatory Policies : These are the legal guidelines set by regulatory authority. The introduction and amendments in statutory requirement increases or lowers the demand, sometimes it may kill the demand completely.
Customer Expectations Order Winners and Qualifiers To be competitive in market place, an organization must have minimum set of characteristics/features in its product. Customer requirements may be based on cost, quality, delivery, after sale service. These basic requirements are called Order qualifier. On the other side to attract the customer to buy its product an organization must have certain special characteristics in the product it offers. Those features & characteristics that make customer to choose its product over a competitor are called order winner. Order winner provides organization with competitive advantage As the customer expectation changes order winner also changes. Order winner over a period of time may change and become an order qualifier. In addition to Order qualifier & Order Winner, there are certain characteristics whose presence or absence may not make any difference on customer’s choice, such features are called Non Issues. Marketing Strategy Marketing strategy deals with number of issues like determining market segment, developing market niches, analyzing competition & increasing market share

Session 3 – Demand Planning 41
Institute of Manufacturing Resource Management of India
Customer Relationship Customer relationship management is important to be competitive in the market and increase the market share. It has to be a systematic approach that will develop a long-term relationship with a customer that builds loyalty for an organization. Customers are continuously informed about new products, innovations in existing products, sales schemes, annual maintenance renewals, discounts & so on. This gives customer a feeling of uniqueness & in turn develops loyalty for an organization.
Demand Management Demand management is the function of coordinating and controlling of all the sources of demand in order to enhance efficiency and effectiveness of total business. Demand management could be short, medium or long term.
Sources of Demand Following are the sources of demand
◊ Consumers – the end user of a product ◊ Referrers – people who recommend the products ◊ Dealers & Distributors – channel of distribution ◊ Inter company – demand from sister or group company ◊ Service needs – requirement from after sales service department
Kinds of Demand Dependent Demand It is a demand for the product or service caused by demand for another product or services. Dependent demand is directly related to or derived from the bill of material structure for other items or end products. Such demands are therefore calculated and need not or should not be forecasted. This typically includes raw materials, purchased or manufactured parts or ingredients and manufactured subassemblies, attachments and accessories. Dependent demand is derived from other products and is hence calculated

Session 3 – Demand Planning 42
Institute of Manufacturing Resource Management of India
For example if an organization is making table tops with wooden top & 4 legs, then if firms sells100 table tops, then it requires 100 wooden tops & 400 legs. This demand of wooden tops & legs is dependent on demand of tabletop & hence termed as dependent demand. Independent Demand If the demand does not depend upon or is unrelated to the demand of other items then it is called independent demand. Tabletop in above example is an independent demand. This typically includes demand for finished goods, parts required for destructive testing and service parts. Independent demand is forecasted. Sometime an inventory item can be subjected to both dependent demand and independent demand. For example, parts like automobile glass may represent both demands – dependent (as it depends on the manufacturing schedule of new automobiles) and independent (as it may be used as a replacement parts). Aggregate Vs Disaggregate Demand Aggregate demand : Demand estimates for a product group or family is called aggregate demand Disaggregate demand : Demand estimates for an individual product is called disaggregate demand For an example in a Home Appliance manufacturing company that makes air conditioner, refrigerator of different capacities, the demand estimates for total of air conditioner & refrigerator is aggregate demand. E.g. 20,000 air conditioner or 1,00,000 refrigerators. Similarly demand estimates of each product like 10,000 nos of 165 Ltr Refrigerator, 30,000 nos. of 200 Ltr refrigerators is disaggregate demand. Higher the level of aggregation is, the more accurate the demand estimate; the lower or more detailed or disaggregated the level, the less accurate the demand estimate. Though the increased demand forecast accuracy results from aggregation, the aggregated data may not be as useful. The most commonly used dimensions of aggregation and desegregations are time, geographic location and product group. The above example cited above is at product group level. Characteristics of Demand Demand pattern for products & services could be as follow :
Session 3 – Demand Planning 43
Institute of Manufacturing Resource Management of India
Trend : It is an increasing or decreasing steady pattern of demand from year to year. A trend could be a) Linear trend b) S Curve c) Asymptotic Trend d) Exponential trend Seasonality : The demand in a particular period every year rises above or goes below the average yearly demand. This happens as a result of seasonal changes like festival, holiday’s etc. Random variations : Random variations are caused by chance events. Statistically when all the known causes for demand (trend, seasonal, cyclical) are subtracted from the total demand, what remains is unexplained portion of demand. This unexplained portion is due to randomness. Cyclical : The world economy as well as country’s economy influences overall demand pattern. Cyclical factors are more difficult to determine because the time span may be unknown. Cyclical influence on demand may also come from political election, war, and sociological pressure.
Forecast Management The forecast is an estimate of future demand. A forecast can be determined by mathematical means using historical data; it can be created subjectively by using estimate from informal sources; or it can represent a combination of both techniques. It looks into occurrences, timings or magnitudes of future events. Accurate forecast can reduce uncertainty and minor forecasting improvements have a remarkable and direct impact on inventory cost and responsiveness to customer requirements. Definition of Forecast Management Forecast management is a process of collection of data, selection of appropriate techniques, forecasting & then taking corrective action if actual demand varies significantly. Objectives : Planning of long lead time resources like plant expansion, capital equipment Planning of medium & short term resources like labor, procurement of materials To shorten customer’s delivery time
Session 3 – Demand Planning 44
Institute of Manufacturing Resource Management of India
Principles of Forecast
◊ Forecasts will be wrong- as forecasting is based on various consideration viz., the source of data, the forecasting method, the time dimension of data, the level of aggregation of data, the unit of measure used, the frequency of reassessment, and the quality and accuracy of the data itself, it is bound to go wrong.
◊ Forecast shall include an estimate of error. This estimates of error can be
mentioned either as percentage or plus / minus tolerances.
◊ Forecast is more accurate for shorter time periods. This is simply because nearest future is more predictable
◊ Forecasts are more accurate for a family or group of products. On the other
hand, forecast of individual items is more erratic. Collection of Data The quality of forecast is as good as data used. Data collection shall be done in an accurate way leaving no way for errors & ambiguity. Following guidelines shall be considered.
◊ Data shall be recorded in proper units & location as needed for forecast. For example if forecast of sales is to be made, data shall be of actual sales made in the past & shall not be of production or shipment.
◊ Capture the event or circumstances related to data. Certain events &
circumstances influence the demand in that particular period like festivals, holiday’s etc. Capturing the data with relevance to such incidents would enable forecaster to account or discount such events in forecasting.
◊ Demand data of different customer group shall be recorded separately.
Methods / Techniques Forecasting methods are broadly divided as :
◊ Qualitative Techniques ◊ Quantitative techniques
Quantitative Techniques are further divided into :
◊ Intrinsic Techniques ◊ Extrinsic Techniques
Session 3 – Demand Planning 45
Institute of Manufacturing Resource Management of India
Qualitative Techniques It is a subjective, judgmental & is based on estimates & opinions. It is generally used by senior managers. Following are few examples of qualitative techniques, Grass Roots : Derives forecast by compiling input from those at the end of the hierarchy who deal with what is being forecasted Market Research : This is used to forecast long range & new product sales & includes surveys, interviews. Generally market research connotes a more rigorous, often hypothesis-testing approach. Panel Consensus : Sales executives, middle managers, supplier, customer is invited in free meeting & future trends are discussed & summarized. Historical Analogy : Forecast is derived from actual sale of similar item in the past. Knowledge of past and mostly completed event may be closely related to a future event. Eg. Market development of colour TV may follow pattern Black & White TV. Historical analogies tend to be best for replacement products and where direct market substitutability relationship exist. Delphi Method : Group of experts responds to questionnaire. A group co ordinator collects the feedback, compiles & prepares new questionnaire, which is re submitted, to group. Quantitative Techniques This incorporates more extensive computational evaluation of data pattern or external relationships. There are two subsets of Quantitative methods :
◊ Extrinsic Technique ◊ Intrinsic Technique
Extrinsic Technique : A certain set of external factors/ indicators outside the organization are used to forecast product demand. Examples are, rise in sales of automobiles & refrigerators will increase demand on steel industry. Some frequently used indicators are GDP growth, agricultural production, automobile production, steel production, hosing sector growth, census etc. Extrinsic demand is mostly used to forecast group or family of products. Intrinsic Methods : These techniques use historical recorded data for future estimates. Past performance of product in the marketplace is studied/ analyzed with mathematical or statistical tools to arrive at future demand. Individual products are forecasted by these methods. Following are major techniques of intrinsic methods
Session 3 – Demand Planning 46
Institute of Manufacturing Resource Management of India
◊ Average Demand ◊ Simple Moving Average ◊ Weighted Moving average ◊ Exponential smoothing ◊ Seasonal Index ◊ Regression analysis ◊ Box Jenkins Technique
All of above are forecasts based on time series analysis. First techniques are discussed in details below. Refer to following table for all further examples,
Sr. No. Month Demand Forecast Error 1 Jan 02 10000 9000 +1000 2 Feb 02 9000 10000 -1000 3 Mar 02 15000 14000 +1000 4 Apr 02 20000 20000 0 5 May 02 22000 23000 -1000 6 Jun 02 10000 9500 +500 7 Jul 02 6000 5500 -500 8 Aug 02 8000 6900 +1100 9 Sept 02 12000 12300 -300 10 Oct 02 15000 14500 +500 11 Nov 02 20000 20500 -500 12 Dec 02 15000 14000 +1000
Average Demand : This is a simple average of last year’s actual demand. It has limitation of not able to capture trend & seasonal variation. Referring to above table, Average Demand for the year = (10000 +9000+ ---------+15000) / 12 Simple Moving Average : Simple moving average is used when demand for a product is neither growing nor declining rapidly & if there is no seasonality in it. In our example, if we want to find demand for Jan 03 on the basis of 3 month’s moving average then,

Session 3 – Demand Planning 47
Institute of Manufacturing Resource Management of India
Forecast of Jan 03 = (Dec 02 + Nov 02 +Oct 02)/ 3 = 16667 nos Similarly 5 month’s moving average will be, Forecast of Jan 03 = (Dec 02 +--------+ Aug 02) / 5 = (15000 +-------+8000) / 5 = 14000 nos It is very important to select the best period for the moving average. There are several conflicting effects of different period lengths. The longer the moving average period, the greater the random elements are smoothed out. But if there is a trend in the data either increasing or decreasing, the moving average has the adverse characteristics of lagging trend. Like 3 months moving average for Jan 03 is 16667 but looking at last year data, actual demand will be less than forecast. Weighted Moving Average : This allows any weights to be placed on each element, but ensuring that the sum of all weights equals to 1. Weights are chosen by experience & trial & error . As a logical rule, most recent data is given higher weight. But if data are seasonal, then weights shall be established accordingly. In our example, let’s assign 20%, 30%& 50% weights to Dec/ Nov/ Oct respectively, Hence, Forecast for Jan 03 on 3 months moving average could be, Forecast For Jan 03 = Dec 03 * 0.2 + Nov 02 *0.3 + Oct 02 * 0.5 = 15000*0.2 + 20000*0.3+15000*0.5 = 16500 If different weights for each period are selected, the following three rules should be followed:
◊ Rule 1: The sum of the weights should be 1.0 (or factored to be 1.0) ◊ Rule 2: Weights should not be zero or negative ◊ Rule 3: More recent periods should receive heavier weights.
Exponential Smoothing : In both the above methods, an organization has to carry a large amount of historical data. It is well established that forecast based on recent data is more indicative of future than more distant past. Exponential smoothing is a technique that uses this kind of recent data in establishing future demand. In the exponential smoothing method, only 3 pieces of data are needed,

Session 3 – Demand Planning 48
Institute of Manufacturing Resource Management of India
◊ the most recent forecast ◊ the actual demand that occurred for that forecast period ◊ smoothing constant alpha (α).
This smoothing constant alpha(α) determines the level of smoothing & the speed of reaction to difference between forecasts & actual occurrences. The value of alpha is determined by nature of product, forecasters’ intuition. The another way is to use computer simulations & by trial & error arrive at the alpha value. Again calculating Jan 03 forecast, let us assume that Dec 02 forecast was 13000 & alpha value chosen is 0.4 New Forecast = (α) (latest Demand) + ( 1 -α ) (forecast of Latest demand) Hence, Jan 03 Forecast = 0.4 *15000 + ( 1- 0.4) *13000 = 13800 It is clear from the above example that if (α) chosen is low then heavy weightage is given on old forecast & possible trend will not be taken care. On the other hand high(α) value is used, then recent demand is heavily accounted. Seasonal Index : Demand of the product increases or decreases in a particular period every time, such demand is termed Seasonal. This could happen as a result of festival, recurring occurrences of certain event, holidays & so on. This seasonal variation in demand is captured through seasonal index. Seasonal index estimates by how much the demand in season will be below or above the average demand. Seasonal Index = Period Average demand / Average Demand for all periods Applying this formula to our example, Seasonal Index For Jan 03 = Jan 02 Demand / Average Demand For the year 02 = 10000 / 13500 = 0.75 The average demand for all periods is a value that averages out seasonality. This is called the desesonalized demand. Equation given above can be re written like this, Seasonal Index = Period average demand / Deseasonalised demand

Session 3 – Demand Planning 49
Institute of Manufacturing Resource Management of India
Regression Analysis : Quantitative models for finding the mathematical expression that best describe the relationship between two or more variables. Regression models often are used in forecasting. Box-Jenkins Models : A quantitative forecasting approach based on regression and moving average models, where the model is based not on regression of independent variables but on past observations of the item to be forecast at varying time lags and on previous error values from forecasting Forecast Error Measurement and Response The accuracy of a particular forecast method is measured in terms of the forecast error. The difference between the actual demand & the forecast demand is called forecast error. The error can come in two ways
◊ Bias ◊ Random
When actual demand is consistently above or below the forecast demand, the error is called bias. To improve upon bias, an organization needs to change forecast. Random errors in forecast are natural variation about the average demand. Bias & random variations are similar to assignable & inherent causes in SQC. Forecast error can be measured in any of following ways,
◊ Mean Absolute error ◊ Standard Error ◊ Tracking Signal
Mean Absolute Deviation (MAD) : MAD is simple method & very useful in obtaining tracking signal. MAD is the average error in the forecast, using absolute value. MAD is calculated using the difference between the actual demand & the forecast demand without regard to sign. It equals the sum of absolute deviations divided by the number of data points, Referring to our (additional column of forecast is added) MAD = Sum of Absolute error / No of Observations = 8400 / 12 = 700

Session 3 – Demand Planning 50
Institute of Manufacturing Resource Management of India
MAD is the average amount by which the forecast errs. MAD does not consider the direction of the error, only the average amount of the error. Standard Error : As shown in the example, MAD is a measurement of the differences between actual demand & forecast. If we plot histogram of frequency of actual demand of a particular value, it gives bell shaped curve also known as normal distribution. Normal distribution curve has three properties, mean (average), central tendency, and dispersion. This dispersion is measured by standard deviation. This dispersion is directly proportion to standard deviation. MAD though different can be interpreted the way standard deviation is interpreted in following manner, The forecast error will be within,
+/-1 MAD of the average about 60 % of time
+/-2 MAD of the average about 90 % of time
+/-3 MAD of the average about 98 % of time Tracking Signal : It is measurement that indicates whether the forecast average is keeping pace with any genuine upward or downward changes in demand. A tracking signal is the number of mean absolute deviation that the forecast value is above or below the actual occurrences. Tracking signal is useful because it measures error over a specified range of data, for example 4 weeks in a month or 52 weeks in a year, Thus it can identify periodic areas where forecast has greater error. In addition to this, tracking signal can be used to indicate that the inherent pattern of the data is changing and the forecasting method needs to be adjusted. Tracking Signal = Algebraic sum of forecast error / MAD Referring to our example (MAD IS already calculated as 700) Tracking Signal = 1800 /700 = 2.57 Thus Jan 02 tracking signal is –1. , that means forecast models providing forecast that is quite a bit below the mean of the actual occurrences. Organizational sets limits for tracking signal called trigger, say +/- 4. If tracking signal calculated is beyond this limit, then forecasting model needs review otherwise not. Acceptance limits for tracking signal depend on the size of the demand being forecast & the amount of time available.

Session 3 – Demand Planning 51
Institute of Manufacturing Resource Management of India
Distribution Requirements Planning (DRP) What is DRP ? DRP provides a framework for implementation of centralized push systems of distribution inventory management. Distribution resource includes more than just the planning and control system for replenishment. It includes many of the physical aspects of distribution – warehousing and transportation facilities. It also implies the connection of replenishment system to financial systems and use of simulation as a means to improve system performance. DRP is similar to MRP applied to MPS .The process of determining the need to replenish finished good inventory at branch warehouses. A time-phased order Point (TPOP) approach is used where the planned orders at the branch warehouse level are “exploded” with the help of MRP logic to become gross requirements on the supplying source. This gross requirement then becomes input to MPS. The extension of distribution requirements planning into the planning of the key resources contained in a distribution system: warehouse space, workforce, money, truck, freight is known as distribution requirement planning 2 (DRPII) Inputs / Outputs DRP Input : Requirement of each distribution system is calculated by Forecast. Hence, forecasting method shall be selected with utmost care so that trends & seasonality are captured properly. As in case of MRP actual customer order also becomes input to DRP system. DRP Output : Planned order release are output of DRP which can be automatically generated from the system. This Planned order release is input for Master Production Schedule. The point of connection between the production system and the distribution system is the master production schedule (MPS). DRP provides a framework for managing orders, shipments and inventories even in the face of dynamic market place. Unplanned events and changing conditions may often be accommodated through pegging of requirements, fair share allocations, and firm planned orders, while still maintaining overall lower safety stock levels.
Session 3 – Demand Planning 52
Institute of Manufacturing Resource Management of India
Key Terminology 01) Aggregate Demand 02) Bias 03) Cyclical 04) Demand Management 05) Dependent Demand 06) Disaggregate Demand 07) Distribution Requirement Planning (DRP) 08) Forecast Error 09) Independent Demand 10) Mean Absolute Deviation 11) Random 12) Seasonality 13) Trend 14) Tracking Signal 15) Order Winner 16) Order Qualifier

Session 3 – Demand Planning 53
Institute of Manufacturing Resource Management of India
Practice Questions – Session 3 Question 1 : Which of the following is not a source of demand : A) Consumers – the end user of a product
B) Dealers and Distributors – channel of distribution C) Service Needs – requirement from after sales service department D) Component Requirements – planned by MRP
Correct Answer is: ------------------------------------------------------------------------------------------------------------ Question 2 : Dependent demand is not :
A) Calculated B) Forecasted C) Related to the demand of its parent D) Derived from BOM
Correct Answer is: ------------------------------------------------------------------------------------------------------------ Question 3 : Which of the following are characteristics of demand :
A) Trend B) Random Variation C) Seasonality D) All the above
Correct Answer is: ------------------------------------------------------------------------------------------------------------ Question 4 : Which of the following statements if incorrect :
A) Forecasts are usually inaccurate B) Forecasts should include an estimate of error C) Forecasts are more accurate for longer time periods D) Forecasts are more accurate for family / group of products
Correct Answer is: ------------------------------------------------------------------------------------------------------------ Question 5 : Which of the following are techniques / methods of forecasting :

Session 3 – Demand Planning 54
Institute of Manufacturing Resource Management of India
A) Qualitative Techniques B) Intrinsic Techniques
C) Extrinsic Techniques D) All the above Correct Answer is: ------------------------------------------------------------------------------------------------------------ Question 6 : Which of the following is not an intrinsic method of forecasting :
A) Simple Moving Average B) Exponential Smoothing C) Regression Analysis D) Delphi Method
Correct Answer is: ------------------------------------------------------------------------------------------------------------ Question 7 : Considering “C” as the smoothing constant, the formula to calculate the forecast by exponential smoothing method is :
A) Forecast = (C) (Latest Demand) + (1 + C) (Forecast of Latest Demand) B) Forecast = (1 – C) (Latest Demand) + (C) (Forecast of Latest Demand) C) Forecast = (C) (Latest Demand) + (1 – C) (Forecast of Latest Demand) D) Forecast = (1 + C) (Latest Demand) + (C) (Forecast of Latest Demand)
Correct Answer is: ------------------------------------------------------------------------------------------------------------ Question 8 : Forecast error can be measured by :
A) Mean Absolute Deviation B) Standard Error C) Tracking Signal D) All the above
Correct Answer is: ------------------------------------------------------------------------------------------------------------ Question 9 : Which of the following is a quantitative forecasting method :
A) Market Research Method B) Panel Consensus Method C) Historical Analogy Method D) Box-Jenkins Method
Correct Answer is:

Session 3 – Demand Planning 55
Institute of Manufacturing Resource Management of India
------------------------------------------------------------------------------------------------------------ Question 10 : When actual demand is consistently above or below the forecast demand, the error is called :
A) Random Variation B) Bias C) Standard Error D) Mean Absolute Error
Correct Answer is: ------------------------------------------------------------------------------------------------------------

56
Institute of Manufacturing Resource Management of India
SESSION 4
DESIGN

Session 4 - Design 57
Institute of Manufacturing Resource Management of India
Manufacturing Feasibility Manufacturing Feasibility or Manufacturability is a measure of design of a product or process in terms of its ability to be produced easily, consistently and with high quality.
New Product Design and Introduction Introduction Numbers of activities are associated with design for quality. These include reliability engineering, collaborative design, value engineering, design for manufacturability, and design for cost. All these concepts/tools are useful in designing products to optimally fulfill customer needs and provide a quality product. Product Development Principles Steps in new product design and introduction include : Guide product development with an understanding of customer needs and wants. Many firms design products because “they can”. Avoid this tendency. Design should proceed from outside in, rather than inside out. Test the feasibility of design through engineering breadboard. This means including a step in product development to test whether the product can be technologically achieved (feasible) is necessary. Package the product, design tools, make make/buy decision during engineering prototype. A model of the product is assembled, often from existing and handmade parts. At this stage, features and options, and basic functions of the product are decided. Make or buy decisions and tooling design for production parts are accomplished at this phase. Establish suppliers and test production parts during manufacturing prototype. During this phase
◊ Suppliers are selected, production parts are received, and assembly instructions are written
◊ Design changes are made to improve manufacturability. ◊ Initial purchase contracts are established and production line is laid out. ◊ Test procedures and machine choices are made.
Train workers, establish procedures, set up line, establish throughput times, try production/ assembly/ test tooling. This is a stage where
Session 4 - Design 58
Institute of Manufacturing Resource Management of India
◊ All the procedures, test steps, inspection, tools are tested before full-scale
production starts. ◊ Production workers are trained ◊ Production layout is tested ◊ Standards are established ◊ First production run of parts from suppliers is made ◊ Throughput times and capacities needed are verified ◊ Manufacturability changes are made before the product is released into
production.
Begin production Product Specification and Design Participative design is a central part of the overall process of product design and introduction. Customers and all the major functional areas of the firm are partners in the design activity. Role of P&IM professional in the design process at various stages in new product design process includes
◊ Understanding customer needs and wants – boundary spanning ◊ Engineering breadboard – P&IM system design begins ◊ Engineering prototype – Make or buy decisions – coordinate with new or existing
suppliers ◊ Manufacturing prototypes – Database additions, start MPS and demand
management activities ◊ Doing pilot run – verify suppliers, start shop floor reporting, demonstrate all
capabilities ◊ Begin production – Normal operations
Process Design The alignment of the process with what firm is trying to do in the marketplace to achieve competitive advance and to the current and expected volumes and varieties of product offerings is critical. Process choices are generally made infrequently. Process choices put machinery and systems in place that must be compatible with market needs.

Session 4 - Design 59
Institute of Manufacturing Resource Management of India
Influencing Factors A number of issues, strategic, and tactical are connected to process choice. A firm may choose leading edge technologies, or a more conventional technology, having different mixes of machinery and people. The nature of firms’ order winners and order qualifiers; current and expected volumes and varieties of firms’ products set the stage for firms’ process choice decision. Process Choices Choice of a new process must provide the firm with the strategic capabilities it needs. Consideration should be placed on needed resources to implement the chosen process, impact of these technologies on the information system and planning and control systems is required. Process choice decisions should be made for strategic reasons than simply evaluation of financial payback. For a firm competing on cost, having products in mature stage of product life cycle, the likelihood is of low variety and high volume of products. The process choice calls for dedicated, high volume equipment – e.g. automated assembly line. In this mature part of life cycle, focus on cost is high. High volume, dedicated equipment minimizes deployment cost. A firm with many machining operations generally competes on quality and delivery capability. The products have mid range of volume and high variety. The choice of process is multi-purpose machine that can offer quick changeovers, is highly reliable, easy to maintain, with high tolerance capability. Process Flexibility Process flexibility refers to the speed and ease with which the manufacturing transformation tasks can respond to internal or external changes. Flexibility demands the ability to introduce new products rapidly and to increase and decrease production quickly in response to changes in the marketplace for firms’ products. Process flexibility requires a master schedule that can drive the production system quickly and efficiently. As volumes and varieties change rapidly and new products are introduced more frequently, the management of the master schedule is critical. Excess capacity must be reflected and managed in the master schedule. Process flexibility also leads to greater need to simulate – carry out “what if” analysis.
Session 4 - Design 60
Institute of Manufacturing Resource Management of India
Continuous Process Improvements Continuous process improvement refers to a never-ending effort to expose and eliminate root causes of problems; continuous process improvements are small step improvements as opposed to big-step improvements. The process improvement activities identify and eliminate causes of poor quality, process variation and non-value-added activities. Steps in process improvement include
1. Choose a process - Choose an easier process. The process should be well understood. The objectives and customers of the process should be clear. Customers, their needs and wants should be clear.
2. Identify the goals and what are we trying to accomplish with the process? Goals
of the process should be related both to the goals of the operating unit and to the needs and wants of the customer.
3. Choose measurements - The measurements should coincide with the goals of the
process.
4. Measure output reliability- The process owner should determine the process capability.
5. The process should be fundamentally capable of perfect output. Baseline measures should be made on current process. The baseline measures are used to provide feedback on process improvement over time.
6. Take the process apart piece by piece - The process is studied in details – showing
each step, who does it, paperwork/information involved, the source of information, the use of information, time required to perform each step, waiting time, transportation time.
7. Eliminate waste - Waste are the activities that add cost without adding value.
Process simplification starts with elimination of as many forms of waste as possible.
8. Simplify, fix, train - Eliminate steps, doing less activity at steps wherever
possible. Training and education can help where process has shown problems because of lack of training.
9. Measure output again - Ensures that there has actually been improvement in
quality and determines the degree of improvement
10. Repeat from number 6
Session 4 - Design 61
Institute of Manufacturing Resource Management of India
Planning Parameters
Manufacturing and Purchasing Lead Time Definition and Functions of Lead Time Lead time is a span of time required to perform a process (or series of operations). In a logistics context, lead time is the time between recognition of the need for an order and the receipt of goods. Individual components of lead time can include order preparation time, queue time, processing time, move or transportation time, and receiving and inspection time. Manufacturing lead time is the total time required to manufacture an item, exclusive of lower level purchasing lead time. For make to order products, it is the length of time between the release of an order to production process and shipment to the final customer. For make to stock products, it is the length of time between the release of an order to the production process and receipt into finished good inventory. Included here are order preparation time, setup time, run time, move time, inspection time, and put-away time. Purchasing lead time is the total lead time required to obtain a purchased item. Included here are order preparation and release time; supplier lead time; transportation time; and receiving, inspection, and put-away time. Elements and Determinants of Lead Time Move or transportation time : The time that a job spends in transit from one operation to another in the plant Order preparation time : The time needed to analyze requirements and open order status and to create the paperwork necessary to release a purchase order or a production order Processing Time : The time during which the material is being changed, whether it is machining operation or an assembly. Process time per piece is (Setup time/lot-size) + Runtime per piece. Put-away Time : Put-away relates to removing the material from the dock or another location of receipt, transporting the material to a storage area, placing that material in a staging area and then moving it to a specific location, and recording the movement and identification of the location where the material has been placed.

Session 4 - Design 62
Institute of Manufacturing Resource Management of India
Queue Time : The amount of time a job waits at a work center before setup or work is performed on the job. Queue time is one element of total manufacturing lead time. Increases in queue time result in direct increases to manufacturing lead time and work-in-process inventories. Receiving and inspection time : Relates time taken in the function of receiving and encompasses physical receipt of material, inspection of the shipment for conformance with the purchase order (quantity and damage), the identification and delivery to destination, and the preparation of receiving reports. Inspection activities involve measuring, examination, testing, gauging one or more characteristics of a product or service and comparing the results with specified requirements to determine whether conformity is achieved for each characteristics. Set-up Time : Setup refers to the work required to change a specific machine, resource, work center, or line from making the last good piece of unit A to the first good piece of unit B. Setup also refers to the refitting of equipment to neutralise the effects of the last lot produced; e.g. teardown of the just completed production and preparation of the equipment for production of the next scheduled item. Set up time is the time needed to prepare a manufacturing process to start. Setup lead time may include run and inspection time for the first piece. Supplier Lead-time : is the amount of time that normally elapses between the time an order is received by a supplier and the time the order is shipped. Planned, Cumulative and Actual Lead Times Planned Lead Time : MRP requires planned lead time value to offset the planned receipt of an item, using backward scheduling, to properly place the planned order release in the correct time period. Cumulative Lead time : is the longest planned length of time to accomplish the activity in question. For any item planned through MRP, it is found by reviewing the lead time for each bill of material path below the item,; whichever path adds up to the greatest number defines cumulative lead time. Cumulative manufacturing lead time : is the cumulative planned lead time when all purchased items are assumed to be in stock. Actual Lead time : Planned lead time estimates are generally of not the same accuracy as on-hand balances and scheduled receipts. For this reasons, actual lead times are extremely volatile.

Session 4 - Design 63
Institute of Manufacturing Resource Management of India
Controlling Actual Lead Times Often there is a temptation to intentionally overstate lead time to be on safe side. When lead times are overstated consistently at each level of the product structure, they are additive, increasing the cumulative lead time for production of the product and thereby contributing to uncertainty and likelihood of subsequent MPS changes with their accompanying costs and disruptions. Planned lead-times should therefore be reasonably even when they cant be made totally accurate.
Order Quantity / Lot Size / Batch Significance Lot size is the amount of a particular item that is ordered from the plant or a supplier or issued as a standard quantity to the production process. Batch is a quantity scheduled to be produced or in production. For discrete products, the batch is planned to be the standard batch quantity, but during production, the standard batch quantity may be broken into smaller lots. In non-discrete products, the batch is a quantity that is planned to be produced in a given time period based on a formula or recipe, which often is developed to produce a given number of end items. Lot sizing means producing a quantity that may exceed the immediate need due to economies of scale or constraints inherent in the production process. Often purchase discounts based on the quantity are also cited as reasons for lot sizing. Policies regarding lot size quantities and how they will be determined must be provided as an input to the MRP process. Seldom will a single lot size rule be appropriate for all levels of end products, assemblies and components. There are also substantial cash flow and cost consequences associate with lot-size decisions. Therefore formulation of lot-size rules must be done with great care. Costs and Other Considerations The cost to place additional orders with suppliers or the production facility is inverse to the cost to carry inventory. If you order only as required, or in smaller quantities, the inventory will be smaller and the cost to carry the inventory will be minimised

Session 4 - Design 64
Institute of Manufacturing Resource Management of India
On the other hand, large lot sizes will have fewer orders or setups and therefore the costs attendant on orders and setups will be minimised. The cost implications are shown in graph below:
Available Techniques Fixed order quantity : is a lot sizing technique in MRP or inventory management that will always cause planned or actual orders to be generated for a predetermined fixed quantity, or multiples thereof, if net requirements for the period exceed the fixed order quantity. Economic Order Quantity (EOQ) : a lot size based on a well known square root formula that may be optimum so long as requirements are regular and continuous. Periods of Supply (POS) : a popular method with MRP where lot sizes are based on covering a certain number of periods of requirements Lot for Lot : Lot sizes that just cover net requirements as necessary, sometimes called “as needed” or “as required”. Least unit cost (LUC) : a mathematical lot-size rule that selects the order quantity that minimises the unit cost of each item being produced or procured. Least Total Cost (LTC) : a mathematical lot size rule that selects the order quantity that minimises the total of order/setup and carrying costs.
Order Cost
Carrying Cost
LOT SIZE
C
O
S
T
Order Cost
Carrying Cost
LOT SIZE
C
O
S
T

Session 4 - Design 65
Institute of Manufacturing Resource Management of India
Part period balancing (PPB) : a method similar to LTC that measures the costs associated with carrying one unit of inventory for one period Wagner Whitin Algorithm : A method using management science techniques that looks at all possible combinations of lot-size choices to select the optimum.
Safety Stock and / or Capacity Concepts, Significance and Design Considerations of Safety Stock and Safety Capacity Safety Stock – is a quantity of stock planned to be in inventory to protect against fluctuations in demand or supply. In the context of master production scheduling, the additional inventory and capacity planned as protection against forecast errors and short-term changes in backlog. Over planning can be used to create safety stock. Safety capacity is the planned amount by which the available capacity exceeds current productive capacity. This capacity provides protection from planned activities, such as resource contention, and preventive maintenance and unplanned activities, such as resource break-down, poor quality, rework or lateness. Safety capacity plus productive capacity plus excess capacity is equal to 100% of capacity. Safety stock is employed to buffer against uncertainties of demand and should be utilized for independent demand end products that are planned using MPS. The items, the demand for which is computed using MRP and not forecast have little need for safety stock. Safety stock is best planned at MPS level, to generate matched sets through the explosion into component orders. Potential spoilage, unreliable suppliers, use of intermediate product as service part, however are the conditions, that may lead to inclusion of safety stock for MRP planned items. Safety lead time often is used to compensate for uncertainty regarding receipt or completion of orders. This means receipt of item in inventory before it is needed, and tends to increase the cumulative lead time.

Session 4 - Design 66
Institute of Manufacturing Resource Management of India
Data Sources and Data Accuracy
Bill of Materials (BOM) Definition Bill of material (BOM)- is a listing of all the subassemblies, intermediates, parts, and raw materials that go into a parent assembly showing the quantity of each required to make an assembly. It is used in conjunction with the master production schedule to determine the items for which purchase requisitions and production orders must be released. A variety of display formats exists for bills of material, including the single-level bill of material, indented bill of material, modular (planning) bill of material, transient bill of material, matrix bill of material, and costed bill of material. The bill of material may also be called the formula, recipe, or ingredients list in certain process industries. Bill of material information is used to show how the product is made; generate pick lists showing how many of each component to issue; provide “where used” information. BOM Structure and Representation BOM structure represents more than just a part list. It shows the assembly and sub-assembly break-downs of a product “as built” rather than “as designed” that are often at variance. BOM representation – If a complete, multi-level BOM were constructed for each and every product in a large product line, there would be a considerable amount of duplication. It makes sense to create single level bills for each product, assembly, and sub-assembly so that each needs to be retained in data files only once. Indented Part List or Indented BOM – is a result of brining together multiple single-levels bills to prepare a complete multilevel display or printout, using indentation, to show the structure. Summarized Parts List – is the quick reference display of total number of components used in the assembly or product without showing indented break-downs. Where-used report – is a possible way of displaying BOM data. While this format is not directly used in MRP process, it is very useful in maintenance of BOM and by purchasing, production control, engineering in various decision making situations.

Session 4 - Design 67
Institute of Manufacturing Resource Management of India
Maintenance of BOM Maintenance of BOM is the responsibility of Engineering. Firms where changes to product specifications are frequent, a good engineering change system and a consistent method of updating the data files is precondition to an effective MRP. Maintenance procedures should be able to attend to requirement of a future effectivity date of a planned change. Accuracy of BOM is a necessary condition for the use of MRP, for MRP to perform its job of planning the right material at the right time. Just as inventory data accuracy should be ensured before implementing MRP, accurate BOM and effective BOM maintenance procedures should also be in place. Planning BOM Planning Bill of Material (BOM) is an artificial grouping of items or events in bill-of-material format, used to facilitate master scheduling and material planning. Modular bill of material is a type of planning bill that is arranged in product modules or options. It is often used in companies where the product has many optional features, e.g., assemble-to-order companies such as automobile manufacturers.
Item Master / Material Master Significance, Data Elements and Design Considerations It is essential that item identification (part numbers) be unique and unambiguous in BOM data for use with MRP. The sub-assemblies should be assigned a unique part number so that they be planned and prioritized appropriately in the MRP system. In case of a minor change made by engineering to a product, apart from the engineering change notice (ECN), a new part number should be created. If a single part goes through multiple stages of processing/value addition/finishing, a separate part number should be assigned for different stages for MRP to perform its planning function appropriately. In case dies, drill bits, and other tools are used in production process, tooling information should be included in BOM. A tool may be assigned a part number with fractional usage in order to properly plan the tool availability based on lot size to be produced.

Session 4 - Design 68
Institute of Manufacturing Resource Management of India
Routing / Process Significance and Routing Data Elements Routing data include information that pertains to the sequence of operations necessary to complete a manufacturing order. There is a separate routing for every part, assembly and product to be produced. The sequenced operations also identify the work center in which the operation should be performed. The data elements that are typical of each operation in a routing file are
◊ Operation identification code ◊ Operation description ◊ Planned work center ◊ Standard setup time ◊ Standard run time per unit ◊ Tooling requirements
Work Center / Flow Line Work Center Data Elements Much of the work center data is related to capacity and to lead time and are used in CRP calculation. Several factors that are typically included in work center data are listed below-
◊ Work Center Identification and Description ◊ Number of shifts scheduled ◊ Number of machines or workstations ◊ Hours scheduled per shift ◊ Workdays per period ◊ Utilization factor ◊ Efficiency factor ◊ Planned queue time

Session 4 - Design 69
Institute of Manufacturing Resource Management of India
Functional Responsibilities According to the APICS Dictionary - Often the job title of the person charged with the responsibility of managing, establishing, reviewing, and maintaining a master schedule for select items is “Master Scheduler”. Ideally the master scheduler should have substantial product, plant, process and market knowledge because the consequences of this individual’s actions often have a great impact on customer service, material, and capacity planning. The functions of the master scheduler include
◊ Understand the forecasting approach and its limitations ◊ Participate in the development of the production plan ◊ Manage the limitations of production capacity. ◊ Maintain an attainable master schedule
Monitor consistency with the production plan Maintain planning bills with the master schedule Execute master production schedule policies, such as time fences, safety
stocks, subcontracting, and lot sizing Manage forecast assumptions Identify, negotiate and resolve conflicts Act as a business manager

Session 4 - Design 70
Institute of Manufacturing Resource Management of India
Key Terminology 01) Actual Lead Time 02) Batch 03) Bill of Material 04) BOM Representation 05) Continuous Process Improvement 06) Cumulative Lead Time 07) Economic Order Quantity (EOQ) 08) Engineering Breadboard 09) Engineering Prototype 10) Fixed Order Quantity 11) Indented Part List / Indented BOM 12) Least Unit Cost 13) Lot-for-Lot 14) Lot Size 15) Manufacturability 16) Manufacturing Feasibility 17) Manufacturing Lead Time 18) Manufacturing Prototype 19) Master Scheduler 20) Modular Bill of Material 21) Move Time 22) Order Preparation Time 23) Parts Period Balancing 24) Periods of Supply 25) Planned Lead Time 26) Planning Bill of Material 27) Process Flexibility 28) Processing Time 29) Purchasing Lead Time 30) Put-away Time 31) Queue Time 32) Receiving and Inspection Time 33) Routing 34) Safety Capacity 35) Safety Lead Time 36) Safety Stock 37) Set-up Time 38) Summarized Part List 39) Supplier Lead Time 40) Wagner Whitin Algorithm 41) Where-used Report 42) Work Center

Session 4 - Design 71
Institute of Manufacturing Resource Management of India
Practice Questions – Session 4 Question 1 : At which stage in the product development is the feasibility of the design tested :
A) Manufacturing Prototype B) Engineering Breadboard C) Engineering Prototype D) Engineering Pilot
Correct Answer is: ------------------------------------------------------------------------------------------------------------ Question 2 : Which one of the following is not a responsibility of the Master Scheduler :
A) Prepare Production Plan B) Manage Production Capacity limitations C) Maintain attainable Master Schedule D) Monitor consistency of Master Schedule with Production Plan
Correct Answer is: ------------------------------------------------------------------------------------------------------------ Question 3 : One part used in multiple automobile models has to be replaced with a new part. Which of the following representations of BOM would be most useful to find all the instances where this part needs to be replaced :
A) Indented BOM B) Where used Report C) Summarized BOM D) Modular BOM
Correct Answer is: ------------------------------------------------------------------------------------------------------------ Question 4 : Lot sizing technique, that looks at all possible choices of lot sizes and selects the optimum is called :
A) Part Period Balancing B) Periods of Supply C) Wagner Whitin Algorithm D) Economic Order Quantity
Correct Answer is:

Session 4 - Design 72
Institute of Manufacturing Resource Management of India
------------------------------------------------------------------------------------------------------------ Question 5 : The time needed to prepare the manufacturing process to start is called:
A) Queue Time B) Move Time C) Put-away Time D) Set-up Time
Correct Answer is: ------------------------------------------------------------------------------------------------------------ Question 6 : Which one of the following is NOT true about EOQ :
A) Produces optimum quantity to be ordered for which the total cost of ordering and setup is minimized
B) At EOQ, the ordering cost is equal to the carrying cost C) Is same as periods of supply D) May result in excess inventory of items
Correct Answer is: ------------------------------------------------------------------------------------------------------------ Question 7 : Purchasing lead time includes all of the following except :
A) Supplier lead time B) Order preparation and release time C) Receiving and inspection time D) Queue time
Correct Answer is: ------------------------------------------------------------------------------------------------------------ Question 8 : Which of the following information would not be found in the routing file :
A) Planned work center B) Actual processing taken C) Standard setup time D) Tooling requirements
Correct Answer is: ------------------------------------------------------------------------------------------------------------ Question 9 : Factors affecting data selection and forecast accuracy include all of the following except :

Session 4 - Design 73
Institute of Manufacturing Resource Management of India
A) Consistency B) Availability C) Forecast frequency D) Time spent on researching published data
Correct Answer is: ------------------------------------------------------------------------------------------------------------ Question 10 : For a firm competing on cost, which of the following is least likely to be true :
A) Products would be in mature stage of life cycle B) Products would be of low variety and high volume C) Use of high volume, dedicated equipment would increase costs D) Ideal process choice would be dedicated, high volume equipment – e.g.
automated assembly line Correct Answer is: ------------------------------------------------------------------------------------------------------------

74
Institute of Manufacturing Resource Management of India
SESSION 5
CAPACITY
MANAGEMENT

Session 5 – Capacity Management 75
Institute of Manufacturing Resource Management of India
Fundamental Concepts Introduction Capacity Management is concerned with supplying the necessary resources to achieve the priority plans. It address the questions like how much of capacity is available, how much is required and how to balance priority (demand) and capacity. Before discussing on capacity management further lets try to understand the Capacity and types of capacity. Capacity According to APICS Dictionary, Capacity is defined as “the capability of a worker, machine, work center or organization to produce output per period of time”. Thus it can inferred that capacity is the rate of doing work, not the quantity of work done.
Types of Capacity For effective and efficient capacity management two types of capacity can be identified - Capacity Available and Capacity required. Capacity Available : is the capacity of a system or resource to produce a quantity of output in given time period. Capacity Required : is the capacity of a system or resource needed to produce a desired output in given time period. Load : is a term closely related to capacity required. Load is the amount of released and planned work assigned to a facility for a particular time period.
Load Capacity Available Output

Session 5 – Capacity Management 76
Institute of Manufacturing Resource Management of India
These three terms are important for capacity management. Relationship between these can be pictured in the above diagram Capacity is often pictured as a funnel, capacity available is the rate at which work can be drawn from the system and load is the amount of work in the system.
Capacity Management – Definition Capacity Management can defined as “ the function of establishing, measuring, monitoring and adjusting limits or levels of capacity in order to execute all manufacturing schedules” – APICS dictionary. Thus capacity management is responsible for determining the capacity available and capacity required. Resolve the difference if any between them. And it is also about monitoring production output and work center capacity control.
Objectives of Capacity Management Following are the objectives of Capacity management: To determine the capacity needed to achieve the priority Provide, monitor and control the capacity so that priority plan can be met.
Capacity Management Process As all management process even capacity management process involve planning and control functions. Capacity planning process occurs at each level in the priority planning process, varying only in the level of detail and time spans involved. Capacity Control monitors the production output and takes corrective action when needed. Capacity Planning To determine the capacity needed to achieve the priority plans as well as providing, monitoring and controlling the capacity so that priority plan can be met. It involves calculating the capacity needed to achieve the priority plan and finding ways of making that capacity available. If the capacity requirement cannot be met then the priority plan will be changed.

Session 5 – Capacity Management 77
Institute of Manufacturing Resource Management of India
Capacity planning process is as follows: Identify the resources : Resources (ex., machine , manpower or work center) for
which capacity available and load will be measured need to be identified. Measure available capacity: Determine the capacity available at each work
center in each time period. Determine the Capacity Required: Determine the load at each work center in
each time period ◊ Translate the priority plan into the hour of work required at each work center in
each time period to determine the capacity required. ◊ Sum up the capacities required for each time on each work center to determine the
load on each work center in each time period. Resolve the Differences: Resolve differences between available capacity and
required capacity. If possible, available capacity should be adjusted to match the load. Otherwise the priority plans must be changed to match the available capacity.
Capacity Planning Levels and relationship with priority planning levels: This process occurs at each priority planning level (Production plan, master production schedule and materials requirement plan), varying only in the level of detail and time spans involved. Thus capacity plan links various priority plans to manufacturing resources. Resource Planning: involves long-range resource requirement planning and is directly linked to production planning. It involves translating quarterly or annual product priorities from the production plan into some total measure of capacity, such as gross labor hours. Resource planning involves changes in manpower, capital equipment, product design or other facilities that take long time to acquire and eliminate. If a resource plan cannot be devised to meet the production plan then production plan has to be changed. Rough-cut capacity planning: Purpose of rough-cut capacity planning is to check the feasibility of the MPS, provide warnings of any bottlenecks, ensure utilization of work centers and advise vendors of capacity requirements. Capacity Requirement Planning: is linked to Materials requirement planning. Since MRP focus on components parts, greater detail is involved in CRP. It is concerned with individual orders at individual work centers and calculates work center loads and labor requirements for each time period at each work center.
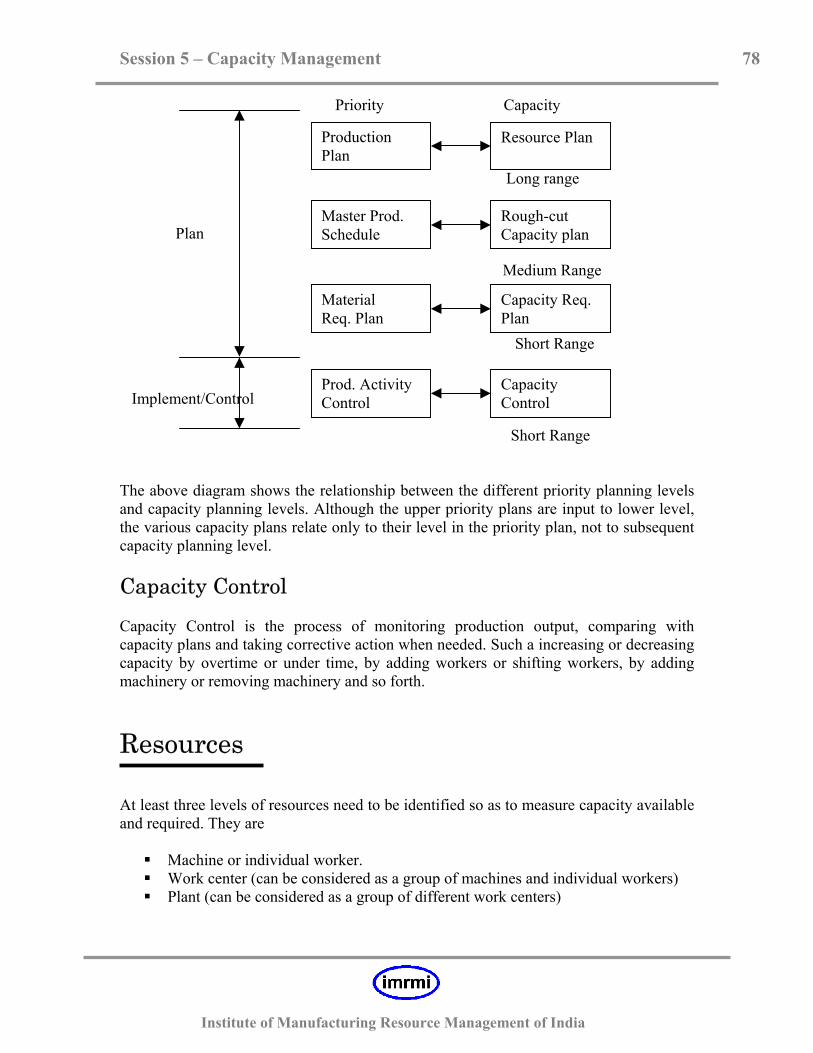
Session 5 – Capacity Management 78
Institute of Manufacturing Resource Management of India
Priority Capacity Long range Plan Medium Range Short Range Implement/Control Short Range The above diagram shows the relationship between the different priority planning levels and capacity planning levels. Although the upper priority plans are input to lower level, the various capacity plans relate only to their level in the priority plan, not to subsequent capacity planning level. Capacity Control Capacity Control is the process of monitoring production output, comparing with capacity plans and taking corrective action when needed. Such a increasing or decreasing capacity by overtime or under time, by adding workers or shifting workers, by adding machinery or removing machinery and so forth.
Resources At least three levels of resources need to be identified so as to measure capacity available and required. They are Machine or individual worker. Work center (can be considered as a group of machines and individual workers) Plant (can be considered as a group of different work centers)
Production Plan
Resource Plan
Master Prod. Schedule
Rough-cut Capacity plan
Material Req. Plan
Capacity Req. Plan
Prod. Activity Control
Capacity Control

Session 5 – Capacity Management 79
Institute of Manufacturing Resource Management of India
Measuring Available Capacity Before determining the Capacity Available, one need to understand the factors that affect capacity and the units used to measure capacity. Understanding and considering these will help in determining the capacity available more accurately. Factors Affecting Capacity Product Specifications If the product specifications change, the work content (work required to produce the product) will change, thus affecting the number of units that can be produced. Product Mix Each product has its own work content measured in the time it takes to make the product. If the mix of products being produced changes, the total work content (time) for the mix will change. Plant and Equipments This relates to the methods used to make the product. If the method is changed – for example, a faster machine is used the output will change. Similarly, if more machines are added to the work center, the capacity will change. Work Efforts This relates to the speed or pace at which the work is done. If the workforce changes pace, perhaps producing more in a given time, the capacity will be altered.
Capacity Measuring Units Units of Output If the variety of products at a work center is not large, it is often possible to use a unit common to all products. Ex., breweries measure capacity in barrels of beer, automobile manufacturers in number of cars. If a variety of products is made, a good common unit may not exists. In such case, the unit common to all products is time.

Session 5 – Capacity Management 80
Institute of Manufacturing Resource Management of India
Standard Time Using time-study techniques the standard time for a job can be determined—that is, the time it would take a qualified operator working at a normal pace to do the Job. It provides a yardstick for measuring work center content and a unit for stating capacity. It is useful in loading and scheduling.
Available Capacity As per APICS Dictionary, “The capability of a system or resource to produce a quality of output in a particular time period”. To calculate available capacity, we need to know Available time, Utilization and Efficiency. Available time : It is maximum Number of hours a work center can be used. It depends on the number of machines, the number of workers, and the hours of operation. Example A work center has six machines, operated for eight hours a day for five days a week. Calculate available time. Available time = 6 x 8 x 5 = 240 hrs per week Utilization : As a result of breakdown, maintenance a work center is not fully utilized. The Percentage of time the work center is actually used is called Utilization Utilization = hours actually worked /available hours x 100% Example: Calculate utilization if a work center is available for 160 hours a week, but produces for 100 hours only. Utilization=100 / 160 x 100% = 62.5% Efficiency : The workers working on the machine are not fully trained or machines are worn out & hence the output of machines will be less than standard hours of work as expected. It

Session 5 – Capacity Management 81
Institute of Manufacturing Resource Management of India
could happen visa versa also. Efficiency is a measure of actual out put of a work center compare to standard output expected. It is expressed in percentage. Efficiency = Actual rate of production / Standard rate of production x 100% Example: Calculate efficiency if a work center is used 100 hours per week and produces 120 hours of work. Efficiency=120 / 100 x 100% = 120%
Ways of Determining Capacity We have to two ways to determine the capacity available. Demonstrated (Measured) capacity is figured from historical data. Rated (calculated) is figured from available time, utilization and efficiency. Rated Capacity Rated Capacity is calculated by taking into account the work center utilization and efficiency. It is the product of available time, utilization and efficiency.
Rated Capacity = Available time x Utilization x Efficiency
Available time: is the number of hours work center can be used. It depends on the number of machines, the number of workers and the hours of operation. See the comprehensive example below. Utilization: The available time is the maximum hours we can expect from the work center. However, it is unlikely this will be attained all the time. Down time can occur due to machine break down, absenteeism, lack of material and all those problems that cause unavoidable delays. The Percentage of time that the work center is active compared to the available time is called work center utilization. See the comprehensive example below. hours actually worked
Utilization = --------------------------------- * 100 available hours Efficiency: It is possible for a work center to utilize 100 hours a week but not produce 100 standard hours of work. The workers might be working at a faster or slower pace than the standard working pace, causing the efficiency of the work center to be more or less than 100%. See the comprehensive example below.

Session 5 – Capacity Management 82
Institute of Manufacturing Resource Management of India
actual rate of production Efficiency = ------------------------------------ * 100 Standard rate of production Efficiency can be obtained from historical data if a record is maintained of the hours available, hours actually worked and the standard hours produced by a work center. Then it can also be calculated as: Standard hours of work produced Efficiency = ------------------------------------------* 100 Hours actually worked Comprehensive example: In One Week, a work center comprising 2 machines supposed to work 40 hours per week, produces 85 standard hours of work. Both machines actually worked for 75 hours. Calculate the following for work center available time, utilization, efficiency and rated capacity ? Available time per week = No. of machines x hours available per week
= 2 x 40 = 80 hours.
hours actually worked. Utilization = --------------------------------- x 100 available hours. 75 x 100 = ---------- 80
= 93.73 % Standard hours of work produced Efficiency = ---------------------------------------------- x 100 Hours actually worked
85 x 100 = ---------- 75
= 113.33% Rated capacity = Available time x Utilization x Efficiency (Note: if utilization and efficiency are in percentage then divide with 100) 80 * 93.75 * 113.33 = ----------------------------- = 85 hours 100 * 100

Session 5 – Capacity Management 83
Institute of Manufacturing Resource Management of India
Demonstrated Capacity One way to find out capacity of work center is to examine the previous production records and to use that information as the capacity available of the work center. It is average not maximum output. It also depends on the utilization and efficiency of the work center, although these are not included in the calculation
Sum (Output in the given periods) Demonstrated capacity = ---------------------------------------------- No. Periods
Example : Over the periods of six weeks, a work center produces 100, 120, 130, 140, 170, 180 standard hours of work. What is the demonstrated capacity of the work center?
Sum (Output in the given periods) Demonstrated capacity = ---------------------------------------------- No. Periods
100+120+130+140+170+180
Demonstrated capacity = ---------------------------------------------- 6 840 = ------ 6
= 140 Standard Hours.
Capacity Requirement Planning (CRP) Load : Load can be calculated by translating the planned orders & actual orders into time required by them into the time required at each work center in each period. Capacity requirements planning : The function of establishing, measuring, and adjusting limits or levels of capacity. It occurs at MRP level .The term capacity requirements planning in this context refers to the process of determining in detail the amount of labor and machine resources required to accomplish the tasks of production.

Session 5 – Capacity Management 84
Institute of Manufacturing Resource Management of India
Inputs To CRP : Open shop orders - Information available in Open order file
Planned order releases - Information available in MRP
Where work is done - Information available in Routing file
Time needed in standard hours - Information available in Routing file
Lead times - Information available in Routing file or work center file
Open shop orders and planned orders in the MRP system are input to CRP, which through the use of parts routings and time standards translates these orders into hours of work by work center by time period. Even though rough-cut capacity planning may indicate that sufficient capacity exists to execute the MPS, CRP may show that capacity is insufficient during specific time periods. Shop Calendar Another input required by CRP is no of days available for the production, The Gregorian calendar which we use daily has following drawbacks & cannot be used.
o Numbers of days are not same in all Months o Uneven spread of holidays o The calendar does not use a decimal system
To overcome this problem, shop calendar as shown below is used.
Sunday Monday Tuesday Wednesday Thursday Friday Saturday
1 1 2 2 3 3 4 4 5 5 6
7 8 6 9 7 10 8 11 9 12 10 13
14 15 11 12 12 17 13 18 14 19 15 20
21 22 16 23 17 24 18 25 19 26 20 27
28 29 21 30 22 31 23

Session 5 – Capacity Management 85
Institute of Manufacturing Resource Management of India
Manufacturing Lead Time The total time required to make an item, once the order is released is called Manufacturing Lead time. For make-to-order products, it is the length of time between the release of an order to the production process and shipment to the final customer. For make-to-stock products, it is the length of time between the release of an order to the production process and receipt into finished goods inventory. Included here are order preparation time, queue time, setup time, run time, move time, inspection time, and put away time. Synonyms: manufacturing time, production cycle, and production lead-time. Manufacturing Lead-time contains five components, Queue : Waiting before machine as some other job is going on Setup : Time taken for changing over to a new set of production parameters Run : Actual operation time on machine Wait : After end of operation part is waiting to be moved to next operation Move : Actual time taken to move the part to next operation In most of the manufacturing environment Queue time is the biggest of total manufacturing Lead-time & approximately accounts for 70 -80 % Schedule the Orders First step in CRP is to determine when orders should be started and completed on each work center. Calculate the operation time required at each work center Operation time = setup time + (run time per piece x number of pieces) Allow for queue, wait, and move times. Order quantity 100 units From route sheet Operation Work center Setup time
(std hrs) Runtime (Std hrs)
Totaltime (std hrs)
Days
10 1 2.0 0.2 22 3 20 2 1.5 0.3 31.5 4

Session 5 – Capacity Management 86
Institute of Manufacturing Resource Management of India
From work center files Work Center Queue (days) Wait (days) Move (days) 1 2 1 1 2 4 1 1 Schedule Operation Work
Center Arrival date
Queue (days)
Operation (days)
Finish Date
Wait and Move
10 1 101 2 3 106 2 20 2 108 4 4 116 2 Store Stores 118 The scheduling rule to convert hours to days is to round up to the nearest eight hours and express as days on a one-shift basis. Load profile : Capacity required at a work center based on planned and released orders for each time period Example : Work Center: 1 Rated capacity: 120 standard hours/week Week 12 13 14 15 Total Released load
105 100 90 40 335
Planned load 50 70 120 Total load 105 100 140 110 455 Rated capacity
110 110 110 110 440
Over/under capacity
5 10 (30) 0 (15)
Resolve the Differences (Capacity Plan) Ideally, the required capacity and available capacity should be equal. If available capacity is more than the required capacity, resources may not be used to the fullest. If available capacity is less than the required capacity, the priority plan cannot be met.

Session 5 – Capacity Management 87
Institute of Manufacturing Resource Management of India
To resolve the difference: Adjust Capacity by: Overtime or under time Hiring or layoff Shift work force Alternate routings Subcontract
Alter load by: Alter lot sizes Reschedule Split Operation Operation Overlapping
Altering the load may complicate the schedule for other work centers.

Session 5 – Capacity Management 88
Institute of Manufacturing Resource Management of India
Key Terminology 01) Capacity 02) Capacity Available 03) Capacity Management 04) Capacity Required 05) Capacity Requirements Planning 06) Demonstrated Capacity 07) Load 08) Load Leveling 09) Manufacturing Lead Time 10) Move Time 11) Queue Time 12) Rated Capacity 13) Run Time 14) Shop Calendar 15) Start Date 16) Wait Time 17) Work Center

Session 5 – Capacity Management 89
Institute of Manufacturing Resource Management of India
Practice Questions – Session 5 Question 1 : Identify the correct relationships between the capacity planning levels and priority planning levels : A) Resource Requirement Plan – Production Plan
B) Rough-cut Capacity Plan – Master Production Schedule C) Capacity Requirement Plan – Material Requirement Planning D) All the above
Correct Answer is: ------------------------------------------------------------------------------------------------------------ Question 2 : All of the following resources are required to measure the available capacity expect :
A) Work Center B) Individual Machines C) Individual Workers D) Suppliers
Correct Answer is: ------------------------------------------------------------------------------------------------------------ Question 3 : The following are the primary factors affecting capacity expect :
A) Product Mix B) Plant and Equipment C) Work Efforts D) Warehouse Management System
Correct Answer is: ------------------------------------------------------------------------------------------------------------ Question 4 : A work-center has 5 machines. Working hours of the work-center are from 9.00 AM to 5.00 PM (Monday to Friday). What is the available time in hours, of the work-center per week :
A) 100 B) 200 C) 300 D) 400
Correct Answer is: ------------------------------------------------------------------------------------------------------------

Session 5 – Capacity Management 90
Institute of Manufacturing Resource Management of India
Question 5 : A work-center has 10 machines and operates for 8 hrs a day, 5 days a week. The operators working on machines 5 and 6 were in a training program for the first 2 days of the week and no suitable replacement could be found. Due to this, the work-centers’ actual production in that week was 300 hours. The utilization of the work-center was :
A) 25 % B) 50 %
C) 75 % D) 100 % Correct Answer is: ------------------------------------------------------------------------------------------------------------ Question 6 : What is the efficiency of a work-center if it is used for 200 hours/week and produces 150 hours of work per week :
A) 25 % B) 50 %
C) 75 % D) 100 %
Correct Answer is: ------------------------------------------------------------------------------------------------------------ Question 7 : Which of the following is correct :
A) Rated Capacity = (Available time / Utilization) x Efficiency B) Rated Capacity = (Available time / Efficiency) x Utilization C) Rated Capacity = Available time x Efficiency x Utilization D) Rated Capacity = Available time + Efficiency + Utilization
Correct Answer is: ------------------------------------------------------------------------------------------------------------ Question 8 : Which of the following is not a direct input to CRP :
A) Open Shop Orders B) Planned Order Releases C) Time Required in Standard Hours D) MPS Requirements
Correct Answer is: ------------------------------------------------------------------------------------------------------------ Question 9 : Which of the following is not correct about lead times :

Session 5 – Capacity Management 91
Institute of Manufacturing Resource Management of India
A) Setup Time – time taken for changing over to a new set of production
parameters B) Run Time – actual time taken to move the part to the next operation C) Wait Time – after end of operation, part is waiting to be moved to the next operation D) Queue Time – waiting before a machine as some other job is under process
Correct Answer is: ------------------------------------------------------------------------------------------------------------ Question 10 : Which of the following can be done to resolve capacity differences :
A) Shifting work force B) Subcontracting C) Altering lot sizes D) All the above
Correct Answer is: ------------------------------------------------------------------------------------------------------------
92
Institute of Manufacturing Resource Management of India
SESSION 6
PLANNING

Session 6 - Planning 93
Institute of Manufacturing Resource Management of India
The Planning Hierarchy Manufacturing companies produce a wide variety of products. Each manufacturing company differs from the other in the type and number of products manufactured, the processes and equipment used, the labour skills and materials required etc., To be profitable, every manufacturing company must produce the right goods at the required time and of right quality and at minimum costs. The system which helps every manufacturing company in attaining profitability by planning and coordinating the various resources of the company, by linking the several functions involved and which forms the core of practically every manufacturing company is the ‘manufacturing planning system’.
S T R A T E G I C P L A N N I N G
B U S I N E S S P L A N N I N G
RESOURCE
PRODUCTION REQUIREMENT PLANNING PLANNING MASTER ROUGH-CUT PRODUCTION CAPACITY SCHEDULE PLANNING MATERIAL CAPACITY REQUIREMENT REQUIREMENT PLANNING PLANNING
E X E C U T I O N
Figure 6.1 - Manufacturing Planning System

Session 6 - Planning 94
Institute of Manufacturing Resource Management of India
The planning hierarchy includes a top-down, step by step planning process, effective at each level in the manufacturing planning system as described below. Strategic Planning : Strategic plans are high level plans based on the overall organizational perspective and are devised by the top management of the company. They extend into longer periods into the future, usually 2 to 10 years and talk about the strategic direction of the firm. The strategic plans address the competitive characteristics of the firm and establish the long-term objectives in terms of the markets served, types of products etc., Planning for the necessary resources becomes an integral part of the strategic planning process. Business Planning : Based on the strategic plans of a company, the business plans define the objectives of the various functions of the company on an aggregate level. The business plans being more financially oriented include the income, cost and profit objectives of the company. The business plans address and drive the sales, manufacturing finance and other activities of the organization in order to achieve the set objectives. The planning horizon usually extends from 12 to 18 months into the future and the resource requirements necessary to achieve the business plans are an integral part of the business planning process. Production Planning : Production plans include the planning of the manufacturing facilities required to support the business plan. Production plans determine the overall level of the manufacturing output broken down by quarterly or monthly time periods and ensures the integration between the production function and the business plan. Production plans are responsible for setting the overall production objectives and determine the production rates, desired inventory levels and resource requirements. The resource requirements plan determines the requirements of the key resources and evaluates the availability of these key resources to achieve the production plan. Master Production Schedule : Master production schedule is a plan for the production of individual end items. The production plan determines the manufacturing output for families or groups of products by time periods. The master production schedule breaks down the production plan into the plan for manufacturing individual end items by time period. For each individual end item, master production schedule takes into consideration the forecast, actual customer orders, desired inventory levels and capacity in determining the master production schedule requirements. The master production schedule hence acts as an interface between production and marketing functions. Rough-cut capacity planning helps in identifying and evaluating the bottleneck resources involved in achieving the master production schedules. Material Requirements Planning : The master production schedule plans for the end item requirements by time period. Each end item is made up of a number of manufactured and purchased components. Material requirements plan is a plan for determining and scheduling the production and purchase of the various components of the end items necessary to support the master production schedule. Capacity Requirements planning determines the detailed requirements of the amount of labour and

Session 6 - Planning 95
Institute of Manufacturing Resource Management of India
equipment resources needed to achieve the production of components planned by the material requirements plan. Material requirements plan is the final level of the planning hierarchy and forms the inputs for the execution functions of production and purchasing. In the planning hierarchy, as we move from the strategic planning to the material requirements planning through the various planning levels,
The purpose of the plans change from a broad general strategic direction to detailed component plans
The planning horizon decreases from years to months to days
The level of detail increases from general product categories to specific individual
components
The planning review periods decrease from monthly reviews to daily reviews
The resource requirements change from determining general resource availability to calculating detailed labour and equipment resource requirements.
Strategic Planning & Business Planning
Strategic Planning According to APICS dictionary, Strategic plan is defined as the plan for how to marshal and determine the actions to support the mission, goals, and objectives. Generally includes an organization’s explicit mission, goals and objectives, and the specific actions needed to achieve those goals and objectives Strategic Fundamentals Strategic plans are high level plans devised by the top management of the company and generally extend three to five years into the future. They include a statement of the charter of business, the type of business the company does and intends to do and sets the broad direction for the company in terms of markets entered, type of products manufactured and the manufacturing practices followed. Strategic plans form the basic inputs to the subsequent planning levels of the manufacturing resource planning (MRP II) Strategy specifies the scope of the business of company and addresses the basis on
which its business will achieve and maintain a competitive advantage.

Session 6 - Planning 96
Institute of Manufacturing Resource Management of India
Strategy involves plans that have long-term impact on the organization and is collectively devised by the senior management of the company.
Strategy comprises the collective strategies of the functional units of the company
viz., manufacturing, finance, marketing, R&D and human resources and aims at setting a direction for the firm
Strategic Planning Process and Strategy Model The strategic planning process involves the following tasks Developing a strategic vision and mission Setting strategic objectives Evaluating External Influences Analyzing Internal Strengths and Weakness Executing / Formulating the strategic objectives Evaluating and making necessary adjustments
Developing a Strategic Vision and Mission : The strategic vision sets the long-term direction for the company’s future and addresses the values and aspirations of the company. Vision is an organizations’ sense of purpose. It is clear, inspiring and it prepares the organization for the future. Mission gives specific direction consistent with the general goals articulated in the vision and thus provides a foundation for the strategic plans of the organization. Setting Strategic Objectives : Based on the mission statement, the next key element is to explicitly state the business's Objectives in terms of the results it needs/wants to achieve in the medium/long term. Objectives should relate to the expectations and requirements of all the major stakeholders and should reflect the underlying reasons for running the business. These objectives could cover growth, profitability, technology, offerings and markets. Evaluating External Influences : The various external influences which impact the strategic objectives both of an organization, both in the current and future time periods include
o Competition o Legal / Governmental rules, policies, regulations, other constraints o Social Environment o Economic Conditions o Technology Trends
Analyzing Internal Strengths and Weakness : The exercise of analyzing the internal strengths and weakness on all functional areas help the firm in focusing on its strengths to

Session 6 - Planning 97
Institute of Manufacturing Resource Management of India
gain a competitive advantage and to improve on the identified weakness to decrease the vulnerability to competitor initiatives Executing / Formulating the strategic objectives : In the Strategy formulation stage, the goals and objectives of the firm are coordinated with the internal and external influencing factors and with the needs and wants of the customers. The organization may formulate a number of alternative strategies to meet the expected objectives of the firm Evaluating and making necessary adjustments : In this final phase of strategic planning process, the chosen strategy is reviewed and evaluated for determining the possible problems or changes that may occur during implementation of the strategy. Firms must develop contingency plans that will specify the steps to be taken to accommodate the disruptions.
Vision and Mission
Corporate Objectives
Environment Scanning / External Influences
Internal Strength and Weakness Analysis
Corporate Strategy
Functional Strategy
Figure 6.2 - Strategy Model Functional Strategy : The functional strategies which include the marketing, manufacturing, finance and R&D strategies are the next logical extensions of the overall firm strategy.

Session 6 - Planning 98
Institute of Manufacturing Resource Management of India
Business Planning According to APICS dictionary, business plan is defined as a statement of long-range strategy and revenue, cost, and profit objectives usually accompanied by budgets, a projected balance sheet, and a cash flow (source and application of funds) statement. A business plan is usually stated in financial terms and grouped by product family. The business plan, the sales and operations plan, and the production plan, although frequently stated in different terms, should agree with each other. Introduction to Business Planning The business plans include a statement of the long-range strategy and income, cost and profit objectives. It is usually stated in financial terms and is grouped by product families. The business plan integrates inputs from and provides plans necessary to drive the activities of finance, marketing, human resources, operations and other departments. The top management develops and implements the business plan. Business plans have a long time horizon, typically extending 12 to 18 months into the future. The business plans have more far-reaching strategic implications and define the following
o Product Positioning Strategy o Sales and Marketing Strategy o Types of Markets served / to be served o Manufacturing Process Decisions o Resource Requirement Decisions o Capital and Investment Decisions o Manufacturing Infrastructure Decisions
Common Features of a Business Plan Though the business plan features vary from organization to organization, the common features that can generally be found in business plans include The nature of the firm, defined by its
o Locations and facilities o Organization and people o Levels of processing technology o The type and nature of capital resources required o Major suppliers o Primary investors

Session 6 - Planning 99
Institute of Manufacturing Resource Management of India
The client base of the firm o Location o Growth rates o Changing client needs o Regional economic considerations and business conditions affecting client
needs The business environment of the firm
o Major competitors o Projections of business growth, including environmental threats and
opportunities o Availability of financial resources o Emerging technologies
Business Planning Cycle
BUSINESS PLANNING FORECASTS
PRODUCTION & RESOURCE PLANNING (Check Resources)
MPS & RCCP MRP & CRP
(Check Plans)
PURCHASING PAC / SFC
EVALUATION
Figure 6.3 - Business Planning Cycle
The business planning cycle spans across the long-to-mid range activities of business planning, forecasting, production & resource planning, mid-to-short range MPS, RCCP, MRP and CRP, short range activities of purchasing, PAC and finally the evaluation

Session 6 - Planning 100
Institute of Manufacturing Resource Management of India
criteria of the production operation involving the elements of cost, quality, delivery and flexibility. The feedback loops and the appropriate evaluation /checking for resources, validating the plans as indicated in the figure form the process of the business planning cycle.
Sales & Operations / Production Planning
Production and Resource Planning After establishing the strategic plan and the business plans, the process of setting the overall level of manufacturing output, consistent with the above plans is known as production planning. Production planning is concerned with the quantities of each product group to be manufactured in each period, in line with the objectives of marketing, finance and other components of the business plan and hence planning is done for product groups. The planning horizon is usually 6 to 18 months into the future and is reviewed quarterly or monthly. The resource plan considers the availability of key resources as part of the capacity evaluation and plans for the necessary capacity adjustment in order to support the production plans. Objectives of Production and Resource Planning To effectively integrate the production function with the other activities of the planning system and to support the management objectives of establishing the required production rates, related inventory levels and the management of key resources, production and resource planning must meet the following objectives : Realistic and valid plans : To prepare plans that are realistic and valid in terms of
supporting the higher level strategic and business plans and ensuring that the required resources are available in achieving these plans.
Integration with other activities : To ensure proper integration of the production
and resource plans with the other activities of the business plans and to have the appropriate communication system.

Session 6 - Planning 101
Institute of Manufacturing Resource Management of India
Top management involvement and feedback : To involve the top management in decisions related to operational and strategic inputs to the production and resource planning and to have an appropriate feedback mechanism to the higher planning levels.
Linking planning levels : To form the link between the higher planning levels and
the next detailed planning levels of Master Production Schedule. Driving the MPS : To form the inputs to and drive the master production scheduling
and the subsequent short-range planning activities of the planning system. Functions of Production and Resource Planning Production and resource planning essentially perform the following functions in order to meet the corporate objectives Providing Alternative Production Planning Strategies : Provide the top
management with the alternative production and resource planning strategies with their associated costs. This helps top management in evaluating the various production planning alternatives and in determining the best suitable strategy which meets the strategic and business goals of the company.
Establishing Product Groups and Schedules : Since the production and resource
planning plan on an aggregate level of product groups, one of the functions of the production and resource planning is to establish the appropriate product groups and their schedules to meet the objectives of marketing, finance and other components of the business plan. The product groups are usually established based on the similarity of the manufacturing processes.
Time Phasing the Production Plan : Time phasing the production plan resulting in
o The plan becoming firm as time, resources and financial commitments are
made
o Coordinating the planned schedule with each of the key functions of the firm viz., manufacturing, sales, finance, engineering, human resources and ensuring that the planned schedule is acceptable across these functions and that it meets the goals of the organization.
Alternative Strategies and Costs Involved

Session 6 - Planning 102
Institute of Manufacturing Resource Management of India
Alternative Strategies Production Planning provides the top management with a variety of ‘what if’ alternatives with their associated costs in order to facilitate selection of the best suitable plan to meet the corporate objectives. The strategies that can be used in developing a production plan include
Chase Strategy Level Strategy Subcontract Strategy Hybrid / Compromise Strategy
Chase Strategy : This strategy is also known as the demand matching strategy as it involves producing the amount of goods required to exactly meet the demand at any given point of time. D E M A N D Demand Production TIME Figure 6.4 - Graphical Representation of Chase Strategy Since Production matches demand, production varies according to the demand resulting in the inventory to be constant. The advantage of this strategy is that a constant level of inventory can be maintained but there is variation in the production capacity based on the variations in the production rates. As an example, consider the six period forecast demand for a product group as shown in figure 6.3.

Session 6 - Planning 103
Institute of Manufacturing Resource Management of India
Chase Strategy
Period 1 2 3 4 5 6 Total Forecast Demand 10 15 10 15 25 15 90
Production Plan 10 15 10 15 25 15 90
Inventory
30 30 30 30 30 30 30 180
Capacity Changes -- 1 1 1 1 1 5
Figure 6.5 - Chase Strategy The total of the forecast demand is 90. In the chase strategy since production matches demand, production plan in each period is same as the demand in each period. Assuming the beginning inventory is 30, inventory remains constant through the six periods as indicated but the total inventory carried at the end of the sixth period is 180. Since the production rates vary based on the demand, the capacity to produce also varies accordingly and hence the number of times the capacity varies sums up to 5. Level Strategy : Level strategy or the production leveling strategy involves producing in each period an amount equal to the average of the total demand for a given planning horizon. D E M A N D Demand Production TIME Figure 6.6 - Graphical Representation of Level Strategy

Session 6 - Planning 104
Institute of Manufacturing Resource Management of India
Since the production is leveled, the production rate remains constant resulting in the variation of the inventory levels based on the difference between demand and production. This strategy has the advantage of having a constant production capacity irrespective of the variations in demand resulting in a stable work force but the building up of inventory during slack demand periods incurs high carrying costs. Considering the demand to be same as shown in figure 6.3, the level strategy can be calculated as shown in figure 6.5 The total demand for the 6 periods sums up to 90 and the average demand is 15. In the level strategy, the production for each period is planned to be the average demand and hence each period production is 15. Assuming the beginning inventory to be 30, the changes in inventory levels based on the difference between the demand and the production is as indicated and the total inventory carried at the end of the sixth period is 210. Since there is no change in the production capacity, the change in production capacity is zero. Level Strategy
Period 1 2 3 4 5 6 Total Forecast Demand 10 15 10 15 25 15 90
Production Plan 15 15 15 15 15 15 90
Inventory
30 35 35 40 40 30 30 210
Capacity Changes -- -- -- -- -- -- 0
Figure 6.7 - Level Strategy Subcontract Strategy : This strategy involves continuously producing an amount equal to the minimum of the demand over the planning horizon and subcontracting the extra demand.

Session 6 - Planning 105
Institute of Manufacturing Resource Management of India
D E M A N D Demand Production TIME Figure 6.8 - Graphical Representation of Subcontract Strategy This strategy has the advantage of maintaining a level production rate resulting in the requirement of a constant production capacity and maintaining constant inventory levels but the costs incurred in subcontracting the extra demand compared to the cost of producing them in the plant are generally high. As an example, consider the forecast demand for six periods as shown in figure 6.7.
Subcontract Strategy
Period 1 2 3 4 5 6 Total Forecast Demand 10 15 10 15 25 15 90
Production Plan 10 10 10 10 10 10 60
Inventory
30 30 30 30 30 30 30 180
Subcontract amount 0 5 0 5 15 5 30
Capacity Changes -- -- -- -- -- -- 0
Figure 6.9 - Subcontract Strategy The minimum of the forecast demand over the six periods is 10 and hence the production plan per period is 10 summing up to 60. Since the production is leveled at 10 per period, inventory is constant and the total inventory carried at the end of the sixth period is 180. The total amount subcontracted is 30 and there are no production capacity changes.

Session 6 - Planning 106
Institute of Manufacturing Resource Management of India
Hybrid Strategy : The chase strategy, level strategy and subcontract strategy are known as pure strategies and each of these strategies have their own cost implications in terms of carrying inventory, changing production capacity, subcontracting etc., To achieve cost benefits, a number of combinations of these strategies can be formulated which are known as the hybrid strategies D E M A N D Demand Production TIME Figure 6.10 - Graphical Representation of a Hybrid Strategy Considering the same example with the forecast demand for six periods as shown in figure 6.9, one of the possible hybrid strategies could be to produce an amount of 30 in periods 3, 4 and 5 with no production in the other periods. The beginning inventory is assumed to be 30. This inventory meets the demand for periods 1 and 2. The production capacity changes from period 2 to 3 and again from period 5 to 6.
Hybrid Strategy
Period 1 2 3 4 5 6 Total Forecast Demand 10 15 10 15 25 15 90
Production Plan 0 0 30 30 30 0 90
Inventory
30 20 5 25 40 45 30 165
Capacity Changes -- -- 1 -- -- 1 2
Figure 6.11 - Hybrid Strategy

Session 6 - Planning 107
Institute of Manufacturing Resource Management of India
Costs Involved in the Various Strategies The basic costs involved in the alternate production planning strategies include
Base Production Costs Inventory Costs Production rate / Production Capacity Change Costs Capacity Related Costs
Base Production Costs : These are the base costs incurred for producing each unit which include the cost components of labor, equipment, material, overhead etc., These costs are the same for all alternative strategies and are not generally considered while comparing the costs of various alternative production planning strategies Inventory Costs : These costs include the cost of holding and carrying inventory. Costs of stockout, pilferage, obsolescence etc., are also part of inventory costs. Production rate / Production Capacity Change Costs : These costs include the change in production rates or the production capacity caused due to starting / stopping a production facility, Hiring and lay-offs, change in resources etc., Capacity Related Costs : These costs are incurred due to capacity related changes caused by subcontracting, outsourcing, working Overtime etc., In the examples considered to illustrate the various production planning strategy alternatives, the costs can be calculated and compared by considering the following assumptions Base Production Cost is Rs. 5per unit Inventory Carrying Cost is Rs. 2 per unit One time Production Rate / Production Capacity Change Costs is Rs. 20 Capacity Related Cost (Subcontracting Cost) is Rs. 4 per unit Costs of Chase Strategy
Period 1 2 3 4 5 6 Total Forecast Demand 10 15 10 15 25 15 90
Production Plan 10 15 10 15 25 15 90
Inventory
30 30 30 30 30 30 30 180
Capacity Changes -- 1 1 1 1 1 5

Session 6 - Planning 108
Institute of Manufacturing Resource Management of India
Base Production Cost = 90 units x Rs. 5 per unit = Rs. 450 Inventory Carrying Cost = 180 units x Rs. 2 per unit = Rs. 360 Production Rate Cost = 5 times x Rs. 20 per change = Rs. 100 Capacity Related Cost – (not incurred)
Total Costs = Rs. 910 Costs of Level Strategy
Period 1 2 3 4 5 6 Total Forecast Demand 10 15 10 15 25 15 90
Production Plan 15 15 15 15 15 15 90
Inventory
30 35 35 40 40 30 30 210
Capacity Changes -- -- -- -- -- -- 0
Base Production Cost = 90 units x Rs. 5 per unit = Rs. 450 Inventory Carrying Cost = 210 units x Rs. 2 per unit = Rs. 420 Production Rate Cost = 0 times x Rs. 20 per change = Rs. 0 Capacity Related Cost – (not incurred)
Total Costs = Rs. 870 Costs of Subcontract Strategy
Period 1 2 3 4 5 6 Total Forecast Demand 10 15 10 15 25 15 90
Production Plan 10 10 10 10 10 10 60
Inventory
30 30 30 30 30 30 30 180
Subcontract units 0 5 0 5 15 5 30
Capacity Changes -- -- -- -- -- -- 0
Base Production Cost = 60 units x Rs. 5 per unit = Rs. 300 Inventory Carrying Cost = 180 units x Rs. 2 per unit = Rs. 360 Production Rate Cost = 0 times x Rs. 20 per change = Rs. 0 Capacity Related Cost = 30 units x Rs. 4 per unit = Rs. 120
Total Costs = Rs. 780

Session 6 - Planning 109
Institute of Manufacturing Resource Management of India
Costs of Hybrid Strategy
Period 1 2 3 4 5 6 Total Forecast Demand 10 15 10 15 25 15 90
Production Plan 0 0 30 30 30 0 90
Inventory
30 20 5 25 40 45 30 165
Capacity Changes -- -- 1 -- -- 1 2
Base Production Cost = 90 units x Rs. 5 per unit = Rs. 450 Inventory Carrying Cost = 165 units x Rs. 2 per unit = Rs. 330 Production Rate Cost = 2 times x Rs. 20 per change = Rs. 40 Capacity Related Cost – (not incurred)
Total Costs = Rs. 820 System Design Considerations The factors to be considered in the design and development of a production planning system include Planning Time Horizon : The planning time horizon should extend sufficiently into the future to accommodate the demand trends for product groups, to realize the market environment and to handle necessary changes to the plans as required and the planning time horizon must also include periodic updates and reviews. Characteristics of Demand : The Plan must address the characteristics of demand which involve seasonal and fluctuating demand patterns for families or groups of products. Aggregation Levels and Resource Commitments : In the distant periods the plan is stated in more aggregate terms of product families, resource requirements etc., and in the nearer periods of the production plan, the level is more detailed and requires that the plant and necessary equipment are fixed. Management Objectives : The production planning system must support the management objectives of estimated production rates, desired inventory levels, expected customer service levels, efficient plant operations etc., Manufacturing Environments : Manufacturing environments form an important criteria in the production planning system design as they influence the planning decision and the computation of the production rates.

Session 6 - Planning 110
Institute of Manufacturing Resource Management of India
Production planning in a Make-to-Stock (MTS) Environment : In a Make-to-Stock environment, products are manufacturing and inventoried. Sales of products are done from the inventory. Computation of the total production and production rates is as shown below
Total Production = Total Forecast + back orders + ending inventory – opening inventory
For a Level Strategy, Production Rate = Total Production / Number of periods For a Chase Strategy, Production Rate = Demand Problem 6.1 - Level Production Planning Strategy in a MTS Environment : Given the following data, Calculate the total production, the production rates and the inventory levels
Opening Inventory = 100 units Desired Ending Inventory = 80 units Period 1 2 3 4 5 6 Total Forecast Demand 100 120 130 110 120 100 680
Production Plan 110 110 110 110 110 110 660
Ending Inventory 110 100 80 80 70 80
(Total Production = Total Forecast Demand + Ending Inventory – Opening Inventory) Total Production = 680 + 80 – 100 = 660 Units (Production Rate (level strategy) = Total Production / Number of Periods) Production rate = 660 / 6 = 110 units per period (Ending Inventory for period 1 = Opening Inventory + Production – Forecast) Ending Inventory for period 1 = 100 + 110 – 100 = 110 units. Ending Inventory for the remaining periods are calculated similarly Problem 6.2 - Chase Production Planning Strategy in a MTS Environment : Given the following data, calculate cost of production rate change, inventory carrying cost and the total cost of the strategy
Cost of Changing production level = Rs. 10 per unit Opening Inventory = 20 units Inventory Carrying Cost = Rs. 3 per unit

Session 6 - Planning 111
Institute of Manufacturing Resource Management of India
Period 1 2 3 4 5 6 Total Forecast Demand 100 120 130 110 120 110 690
Production Plan 100 120 130 110 120 110 690
Change in Production 0 20 10 20 10 10 70
Ending Inventory 20 20 20 20 20 20 120
(Total Production = Total Forecast Demand + Ending Inventory – Opening Inventory) Total Production = 690 + 20 – 20 = 690 Units (Production Rate (chase strategy) = Demand in each period) Cost of changing production level = Rs. 10 per unit x 70 units = Rs. 700 Cost of carrying inventory = Rs. 3 per unit x 120 units = Rs. 360
Total Cost of the strategy = Rs. 1060
Production planning in a Make-to-Order (MTO) Environment : In a Make-to-Order environment, products are manufactured after the receipt of customer orders for that product. Hence there is no buildup of inventory of the finished goods but takes into account the amount of customer orders to be fulfilled which is also known as the backlog of customer orders. Computation of the total production and production rates is as shown below
Total Production = Total Forecast + opening backlog - ending backlog For a Level Strategy, Production Rate = Total Production / Number of periods For a Chase Strategy, Production Rate = Demand Problem 6.3 - Level Production Planning Strategy in a MTO Environment : Given the following data, calculate the total production, production rates and per period backlogs
Beginning Backlog = 200 units Desired Ending Backlog = 110 units Period 1 2 3 4 5 6 Total Forecast Demand 110 120 130 110 120 100 690
Production Plan 130 130 130 130 130 130 780
Ending Backlog 180 170 170 150 140 110
(Total Production = Total Forecast Demand + Beginning Backlog – Ending Backlog) Total Production = 690 + 200 – 110 = 780 Units
Session 6 - Planning 112
Institute of Manufacturing Resource Management of India
(Production Rate (level strategy) = Total Production / Number of Periods) Production rate = 780 / 6 = 130 units per period (Backlog for a period = Old Backlog + Forecast Demand - Production) Backlog for period 1 = 200 + 110 – 130 = 180 units Backlog for period 2 = 180 + 120 – 130 = 170 units Backlog for period 3 = 170 + 130 – 130 = 170 units Backlog for period 4 = 170 + 110 – 130 = 150 units Backlog for period 5 = 150 + 120 – 130 = 140 units Backlog for period 6 = 140 + 100 – 130 = 110 units Production planning in a Assemble-to-Order (ATO) Environment : ATO forms
a subset of the MTO environment and caters to products with various options. In this environment, standard components are manufactured and stocked and depending on the customer orders, the required components are assembled to meet the required customer options. Hence there is buildup of inventory of standard components and backlog of the customer orders. Computation of the total production and production rates is as shown below
Total Production = Total Forecast + (ending inventory - opening inventory ) of standard components / semi-finished goods + (beginning backlog - ending backlog) of customer orders For a Level Strategy, Production Rate = Total Production / Number of periods
For a Chase Strategy, Production Rate = Demand Production Planning Process The process of establishing an agreed upon and a do-able production plan which realizes the higher level business plans and strategic plans involves the formal process of communication, coordination and integration within the planning hierarchy and the various functions of the organization. The production planning processes generally involves the following activities. The Data Collection Process : It involves collecting the necessary input data from
the various sources of demand with the provision to accommodate sudden changes and probable fluctuations in demand.
The Sales Plan Development Process : Forecasts are indicators of demand patterns
over long planning horizons and are based on the historical data. However, in the nearer periods of the planning horizon, this data is evaluated and processed to develop the sales plan. The sales plan helps in establishing the requirements and also includes any changes to be incorporated due to promotions, advertisements, product mix changes etc.,

Session 6 - Planning 113
Institute of Manufacturing Resource Management of India
The Capacity Planning Process : It involves determining the availability of adequate capacity and material resources to support the aggregate plans under the various conditions and if required, in establishing the best alternatives of adjusting production capability in the form of subcontracting, Overtime, etc.,
The Partnership Meeting Process : The partnership meeting provides the forum for
communication and coordination between the various functions of the company. It considers the strategic and business plans of the company and guides the specific ways of achieving these plans, often stated in broad and general terms of expected aggregate volume of product groups, production capacities etc., These meetings are held monthly or quarterly and form the basis for the production planner to make a production plan in tune with the production and sales objectives. The participant list for the partnership meeting include the General Manager / President and the Heads / Managers of the following departments
o Sales o Marketing o Manufacturing o Engineering o Finance o Human Resources o Material Management o Quality
And the agenda for the partnership meeting includes the following
o Special Issues o Performance Reviews of the Company o Product Reviews by groups / families o New Products o Special Projects
Resource Planning Process The formulated production plan must be validated to ensure the availability of the critical resources to achieve the plan and in the cases of difference between the requirement and availability of these critical resources, necessary actions of either adjusting the capacity or revising the plans must be done. The critical resources generally are a combination of equipment time, labour, material with long lead-times, financial resources, storage facilities etc., and influence the production process in devising the production plans and production rates.

Session 6 - Planning 114
Institute of Manufacturing Resource Management of India
The resource planning process generally involves the following Obtaining a production plan for a product group / family by time period Determining the product structure for each product group / family To obtain the ‘Bill of Resources’ for each product group / family To calculate the total resource requirements To evaluate against the available capacity Resolving the differences, if any, by adjusting the capacity or the plans
Let us consider the following example and calculate the resource requirements. The level production plan for a product group ‘plastic utilities’ is as given below Level Strategy for ‘plastic utilities’
Period 1 2 3 4 5 6 Total Forecast Demand 500 1000 500 1000 2000 1000 6000
Production Plan 1000 1000 1000 1000 1000 1000 6000
Inventory
0 500 500 1000 1000 0 0 3000
Capacity Changes -- -- -- -- -- --
The product structure for the product group ‘plastic utilities’ with the products and the percentage of each product in the product group is as given below
Plastic Utilities Plastic Drums Waste Bins Plastic Buckets 20 % 30 % 50 % The Bill of Resources for the critical resources, material and labour in our example, is as given below
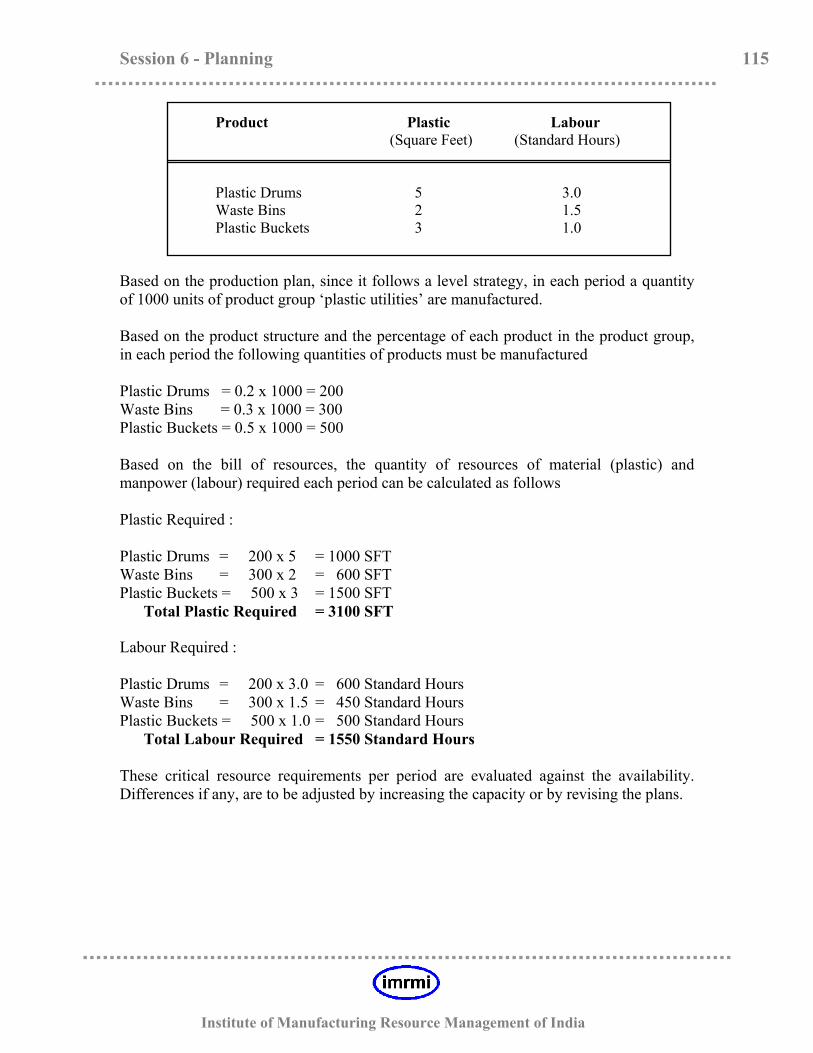
Session 6 - Planning 115
Institute of Manufacturing Resource Management of India
Product Plastic Labour (Square Feet) (Standard Hours) Plastic Drums 5 3.0 Waste Bins 2 1.5 Plastic Buckets 3 1.0
Based on the production plan, since it follows a level strategy, in each period a quantity of 1000 units of product group ‘plastic utilities’ are manufactured. Based on the product structure and the percentage of each product in the product group, in each period the following quantities of products must be manufactured Plastic Drums = 0.2 x 1000 = 200 Waste Bins = 0.3 x 1000 = 300 Plastic Buckets = 0.5 x 1000 = 500 Based on the bill of resources, the quantity of resources of material (plastic) and manpower (labour) required each period can be calculated as follows Plastic Required : Plastic Drums = 200 x 5 = 1000 SFT Waste Bins = 300 x 2 = 600 SFT Plastic Buckets = 500 x 3 = 1500 SFT Total Plastic Required = 3100 SFT Labour Required : Plastic Drums = 200 x 3.0 = 600 Standard Hours Waste Bins = 300 x 1.5 = 450 Standard Hours Plastic Buckets = 500 x 1.0 = 500 Standard Hours Total Labour Required = 1550 Standard Hours These critical resource requirements per period are evaluated against the availability. Differences if any, are to be adjusted by increasing the capacity or by revising the plans.

Session 6 - Planning 116
Institute of Manufacturing Resource Management of India
Sales and Operations Planning Introduction to Sales and Operations Planning
S T R A T E G I C P L A N N I N G
B U S I N E S S P L A N N I N G
S A L E S A N D O P E R A T I O N S P L A N
MARKETING PRODUCTION PLAN PLAN Figure 6.12 - Sales and Operations Plan
Definition of Sales and Operations Planning : According to APICS dictionary, sales and operations planning is defined as a process that provides management the ability to strategically direct its businesses to achieve competitive advantage on a continuous basis by integrating customer focused marketing plans for new and existing products with the management of the supply chain. Sales and Operations Planning (SOP) is a process that ensures coordination of all the essential functions of an organization to determine what and when to produce and hence brings together all the plans of these functions into an aggregated set of plans. By comparing the sales plan with the actual demand and by assessing the market potential on a regular basis, future demand is forecasted and the marketing plans are updated accordingly. This updated marketing plan is then communicated to the other functions viz., manufacturing, finance and engineering which adjust their respective plans to support the updated marketing plan. Sales and operations planning thus becomes the forum in which the production plan is developed.

Session 6 - Planning 117
Institute of Manufacturing Resource Management of India
It thus provides a means of managing change and updating the higher level plans as conditions change resulting in a realistic plan that is coordinated between the various functions of the organization and which is in line with the organizational objectives.
Master Scheduling & Rough-Cut Capacity Planning After evaluating and determining the suitable production plan from the various production planning alternatives, the next step in the planning process known as ‘Master Scheduling’ helps in disaggregating the production plan into a time-phased manufacturing schedule of individual end items with detailed consideration of the forecasts, actual customer orders, backlogs, inventory levels at individual end item levels. The process of identifying and evaluating the bottleneck resources and making the necessary capacity adjustments to meet the master schedule is the function of ‘Rough-cut Capacity Planning (RCCP)’
Master Scheduling The process of determining the time-phased planning chart for the manufacturing of individual end items in order to support the production plan is known as master scheduling. The master schedule becomes an input to the master scheduler in preparing an anticipated build schedule in the short run for each individual end item, expressed in specific configurations, quantities and dates. This anticipated build schedule is know as the ‘Master Production Schedule (MPS)’ General Concepts of Master Scheduling The master schedule / master production schedule helps in developing the schedule
showing which products, how many of them and when they are to be produced. In developing the schedule for individual end items, the master production schedule
should consider the production plan, item forecast and actual customer orders, backlogs and the management goals and objectives.
Since the master production schedule is the disaggregation of the production plan, it
is limited by the production plan and hence the total of the items in the master production schedule must equal the total of the production plan.

Session 6 - Planning 118
Institute of Manufacturing Resource Management of India
By determining the anticipated build schedule of end items, the master production schedule integrates the production plan and the manufacturing activity of the company.
Master production schedule integrates the marketing, sales and production functions
at individual end item levels which help in keeping the priorities current and in making valid delivery promises to the market.
Master production schedule with the specific information of the product configuration
and available inventory levels becomes the necessary inputs to further plan for the components of the end items and hence drives the material requirements plan (MRP).
Master Production Schedule (MPS) Relationships The production plan for families / groups of products is disaggregated by the MPS into anticipated build schedule of individual end items. This schedule drives the material requirements plan (MRP) to plan for the purchase and manufacture of the various components that go into the end item. The relationship between the production plan, the MPS and the material requirements plan (MRP) can be depicted as follows : Let us consider a product group comprising of Bi-cycles. The production plan is stated in monthly periods and a part of the plan for four months March to June 2003 is shown in figure 6.9. The product group – Bicycles consists of three products – Bicycles for men (BM), Bicycles for women (BW) and Bicycles for Children (BC). The master production schedule disaggregates the production plan into the build schedule for the individual products. The MPS for the three products during week 22 to week 25 for the month of June 2003 is as shown in figure 6.9 and the total of the MPS for the three products for these four weeks should equal the production plan for June as shown. The master production schedule drives the material requirements plan (MRP) to calculate the component requirement for each end item. In figure 6.9, the component requirements for one of the products – BM for week 22 is shown. The component requirements for the other products of the MPS can similarly be derived.

Session 6 - Planning 119
Institute of Manufacturing Resource Management of India
Production Plan Jan 2003 – Jan 2004 Month ..…. Mar’03 Apr’03 May’03 June’03 …… Days 25 20 23 24 Production Plan 2500 2000 2300 2400 Master Production Schedule June’03 Week 22 23 24 25 Product - BM 300 250 400 350 Product - BW 200 100 --- 100 Product – BC 100 250 200 150 600 600 600 600 Material Requirements Plan Week 22 (Product – BM) Week 22 Product – BM Requirement = 300 units Purchase Requirements Manufacturing / Assembly Requirements
o Tyres = 600 Frame Assembly = 300 o Seat = 300 Chain Assembly = 300 o Case = 300 Handle Assembly = 300 o Rivets = 15000 o Tubes = 1500 o Fasteners = 3000
Figure 6.12 - Production Plan, MPS and MRP Relationship

Session 6 - Planning 120
Institute of Manufacturing Resource Management of India
Product BM
Frame Assembly(1) Tyres(2) Seat(1) Chain Assembly(1) Handle Assembly(1) Case(1) Rivets(50) Tubes(5) Fasteners(10)
Purpose of Master Production Schedule (MPS) Master scheduling of the production process serves the following purposes : Smoothing and Stabilizing Production Plans : MPS helps to buffer the forecasts, which are generally based on historical patterns and which seldom correspond to the actual demand patterns and thus help in reducing the nervousness caused by the forecasts Estimating and Managing Key Resources : MPS forms the basis for estimating the key resource requirements and involves the management of the impact on these key resources due to schedule changes, technology changeovers and upgrades. It also involves identifying overtime / outsourcing needs to manage production schedules. Keeping Priorities Valid : MPS ensures the execution of the production plans and develops the data required to drive the detailed MRP planning level, keeping the priorities current and valid Controlling Item Inventory : Through the techniques of netting and lot-sizing, MPS determines the net requirements and batch sizes that result in economical groups for production which helps in better utilization of facilities and equipment. Making Delivery Promises : MPS helps in making possible reliable delivery promises by providing information on available-to-promise (ATP) indicating when end products will be available

Session 6 - Planning 121
Institute of Manufacturing Resource Management of India
MPS Design Considerations The important MPS Design Considerations include The manufacturing environment characteristics Product Structure in the manufacturing environments
Manufacturing Environment Characteristics : The various characteristics associated with the manufacturing environments impact the scheduling process / decisions. Considering a few examples, o The level of customer interaction with the production function is generally very low
in a make-to-stock environment compared to the very high interface in a make-to-order environment.
o In a make-to-stock environment, the delivery lead-times are very short compared to the very long lead-times in a make-to-order environment.
o The number of different products produced in the production line is generally less in a make-to-stock environment when compared with the number of products produced in a make-to-order environment.
o In a make-to-stock environment, forecasts become one of the major inputs for planning the production but in a make-to-order environment, customer backlogs become the major input for production planning.
Product Structure in the various environments : The MPS plays an important role in determining what manufacturing has to make and hence it must ensure planning flexibility and reduction in complexities in terms of planning and managing the various product varieties. The product structure in the various manufacturing environments can be depicted as shown in figure 6.10 Make-to-Stock Assemble-to-Order Make-to-Order (M T S) (A T O) (M T O) MPS MPS MPS Figure 6.26 Product Structures in Manufacturing Environments In each of the manufacturing environments, the MPS should be made at the narrowest level of the product structure.

Session 6 - Planning 122
Institute of Manufacturing Resource Management of India
o Make-to-Stock (MTS) Product Structure : In a MTS environment, a few standard end items are produced from a large number of components which results in a conical structure narrowed at the top. Hence the MPS should be made at the end item level in this environment. Examples include most of the consumer durable items.
o Assemble-to-Order (ATO) Product Structure : In an ATO environment, a large
number of subassemblies / standard components are made and inventoried. Based on the customer orders received, various combinations of these subassemblies / standard components are made to meet the customer options. The product structure in this environment appears as an hour glass and the MPS should be made at the standard components / subassembly level as indicated. Examples include automobiles, wooden furniture etc., in which the standard components are made and various options are fitted / assembled based on the customer requirements.
o Make-to-Order (MTO) Product Structure : In a MTO environment, there are
usually a few raw materials and various end items, specific to customer orders are made from these raw materials which results in an inverted cone structure. Since there can be many variations in the products that can be made from the raw materials, the MPS is made at the narrowest level of the product structure which is the raw material level. Examples include buildings, airplanes etc.,
MPS Inputs and Outputs The major inputs to the master production schedule (MPS) include The Production Plan : The production plan forms the primary input to the MPS. It
limits the MPS and hence the total of the MPS of the individual end items of a product group must equal the production plan of the product group.
Demand Data : For each individual end item, the demand data in the form of
forecasts, actual customer orders, stock replenishment requirements, interplant requirements, service requirements must be considered.
Inventory Levels : It includes the desired inventory levels, the inventory on-hand
and allocated stocks and scheduled receipts. Capacity Restraints : The rough-cut capacity plan (RCCP) helps in determining the
feasibility of the MPS by identifying and evaluating the critical / bottleneck resources and in making the necessary capacity adjustments.
The primary output of MPS is an anticipated build schedule of the individual end items which further becomes the input to the material requirements plan (MRP) which plans for the necessary components to achieve the MPS.

Session 6 - Planning 123
Institute of Manufacturing Resource Management of India
Master Production Schedule Techniques Frozen Slushy Liquid Current Demand Time Planning Time Date Fence (DTF) Fence (PTF) Master Production schedule is a time-phased schedule of end item requirements. The planned order releases of this time-phased schedule become the inputs to Material Requirements Plan (MRP) in terms of quantity and time. Demand Time Fence : The demand time fence is a point in the MPS and is set between the current date and the planning time fence as shown in figure. The region between the current date and the demand time fence is known as the ‘frozen zone’. The demand time fence contains actual customer orders. Since the resources are committed to these orders, changes would result in excessive cost, reduced manufacturing efficiency and poor customer service and hence any changes can only be made with the approval of senior management Planning Time Fence : The planning time fence is a point in the MPS and is set between the demand time fence and the end of the planning horizon as shown in figure. The region between the demand time fence and the planning time fence is know as the ‘slushy zone’. The planning time fence contains actual customer orders and forecast orders. Resources are committed but to a lesser extent and it is possible to change the priorities. The region beyond the planning time fence contains only forecast orders and the region is classified as ‘liquid zone’ and changes to the schedule can be made as resources are still not committed . Projected Available Balance (PAB) : Projected available balance is the projected inventory of end items if the MPS quantities are completed. The PAB for the three zones are as follows PAB (frozen zone) = Prior period PAB + MPS – Customer Orders PAB (slushy zone) = Prior period PAB + MPS – (greater of customer order or forecast) PAB (liquid zone) = Prior Period PAB + MPS – forecasts Available to Promise (ATP) : Available to promise is the uncommitted portion of a company’s inventory and planned production, maintained in the MPS to support customer order promising. The ATP quantity is the uncommitted inventory balance in the

Session 6 - Planning 124
Institute of Manufacturing Resource Management of India
first period, and is normally calculated for each period in which an MPS receipt is scheduled. In the first period, ATP = Inventory on Hand + MPS (if it is + ve) – Customer Orders In further periods containing MPS scheduled receipts, ATP = MPS – Customer orders due before next MPS Two-level Master Production Schedule : A master scheduling approach where a planning bill of material is used to master schedule end items or product families. Features like options and accessories are frequently used in the two-level MPS procedure. Multi-level Master Production Schedule : A master scheduling approach that allows any level in an end item’s Bill of Material to be master scheduled. To accomplish this, MPS items must receive requirements from independent and dependent sources. Higher level MPS items are scheduled before lower level MPS items.
Rough-Cut Capacity Planning Rough cut capacity planning evaluates the capacity requirements in the medium range. It gets its primary inputs from the Master Production Schedule (MPS). It determines and evaluates the capacity availability of the bottleneck resources in order to realize the master production schedule. Goal of Rough-Cut Capacity Planning Goal of RCCP include Converting high level priority plans into the impact on resources. Checking the feasibility and validity of MPS Evaluating the bottleneck resources for capacity requirements and availability Ensuring utilization of the work centers Initiating actions for required capacity adjustments

Session 6 - Planning 125
Institute of Manufacturing Resource Management of India
Process of Rough-Cut Capacity Planning The process of rough-cut capacity planning (RCCP) is similar to that of the resource requirement planning used in the production planning process except that RCCP deals with the capacity considerations of individual end product manufacturing. To validate the feasibility of the MPS, RCCP evaluates the availability of bottleneck resources and considers the possible capacity adjustments as required. The process of RCCP involves the following Obtaining the MPS for individual end items Obtaining the “Bill of Resources” for each individual end item Identifying the Calculating the bottleneck resource requirement and availability Resolving the differences, if any, by adjusting the capacity or the plans
Let us consider the below example to calculate the rough-cut capacity requirements The master production schedule for three models of cars for the month of June is as given below Master Production Schedule June’03 Week 22 23 24 25 Car 001 300 250 400 350 Car 002 200 100 --- 100 Car 003 100 250 200 150 600 600 600 600 let us assume that the cars after the final assembly on their respective assembly lines, pass through a common paint shop for the painting operation and that the painting operation is a bottleneck. The resource bill for the painting operation is as follows Resource Bill - Painting Operation Product Time for painting (standard hours) Car 001 6 Car 002 5 Car 003 8
Session 6 - Planning 126
Institute of Manufacturing Resource Management of India
For week 22, the capacity requirement on the bottleneck resource is Car 001 : 300 units x 6 std hours / unit = 1800 std hours Car 002 : 200 units x 5 std hours / unit = 1000 std hours Car 003 : 100 units x 8 std hours / unit = 800 std hours Total time required on the bottleneck operation for week 22 is 3600 standard hours.
Material Requirement Planning (MRP) & Capacity Requirement Planning (CRP) Based on the master production schedule (MPS), product structure represented by the bill of materials (BOM), inventory levels and planning factors, the material requirements plan (MRP) determines the time-phased requirement of all the components and then schedules the planned purchase and planned production orders to meet the MPS requirements. It therefore represents a priority planning and scheduling system at a very detailed planning level and is the last step in the planning hierarchy The planned production orders, generated by the MRP become the necessary inputs to the Capacity Requirements Planning (CRP) which evaluates and adjusts the detailed labour and equipment capacity requirements at each work center by time period.
Material Requirement Planning (MRP) Nature of Demand There are basically two types of demand Independent Demand Dependent Demand

Session 6 - Planning 127
Institute of Manufacturing Resource Management of India
Cycle
Tyres Chain Frame Seat Handle (2) Assembly (1) (1) Assembly (1) (1)
Figure 6.11 - Nature of Demand Independent Demand : This demand is not based on the demand for other products, assemblies or components. All end items have an independent demand and the demand must be forecast. Master production schedule deals with independent demand items. In figure 6.11, the demand for the cycle is independent and it must be forecast. Dependent Demand : This demand always depends on the demand for the higher level assemblies or end products and hence the demand must be calculated. Material requirements planning (MRP) deals with the components of the end items and hence always calculates the component requirements based on the demand for the end item. In figure 6.11, all the components that make the cycle are dependent on the demand for cycle and hence the demands for these components are calculated. Objectives of MRP To effectively plan the detailed component requirements and to maintain an efficient system, material requirements planning (MRP) must meet the following objectives Determining Requirements : To Determine the components required to achieve the
master production schedule (MPS) and to schedule the purchase and production of the appropriate components based on their lead time so that the right components are available in the right quantities at the required time.
Maintaining Low Inventory Levels : By determining and scheduling the purchased
and manufactured components on a calculated need basis, MRP helps to avoid build up of excess inventory of these components and hence results in maintaining low inventory levels.
Independent Demand (Forecasted)
Dependent Demand (Calculated)

Session 6 - Planning 128
Institute of Manufacturing Resource Management of India
Keeping Up-to-date and Valid Schedules : In a manufacturing environment, things
seldom go as planned due to reasons such as late deliveries from suppliers, changing customer orders, machine breakdowns, excess scrap, change in designs, later arrival of orders, etc., The MRP must be able to reorganize the priorities by accommodating these changes so that the plans are valid and updated.
Inputs to MRP The Material Requirements Plan (MRP) gets its inputs from the following
Master Production Schedule (MPS) Inventory Status Bill of Material (BOM) Planning Factors
Inventory Status
MPS MRP BOM Planning Factors Figure 6.12 - MRP Inputs Master Production Schedule : The master production schedule determines the
requirements of each end item by quantity and date. This data becomes the primary input for the MRP to determine the component requirements of each individual end item to meet the MPS.
Inventory Status : The inventory status forms an important input to the MRP. For
each of the manufactured component, it gives information regarding the on-hand inventory balance, allocated stock, scheduled receipts, planned lead time, safety stock, scrap / yield factors, lot size etc.,
Bill of Material : BOM forms the most important input to the MRP. It depicts a
hierarchical structure of all the components that make the end item with the

Session 6 - Planning 129
Institute of Manufacturing Resource Management of India
information regarding the quantities of each component required and the purchase / manufacturing lead times. The BOM becomes the basis for MRP to determine the quantity requirements for each component and to time-phase these requirements based on their lead time.
Planning Factors : The planning factors provide the necessary information regarding
the planning horizon of the MRP, length of the time buckets and the re-planning frequency of the MRP.
The MRP Process The material requirements plan, with the inputs from the master production schedule (MPS), inventory records, bill of material (BOM) and the planning factors determines the required quantities of the components at the required time to meet the MPS. The MRP process follows the following techniques to determine and schedule the component requirements.
Exploding the Requirements Lead time Offsetting Planned Order (Release and Receipt) Calculating Gross Requirements Calculating Net Requirements Releasing the Order
consider the following example of a product structure of a table with the individual component requirements and lead times as given.
Table LT = 1 week
Top (1) LT = 2 weeks Legs (4) LT = 1 week Wooden Fasteners (10) Wooden Bolts (8) Frame (1) Rounds (1) LT = 1 week LT = 1 week LT = 2 weeks LT = 1 week Exploding the Requirements : Exploding is the process of determining the quantities of all the components required by multiplying the requirements by the usage quantity to meet the MPS.

Session 6 - Planning 130
Institute of Manufacturing Resource Management of India
If the MPS for the table in week 10 is 200 units, then by exploding the BOM the requirements for the components can be determined as follows Requirement for Top = 1 (one top per table) x 200 (tables) = 200 (tops) Requirement for Legs = 4 (four legs per table) x 200 (tables) = 800 (legs) Requirement for Wooden frames = 1(one frame per top) x 200 (tops) = 200 (frames) Requirement for Fasteners = 10 (ten fasteners per top) x 200 (tops) = 2000 (fasteners) Requirement for Wooden rounds = 1 (one round per leg) x 800 (legs) = 800 (rounds) Requirement for Bolts = 8 (eight bolts per leg) x 800 (legs) = 6400 (bolts) Lead Time Offsetting : Lead-time offsetting is the process of placing the exploded requirement of the components in the appropriate time periods based on their lead-times. If the MPS requirement for the table is 200 units in week 10, then the offsetting process is as follows Table (LT = 1 week) and hence work on the table should start by week 9 Top (LT = 2 weeks) and hence the 200 tops should be available by week 9 Legs (LT = 1 week) and hence the 800 legs should be available by week 9 Wooden Frame (LT = 2 weeks) and hence 200 frames should be available by week 7 Fasteners (LT = 1 week) and hence 2000 fasteners should be available by week 7 Wooden Rounds (LT = 1 week) and hence 800 rounds should be available by week 8 Bolts (LT = 1 week) and hence 6400 bolts should be available by week 8 Planned Orders (Release and Receipt) : The planned order receipt and planned order release determine the periods in which the orders will be received and released respectively and the calculation is based on the lead time. In the above example,200 tables are required in week 10, the lead time is 1 week. Hence the planned receipt will be in week 10 and in order to have the planned receipt in week 10, the order must be released in week 9 and hence the planned order release is in week 9. Planned Order Receipt Planned Order Release Lead Time Table week 10 week 9 1 week Top week 9 week 7 2 weeks Legs week 9 week 8 1 week Wooden Frame week 7 week 5 2 weeks Fasteners week 7 week 6 1 week Wooden Rounds week 8 week 7 1 week Bolts week 8 week 7 1 week Problem 6.4 : There is a requirement for 200 X’s in week 5. Given the following product tree, calculate the Planned Order Receipts and Planned Order Releases for the Components. All quantities per are one.

Session 6 - Planning 131
Institute of Manufacturing Resource Management of India
X (LT = 1 week)
Y (LT = 1 week) Z (LT = 2 weeks) W (LT = 1 week) V (LT = 2 weeks)
Week
Item No.
1
2
3
4
5
X
Planned Order Receipt Planned Order Release
200
200
Y
Planned Order Receipt Planned Order Release
200
200
Z
Planned Order Receipt Planned Order Release
200
200
W
Planned Order Receipt Planned Order Release
200
200
V
Planned Order Receipt Planned Order Release
200
200
Problem 6.5 : There are 50 A’s required in week 5 and 100 in week 6. Calculate the Planned Order Receipts and Planned Order Releases for all the components
A (LT = 1 week) B (LT = 2 weeks) C (LT = 1 week) D (LT = 1 week) E (LT = 1 week)

Session 6 - Planning 132
Institute of Manufacturing Resource Management of India
Week Item No.
1
2
3
4
5
6
A
Planned Order Receipt Planned Order Release
50
50
100
100
B
Planned Order Receipt Planned Order Release
50
100
50
100
C
Planned Order Receipt Planned Order Release
50
50
100
100
D
Planned Order Receipt Planned Order Release
50
50
100
100
E
Planned Order Receipt Planned Order Release
50
50
100
100
Gross Requirements : The requirements of the components calculated without considering the available inventory results in the gross requirements. In the example considered, a requirement of 200 tables resulted in a requirement of 200 tops and 800 legs which is the gross requirement. Net Requirements : Generally inventory of the components is available and hence the requirements must be netted.
Net requirements = Gross requirements – inventory available In the example considered if an inventory of 300 legs and 30 tops were present then the requirement of 200 tables will result in net requirements of 170 tops and 500 legs. Problem 6.6 : Given the below product structure, lead times and the projected available inventory for items B and C, calculate the gross requirements, net requirements, planned order receipt and planned order release.

Session 6 - Planning 133
Institute of Manufacturing Resource Management of India
B (LT = 1 week) C (LT = 2 weeks) D (LT = 1 week) E (LT = 1 week) F (LT = 1 week)
Week Item Number
1 2 3 4 5 100
40 40 40 40 0 60 60
B
Gross Requirements Projected Available 40 Net Requirements Planned Order Receipt Planned Order Release 60
60 20 20 20 0
40 40
C
Gross Requirements Projected Available 20 Net Requirements Planned Order Receipt Planned Order Release 40
60 0 60 60
D
Gross Requirements Projected Available Net Requirements Planned Order Receipt Planned Order Release 60
40 0 40 40
E
Gross Requirements Projected Available Net Requirements Planned Order Receipt Planned Order Release 40
40 0 40 40
F
Gross Requirements Projected Available Net Requirements Planned Order Receipt Planned Order Release 40
Problem 6.7 : Given the following product tree, explode, offset, and determine the gross and net requirements. All lead times are one week, and the quantities required are shown in parentheses. The master production schedule calls for 100 A’s to be available in week 5. There are 20 B’s, 30 C’s, 100 D’s, 40 E’s and 10 F’s available.

Session 6 - Planning 134
Institute of Manufacturing Resource Management of India
A
B(2) C(1) D(1) E(1) D(2) F(1)
Week Item Number
1 2 3 4 5 100 0 100 100
A
Gross Requirements Projected Available Net Requirements Planned Order Receipt Planned Order Release 100
200 20 20 20 0
180 180
B
Gross Requirements Projected Available 20 Net Requirements Planned Order Receipt Planned Order Release 180
100 30 30 30 0
70 70
C
Gross Requirements Projected Available 30 Net Requirements Planned Order Receipt Planned Order Release 70
320 100 100 0
220 220
D
Gross Requirements Projected Available 100 Net Requirements Planned Order Receipt Planned Order Release 220
180 40 40 0
140 140
E
Gross Requirements Projected Available 40 Net Requirements Planned Order Receipt Planned Order Release 140
70 10 10 0
60 60
F
Gross Requirements Projected Available 10 Net Requirements Planned Order Receipt Planned Order Release 60

Session 6 - Planning 135
Institute of Manufacturing Resource Management of India
Releasing the Order : The planned order release is only a plan to release the order. The actual release of the order is the responsibility of the material planner. By releasing the order, authorization is given to the purchase department and the shop floor to procure and manufacture the components respectively. Once the authorization is given, the plan will be actually realized and hence the planned order receipt is cancelled and a scheduled receipt is created in that time period. Scheduled receipts therefore represent a commitment to purchase or manufacture and shows when the components are scheduled to be available. Consider the planned order release and planned order receipt for components A and B as shown below
Week Item No.
1 2 3 4 5 50 0 0 50 50
A
Gross requirements Projected available Net Requirements Planned Order Receipt Planned Order Release 50
30 0 0 30 30
B
Gross requirements Projected available Net Requirements Planned Order Receipt Planned Order Release 30
Scheduled Receipt
Week Item No.
1 2 3 4 5
50 50 0 0 0
A
Gross requirements Scheduled Receipts Projected available Net Requirements Planned Order Receipt Planned Order Release
30 30 0 0
B
Gross requirements Scheduled Receipts Projected available Net Requirements Planned Order Receipt Planned Order Release

Session 6 - Planning 136
Institute of Manufacturing Resource Management of India
MRP Outputs The primary outputs of MRP include
Planned Purchase Order Release Schedules Planned Manufacturing Order Release Schedules Action Notices and Messages
Planned Purchase Order Release Schedules : The planned purchase order release schedules specify the scheduled requirements of all the purchased components in terms of quantity and time periods and hence facilitates the purchasing function to plan the issue of necessary purchase authorizations to meet these schedules. Planned Manufacturing Order Release Schedules : The planned manufacturing order release schedules specify the scheduled requirements of all the manufactured components in terms of quantity and time periods and hence facilitates the production function to plan the issue of necessary work order authorizations to meet these schedules. Action Notices and Messages : The MRP software performs the processes of exploding requirements, lead time offsetting, netting and generates the planned purchase and manufacturing order schedules but does not issue or reschedule the purchase and manufacturing orders. The MRP system generates action notices and messages to advice and involve the planner for the events needing the attention of the planner. Notices / messages to a planner indicate when to release orders, when to expedite / de-expedite orders, when to cancel orders etc., While using an MRP system, the planner usually works with three types of orders
Computer Planned Orders Released Orders Firm Planned Orders
Computer Planned Orders : These orders are automatically scheduled and controlled by the computer. The computer recalculates the quantities and timing of the planned order releases based on the changes in the gross requirements, inventory status, scheduled receipts etc., The system schedules the planned order release and recommends the planner to release the orders which enter the action buckets Released Orders : The planner is responsible for the release of the planned orders which when released become the an open order to either purchasing or manufacturing. The planner can then meet the priorities by expediting, de-expediting or canceling the order as required. Firm Planned Orders : Depending on the changes to the gross requirements or inventory status, the computer automatically recalculates the planned order schedule based on a predefined logic. But, based on a number of factors like the material

Session 6 - Planning 137
Institute of Manufacturing Resource Management of India
availability, capacity constraints etc., the planner can override the computer logic of recalculating the planned order release schedules and can freeze the planned order schedules in terms of quantity and time thus making them firm planned orders.
Capacity Requirement Planning (CRP) Capacity Requirements Planning (CRP) is directly linked to the material requirements plan (MRP). CRP considers the planned manufacturing orders generated by the MRP together with the open orders already in the manufacturing process and estimates the load verses capacity for each work-center by time period. Since MRP plans for the detailed component requirements, CRP deals with the capacity evaluation at a very detailed level and considers individual orders at each work center, calculates the work center loads and determines the amount of labour and machine resources required. CRP Model Capacity requirements planning (CRP) being at a very detailed capacity evaluation level among the capacity planning techniques, requires good amount of data for complete and accurate calculations of load and capacity at each work center. This helps CRP to correct shortfalls and imbalances in capacity by making the necessary adjustments to the capacity or the schedules. Schedule of planned Routing Data Revised Schedule manufacturing order of planned manu- release facturing orders CAPACITY REQUIREMENTS PLANNING Open order file Work center file Work center
Load Report Figure 6.13 - CRP Model

Session 6 - Planning 138
Institute of Manufacturing Resource Management of India
CRP Inputs In determining the workload and capacity availability at each work center, CRP considers the planned orders generated by MRP, open orders, routing data and work center data.
Open Order file
Planned Orders CRP Routing File
Work Center File Figure 6.14 - CRP Inputs Open Order File : An open order which is a scheduled receipt on the MRP is an order already released for manufacturing. The open order file contains all the active shop orders and includes the following data for each order
o Due date of the order o Quantity on the order o Completed operations o Remaining operations
Planned Orders : Planned orders are generated through the MRP and indicate the capacity requirements in future periods of time. Capacity evaluation for the planned orders is based on the following data
o Planned order release date o Planned order receipt date o Planned order Quantity
Routing File : For every component to be manufactured, the information regarding the operations to be carried out and their sequence, the path through which the work follows, alternate work centers, tooling requirements, setup and run times, operator skill levels, inspections etc are given in the routing file. CRP determines the resource requirements based on the routing files. Work Center File : Work center consist of one or more people and machines with identical capabilities and can be considered as one entity for the purpose of capacity

Session 6 - Planning 139
Institute of Manufacturing Resource Management of India
planning. The work center file contains information on its capacity and the move, wait and queue times for the components at these work centers. In addition the work center file also provides information of the number of shits, hours per shift, workdays, utilization and efficiency factors etc. The information from the work center file is used by CRP in estimating the capacity and determining the loads on the individual work centers.
Process of CRP CRP determines in detail, the amount of resources required to achieve the production. It considers the planned orders generated by MRP and the open orders to evaluate the resource requirements and determines the load in individual work centers. CRP determines the time required for each order at each work center and adds up the capacity requirements of all the orders to determine the load on each work center. For each order at each work center, the time required is calculated by
Time required = set up time + (run time x number of pieces) Consider the following example to develop a load profile In week 1, on work center A, following are the planned and open orders with their setup and run times. Calculate the load profile based on the given data Week 1 Work Center A Order Quantity setup Time Run Time (pieces) (hours) (hours / piece) Open Order 1 100 1.0 0.2 Open Order 2 200 2.0 0.3 Planned Order 1 200 1.5 0.2 Planned Order 2 150 3.0 0.4
Capacity requirements are work center A Open order 1 = 1.0 + (100 x 0.2) = 21.0 hrs Open order 2 = 2.0 + (200 x 0.3) = 62.0 hrs Planned Order 1 = 1.5 + (200 x 0.2) = 41.5 hrs Planned Order 2 = 3.0 + (150 x 0.4) = 63.0 hrs
Total load = 187.5 hrs Hence the total load on work center A in week 1 is 187.5 standard hours. Similarly the loads for the remaining weeks on this work center can be determined. The load must be

Session 6 - Planning 140
Institute of Manufacturing Resource Management of India
compared to the existing capacity and differences if any must be handling by adjusting the capacity or the priority plans CRP Outputs Following are the outputs of CRP
Work Center Load Report Revised Schedule of Planned Order Releases
Work Center Load Report : The primary output of CRP is the work center load report. The load report represents the load created by both the open orders and planned orders in each work center by time period and then compares it with the available capacity. Since MRP does not consider capacity in its calculations the load reports can have over-loads and under-loads which are further balanced by adjusting either the capacity or the priority plans. Rated Capacity standard hours Planned Order load
Open Order load
Weeks Figure 6.15 - Work Center Load Report Revised Schedule of Planned Order Releases : Based on the CRP outputs, if the constraints in capacity are to be met by changing priority plans then the MRP schedule may be revised accordingly.

Session 6 - Planning 141
Institute of Manufacturing Resource Management of India
Advantages and Limitations of CRP Advantages of CRP include the following CRP provides a time-phased visibility of the load profile with reference to the
available capacity. The inputs from the load profile helps in making the necessary adjustments to the load and capacity so that the over and under loads are balanced appropriately.
CRP confirms the availability of necessary Capacity across the planning horizon
Since CRP considers a large amount of data as its inputs, the lead times are better
estimated by CRP than the MRP By smoothing the loads across work centers, CRP contributes to eliminating erratic
lead times and helps in better control of the lead times Limitations of CRP include the following The concept of capacity requirements planning as discussed above is more applicable
to job shop environment CRP requires large amount of input data and computation making computer
processing almost mandatory Estimates can sometimes be misleading due to the variations in queue times and wait
times
MRP / CRP in Repetitive Production Though MRP and CRP find their suitability in the job shop production environment, the other production environments viz., repetitive production, just-in-time production and project type production also operate on the basic principles of having the right material at the required time, in the right quantities and balancing the load with the available capacity. Hence all types of environments find the applicability of planning for the material and capacity requirements. In a repetitive production environment, each of the equipment necessary to manufacture the product is dedicated to particular operation of the process and are arranged in a well-defined and fixed sequence. The manufacturing operations are performed in the defined manner on the product as it moves sequentially through these operations. Large volumes of products that are fairly similar justify the setting up of this type of environment. Auto assembly lines and bottling plants are examples of repetitive production environments.

Session 6 - Planning 142
Institute of Manufacturing Resource Management of India
Material Planning in Repetitive Production Environment Since the manufacturing operation is on a sequential and continuous basis, material availability at every stage becomes critical to meet the defined production rates. MRP must ensure that the components, both purchased and manufactured are planned and scheduled to be available at the right time. The considerations in planning for the materials in this environment are as follows Flat Bill of Material Structure : The components received at the workstations are
immediately used in the production process and hence the bill of material tends to have a flat structure with one or two levels
No On hand Inventory : The product moves through the production process from
one workstation to the next at a defined rate and there is no storage of intermediate subassemblies. Hence there are no on-hand inventory balance considerations.
Shorter Time Buckets : The time buckets in repetitive production are shorter than
that of the job shop environment Gross Requirements equal to production rates : Since the production rates are
constant, the gross requirement for each period is equal to the production rates. Backflushing : In the repetitive manufacturing environment, specific withdrawals of
material is not recorded individually. The inventory records are adjusted by backflushing which inturn reduces the number of inventory transactions.
Phantom Assemblies : Repetitive manufacturing have more phantom assemblies
when compared to job shop production due to the immediate utilization of the subassemblies in the next level assemblies.
Capacity Planning in Repetitive Production Environment The production rate and the product mix form the essential inputs to determine the load. The available capacity is then adjusted to achieve a balanced production rate throughout the process. This is known as line balancing. The considerations in planning for the capacity in this environment are as follows Routings : All the products moves sequentially through the work centers and the
routing sequence is fixed Run Times : The run times vary depending on the product mix.
Queue and Wait times : Since the flow of products through each work center is
balanced based on the production rates, there is very less scope for queue and wait times.
Session 6 - Planning 143
Institute of Manufacturing Resource Management of India
Setup time : Setup in a repetitive environment is done once for the entire line and will have to be done again only during a line change over / changing the product mix.
Production Rate : The rate of production is dependent on the output of the
bottleneck resource in the line
Final Assembly Scheduling (FAS)
Basics of Final Assembly Scheduling (FAS) In the make-to-order and assemble-to-order environments, there are many possible options of the end products that can be obtained by the various combinations of the basic components and subassemblies. Customer requirements are met by the appropriate combination but it is difficult to forecast these customer requirements. Master Production Schedule (MPS) considers the component / subassembly forecasts, demand and plans at the basic component / subassembly levels and the actual customer orders are scheduled by the Final Assembly Schedule and thus supplements the master production schedule Definition According to the APICS dictionary, Final Assembly Schedule is a schedule of end items to finish the product for specific customers’ orders in a make-to-order or assemble-to-order environment. It is also referred to as the ‘finishing schedule’ because it may involve operations other than just the final assembly. Also, it may not involve assembly, but simply final mixing, cutting, packing etc., The final assembly schedule is prepared after receipt of a customer order as constrained by the availability of material and capacity, and it schedules the operations required to complete the product from the level where it is stocked (or master scheduled) to the end-item level Process of FAS The process of FAS involves decoupling the MPS from the final configuration or end product that is manufactured. The MPS hence plans at the basic component / subassembly level and maintains an inventory of these components / subassemblies. The actual demand in the form of customer orders triggers the FAS to pull the MPS inventory and to schedule the required combinations to form the end item configuration needed by the customer.

Session 6 - Planning 144
Institute of Manufacturing Resource Management of India
Key Terminology 01) Assemble–to–Order (ATO) 02) Available Inventory 03) Available–to–Promise (ATP) 04) Back-flush 05) Backlog 06) Back Order 07) Bill of Material (BOM) 08) Bottleneck 09) Business Plan 10) Capacity 11) Capacity Available 12) Capacity Required 13) Capacity Requirements Planning (CRP) 14) Carrying Cost 15) Chase (Demand Matching) Method 16) Closed-Loop MRP 17) Demand 18) Dependent Demand 19) Due Date 20) Explode 21) Feedback 22) Final Assembly Schedule (FAS) 23) Finished Goods 24) Firm Planned Order 25) Gross Requirements 26) Independent Demand 27) Inventory 28) Lead Time 29) Lead–Time Offset 30) Level Production Plan (Level Schedule) 31) Load 32) Make–to–Order 33) Make–to–Stock 34) Manufacturing Resource Planning (MRP II) 35) Master Planning 36) Master Production Schedule (MPS) 37) Master Schedule 38) Material Requirements Planning (MRP) 39) Net Requirements 40) On–hand Balance
Session 6 - Planning 145
Institute of Manufacturing Resource Management of India
Key Terminology (Cont’d) 41) Open Order 42) Order Promising 43) Pegging 44) Planned Order 45) Planned Order Receipt 46) Planned Order Release 47) Planning Horizon 48) Production Plan 49) Production Planning 50) Projected Available Inventory (Balance) 51) Purchasing 52) Repetitive Manufacturing 53) Requirements Explosion 54) Resource Planning 55) Rough–Cut Capacity Planning 56) Sales and Operations Planning 57) Scheduled Receipt 58) Strategic Plan 59) Subcontracting 60) Time Fence

Session 6 - Planning 146
Institute of Manufacturing Resource Management of India
Practice Questions – Session 6 Question 1 : Which of the following planning process develops the strategic vision and mission of an organization ? A) Master Planning
B) Strategic Planning C) Material Requirement Planning D) Purchase Planning
Correct Answer is: ------------------------------------------------------------------------------------------------------------ Question 2 : For a given planning horizon, in which of the following is production in each period always equal to the average of the total demand :
A) Level Strategy B) Chase Strategy C) Subcontract Strategy D) Hybrid Strategy
Correct Answer is: ------------------------------------------------------------------------------------------------------------ Question 3 : Which of the following statements is most correct ?
A) The MPS shows families of products B) The MPS has more detail than the production plan C) The production plan has more detail that the MPS D) The production plan rolls up to equal the MPS
Correct Answer is: ------------------------------------------------------------------------------------------------------------ Question 4 : Which of the following are inputs to a realistic MPS ?
I. Production plan II. Forecasts for end items III. Product costs for end items IV. Capacity constraints
A) I, II and III B) I, II and IV C) II, III and IV D) I, III and IV

Session 6 - Planning 147
Institute of Manufacturing Resource Management of India
Correct Answer is: ------------------------------------------------------------------------------------------------------------ Question 5 : Final Assembly Scheduling is usually done after :
A) Planning a build schedule B) Capacity is constrained
C) A customer order is received D) Goods are returned by the customer Correct Answer is: ------------------------------------------------------------------------------------------------------------ Question 6 : Which of the following is not an input to MRP :
A) Master Production Schedule B) Inventory records C) Bill of Material D) Capacity Planning
Correct Answer is: ------------------------------------------------------------------------------------------------------------ Question 7 : A firm planned order is used to :
A) Freeze the planned order against changes in quantity and time B) Convert the planned order to a scheduled receipt C) Simulate the projected inventory balance D) Manipulate the data and quantity of the customer order
Correct Answer is: ------------------------------------------------------------------------------------------------------------ Question 8 : Which of the following is an output of CRP :
A) Planned purchase order release schedule B) Planned manufacturing order release schedule C) Work center load report D) Action notices and messages
Correct Answer is: ------------------------------------------------------------------------------------------------------------ Question 9 : Which of the following are part of Sales and Operations Plan :

Session 6 - Planning 148
Institute of Manufacturing Resource Management of India
A) Strategic plan and production plan B) Business plan and marketing plan E) Material requirements plan and capacity requirements plan D) Marketing plan and production plan
Correct Answer is: ------------------------------------------------------------------------------------------------------------ Question 10 : Rough-cut capacity planning can be best described as :
A) Checking to be certain that critical resources are available to support the preliminary MPS
B) Making sure that enough warehouse space is available for raw materials C) Making certain that the load at each work center is less than the capacity D) Ensuring resources are available by product family
Correct Answer is: ------------------------------------------------------------------------------------------------------------

149
Institute of Manufacturing Resource Management of India
SESSION 7
EXECUTION
AND
CONTROL

Session 7 – Execution and Control 150
Institute of Manufacturing Resource Management of India
Customer Service Goals for customer service levels should be established and performance should be measured to assure that customers are being adequately served. Measures of Customer Service could include Quality products Availability when wanted (or promised) Reasonable price Fill rate for stock finished goods On-time delivery for make-to-order or assemble-to-order
Often Customer Service is looked at in terms of external customers who purchase firms’ products. We must also service internal customers by delivering quality products on-time.
Order Processing APICS defines order processing as the activity required to administratively process a customers’ order and make it ready for shipment or production.
Order Promising APICS defines order promising as the process of making a delivery commitment, I.e. answering the question, when can you ship? For make-to-order products, this usually involves a check of uncommitted material and availability of capacity, often as represented by the master schedule available to promise.
Push / Pull APICS defines Pull System as a system that In production, produces items only as demanded for use or to replace those taken
for use In material control, withdraws inventory as demanded by using operation.
Material is not issued until a signal comes from the user
Session 7 – Execution and Control 151
Institute of Manufacturing Resource Management of India
In distribution, replenishes field warehouse inventories where replenishment decisions are made at the field warehouse itself, not at a central warehouse or plant.
APICS defines Push system as a system that In production, produces items at times required by a given schedule planned in
advance In material control, issues the material according to a given schedule or issues
material to a job order at its start time. In distribution, replenishes field warehouse inventories where replenishment
decision making is centralized, usually at the manufacturing site or central supply facility.
Planning for Execution
Scheduling Techniques Forward / Backward Scheduling Back Scheduling : APICS defines back scheduling as a technique for calculating operation start dates and due dates. This schedule is computed starting with the due date for the order and working backward to determine the required start date and/or due dates for each operation. Back Scheduling : In backward scheduling MRP establishes the completion dates. Independent
demand quantities and timings are based on the MPS. Order completion dates and release dates are determined for each part in the
product structure, using the planned lead times for each part number MRP plans order due dates and release dates and keeps them up-to-date by
adjusting for changes in schedules, lead times, product structure. Typically work centers have several jobs waiting in line to be done. Which
should go first? Order due dates alone do not provide an answer. Priority should be determined based on working a backward schedule and comparing the release dates against customer required schedule.
Forward Scheduling : APICS Defines forward scheduling as a scheduling technique where the scheduler proceeds from a known start date and computes the completion date

Session 7 – Execution and Control 152
Institute of Manufacturing Resource Management of India
for an order, usually proceeding from the first operation to the last. Dates generated by this technique are generally the earliest start dates for the operations. Forward Scheduling : Used to develop promise dates for customers May focus on critical operations, identifying when they would next be available,
then scheduling through subsequent operations Works poorly for complex product structures
Assembly component lead times differ, but must be scheduled to be
available concurrently to start assembly. Many paths through the structure need to be calculated, adjusted to the
timing of the longest path. Can be used to supplement backward scheduling to solve problems, respond to
customer needs A job is behind schedule – will it be possible to catch up? Will the order
have to be rescheduled? A major customer needs a spare part as soon as possible – how quickly
can we produce it? Finite / Infinite Scheduling APICS defines Finite scheduling as an equipment scheduling technique that builds a schedule by proceeding sequentially from the initial period to the final period while observing capacity limits. A Gantt chart may be used with this technique Finite loading refers to assigning no more work to a work center than the work center can be expected to execute in a given time period. Finite loading computer techniques involve calculating shop priority revisions in order to level load operation by operation. Infinite loading involves calculation of capacity required at work centers in the time periods required regardless of capacity available to perform this work. Finite / Infinite Loading Critical Resource Loads are compared to capacity in resource requirement planning and rough cut capacity planning Capacity in not infinite Perform a trial fit, comparing load to capacity Make adjustments to resolve imbalances

Session 7 – Execution and Control 153
Institute of Manufacturing Resource Management of India
Given a general balance, problems may still occur when detailed work center schedules and loads are developed CRP Identifies overload Good planning demands resolution Adjust capacities and reschedule orders so that plans can be achieved Infinite schedules become finite
Good reasons should be noted for infinite scheduling To plan how much capacity could be used To see what should be made available To calculate requirements for critical labor skills, tooling etc.
Executing The Plan
Production Authorization and Release Resource availability must be verified before work is released to the shop. Even the best plans are subject to unforeseen problems. Adjustments must be made if materials, capacity, or tooling are lacking. Steps Check requirements and availability – capacity, lead time validity, material, other
resources Resolve shortages – capacity/load shortages, material shortages, other resource
shortages Adjust Schedules
Check Requirements and Availability Check the requirements and availability of capacity, material, other resources. Capacity Requirement : Load profiles are used to check capacity requirements. Capacity requirement is determined by CRP. Updated information on standard hours of work for each work center by time
period should be made available and checked for exception conditions.

Session 7 – Execution and Control 154
Institute of Manufacturing Resource Management of India
Load profiles should be broken down to identify released load (already in proces) versus the planned hours (not yet released)
Capacity Availability : Rated capacity, demonstrated capacity, or both should be known Availability must be checked for exception conditions (understaffing, equipment
downtime, etc) Capacity available should be validated for lead time. Imbalances can extend lead
time. Deferred orders may lack planned lead times. Some items may require special handling.
Particular attention should be paid to bottleneck work centers. Material Requirement and Availability : Requirements are calculated in MRP. Quantities available are based on balances on hand, considering quantities allocated to other orders. MRP systems also show the exception reports highlighting the components that are not available in sufficient quantities. Other Resources – Requirement and Availability : Tooling needs can be identified from routing file. Often tooling requirement is also indicated on bills of material and treated like components for availability checking. Availability is checked by calling tool crib or asking with supervisor. Need to ensure that tooling is ready for use, sharpened and calibrated. Any unique skills needed to use tolling should be available. Resolve Shortages Resource shortfalls must be resolved. The resolution could be increase of resources or revision of schedule or both. Capacity/Load Shortages : Short-term opportunities for increasing capacity include overtime, temporary help, reassignments, equipment rental. Alternate routings, outsourcing, subcontracting, overlap operations, rescheduling opportunities could be used in case of capacity shortage. Material Shortages : Rush orders, substitute materials, rework parts, inhouse production of purchased parts, borrow, cannibalisation options could be used in case of materials shortage Other Resources Shortage

Session 7 – Execution and Control 155
Institute of Manufacturing Resource Management of India
Alternatives used in case of shortage of resources include – alternate resource, outsourcing, sub-contracting, rented skills/equipment. Adjust Schedules If everything else fails, plans need to be revised. Changes will impact overall planning, control processes. Some of the implications could include - rescheduling parent part, resulting in higher-level delays up to master schedule. This could also change when the other components for assembly are needed. This would have an impact on previously balanced material and capacity plan. Despite the implications, if schedule cannot be met, it better be changed. Relevant actions include Delay release; plan efforts to catch up; evaluate impact of higher-level assemblies
and associated components. Change order quantity Split lots (spread order over several work stations, run in several smaller
quantities) to alleviate lead time problems. Build partial complete
Costs must be considered. Alternatives will require premium – overtime, extra shipping & handling, additional setups Work is needed on preventive actions to prevent such problems in future.
Information Docket for Execution Order Release and Documentation : When the decision is made to release work for production, orders are opened in manufacturing system, to Inform MRP that there are scheduled receipts Allow material and labor charges Provide feedback documents to track progress and record issues
Documents are generated to provide information and instructions to the shop and facilitate feedback regarding material issues, order status, and so forth. Information needs depend on product and manufacturing complexity, degree of control required, and accessibility of such information through systems.

Session 7 – Execution and Control 156
Institute of Manufacturing Resource Management of India
Shop Information Docket for Execution : These dockets include the following Engineering drawings Production process (routing) information
◊ Order information: Order number, Part no, name & description, quantity, due
date ◊ Operations to be done, sequence, work centers ◊ Operation start and completion dates ◊ Operation descriptions ◊ Setup and run times ◊ Tooling, fixtures, material required.
Pick lists Other information and feedback documents
◊ Special instructions ◊ Move tickets ◊ Shipping documents ◊ Labor reporting tickets ◊ Tool requests ◊ Certification and test result forms
Control Work–in–Process Work in process is controlled by controlling capacity and controlling load.
Capacity Control Capacity and Load APICS dictionary defines capacity as “the highest reasonable output rate which can be achieved with the current product specifications, product mix, work force, plant and equipment. A measure of capacity must be established to identify the amount of production that can be reasonably expected. Two methods of depicting capacity include – Demonstrated capacity, Rated capacity

Session 7 – Execution and Control 157
Institute of Manufacturing Resource Management of India
Demonstrated Capacity : Demonstrated capacity refers to the capacity availed in recent periods. The calculation of demonstrated capacity uses a historic average of work produced. Care must be exercised in using demonstrated capacity information
◊ Adequate data must be used so that it is representative but not out-of-date ◊ The data must be reviewed for abnormalities, such as short weeks or resource
changes ◊ Adjustments must be made for planed changes in capacity, such as more people
Rated Capacity :
◊ Rated Capacity is also known as theoretical capacity. To calculate rated capacity, total hours available for production is based on number of people or pieces of equipment and work hours.
◊ Utilization factor is calculated by dividing the production time available by Total
clock hours available. Production time available is total clock hours available LESS non-working time (breaks, routine maintenance, etc..)
◊ Efficiency is a percentage representing the number of standard hours that can be
produced per actual hour of production. Efficiency = UStandard hours earned Total setup and run hours Rated Capacity = Total clock hours * Utilization factor * efficiency
◊ Utilization factor and efficiency can be combined in a single percentage called “productivity”.
Productivity = UStandard hours producedU
Total clock hours available Productivity percentage can also be distorted by the amount of work available to run. It is recommended that both methods “Demonstrated Capacity” and “Rated Capacity” be used. Calculate rated capacity and compare the results to demonstrated capacity. This comparison provides a test of reasonableness. Reasons must be determined for any significant differences in rated and demonstrated capacity.

Session 7 – Execution and Control 158
Institute of Manufacturing Resource Management of India
Load Control : APICS dictionary defines Load as “The amount of scheduled work ahead of a manufacturing facility, usually expressed in terms of hours of work or units of production.” Load is the amount of work to be done by a work center. Determining the Load :
◊ The production plan establishes the long-range rate of production. ◊ MPS drives MRP, planning future orders for purchased and manufactured items. ◊ Orders are released; progress is reported. ◊ CRP calculates standard hours required, by work center, by time period, based on
released orders and orders planned for future periods. ◊ When this calculation is made for all released and planned orders, the total load
(work to be done) can be compared for each time period to the capacity available. Balancing Capacity vs Load : Imbalances of load and capacity require corrective action – capacity adjustment, or load revision Long-range capacity management – e.g. new plant, major equipment, is done in business planning and production planning. Medium range capacity planning, such as adding a third shift, is done in MRP and CRP phases of planning and control. Short-range capacity and load adjustments are done in PAC
◊ Work overtime ◊ Make temporary re-assignments ◊ Use alternate routings ◊ Send to an outside contractor
Some capacity/ load adjustments may be handled either way – adjusting capacity or adjusting load. E.g. preventive maintenance Routine maintenance (regular requirement) can be accommodated by reducing available capacity via the utilization factor.
◊ Major overhauls (irregular, lumpy requirement) could be recognized as load by opening a work order to consume the capacity.

Session 7 – Execution and Control 159
Institute of Manufacturing Resource Management of India
Input / Output Control Getting more out of a work center just by putting more in is impossible. The work would overflow. Input/Output control is a method to manage queues and work-in-process lead times. It applies the basic principles of planning and control: plan, execute, measure, and correct. Input Output Control Report : Planned Input : Work expected to arrive by time period
◊ Based on CRP constraints ◊ Expressed in standard hours or other common unit of measure
Planned output : Work to be produced by time period
◊ To reduce queue, plan output greater than input ◊ Make capacity available
Planned Queue : Beginning queue + Planned Input – Planned Output
Actual Input : Work arriving at work center by time period, same unit of measure
◊ Obtained from reporting systems or manual logs ◊ Affected by releases to shop, flow from prior operations
Actual Output : Standard hours produced during each period
◊ From reporting systems or manual logs ◊ Affected by resources, efficiency, work load
Actual Queue : Beginning or prior period queue + actual input – actual output Verify periodically to confirm accuracy of input and output data

Session 7 – Execution and Control 160
Institute of Manufacturing Resource Management of India
Control Measure actual to plan Identify significant variations Take corrective action Cumulative deviations
◊ Highlight big differences, trends ◊ Establish tolerance levels ◊ Tune the process
Interpreting Input Output Control Reports Actual Output less than planned output: work center behind schedule Causes : Insufficient Capacity?, Not enough input? Result : Queue and LT increase? Actual Output greater than planned output: Work center ahead of schedule Causes : Excess Capacity Results : Queues less than expected, May run out of work Actual Output Less than actual input: Increase in queue and LT Causes : Not enough capacity or preceding work center ahead, releases early Results : Additional inventory at work center, risk of late orders Actual Input less than planned input: Work Arriving late Causes : Feeding work center is behind schedule, Late release of work Results : May run out of work, queue less than expected, output may suffer (Late orders Actual Input greater than planned input: Work arriving early Causes : Feeding work center ahead of schedule, work being released early Results : Queues and LT increase Actual Output Greater than actual input: Feeding centers behind – releases late or work center ahead of schedule Causes : Excess capacity or feeding work center behind Results : Wasted capacity, center may not have enough work, or late orders

Session 7 – Execution and Control 161
Institute of Manufacturing Resource Management of India
Priority control Operations Sequencing If several jobs are in line to be run, methods are needed to decide which goes first, which goes next. Specific orders, in sequence must be assigned to a worker. Establish Priorities – Order due dates – are simple but may be misleading because completing jobs
have different work remaining and time remaining. Operation start dates – take work remaining (including wait, queue, and move
times) into consideration. Critical Ratios = time remaining/work remaining. A critical ratio greater than 1
indicates that job has some slack time. Ratio less than 1 indicates job must be expedited.
Shortest processing times – The order with the least amount of setup and run time required at the current work center runs first. This scheduling rule can delay long jobs indefinitely. It may be used as a temporary expedient to rush work to downstream work centers.
First in First Out (FIFO) – should be used only where “work remaining” for competing orders is relatively equal.
Queue ratios and slack ratios are similar to critical ratios but are more complicated and offer no significant advantage
Assigning early due dates to orders for important customers will establish favorable operation start date, but
◊ The price for completing orders ahead of time could be late orders for other customers ◊ A better approach would be to assign tie-breakers codes to give special orders an edge in case of ties ◊ This method can also be used to give a slight, but reasonable, edge for new products, items being promoted and so forth.
Bad ways to set priorities include gravy jobs, informal hot lists, red tags, rush stickers.. Priorities must be rational, clear and consistent. Dispatching Systems : Priority based on earliest operation start date, priority code, setup type, etc. Work expected to arrive soon based on

Session 7 – Execution and Control 162
Institute of Manufacturing Resource Management of India
Orders with overdue start dates for work center or due to start today Orders at the prior operation Orders at earlier operation sequences likely to arrive soon
Other ways to sequence work Manually sort orders according to sequencing rules Apply first in first out Use signaling system
Dispatching Systems should address several considerations. Some of these include Supervisors may feel that they will lose control of their departments Problems often exist because important factors such as group setups are not
considered by the rules It may be possible to follow the rules religiously due to tooling problems or
material shortage A different setup sequence may seem to make sense Start a job early to combine setups Starting early may make other orders late
Good rules balance Schedule discipline with operational flexibility. Consider Complete overdue orders before any others are started If there are no overdues, group future orders with a current order to reduce setup,
but not more than X days ahead Bring problems to the attention of production scheduling Educate shop personnel as to the need for consistent, formal priorities Resolve problems and refine priority rules; then assure compliance Eliminate informal priorities Address legitimate priority needs within the formal system Insist upon timely and accurate dispatching information
Maintaining Priorities : Priorities must be maintained - I.e. master schedules, lead times, routing information must be maintained and kept up-to-date. Production must be executed in time to meet due dates. Late orders should be expedited. Jobs that are ahead of schedule should be de-expedited to make capacity available for the jobs that are behind Purchased items also should be expedited to compensate for the quality problems or excessive scrap and de-expedited if they are not needed as originally planned. Expedite/de-expedite situations could occur in CRP or in execution of production.

Session 7 – Execution and Control 163
Institute of Manufacturing Resource Management of India
Selection of Appropriate Operations Sequencing techniques : Job Shops – detailed backward scheduling, dispatching systems to sequence work Make-to-order and assemble to order environments – use of forward scheduling to
make promise dates to customers Flow production – signaling systems such as kanban and flow control. With
sufficient volume and consistent demand, mixed model scheduling and rate-based scheduling can be used
Custom built products and special projects CPM, PERT, or other network planning and control techniques
Bottleneck management – operations with constraining resources A variety of environments and strategies – several different methods
Production Reporting Shop feedback updates order status, keeps balances on hand current, and highlights problems to initiate corrective actions Production Progress must be reported to maintain schedules and respond to inquiries. Production information to be reported includes Job shop reporting : Quantities completed against manufacturing orders or shop orders Operation by operation completions May also include notification of moves from operation to operation
Flow production reporting : Quantities usually reported against the progress or work cell, although some may
report against batches or lots being produced Less detail – final completions by the work cell or process rather than step by step
operation completions To assure that steady flow schedules are achieved
Work center report includes reporting on material activity and capacity resources. Material Activity : Accurate quantities on hand and in process are essential. All material activity must be made known, including scrap, rework, and yield losses. Material reporting includes Storeroom inventories Work in Process Material in Scrap/Rework

Session 7 – Execution and Control 164
Institute of Manufacturing Resource Management of India
Material Activity Reporting: Storeroom Inventories Storeroom inventories – receipts, issues, adjustments, and location transfers must be recorded: Job shops issue materials to order numbers Flow, production issues materials to the process Materials transactions need to be recorded by lot or batch number if lot number
control is required Flow production encourages material delivery directly to the point of use. Issue
transaction may be automatically generated, based on the quantities consumed per the flow rate.
Material Activity Reporting: Work in Process Losses must be reported to keep track of the quantities remaining in process. If losses are greater than planned, more work may need to be released to compensate. Scrap – parts or products which are ruined during production or fail tests Rework – Items that do not meet specifications
◊ The availability of such items in terms of usefulness is questionable. Rework
must be reported to plan replacement quantities. ◊ Rework materials take up space awaiting dispositions (they tend to sit there).
A concerted effort is needed to fix them or dispose them off. Material Activity Reporting : Material in Scrap/Rework Procedures should be established to periodically review materials in scrap or rework condition, to assure that they are either discarded or repaired. Quantities in “limbo” take up space. They may or may not be useful. Decide which is the case, and take appropriate action. Yield losses – some production operations have inherent losses in the process Liquid products can evaporate Compound batches may shrink as some product sticks to or remains in equipment 105 sets of components may need to be started to produce 100 good assemblies Some fragile parts break during production
Factors can be applied in materials planning to compensate for such losses. However, actual yields must be reported to identify situations where the final output will be less or more than expected so that plans can be adjusted accordingly.

Session 7 – Execution and Control 165
Institute of Manufacturing Resource Management of India
Capacity Resources : CRP includes factors relating to performance, problems, exceptional conditions affecting capacity and other resources. Capacity resource reporting includes reporting on – Labor Equipment Tooling
Capacity Resources Reporting: Labor Labor – labor reporting updates status and efficiency information. PAC feedback includes changes in staffing levels, work hours, absentee rates, and other such factors affecting capacity. Typical labor reporting includes – Quantities completed and actual setup and run times, which serve several
purposes
◊ Order status update ◊ Efficiency information to determine rated capacity ◊ Identifies low efficiencies signaling problems, e.g. need for more training or
material and equipment problems ◊ Changes in staffing levels and hours of work must be communicated to update
rated capacity ◊ Temporary changes (illness, funeral leaves..) impact schedules, so production
scheduling must be notified. Capacity Resources: Equipment Equipment – machine availability is important. Downtime must be tracked and provided for in planning and scheduling. Break-downs must be promptly communicated and rectified Routine maintenance must be scheduled to maximize equipment availability.
Actual time may be reported.
◊ To measure time required ◊ To assure that the preventive maintenance schedule is being followed ◊ Overhauls must be planned and scheduled: reporting actual time consumed can
help to plan future maintenance ◊ Unexpected breakdowns are major problems: procedures should include notifying
production scheduling (they need to know that a machine is down and how long repairs might take to develop alternative plans)
◊ Statistical process control (SPC) charts and recordings of physical conditions (e.g. temperatures, cycle times) can alert people to the need for overhaul or repair.

Session 7 – Execution and Control 166
Institute of Manufacturing Resource Management of India
Capacity Resources: Tooling Information about tooling usage and condition. Good order release practices confirm tooling availability. The status of tools, fixtures, dies, numerically controlled machines (NC) programs, and testing devices is important, and must be reported. Consumable tools – record usage (strokes, pieces produced, whatever is a good
indicator of wear and remaining tool life) Other tools, fixtures, NC tapes, test equipment, etc.: Are they available? Have
they been designed, procured, programmed? Tooling is an important resource and must be controlled. Feedback is needed to
confirm availability
Quality Assurance Quality Assurance deals with Measuring Quality and associated costs Process variation – kinds and patterns of variation Process capability Process Control – Control charts and control limits Sample Inspection – Reasons, Necessary conditions, Sampling Plan
Measuring Quality Costs Associated with Quality Cost of quality is an important measure that can be used to understand where problems occur and to focus on quality improvement programs. Internal Failure Costs – Cost of defects found prior to shipment (scrap, rework,
failure analysis, sorting inspection, reinspection) External Failure costs – are costs of defects found after shipment. E.g. warranty
costs, complaint adjustments, returned material and allowances. Appraisal Costs – include costs associated with determining the degree to which
the product conforms to specifications. Examples include inspection and test at all stages of production, quality audits, and maintenance and test equipment.

Session 7 – Execution and Control 167
Institute of Manufacturing Resource Management of India
Prevention Costs – are the costs incurred to keep failure and appraisal costs to a minimum. e.g. quality planning, process planning, process control and quality training.
Process Variation – Kinds and Patterns Process Variation refers to change relating to a process - in data, characteristic, or function caused by one of the four factors – special causes, common causes, tampering, or structural variation.
Process Capability In APICS Dictionary, Process capability refers to the ability of the process to produce parts that conform to engineering specifications. Process capability relates to the inherent variability of a process that is in a state of statistical control. An analysis should be made if the process is capable of producing perfect output (zero defect). Often we demand perfect output from a process that cannot due to flaws in procedures, worn-out machines, untrained people, produce a perfect output. When the process is not capable, it must be improved until it is capable. Process capability analysis is a procedure to estimate the parameters defining a process. The mean and standard deviation of the process are estimated and compared to the specifications. This comparison is the basis for calculating capability indices. Additionally, the form of the relative frequency distribution of the characteristics of interest may be estimated. Process capability index refers to the value of the tolerance specified for the characteristic divided by the process capability. There are various types of process capability indexes, including widely used Cpk and Cp.
Process Control Process control refers to the function of maintaining a process within a given range of capability by feedback, correction, etc. 2 Sets of sources of error in process include common (random) causes and special (assignable causes)

Session 7 – Execution and Control 168
Institute of Manufacturing Resource Management of India
Common (Random) causes Errors introduced into the process that come from common causes occur because of the randomness of the process or the inability of the process to repeat precisely every time. Special (assignable) causes Errors introduced into the process that come from special causes are controllable, can be identified, and can be eliminated The purpose of any process improvement activity is to eliminate all assignable causes of errors from the process and to ensure that the common (random) causes of error are within the tolerances needed for process quality success. Control Charts and Limits Control chart is a graphic comparison of process performance data with predetermined computed control limits. The process performance data usually consists of groups of measurements selected in regular sequence of production that preserve that order. The primary use of control charts is to detect assignable causes of variation in the process as opposed to random variations. Lower Control Limit (LCL) in a control chart refers to control limit for points below the central line. Upper control Limit (UCL) in a control chart refers to control limit for points above the central line. Process that is out of control (producing rejects) will not benefit from statistical process control charts. If an X (average) or R (Range) chart is used on a process that is out of control, the chart will only show that the process is out of control. A control chart used prior to process improvement will establish the variability of the process. These pre-control charts are sometime useful because they may establish a baseline for process change and can be used to monitor progress. X Chart (Average or mean) – plots the average of a certain dimension over time. R Chart (Range) – also used on variables, measures the range of the dimension of a certain variable. U Charts (Defects per unit) – used on attributes, measures the number of nonconformities per unit. P Charts (Monitor percentage defective of a process output) – used on attributes, measures the nonconforming fraction of the attribute (e.g. percentage defective)

Session 7 – Execution and Control 169
Institute of Manufacturing Resource Management of India
C Chart (Number of Defects) – used on attributes, measures the number of nonconformities.
Sample Inspection Sample is a portion of a universe of data chosen to estimate some characteristics about the whole universe. The universe of data could consist of sizes of customer orders, number of units of inventory, number of lines on a purchase order, etc. Sampling refers to a statistical process where generalizations regarding an entire body of phenomenon are drawn from a relatively small number of observations. Inspection refers to measuring, examining, testing, or gauging one or more characteristics of a product or service and comparing the result with specified requirements to determine whether conformity is achieved for each characteristic. In general most firms inspect products solely for the purpose of finding errors or rejects. Inspection viewed from this perspective is futile and does not contribute to quality improvement. Firms that inspect either 100% of product or a statistical sample do not cause any changes in product quality. In a sample inspection, a small quantity, statistically chosen, is removed from a larger lot. The results of this inspection of this small number of parts is used to infer the quality level of the overall lot or group of parts or product. Nature of sampling is such that it assumes that a level of defects are present. The choice of the number of parts that are sampled is based on the level of defects that will be tolerated. Sample inspection will nearly guarantee that the lots accepted will have some level of defects. This is certainly not what a firm desires. Most commonly accepted alternative is to inspect a larger percentage of the lot to find the defects. In the extreme this results in 100% inspection. Besides being costly 100% inspection will not yield perfect quality. Due to human error and other causes, lots will have to be inspected on average 200%, I.e. examined twice or more to find 100% of the defective items.

Session 7 – Execution and Control 170
Institute of Manufacturing Resource Management of India
Key Terminology 01) Appraisal Cost 02) Backward Scheduling 03) C Chart 04) Common (random) Causes 05) Control Chart 06) Cost of Quality 07) Critical Ratio 08) Customer Service 09) Demonstrated Capacity 10) External Failure Cost 11) FIFO 12) Finite Loading 13) Finite Scheduling 14) Forward Scheduling 15) Infinite Loading 16) Infinite Scheduling 17) Inspection 18) Internal Failure Cost 19) LIFO 20) Lower Control Limit 21) Operation Start Date 22) Order Due Date 23) Order Processing 24) Order Promising 25) P Chart 26) Prevention Cost 27) Process Capability Analysis 28) Process Capability Index 29) Process Control 30) Process Variation 31) Productivity 32) Pull System 33) Push System 34) Queue Ratio / Slack Ratio 35) R Chart 36) Rated Capacity 37) Shop Information Docket 38) Shortest Processing Time 39) Special (assignable) Causes 40) U Chart 41) Upper Control Limit 42) Utilization 43) X Chart

Session 7 – Execution and Control 171
Institute of Manufacturing Resource Management of India
Practice Questions – Session 7 Question 1 : Which of the following is not a customer service measure :
A) Fill rate B) Availability C) Lowest price D) Quality of product
Correct Answer is: ------------------------------------------------------------------------------------------------------------ Question 2 : A system that produces items only as demanded for use or to replace those taken for use is called :
A) Pull system B) MRP system C) Push system D) ERP system
Correct Answer is: ------------------------------------------------------------------------------------------------------------ Question 3 : Which of the following charts plots number of defects :
A) P chart B) U chart C) C chart D) R chart
Correct Answer is: ------------------------------------------------------------------------------------------------------------ Question 4 : Which of the following is not a purpose of process improvement activity:
A) Eliminate all assignable causes of errors from process B) Ensure common causes of error are within the tolerance needed C) Ensure process quality success by ensuring assignable causes of error to a
limit D) Ensure process quality success by ensuring common causes of error to a
limit Correct Answer is: ------------------------------------------------------------------------------------------------------------

Session 7 – Execution and Control 172
Institute of Manufacturing Resource Management of India
Question 5 : Quality costs relating to determination of degree to which the product confirms to specifications are called
A) Internal failure cost B) External failure cost C) Prevention cost D) Appraisal cost
Correct Answer is: ------------------------------------------------------------------------------------------------------------ Question 6 : Where work remaining for completing orders is relatively equal, the dispatching mechanism recommended should be :
A) Shortest processing time B) Last in first out C) First in first out D) Critical ratio
Correct Answer is: ------------------------------------------------------------------------------------------------------------ Question 7 : Which of the following is not a good priority rule :
A) Shortest processing time B) Hot jobs C) Critical ratio D) First in first out
Correct Answer is: ------------------------------------------------------------------------------------------------------------ Question 8 : Which one of the following is not a “cause” or “result” of a work center with actual output greater than the planned output :
A) Work center is ahead of schedule B) Excess capacity exists C) May run out of work D) More queue than expected
Correct Answer is: ------------------------------------------------------------------------------------------------------------ Question 9 : Each of the following is a method to balance load and capacity in the short-term execpt :

Session 7 – Execution and Control 173
Institute of Manufacturing Resource Management of India
A) Work overtime B) Start a new plant C) Use alternate routings D) Send work to an outside contractor
Correct Answer is: ------------------------------------------------------------------------------------------------------------ Question 10 : Each of the following is a good reason for infinite scheduling except :
A) To plan how much capacity could be used B) To assign only the work to work center that it can handle and no more C) To see what should be made available D) To calculate requirements for critical labor skills, tooling etc.
Correct Answer is: ------------------------------------------------------------------------------------------------------------

174
Institute of Manufacturing Resource Management of India
SESSION 8
PERFORMANCE
MEASUREMENT

Session 8 – Performance Measurement 175
Institute of Manufacturing Resource Management of India
Performance Measurements Why Measures are required ?
◊ Measures can do more than just evaluating performance of a process or worker. ◊ Measures can be used to motivate workers or give feedback to focus on areas
needing action or problems needing resolution. ◊ Measures can be used to measure the degree to which the firm has attained its
strategic goals, or they can be used to evaluate local actions. ◊ Measures can be coordinated to achieve overall objectives or can be used to
evaluate some activity. Performance Measurement Questions to be answered . . .
◊ “How Can We Link Vision, Strategies to Business Performance?” ◊ “How Are We Going to Evaluate Change?” ◊ “How Can We Make Better Product, Customer and Process Decisions?” ◊ “Why Don’t We Know Our Actual Process Cost?” ◊ “How Can We Reinforce Cultural Change and Limit Resistance to Improvement
Initiatives?” ◊ “How Can We Create a Common Language for Communicating the Strategies
Throughout the Organization?” Performance measures are
◊ Part of any enterprise’s strategic plan, they indicate how to progress toward enterprise goal and objectives will be measured,
◊ Used by decision-maker in allocating resources, ◊ Intended to help focus efforts on achieving priority goals and objectives, ◊ Monitoring tools to help guide top management and make it accountable to the
shareholders.
General Principles of Performance Measurements The following are the generic guiding principle for any performance management process. These should be modified to suit specific industry, their vision, mission and objectives in running business organization.

Session 8 – Performance Measurement 176
Institute of Manufacturing Resource Management of India
Establish strong, senior management sponsorship. Strong sponsorship reflects a commitment from the very top of the organization to the Performance Management process and, as such, is requisite to its institution. While implementation of the Performance Management process is rewarding, it involves a great deal of effort, learning, and change within an organization, particularly with regards to the organization’s focus, communications, reward structures, roles, and responsibilities. Active and visible sponsorship from senior management drives the organizational commitment essential to facing these challenges. More specifically, sponsorship reinforces the importance of Performance Management and motivates the organization to institutionalize it as a vital and continuous tool to success. Develop and articulate a clear strategy, along with the factors critical to its success. The Performance Management process is designed to link a strategy to its day-to-day execution. Therefore, the strategy must be clear, and it must be shared by those who would execute it. Without a clear, agreed-upon strategy as the basis for the development of measures, the resulting identification of critical success factors and definition of measures may not be wholly pertinent or effective. The ability of an enterprise to meet its long-term objectives depends in part on its achievement of short-term objectives. This dependency requires that the articulated strategy look upon two horizons: one focused on short-term objectives -- such as continuous improvement of products and processes -- and one focused on long-term objectives -- such as future products and ventures. Under the Performance Management framework, measures and targets can be defined to support this dual focus. Create a continuous Performance Management process that is flexible. The Performance Management process developed for any organization must be iterative in nature. The process, including the development of measures, communications, and rewards, must possess the inherent flexibility to adapt to on-going changes in an organization’s strategy and business environment. Conversely, the process must continuously serve as a tool for revealing issues and trends that will help shape the organization’s strategy and, in turn, its future. Within the meaning of flexibility, the process of Performance Management also must allow for active coordination with other corporate processes, such as Planning. Coordination will ensure that all actions taken to execute strategy will reflect the priorities of the organization and will be measured effectively. Actively and continuously communicate enterprise objectives, critical measures, targets, and performance results throughout the organization. Active communication throughout an organization is critical to an effective Performance Management process. Communication can be viewed as an on-going circular activity

Session 8 – Performance Measurement 177
Institute of Manufacturing Resource Management of India
that begins with senior management, which broadcasts to the organization the company strategy and supporting information such as organization objectives, critical success factors, competitive environment, and job economics. Continuous communication of this information creates a constancy of purpose within the organization; each employee should not only know the overall corporate goals but also understand how his/her efforts contribute to those goals. With this understanding, employees are be equipped to organize and adjust, if necessary, their activities to meet the expressed strategy. The circle of communication continues with communication up the organization. Employees at all levels hold and acquire knowledge about the organization’s operations and competitive effectiveness. Equipped with an understanding of the overall corporate strategy, they can identify “in the field” those issues of strategic importance and communicate them up the organization. Such information is valuable to senior management for formulating and modifying strategy. Speedy identification of front-line issues enhances the number of options and time a company has to respond to them. Establish specific, ambitious, and reachable targets that are based on comparable benchmarks. The character of targets has a substantial impact on an organization’s ability to meet them. In particular, research has proven that specific and challenging goals, when accepted by those who are responsible for meeting them, lead to greater effort than do vague or easy goals. A target is considered specific when it outlines the desired tangible outcome and the timeframe over which it will be accomplished. However, overly ambitious goals may negatively impact an organization: they may degrade employee commitment and increase both the probability and fear of failure, which, in turn, reduces productivity. Unrealistic goals also may increase the potential for workers to take inappropriate risks or actions. Additionally, targets should be based on benchmarks, of which there are three sources : i) internal standards; ii) competitors; and iii) organizations outside the industry. Benchmarking provides an organization a means of identifying differences between itself and these three sources. A thorough understanding of such differences is vital for motivating change and revealing opportunities for improvement. The usefulness of benchmarks depends upon their credibility. Credibility, in turn, depends upon the reasonableness and comparability of standards chosen. Since organizations and their respective processes and constraints are rarely identical, benchmarks must be adjusted to a basis that allows for a reasonably fair comparison. Adjustments typically are made only for inherent differences that are either uncontrollable or unchangeable. Several additional considerations, which are described as follows, should be made when crafting targets:

Session 8 – Performance Measurement 178
Institute of Manufacturing Resource Management of India
Set milestones For targets that are long-term in nature, milestones should be established to measure progress towards the final, desired outcome. Milestones also can be viewed as decision points at which management acquires additional information that is valuable for adjusting the direction of that initiative. Management may use that information to either proceed as originally planned, terminate the project, or alter its goals. Document assumptions Due to the inherent uncertainty of forecasts and setting targets, management must make assumptions, such as those regarding the macro economy, when deriving performance targets. Documentation of such assumptions facilitates a more meaningful assessment of performance and determination of action plans. Documentation of assumptions serves two other, related purposes. First, the exercise of documentation forces management to understand more deeply the drivers of its business. Second, it facilitates contingency planning -- that is, the development of alternative plans should particular assumptions or logic not hold true. Establish management ownership of the target setting process An organization’s operational knowledge resides with management. Accordingly, ownership of the target setting process by management, versus Corporate Planning, is helpful in establishing targets that are well informed and realistic. Even more importantly, ownership fosters a vital understanding of fundamental business and operational issues and builds goal commitment deeper into the organization. With greater understanding and commitment, line management is more likely to accept targets and to achieve them. In short, ownership of targets implies responsibility for meeting them. Identify the vital few measures that are i) aligned to enterprise strategy and ii) balanced across all areas -- both financial and non-financial -- in which value is created in the organization. The identification of the vital few measures associated with the ultimate execution of strategy is the basis of the Performance Management process. Measures should be defined for all levels of the organization -- enterprise, process, and individual contributor and provide objective data to inform the decisions each must face to achieve the organization’s strategy. Measures of organizational performance also must be balanced across all value creation objectives of the organization. Value creation objectives are defined as the areas in which value is created in the organization. Traditionally, organizations have focused solely on financial measures to define performance. Without a broader focus on all major areas of value creation, however, the organization doesn’t capture exactly what is driving

Session 8 – Performance Measurement 179
Institute of Manufacturing Resource Management of India
the financial performance of the organization, such as customer satisfaction, employee satisfaction, and new product development. Looking across a balanced set of measures encourages management to view the business in a way that reveals the full range of competencies and factors critical to competitive advantage and vitality. Lastly, consistent with the Pareto principle, only those few measures that reflect vital elements of strategy and critical success factors should be reported. By limiting measures to the vital few, management can focus its efforts on those areas that have the greatest impact on the organization. Monitor results at specific, regular intervals to assess progress. At least quarterly, management should formally assess the organization’s progress on i) action plans and the Improvement Portfolio; ii) the achievement of targets; and iii) the reaching of milestones. The periodic assessment is a forum not only for reviewing performance at a point in time but also for identifying emerging issues and problems early. The assessment also provides valuable information with which to make necessary changes to plans -- targets, action plans, and, potentially, strategy -- and to assumptions and logic. Determine the correlation between non-financial measures and financial results. The majority of measures presented in a typical Balanced Scorecard are non-financial ones, such as cycle time and customer satisfaction. Although non-financial, each of these measures ultimately translates, either directly or indirectly, into a certain financial outcome. Establishing this financial relationship, or correlation, provides an organization with valuable information that supports management decisions regarding the selection of improvement initiatives and capital investments. More specifically, the financial relationship allows management to identify the measures that yield the greatest financial impact and to focus its attention on them. This information, in turn, allows management to determine the return on any investment proposed to improve the performance of those measures. Align reward system with measures to reinforce desired behaviors. The Performance Management process defines specific measures, along with targets of performance, at all levels of the organization. These measures and targets drive specific behaviors, which, collectively, drive organization performance. To enable the success of the Performance Management system, compensation and incentives must be tied to desired behaviors. Without an alignment between what is being measured and what is being rewarded, a conflict will exist between individual efforts and organization objectives.

Session 8 – Performance Measurement 180
Institute of Manufacturing Resource Management of India
Deploy technology to support the Performance Management process. Easy access to information enables the Performance Management process to operate in an effective manner. Whether it is to catalog information, provide data for measures, or report progress, a technological system will enable the success, flexibility, and communication of the Performance Management process. Align the corporate culture with the Performance Management process. In any organization, to fight the culture (the beliefs, behaviours and values of an organization) and implement a process or system that is not aligned with that culture, inevitably means failure. An organization, therefore, must carefully craft a culture that supports the objectives of the Performance Management process. Active communication and aligned reward structures, which were discussed previously, assist management with creating such a culture. Additional key factors that support an effective Performance Management culture are participation and accountability. Each employee should be expected to contribute continuously to achieving corporate success and defining, through action plans, what will be done to achieve it. As part of this effort, employees should participate in setting targets for his/her area of focus and be responsible for achieving them. Once targets are set and updated for changes in assumptions and general business conditions, it should not be considered culturally acceptable to miss them. Lastly, the culture must foster a spirit of continuous improvement and learning. As mentioned before, the implementation and practice of Performance Management often involves substantial time commitments, organizational learning, and cultural change. Consequently, the Performance Management process will never start as a perfect one. It is a process that must continuously evolve and improve as the organization gains a better understanding of how it is practiced and applied. Along the way, the organization also will continuously broaden and deepen its understanding of its business. Develop and maintain an Improvement Portfolio as a vehicle for identifying and managing core opportunities for improvement. The Improvement Portfolio outlines the core initiatives an organization will undertake to achieve its targets. Included in the Portfolio for each initiative are a project description and definitions of such items as: i) project owner(s); ii) human and capital resources required; iii) detailed action plans; iv) project benefits and costs, both tangible and intangible (value proposition); v) dependencies with other projects; and vi) a time frame for implementation. The Portfolio should be maintained regularly to reflect new initiatives and modifications to existing ones. The maintenance of an Improvement Portfolio and the development of targets occur concurrently, primarily since the integrity of targets depends upon the ability of an

Session 8 – Performance Measurement 181
Institute of Manufacturing Resource Management of India
organization to undertake specific initiatives to achieve them. In other words, the actions specified by improvement initiatives define what levels of performance are achievable. Defining targets and initiatives is a difficult and time-consuming process, yet it yields numerous benefits. Most importantly, specific action plans for each initiative provide direction to those who will carry them out and, as a result, help to ensure that targets are met. Further, rigorous development of action plans fosters a greater understanding of the drivers and barriers to organizational success. Lastly, the complexity of total process demands the knowledge and ideas of employees at all levels in the organization and, as such, encourages teamwork. PPeerrffoorrmmaannccee MMaannaaggeemmeenntt DDeeffiinniittiioonnss How the organization sets individual direction, evaluates performance and provides feedback on a formal and informal basis and takes corrective actions in resetting individual direction. PPeerrffoorrmmaannccee MMeeaassuurreemmeenntt OObbjjeeccttiivveess
◊ Develop a process for measuring and managing performance to support and reinforce Future State behaviors
◊ Refine individual performance measures by position ◊ Provide input to Migration Planning
Performance Measurement Key Steps
◊ Current State Review ◊ Education / Overview ◊ Develop Process Flow for Performance Measurement Process ◊ Define Process Flow Component Attributes ◊ Develop Balanced Scorecard for each Job Position / Team ◊ Review and Approval
Performance Measurement Key Deliverables
◊ Performance Measurement Process Flow ◊ Process Flow Component Descriptions ◊ Barriers / Strategies to Overcome Barriers ◊ Performance Measurement Linkages to Other OA Enablers ◊ Balanced Scorecard by Position / Team

Session 8 – Performance Measurement 182
Institute of Manufacturing Resource Management of India
Performance Measurement Process Components
Performance Measurement Balanced Scorecard Definition : A set of performance measures that are linked to the corporation’s strategic objectives and give a comprehensive view of the business. The balanced scorecard includes financial measures that track results of past actions and non-financial measures that are the drivers of future financial performance. WWhhaatt iiss PPeerrffoorrmmaannccee MMaannaaggeemmeenntt?? Performance Management is a system that provides organizations with a method of measuring and aligning the organizations strategy with business performance, the capability to capture performance measures for making decisions to achieve the strategy, and a framework for targeting and monitoring the improvement initiatives taken from those decisions. Roadmap to getting something done, So we don’t miss some thing important So we don’t dwell on what we know to be unimportant Common language for process of communication Tools for planning, conducting and controlling business processes Provide a consistent, reliable, and meaningful methodology to assess and monitor short and long-term business performance - both financial and non-financial - and track progress in implementing Key Strategic Initiatives”
Training & Education
Set Expectations
Establish M easurement
CriteriaSelf Review
Rewards & Recognition
Formal Evaluation
Periodic Feedback
Future Development
Plans
•Performance•Behavioral•Collaborative Effort
•Goal Setting•Specific, Agreed Upon•Understood, Flexible•Collaborative Effort
•Completed by position incumbent•Completed prior to formal•Use as base for formal evaluation•Evaluation discussion
•Drive future expectations•Collaborative Effort•Improvement objectives•Planned training•Com munication
•Financial•Non-financial•Earned not given
•No surprises•Fair & firm•Opportunity for coaching•Assessment•Input to development plans
•M ay be informal•Frequent•Soon after milestones•Recast Expecations

Session 8 – Performance Measurement 183
Institute of Manufacturing Resource Management of India
Types of Measurements Most measures can be separated into two broad types such as financial and non-financial. Financial measures are those we can associate with the accounting systems or with financial reports of a firm. These kinds of reports are normally available in any standard integrated package such as Oracle, SAP. Further customization has to be made to address specific industry’s requirement.
◊ E.g. material price variances, inventory turns, return on investment, various financial ratios.
Non-financial measures are usually not expressed in dollar terms.
◊ E.g. Cycle times, number of rejects, % of on-time delivery Measurements can also be local or global. A local measure is one that is particular to a sub-unit or activity. These also usually happen to be measures associated with cost accounting systems. These measures are also shown to be counterproductive to the achievement of many of the firms’ goals and can often be in conflict with one another. Local measures are usually applied to the lowest level of work in the system. Local optimum solutions are not necessarily giving Global optimum solution. Trade-off to make based on situations.
◊ E.g. labor-output rates, machine cycle times, machine utilization, machine downtime in a particular area, number of defects in particular batch of products.
Global measures focus on overall performance of the firm.
◊ E.g. defects per unit, profitability, return on investment, return on assets, overall sales, customer satisfaction index based on predetermined parameters.
Local measures are used to evaluate performance of a department or group. Global measures are used to evaluate overall performance of the firm. Result of Making Decisions From Inaccurate Information
◊ Misdirected marketing efforts ◊ Incorrect pricing ◊ Inability to manage overhead costs ◊ Misplaced emphasis on cost-cutting ◊ Under investment in new technologies ◊ High Overheads Compared to Industry

Session 8 – Performance Measurement 184
Institute of Manufacturing Resource Management of India
◊ High Indirect to Direct Manpower Ratio ◊ Poor Resource Productivity ◊ Expediting Is the Rule ◊ Informal Systems Are Operating Systems ◊ Poor Due Date Performance, Dissatisfied Customers ◊ High but Wrong Inventories, Sales/production Driven by Material Availability ◊ High Lost Sales ◊ Cash flow problems, suppliers not paid in time ◊ No accountability- justification, excuses and finger pointing ◊ Overstated/inflated plans and schedules ◊ Multiple figures, plans, schedules ◊ Material spends more than 80% time in non value added activities ◊ More fire-fighting activities, less planned activities ◊ Confusion ◊ Missing leadership and intent ◊ “Chalta Hai” attitude, ◊ No penalty for non-performance ◊ None or incorrect performance measures ◊ No system of rigorous planning and control ◊ People thriving on chaos ◊ Busy in fire-fighting, no time for improvements ◊ Keep producing even when not required
Performance Management Benefits - Tangible
◊ Measurement managed companies outperform their non-measured competitors ◊ Grow Market share for services that have value ◊ Exit market, or reduce services with no value ◊ Improve cost structure for unprofitable services ◊ Improve customer satisfaction through understanding of value proposition of
services delivered ◊ Sustained improvement and value
Performance Management Benefits - Intangible
◊ Tool to communicate the company’s strategies ◊ Assign Accountability ◊ Provides for managing and improving critical business processes ◊ Creates an understanding of how performance is achieved ◊ Develops bias for proactiveness vs. reactiveness ◊ Provides foundation for continuous learning/improvement ◊ Higher value added business support ◊ Motivates people to achieve strategic goals and objectives ◊ Increased market share

Session 8 – Performance Measurement 185
Institute of Manufacturing Resource Management of India
◊ Better customer satisfaction ◊ Improved vendor performance ◊ Reduced obsolescence ◊ Increased flexibility ◊ Reduced premium freight ◊ Reduced quality costs ◊ Improved resource utilisation ◊ Improved information accuracy ◊ Improved decision making capability ◊ Better cost visibility ◊ Improved coordination between all departments ◊ Reduced expediting ◊ Improved morale
Financial Measures
Accounting Based The purpose of accounting based financial information is to ensure fair and accurate reporting of financial condition of the firm to shareholders. Cost accounting systems focus on variety of variance accounting procedures that focus on positive and negative deviations of costs from some budgetary or other standard set by the firm.
◊ E.g. labor rate, labor quantity variance; Material price and material quantity variance; Factory overhead variance, overhead efficiency variance
Activity Based Measures Activity based cost systems allocate costs (specially overhead cost) according to the degree to which they are needed for a particular product or product group. This method seeks to identify cost drivers or activities that cause costs to be accumulated to some production line or task. In classical accounting systems overhead is allocated (spread uniformly) over the entire production process. This technique distorts cost of products as the product that uses little overhead is made to absorb extra overhead, and vice versa.

Session 8 – Performance Measurement 186
Institute of Manufacturing Resource Management of India
Under activity based cost system, the overheads relating to specific product or product group are charged to it based on the cost drivers, which gives a more accurate information on costs and margins. The activity based costing system should make production of higher volume standardized products appear more profitable. Activity based cost systems allocate costs (specially overhead cost) according to the degree to which they are needed for a particular product or product group. This method seeks to identify cost drivers or activities that cause costs to be accumulated to some production line or task. In classical accounting systems overhead is allocated (spread uniformly) over the entire production process. This technique distorts cost of products as the product that uses little overhead is made to absorb extra overhead, and vice versa. Under activity based cost system, the overheads relating to specific product or product group are charged to it based on the cost drivers, which gives a more accurate information on costs and margins. The activity based costing system should make production of higher volume standardized products appear more profitable. Activity-Based Management Definition : ABM is a discipline that focuses on the management of activities as the route to improving the value received by the customer and the profit achieved by providing this value. This discipline includes cost driver analysis, activity analysis, and performance measurement. ABM draws on Activity-Based Costing as its major source of information.” ABM is a process to :
◊ Understand how and where costs are consumed ◊ Determine the underlying “driver” of the business process/activities ◊ Identify how much it costs to perform a process/ activity ◊ Apply cost to products/services, customers, applications or sites based on
resources (drivers) consumed ◊ Quantify value drivers and provide a foundation to the strategic planning process

Session 8 – Performance Measurement 187
Institute of Manufacturing Resource Management of India
Why Activity-Based Management?
◊ World class Companies Know Their Profitability by Product, Customer (Market Segment), and Geography
◊ To support profitability analysis of products/services or customers/segments ◊ To support pricing, product development and strategic business planning and
decision making ◊ To support improvement in business performance
Why Activity-Based Management it is important?
◊ Activities that directly impact value drivers are identified ◊ Visibility to what drives a change in the value of the organization ◊ Identification of what needs to be measured to influence a change in the value of
the business How is it done?
◊ Identify value drivers ◊ Map processes, activities and drivers to value driver ◊ Communicate linkages ◊ Tie to performance management process
Results
◊ Action taken on activities that are important ◊ More accurate product and customer cost based on true consumption of resources ◊ Support for operational control through the use of a Bill of Activities ◊ Support for profitability analysis and strategic business planning ◊ Support for process improvement and cost reduction ◊ Support for investment analysis and planning
Productivity Measures Productivity based measures include single-factor and total-factor productivity. These measures can be expressed in monetary (e.g. Dollar) or physical (e.g. Units, weight) terms. Productivity Based – Single Factor : Single-factor productivities are the amount of output generated per unit of resource used. These measures could be global or local.
◊ E.g. units per pound of material, units per labor hour, units per machine hour

Session 8 – Performance Measurement 188
Institute of Manufacturing Resource Management of India
Using these measures one can determine whether productivity is rising or falling over a period of time and causes for those changes can be investigated. Problems occur when the firm expresses single factor productivity measures in financial terms (dollars). The effect of process changes, wage changes etc complicate analysis of productivity. Sales per Person Overall value addition per person. This ratio shows how effective is the process Financial Measures – Productivity Based – Total Factor Productivities : some of the single-factor productivities go down and few go up, with only single factor productivities may not know whether it is better off or worse compared to earlier. Total-factor productivities (TFP) resolve this problem by looking at sum of all productivities. Monitoring changes in TFP enables firm to interpret activities from period to period; and across various plants/SBUs. Adjustments made before summing productivities Individual productivities are not used in equal proportion, but are weighed in pre-determined proportions. Each individual factor is multiplied by its percentage of use in the final product and summed to compute TFP. TFP is useful in determining how internal changes as well as variations in the inputs of the operation affect the overall performance of the business.
Other Financially based Measures
◊ Inventory Measures ◊ Quality Measures ◊ Cost of Goods Sold (COGS) Measures
Inventory Measures Inventory levels include Raw Material, WIP, Finished Goods and other non-production stocks (MRO). E.g. Hand gloves, Safety glasses, Maintenance Spare parts, Lubricating oil etc. Inventory Turns = Cost of Goods Sold/Inventory

Session 8 – Performance Measurement 189
Institute of Manufacturing Resource Management of India
Inventory turn reflects the velocity of the inventory through the firm. Fastest the firm can move inventory through the plant is the sum of all the operation times for the product. Queue, move, wait times and other delays prevent the firm from achieving highest possible inventory turns. Quality Measures Cost of quality is an important measure that can be used to understand where problems occur and to focus on quality improvement programs.
◊ Internal Failure Costs – Cost of defects found prior to shipment (scrap, rework, failure analysis, sorting inspection, re-inspection)
◊ External Failure costs – are costs of defects found after shipment. E.g. warranty
costs, complaint adjustments, returned material and allowances. ◊ Appraisal Costs – include costs associated with determining the degree to which
the product conforms to specifications. Examples include inspection and test at all stages of production, quality audits, and maintenance and test equipment.
◊ Prevention Costs – are the costs incurred to keep failure and appraisal costs to a
minimum. e.g. quality planning, process planning, process control and quality training.
Cost of Goods Sold Measures COGS is also known as factory cost or manufacturing cost. Made up of direct labor, materials and factory overhead. COGS measure is important in understanding the ratio of each cost element to the whole. When the percentage of one of the element in the whole is low, the focus on control of that element should be low. Typically 80/20 rules apply here.
Non – Financial Measures
Strategic Measures

Session 8 – Performance Measurement 190
Institute of Manufacturing Resource Management of India
Non-financial measures should be balanced and reflect the strategic importance of each of the strategic drivers – price, quality, delivery speed.. Measures based on Cost Drivers
◊ Cycle time cost measures ◊ Waste reduction measures
Measures based on Quality Drivers – include quality measures for
◊ Sales ◊ Product design / design engineering ◊ Accounting ◊ Production / Manufacturing
Measures based on Delivery Speed
◊ Cycle time ◊ Delivery reliability ◊ Flexibility
Cost / Price Measures Where cost is of strategic importance to the firm, there is value in focusing on local cost measures. The firm’s attention to cost measures should be in proportion to place of ‘cost’ in strategy of the firm. Cycle Time Measures - Cost can be reduced through rapid processing of product. Materials velocity (cycle time for product manufacture) is a measure that reflects cost. Waste Reduction Measures – All identifiable waste is a cost to the system. Waste reduction helps in reducing the cost to the system. E.g. reduction in waste of time, space, energy, equipment, material Any measure which will reduce overall lead time to service customer orders. Sample Cycle Time Measures :
◊ Order entry time ◊ Master schedule preparation time

Session 8 – Performance Measurement 191
Institute of Manufacturing Resource Management of India
◊ Machine changeover time (One can apply quick die change system to reduce setup time, Single minute exchange of Die (SMED Concept on production shop floor, Compare Flexible manufacturing System (FMS) v/s. rigid production process line)
◊ Packaging to ship time ◊ New product development time (This will only affect for introduction of new
product time to market. For detailed please refer `Marketing Management, Asian perspective by Philip Kotler and some other Asian Author for knowing exact definition of new product and their launching strategy with an example on SONY’s case study)
◊ Supplier selection time ◊ Time to return customer calls ◊ Time to prepare annual budgets ◊ Time to update inventory files ◊ Time to receive materials ◊ Time to hold meetings
Quality Measures Quality Measures for Sales – may include items such as
◊ Order entry errors ◊ Changes demanded of current production schedules ◊ Phone calls not returned to customers ◊ Errors in quotes ◊ Inadequate sales training ◊ Poor delivery promises ◊ Errors in input to the master schedule ◊ Missed follow-up on problems with customers
Quality Measures for Product Design/ Design Engineering – include the following
◊ The number and type of engineering changes requested ◊ Cpk is measure of expectations v/s. achievement (Customer’s expected tolerence
v/s. manufacturing tolerance. ◊ The number of new parts specified ◊ The degree to which the design reflects the customer needs and wants (as
determined by quality function deployment (QFD) approaches ◊ The reliability of design as reflected in failure analysis ◊ Manufacturability of design
Quality Measures for accounting
◊ Mistakes made in data acquisition

Session 8 – Performance Measurement 192
Institute of Manufacturing Resource Management of India
◊ Mistakes in report preparation ◊ Usefulness of information acquired by cost-accounting function ◊ Inadequate Data Model
Quality Measures for Production/Manufacturing – include the following
◊ Standard cost of quality ◊ Number of changes to shop floor schedule due to planning errors ◊ Production quality measures (scrap, rework, test failures) ◊ Control variability of production processes ◊ Too many manual controls
Delivery Speed Measures Cycle times are useful local measures of delivery speed. Cycle time can be analyzed for each step from the time sale is made to the time product is shipped. Possible elements of overall cycle time include
◊ Product development cycle time (This will only affect new production introduction time and hence loss ofbusiness, typically in developed countries 80 % of business comes from new products developed in last three years time frame). There has to be product retirement policy in business process.
◊ Order entry cycle times ◊ Planning system times ◊ Procurement times ◊ Material receipt times ◊ Inspection times ◊ Kitting times ◊ Material movement times ◊ Queue times, Setup times, Run times ◊ Assembly times ◊ Test Times ◊ Packaging times
Delivery Reliability Measures Delivery reliability refers to percentage on time of all orders and promises made by the firm. Examples of measures include
◊ On-time delivery to customer promise ◊ Master schedule performance ◊ Production plan performance

Session 8 – Performance Measurement 193
Institute of Manufacturing Resource Management of India
◊ New product availability ◊ Final assembly performance ◊ Supplier delivery performance ◊ Expedite hours per week ◊ Number of changed delivery promises ◊ Hours of unplanned overtime ◊ Hours of unplanned sub-contract time
Flexibility Measures Two measures of flexibility include volume flexibility and product mix (variety) flexibility. Volume flexibility measures the degree to which the firm can adapt to changes in volume for a product or product line Product Mix (variety) flexibility refers to firm’s capability to adapt rapidly to changes in product range as required by customers. This can be achieved by implementation of Flexible manufacturing system on shop floor provided it is economically viable e.g. FMS, CNC Machines, CNC Turret Punch presses for sheet metal processing etc. Factors that affect the flexibility include
◊ Cycle times for acquiring and producing the product ◊ Adaptability of the process to change ◊ Quality of the product in the system ◊ Ability of the workers to respond to changes ◊ The level of capacity available ◊ The distribution times
Volume Flexibility Measures
◊ Supplier lead times ◊ Excess capacity ◊ Cross-trained workers ◊ Yields ◊ Quality of purchased parts ◊ Cash availability ◊ Current inventory position
Variety Flexibility
◊ Product cycle times ◊ New product introduction speed

Session 8 – Performance Measurement 194
Institute of Manufacturing Resource Management of India
◊ Time required to plan schedule changes ◊ Cross-trained workers ◊ Order entry time ◊ Number of unique parts per machine ◊ Speed of making engineering change
Product Design Measures For the firm competing on product design, an important measure is the number of features and options offered for each product. This information combined with volume information, leads to an index that describes the volume per end product for various product lines. Try to implement quality Function Deployment process into product design process. This process will capture directly voice of customer into product design, gives an opportunity to benchmarking for best in the class and sees product design for manufacturability. The lower the volume per end product, the higher the degree of flexibility needed to produce the product. If final product configurations are not sure from sales point of view go for modular product design and Assemble to Order manufacturing environment (ATO). This will control overall inventory investment and quicker delivery lead-time.
Other Tactical Measures
Performance Measuring Model Well-designed measurement system provides mechanism to help the firm attain its strategic goals.
Set Objectives Plan Actions
Production Plan
Perform Activities
Measure Results
MRP CRP, PAC
Compare Achievement to Objectives
Revise Objectives
Revise Plans Adjust
Performance
Feedback
Set Objectives Plan Actions
Production Plan
Perform Activities
Measure Results
MRP CRP, PAC
Compare Achievement to Objectives
Revise Objectives
Revise Plans Adjust
Performance
Feedback

Session 8 – Performance Measurement 195
Institute of Manufacturing Resource Management of India
The Measurement System Model shows that
◊ All strategies require action to execute the strategy ◊ Implementation of strategy results in achievements. ◊ Measurements provide key feedback to determine
If actions have been successful If strategies have been achieved. Strategies are revised based on feedback drawn from measurements Measurement feedback is essential to provide feedback on the strategies and actions.
MRP / CRP Performance Measurements Major investment is involved in designing and implementing MRP/CRP systems. Taking measurements assumes importance to ensure that desired returns are achieved on investments. WWhhyy MMeeaassuurree MMRRPP//CCRRPP PPeerrffoorrmmaannccee ::
◊ Major investment is involved in designing and implementing MRP/CRP systems. Taking measurements assumes importance to ensure that desired returns are achieved on investments.
◊ Extreme data accuracy is required in building basic Master Data. E.g. Resource
information on capacity, production rate etc.
◊ Accurate information on Item Master and business policy. E.g. Safety Stock/Reorder level figures for each Inventory item, batch size in production / purchase order.
Inventory Measurements
◊ Aggregate Inventory Reduction – the elimination of safety stocks for manufactured items and time-phased ordering based on need.
◊ Increased Inventory Turnover determines efficiency of use of inventory.
◊ Inventory turnover = UCost of SalesU
Average Inventory

Session 8 – Performance Measurement 196
Institute of Manufacturing Resource Management of India
◊ Reduced Storage Requirements – based on overall lower levels of aggregate inventories.
◊ Improved inventory record accuracy Customer Service Measurements
◊ Fewer stock-outs ◊ Better on-time delivery based on schedules validated by rough-cut capacity
planning (RCCP) and CRP activities ◊ Shorter delivery lead time
Productivity Measurements
◊ Less expediting ◊ On-time release of factory and supplier orders ◊ Better management of MPS ◊ Reduced number of exceptions to be handled
Capacity Performance measurements
◊ Reduced overtime ◊ Better utilization of facilities ◊ Reduced idle time ◊ Better management of queues
Supplier Performance Measurements
◊ Improved on-time delivery ◊ Better quality performance ◊ Improved supplier relations ◊ Contracting for capacity ◊ Reduction in paper work

Session 8 – Performance Measurement 197
Institute of Manufacturing Resource Management of India
Key Terminology 01) Accounting Based Measures 02) Activity Based Measures 03) Cost Driver 04) Cycle Time Measures 05) Delivery Reliability 06) Delivery Speed 07) Expediting 08) Global Measures 09) Inventory Record Accuracy 10) Inventory Turnover 11) Local Measures 12) Overtime 13) Performance Measures 14) Single Factor Productivity 15) Supplier Performance 16) Total Factor Productivity 17) Variety Flexibility 18) Volume Flexibility 19) Process Variability 20) Quality Function Deployment (QFD) 21) Total Quality Management (TQM) 22) Flexible Manufacturing System(FMS) 23) Single Minute Exchange of Die (SMED) 24) Computerized Numerical Control Machines (CNC) 25) Assemble to Order Environment (ATO) 26) Configure to Order Environment (CTO) 27) Make to Order Environment (MTO) 28) Make to Stock Environment (MTS) 29) Activity Based Management (ABM)

Session 8 – Performance Measurement 198
Institute of Manufacturing Resource Management of India
Practice Questions – Session 8 Question 1 : A company maintains 60 day inventory on an average. What is the inventory turnover ratio :
A) 6 B) 2 C) 9 D) 12
Correct Answer is: ------------------------------------------------------------------------------------------------------------ Question 2 : Which of the following is not a customer service measure :
A) Delivery Reliability B) Fewer Stock-outs C) Shorter delivery Lead Time D) High turnover of Inventory
Correct Answer is: ------------------------------------------------------------------------------------------------------------ Question 3 : Which of the following is not a productivity measure :
A) Less Expediting B) On-time release of factory and supplier order C) Amount of WIP Inventory D) Better management of MPS
Correct Answer is: ------------------------------------------------------------------------------------------------------------ Question 4 : Which of the following is NOT a variety flexibility measure :
A) Product Cycle Time B) New Product Introduction Speed C) Cross-Trained Workers D) Current Inventory Position
Correct Answer is: ------------------------------------------------------------------------------------------------------------ Question 5 : Which one of the following is NOT a say to classify measure :

Session 8 – Performance Measurement 199
Institute of Manufacturing Resource Management of India
A) Productive Vs Non-Productive B) Local Vs Global C) Financial Vs Non-financial D) Accounting based Vs Activity based
Correct Answer is: ------------------------------------------------------------------------------------------------------------ Question 6 : Which one of the following is NOT a capacity performance objective :
A) Reduce overtime B) Maximize production hours of individual machines C) Better management of queues D) Reduced idle time
Correct Answer is: ------------------------------------------------------------------------------------------------------------ Question 7 : Which of the following is NOT a good supplier performance objective :
A) Improved on-time delivery B) Better quality performance C) Increased number of suppliers for same part D) Reduction in paper work
Correct Answer is: ------------------------------------------------------------------------------------------------------------ Question 8 : The ability of the firm to quickly adapt to changes in product range as required by customers is reflected in :
A) Volume flexibility measure B) Variety flexibility measure C) Both the above D) None of the above
Correct Answer is: ------------------------------------------------------------------------------------------------------------ Question 9 : Which one of the following is NOT a volume flexibility measure :
A) Supplier lead times B) Excess Capacity C) Time required to plan schedule changes D) Cash availability
Correct Answer is:

Session 8 – Performance Measurement 200
Institute of Manufacturing Resource Management of India
------------------------------------------------------------------------------------------------------------ Question 10 : Which of the following represents quality measures for sales function :
A) Order entry errors B) Phone calls not returned to customers C) Errors in quotes D) All the above
Correct Answer is: ------------------------------------------------------------------------------------------------------------

201
Institute of Manufacturing Resource Management of India
SESSION 9
FUNDAMENTALS
OF
INVENTORY
MANAGEMENT

Session 9 – Fundamentals of Inventory Management 202
Institute of Manufacturing Resource Management of India
Inventory Fundamentals
Introduction to Inventory What is Inventory ? Inventories are materials and supplies that a business or institution carry either for sale or to provide inputs or supplies to the production process. All businesses and institutions require inventories. Often they are a substantial part of total assets. Financially, inventories are very important to manufacturing companies. On the balance sheet, they usually represent from 20% to 60% of total assets. As inventories are used, their value is converted into cash, which improves cash flow and return on investment. There is a cost of carrying inventories, which increases operating costs and decreases profits. Inventory ties up capital, requires handling, uses storage space, deteriorates, sometimes becomes obsolete, requires insurance, incurs taxes, can be stolen or gets lost. Inventory must be considered at each of the planning levels with production planning concerned with overall inventory, master planning with end items and materials requirements planning with components parts and raw material. The primary function of inventory is buffering and decoupling. It serves as a shock absorber between customer demand and the manufacturer’s production capability, between input materials required for an operation and the output of the preceding operation, between the manufacturing process and the supplier of raw materials. It essentially – decouples – demand from the immediate dependence on the source of supply. Objectives of Inventory Many different organizational units have an interest in the creation and control of inventories. These objectives often conflict and must be resolved through negotiation and consideration of the overall benefits to the company. Some of the major objectives that underlie the use of inventories are: Customer Service : Customer Service is the ability of a company to satisfy the needs of the customer. Inventory helps achieve this in several ways, including delivering in a timely manner, buffering against uncertainty, and providing variety to meet individual customer needs.

Session 9 – Fundamentals of Inventory Management 203
Institute of Manufacturing Resource Management of India
Delivering in a Timely Manner : The need to provide quick delivery of goods to users is a primary objective for holding inventories. This is especially true in terms of consumer goods. When a retailer runs short of a particular product, immediate replenishment from a distribution center is needed. The retailer is unwilling to wait for raw materials to be procured and the goods to be manufactured and then delivered over long distances. In the same way, when a distribution center needs replenishment of some products, quick delivery from an upstream distribution center or the factory is demanded. Other goods, notably industrial products, often do not call for immediate shipment. Still, the ability to deliver when promised is a service objective for every company. Competition also plays a major role in the need for customer service, because the ability to deliver in a timely fashion often determines which producer or distributor will survive. Buffering against Uncertainty : Inventories are often held because either the demand for goods or the replenishment of goods is subject to uncertainty. Anticipated demand for products is often forecasted in various ways. Forecasting is an inexact science, however, and it always includes some normal deviations that represent uncertainty. Inventories allow delivery even when demand exceeds those that were expected. Sometimes there is also uncertainty regarding supply; that is, how quickly can goods be replenished? Transportation, quality problems, excessive scrap, and supplier lead times are often factors contributing to uncertainty for which inventory can compensate. Providing Variety : Not only is there uncertainty regarding the timing of demand for goods, but there is also uncertainty regarding exactly what will be demanded. This is often the case where goods are available with various options, colors, or packaging. Inventories in a variety of configurations are therefore needed to adequately fulfill customer demands. Efficiency : There are many instances when inventories are held due to cost efficiencies in procurement and production and for balancing demand to production rate strategies. In Purchasing : In many cases, goods are purchased in larger quantities than are immediately needed in order to achieve efficiency in purchasing or transport. For example, it is less costly per unit of material to ship goods in full truck, FCL (full container load) or full railcar loads than to ship smaller quantities and break bulk lots. Quantity discounts may also be available when goods are purchased in large quantities and larger purchasing lots results in lower ordering costs per unit. When large quantities of goods are delivered in this way, the result is higher inventory levels In Production : From the production standpoint, long production runs of a single product are usually much more efficient than short runs. Things are only produced when the equipment is running. When the equipment is being set up for production of a certain part or product, it is nonproductive. The performance of factory managers is often measured by the amount of product they produce, which acts as an incentive for longer production runs. Long production runs lower the setup costs per item as setup costs, which are fixed, get absorbed over a larger number and lowers the average cost per unit. It is most
Session 9 – Fundamentals of Inventory Management 204
Institute of Manufacturing Resource Management of India
important in cases of bottleneck resources where time lost on setups leads directly to lost throughput and lost capacity. Inventory allows operations with different production rates to operate independently and more economically. Inventory is used to level production runs for catering seasonal demand products where demand is non-uniform throughout the year. Level production runs allow manufacturing to continually produce an amount equal to the average demand. This leads to several cost efficiencies, as costs of changing production levels are avoided, peak installed capacity is not required, overtime, hiring and firing costs and subcontracting costs are reduced. However, this leads to building up of anticipation inventory for peak periods. Investment : Inventories are expensive to hold. They tie up funds in a company that could be more profitable if used elsewhere. Often it is necessary to borrow money from outside sources to pay for inventories. Carrying inventory is justified when benefits exceed the costs of carrying that inventory. Therefore, it is an objective of financial and other-senior level managers to keep inventory level as low as possible. How Objectives conflict ? The objectives regarding inventories, indicated above, are often in conflict. Whether used to provide customer service or to achieve efficiencies in procurement or production, inventories conflict with management’s desire to minimize inventory investment. Long production runs by manufacturing operations tend to create large stocks of single products, whereas marketing organizations would often prefer stocks of a larger variety of products and options to serve a broad customer demand. Large inventories also take up space in factories and distribution centers that is not only expensive to acquire and maintain, but also may lead to loss and confusion as congestion prevents adequate controls and physical storage. Reasons for Carrying Inventory ◊ To meet the customer (internal & external) demand at the right time ◊ To avoid lost sales due to stock outs ◊ Economy of scale in production, purchase and logistics ◊ To protect against the rising prices of the material in the market Aggregate Vs Item Level Inventory Aggregate inventory management deals with managing inventories according to their classification (raw material, WIP etc.) and the function they perform rather than at the individual item level. It is financially oriented and is concerned with the costs and

Session 9 – Fundamentals of Inventory Management 205
Institute of Manufacturing Resource Management of India
benefits of carrying the different classifications of inventories. Aggregate inventory management includes: ◊ Flow and kinds of inventory needed ◊ Supply and demand patterns ◊ Functions that inventories perform ◊ Objectives of inventory management ◊ Costs associated with inventories Inventory is not only managed at the aggregate level but also at the item level. The management must establish decision rules for the inventory items so that people responsible for inventory control can do their job effectively. Few of these rules are: ◊ Which individual inventory items are most important? ◊ How individual items are to be controlled? ◊ How much to order at one time? ◊ When to place an order?
Classification of Inventory Analysis of the entire supply chain will indicate the various types of inventory. Inventory can be classified by categories and by functions. We will discuss both the classifications here.
By Categories Raw Material The acquisition of raw materials is a major factor in a company’s ability to manufacture goods. Although raw materials are often thought of as natural materials extracted directly from the earth and seas, such as metal ores, trees, or petroleum, the term is used here to represent any material inputs acquired by an individual company from the outside for its use in a manufacturing process. This includes manufactured products from other companies, as well as natural resources. Raw materials are often acquired in quantities that are sufficient to last for some period of time. This is done most often because of economics of purchase and transportation. The resulting stock of raw material on hand, which are available for use, constitute inventory. Raw materials are items that have not entered the production process

Session 9 – Fundamentals of Inventory Management 206
Institute of Manufacturing Resource Management of India
Work-in-Process Raw materials are withdrawn from an inventory stock in order to have work performed on them by various classes of labor and equipment in the production transformation process. While materials are in the manufacturing process in various stages of completion, they are referred to as work-in-process inventory. The amount of work in process differs greatly from company to company, depending on the particular production process being employed, but, generally, all manufacturing firms have some inventory that fits this classification. Semi-Finished Assemblies Often, in manufacturing processes, raw materials are withdrawn and then processed, fabricated, or assembled into intermediate parts or subassemblies, which may be restocked temporarily until withdrawn for use later in the production process. These semi-finished assemblies differ from raw materials as they are not acquired directly from outside suppliers, and they differ from finished goods, as they are not in a completed form. Finished Goods Finished goods inventories are products ready to be delivered to distribution centers or ultimate users. At times, manufacturing companies themselves may keep a stock of finished goods at or near factory locations ready to be delivered when requested. Some finished goods may be held at various distribution centers where they are stored as inventory before being delivered to additional holding points in the distribution chain, such as wholesale or retail stores. Furthermore, some finished goods are always in transit from one inventory stocking point to another, until delivered to a final user. The chain of distribution indicates that many different kinds of companies have concerns about inventory. Distribution points, such as warehouse or stores, may be owned and operated by the company of manufacture or may be independently owned and operated. Maintenance, Repair and Operating Supplies (MRO) The familiar acronym MRO stands for maintenance, repair, and operating supplies. All companies hold inventories of these types of items, not just manufacturers and distribution centers. These types of goods are often low cost, but numerous, and include office and janitorial supplies, items used in production that do not become part of the product like hand tools, lubricants, spare parts, or even food for company-run cafeterias. It is obvious, therefore, that all organizations-whether public or private, profit or nonprofit-have some inventory concerns.
Session 9 – Fundamentals of Inventory Management 207
Institute of Manufacturing Resource Management of India
By Functions Transit / Pipeline Sometimes called transportation stock, pipeline inventories represent material that is in transit, such as from a plant to a distribution center or a customer. Pipeline stocks are most prevalent with distribution inventories of finished goods. Pipeline stocks also exist for raw materials, but keep in mind that the raw materials for one organization represent the finished products of the company producing them and, therefore, are a form of distribution inventory to the producer. Transit inventory does not depend on the shipment size but on the transit time and the annual demand. Cycle / Lot Size Cycle stock gets its name from the cyclic reordering practice associated with most goods. It is sometimes referred to as lot-size stock and results from ordering on quantities that are in excess of current needs. This stock gets depleted gradually upon serving customer orders and replenished cyclically when supplier orders are received. Cycle stock applies equally to finished goods, work-in-process, raw materials, and MRO inventories. Cycle stock is used to take advantage of quantity discounts, reduce shipping, clerical and setup costs and where supply rate is lower than the demand rate. Anticipation The term anticipation stock is usually applied to inventory buildups that are produced and accumulated based on some strategy as preparing for peak season, planned sales promotional campaign, or to help level the production rate to reduce the production rate changeover costs. Seasonal product buildup is one of the best examples of anticipation stock. Inventory buildup due to a planned shutdown of a manufacturing plant for changeover or vacation is another example. Safety Stocks Safety stock, also referred to as buffer stock, is used to protect against the possibility of stock-outs when demand or supplies are subject to uncertainty or fluctuation. It constitutes extra inventory held just in case anticipated demands exceed those that were forecast or in case a replenishment order is tardy or in a quantity less than requested.

Session 9 – Fundamentals of Inventory Management 208
Institute of Manufacturing Resource Management of India
Hedging Stocks Hedging stock is very similar, conceptually, to anticipation stock. The term is borrowed from financial markets to denote the higher degree of risk involved. Some even call it gambling stock. Hedging stock is a form of inventory buildup that is done in anticipation of some event that may not actually come about, which differentiates it from anticipation stock. Justification for hedging stocks may be based on such things as impending labor strikes in a supplier industry, predicted sharp price increases for a raw material, unsettled governments of countries where foreign suppliers are located, or items that have very long, or variable, lead times. Decoupling Supply and Demand The term, decoupling stock, is sometimes used instead of safety stock to represent a separation, or buffer, of product demand from product supply. Most often, however, it is used to denote work-in-process inventories that act as buffers between successive work operations in a factory, especially in job-shop production. As factory work orders pass from work center to work center, queues of orders are often planned for each work center to absorb variations in work load due to mix of parts or products being worked on. These queues of work separate the operations so that each work center can produce somewhat independently from other work centers. The objective is to prevent idle time in the factory.
Costs Associated with Inventory Agenda for this section is the various cost elements involved for inventory management. These cost elements are: ◊ Item cost ◊ Carrying costs ◊ Ordering costs ◊ Stock-out costs ◊ Capacity-related costs
Item Costs The price paid for a purchased item consists of the cost of the item and any other direct costs associated in getting the item into the plant. These could include such things as transportation, custom duties, and insurance. The inclusive cost is often called the landed

Session 9 – Fundamentals of Inventory Management 209
Institute of Manufacturing Resource Management of India
price. For an item manufactured in-house, the cost elements are direct material, direct labor, and factory overhead. These costs can normally be obtained from either purchasing or accounting.
Carrying Costs There are several kinds of costs associated with carrying inventory; these costs include all expenses incurred by the firm because of the volume of inventory carried. Inventory carrying cost increases as inventory increases. Inventory carrying cost is usually expressed as a percentage of the cost of the inventory item being ordered, which represents the cost to carry that item in inventory for one year. Various costs associated with carrying inventory: Storage costs : Storing inventory requires various resources like equipment, space and workers. As inventory goes up so do these costs. Transporting and handling Costs Risk Costs : Risk costs comprises of ◊ Obsolescence ◊ Damage ◊ Pilferage ◊ Deterioration These costs vary from industry to industry and even from product to product. Opportunity Cost (Capital Cost) : These are the rate of returns possible from the alternative investments that could be made with the money tied up in the inventory. The average expected return from feasible alternative investment is used as an estimate of opportunity costs Insurance and taxes
Ordering Costs The costs associated with placing orders to replenish inventory stocks differ between orders placed by purchasing on outside suppliers and orders placed on a factory for production of the needed product. The cost of placing an order does not depend upon the quantity ordered. However, the annual cost of ordering depends upon the number of

Session 9 – Fundamentals of Inventory Management 210
Institute of Manufacturing Resource Management of India
orders placed in a year. It can be reduced by ordering more at a time, resulting in placing of fewer orders. However, this increases the inventory and annual cost of carrying inventory. Purchase order Costs : ◊ Supplier selection, follow-up, expediting and other contacts ◊ Account payables and collection ◊ Receiving, inspecting, and handling ◊ Preparation and handling of an order / authorization document Production Order Costs : ◊ Lost capacity cost due to setup of equipment or assembly-line changeover ◊ Preparation of production paperwork ◊ Tracking and reporting work orders in the plant ◊ Scrap that results from start-up after a new setup
Stock Out Costs If demand during the lead-time exceeds forecast, we can expect a stock-out. A stock-out can potentially be expensive because of back-order costs, lost sales, and possibly lost customers. There is possibility of additional losses due to future orders being placed with competitors. Repeated inability to deliver in competitive manner can generate a poor delivery reputation, loss of goodwill, and loss of sales. Stock-outs can be reduced by carrying extra inventory to protect against those times when the demand during lead-time is greater than forecast.
Capacity Related Costs When output level keeps changing (if production strategy is to chase the demand), there are costs for overtime, hiring, training, extra shifts and layoffs. These costs can be avoided by leveling production i.e. changing the production strategy to level (producing items in slack period for sale in peak period). However, this will result in extra inventory in slack period. When Capacity is increased, some or all of the following increases costs:
◊ Hiring and training direct laborers ◊ Hiring and training supervisors ◊ Adding service personnel in receiving, the warehouse and so on

Session 9 – Fundamentals of Inventory Management 211
Institute of Manufacturing Resource Management of India
◊ Learning curve experiences ◊ Purchasing equipments
A substantial decrease in capacity results in costs due to:
◊ Layoffs (termination, unemployment compensation) ◊ Fixed overhead spread across a smaller volume ◊ Temporary inefficiency due to change in production rate and reassignment of
personnel ◊ Low morale
Cost Balancing Whether inventory is an asset used to accomplish the objective of an organization or a liability depends on its management; both conditions may exist in the same firm at the same time. There are benefits as well as costs to having inventory. The problem is to balance the cost of carrying inventory with the following: Customer service. Higher inventory levels result in higher customer service levels. Lower levels of inventory can cause potential stock-out, backorders, lost sales and lost customers. Operating efficiency. Higher inventory levels allow leveling production, longer production runs and reduced set-up time. Inventory lets manufacturing purchase in larger quantities availing volume discounts. Cost of placing orders. Ordering smaller quantities each time an order is placed can reduce inventory. However, this increases the annual ordering costs. Transportation and handling cost. The more often goods have to be moved and smaller the quantities moved, the greater the transportation and materials handling cost. However, moving larger lots leads to higher inventory.

Session 9 – Fundamentals of Inventory Management 212
Institute of Manufacturing Resource Management of India
Key Terminology 01) Anticipation Inventories 02) Buffer 03) Capacity related costs 04) Carrying Cost 05) Cost of goods sold 06) Customer Service 07) Cycle stock 08) Decoupling Inventory 09) Distribution Inventory 10) Finished goods 11) Fluctuation inventory 12) Hedge Inventory 13) In transit Inventory 14) Inventory 15) Item Cost 16) Maintenance, repair and operating supplies (MRO) 17) Materials management 18) Physical inventory 19) Pipeline inventory 20) Raw material 21) Safety stock 22) Service parts 23) Stockout costs 24) Storage cost 25) Transportation inventory 26) Work in Process (WIP) Inventory

Session 9 – Fundamentals of Inventory Management 213
Institute of Manufacturing Resource Management of India
Practice Questions – Session 9 Question 1 : Each of the following is an objective regarding inventories except
A) Providing Customer Service B) Providing Efficiencies in Production C) Keeping investment as low as possible D) Keeping available space filled
Correct Answer is: ------------------------------------------------------------------------------------------------------------ Question 2 : ABC Classification of inventory is a means to categorize materials in terms of their
A) Function B) Type C) Annual Usage Value D) Storage requirements
Correct Answer is: ------------------------------------------------------------------------------------------------------------ Question 3 : Safety stocks would most likely be necessary for which of the following types of inventory
A) Finished Goods B) Work – in - Process C) Semi – finished Assemblies D) Raw materials
Correct Answer is: ------------------------------------------------------------------------------------------------------------ Question 4 : Inventory that results from decisions regarding the quantity of goods to be produced or manufactured in each cycle may be called :
A) Safety Stock B) Lot – Size Stock C) Anticipation Stock D) Pipeline Stock
Correct Answer is: ------------------------------------------------------------------------------------------------------------

Session 9 – Fundamentals of Inventory Management 214
Institute of Manufacturing Resource Management of India
Question 5 : Which of the following is considered “Ordering Cost”:
A) Production Control Cost B) Capital Cost C) Risk Cost D) Obsolescence Cost
Correct Answer is: ------------------------------------------------------------------------------------------------------------ Question 6 : Each of the following contribute to item cost except :
A) Direct Material Cost B) Direct Labor Cost C) Overheads D) Storage Cost
Correct Answer is: ------------------------------------------------------------------------------------------------------------ Question 7 : The cost of placing an order depends upon the quantity ordered :
A) True B) False
Correct Answer is: ------------------------------------------------------------------------------------------------------------ Question 8 : The most significant consequence of stock out is :
A) Back Order B) Financial Penalty C) Lost Customer D) Impact on the performance of Sales Executive
Correct Answer is: ------------------------------------------------------------------------------------------------------------ Question 9 : Which of the following are costs of “Carrying” inventory:
A) Capital costs and production control costs B) Capital costs and storage costs C) Production control costs and purchase costs D) Storage costs and purchasing costs
Correct Answer is: ------------------------------------------------------------------------------------------------------------

Session 9 – Fundamentals of Inventory Management 215
Institute of Manufacturing Resource Management of India
Question 10 : The problem in managing inventory is to balance the inventory investment with which of the following :
A) Customer service, costs of changing production levels and costs of placing orders B) Costs of changing production levels, costs of placing orders and material
handling costs C) Costs of placing orders, customer service and material handling costs D) Customer service, costs of changing production levels and material
handling costs Correct Answer is: ------------------------------------------------------------------------------------------------------------

216
Institute of Manufacturing Resource Management of India
SESSION 10
INVENTORY
MANAGEMENT

Session 10 – Inventory Management 217
Institute of Manufacturing Resource Management of India
Inventory Analysis
ABC Analysis ABC analysis is a very useful and relatively simple method for classifying and analysing inventory. Control of inventory is exercised by controlling individual items called Stock-Keeping Units (SKUs). Fours factors needs to considered in controlling inventory: ◊ What is the importance of the inventory item? ◊ How to control them? ◊ How much should be ordered at one time? ◊ When should an order be placed? ABC analysis addresses first two of the above four concerns by determining the importance of items and thus allowing different levels of control based on the relative importance of items. Organizations normally have a large number of SKUs in stock. To have better control at a reasonable cost, it is helpful to classify the items according to their importance. Usually this is based on annual dollar usage, but other factors affecting the importance of an item and may be criteria are: ◊ Unit Cost ◊ Lead Time ◊ Annual Usage Quantity ◊ Cost of a Stock-out ◊ Storage requirements for an item ◊ Scarcity of resources, raw materials ◊ Shelf life, possibility of pilferage This method of analysis is based on Pareto’s law. As applied to inventories, a relationship is found between the percentage of items and the percentage of annual dollar usage: A : About 20% of the items account for about 80% of the dollar usage B : About 30% of the items account for about 15% of the dollar usage C : About 50% of the items account for about 5% of the dollar usage Uses of ABC Analysis There are a number of ways in which the ABC analysis may be used to help manage inventories. The use of the classification scheme centers on the concept of degree of control. Few common uses of ABC classifications are:

Session 10 – Inventory Management 218
Institute of Manufacturing Resource Management of India
◊ Cycle-counting frequency ◊ Engineering priorities ◊ Procurement priorities ◊ Security ◊ Replenishment systems ◊ Investment decisions Method of calculation The ABC analysis calculations are quite simple, if the data are available and in a form a computer can process that. Procedure for performing ABC analysis based on annual dollar usage is as follows: Inputs required: ◊ Annual usage in units for each item ◊ Unit cost of each item Calculate annual dollar usage for each item by multiplying Annual usage in units by the unit cost.
◊ Add the total annual usages of all items to determine the aggregate annual dollar usage.
◊ Divide the annual dollar usage of each item by the aggregate annual usage to
obtain percentage of total usage by each item.
◊ Rank items by percentage of total usage in descending order (from highest to lowest).
◊ Calculate the cumulative percentage of total usage from top to bottom of the list.
◊ Group the items into A, B and C groups based on cumulative percentage and the
defined rules. Control Based on ABC Classification ABC classification helps in instituting various levels of controls on inventory. A control may be the following.
Session 10 – Inventory Management 219
Institute of Manufacturing Resource Management of India
‘A’ items: High priority: Tighter control, complete accurate records, regular and frequent reviews, close follow-ups and expediting to reduce lead times. Allocate maximum resources and efforts for tightest control. ‘B’ items: Medium priority: Normal controls, good records and normal processing with regular attention. ‘C’ items: Lowest priority: Simple and basic controls, Order large quantities, have plenty and carry safety stock.
Obsolescence of Inventory Inventory obsolescence is one the biggest concern areas to the management. It is important for an organization to be able to identify the obsolete inventory and take actions to dispose it off. It has been observed, that it almost always results in an inventory write-off on the organization’s income statement, which, as a direct subtraction from income, reduces profit. Reasons of Obsolescence Various reasons for inventory obsolescence are: ◊ Engineering Changes ◊ Spoilage ◊ Technical Obsolescence ◊ Defects Detecting Obsolescence To detect obsolete inventories, a report of all the items with last used date is required. If data is available on computer, this report can be generated very easily. Items that have not been used for a long time (cutoff time can be fixed) need to be analyzed. There will often be cases where there are legitimate reasons for non-usage, and the need for the inventory might still be valid. Disposal of Obsolete Inventory Most commonly used tactics for disposal of obsolete inventory in the industries are: ◊ Alternate use ◊ Return back to the vendor

Session 10 – Inventory Management 220
Institute of Manufacturing Resource Management of India
◊ Sale in the market through various channels As a last resort (when no other tactics work) organization may scrap the inventory.
Inventory Accounting and Control
Accounting Principles Tracking of Inventory Inventory accuracy is always a big concern for any organization. The processes discussed here are concerned with determining the quantity of inventory in units (unit may include multiple e.g. cases, drums etc.). The dollar data on financial statements are determined by multiplying the units’ information by the cost information, which is subsequently described. Perpetual Inventory Systems : In a perpetual inventory system, records are kept of each transaction, receipt or withdrawal from inventory, and the new on-hand balance is recorded. This indicates, at all times, the up-to-date quantity of an item that is in stock and may also indicate inventory on order and allocated. The accuracy of the records depend upon the speed with which the transactions are recorded and accuracy of the input. Such speed and minimization of human error may be possible only through computerized systems. The computer can also be programmed to flash an exception message when the stock balance is at or below the order point. Manufacturing companies and wholesale distributors use this system mainly tracking inventory of raw materials and finished goods. Periodic Inventory Systems : A periodic system does not attempt to keep track of each issue and disbursement of items. Instead, a review is made in regular cycles, which might be daily, weekly, or monthly, depending on the nature of the goods, to determine the inventory level and signal the need for replenishment or other action. Periodic review systems need larger safety stock than continuous review systems, given same variations in demand, as safety stock must cover variations in demand during the replenishment period as well as during the lead-time. The review period is fixed and the order quantity is allowed to vary. Periodic systems are often used for MRO supply items or for other small, inexpensive parts.

Session 10 – Inventory Management 221
Institute of Manufacturing Resource Management of India
Visual Review Systems : A visual review system is similar to a periodic system in that no perpetual on-hand balances are recorded. However, it is generally a little less formal than a periodic system, with reliance on visual recognition by users for reorder or other actions. The two-bin system of inventory storage is a common method of operating this system. Visual reviews are often used to manage office supplies, common hardware items and other small, inexpensive MRO supplies. Four-Wall Inventory Systems : Four-wall systems (also known as wall-to-wall systems) record inventory receipts when they first arrive at a plant or warehouse. However, they are not subtracted from inventory until they leave the location in the form of deliverable finished goods. This technique is often used when materials are received, converted into deliverable form, and shipped within a very short period of time. They may not be held in a storeroom at all. Determine the Cost of Inventory It would seem that the cost of an inventory item is a very straightforward data element that does not present any kind of problem. This is seldom the case, however, because the total number of units in an inventory may be the result of several purchases, or factory orders that were procured or built at different costs. Seldom is attention given to actually picking stock items in a particular order, except where traceability or shelf life may be factor. Still, the values assumed for items withdrawn from inventory must be valued for financial reporting and for certain control functions, such as ABC analysis. The inventory costing procedure will affect the book value of inventory investment, profit, taxes and cash flow. First In, First Out (FIFO) : The FIFO method assumes that items are issued from stock in the same sequence as they are received. Means the oldest items are issued first and so on. In a period of changing costs, this would tend to keep the total inventory value on the balance sheet close to the current market value but would charge cost of sales at the least recent cost values. Thus, during an inflationary period it will result in lower cost of goods sold and decreased cash flow with opposite results during a deflationary period. Last In, First Out (LIFO) : The LIFO method assumes that the most recent arrivals in inventory are the first ones being issued. Essentially, this method assigns cost of sales based on the most recent costs incurred. During an inflationary period this method results in higher cost of goods sold and increased cash flow. This would tend to understate the total inventory value on the balance sheet, often substantially, as time goes by. However, it would charge cost of sales with values close to the current market value Opposite results are obtained during a deflationary period. Weighted Average Cost Systems : The weighted average cost method calculates the value of items in inventory on the basis of their weighted average cost. The cost of items

Session 10 – Inventory Management 222
Institute of Manufacturing Resource Management of India
consumed by production equals the weighted average unit cost of inventory. This method smooths the effect of inflation and deflation on the valuation of inventory and the costs of goods sold. Often, a weighted average is used to take into consideration the quantities that were received into inventory from various procurement orders or production runs. Standard Cost Systems : With standard cost systems, a single value is selected for an inventory item that is reasonable, often based on an average of historical or anticipated costs. The difference between the actual costs incurred and the standard costs is then reported in the form of a variance from the standard. This technique reports the inventory assets and cost of sales in consistent terms. Replacement Cost Systems : This technique attempts to assign a cost to inventory items, based on the next price incurred. This method might be used to get a more realistic inventory value when parts are held for a long time without any usage, such as certain maintenance parts. Actual Cost Systems : To be realistic about cost requires that some form of a lot control technique be in place so that materials withdrawn from inventory can be traced directly to a specific purchase or production run. This method is not used very often except for certain government contracts, which might require it, or where lot traceability is required for other reasons, such as warranty or safety. Value-Added Costing Systems : Some special problems arise when semi-finished materials are stored in inventory. The attempt to reflect labor and overhead costs is called value-added costing and is usually reflected in inventory value in the form of a standard cost.
Physical Inventory Control The inventory held by a company is usually stored in one or more storerooms, or other locations, referred to as stocking points. There are a number of issues related to the physical storage of materials, including items’ identification, location, various storekeeping controls, and verification of inventory balances by physical counts. Each of these topics is discussed in this section. Identification of Items Item identification seems a somewhat trivial subject. For small organizations where the numbers of items are less, inventory can be managed without any formal item identification but formal item identification becomes a must where the numbers of items are high.

Session 10 – Inventory Management 223
Institute of Manufacturing Resource Management of India
The problem is that many items held in inventory look the same, yet are slightly different. It is feasible to simply describe such materials in a consistent and error-free manner without assigning them unique identification numbers. The situation is sometimes worsened by the desire of different units of an organization to give separate identification numbers to the same items. This might include engineering item numbers, item numbers in production, and item numbers used by marketing when creating catalogs and pricing books. Principles of Item Identification
◊ Item codes should be unique ◊ Only one set of item codes should be used within organization ◊ Responsibility for item code creation should be assigned ◊ Part numbers no longer used should not be reassigned ◊ Item codes should be as short as possible ◊ Item codes should be kept uniform ◊ Avoid confusing characters ◊ Allow room for expansion ◊ Provide for check digits whenever possible
Stock Keeping Principles There are certain principles regarding the storage of materials that can greatly enhance the ability of the inventory system to provide goods for those who need them.
◊ Security ◊ Transaction recording ◊ Authorization control ◊ Automation where possible
Accuracy of Inventory Records With perpetual inventory systems, records are kept that reflect the balance of inventory of items on hand at each stock location. It is easy for physical balances and record balances to differ over a period of time, usually due to human failures regarding security, transaction processing, or locating inventory. Because various planning and inventory replenishment systems rely on record data, most often kept on a computer, it is essential that record balances are verified by regular physical counts. The Cost of Inaccurate Records
◊ Lost sales ◊ Shortages ◊ Excess Inventory

Session 10 – Inventory Management 224
Institute of Manufacturing Resource Management of India
◊ Missed schedules ◊ Low productivity ◊ Late delivery ◊ Excessive expediting ◊ Excess freight costs ◊ High inventory levels ◊ High level of obsolescence
Methods of Counting Periodic physical counting: are most often performed annually, where all items are counted in a short period of time, often requires shutdown of operations and the use of many diverse personnel. This method does not support day-to-day inventory record accuracy. Its primary purpose is to validate the aggregate inventory values used for financial accounting statements Cycle counting: occurs continuously, with a few items, with specified criteria, counted each day by experienced and trained employees. Identification of the trigger for physical-count activity can be based on one of the following rules:
◊ ABC classification ◊ When a reorder is indicated ◊ When a replenishment lot is received ◊ When the record indicates a zero balance ◊ When a record balance becomes negative ◊ Every specified number of transactions
Fixing Accuracy Targets Goal of any organization is to achieve 100% inventory accuracy. Practically achieving 100% accuracy target is not easy and can only be achieved over a period of time through cycle counting, where the causes of errors are discovered and corrected. As a practical matter, goals somewhat less that 100% are targeted and might be established based on ABC classification of the inventory items.
Replenishment Systems In this section we will discuss some of the inventory replenishment systems. Replenishment systems can be quantity based or time based.

Session 10 – Inventory Management 225
Institute of Manufacturing Resource Management of India
Quantity Based Reorder Point Replenishment Reorder point is a quantity based replenishment system and is widely used for consumer goods inventories in stores. The reorder point method assumes that a perpetual method is employed to keep track of inventory so that on-hand balances are always known to the control system. Lets assume the demand is as defined in the graph below (fairly constant demand assumed for ease of understanding). Demand is plotted against the time. Now lets look at the inventory graph (shown below) for the above demand. This graph plots the quantity in inventory of the same item during the same period of time. As units are withdrawn from inventory to meet the demands, the inventory declines gradually until it becomes zero (out of stock). However, if replenishment orders are placed at judicious times, then an inventory receipt of same predetermined quantity should come at just about the time inventory would be depleted. This inventory graph, referred as saw-toothed graph, is a classic model of inventory behavior when usage is uniform and relatively continuous.
Figure A
T ime
Time
Inve
nto
ry
Reorder pointP
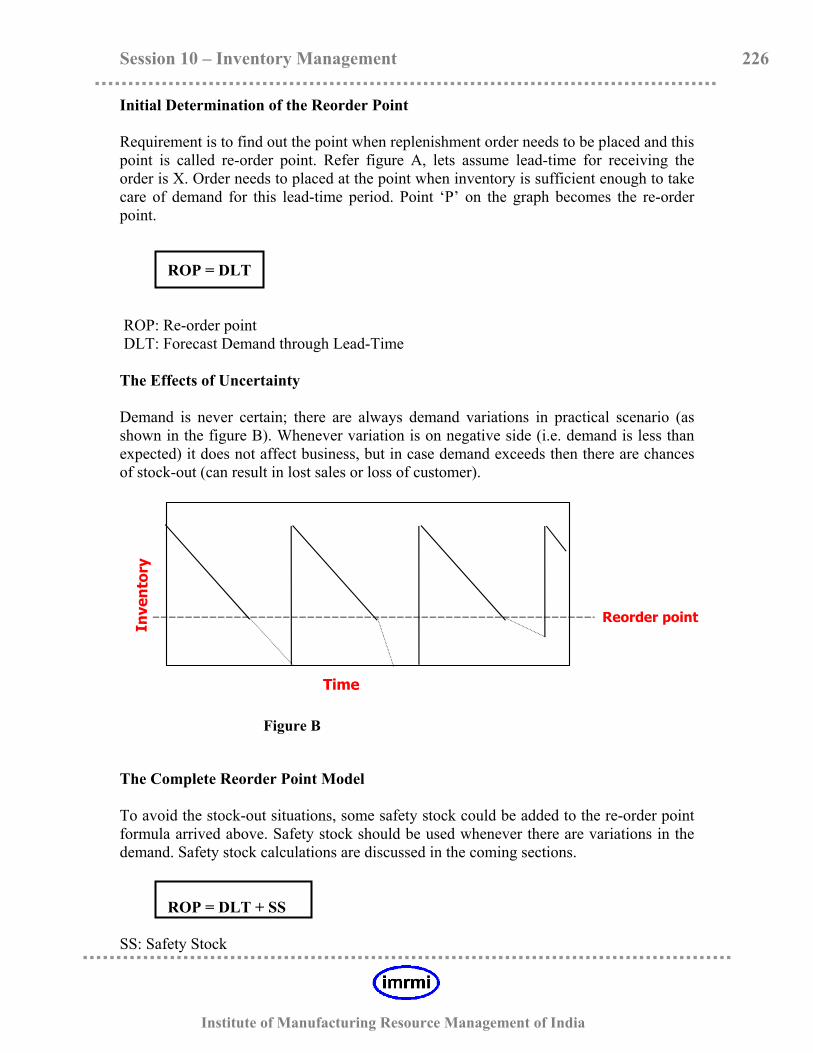
Session 10 – Inventory Management 226
Institute of Manufacturing Resource Management of India
Initial Determination of the Reorder Point Requirement is to find out the point when replenishment order needs to be placed and this point is called re-order point. Refer figure A, lets assume lead-time for receiving the order is X. Order needs to placed at the point when inventory is sufficient enough to take care of demand for this lead-time period. Point ‘P’ on the graph becomes the re-order point.
ROP = DLT ROP: Re-order point DLT: Forecast Demand through Lead-Time The Effects of Uncertainty Demand is never certain; there are always demand variations in practical scenario (as shown in the figure B). Whenever variation is on negative side (i.e. demand is less than expected) it does not affect business, but in case demand exceeds then there are chances of stock-out (can result in lost sales or loss of customer).
Figure B
The Complete Reorder Point Model To avoid the stock-out situations, some safety stock could be added to the re-order point formula arrived above. Safety stock should be used whenever there are variations in the demand. Safety stock calculations are discussed in the coming sections. ROP = DLT + SS SS: Safety Stock
Time
Inve
nto
ry
Reorder point

Session 10 – Inventory Management 227
Institute of Manufacturing Resource Management of India
Calculation Rule: For each item, when the quantity of the inventory on hand drops to, or below, the reorder point, place a replenishment order.
Time Based Time Phased Order Point Time phasing is a technique that has been borrowed from Material Requirement Planning (MRP) as a means to determine when replenishment orders must be placed to ensure a continuous supply of goods. The prerequisites for this system include a forecast of requirements, lead-time of the item and order quantity.
The Time-phased Grid
PERIODS Safety Stock = 20 Order Quantity = 200 Lead Time = 3 1 2 3 4 5 6 7 8 Forecast Demand 100 100 100 100 100 100 100 100 Scheduled Receipts 200 Projected Available 120 20 Planned Receipts Planned Order Releases
Periods: Periods represent the time periods. Assuming weekly planning (time bucket of 1 week), 1,2,3 will represent week1, 2 and 3. Forecast Demand: represents the forecast of demands in future time periods. Scheduled Receipts: represents the expected receipts against the open orders. These inputs i.e. forecast demand and scheduled receipt are taken from the forecast data and planning data respectively. Projected Available, Planned receipts and Planned Order Releases are calculated based on these two as defined above and other inventory planning data (Safety stock, lead time, order quantity etc.). Projected Available for Period n = Projected Available for Period (n-1) + Scheduled Receipts for Period n – Forecast Demand for Period n

Session 10 – Inventory Management 228
Institute of Manufacturing Resource Management of India
When the projected available inventory becomes negative, or falls below the safety stock level, this signals the need for a replenishment receipt in that period. The order quantity or order quantity rule is used to determine the amount that should be received and this amount is recorded in the Planned Receipt row. Depending upon the lead- time, same quantity is updated in the row Planned Order Releases. To calculate final projected available now planned receipt is also added in the above formula. Projected Available for Period n = Projected Available for Period (n-1) + Scheduled Receipts for Period n + Planned Receipts for Period n – Forecast Demand for Period n Characteristics of TPOP System :
◊ Forces the use of predicted future requirements, rather than historical data, for inventory order actions.
◊ Provides future visibility of when purchasing or production orders need to be issued.
◊ Graphical representation emphasizes timing, in addition to quantity information. ◊ Results are identical to a calculated reorder point, when based on forecast needs. ◊ Seasonality, trends, and lumpy demand forecast are clearly evident. ◊ Storing data for time-phased formats requires more computer storage capacity. ◊ The time-phased calculations are more difficult to perform manually as opposed
to using simple formulas.
Determination of Order Quantity
Order Quantity Considerations In general, when products are demanded on a regular basis (i.e. daily), the logistical problems of getting goods from source of supply to inventory requires that enough goods be ordered in each order cycle to last for some reasonable period of time. The more quantity of goods that are ordered each time, the longer they will last. This is true whether the goods are purchased for resale or manufactured to supply a finished goods warehouse or distribution center.
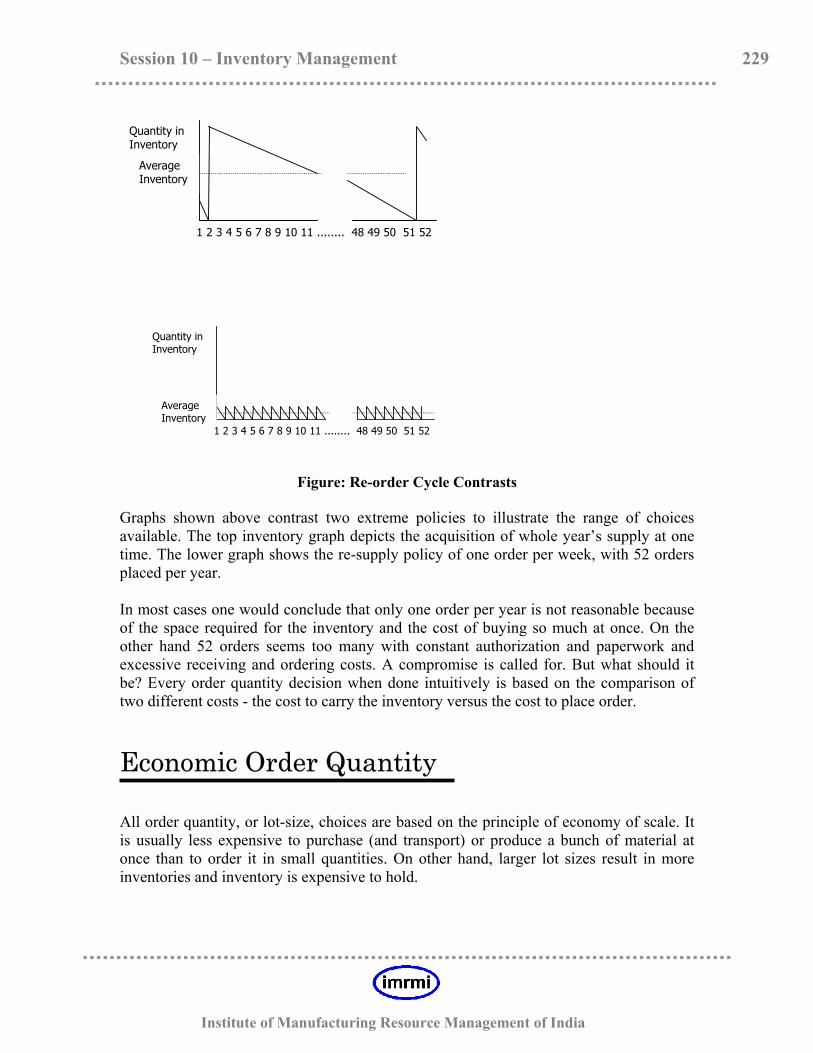
Session 10 – Inventory Management 229
Institute of Manufacturing Resource Management of India
Figure: Re-order Cycle Contrasts Graphs shown above contrast two extreme policies to illustrate the range of choices available. The top inventory graph depicts the acquisition of whole year’s supply at one time. The lower graph shows the re-supply policy of one order per week, with 52 orders placed per year. In most cases one would conclude that only one order per year is not reasonable because of the space required for the inventory and the cost of buying so much at once. On the other hand 52 orders seems too many with constant authorization and paperwork and excessive receiving and ordering costs. A compromise is called for. But what should it be? Every order quantity decision when done intuitively is based on the comparison of two different costs - the cost to carry the inventory versus the cost to place order.
Economic Order Quantity All order quantity, or lot-size, choices are based on the principle of economy of scale. It is usually less expensive to purchase (and transport) or produce a bunch of material at once than to order it in small quantities. On other hand, larger lot sizes result in more inventories and inventory is expensive to hold.
Quantity inInventory
AverageInventory
1 2 3 4 5 6 7 8 9 10 11 ........ 48 49 50 51 52
Quantity inInventory
AverageInventory
1 2 3 4 5 6 7 8 9 10 11 ........ 48 49 50 51 52

Session 10 – Inventory Management 230
Institute of Manufacturing Resource Management of India
Carrying, Ordering and Total Cost Costs associated with carrying inventory :
◊ Storage facility costs ◊ Counting, transporting and handling ◊ Risk of obsolescence, risk of pilferage ◊ Insurance and taxes ◊ Opportunity cost (alternate investments)
Inventory carrying cost denotes the costs related to holding items in inventory and is usually expressed as percentage of cost of inventory item. Cost associated with placing order : Following are contributors to the cost of placing and processing purchase orders.
◊ Supplier selection, follow-up, and other contacts ◊ Accounts payable and collection ◊ Receiving, inspecting and handling ◊ Preparations and document handling
Following are contributors to the cost of placing production orders.
◊ Setup of equipment or assembly line changeover ◊ Preparation of production order paperwork ◊ Tracking and reporting work orders in the plant. ◊ Scrap due to new setup
Order quantity cost Comparison : If you order in small quantities, cost of carrying inventory will be minimized. On other hand large lot sizes will have fewer orders/setups, hence cost on attending orders/setups will minimize. These comparisons are illustrated in the graph below.

Session 10 – Inventory Management 231
Institute of Manufacturing Resource Management of India
Theoretically, the best quantity should be the one that corresponds to the intersection of two curves. This point on horizontal axis is called economic order quantity (EOQ) where total cost is minimum. It represents the theoretical optimum amount to order in each cycle. Deriving the EOQ Following are the formulas for determining each cost based on the assumptions that cost elements are known and demands are level and continuous. Carrying cost = average inventory x cost of carrying one unit for one year
Carrying cost = order quantity x cost of item x annual cost to carry
2 CC = Q x C x i 2
Order Cost = Number of orders x costs per order
Order Cost = Annual usage x cost per order Order Quantity OC = A x S Q Total Cost (TC) = Q x C x i + A x S 2 Q
C O S T
Total Cost
Carrying
Order Cost
Order

Session 10 – Inventory Management 232
Institute of Manufacturing Resource Management of India
Two alternative methods for deriving EOQ formula are indicated below. Algebraic method is solved for quantity where cost set equal to one another. Calculus method is solved by calculating quantity for point at which derivative of total cost formula is zero. Algebraic derivation : Q x C x i = A x S 2 Q
Q x Q x C x i = A x S 2
QP
2 Px C x i = 2 x A x S
QP
2 P= 2 x A x S
C x i EOQ = √ 2AS/CI Calculus derivation : dx TC = C x i + (A x S) P
P= 0
dy 2 Q²
C I = A S 2 Q²P
Q2 C i = A S 2
Q2 = 2AS / C I
EOQ = √ 2AS/CI Limitations of EOQ
◊ Annual usage is assumed to be level and continuous ◊ Underlying costs are assumed to be accurate ◊ Replenishments assumed to be instantaneous ◊ Costs expressed as total/average, rather than marginal ◊ Single-item replenishment is assumed
Although EOQ formula is subject to a number of limitations, the formula is useful in identifying relationships between the factors it includes.

Session 10 – Inventory Management 233
Institute of Manufacturing Resource Management of India
Quantity discounts for purchased items may be available. This complicates the order quantity decision significantly if the normal EOQ calculation does not meet or exceed the price-break quantity. In effect, the square root formula must be bypassed, and a modified total cost formula must be evaluated for each price-break.
Methods for Order Quantity determination When demands are discontinuous, which usually is the case, time-phased order point methods are used so that different requirements in future time periods may be observed and evaluated properly. Different order quantity determination techniques are discussed in following sections. They are classified into two basic categories – demand based methods and discrete methods. Demand Based Methods Fixed order quantity : This method may be determined very informally, such as a set-of-the-pants estimate, where a planner is intuitively assigning values for ordering and carrying costs. It might be also based on some form of calculation, such as an EOQ calculated annually and then used as a fixed order quantity for that whole period of time. Economic Order Quantity (EOQ) : This method is based on the assumption of uniform demand. EOQ can be used if annual usage can be determined. It can be calculated by adding up all the demands over the planning horizon and then “annualize” the demand by extending an average of the period demands to represent the data for a full year. Discrete Methods Lot for lot (L4L) : Lot-for-lot ordering calls for placing an order for each period that has requirements in the exact amount of the requirement. This is equivalent of an “as-required” or “as-needed” rule. The order quantity changes whenever requirements change. This method requires time-phased information. This system creates no unused lot size inventory and hence is best for ‘A’ class items and in a just-in-time environment.

Session 10 – Inventory Management 234
Institute of Manufacturing Resource Management of India
Periods of supply : This method is similar to a fixed order quantity in that it is often specified intuitively. An informal rule such as “two week’s worth at a time” or “90-day supply at a time” is typical. Methods results in fixed order cycles but order quantity may vary. Period Order Quantity (POQ) : Period order quantity rules are similar to periods-of-supply, except that the order cycle is determined more scientifically. The approach uses a formula based on the EOQ but is solved for optimum number of periods to be covered by each order rather than for the optimum quantity. The number of orders per year is same as EOQ, but the quantity ordered each time varies. Thus ordering cost remains same but as the order quantities are determined by actual demand, the carrying cost is reduced. Least unit cost : The least unit cost method proceeds in an iterative fashion, period by period, using the inventory carrying cost percentage and the order, or setup cost, to accumulate a total cost for an order covering one or more periods. Optimum unit cost is derived from total cost. Least total cost (LTC) : This iterative method considers recalculation, one additional period of requirements. It continues, period by period, until the sum of the carrying costs are nearly equal to the setup cost. It would then plan one order to cover the needs for that number of periods. Part period balancing (PPB) : It is a variation to the Least Total Cost method. It uses the LTC derived order size and looks ahead and back to see whether the inclusion of one or more periods of demand in a planned order might delay a subsequent order and thus reduce the carrying costs. PPB uses principle of a part period, which represents the cost to carry for one period. It uses a simple formula to determine the optimum economic part period. Then future periods of requirements are considered iteratively until the cumulative part periods are nearly the same as economic part period.

Session 10 – Inventory Management 235
Institute of Manufacturing Resource Management of India
Dealing with Uncertainity
Demand and Supply Uncertainity Uncertainties do exist in demand as well as supply side. These uncertainties could apply either to quantity, timing or both. Demand uncertainty could arise due to varying customer requirements, market conditions. Supply uncertainty could exist due to supplier problems, scraps, quality, shipping (transportation) etc. Both uncertainties could be buffered using safety stock. When demand or supply is erratic, larger amount of safety stock is necessary. When both demand and supply are uncertain, some form of probability analysis is necessary, usually calling for a higher level of safety stock than if only one factor is subject to uncertainty.
Concept of Safety Stock Safety stock constitutes one of the primary functions performed by inventory. Safety stock is intended to protect when demand for a product or part is subject to uncertainty, or when the timely re-supply of the product or part is uncertain. The need of Safety Stock With uncertainties such as quantity and timings, safety stock usually would be retained to protect against running out of stock. In earlier sessions safety stock was considered in determining reorder point and time-phased order computations. This session discusses the question of how much, if any, safety stock should be provided. Role of Safety Stock Dependant demand items are insulated from the uncertainties of customer demand by MPS. Usually only reason why safety stock is planned for dependant-demand items is because the supply of the item is subject to variation, perhaps due to scrap or quality processes.

Session 10 – Inventory Management 236
Institute of Manufacturing Resource Management of India
Stock Out Cost Vs Carrying Cost Following are consequences of running out of stock :
◊ Backorders ◊ Loss of sales ◊ Loss of future sales ◊ Loss of customer goodwill ◊ Idle machinery or workers
In order to avoid the consequences of stock-outs, when losses are anticipated, a company may carry safety stock. The more safety stock provided, the fewer the incidences of stock-outs with their attendant costs. The price, however, is to incur carrying costs for the safety stock. Theoretically, a cost graph could be depicted, as shown below with an economic safety stock quantity indicated where the two costs intersect.
Concept of Service Level To achieve the objective of rational stock-out cost estimation, techniques used expresses a desired level of service to fill customer needs. Service levels are generally expressed in terms of percentage, such as desire for a 95% customer service level or even 100%. Customer service level objectives could be established based on the delivery service needed to serve the market while obtaining the desired return on investment given the inventory investment required in achieving a certain service level.
C O S T
TotalCost
carrying cost
stock-out cost
Safety stock Quantity

Session 10 – Inventory Management 237
Institute of Manufacturing Resource Management of India
Meaning of Customer Service Customer service can be expressed in many ways. It can be used to describe the availability of items when needed by the customer. Even the meaning of “customer” can be interpreted differently - the ultimate consumer of a finished product, the intermediate customers such as a distributor, a plant in the organization or a downstream operator demanding parts and raw material. The nature of business and the purpose of the inventory must be considered in establishing customer service targets. Following are ways in which customer service might be measured :
◊ Order shipped on schedule ◊ Line items of orders shipped on schedule ◊ Dollar volume shipped on schedule ◊ Ordering period without a stock-out ◊ Idle time due to material or component shortages.
Service Level vis-à-vis Order Quantity When customer service levels are expressed as performance goals relative to some specific period of time, such as a year, the order quantity selected has a bearing on the performance. Only time there is a risk of a stock-out is just prior to receipt of a replenishment order. The smaller the order quantity, and therefore the shorter the order cycle, the more times per year a stock-out may occur.

Session 10 – Inventory Management 238
Institute of Manufacturing Resource Management of India
Key Terminology 01) ABC Inventory Control 02) Carrying Cost 03) Cost of Goods Sold 04) Cycle Counting 05) Customer Service 06) Economic Order Quantity (EOQ) 07) Fixed Order Quantity 08) Inventory 09) Inventory Adjustments 10) Inventory Control 11) Inventory Issues 12) Inventory Management 13) Inventory Turns 14) Inventory Turnover 15) Lot 16) Lot Control 17) Lot Size 18) Lot – for – Lot 19) Lot – size Inventory 20) Materials Management 21) Order Point 22) Ordering Cost 23) Perpetual Inventory Record 24) Physical Inventory 25) Record Accuracy 26) Reorder Point 27) Reorder Quantity 28) Replenishment Lead-time 29) Safety Stock 30) Stock Keeping Unit (SKU) 31) Two-bin System 32) Visual Review System
Session 10 – Inventory Management 239
Institute of Manufacturing Resource Management of India
Practice Questions – Session 10 Question 1 : Which of the following are reasonable explanations for why inventory might become obsolete :
I. Engineering Changes II. Spoilage III. Technical Obsolescence
A) II only B) III only C) I, II and III D) I and III only
Correct Answer is: ------------------------------------------------------------------------------------------------------------ Question 2 : An inventory system where disbursements from raw material inventory are not recorded until the final product is shipped is called :
A) Perpetual Inventory System B) Four-Wall Inventory System C) Visual Review System D) Periodic Inventory System
Correct Answer is: ------------------------------------------------------------------------------------------------------------ Question 3 : An inventory valuation method that tends to give the lowest value to current inventory in a period of rising prices is :
A) LIFO B) FIFO C) Actual Cost System D) Standard Cost System
Correct Answer is: ------------------------------------------------------------------------------------------------------------ Question 4 : Which of the following is a primary objective of cycle counting :

Session 10 – Inventory Management 240
Institute of Manufacturing Resource Management of India
A) Identify and fix the causes of errors B) Make the data processing task easier C) Reduce the number of storeroom personnel D) Eliminate the annual physical inventory
Correct Answer is: ------------------------------------------------------------------------------------------------------------ Question 5 : Which of the following inventory control methods is more appropriate for items with dependent demand than for items with independent demand :
A) Reorder Point B) ABC Analysis C) Time Phased Order Point D) Material Requirement Planning (MRP)
Correct Answer is: ------------------------------------------------------------------------------------------------------------ Question 6 : Determination of an optimal order quantity requires minimizing the sum of which of the following two categories of costs :
A) Ordering Cost and Carrying Cost B) Stock-out Cost and Ordering Cost C) Purchase Order Cost and Production Order Cost D) Carrying Cost and Purchase Cost
Correct Answer is: ------------------------------------------------------------------------------------------------------------ Question 7 : Each of the following order quantity methods is considered a discrete technique except :
A) Lot-for-Lot B) Fixed Order Quantity C) Periods of Supply D) Least Unit Cost
Correct Answer is: ------------------------------------------------------------------------------------------------------------ Question 8 : The determination of safety stock levels is based in a comparison of which of the following opposing costs :

Session 10 – Inventory Management 241
Institute of Manufacturing Resource Management of India
I. Item Cost II. Stock-out Cost III. Ordering Cost IV. Carrying Cost
A) II and IV only B) I and II only C) I, II and III only D) I, II, III and IV
Correct Answer is: ------------------------------------------------------------------------------------------------------------ Question 9 : Each of the following is an advantage of a locked stockroom except :
A) Reduced Shortages B) Less loss due to shrinkage C) Quick access to materials by user D) Increased record accuracy
Correct Answer is: ------------------------------------------------------------------------------------------------------------ Question 10 : The ABC Classification method would be expected to reveal that :
A) 20% of value is in 20% of items. B) 20% of value is in 80% of items. C) 20% of value is in 60% of items. D) 20% of value is in 40% of items.
Correct Answer is: ------------------------------------------------------------------------------------------------------------

242
Institute of Manufacturing Resource Management of India
SESSION 11
PURCHASING

Session 11 – Purchasing 243
Institute of Manufacturing Resource Management of India
Fundamentals of Purchasing
Objectives and Importance What is Materials Management
Materials management is a coordinating function responsible for planning and controlling materials flow. Objectives of materials management:
◊ Maximize the use of the firm’s resources. ◊ Provide the required level of customer service.
Considering the huge contribution of material cost to total turnover, small improvement can contribute in a big improvement on the profits. Materials management can reduce costs by being sure that the right materials are in the right place at the right time and the resources of the company are properly used. What is Purchasing Purchasing is the “process of buying”. Purchasing is responsible for obtaining the right material, in the right quantities, with the right delivery (time and place), from the right source, and at the right price. Choosing the right material requires input from the marketing, engineering, manufacturing, and purchasing departments. Quantities and delivery of final products are decided based on the needs of the marketplace. Manufacturing planning decides when to order which materials to meet the marketplace demand. Based on the requirements given by manufacturing planning, purchasing places orders and ensure timely delivery of the same. Purchasing department is also responsible for locating suitable sources of the supply and finalizing terms and conditions. Objectives of Purchasing Major objectives of purchasing can be classified into four categories:
◊ Obtaining goods and services of the required quantity and quality. ◊ Obtaining goods and services at the lowest cost. ◊ Ensuring the best possible service and prompt delivery by the supplier.

Session 11 – Purchasing 244
Institute of Manufacturing Resource Management of India
◊ Developing and maintaining good supplier relations and developing potential suppliers.
Purchasing Cycle
◊ Receiving and analysing purchase requisitions ◊ Establishing Specifications ◊ Selecting suppliers ◊ Supplier Agreements ◊ Order Management
Receiving and Analyzing notification of need Requisition Purchase requisition is generated from the department and user requiring that item(s). Purchase requisition contain following information:
◊ Identity of originator, signed approval, and costing account details ◊ Materials specification
Determinationof requirements
Source determination
Vendor selection
Order processingOrder monitoring
Warehouse &inventory mgmt.
Invoice verification
Vendor
Outline agreement

Session 11 – Purchasing 245
Institute of Manufacturing Resource Management of India
◊ Quantity and unit of measure ◊ Required delivery date and place
This is an indicative list and there can be other details also depending upon the organization.
All these requisition are submitted to purchase department after required approval. Purchase department analyses these requisitions and takes actions depending upon the requirement. If source exist for the item requested, purchase orders are raised. In case of a new item purchase cycle is followed MRP Output For the items used on regular basis for production requirements are generated from the planning method used. Most of the companies having ERP/MRPII software use MRP (Material Requirement Planning) for generating their material requirement. Final product requirements (quantity and date) are updated in the system as MPS (Master production schedule). Based on MPS, MRP is run which used Bill of Material to generate material requirements.
Establish Specifications Quantity Requirement Requirement is determined for an item in terms of quantity, whether it’s a one-time requirement or it is going to be regular requirement. In case of regular requirement, one should identify if the quantity is going to remain same over period of time or will vary. Price Requirement In most of the cases whether item is required for production or for other use, there will be some constraints in terms of price. It can be to meet target price of final product or budget. Functional Requirements If requested item is an existing item in the purchase list, these specifications will be there. In case of new items specifications need to established. Complexity of this effort depends on the type of the item. If item is a standard item available in the market is very easy to define the specifications. In case of specific requirements specification need to be established very carefully to ensure suppliers can understand the requirements easily. Specification can be given in following documents:

Session 11 – Purchasing 246
Institute of Manufacturing Resource Management of India
◊ Drawing ◊ Technical requirements ◊ Functional requirements ◊ Input material specifications
Organisations may use one or combination of these documents.
Selecting Suppliers Once the requirements and specifications are clearly defined, purchase needs to select the supplier. Purchase inquiry: These requirements can send to the prospective suppliers in inquiry form. How to identify prospective supplier? Suppliers can be identified from the existing list of suppliers of the organisation and/or suppliers can be identified from the product finders, internet, trade magazines, trade directories etc. Quotations: Suppliers will respond to these inquiries with details like price, quantity, lead-time etc. In case of new suppliers normally companies perform an audit before going ahead with any business discussions. In these audits focus is to analyse the capabilities of the supplier in terms of quality, financial strength, management etc. If supplier is found satisfactory in this audit purchase process is taken forward. There are few things for management considerations while selecting the suppliers: Source (Single / Multiple)
Management needs to decide whether they want to have a single source or multiple sources of an item. There are pros and cons of both. Few of them are listed below: Advantages of Single Sourcing :
◊ Supplier can offer better rates because of economy of scale. ◊ Supplier will more loyal and hence can offer better customer service.
Disadvantages of Single Sourcing :
◊ In case of any crisis (quality problem, financial or other) there are no fallback option.
◊ Supplier can take advantage of being single source.
Session 11 – Purchasing 247
Institute of Manufacturing Resource Management of India
Advantages of Multi-Sourcing :
◊ It can create a competitive environment resulting in better customer service. ◊ In case of crisis at one supplier’s end, there are fallback options.
Disadvantages of Multi-Sourcing :
◊ Managing multiple suppliers can be difficult. ◊ Overall prices can be higher because low quantities to suppliers.
There is no universal strategy for sourcing. Organisations need to decide based on the environment they operate. Supplier Partnering Partnering with supplier concept is rapidly picking for last few years. What it means is, companies no longer keep their suppliers at arm’s length distance. Rather they call them business partner and involve them starting from their design phase. It gives kind of a win-win situation for both. Supplier gets better clarity of the requirement and can provide his inputs to get a better and or cost effective design and supplier can optimise its resources. There is total transparency in terms of costing also. Both work towards reducing total cost and share the savings. Vendor Managed Inventory Another concept which companies started implementing is Vendor Managed Inventory (VMI). Under this concept the vendor or supplier manages the inventory of the item he is supplying to the customer. Physical items can be stocked at vendor premises or customer premises. Vendor’s representative interacts with the planners of the customer and ensures inventory is available when required. Payments are made depending on the rules defined e.g. it can be based on the material used in a month paid by 15th of coming month. Vendor is totally responsible for the inventory till it is issued for production. Joint Managed Inventory (JMI) : JMI concept is same as VMI but one difference. In JMI Vendor and customer both jointly hold the responsibility of the inventory.

Session 11 – Purchasing 248
Institute of Manufacturing Resource Management of India
Supplier Agreements Once the factors as discussed above are found satisfactory then agreement need to be done with supplier(s) for supply of item(s). This is finalised through series of negotiations. Following are the elements of an agreement: Price All other things being equal, price becomes the most important factor of purchasing decision. Considering the fact, for average manufacturing organisation, purchase will account for more than 60% of the cost of goods sold, any saving made will contribute directly to profits significantly. One would think pricing will depend on the cost and the profit expectation of the supplier, but it is not that simple as it appears. Equation of demand and supply influence the price of the item in big way. If demand is high and supply is low, suppliers can dictate terms and charge high premiums. In a scenario where supply is higher than demand, customer can expect good value for the money they pay. Prices have an upper and a lower limit. The market based on demand and supply situation as discussed above decides upper limit. The seller sets the lower limit and it is determined by the costs of manufacturing and selling the products and profit expectation. For price negotiation it is very important to have good understanding of market demand and supply, competitive prices, and the methods of arriving at a cost. Some examples of price agreements in practical scenarios:
◊ Rs. 50 per KG for any order quantity ◊ Rs. 50 per KG for order quantity up-to 1000 KG, ◊ Rs. 48 per KG for order quantity from 1001 KG to 2000 KG
Terms There are few terms and conditions, which need to agreed upon and documented in the supplier agreement. These terms are required to ensure smooth transactions. Few of the terms are discussed here: When payment should me made (e.g. 30 days after the receipt, on delivery of goods etc.)? How payments should be made (cheque, cash, Draft etc.)?
Delivery Whether supplier has to deliver or customer will pick the delivery through its transporter? What will be mode of shipment (air/sea/road)?

Session 11 – Purchasing 249
Institute of Manufacturing Resource Management of India
Delivery should be done to which location (there can be multiple locations)? If item needs to be delivered in some specific container and/or packing? Is there some penalty for late delivery? Quality What are the quality requirements for items? Does it require some test certificate from any testing agency? Are there any sample requirements for testing along with the delivery?
Quantity Is there any minimum order quantity requirement per order or schedule? Does pricing depend on quantity?
Order Management Ordering / Releasing Orders are released to the suppliers based on the agreement with the supplier and requirements gathered from the organisation. A purchase order is a legal offer to purchase and once accepted by the supplier, it becomes a legal contract for delivery of the goods according to the terms and conditions specified in the purchase agreement. All concerned (supplier, accounts department, originator department etc.) are notified either by sending a hard copy or electronically. In case of regular supplies customer can issue a blanket order followed by monthly or weekly schedules. Monitoring and Controlling Open Orders The supplier is responsible for delivering the items ordered. The purchasing department ensures that suppliers do deliver the right quantity, at the right place and the right time. There can be cases when supplier is not in position to meet the delivery date, purchase should take preventive and corrective action depending upon the situation. This might involve expediting transportation, locating alternate source of supply, working with the supplier to resolve the issue or reschedule the production. There can be changes from the requirement side as well, may be demand quantity changes or timing changes. Purchase has to manage these situations as well.

Session 11 – Purchasing 250
Institute of Manufacturing Resource Management of India
Receiving and Accepting Orders When the goods are received, the receiving department inspects the goods to ensure the correct ones have been sent, are in the right quantity, and have not been damaged in transit. Based on the purchase order information available on computer system or on the hard copy and the bill of the lading of the supplier, goods are received. A receipt report is prepared noting any variance. If required items are sent to quality control department for inspection. In case material is received in damaged condition purchase department is notified for further action. If found good material is send to the originating department or to the inventory. Approving Invoices for Payment For approving supplier’s invoice, there are three pieces of information is required, the purchase order, the receipt report and the invoice. This is called three-way matching of the invoices. If the information matches, payment is made based on the payment terms. In case of manual setup, purchase department approves and advices accounts department to make payment. In ERP kind of scenario business rules are set to automatically match the invoices and payment cheques are generated based on payment terms.
Monitoring Supplier Performance
Establishing Performance Criteria Supplier’s performance needs to be monitored on a continuous basis. To monitor the performance one needs to establish the criteria. Various factors required to be monitored:
◊ Quality ◊ Delivery ◊ Reliability ◊ Flexibility
Quality Quality is most important factor to be monitored. For each supply record needs to be maintained (i.e. how many items rejected, how many items accepted with some deviation and how many items found good). Weightages can be assigned to all type and some kind of quality rating can be worked out. Grades can be assigned for range of ratings (e.g. 91 – 100% - Grade A, 81 – 90% - Grade B etc.). These ratings can be calculated and supplier’s grade can be arrived.

Session 11 – Purchasing 251
Institute of Manufacturing Resource Management of India
Reliability Reliability is another qualitative parameters for performance management. This gives consideration to factors like
◊ Where does supplier stand in the market as compared to its competitors, ◊ How sound is the management practices of the supplier, ◊ Financial strength of the supplier, ◊ How good the supplier is in terms of technical capability, ◊ Kind of customers it has and the track record
Flexibility This is one of the qualitative parameters for performance management. Considering the uncertainties in the practical scenario, there can be last time changes in the delivery quantity or date. How flexible is the supplier for these changes, needs to be monitored. Purchase department personnel interacting with the suppliers can rate the suppliers on the flexibility parameter on a predefined scale (e.g. 1 to 10). Delivery A late delivery can affect planning in big way, it can result is delay in order supply and much more. Supplies need to be made at the right time, right quantity and right place. For monitoring delivery performance, a time range can be fixed (say 3 days +/- of the expected delivery date). If the supply is done within this time range it is considered 100% performance assuming total quantity is supplied (in case partial quantity is supplied, 80 supplied against order 100, 80% would be the rating). These rating can be graded in the line of quality ratings.
Establish Mechanism to Monitor Performance Performance needs to be monitored based on the criteria defined. Ratings defined under the criteria can be calculated and can be communicated to the suppliers at defined frequency (e.g. once in a month). Poor performances should be discussed with the suppliers and improvement plan should be made and monitored. Performance results analysis can indicate the areas where most suppliers need to improve. Customer can plan some kind of training or educational workshop to improve on these areas. Some kind of awards also can be planned to motivate the good performers.

Session 11 – Purchasing 252
Institute of Manufacturing Resource Management of India
Key Terminology 01) Backorder 02) Blanket Order 03) Consignment 04) Cost of Goods Sold 05) Due Date 06) Electronic Data Interchange 07) Expedite 08) Inspection 09) Joint-Managed Inventory 10) Lot 11) Maintenance, Repair and Operating Supplies (MRO) 12) Materials Management 13) Multi-Sourcing 14) Open Order 15) Ordering Costs 16) Purchase Order 17) Purchase Requisition 18) Purchasing 19) Raw Material 20) Receipt 21) Requisition 22) Single Source Supplier 23) Standard Costs 24) Stock Keeping Unit (SKU) 25) Subcontracting 26) Supplier 27) Supplier Lead-Time 28) Supplier Partnering (Partnership) 29) Vendor 30) Vendor-Managed Inventory (VMI)

Session 11 – Purchasing 253
Institute of Manufacturing Resource Management of India
Practice Questions – Session 11 Question 1 : Objectives of Purchasing are
I. Obtaining goods and services of the required quantity and quality II. Obtaining goods and services at the lowest cost III. Ensuring the best possible service and prompt delivery by the supplier
A) I only B) I and II only C) II and III only D) I, II and III
Correct Answer is: ------------------------------------------------------------------------------------------------------------ Question 2 : Each of the following are responsibilities of purchasing except :
A) Right Material B) Right Price C) Right Source D) Right Customer
Correct Answer is: ------------------------------------------------------------------------------------------------------------ Question 3 : Correct sequence of the purchasing cycle is :
I. Receiving and Analyzing Purchase Requisitions
II. Selecting Suppliers III. Order Management IV. Supplier Agreements V. Establishing Specifications A) I, II, III, IV and V B) I, V, II, IV and III C) I, III, II, IV and V D) V, I, II, IV and III
Correct Answer is: ------------------------------------------------------------------------------------------------------------ Question 4 : Concept of supplier partnering has the following advantages except :

Session 11 – Purchasing 254
Institute of Manufacturing Resource Management of India
A) Supplier gets better clarity of the requirements B) Customers get better service C) Transparency in the system D) Customer can dictate terms
Correct Answer is: ------------------------------------------------------------------------------------------------------------ Question 5 : In Joint Managed Inventory (JMI) concept, vendor and customer both jointly hold the responsibility of the inventory :
A) True B) False
Correct Answer is: ------------------------------------------------------------------------------------------------------------ Question 6 : In a purchasing system, which of the following originates with the department or person who will be the ultimate user :
A) Purchase Requisition B) Purchase Order C) Vendor Selection D) Request for Quotation
Correct Answer is: ------------------------------------------------------------------------------------------------------------ Question 7 : Correct sequence of steps in the order management process is :
I. Monitoring and controlling of the open orders II. Releasing the order
III. Approving invoices for payment IV. Receiving and accepting the orders A) I, II, III and IV B) I, II, IV and III C) II, I, IV and III D) I, III, II and IV
Correct Answer is: ------------------------------------------------------------------------------------------------------------ Question 8 : Each of the following are part of supplier performance criteria except :

Session 11 – Purchasing 255
Institute of Manufacturing Resource Management of India
A) Supplier turn-over B) Quality C) Delivery D) Flexibility
Correct Answer is: ------------------------------------------------------------------------------------------------------------ Question 9 : In three-way matching of invoices, these pieces of information are required except :
A) Purchase order B) Supplier invoice C) Receipt report D) Production order
Correct Answer is: ------------------------------------------------------------------------------------------------------------ Question 10 : Advantage of multi-sourcing is :
A) Supplier can offer better rates because of economy of scale B) Supplier will be more loyal and hence can offer better customer service C) It can create a competitive environment resulting in better customer
service D) There are no fallback options in cases of crisis at supplier’s end
Correct Answer is: ------------------------------------------------------------------------------------------------------------

256
Institute of Manufacturing Resource Management of India
SESSION 12
PHYSICAL
DISTRIBUTION

Session 12 – Physical Distribution 257
Institute of Manufacturing Resource Management of India
Fundamentals of Physical Distribution
Introduction In a Manufacturing Organization, material flow can broadly be classified into three phases as shown in figure 12.1 • Flow of raw material from a supplier to the manufacturing company through Physical Supply • Flow of material as they are processed, within a manufacturing company through the Manufacturing Planning and Control System • Flow of finished goods from the manufacturing company to the end customers through Physical Distribution SUPPLIER MANUFACTURING CUSTOMER COMPANY PHYSICAL MANUFACTURING PHYSICAL SUPPLY PLANNING AND DISTRIBUTION CONTROL SYSTEM Flow of Material Figure 12.1 - Classification based on the flow of material Physical Distribution encompasses all the activities involved during the movement of material from the Producer to the Consumer.

Session 12 – Physical Distribution 258
Institute of Manufacturing Resource Management of India
Distribution Channels Based on the products and the markets served, physical distribution can be direct from a producer to a consumer or it can contain a number of intermediaries viz., Distribution centers, wholesalers, warehousers, transporters, agents, retailers etc., These intermediaries, which can be companies or individuals, help in the flow of goods from the producer to the consumer and are known as the Channels of Distribution.
Manufacturing Company
Factory Warehouse
Regional Regional Distribution Distribution Center 1 Center 2 Public Public Public Public Warehouse Warehouse Warehouse Warehouse Local Local Local Local Local Local Delivery Delivery Delivery Delivery Delivery Delivery C U S T O M E R S Figure 12.2 - Channels of Distribution
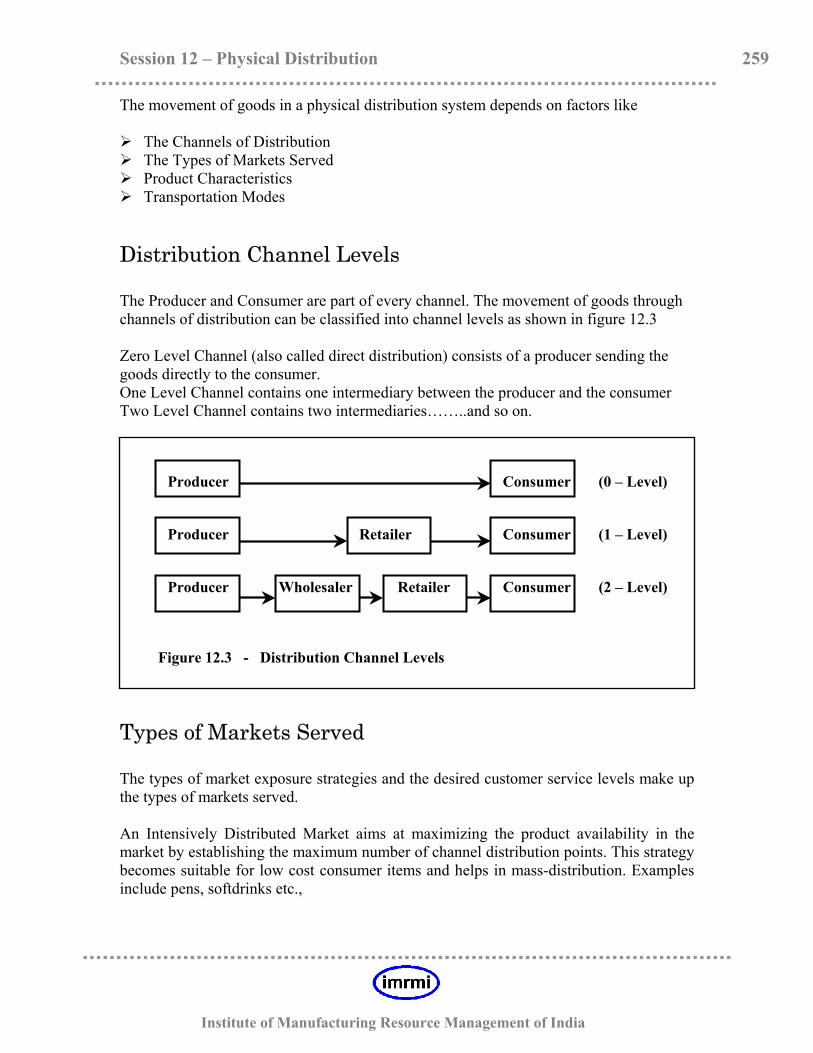
Session 12 – Physical Distribution 259
Institute of Manufacturing Resource Management of India
The movement of goods in a physical distribution system depends on factors like The Channels of Distribution The Types of Markets Served Product Characteristics Transportation Modes
Distribution Channel Levels The Producer and Consumer are part of every channel. The movement of goods through channels of distribution can be classified into channel levels as shown in figure 12.3 Zero Level Channel (also called direct distribution) consists of a producer sending the goods directly to the consumer. One Level Channel contains one intermediary between the producer and the consumer Two Level Channel contains two intermediaries……..and so on. Producer Consumer (0 – Level) Producer Retailer Consumer (1 – Level) Producer Wholesaler Retailer Consumer (2 – Level) Figure 12.3 - Distribution Channel Levels Types of Markets Served The types of market exposure strategies and the desired customer service levels make up the types of markets served. An Intensively Distributed Market aims at maximizing the product availability in the market by establishing the maximum number of channel distribution points. This strategy becomes suitable for low cost consumer items and helps in mass-distribution. Examples include pens, softdrinks etc.,

Session 12 – Physical Distribution 260
Institute of Manufacturing Resource Management of India
An Exclusively Distributed Market aims at having a limited number of distribution points for better administration, control and certain business interests. Examples include Garment stores (exclusive Raymonds outlets), Automobiles etc., A Selectively Distributed Market aims at having a select few distribution channels capable of providing a specified customer service thus catering to a niche market. In each of these strategies, desired customer service levels can be achieved by a detailed understanding of the customers, their buying habits, expectations and catering to the size of orders, timely delivery, speed and accuracy or order processing. Product Characteristics and Transportation modes Product Characteristics (weight, fragility, perishability etc.,) and Transportation Modes (air, water, rail, road) also influence the movement and storage of goods and hence are taken into consideration during the design of distribution channels Control Based on ABC Analysis Typically, distribution inventory consists of thousands of items. The same methods of planning, handling, shipping, etc., cannot be applied uniformly across all the items. According to the ABC Classification,
◊ A items, classified as high value items account for about 20 % of the total items and contribute to about 80 % of the transaction value.
◊ B items, classified as moderate value items account for about 30 % of the total
items and contribute to about 15 % of the transaction value.
◊ C items, classified as low value items account for about 50 % of the total items and contribute to about 5 % of the transaction value.
ABC classification holds good for all inventories and hence the distribution inventory can be classified into A, B and C items.

Session 12 – Physical Distribution 261
Institute of Manufacturing Resource Management of India
100 80 60 40 A B C 20 10 20 30 40 50 60 70 80 90 100 % I t e m s
Figure 12.4 - ABC Classification Based on the ABC classification of inventory, the following controls have to be exercised
◊ A Items : A items being very expensive with high transaction value, require very tight controls. It is essential to maintain accurate inventory records of these items. Inventory planners take decisions regarding the stock and replenishment after a careful time-to-time review. These items are closely monitored and reviewed frequently.
◊ B Items : B items require moderate controls. Good inventory record keeping and
standard reviews are necessary for these items. The stock and replenishment decisions can be computer controlled with less planner interaction.
◊ C Items : C items make up nearly 50 % of the inventory but are relatively
inexpensive with a very low transaction value. These items may / may not be computer controlled and requires very minimum attention in terms of record keeping and reviews. Simple and more general controls are implemented. These items are maintained and ordered in large quantities with plenty of safety stock.
Physical Distribution System Globalization, Advances in technology and Intense competition pose greater challenges and opportunities to businesses today. A well designed physical distribution system plays a vital role in addressing these and helps achieve the desired level of customer service by providing the required goods at the required place and time and at minimum costs.
% v a l u e

Session 12 – Physical Distribution 262
Institute of Manufacturing Resource Management of India
The interrelated activities integrated into the physical distribution system are :- Transportation : Includes the various means of moving goods from the producer to the consumer. It can account from 30 % to 60 % of the total distribution costs. It primarily ensures that the product is available at the required place and hence adds place value to the product. Distribution Inventory : Inventory of the finished goods available at any point in the distribution system. It accounts to about 25 % to 30 % of the total distribution costs. Distribution Inventory helps to meet a customer requirement at the required time and hence adds time value to the product. Warehouses : Warehouses store inventory and ensure that they possess sufficient stock to
Satisfy anticipated customer demand Cater to the uncertainties in supply and demand Facilitate availability in geographically dispersed supply points
Materials Handling : Materials handling is concerned with the various means of moving goods between the storage location to the required locations within a distribution center. Protective Packaging : Products are packaged to enhance protection, containment and identification. It also ensures that the packaged product fits into the dimensions of the storage spaces and transportation vehicles. Order Processing and Communication : Order processing and communication involves all the processes in customer order fulfillment and hence forms an important part of managing customer service.
Transportation Transportation is associated with the movement of goods from one point to the next in the distribution system. By making a product available at a particular point in the distribution system, it adds place value to the product. On a broader perspective, transportation contributes to the social and economic development. There are basically five modes of transportation Rail Road Air Water Pipeline

Session 12 – Physical Distribution 263
Institute of Manufacturing Resource Management of India
Rail Transportation The rail mode of transportation surpasses all the other modes in terms of shipping tonnage due to its ability of transporting large volumes of goods over long distances. The total cost of transportation decreases as the volume of the freight increases and hence rail is cheaper than road in transporting large quantities of bulky goods. The rail mode of transportation incurs huge capital investment since they have to maintain their own facilities in terms of tracks, vehicles, terminals, etc., and hence must have a right volume of traffic to justify the costs. Although the rail mode of transportation has the advantages of large volume transportation over long distances, less per unit transportation costs compared to the other modes, good transportation speed over long distances, reliable service, flexibility in the types of goods carried, etc., it has certain drawbacks as listed below
◊ They operate on specific predetermined time schedules and hence the frequency and transit times are not flexible.
◊ They operate between their terminals and hence cannot provide a stock-point to stock-point type of service
◊ Unlike the road transport, general availability at the required locations and at the required times cannot be guaranteed.
Road Transportation Road transportation is the most popular mode of transportation and accounts to a very large percentage of the transportation revenue. Unlike the rail transportation, road transportation does not maintain their own facilities but use the common facilities provided by the government by paying a fee in the form of taxes, licenses, rents, tolls etc., Optionally, the vehicles and terminals can be owned or can also be used by paying certain charges. Hence the major costs in road transportation are operating costs which are variable. Speedy delivery, flexibility of usage, relatively low cost of transportation and high general availability makes it versatile and hence provides quick response and good customer service. Due to the highly networked roadways, it provides a point-to-point service by a variety of motorized vehicles carrying wide range of loads. The major benefit of road transportation is the distribution of smaller volumes of goods to widely distributed markets.

Session 12 – Physical Distribution 264
Institute of Manufacturing Resource Management of India
Air Transportation Air Transportation has the biggest advantage of service speed over long distances when compared to the other transportation modes. This mode of transportation has a limited applicability and is profitably used for
◊ Speedy transportation of high value – low weight products over long distances ◊ Emergency transportation of critical parts and urgent requirements ◊ Speedy transportation of perishable and seasonalised products
Generally, air transportation uses the systems such as Air Traffic Control (ATC) provided by the government by paying certain charges. The terminals and vehicles are either owned or rented and hence this mode of transportation has a very high variable cost. Although speedy delivery and additional advantages of service flexibility, frequency and reliability of service can be obtained, air transport has the following limitations :
◊ It has a very high service cost compared to the other modes ◊ It has limited accessibility to certain locations ◊ Provides a terminal to terminal service and hence transportation from stock point
to stock point is not possible ◊ It has limited capacity and suitability of cargo bays for different types of freight
requirements. Water Transportation The main advantage of water transportation being cost, this mode of transportation is most suited to the movement of large, low value goods over long distances provided the appropriate waterways are present. This mode of transportation best suits the transportation of commodity type products which do not require urgent delivery and are not subjected to transportation damages. Examples include Iron ore, building materials, petroleum products etc., Water transportation mainly incurs variable costs since the facilities of waterways, terminals and vehicles can be utilized by paying certain charges to the government or the concerned authority. Although water transportation is least expensive and most capable in moving low value bulky cargo over long distances, it has certain limitations
◊ Is relatively slow compared to the other transportation modes ◊ Is dependent on the availability of proper terminals and ports ◊ Has a low frequency of operation

Session 12 – Physical Distribution 265
Institute of Manufacturing Resource Management of India
Pipeline transportation Pipeline transportation is a unique mode of transportation catering to the widespread, continuous movement of large volumes of products in liquid and gaseous forms. Examples include petroleum products, crude oil, water, gas, chemicals etc., This mode of transportation does not depend on facilities like road, rail, waterways and airways but operate using facilities like pipes, storage units, pumping units etc., which may not be publicly visible. Pipeline transportation mode demands a onetime setup of its facilities and hence incurs huge capital costs. Once the setup is in place, operating and maintenance costs are relatively low. This helps in achieving a high level of dependability and service at relatively low costs. The design of this mode helps incorporate good monitoring systems using automatic computer systems and the products moved are rarely subjected to damages and losses. The drawback of this mode of transportation is that it is limited to the movement of liquid and gaseous products only and it does not have geographical flexibility.
Warehousing Warehouses provide a place to store , handle and protect goods. They form an integral part of the business functions of an organization and contribute to the competitive advantage of a company by improving customer service levels and reducing transportation costs. To be effective, management of warehouses should operate around the following objectives
◊ Providing quick and timely response to customer requirements ◊ Maintaining an efficient system to identify and track goods in a warehouse ◊ Maintaining an effective system of moving goods across locations in a warehouse
to gain on cost of moving goods ◊ Providing a channel of communication with external customers
The general activities carried out by warehouses can be broadly classified as follows :
◊ Receiving : Receiving activity involves order acceptance, checking the goods for quantity and quality against the order and identifying the goods based on SKU / Product part numbers.

Session 12 – Physical Distribution 266
Institute of Manufacturing Resource Management of India
◊ Put-away / Storing : This activity involves moving the identified and received goods to the allocated locations in the warehouse and also ensuring the maintenance of appropriate storage conditions for the goods.
◊ Order Picking : Order picking activity involves selection of the products from
the storage locations required to meet a customer order request. This pick list is generated from the sales orders and includes details of the sales order number, item / part numbers, order quantities, required dates, etc., The selected goods are further brought to the staging or marshalling area.
◊ Shipping : Shipping involves consolidating the goods as per the order, preparing
the shipment records, verifying the goods against these records, appropriate packaging and loading for transportation.
◊ Maintaining an Information System : This activity involves capturing all the
transaction information pertaining to the receipt, internal movements, storage and shipment of goods. This helps in maintenance of individual item records showing the quantity on hand, received and shipped quantities and the location of goods in the warehouse. Information system can also include details of warehouse space utilization, availability of equipment and manpower, transportation capacities etc.
Based on their purpose, location and the types of goods stored, warehouses can be classified into factory warehouses, regional warehouses / distribution centers, local warehouses and in-transit warehouses. The ownership and execution control of these warehouses may exist with the supplier or an intermediary or they can be pure public warehouses. All warehouses necessarily perform the functions of providing storage space and providing service to customers. A general warehouse would concentrate more on storage needs and a distribution warehouse would concentrate more on the service needs viz., mixing and moving goods as per the market requirements. Role of Warehouses in the Distribution System In a physical distribution system, the primary activities of the distribution warehouses / distribution centers include product mixing, handling and moving goods to meet customer requirements at reduced costs. To be effective in their functioning, distribution warehouses should perform the following roles :
◊ Consolidation : Usually products shipped to the distributors from various sources are in less-than-truckload (LTL) shipments. Consolidation function helps to convert many such small shipments into full / truckload (TL) shipments and in transporting these truckloads to the deployment warehouses. From the

Session 12 – Physical Distribution 267
Institute of Manufacturing Resource Management of India
deployment warehouses, the shipments are broken down into smaller, less-than-truckload (LTL) shipments to cater to the local market requirements and this process is called break-bulk.
(Consolidation)
Factory TL C 1 Warehouse 1 Shipments U LTL S T Deployment O Warehouse M
(Consolidation) (break-bulk) E Factory TL R
2 Warehouse 2 Shipments LTL S Figure 12.5 - Consolidation
◊ Product Mixing : Customer requirements often contain a mix of products usually produced by different companies and in different locations. To procure required products from the respective producers, customers have to raise a number of orders and have to accept less-than-truckload (LTL) shipments from each producer. Product mixing function in a warehouse allows grouping of various items from various shipments which further helps in meeting customer requirements on a single order and in consolidating the orders by making full / truckload (TL) shipments to the customers gaining on the transportation costs.
◊ Service : Warehouses maximize on customer service by improving product
position and location positioning. Warehouse and Transportation Cost Physical distribution systems aim at providing the required goods at the required place and time in order to achieve a high level of customer service. The functioning of the distribution system largely depends on the location of the warehouses and the transportation modes used. It is therefore important to balance the costs of transportation with the inventory related costs in determining the location of warehouses. Transportation generally represents the largest cost component within the distribution function. Hence the intent should be to minimize the distance and associated transportation costs between the inventory location and other facilities or markets.

Session 12 – Physical Distribution 268
Institute of Manufacturing Resource Management of India
Initially, by increasing the number of warehouses, inventory related costs will increase and transportation costs tend to decrease as Truckload (TL) shipments can be made to these warehouses. But, as the warehouses continue to increase, the transportation costs also tend to increase because it may not be possible to ship truckloads to a large number of warehouses resulting in shipping less-than-truckloads (LTL) and paying higher transportation rate.
Distribution Inventory Distribution inventory comprises the goods held in the distribution system necessary to support demand throughout the distribution channel. In the distribution system, inventory plays a major role in satisfying customer requirements and in reducing the transportation costs and hence holding distribution inventory, exercising effective control and proper management of inventory becomes important and necessary. Effective management of distribution inventory helps in achieving the following objectives :
◊ Improving Customer Service : Maintaining the desired customer service levels by providing the required goods at the required place and time to the customers
◊ Reducing Transportation Costs : Reducing transportation and handling costs
by accepting and shipping full / truckloads (TLs) between the various points in the distribution system
◊ Minimizing Scheduling Problems : Distribution inventory planning is closely
integrated with the various business functions of an organization. Good distribution inventory management helps in coordinating and establishing the correct requirements which in-turn help better scheduling in the supplying organization.
Distribution Systems can vary depending on their distribution network, the number and types of channels used etc., In its simplest and general form, a distribution system is made up of a factory, a central warehouse, distribution warehouses and customers as shown in figure 12.4

Session 12 – Physical Distribution 269
Institute of Manufacturing Resource Management of India
Flow of Goods Distribution C Warehouse U S Central T Factory Warehouse O M Distribution E
Warehouse R Flow of Demand for goods Figure 12.6 - Simple Physical Distribution System
Distribution Inventory Management Systems Customer requirements create demand on the distribution warehouses, which can be fairly uniform, and on a continuous basis. The distribution warehouses meet this demand with their inventory and for inventory replenishment they create a demand on the central warehouse. The demand on the central warehouse in terms of timing and quantity becomes dependent on the replenishment orders of the distribution warehouses and hence will not be uniform and completely predictable. The central warehouse replenishes its stock by placing orders with the factory and hence the demand on the factory will also not be uniform which in-turn effects the schedule and operations of the plant. It is therefore important to evaluate and implement the appropriate distribution inventory management system for better coordination and control of distribution inventory. There are basically three types of distribution inventory management systems : Pull System : In this system, each warehouse in the distribution channel maintains its own inventory and independently determines its own requirements in terms of quantity and time. Hence the inventory planning and replenishment in this system is decentralized. Based on the requirements and ordering techniques followed at each warehouse, inventory is ordered from the network irrespective of its requirements / availability at the other points in the distribution channel. This system is also known as ‘Decentralized System’ or ‘Independent Deployment System’
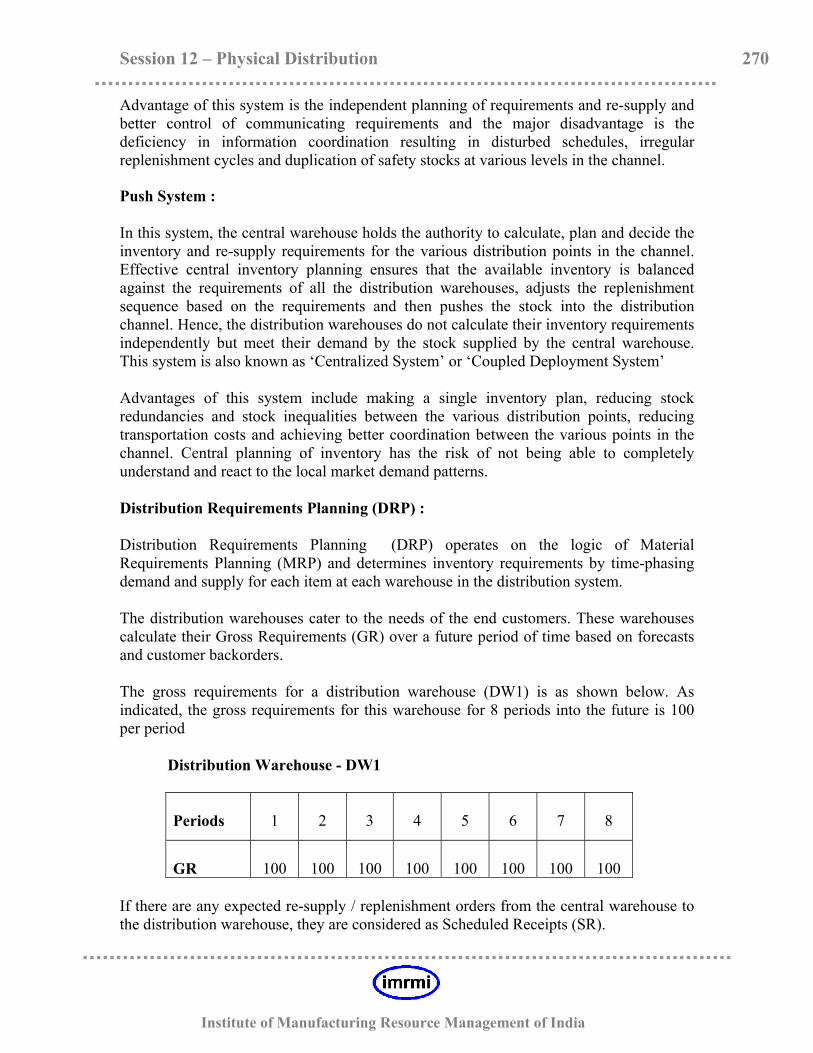
Session 12 – Physical Distribution 270
Institute of Manufacturing Resource Management of India
Advantage of this system is the independent planning of requirements and re-supply and better control of communicating requirements and the major disadvantage is the deficiency in information coordination resulting in disturbed schedules, irregular replenishment cycles and duplication of safety stocks at various levels in the channel. Push System : In this system, the central warehouse holds the authority to calculate, plan and decide the inventory and re-supply requirements for the various distribution points in the channel. Effective central inventory planning ensures that the available inventory is balanced against the requirements of all the distribution warehouses, adjusts the replenishment sequence based on the requirements and then pushes the stock into the distribution channel. Hence, the distribution warehouses do not calculate their inventory requirements independently but meet their demand by the stock supplied by the central warehouse. This system is also known as ‘Centralized System’ or ‘Coupled Deployment System’ Advantages of this system include making a single inventory plan, reducing stock redundancies and stock inequalities between the various distribution points, reducing transportation costs and achieving better coordination between the various points in the channel. Central planning of inventory has the risk of not being able to completely understand and react to the local market demand patterns. Distribution Requirements Planning (DRP) : Distribution Requirements Planning (DRP) operates on the logic of Material Requirements Planning (MRP) and determines inventory requirements by time-phasing demand and supply for each item at each warehouse in the distribution system. The distribution warehouses cater to the needs of the end customers. These warehouses calculate their Gross Requirements (GR) over a future period of time based on forecasts and customer backorders. The gross requirements for a distribution warehouse (DW1) is as shown below. As indicated, the gross requirements for this warehouse for 8 periods into the future is 100 per period Distribution Warehouse - DW1
Periods
1
2
3
4
5
6
7
8
GR
100
100
100
100
100
100
100
100
If there are any expected re-supply / replenishment orders from the central warehouse to the distribution warehouse, they are considered as Scheduled Receipts (SR).
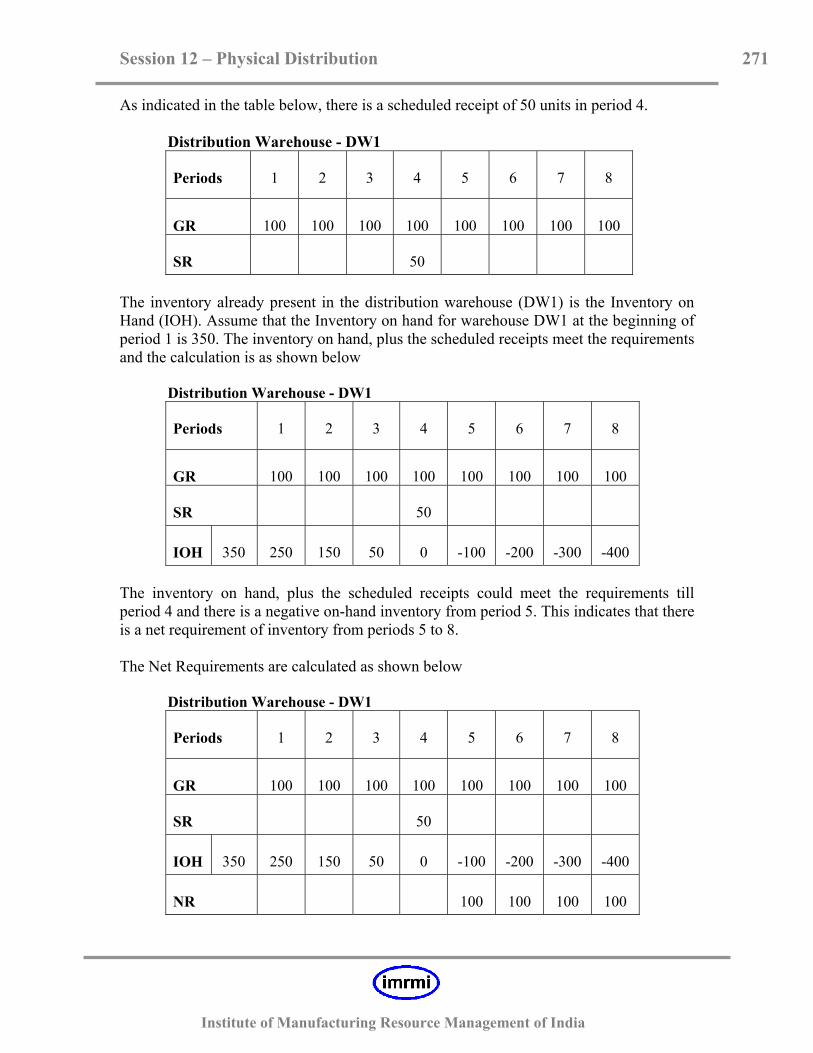
Session 12 – Physical Distribution 271
Institute of Manufacturing Resource Management of India
As indicated in the table below, there is a scheduled receipt of 50 units in period 4. Distribution Warehouse - DW1
Periods
1
2
3
4
5
6
7
8
GR
100
100
100
100
100
100
100
100
SR
50
The inventory already present in the distribution warehouse (DW1) is the Inventory on Hand (IOH). Assume that the Inventory on hand for warehouse DW1 at the beginning of period 1 is 350. The inventory on hand, plus the scheduled receipts meet the requirements and the calculation is as shown below Distribution Warehouse - DW1
Periods
1
2
3
4
5
6
7
8
GR
100
100
100
100
100
100
100
100
SR
50
IOH
350
250
150
50
0
-100
-200
-300
-400
The inventory on hand, plus the scheduled receipts could meet the requirements till period 4 and there is a negative on-hand inventory from period 5. This indicates that there is a net requirement of inventory from periods 5 to 8. The Net Requirements are calculated as shown below Distribution Warehouse - DW1
Periods
1
2
3
4
5
6
7
8
GR
100
100
100
100
100
100
100
100
SR
50
IOH
350
250
150
50
0
-100
-200
-300
-400
NR
100
100
100
100
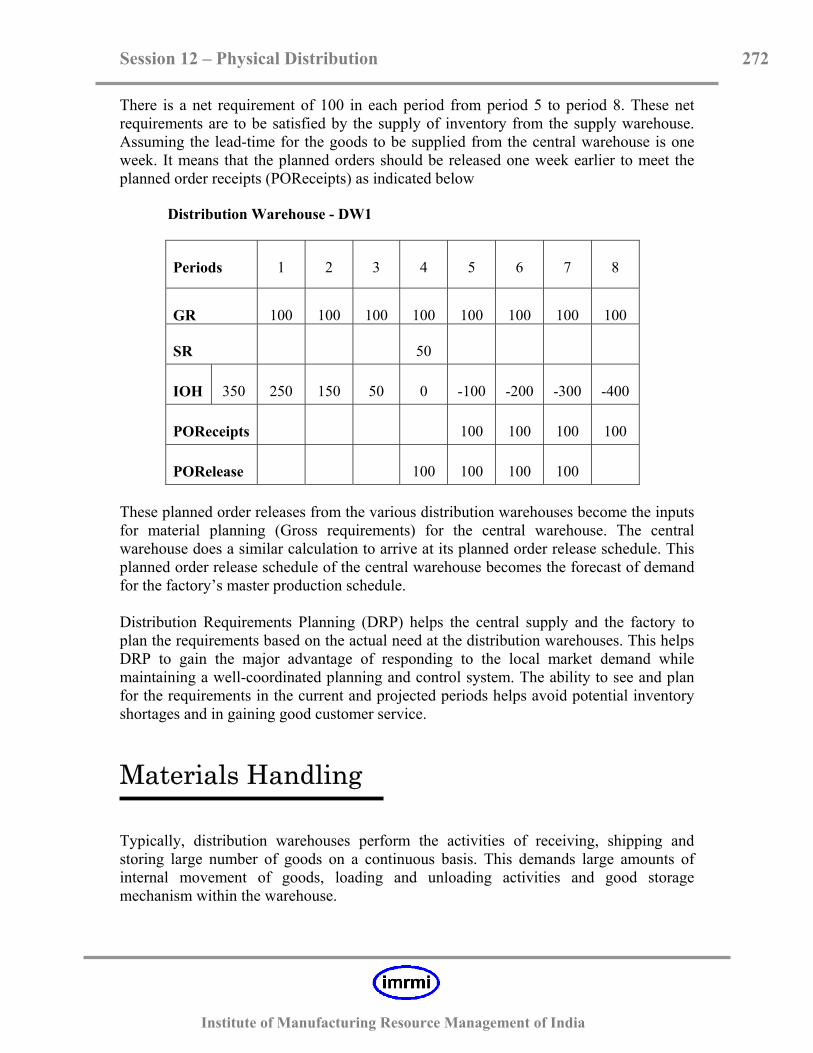
Session 12 – Physical Distribution 272
Institute of Manufacturing Resource Management of India
There is a net requirement of 100 in each period from period 5 to period 8. These net requirements are to be satisfied by the supply of inventory from the supply warehouse. Assuming the lead-time for the goods to be supplied from the central warehouse is one week. It means that the planned orders should be released one week earlier to meet the planned order receipts (POReceipts) as indicated below Distribution Warehouse - DW1
Periods
1
2
3
4
5
6
7
8
GR
100
100
100
100
100
100
100
100
SR
50
IOH
350
250
150
50
0
-100
-200
-300
-400
POReceipts
100
100
100
100
PORelease
100
100
100
100
These planned order releases from the various distribution warehouses become the inputs for material planning (Gross requirements) for the central warehouse. The central warehouse does a similar calculation to arrive at its planned order release schedule. This planned order release schedule of the central warehouse becomes the forecast of demand for the factory’s master production schedule. Distribution Requirements Planning (DRP) helps the central supply and the factory to plan the requirements based on the actual need at the distribution warehouses. This helps DRP to gain the major advantage of responding to the local market demand while maintaining a well-coordinated planning and control system. The ability to see and plan for the requirements in the current and projected periods helps avoid potential inventory shortages and in gaining good customer service.
Materials Handling Typically, distribution warehouses perform the activities of receiving, shipping and storing large number of goods on a continuous basis. This demands large amounts of internal movement of goods, loading and unloading activities and good storage mechanism within the warehouse.
Session 12 – Physical Distribution 273
Institute of Manufacturing Resource Management of India
Material handling is responsible for :
◊ Designing efficient processes required for handling and moving goods. ◊ Using these processes for the actual handling and movement of goods from / to
the required locations to / from the storage areas. Of the various considerations in designing and using an effective process for materials handling, the most important aspect is the selection of the suitable material handling equipment. Though there are large variations in the types of material handling equipment, by the nature of their functions they can broadly be classified into the following categories : Conveyors : Conveyors are used to handle material movement between fixed locations. The movement of material is continuous and in a fixed path and hence these equipment occupy continuous space along the area of operation. This equipment is made up of fairly automated components and is expensive. Cost of procuring and using this equipment must be justified by the throughput between the locations. Few types of conveyors include belt conveyors, roller conveyors, bucket conveyors, pneumatic conveyors Industrial Trucks : Industrial trucks are flexible in their movement between various locations and hence are a preferred choice for the general movement and handling of goods. They are also designed to carry different types of goods and to put / retrieve the goods to / from the storage areas. They are usually hand or battery operated and hence suitable for indoor transportation of goods. Few types of industrial trucks include platform trucks, forklift trucks. Cranes and Hoists : These equipment are not fixed between two points but are restricted to a defined area of operation within which they have the flexibility in handling and moving goods. They help in handling and moving goods both horizontally and vertically and are effective in utilizing overhead space. They are specifically used in handling and moving large and heavy goods and equipment across locations. Overhead cranes find their application in most of the heavy engineering industries making compressors, pressure vessels, foundries, steel mills etc., Some of the applications of hoists include industries involved in wire drawing and chemical cleaning processes. Few types of cranes and hoists include jib cranes, bridge cranes, chain hoists, electric hoists.
Protective Packaging Generally, goods move through the distribution system before reaching the end customers. It is important that these goods are safely and appropriately handled and moved through the distribution system before final delivery. Packaging function caters to these requirements and performs the following activities

Session 12 – Physical Distribution 274
Institute of Manufacturing Resource Management of India
◊ Information : The package conveys the relevant information about the identity of the product within. It also conveys information about the required attributes of the product viz., its size, shape, handling instructions, storage requirements etc.,
◊ Protection : During their movement and storage, goods are subjected to damages
in the form of vibrations, heat, light, compressions, breakages, improper ventilation, etc., Packaging plays an important role in ensuring appropriate protection to the products within against these damages.
◊ Containment : Goods are held and moved in varying sizes of containers through
the distribution channel. Packaging should facilitate the appropriate fitment of goods into these different containers to economize handling and moving and also to reduce the damages to the goods in transit.
◊ System Efficiency : Packaging contributes to improving the distribution system
efficiency by gaining on the economies of transportation and handling of products, minimizing the possible damages to the products and improved handling and transaction management of products based on clear identification of packaged products.
Unitization Unitization is the process of consolidating individual products into bigger units in order to achieve reduction in material handling and labour costs and in improving the transportation efficiency of the products. These bigger units are called unit loads. Unit loads can represent containers, boxes, cartons, racks, pallets and other possible packaging forms. Unitization can be successive where the initial products can be consolidated in a unit load, these unit loads can further be consolidated into bigger unit loads and so on. Effective unitization requires the products to be consolidated into the appropriate unit loads. To achieve this, it is necessary to understand the dimensional relationships between the products and their subsequent unit loads. As an example, consider a soft drink bottle to be a product. 20 such bottles are handled in a crate, the racks in one transport vehicle handles 100 crates and the distribution storage area is designed to hold 10 racks. One product = one soft drink bottle One crate = 20 soft drink bottles One rack = 100 crates = 2000 soft drink bottles Storage area = 10 racks = 1000 crates = 20000 soft drink bottles In addition to the advantages of material handling and transport efficiency, unitization also helps in reducing the chances of damage to the products.

Session 12 – Physical Distribution 275
Institute of Manufacturing Resource Management of India
Order Processing and Communication In a typical business transaction, a customer conveys his requirement to the supplier. The supplier communicates the availability of goods and his terms and conditions. If agreed, customer sends an order. Supplier processes the order and ships the required goods. Supplier generates an invoice against the shipped material. Customer makes the payment against the invoice. In the above business transaction, there are two predominant activities
◊ Processing of the order by the supplier ◊ Regular communication between the supplier and the customer
The function ‘Order Processing and Communication” takes care of these two activities by serving as the primary contact between the customer and the supplier and by providing the channel into which customer orders are placed, allocated, tracked and from which goods are allocated against the customer orders. It hence includes the various activities of fulfilling customer requirements. For an organization to gain a competitive advantage and a high customer service level, its ‘order processing and communication’ function should be effective in terms of providing speedy service, correct and timely response relating to orders and tracking information, and accurate order processing The following are the sequence of activities executed by the order processing function
◊ Receiving the order : Customer orders generated through the sales / marketing function or by direct interaction of the customer with the supplier are validated for the item and customer information and are accepted.
◊ Making the Order Entry : The various details of the order requirement viz.,
customer details, ordered quantity, place and time of requirement, terms and conditions of the order are recorded.
◊ Allocating inventory : Inventory is allocated to the order from the available on-
hand inventory. The allocated inventory is reserved for this order till further process.
◊ Picking the goods : Based on the allocations done, the corresponding goods are
withdrawn from the storage areas and are moved to the staging area for shipping.
◊ Shipping the order : The required shipping documents are generated and the goods are loaded on to a transportation vehicle and shipped to the customer.
Session 12 – Physical Distribution 276
Institute of Manufacturing Resource Management of India
◊ Making the invoice : An invoice against the shipped goods is generated and the accounts receivable function is updated.
◊ Closing the Order : The customer makes the payment against this invoice after
he receives the goods and the order is then closed and loaded into history. The communication aspect should be efficient in responding to the customer requirement and must provide the customer with accurate and timely tracking information about the orders being processed.
Physical Distribution Interfaces After the goods are manufactured, physical distribution system is responsible for the flow of these goods from manufacturing to the end customer and hence acts as a link between manufacturing and the end customer. The activities of the physical distribution system hence have interfaces with the production function and the marketing function. Physical Distribution and Marketing interfaces Physical distribution is concerned with ensuring the product is in the right place at the right time. The ‘Place’ aspect caters to one of the ‘4Ps’ of marketing mix and hence physical distribution is recognized as a critical area of overall marketing management. Marketing function primarily focuses on defining the markets, understanding the sales potential of a market place and facilitating sales, catering to market growth and decline conditions, coordinating product pricing and promotion activities etc., Based on the marketing outcome, Physical distribution with its associated activities of warehousing, transportation, distribution inventories, packaging, and order processing help in the actual supply of goods to the customer, realizing the time and place aspects. Working in tandem with marketing, an efficient physical distribution system helps
◊ In attaining very high customer service levels ◊ In improving the competitive advantage of a company by delivering goods at the
required place and time at minimum transportation costs ◊ In achieving competitive pricing of the products

Session 12 – Physical Distribution 277
Physical Distribution and Production interfaces Physical Distribution is responsible for the movement of goods from the production function to the end customer. The movement of these goods, in the simplest form is generally from the production facility to a factory warehouse. From the factory warehouse to distribution warehouses. From the distribution warehouses to the end customers. The demand for goods originates from the end customer. This creates demand on the distribution warehouses, which can be uniform and continuous. The distribution warehouses, create demand on the factory warehouse for replenishment and this demand is not uniform. The factory warehouse creates demand at the manufacturing facility and this demand is also not uniform and affects the schedule of the plant. The efficiency of the production function is dependent on the distribution system and hence it is important to implement the required distribution system in order to gain better control and coordination.
Transportation Costs In a physical distribution system, transportation function is concerned with the movement of goods from the factory to the end customer through a number of intermediaries. In a typical distribution setup, the finished goods are shipped to the factory warehouse, from the factory warehouse, the goods are shipped to the distribution warehouses, from the distribution warehouses the goods are sent to local storage. From the local storage, the goods are sent to the final customers.
Factory
Warehouse
DistributionWarehouse
Local
Delivery
CUSTOMER
M A N U F A C T U R I N G
Institute of Manufacturing Resource Management of India
Figure 12.7 - Transportation in a Physical Distribution System

Session 12 – Physical Distribution 278
Institute of Manufacturing Resource Management of India
An efficient transportation system helps attain a high customer service level and contributes in gaining a competitive advantage by being cost effective in their operations. This requires transportation to understand and analyse the various costs of the system, which further help in gaining economies of transportation by selecting the appropriate transportation mode, optimizing on the transportation capacity, transportation routes etc., The following are the costs associated with the transportation function :
◊ Line – Haul Costs ◊ Pickup and Delivering Costs ◊ Handling Costs ◊ Billing and Collection Costs
Line – Haul Costs : In any transportation mode, the transportation vehicle has a defined capacity of holding and transporting goods and incurs a cost while transporting the goods from one point to the other in the distribution system. The cost incurred is the Line – haul cost. Considering the example of a truck as the transportation vehicle, it can accommodate upto a defined capacity of goods in terms of weight or physical dimensions or both and moves these goods over road, between the different points of the distribution system. For transporting the goods, the truck incurs certain costs in the form of fuel, driving charges, depreciation charges etc. Irrespective of the amount of goods it carries for transportation, it incurs the same costs. These costs vary only based on the distance moved. Hence the line-haul costs depend directly on the distance moved and not on the amount of goods carried. The costs are then distributed to the goods carried. Shipping full loads hence helps to optimize on the line-haul costs. In cases where the volume of goods meets the dimensional capacity but the weight is less that the capacity of the vehicle, the density of the products should be increased. This can be achieved through nesting of products (ex., plastic cups, trolleys in a supermarket etc) or by shipping unassembled products (ex., collapsible furniture, bicycles etc)

Session 12 – Physical Distribution 279
Institute of Manufacturing Resource Management of India
A furniture manufacturing company would like to evaluate the benefits of Shipping one of its products ‘collapsible sofas’ in unassembled form. The Line-haul cost is Rs.10 per km. The truck can accommodate 20 assembled sofas. The truck can accommodate 60 sofas in unassembled form. If the sofas are to be shipped to the furniture showroom 100 kms away Calculate, the line-haul cost per assembled sofa, the line-haul cost per unassembled sofa and the saving per sofa. Solution : Line-haul cost per assembled sofa = Rs. 10 ÷ 20 = Rs 0.5 per sofa per km Line-haul cost per unassembled sofa = Rs. 10 ÷ 60 = Rs 0.167 per sofa per km Saving per km per sofa = Rs 0.5 – Rs. 0.167 = Rs. 0.333 Saving per sofa for the trip of 100 kms = Rs. 0.333 x 100 = Rs. 33.3 Figure 12.8 - Problem on Line-haul calclation
Pickup and Delivering Costs : As part of the transportation function, goods have to be picked up from the supplier / manufacturing company and delivered at the destination. The carrier transporting the goods also spends time for the activities of picking up the goods and delivering the goods. In addition to the line-haul costs, the carrier also charges for the weight picked up and delivered. Consolidating the goods and picking them up help to optimize on the pickup and delivering costs. Handling Costs : If goods are transported from the supplier / manufacturer to the customer through a number of intermediaries, the goods must be unloaded, handled, sorted and consolidated if required and loaded at each of these intermediaries. These activities incur handling costs at each intermediary and the amount of handling costs depend on the number of packages handled at each intermediary and the number of times the handling activity is executed which depends on the number of intermediaries. Consolidating shipments into packages help to reduce the number of packages to be handled and hence contribute to optimize the handling costs.

Session 12 – Physical Distribution 280
Institute of Manufacturing Resource Management of India
Billing and Collection Costs : In the transportation function, when the goods are picked up there are additional costs incurred which are administrative in nature and relate to preparing the necessary shipping documents and generating the invoice for the goods. These costs are incurred each time the goods are picked and hence reducing the number of pickups by means of consolidation helps reduce the billing and collection costs. Total Costs Line-haul Cost Pickup and delivery, Handling, and Billing and collection Distance travelled Figure 12.9 - Total Cost of Transportation Among the elements of the total transportation costs, the line-haul costs depend directly on the distance moved and hence constitute the variable cost. The costs of pickup and delivery, handling, and billing and collection are fixed and constitute the fixed costs. In determining the transportation charges, the transportation carrier takes into consideration the above fixed and variable costs. In addition, if the carrier has to take certain precautions and responsibility based on the commodity, its value, packaging methods, product characteristics like perishability, fragility etc., an additional amount can be levied.
Fixed Costs
Session 12 – Physical Distribution 281
Institute of Manufacturing Resource Management of India
Key Terminology 01) ABC Inventory Control 02) Customer Service 03) Distribution Inventory 04) Distribution Requirements Planning (DRP) 05) Distribution Resource Planning (DRP II) 06) Distributor 07) In-transit Inventory 08) Inventory 09) Inventory Control 10) Level of Service 11) Order Quantity 12) Package-to-order 13) Packing and Marking 14) Physical Distribution 15) Pipeline Inventory 16) Pull System 17) Push System 18) Receipt 19) Record accuracy 20) Replenishment Lead Time 21) Transit Time 22) Transportation Inventory 23) Utilization 24) Value Added 25) Warehousing
Session 12 – Physical Distribution 282
Institute of Manufacturing Resource Management of India
Practice Questions – Session 12 Question 1 : Which of the following activities is not part of physical distribution?
A) Transportation B) Capacity Planning C) Warehousing D) Order Entry
Correct Answer is: ------------------------------------------------------------------------------------------------------------ Question 2 : All of the following are part of Physical Distribution except :
A) Supplier Inventory B) Material Handling C) Order Entry D) Finished Goods Inventory
Correct Answer is: ------------------------------------------------------------------------------------------------------------ Question 3 : Which among the following transportation cost elements is a variable cost :
A) Line – Haul B) Picking and Delivery C) Terminal Handling D) Billing and Collecting
Correct Answer is: ------------------------------------------------------------------------------------------------------------ Question 4 : For a Truckload (TL) shipment of a particular material from location A to location B the line-haul cost is Rs. 5000. On the return journey, if the truck fills up the same material but exactly half the previous load, the line-haul cost is :
A) Rs. 1250 B) Rs. 2500 C) Rs. 5000 D) Rs. 3750
Correct Answer is: ------------------------------------------------------------------------------------------------------------

Session 12 – Physical Distribution 283
Institute of Manufacturing Resource Management of India
Question 5 : Which among the following is the best suitable transportation mode to move large volumes of bulky goods over long distances :
A) Rail B) Road C) Air D) None of the above
Correct Answer is: ------------------------------------------------------------------------------------------------------------ Question 6 : Shipments from the distribution centers / warehouses are broken down into smaller shipments to be send to local markets. This process is known as :
A) Consolidation B) Product Mixing C) Break-Bulk D) Dispersion
Correct Answer is: ------------------------------------------------------------------------------------------------------------ Question 7 : In which system does each distribution center / warehouse act independently in determining its own requirements :
A) Decentralized System B) Push System C) Distribution Requirements Planning (DRP) D) Centralized System
Correct Answer is: ------------------------------------------------------------------------------------------------------------ Question 8 : Distribution Requirements Planning translates the logic of which of the following :
A) MRP II B) MRP C) DRP D) CRP
Correct Answer is: ------------------------------------------------------------------------------------------------------------

Session 12 – Physical Distribution 284
Institute of Manufacturing Resource Management of India
Question 9 : Comparatively, which of the following Distribution Inventory Management Systems has the drawback of not able to react to local demand :
A) Pull System B) Push System C) Distribution Requirements Planning (DRP) D) None of the above
Correct Answer is: ------------------------------------------------------------------------------------------------------------ Question 10 : Which of the following is not exactly a material handling equipment :
A) Conveyors B) Transportation Trucks C) Industrial Trucks D) Cranes and Hoists
Correct Answer is: ------------------------------------------------------------------------------------------------------------
285
Institute of Manufacturing Resource Management of India
Solutions
To
Practice Questions

Solutions – Practice Questions 286
Institute of Manufacturing Resource Management of India
USolutions To Practice Questions
Session 1 (Business Concepts)
Session 2 (Management Approaches)
Session 3 (Demand Planning)
1. D 2. B 3. A 4. C 5. B 6. C 7. C 8. B 9. B
10. A
1. D 2. A 3. C 4. C 5. C 6. A 7. D 8. B 9. C
10. D
1. D 2. B 3. D 4. C 5. D 6. D 7. C 8. D 9. D
10. B
Session 4 (Design)
Session 5 (Capacity Management)
Session 6 (Planning)
1. B 2. A 3. B 4. C 5. D 6. C 7. D 8. B 9. D
10. C
1. D 2. D 3. D 4. B 5. C 6. C 7. C 8. D 9. B
10. D
1. B 2. A 3. B 4. B 5. C 6. D 7. A 8. C 9. D
10. A

Solutions – Practice Questions 287
Institute of Manufacturing Resource Management of India
Session 7 (Execution and Control)
Session 8 (Performance Measurement)
Session 9 (Fundamentals of
Inventory Management)
1. C 2. A 3. C 4. C 5. D 6. C 7. B 8. D 9. B
10. B
1. A 2. D 3. C 4. D 5. A 6. B 7. C 8. B 9. C
10. D
1. D 2. C 3. A 4. B 5. A 6. D 7. B 8. A 9. B
10. A
Session 10
(Inventory Management) Session 11
(Purchasing) Session 12
(Physical Distribution)
1. C 2. B 3. A 4. A 5. D 6. A 7. B 8. A 9. C
10. B
1. D 2. D 3. B 4. D 5. A 6. A 7. C 8. A 9. D
10. C
1. B 2. A 3. A 4. C 5. A 6. C 7. A 8. B 9. B
10. B

288
Institute of Manufacturing Resource Management of India
Basics of Supply Chain Management
Sample Test
BSCM – Sample Test 289
Institute of Manufacturing Resource Management of India
UBasics of Supply Chain Management - Sample Test Number of Questions : 110 Time : 3 hours ------------------------------------------------------------------------------------------------------------ Question #: 1 Why is manufacturing important to the economy:
A) It generates wealth and adds value to products. B) It uses natural resources and prevents waste. C) It decreases employment and generates wealth. D) It prevents waste and decreases employment.
Correct Answer is: ------------------------------------------------------------------------------------------------------------ Question #: 2 Which of the following strategies produce the longest delivery lead time:
A) Make - to - order. B) Assemble - to - order. C) Make - to - stock. D) Continuous manufacturing.
Correct Answer is: ------------------------------------------------------------------------------------------------------------ Question #: 3 Which of the following are primary activities of manufacturing planning and control:
A) Inventory Management and Cost Information. B) Sales Support and Cost Information. C) Production Planning and Inventory Management.
D) Sales Support, Implementation and Control. Correct Answer is: ------------------------------------------------------------------------------------------------------------ Question #: 4 In a purchasing system, which of the following originates with the department or person who will be the ultimate user:
A) A Purchase Requisition. B) A Purchase Order.
BSCM – Sample Test 290
Institute of Manufacturing Resource Management of India
C) Vendor Selection. D) A Request for Quotation. Correct Answer is: ------------------------------------------------------------------------------------------------------------ Question #: 5 Which of the following is a component of a demand pattern:
A) Mean Absolute Variation. B) Seasonal Variation. C) Average Variation. D) Standard Deviation.
Correct Answer is: ------------------------------------------------------------------------------------------------------------ Question #: 6 Product A is made from components B and C. Component B is made from parts D and E. Which items should be forecast:
A) Only A. B) A, B, and C. C) D and E. D) B, C, D, and E.
Correct Answer is: ------------------------------------------------------------------------------------------------------------ Question #: 7 Which of the following is an objective of purchasing:
A) To keep many sources of supply available to ensure competitive pricing. B) To control budgetary expenditures of all employees through sound purchase
order control. C) To obtain goods and services of the required specification and quality. D) To ensure that goods are always purchased at the lowest price.
Correct Answer is: ------------------------------------------------------------------------------------------------------------ Question #: 8 Which of the following equation is correct:
A) Assets = Liabilities – Owner’s Equity. B) Income = Revenue - Liabilities.

BSCM – Sample Test 291
Institute of Manufacturing Resource Management of India
C) Owner’s Equity = Assets - Liabilities. D) Revenue = Cost of Goods Sold – General and Administrative Expense.
Correct Answer is: ------------------------------------------------------------------------------------------------------------ Question #: 9 The inventory turns ratio measures:
A) The amount of inventory needed to support sales growth. B) Obsolete inventory as a percent of sales. C) How effectively inventory is being used. D) The amount of space needed to store inventory.
Correct Answer is: ------------------------------------------------------------------------------------------------------------ Question #: 10 A bill of materials contains:
I. Components used to make a product.
II. Labor needed to build the product. III. Assemblies at various stages of production.
IV. Safety stock by item. A) I and II. B) I and III. C) II and III. D) III and IV.
Correct Answer is: ------------------------------------------------------------------------------------------------------------ Question #: 11 Which of the following activities is not part of physical supply /distribution?
A) Transportation B) Warehousing C) Order Entry
D) Capacity Planning Correct Answer is: ------------------------------------------------------------------------------------------------------------ Question #: 12 All of the following are part of physical Supply / distribution except:

BSCM – Sample Test 292
Institute of Manufacturing Resource Management of India
A) Supplier inventory. B) Material handling. C) Order entry.
D) Finished goods inventory. Correct Answer is: ------------------------------------------------------------------------------------------------------------ Question #: 13 A company's strategic plan:
A) Provides the manufacturing plan for families of end items. B) Outlines the sales plan for the next year. C) Is a statement of goals and objectives for a long range period. D) outlines new products for the next year.
Correct Answer is: ------------------------------------------------------------------------------------------------------------ Question #: 14 Production plans have all the following except:
A) Shipment plan. B) Product families. C) Inventory plan. D) Weekly production.
Correct Answer is: ------------------------------------------------------------------------------------------------------------ Question #: 15 Which of the following statements is most correct?
A) The MPS shows families of products. B) The MPS has more detail than the production plan.
C) The production plan has more detail than the MPS. D) The production plan rolls up to equal the MPS.
Correct Answer is: ------------------------------------------------------------------------------------------------------------ Question #: 16 A closed loop MRP system can be best defined as:
A) Action taken by a planner to approve planned orders.

BSCM – Sample Test 293
Institute of Manufacturing Resource Management of India
B) Re-planning of capacity to accommodate restraints. C) Integrated planning and control system with feedback from the bottom-up. D) Integrated systems which include financial software, finite capacity and
logistics. Correct Answer is: ------------------------------------------------------------------------------------------------------------ Question #: 17 You are working as a Master Scheduler, in a discrete manufacturing company. A large customer has asked if you can deliver an order, but you have some short term capacity constraints. Which of the following actions could be taken so the order can be delivered?
I. People could be hired. II. Overtime could be worked.
III. Inventory could be built in slow times. IV. Work could be subcontracted.
A) I, II and III. B) II, III and IV. C) I, III and IV. D) I, II and IV. Correct Answer is: ------------------------------------------------------------------------------------------------------------ Question #: 18 Which of the following are strategies to use in developing a production plan?
I. Chase strategy II. Delphi strategy
III. Level strategy IV. Backlog strategy A) I and II. B) I and III. C) II and IV. D) III and IV. Correct Answer is: ------------------------------------------------------------------------------------------------------------ Question #: 19 A company needs to produce 4000 units over the next two months. There are 21 working days the first month and 19 working days the second month. What must the daily rate be with a level strategy?

BSCM – Sample Test 294
Institute of Manufacturing Resource Management of India
A) 50 B) 75 C) 100 D) 125
Correct Answer is: ------------------------------------------------------------------------------------------------------------ Question #: 20 The MPS is used to facilitate communication between which two groups?
A) Manufacturing and logistics B) Sales and marketing C) Manufacturing and finance D) Sales and manufacturing
Correct Answer is: ------------------------------------------------------------------------------------------------------------ Question #: 21 If the lead time is 1 week, the review period is 1 week, the average demand is 100 units per week, and the safety stock is 50 units, the target level will be:
A) 150 units. B) 200 units. C) 250 units. D) 300 units.
Correct Answer is: ------------------------------------------------------------------------------------------------------------ Question #: 22 Which forecasting technique takes the average demand for some past number of periods: A) Trend Time Average. B) Moving Average. C) Demand Smoothing. D) Qualitative Analysis.
Correct Answer is: ------------------------------------------------------------------------------------------------------------ Question #: 23 Which basic production planning strategy will build inventory and avoid the costs of excess capacity:

BSCM – Sample Test 295
Institute of Manufacturing Resource Management of India
A) Chase Strategy. B) Level Strategy. C) Cycle Counting Strategy.
D) Demand Matching Strategy. Correct Answer is: ------------------------------------------------------------------------------------------------------------ Question #: 24. Which of the following is an advantage of cycle counting: A) Timely detection and correction of problems. B) Reduction of direct labor costs. C) Use of spare labor. D) Replenishment of inventory. Correct Answer is: ------------------------------------------------------------------------------------------------------------ Question #: 25 When an Invoice is received for payment, it is compared with which of the following documents before payment is made:
A) The Bill of Lading. B) The Original Purchase Order. C) The Purchase Requisition. D) The Account Debit Memo posted at the time of entry.
Correct Answer is: ------------------------------------------------------------------------------------------------------------ Question #: 26 Which of the following statements is true regarding JIT:
A) It is a philosophy that relates to the way in which a manufacturing company organizes and operates its business.
B) It involves getting the goods to the customer as fast as possible at all costs. C) It is a culturally based method of management. D) It is concerned with adding cost to the product.
Correct Answer is: ------------------------------------------------------------------------------------------------------------ Question #: 27

BSCM – Sample Test 296
Institute of Manufacturing Resource Management of India
If the annual cost of goods sold is Rs. 1,00,000 and the average inventory is Rs. 25,000. What is the turns ratio:
A) Rs. 75,000 B) 0.25 C) 2.5 D) 4
Correct Answer is: ------------------------------------------------------------------------------------------------------------ Question #: 28 Which of the following is considered as ordering costs:
A) Production Control Costs. B) Capital Costs. C) Risk Costs. D) Obsolescence Costs.
Correct Answer is: ------------------------------------------------------------------------------------------------------------ Question #: 29 Which of the following are inputs to a realistic MPS?
I. Production plan II. Forecasts for end items
III. Product costs for end items IV. Capacity constraints
A) I, II and III. B) I, II and IV. C) II, III and IV. D) I, III and IV. Correct Answer is: ------------------------------------------------------------------------------------------------------------ Question #: 30 Which of the following are objectives when establishing the MPS?
I. Efficient use of resources II. Efficient final assembly III. High customer service levels IV. Efficient use of inventory
A) I, II and III.

BSCM – Sample Test 297
Institute of Manufacturing Resource Management of India
B) I, III and IV. C) II, III and IV. D) I, III and IV. Correct Answer is: ------------------------------------------------------------------------------------------------------------ Question #: 31 Rough cut capacity planning can be best described as:
A) Checking to be certain critical resources are available to support the preliminary MPS.
B) Making sure warehouse space is available for raw materials. C) Making certain the load at each work center is less than capacity. D) Ensuring resources are available by product family.
Correct Answer is:
------------------------------------------------------------------------------------------------------------ Question #: 32 Which of the following manufacturing environments would consumer products, such as film, food etc. be classified?
A) Assemble to order B) Engineer to order C) Make to order D) Make to stock
Correct Answer is: ------------------------------------------------------------------------------------------------------------ Question #: 33 Many different end items are made from a small number of components. What manufacturing environment would this be?
A) Make to stock B) Make to order
C) Assemble to order D) Engineer to order
Correct Answer is: ------------------------------------------------------------------------------------------------------------ Question #: 34 Final Assembly Scheduling usually occurs when:

BSCM – Sample Test 298
Institute of Manufacturing Resource Management of India
A) A customer order is received. B) Planning a build schedule. C) The MPS is established. D) Capacity is constrained.
Correct Answer is: ------------------------------------------------------------------------------------------------------------ Question #: 35 The minimum planning horizon for the MPS should be:
A) Twelve months in weekly amounts. B) Equal to the longest cumulative lead time. C) As long as it takes to acquire new capacity. D) Twice the longest component lead time.
Correct Answer is: ------------------------------------------------------------------------------------------------------------ Question #: 36 In make to stock requirements, customers orders are satisfied from:
A) Available capacity B) Work in process inventory- C) Finished goods inventory. D) Raw material inventory.
Correct Answer is: ------------------------------------------------------------------------------------------------------------ Question #: 37 Available to promise can be best defined as:
A) Inventory and planned production not already committed. B) Customer orders inside lead time which have been promised. C) Inventory not already committed. D) Capacity which is not used and therefore is available.
Correct Answer is: ------------------------------------------------------------------------------------------------------------ Question #: 38 Week 1 2 3 4 5 Customer Orders 60 30 20 40 MPS 110 110
BSCM – Sample Test 299
Institute of Manufacturing Resource Management of India
ATP 20 50 Based on the above, what action can the planner take regarding an order for 60 in week three?
A) Reject the order for 60; tell the customer 50 is acceptable. B) Accept the order for week 4 for 60. C) Accept the order for week 2 for 60. D) Accept the order for week 3 for 60.
Correct Answer is: ------------------------------------------------------------------------------------------------------------ Question #: 39 Independent demand can be defined by all of the following except:
A) Demand not related to demand from higher level assemblies. B) Forecasted demand. C) Demand calculated based on present demand. D) Demand from customer orders.
Correct Answer is: ------------------------------------------------------------------------------------------------------------ Question #: 40 Which of the following would best define dependent demand?
I. Demand which is dependent on the forecast II. Demand which is dependent on demand for a higher level assembly
III. Demand which is calculated A) I only. B) I and II. C) II and III. D) III only. Correct Answer is: ------------------------------------------------------------------------------------------------------------ Question #: 41 Which of the following is cost of carrying inventory:
A) Capital Costs and Production Control Costs. B) Capital Costs and Storage Costs. C) Production Control Costs and Purchase Costs. D) Storage Costs and Purchase Costs.

BSCM – Sample Test 300
Institute of Manufacturing Resource Management of India
Correct Answer is: ------------------------------------------------------------------------------------------------------------ Question #: 42 What is the portion of inventory or production that is not committed to customer orders called: A) Free Stock. B) Available – to - Promise. C) Excess Production. D) Waste.
Correct Answer is: ------------------------------------------------------------------------------------------------------------ Question #: 43 Which of the following causes forecast error:
A) Random Variation from the average demand. B) Errors in forecasting seasonality. C) Differences in lead times.
D) Differences between sales and demand. Correct Answer is: ------------------------------------------------------------------------------------------------------------ Question #: 44 For the purposes of production planning, product groups should be established on the basis of:
A) Market Segments. B) Similarity of Manufacturing Process. C) The availability of Materials.
D) The availability of Machinery. Correct Answer is: ------------------------------------------------------------------------------------------------------------ Question #: 45 Which of the following is a characteristic of the MPS:
A) It facilitates Forecasting. B) It works with Families of Products. C) It is an agreed-upon plan between Production and Marketing. D) It cannot be used for Order Promising.

BSCM – Sample Test 301
Institute of Manufacturing Resource Management of India
Correct Answer is: ------------------------------------------------------------------------------------------------------------ Question #: 46 In developing the standard EOQ formula, which of the following assumptions is made:
A) Demand for the item is relatively uniform. B) Replenishment is in lots or batches that arrive all at once. C) Lead Time is constant. D) All the above are assumed.
Correct Answer is: ------------------------------------------------------------------------------------------------------------ Question #: 47 What is an inventory record system that keeps a continuous account of transactions as they occur?
A) Perpetual Inventory System. B) Period Inventory System. C) Two-bin System. D) Safety Stock System.
Correct Answer is: ------------------------------------------------------------------------------------------------------------ Question #: 48 The quantity in a JIT pull signal:
A) Is always the same as upstream pull signal. B) Is always one. C) Can be any quantity. D) Often includes a small safety factor.
Correct Answer is: ------------------------------------------------------------------------------------------------------------ Question #: 49 Material requirement's (MRP) major objective, in addition to calculating requirements is to:
A) Keep the order priorities current. B) Maintain the bill of materials. C) Calculate the inventory needed. D) Ensure forecasted demand is to be used.

BSCM – Sample Test 302
Institute of Manufacturing Resource Management of India
Correct Answer is: ------------------------------------------------------------------------------------------------------------ Question #: 50 Which of the following is not an input to MRP?
A) Master Production Schedule B) Inventory records C) Bills of material D) Capacity planning
Correct Answer is: ------------------------------------------------------------------------------------------------------------ Question #: 51 A where-used report provides a list of:
A) All work centers where a part is run. B) All parents where a component is used. C) All components where a parent is used. D) All planning bills.
Correct Answer is: ------------------------------------------------------------------------------------------------------------ Question #: 52 A pegging report is used to:
A) Trace the origin of demand for a component. B) Trace the capacity requirement for a part. C) Identify the quantity per for a particular parent. D) Establish the demand for a part.
Correct Answer is: ------------------------------------------------------------------------------------------------------------ Question #: 53 The Bill of Materials is used quite frequently in manufacturing. All of the following are uses of the BOM except:
A) Product costing. B) Planning. C) Calculating capacity. D) Engineering change control.
Correct Answer is:

BSCM – Sample Test 303
Institute of Manufacturing Resource Management of India
------------------------------------------------------------------------------------------------------------ Question #: 54 A firm planned order is used to:
A) Freeze the planned order against changes in quantity and time. B) Convert the planned order to a scheduled receipt. C) Simulate the projected inventory balance. D) Manipulate the data and quantity of the customer order.
Correct Answer is: ------------------------------------------------------------------------------------------------------------ Question #: 55 All of the following conditions will trigger an exception message except:
A) Changes in timing of a scheduled receipt. B) Changes in the inventory on hand balance due to cycle count adjustment. C) Changes in the forecast. D) Changes in the assigned planner.
Correct Answer is:
------------------------------------------------------------------------------------------------------------ Question #: 56 Of the following choices, which would be the preferred method to minimize system nervousness?
A) Increase the order quantities. B) Increase the lead time. C) Use firm planned orders. D) Ignore the exception messages.
Correct Answer is:
------------------------------------------------------------------------------------------------------------ Question #: 57 Available capacity can be best described as:
A) The ability of a resource to produce a quantity of output for a particular period. B) The amount of resource needed to produce the necessary output for a specified
time period. C) The amount of released work to a facility during a specified time period. D) The amount of load on a work center to produce the output necessary.
Correct Answer is:

BSCM – Sample Test 304
Institute of Manufacturing Resource Management of India
------------------------------------------------------------------------------------------------------------ Question #: 58 Capacity requirements planning (CRP) is concerned with which of the following?
I. Labor hours for a product family. II. Individual orders and individual work centers. III. Calculating work center loads. IV. Validating the capacity for the master production schedule.
A) I and II. B) I and III. C) II and III. D) III and IV.
Correct Answer is:
------------------------------------------------------------------------------------------------------------ Question #: 59 which of the following best describes a routing?
A) The path materials follow from beginning to end. B) The path work follows from work center to work center as it is completed. C) The path information transactions follow to be completed. D) The critical ratio calculated to determine whether jobs are on schedule.
Correct Answer is: ------------------------------------------------------------------------------------------------------------ Question #: 60 Available capacity can be determined two ways: measurement and calculation. Measured capacity is determined by which of the following methods?
A) Historical data B) Available time C) Machine utilization D) Machine efficiency
Correct Answer is: ------------------------------------------------------------------------------------------------------------ Question #: 61 Why is it important to track the forecast:
A) To compare the actual sales with the forecast. B) To improve the forecasting methods.

BSCM – Sample Test 305
Institute of Manufacturing Resource Management of India
C) To utilize actual sales data. D) To satisfy marketing’s need to know.
Correct Answer is: ------------------------------------------------------------------------------------------------------------ Question #: 62 Under which of the following circumstances will firms generally make to stock: A) Demand is unpredictable. B) Many product options exist. C) Required delivery times are shorter than the time needed to make the product. D) Customers require special engineering.
Correct Answer is: ------------------------------------------------------------------------------------------------------------ Question #: 63 If the order quantity is increased, which of the following occurs:
A) The cost of carrying inventory decreases and the cost of ordering increases. B) The cost of carrying inventory increases and the cost of ordering decreases. C) The cost of carrying inventory increases and the cost of ordering increases
D) The cost of carrying inventory decreases and the cost of ordering decreases Correct Answer is: ------------------------------------------------------------------------------------------------------------ Question #: 64 Safety stock will depend on which of the following:
A) Variability of demand. B) Cost of carrying inventory. C) Cost of placing an order.
D) Product obsolescence. Correct Answer is: ------------------------------------------------------------------------------------------------------------ Question #: 65 Which of the following statements is best:
A) Demand fluctuations that depend on the time of the year, week or day are called trend.

BSCM – Sample Test 306
Institute of Manufacturing Resource Management of India
B) The seasonal index is an estimate of how much the demand during the season will be above or below the average demand.
C) Seasonality always occurs in summer, winter, spring and fall. D) Random variation is constant from period to period.
Correct Answer is: ------------------------------------------------------------------------------------------------------------ Question #: 66 Which of the following is an objective of MPS:
A) To maximize utilization of equipment. B) To keep the sales department happy. C) To maintain the desired level of customer service. D) To minimize inventory investment.
Correct Answer is: ------------------------------------------------------------------------------------------------------------ Question #: 67 Which of the following is true about time fences in a MPS:
A) Changes far out in the planning horizon can be made with little or no cost to manufacturing.
B) In the “Frozen zone”, capacity and materials can easily be committed to new orders.
C) Changes in the near future on the planning horizon are less costly to make than changes far out.
D) The master planner should be authorized to make changes in the “frozen zone”. Correct Answer is: ------------------------------------------------------------------------------------------------------------ Question #: 68 TQM can reduce batch sizes by:
A) Reducing lead time. B) Using statistical analysis and destructive testing. C) Increasing per-order costs. D) Lowering fixed costs associated with batch-size calculations.
Correct Answer is: ------------------------------------------------------------------------------------------------------------

BSCM – Sample Test 307
Institute of Manufacturing Resource Management of India
Question #: 69 A work center has 4 machines operating 6 days for 8 hours per day. What is the available time?
A) 24 hours B) 32 hours C) 48 hours D) 192 hours
Correct Answer is :
------------------------------------------------------------------------------------------------------------ Question #: 70 A work center has 4 machines available 8 hours per day for 5 days per week. During the week, they produced for 128 hours. The utilization is:
A) 70% B) 75% C) 80% D) 85%
Correct Answer is:
------------------------------------------------------------------------------------------------------------ Question #: 71 A work center has 4 machines available for 8 hours per day, 5 days per week. The work center is utilized 100 hours but produces 120 hours of standard work. The efficiency of the work center is:
A) 50% B) 62.5% C) 75% D) 120%
Correct Answer is: ------------------------------------------------------------------------------------------------------------ Question #: 72 Which of the following best describes the term "load"?
A) Sum of the required times for all actual orders to be run at a work center for a specified time frame.
B) Sum of a required times for all planned orders to be run at a work center for a specified time frame.
C) Sum of the required times for all planned and actual orders to be run at a work center for a specified time period.

BSCM – Sample Test 308
Institute of Manufacturing Resource Management of India
D) Sum of the required times for all forecasted orders to be run at the work center for a specified time period.
Correct Answer is: ------------------------------------------------------------------------------------------------------------ Question #: 73 In order to back schedule, which of the following information is necessary? I. Quantity and due dates
II. Bill of materials sequence III. Setup and run times for each operation IV. Queue, wait, and move times
A) I, II, and III. B) I, III, and IV. C) II, III, and IV. D) I, II, and IV. Correct Answer is: ------------------------------------------------------------------------------------------------------------ Question #: 74 Production activity control can be best described as a:
A) Planning system. B) Execution system. C) Scheduling system. D) Ordering system.
Correct Answer is: ------------------------------------------------------------------------------------------------------------ Question #: 75 Dispatching can be best described as:
A) Routing the factory orders. B) Developing the work instructions. C) Releasing orders to the shop floor. D) Placing purchase orders with suppliers.
Correct Answer is: ------------------------------------------------------------------------------------------------------------ Question #: 76

BSCM – Sample Test 309
Institute of Manufacturing Resource Management of India
In a certain manufacturing environment, routings are fixed, and work centers are arranged in the order of the routings. The production at each work center takes a similar amount of time. This would describe:
A) Project manufacturing. B) Intermittent manufacturing. C) Flow manufacturing. D) Specialty manufacturing.
Correct Answer is: ------------------------------------------------------------------------------------------------------------ Question #: 77 In a certain manufacturing environment, flow of work is varied, workers must be flexible and throughput times are long. This describes:
A) Project manufacturing. B) Intermittent manufacturing. C) Flow manufacturing. D) Specialty manufacturing.
Correct Answer is:
------------------------------------------------------------------------------------------------------------ Question #: 78 All of the following are part of manufacturing lead time except:
A) Queue time. B) Wait time. C) Move time. D) Purchasing time.
Correct Answer is: ------------------------------------------------------------------------------------------------------------ Question #: 79 Of all the times associated with manufacturing lead times, which generally takes the most time in intermittent manufacturing?
A) Run time B) Setup time C) Queue time D) Move time
Correct Answer is: ------------------------------------------------------------------------------------------------------------

BSCM – Sample Test 310
Institute of Manufacturing Resource Management of India
Question #: 80 Operations are scheduled from the date the order is received. This would best describe:
A) Backward scheduling. B) Master scheduling. C) Capacity scheduling. D) Forward scheduling.
Correct Answer is: ------------------------------------------------------------------------------------------------------------ Question #: 81 The last operation is scheduled for completion on the due date. Other previous operations are scheduled so the due date can be met. This describes:
A) Backward scheduling. B) Master scheduling. C) Capacity scheduling. D) Forward scheduling.
Correct Answer is: ------------------------------------------------------------------------------------------------------------ Question #: 82 When the next operation is allowed to begin before the entire lot is completed on the previous operation, this is called:
A) Operation splitting. B) Operation overlapping. C) Work center overlapping. D) Work center splitting.
Correct Answer is: ------------------------------------------------------------------------------------------------------------ Question #: 83 Bottlenecks can be best defined as:
A) Work stations where available capacity is greater than required capacity. B) work stations where measured capacity is greater than required capacity. C) Work stations where required capacity is greater than available capacity. D) Work stations where the demonstrated capacity is greater than the measured
capacity. Correct Answer is:

BSCM – Sample Test 311
Institute of Manufacturing Resource Management of India
------------------------------------------------------------------------------------------------------------ Question #: 84 The total volume of production passing through a facility is defined as:
A) Total output. B) Finished goods production. C) Load. D) Throughput.
Correct Answer is:
------------------------------------------------------------------------------------------------------------ Question #: 85 All of the following are principles of bottlenecks except:
A) Using a non-bottleneck 100% of the time does not produce 100% utilization. B) The capacity of the production process depends on the capacity of the
bottleneck. C) Time saved at the bottleneck saves nothing. D) Capacity and demand must be considered together.
Correct Answer is: ------------------------------------------------------------------------------------------------------------ Question #: 86 Managing bottlenecks is extremely important to the throughput of the production facility. All of the following should be done to manage bottlenecks except:
A) Change the schedule frequently to meet customer promises. B) Maintain a time buffer before each bottleneck. C) Control the feed rate of material to the bottleneck. D) Increase the bottleneck capacity as much as possible.
Correct Answer is: ------------------------------------------------------------------------------------------------------------ Question #: 87 A shop packet will contain all of the following except:
A) Engineering drawings B) Bills of materials C) Route sheets D) Customer information

BSCM – Sample Test 312
Institute of Manufacturing Resource Management of India
Correct Answer is: ------------------------------------------------------------------------------------------------------------ Question #: 88 The input rate is controlled by:
A) The material flow from suppliers. B) The tooling requirements. C) The release of orders to the shop. D) The demand from customers.
Correct Answer is:
------------------------------------------------------------------------------------------------------------ Question #: 89 All of the following are objectives of purchasing except:
A) Buy goods and services in the right quantity and quality. B) Buy goods and services at the lowest cost possible. C) Maintaining good supplier relations. D) Schedule the suppliers plant so goods arrive on time.
Correct Answer is: ------------------------------------------------------------------------------------------------------------ Question #: 90 Which of the following are factors in selecting suppliers?
I. Technical capability. II. Financial reliability. III. Location IV. Service after the sale.
A) I, II and III. B) I, III and IV. C) II, III and IV. D) 1, II, III, and IV. Correct Answer is: ------------------------------------------------------------------------------------------------------------
Question #: 91 The ability to negotiate price is dependent on the type of product. Which of the following products could generally be negotiated?
A) Maintenance, repair and operating supplies

BSCM – Sample Test 313
Institute of Manufacturing Resource Management of India
B) Copper, cool, wheat, metal C) Standard electronic components D) Made to order motors
Correct Answer is: ------------------------------------------------------------------------------------------------------------ Question #: 92 Which of the following best describes the advantage of a planner/buyer position? I. Smooth flow of information between supplier and the factory.
II. Improved coordination of factory requirements and the supplier. III. Improved flow of materials through the factory. IV. Ability to match material requirements with suppliers capability.
A) I, II and IV. B) I, III and IV. C) II, III and IV, D) I, II, III and IV Correct Answer is: ------------------------------------------------------------------------------------------------------------ Question #: 93 In most companies, material purchases represent what percentage of the cost of the product?
A) 30% B) 50% C) 70% D) 90%
Correct Answer is: ------------------------------------------------------------------------------------------------------------ Question #: 94 Which of the following would be included in demand management?
I. Forecasted requirements II. Service parts requirements
III. Branch warehouse requirements IV. Interplant orders
A) I, II and III. B) II, III and IV. C) I, III and IV.
BSCM – Sample Test 314
Institute of Manufacturing Resource Management of India
D) 1, II, III, and IV.
Correct Answer is: ------------------------------------------------------------------------------------------------------------ Question #: 95 The purpose of a strategic business plan is:
A) To plan production by product family. B) To plan for business changes which take a long time. C) To establish customer requirements over the long term. D) To establish order promising strategies.
Correct Answer is:
------------------------------------------------------------------------------------------------------------ Question #: 96 All of the following are principles of forecasting except:
A) Forecasts are usually wrong. B) Forecasts are more accurate for end items. C) Forecasts should include an estimate of error. D) Forecasts are more accurate in the near term.
Correct Answer is: ------------------------------------------------------------------------------------------------------------ Question #: 97 When historical data is available in a company to use in forecasting future demand, the technique to use this data is:
A) Qualitative forecasting techniques B) Extrinsic forecasting techniques C) Intrinsic forecasting techniques D) Causal forecasting techniques
Correct Answer is: ------------------------------------------------------------------------------------------------------------ Question #: 98 Which of the following statements is best about inventory management:
A) Inventories and production must be managed together. B) Inventory is not important at the production planning level. C) Inventories are usually insignificant on the balance sheet.

BSCM – Sample Test 315
Institute of Manufacturing Resource Management of India
D) Inventory does not cost much to carry. Correct Answer is: ------------------------------------------------------------------------------------------------------------ Question #: 99 What are the materials used in the production process but that do not become a part of the product called :
A) Raw materials B) Work-in-process C) Finished goods D) Maintenance, Repair and Operating supplies
Correct Answer is: ------------------------------------------------------------------------------------------------------------ Question #: 100 What is the name given to the inventories of items that are purchased or manufactured in quantities greater than needed immediately :
A) Fluctuation inventory. B) Lot size inventory.
C) Transportation inventory. D) Scheduled receipts. Correct Answer is: ------------------------------------------------------------------------------------------------------------ Question #: 101 Which of the following are costs of carrying inventory:
A) Capital costs and production control costs. B) Capital costs and storage costs. C) Production control costs and purchase costs. D) Storage costs and purchasing costs.
Correct Answer is: ------------------------------------------------------------------------------------------------------------ Question #: 102 Which of the following are considered ordering costs:
A) Production control costs. B) Capital costs. C) Risk costs.

BSCM – Sample Test 316
Institute of Manufacturing Resource Management of India
D) Obsolescence costs. Correct Answer is: ------------------------------------------------------------------------------------------------------------ Question #: 103 Which of the following statements is best?
A) Order Point = DDLT + SS. B) Average inventory = (Q + SS)/2. C) Safety stock is always needed. D) Safety stock = order point + order quantity.
Correct Answer is: ------------------------------------------------------------------------------------------------------------ Question #: 104 Which of the following is an advantage of cycle counting:
A) Timely detection and correction of problems. B) Reduction of direct labor costs. C) Use of spare labor. D) Replenishment of inventory.
Correct Answer is: ------------------------------------------------------------------------------------------------------------ Question #: 105 Which of the following statements is true regarding JIT?
A) It is a philosophy that relates to the way in which a manufacturing company organizes and operates its business.
B) It involves in getting the goods to the customer as fast as possible at all costs. C) It is a culturally based method of management. D) It is concerned with adding cost to the product.
Correct Answer is: ------------------------------------------------------------------------------------------------------------ Question #: 106 Which of the following statements is best regarding employee empowerment?
A) Management is relieved of the responsibility for decisions the company makes. B) Employees are empowered to set their wage rates and hours of work. C) Line employees are given more authority to make decisions.

BSCM – Sample Test 317
Institute of Manufacturing Resource Management of India
D) Decision-making power is concentrated in a small upper level management group.
Correct Answer is: ------------------------------------------------------------------------------------------------------------ Question #: 107 Which of the following is an advantage of work cells:
A) Maximum machine utilization. B) Simplified production activity control. C) Larger batches and lower unit costs. D) Reduced worker skills required.
Correct Answer is: ------------------------------------------------------------------------------------------------------------ Question #: 108 Which of the following statements is best:
A) If we wish to forecast demand, past sales must be used for the forecast. B) Forecasts made in Rupees for total sales should be used by manufacturing. C) Forecasts should be made for all items, models, and options offered. D) The circumstances relating to demand data should be recorded.
Correct Answer is: ------------------------------------------------------------------------------------------------------------ Question #: 109 If the opening inventory is 100 units, sales are 500 units, and the ending inventory is 200 units, what will manufacturing produce:
A) 300 units. B) 400 units. C) 500 units. D) 600 units.
Correct Answer is: ------------------------------------------------------------------------------------------------------------ Question #: 110 The information needed to develop a master production schedule will come from which of the following:

BSCM – Sample Test 318
Institute of Manufacturing Resource Management of India
A) Capacity Requirements Plan. B) Forecast of individual end items. C) Production Activity Control. D) Material Requirements Plan.
Correct Answer is: ------------------------------------------------------------------------------------------------------------

319
Institute of Manufacturing Resource Management of India
Basics of Supply Chain Management
Sample Test (Solutions)

BSCM – Sample Test (Solutions) 320
Institute of Manufacturing Resource Management of India
UBasics of Supply Chain Management - Sample Test
USolutions
1. A 2. A 3. C 4. A
5. B 6. A 7. C 8. C
9. C 10. B 11. D 12. A
13. C 14. D 15. B 16. C
17. B 18. B 19. C 20. D
21. C 22. B 23. B 24. A
25. B 26. A 27. D 28. A
29. B 30. D 31. A 32. D
33. B 34. A 35. B 36. C
37. A 38. D 39. C 40. C
41. B 42. B 43. A 44. B
45. C 46. D 47. A 48. C
49. A 50. D 51. B 52. A
53. C 54. A 55. D 56. C
57. A 58. C 59. B 60. A
61. B 62. C 63. B 64. A
65. B 66. C 67. A 68. D

BSCM – Sample Test (Solutions) 321
Institute of Manufacturing Resource Management of India
69. D 70. D 71. D 72. C
73. B 74. B 75. C 76. C
77. B 78. D 79. C 80. D
81. A 82. B 83. C 84. D
85. C 86. A 87. D 88. C
89. D 90. D 91. D 92. A 93. B 94. D 95. B 96. B
97. C 98. A 99. D 100. B
101. B 102. A 103. A 104. A
105. A 106. C 107. B 108.D
109.D 110. B
Basics of Supply Chain Management - Sample Test
Solutions with Explanation ------------------------------------------------------------------------------------------------------------ Question #: 1 Why is manufacturing important to the economy:

BSCM – Sample Test (Solutions) 322
Institute of Manufacturing Resource Management of India
A) It generates wealth and adds value to products. B) It uses natural resources and prevents waste. C) It decreases employment and generates wealth. D) It prevents waste and decreases employment.
Correct Answer is: A Manufacturing / production function helps in the transformation of raw material resources into useful products and hence adds value to products which in turn generate wealth. ------------------------------------------------------------------------------------------------------------ Question #: 2 Which of the following strategies produce the longest delivery lead time:
A) Make – to - order. B) Assemble – to - order. C) Make – to - stock. D) Continuous manufacturing.
Correct Answer is: A In a make-to-order strategy, the delivery lead time includes the time to make, assemble, pack and ship the product after receipt of the customer order and hence requires more time than the other strategies listed. ------------------------------------------------------------------------------------------------------------ Question #: 3 Which of the following are primary activities of manufacturing planning and control:
A) Inventory Management and Cost Information. B) Sales Support and Cost Information. C) Production Planning and Inventory Management.
D) Sales Support, Implementation and Control. Correct Answer is: C Manufacturing planning and control primarily caters to the production planning function. Inventory management forms a part of the production planning function. ------------------------------------------------------------------------------------------------------------ Question #: 4 In a purchasing system, which of the following originates with the department or person who will be the ultimate user:
A) A Purchase Requisition. B) A Purchase Order. C) Vendor Selection.
D) A Request for Quotation.

BSCM – Sample Test (Solutions) 323
Institute of Manufacturing Resource Management of India
Correct Answer is: A The initial requirement of any individual or department is communicated to the purchasing system in the form of purchase requisitions which are later converted to RFQ’s, Quotations and Orders etc., ------------------------------------------------------------------------------------------------------------ Question #: 5 Which of the following is a component of a demand pattern:
A) Mean Absolute Variation. B) Seasonal Variation. C) Average Variation. D) Standard Deviation.
Correct Answer is: B Seasonal variation forms a component of the demand pattern and the rest are forecast error measurement techniques. ------------------------------------------------------------------------------------------------------------ Question #: 6 Product A is made from components B and C. Component B is made from parts D and E. Which items should be forecast:
A) Only A. B) A, B, and C. C) D and E. D) B, C, D, and E.
Correct Answer is: A Only the end items / independent demand items are forecasted. The demand for the dependent items / components are calculated. Hence only A has to be forecasted. ------------------------------------------------------------------------------------------------------------ Question #: 7 Which of the following is an objective of purchasing:
A) To keep many sources of supply available to ensure competitive pricing. B) To control budgetary expenditures of all employees through sound purchase
order control. C) To obtain goods and services of the required specification and quality. D) To ensure that goods are always purchased at the lowest price.
Correct Answer is: C The primary objective of the purchasing function is to obtain the right goods and services of the required quality and at the required time.

BSCM – Sample Test (Solutions) 324
Institute of Manufacturing Resource Management of India
------------------------------------------------------------------------------------------------------------ Question #: 8 Which of the following equation is correct:
A) Assets = Liabilities – Owner’s Equity. B) Income = Revenue - Liabilities. C) Owner’s Equity = Assets - Liabilities. D) Revenue = Cost of Goods Sold – General and Administrative Expense.
Correct Answer is: C Owner’s Equity = Assets – Liabilities ------------------------------------------------------------------------------------------------------------ Question #: 9 The inventory turns ratio measures:
A) The amount of inventory needed to support sales growth. B) Obsolete inventory as a percent of sales. C) How effectively inventory is being used. D) The amount of space needed to store inventory.
Correct Answer is: C Inventory turns ratio measures how effectively inventories are being used. It is calculated by dividing annual cost of goods sold by average inventory in dollars. ------------------------------------------------------------------------------------------------------------ Question #: 10 A bill of materials contains:
I. Components used to make a product. II. Labor needed to build the product.
III. Assemblies at various stages of production. IV. Safety stock by item. A) I and II. B) I and III. C) II and III. D) III and IV. Correct Answer is: B A bill of materials contains all the components used in the manufacture of end items. In addition, the subassemblies at various stages of manufacture are described. Labor is defined in the routing generally in standard hours and safety stock is not generally maintained on the bill of materials. ------------------------------------------------------------------------------------------------------------

BSCM – Sample Test (Solutions) 325
Institute of Manufacturing Resource Management of India
Question #: 11 Which of the following activities is not part of physical supply /distribution?
A) Transportation B) Warehousing C) Order Entry
D) Capacity Planning Correct Answer is: D Capacity planning is considered part of the manufacturing process. ------------------------------------------------------------------------------------------------------------ Question #: 12 All of the following are part of physical Supply / distribution except:
A) Supplier inventory. B) Material handling. C) Order entry.
D) Finished goods inventory. Correct Answer is: A Physical supply/distribution is involved with the movement of goods from the supplier to the beginning of production, and from the end of production to the final customers ------------------------------------------------------------------------------------------------------------ Question #: 13 A company's strategic plan:
A) Provides the manufacturing plan for families of end items. B) Outlines the sales plan for the next year. C) Is a statement of goals and objectives for a long range period. D) Outlines new products for the next year.
Correct Answer is: C While strategic plans do provide for manufacturing sales and new product plans, they really provide the overall direction for the company. The result is a statement of goals and objectives for 2-5 years and sometimes 10. ------------------------------------------------------------------------------------------------------------ Question #: 14 Production plans have all the following except:
A) Shipment plan. B) Product families. C) Inventory plan.

BSCM – Sample Test (Solutions) 326
Institute of Manufacturing Resource Management of India
D) Weekly production. Correct Answer is: D Production plans are generally monthly statements of shipments, production and inventory (or backlog) broken down by product families, not end items. ------------------------------------------------------------------------------------------------------------ Question #: 15 Which of the following statements is most correct?
A) The MPS shows families of products. B) The MPS has more detail than the production plan. C) The production plan has more detail than the MPS. D) The production plan rolls up to equal the MPS.
Correct Answer is: B The MPS has more detail than the production plan. The MPS should add up to equal the production plan families. ------------------------------------------------------------------------------------------------------------ Question #: 16 A closed loop MRP system can be best defined as:
A) Action taken by a planner to approve planned orders. B) Re-planning of capacity to accommodate restraints. C) Integrated planning and control system with feedback from the bottom-up. D) Integrated systems which include financial software, finite capacity and
logistics. Correct Answer is: C Closed loop MRP systems operate from the top down with feedback through the system. These feedback mechanisms allow changes to occur in the top level planning. ------------------------------------------------------------------------------------------------------------ Question #: 17 You are working as a Master Scheduler, in a discrete manufacturing company. A large customer has asked if you can deliver an order, but you have some short term capacity constraints. Which of the following actions could be taken so the order can be delivered? I. People could be hired.
II. Overtime could be worked. III. Inventory could be built in slow times.
IV. Work could be subcontracted. A) I, II and III. B) II, III and IV.

BSCM – Sample Test (Solutions) 327
Institute of Manufacturing Resource Management of India
C) I, III and IV. D) I, II and IV. Correct Answer is: B Short term capacity can be increased by overtime inventory or subcontract. Often hiring qualified people takes much longer than the other three options. ------------------------------------------------------------------------------------------------------------ Question #: 18 Which of the following are strategies to use in developing a production plan?
I. Chase strategy II. Delphi strategy
III. Level strategy IV. Backlog strategy A) I and II. B) I and III. C) II and IV. D) III and IV. Correct Answer is: B The Chase strategy means production will vary with demand (inventory stays level). The Level strategy establishes production at the average demand. Fluctuations in demand are absorbed by inventory. Third strategy is sub contracting. Production is at the minimum demand level. Variations in the demand level are absorbed by sub contracting production ------------------------------------------------------------------------------------------------------------ Question #: 19 A company needs to produce 4000 units over the next two months. There are 21 working days the first month and 19 working days the second month. What must the daily rate be with a level strategy?
A) 50 B) 75 C) 100 D) 125
Correct Answer is: C The calculation would be as follows: 4000 units divided by 40 work days = 100 units/day. ------------------------------------------------------------------------------------------------------------ Question #: 20 The MPS is used to facilitate communication between which two groups?

BSCM – Sample Test (Solutions) 328
Institute of Manufacturing Resource Management of India
A) Manufacturing and logistics B) Sales and marketing C) Manufacturing and finance D) Sales and manufacturing
Correct Answer is: D While the MPS can be used for many purposes, it is primarily a tool for use by manufacturing and sales. ------------------------------------------------------------------------------------------------------------ Question #: 21 If the lead time is 1 week, the review period is 1 week, the average demand is 100 units per week, and the safety stock is 50 units, the target level will be:
A) 150 units. B) 200 units. C) 250 units. D) 300 units.
Correct Answer is: C Target inventory = demand (review period + lead time) + Safety stock; Hence the target inventory = 100(1+1) + 50 = 250 units ------------------------------------------------------------------------------------------------------------ Question #: 22 Which forecasting technique takes the average demand for some past number of periods: A) Trend Time Average. B) Moving Average. C) Demand Smoothing. D) Qualitative Analysis.
Correct Answer is: B Moving Average is the quantitative forecasting technique which takes into consideration the average demand for some past number of periods to calculate the forecasts. ------------------------------------------------------------------------------------------------------------ Question #: 23 Which basic production planning strategy will build inventory and avoid the costs of excess capacity:
A) Chase Strategy. B) Level Strategy. C) Cycle Counting Strategy.
D) Demand Matching Strategy. Correct Answer is: B

BSCM – Sample Test (Solutions) 329
Institute of Manufacturing Resource Management of India
In the level strategy, the production is always done at the level of average demand and hence there will be increase / decrease in the inventory levels whereas the capacity remains constant. ------------------------------------------------------------------------------------------------------------ Question #: 24 Which of the following is an advantage of cycle counting: A) Timely detection and correction of problems. B) Reduction of direct labor costs. C) Use of spare labor. D) Replenishment of inventory Correct Answer is: A Cycle counting activity is carried out to detect and correct inventory problems. ------------------------------------------------------------------------------------------------------------ Question #: 25 When an Invoice is received for payment, it is compared with which of the following documents before payment is made:
A) The Bill of Lading. B) The Original Purchase Order. C) The Purchase Requisition. D) The Account Debit Memo posted at the time of entry.
Correct Answer is: B The invoice received for payment is compared with the original purchase order before the payments are initiated. ------------------------------------------------------------------------------------------------------------ Question #: 26 Which of the following statements is true regarding JIT:
A) It is a philosophy that relates to the way in which a manufacturing company organizes and operates its business.
B) It involves getting the goods to the customer as fast as possible at all costs. C) It is a culturally based method of management. D) It is concerned with adding cost to the product.
Correct Answer is: A JIT is a philosophy of how manufacturing companies must operate their business. It is not culturally based, and it does not adding cost to products. ------------------------------------------------------------------------------------------------------------ Question #: 27

BSCM – Sample Test (Solutions) 330
Institute of Manufacturing Resource Management of India
If the annual cost of goods sold is Rs. 1,00,000 and the average inventory is Rs. 25,000. What is the turns ratio:
A) Rs. 75,000 B) 0.25 C) 2.5 D) 4
Correct Answer is: D Inventory turns is calculated by dividing the annual cost of goods by the average inventory. Inventory turns in the above problem is 100000/25000 = 4 ------------------------------------------------------------------------------------------------------------ Question #: 28 Which of the following is considered as ordering costs:
A) Production Control Costs. B) Capital Costs. C) Risk Costs. D) Obsolescence Costs.
Correct Answer is: A Production control costs contribute to ordering costs and the other costs listed are part of carrying costs. ------------------------------------------------------------------------------------------------------------ Question #: 29 Which of the following are inputs to a realistic MPS?
I. Production plan II. Forecasts for end items
III. Product costs for end items IV. Capacity constraints
A) I, II and III. B) I, II and IV. C) II, III and IV. D) I, III and IV. Correct Answer is: B The production plan, forecasts and capacity constraints are all inputs to the MPS. While costs are nice to have, they are not a necessary input. ------------------------------------------------------------------------------------------------------------ Question #: 30 Which of the following are objectives when establishing the MPS?

BSCM – Sample Test (Solutions) 331
Institute of Manufacturing Resource Management of India
I. Efficient use of resources II. Efficient final assembly III. High customer service levels IV. Efficient use of inventory
A) I, II and III. B) I, III and IV. C) II, III and IV. D) I, III and IV. Correct Answer is: D The master scheduler, when developing the MPS, must make sure labor, material, equipment, and inventory are being used efficiently to maintain high levels of customer service. Efficient final assembly would be developed by a final assembly schedule. ------------------------------------------------------------------------------------------------------------ Question #: 31 Rough cut capacity planning can be best described as:
A) Checking to be certain critical resources are available to support the preliminary MPS.
B) Making sure warehouse space is available for raw materials. C) Making certain the load at each work center is less than capacity. D) Ensuring resources are available by product family.
Correct Answer is: A Rough cut capacity planning is concerned with making certain critical resources are available at the preliminary MPS stage before committing to the schedule. Critical resources are bottleneck operations (not every work center), labor, and materials which may be scarce or have long lead times. ------------------------------------------------------------------------------------------------------------ Question #: 32 Which of the following manufacturing environments would consumer products, such as film, food etc. be classified?
A) Assemble to order B) Engineer to order C) Make to order D) Make to stock
Correct Answer is: D Consumer products are generally considered make to stock. There are a few standard items assembled from many components. The MPS is a schedule of finished end items. ------------------------------------------------------------------------------------------------------------

BSCM – Sample Test (Solutions) 332
Institute of Manufacturing Resource Management of India
Question #: 33 Many different end items are made from a small number of components. What manufacturing environment would this be? A) Make to stock B) Make to order
C) Assemble to order D) Engineer to order
Correct Answer is: B Make to order. Companies make many end items from a small number of components. The schedule is developed from actual customer orders. ------------------------------------------------------------------------------------------------------------ Question #: 34 Final Assembly Scheduling usually occurs when:
A) A customer order is received. B) Planning a build schedule. C) The MPS is established. D) Capacity is constrained.
Correct Answer is: A Final Assembly Scheduling occurs only after the customer order is received. The FAS is the actual build schedule to ensure the customers get what they want. Generally, FAS occurs when there are a variety of options for the customer to order. ------------------------------------------------------------------------------------------------------------ Question #: 35 The minimum planning horizon for the MPS should be:
A) Twelve months in weekly amounts. B) Equal to the longest cumulative lead time. C) As long as it takes to acquire new capacity. D) Twice the longest component lead time.
Correct Answer is: B The planning horizon should be equal to the longest cumu-lative lead-time to purchase components and manufacture. This allows visibility to plan. ------------------------------------------------------------------------------------------------------------ Question #: 36 In make to stock requirements, customer orders are satisfied from:
A) Available capacity

BSCM – Sample Test (Solutions) 333
Institute of Manufacturing Resource Management of India
B) Work in process inventory- C) Finished goods inventory. D) Raw material inventory.
Correct Answer is: C Make to stock companies ship customers orders from finished goods. Make to order companies ship from available capacity. ------------------------------------------------------------------------------------------------------------ Question #: 37 Available to promise can be best defined as:
A) Inventory and planned production not already committed. B) Customer orders inside lead time which have been promised. C) Inventory not already committed. D) Capacity which is not used and therefore is available.
Correct Answer is: A Available to promise is the part of inventory and planned production which is available to be promised to customers for delivery. It is calculated by adding scheduled receipts to the beginning inventory and subtracting actual orders scheduled before the next scheduled receipt. ------------------------------------------------------------------------------------------------------------ Question #: 38 Week 1 2 3 4 5 Customer Orders 60 30 20 40 MPS 110 110 ATP 20 50 Based on the above, what action can the planner take regarding an order for 60 in week three?
A) Reject the order for 60; tell the customer 50 is acceptable. B) Accept the order for week 4 for 60. C) Accept the order for week 2 for 60. D) Accept the order for week 3 for 60.
Correct Answer is: D The order for 60 can be accepted for week 3, as 70 are available - 20 from week 1 and 50 from week 3. ------------------------------------------------------------------------------------------------------------ Question #: 39 Independent demand can be defined by all of the following except:

BSCM – Sample Test (Solutions) 334
Institute of Manufacturing Resource Management of India
A) Demand not related to demand from higher level assemblies. B) Forecasted demand. C) Demand calculated based on present demand. D) Demand from customer orders.
Correct Answer is: C Demand calculated from present demand would be dependent demand. Its demand is dependent upon a higher level assembly. ------------------------------------------------------------------------------------------------------------ Question #: 40 Which of the following would best define dependent demand? I. Demand which is dependent on the forecast II. Demand which is dependent on demand for a higher level assembly III. Demand which is calculated A) I only. B) I and II. C) II and III. D) III only. Correct Answer is: C Dependent demand is calculated based on demand for higher level assemblies. Forecasted demand is independent. ------------------------------------------------------------------------------------------------------------ Question #: 41 Which of the following is cost of carrying inventory:
A) Capital Costs and Production Control Costs. B) Capital Costs and Storage Costs. C) Production Control Costs and Purchase Costs. D) Storage Costs and Purchase Costs.
Correct Answer is: B Production control costs and purchase costs contribute to ordering costs. Capital costs and storage costs contribute to inventory carrying costs. ------------------------------------------------------------------------------------------------------------ Question #: 42 What is the portion of inventory or production that is not committed to customer orders called: A) Free Stock.

BSCM – Sample Test (Solutions) 335
Institute of Manufacturing Resource Management of India
B) Available – to - Promise. C) Excess Production. D) Waste.
Correct Answer is: B In the MPS, the portion of the inventory or production that is not committed to customer orders is called the “ATP (available to promise) quantity. ------------------------------------------------------------------------------------------------------------ Question #: 43 Which of the following causes forecast error:
A) Random Variation from the average demand. B) Errors in forecasting seasonality. C) Differences in lead times.
D) Differences between sales and demand. Correct Answer is: A Random variation from the average demand is the prime cause of forecast error. ------------------------------------------------------------------------------------------------------------ Question #: 44 For the purposes of production planning, product groups should be established on the basis of:
A) Market Segments. B) Similarity of Manufacturing Process. C) The availability of Materials.
D) The availability of Machinery. Correct Answer is: B From the production planning perspective, product groups should be established on the basis of similarity of manufacturing process. ------------------------------------------------------------------------------------------------------------ Question #: 45 Which of the following is a characteristic of the MPS:
A) It facilitates Forecasting. B) It works with Families of Products. C) It is an agreed-upon plan between Production and Marketing. D) It cannot be used for Order Promising.
Correct Answer is: C MPS integrates the production and marketing functions and is an agreed upon plan between these functions.
BSCM – Sample Test (Solutions) 336
Institute of Manufacturing Resource Management of India
------------------------------------------------------------------------------------------------------------ Question #: 46 In developing the standard EOQ formula, which of the following assumptions is made:
A) Demand for the item is relatively uniform. B) Replenishment is in lots or batches that arrive all at once. C) Lead Time is constant. D) All the above are assumed.
Correct Answer is: D EOQ is determined with the assumptions that there is a fairly stable demand and replenishment is predictable and is in predefined lots / batches. ------------------------------------------------------------------------------------------------------------ Question #: 47 What is an inventory record system that keeps a continuous account of transactions as they occur?
A) Perpetual Inventory System. B) Period Inventory System. C) Two-bin System. D) Safety Stock System.
Correct Answer is: A Perpetual inventory system keeps a continuous account of transactions as they occur. ------------------------------------------------------------------------------------------------------------ Question #: 48 The quantity in a JIT pull signal:
A) Is always the same as upstream pull signal. B) Is always one. C) Can be any quantity. D) Often includes a small safety factor.
Correct Answer is: C The JIT pull signal defines the movement of goods and information but does not restrict the quantity. ------------------------------------------------------------------------------------------------------------ Question #: 49 Material requirement's (MRP) major objective, in addition to calculating requirements is to:
A) Keep the order priorities current.

BSCM – Sample Test (Solutions) 337
Institute of Manufacturing Resource Management of India
B) Maintain the bill of materials. C) Calculate the inventory needed. D) Ensure forecasted demand is to be used.
Correct Answer is: A The two major objectives of MRP are to: l. Calculate the material requirements based on demand and on hand inventory and 2. keep order priorities current as business needs change. While MRP does calculate projected inventory, it is not its major objective. ------------------------------------------------------------------------------------------------------------ Question #: 50 Which of the following is not an input to MRP?
A) Master Production Schedule B) Inventory records C) Bills of material D) Capacity planning
Correct Answer is: D Capacity planning is not an input to MRP. In fact, MRP assumes infinite capacity is available in its calculation. ------------------------------------------------------------------------------------------------------------ Question #: 51 A where-used report provides a list of:
A) All work centers where a part is run. B) All parents where a component is used. C) All components where a parent is used. D) All planning bills.
Correct Answer is: B A where-used report provides a list of all parents Where a component is used. It is useful for working more component changes. ------------------------------------------------------------------------------------------------------------ Question #: 52 A pegging report is used to:
A) Trace the origin of demand for a component. B) Trace the capacity requirement for a part. C) Identify the quantity per for a particular parent. D) Establish the demand for a part.
Correct Answer is: A

BSCM – Sample Test (Solutions) 338
Institute of Manufacturing Resource Management of India
A pegging report is used to trace the origin of demand for a component. It shows only the parents for which demand exists, unlike the where-used report which shows every parent on which a component is used. ------------------------------------------------------------------------------------------------------------ Question #: 53 The Bill of Materials is used quite frequently in manufacturing. All of the following are uses of the BOM except:
A) Product costing. B) Planning. C) Calculating capacity. D) Engineering change control.
Correct Answer is: C Capacity Planning uses the routing file to determine the load on the work centers. ------------------------------------------------------------------------------------------------------------ Question #: 54 A firm planned order is used to:
A) Freeze the planned order against changes in quantity and time. B) Convert the planned order to a scheduled receipt. C) Simulate the projected inventory balance. D) Manipulate the data and quantity of the customer order.
Correct Answer is: A Firm planned orders are used by planners when it is necessary to "freeze" the planned order. This might be necessary due to material shortages or capacity problems. (e.g. strikes) ------------------------------------------------------------------------------------------------------------ Question #: 55 All of the following conditions will trigger an exception message except:
A) Changes in timing of a scheduled receipt. B) Changes in the inventory on hand balance due to cycle count adjustment. C) Changes in the forecast. D) Changes in the assigned planner.
Correct Answer is: D All of the conditions will trigger an exception message except for changing the planner assignment. This will cause the reports to print differently. Any records which cause a change in the gross requirements, inventory or scheduled receipts, will trigger an exception message ------------------------------------------------------------------------------------------------------------

BSCM – Sample Test (Solutions) 339
Institute of Manufacturing Resource Management of India
Question #: 56 Of the following choices, which would be the preferred method to minimize system nervousness?
A) Increase the order quantities. B) Increase the lead time. C) Use firm planned orders. D) Ignore the exception messages.
Correct Answer is: C Firm planned orders will reduce system nervousness, especially, inside the manufacturing lead-time. The planner could ignore the exception messages, however, this could become a dangerous practice. ------------------------------------------------------------------------------------------------------------ Question #: 57 Available capacity can be best described as:
A) The ability of a resource to produce a quantity of output for a particular period. B) The amount of resource needed to produce the necessary output for a specified
time period. C) The amount of released work to a facility during a specified time period. D) The amount of load on a work center to produce the output necessary.
Correct Answer is: A Available capacity measures the ability of a resource(eg. machine, plant, etc.) to produce output (eg. parts.) for a specified time frame (eg. hour, day, week, month, etc.) Answer B defines the required capacity, while answer C defines the load. ------------------------------------------------------------------------------------------------------------ Question #: 58 Capacity requirements planning (CRP) is concerned with which of the following? I. Labor hours for a product family. II. Individual orders and individual work centers. III. Calculating work center loads.
IV. Validating the capacity for the master production schedule.
A) I and II. B) I and III. C) II and III. D) III and IV.
Correct Answer is: C

BSCM – Sample Test (Solutions) 340
Institute of Manufacturing Resource Management of India
CRP is concerned with very detailed scheduling for individual orders at each work center to calculate work center loads. Resource planning is concerned with checking the resource available for product families while rough cut capacity planning validates the MPS prior to running the schedule.
------------------------------------------------------------------------------------------------------------ Question #: 59 which of the following best describes a routing?
A) The path materials follow from beginning to end. B) The path work follows from work center to work center as it is completed. C) The path information transactions follow to be completed. D) The critical ratio calculated to determine whether jobs are on schedule.
Correct Answer is: B Routing defines the operations required to make a product and the sequence of the operations in which the product has to move. ------------------------------------------------------------------------------------------------------------ Question #: 60 Available capacity can be determined two ways: measurement and calculation. Measured capacity is determined by which of the following methods?
A) Historical data B) Available time C) Machine utilization D) Machine efficiency
Correct Answer is: A Measured capacity is based on historical data, that is, what the machine or operator has produced in the past. ------------------------------------------------------------------------------------------------------------ Question #: 61 Why is it important to track the forecast:
A) To compare the actual sales with the forecast. B) To improve the forecasting methods. C) To utilize actual sales data. D) To satisfy marketing’s need to know.
Correct Answer is: B It is important to track the forecast so that the actual data and the forecast data can be compared which can subsequently be used for improving the forecasting methods. ------------------------------------------------------------------------------------------------------------

BSCM – Sample Test (Solutions) 341
Institute of Manufacturing Resource Management of India
Question #: 62 Under which of the following circumstances will firms generally make to stock: A) Demand is unpredictable. B) Many product options exist. C) Required delivery times are shorter than the time needed to make the product. D) Customers require special engineering.
Correct Answer is: C Make to stock products are products that must be readily available to the customers and hence the delivery lead time is much shorter. The demand of MTS products is fairly stable, the products do not exist with many product options and there is no special engineering involved. ------------------------------------------------------------------------------------------------------------ Question #: 63 If the order quantity is increased, which of the following occurs:
A) The cost of carrying inventory decreases and the cost of ordering increases. B) The cost of carrying inventory increases and the cost of ordering decreases. C) The cost of carrying inventory increases and the cost of ordering increases.
D) The cost of carrying inventory decreases and the cost of ordering decreases. Correct Answer is: B As the order quantity increases, the number of orders decrease and hence the ordering costs decrease but there is more inventory to carry and hence the carrying costs increase. ------------------------------------------------------------------------------------------------------------ Question #: 64 Safety stock will depend on which of the following:
A) Variability of demand. B) Cost of carrying inventory. C) Cost of placing an order.
D) Product obsolescence. Correct Answer is: A Safety stock is used buffer the variations between the expected and actual demands. ------------------------------------------------------------------------------------------------------------ Question #: 65 Which of the following statements is best:
A) Demand fluctuations that depend on the time of the year, week or day are called trend.
BSCM – Sample Test (Solutions) 342
Institute of Manufacturing Resource Management of India
B) The seasonal index is an estimate of how much the demand during the season will be above or below the average demand.
C) Seasonality always occurs in summer, winter, spring and fall. D) Random variation is constant from period to period.
Correct Answer is: B Demand fluctuations that depend on the time of the year, week or day is not called trend, and seasonality is not always related to the seasons of the year and random variation is not constant from period to period. Seasonality is based on the demand patterns and the seasonal index is the estimate of how much the demand during that season will be above / below the average. ------------------------------------------------------------------------------------------------------------ Question #: 66 Which of the following is an objective of MPS:
A) To maximize utilization of equipment. B) To keep the sales department happy. C) To maintain the desired level of customer service. D) To minimize inventory investment.
Correct Answer is: C MPS is an agreed upon plan between marketing and production and hence MPS helps in maintaining the desired level of customer service. ------------------------------------------------------------------------------------------------------------ Question #: 67 Which of the following is true about time fences in a MPS:
A) Changes far out in the planning horizon can be made with little or no cost to manufacturing.
B) In the “Frozen zone”, capacity and materials can easily be committed to new orders.
C) Changes in the near future on the planning horizon are less costly to make than changes far out.
D) The master planner should be authorized to make changes in the “frozen zone”. Correct Answer is: A In the nearer periods of the planning horizon and within the demand time fence, resources are committed and hence changes cause disruptions to the schedule and incur heavy costs. In periods far out in the planning horizon, changes can be made with little or no cost to manufacturing. ------------------------------------------------------------------------------------------------------------ Question #: 68 TQM can reduce batch sizes by:

BSCM – Sample Test (Solutions) 343
Institute of Manufacturing Resource Management of India
A) Reducing lead time. B) Using statistical analysis and destructive testing. C) Increasing per-order costs. D) Lowering fixed costs associated with batch-size calculations.
Correct Answer is: D By continuously evaluating and improving the processes, fixed costs associated with batch sizes can be reduced. ------------------------------------------------------------------------------------------------------------ Question #: 69 A work center has 4 machines operating 6 days for 8 hours per day. What is the available time?
A) 24 hours B) 32 hours C) 48 hours D) 192 hours
Correct Answer is : D Available time is the total number of hours a work center can be used. Therefore, 8x6x4 = 192 hours ------------------------------------------------------------------------------------------------------------ Question #: 70 A work center has 4 machines available 8 hours per day for 5 days per week. During the week, they produced for 128 hours. The utilization is:
A) 70% B) 75% C) 80% D) 85%
Correct Answer is: C Utilization is equal to hours actually worked divided by available hours. In this example, there are 4 machines x 5 days x 8 hours = 160 available hours. For 128 hours of actual work divided by 160 available hours = 80% utilization. ------------------------------------------------------------------------------------------------------------ Question #: 71 A work center has 4 machines available for 8 hours per day, 5 days per week. The work center is utilized 100 hours but produces 120 hours of standard work. The efficiency of the work center is:
A) 50%

BSCM – Sample Test (Solutions) 344
Institute of Manufacturing Resource Management of India
B) 62.5% C) 75% D) 120%
Correct Answer is: D Efficiency equals standard hours of work produced divided by hours actually worked x 100%. For this example, 120 standard hours of work was produced divided by 100 hours of actual work = 1.2 x 100% 120%. ------------------------------------------------------------------------------------------------------------ Question #: 72 Which of the following best describes the term "load"?
A) Sum of the required times for all actual orders to be run at a work center for a specified time frame.
B) Sum of a required times for all planned orders to be run at a work center for a specified time frame.
C) Sum of the required times for all planned and actual orders to be run at a work center for a specified time period.
D) Sum of the required times for all forecasted orders to be run at the work center for a specified time period.
Correct Answer is: C The load on a work-center is calculated by adding the required times for all planned and actual orders to be run at a work center for a specified time period. ------------------------------------------------------------------------------------------------------------ Question #: 73 In order to back schedule, which of the following information is necessary? I. Quantity and due dates
II. Bill of materials sequence III. Setup and run times for each operation IV. Queue, wait, and move times
A) I, II, and III. B) I, III, and IV. C) II, III and IV. D) I, II and IV. Correct Answer is: B The bill of materials sequence is not needed in order to backward schedule. Backward scheduling involves machine operation sequence as well as move, queue, and wait times. The quantity would directly impact the time taken at each work center. ------------------------------------------------------------------------------------------------------------

BSCM – Sample Test (Solutions) 345
Institute of Manufacturing Resource Management of India
Question #: 74 Production activity control can be best described as a:
A) Planning system. B) Execution system. C) Scheduling system. D) Ordering system.
Correct Answer is: B The production activity control system is responsible for executing the materials requirement plan and the master production schedule. ------------------------------------------------------------------------------------------------------------ Question #: 75 Dispatching can be best described as:
A) Routing the factory orders. B) Developing the work instructions. C) Releasing orders to the shop floor. D) Placing purchase orders with suppliers.
Correct Answer is: C Dispatching is the function of releasing orders to the shop floor based on the materials requirements plan priorities. ------------------------------------------------------------------------------------------------------------ Question #: 76 In a certain manufacturing environment, routings are fixed, and work centers are arranged in the order of the routings. The production at each work center takes a similar amount of time. This would describe:
A) Project manufacturing. B) Intermittent manufacturing. C) Flow manufacturing. D) Specialty manufacturing.
Correct Answer is: C In a flow manufacturing equipment, routings are generally fixed with work centers arranged according to the flow. ------------------------------------------------------------------------------------------------------------ Question #: 77 In a certain manufacturing environment, flow of work is varied, workers must be flexible and throughput times are long. This describes:
A) Project manufacturing.
BSCM – Sample Test (Solutions) 346
Institute of Manufacturing Resource Management of India
B) Intermittent manufacturing. C) Flow manufacturing. D) Specialty manufacturing.
Correct Answer is: B With intermittent manufacturing, the flow of work is varied, depending on the design. This causes the work flow to be unbalanced. Machinery and workers need to be flexible and are generally grouped together by function. Throughput times are generally long depending on the work which needs to be done at each work center. As a result, scheduling is very complex. The capacity needed depends on the mix of products moving through the various work centers. ------------------------------------------------------------------------------------------------------------ Question #: 78 All of the following are part of manufacturing lead time except:
A) Queue time. B) Wait time. C) Move time. D) Purchasing time.
Correct Answer is: D Purchasing time is part of the overall lead time of a product, however, manufacturing lead time includes queue time, setup time, run time, wait time and move time. ------------------------------------------------------------------------------------------------------------ Question #: 79 Of all the times associated with manufacturing lead times, which generally takes the most time in intermittent manufacturing?
A) Run time B) Setup time C) Queue time D) Move time
Correct Answer is: C Queue time usually accounts for 85%-95% of total lead time. As a result, it is critical that production control aggressively manages the queue time. ------------------------------------------------------------------------------------------------------------ Question #: 80 Operations are scheduled from the date the order is received. This would best describe:
A) Backward scheduling. B) Master scheduling. C) Capacity scheduling.

BSCM – Sample Test (Solutions) 347
Institute of Manufacturing Resource Management of India
D) Forward scheduling. Correct Answer is: D Forward scheduling begins when an order is received. The due date for the customer would be calculated based on material purchases and operation scheduling. It is used for developing promise dates for the customer, or determining whether a late order can be delivered on time. ------------------------------------------------------------------------------------------------------------ Question #: 81 The last operation is scheduled for completion on the due date. Other previous operations are scheduled so the due date can be met. This describes:
A) Backward scheduling. B) Master scheduling. C) Capacity scheduling. D) Forward scheduling.
Correct Answer is: A Backward scheduling schedules the last operation on the routing so the completion date is the due date. All previous operations are scheduled back from the last operation. The benefit of backward scheduling is that it schedules back from the customer due date. However, because there is no slack time, on time delivery and service may suffer. ------------------------------------------------------------------------------------------------------------ Question #: 82 When the next operation is allowed to begin before the entire lot is completed on the previous operation, this is called:
A) Operation splitting. B) Operation overlapping. C) Work center overlapping. D) Work center splitting.
Correct Answer is: B Operation overlapping allows the next operation to begin even though the whole lot has not been completed through the previous operations. It can be used to expedite an order. However, sometimes costs are increased. ------------------------------------------------------------------------------------------------------------ Question #: 83 Bottlenecks can be best defined as:
A) Work stations where available capacity is greater than required capacity. B) work stations where measured capacity is greater than required capacity. C) Work stations where required capacity is greater than available capacity.

BSCM – Sample Test (Solutions) 348
Institute of Manufacturing Resource Management of India
D) Work stations where the demonstrated capacity is greater than the measured capacity.
Correct Answer is: C Bottlenecks occur when the required capacity is greater than the available capacity. ------------------------------------------------------------------------------------------------------------ Question #: 84 The total volume of production passing through a facility is defined as:
A) Total output. B) Finished goods production. C) Load. D) Throughput.
Correct Answer is: D Throughput is the total volume passing through a facility. Bottlenecks control the throughput as production can only proceed as quickly as the slowest bottleneck. ------------------------------------------------------------------------------------------------------------ Question #: 85 All of the following are principles of bottlenecks except:
A) Using a non-bottleneck 100% of the time does not produce 100% utilization. B) The capacity of the production process depends on the capacity of the
bottleneck. C) Time saved at the bottleneck saves nothing. D) Capacity and demand must be considered together.
Correct Answer is: C Time saved at the bottleneck is where capacity is saved because the entire production process can only go as fast as the bottleneck. ------------------------------------------------------------------------------------------------------------ Question #: 86 Managing bottlenecks is extremely important to the throughput of the production facility. All of the following should be done to manage bottlenecks except:
A) Change the schedule frequently to meet customer promises. B) Maintain a time buffer before each bottleneck. C) Control the feed rate of material to the bottleneck. D) Increase the bottleneck capacity as much as possible.
Correct Answer is: A

BSCM – Sample Test (Solutions) 349
Institute of Manufacturing Resource Management of India
The schedule should be changed as a last resort to meet customer deliveries. However, frequent changes will in fact reduce capacity at the bottleneck. ------------------------------------------------------------------------------------------------------------ Question #: 87 A shop packet will contain all of the following except:
A) Engineering drawings B) Bills of materials C) Route sheets D) Customer information
Correct Answer is: D While the customer might be identified, it is not necessary to contain the customer information in the shop packet. The other answers would generally be included. ------------------------------------------------------------------------------------------------------------ Question #: 88 The input rate is controlled by:
A) The material flow from suppliers. B) The tooling requirements. C) The release of orders to the shop. D) The demand from customers.
Correct Answer is: C Releasing orders to the shop controls the input rate. If orders are released faster than they can be produced, then queue work-in-progress and lead times will increase. ------------------------------------------------------------------------------------------------------------ Question #: 89 All of the following are objectives of purchasing except:
A) Buy goods and services in the right quantity and quality. B) Buy goods and services at the lowest cost possible. C) Maintaining good supplier relations. D) Schedule the suppliers plant so goods arrive on time.
Correct Answer is: D Purchasing objectives are the three answers in A,B, and C. In addition, purchasing must make sure the company receives the best possible service and prompt delivery by the supplier. ------------------------------------------------------------------------------------------------------------ Question #: 90 Which of the following are factors in selecting suppliers?

BSCM – Sample Test (Solutions) 350
Institute of Manufacturing Resource Management of India
I. Technical capability. II. Financial reliability. III. Location IV. Service after the sale. A) I, II and III. B) I, III and IV. C) II, III and IV. D) 1, II, III, and IV. Correct Answer is: D All of the factors listed should be considered when trying to select a supplier. Other factors include price, credit terms and quality capabilities. ------------------------------------------------------------------------------------------------------------ Question #: 91 The ability to negotiate price is dependent on the type of product. Which of the following products could generally be negotiated?
A) Maintenance, repair and operating supplies B) Copper, cool, wheat, metal
C) Standard electronic components D) Made to order motors
Correct Answer is: D Generally made to order items which are made to specification from many sources can be negotiated. ------------------------------------------------------------------------------------------------------------ Question #: 92 Which of the following best describes the advantage of a planner/buyer position? I. Smooth flow of information between supplier and the factory. II. Improved coordination of factory requirements and the supplier. III. Improved flow of materials through the factory. IV. Ability to match material requirements with suppliers capability. A) I, II and IV. B) I, III and IV. C) II, III and IV, D) I, II III and IV Correct Answer is: A The planner/buyer concept improves coordination between the factory and supplier. By eliminating the extra handoff between planner and buyer, communication will improve.

BSCM – Sample Test (Solutions) 351
Institute of Manufacturing Resource Management of India
While materials will flow more smoothly into the facility, the flow through the factory is dependent on many other factors. ------------------------------------------------------------------------------------------------------------ Question #: 93 In most companies, material purchases represent what percentage of the cost of the product?
A) 30% B) 50% C) 70% D) 90%
Correct Answer is: B In most companies today, material costs represent 50 % or higher of the cost of the product. ------------------------------------------------------------------------------------------------------------ Question #: 94 Which of the following would be included in demand management? I. Forecasted requirements II. Service parts requirements III. Branch warehouse requirements IV. Interplant orders A) I, II and III. B) II, III and IV. C) I, III and IV. D) 1, II, III, and IV. Correct Answer is: D All of the answers would be part of demand management, plus order entry and order promising. ------------------------------------------------------------------------------------------------------------ Question #: 95 The purpose of a strategic business plan is:
A) To plan production by product family. B) To plan for business changes which take a long time. C) To establish customer requirements over the long term. D) To establish order promising strategies.
Correct Answer is: B

BSCM – Sample Test (Solutions) 352
Institute of Manufacturing Resource Management of India
Strategic plans are used for long term planning (2-10 years). They are used to allow time to plan for changes which take a long time to occur. These might include new plants or distribution centers. ------------------------------------------------------------------------------------------------------------ Question #: 96 All of the following are principles of forecasting except:
A) Forecasts are usually wrong. B) Forecasts are more accurate for end items. C) Forecasts should include an estimate of error. D) Forecasts are more accurate in the near term.
Correct Answer is: B Forecasts are more accurate for product families or group of products. The reason is that aggregate numbers tend to be more accurate then detailed numbers. So although the sales forecast error may be very small in a company, predicting the shipments of an end item will have more error associated with it. ------------------------------------------------------------------------------------------------------------ Question #: 97 When historical data is available in a company to use in forecasting future demand, the technique to use this data is:
A) Qualitative forecasting techniques B) Extrinsic forecasting techniques C) Intrinsic forecasting techniques D) Causal forecasting techniques
Correct Answer is: C Intrinsic forecasting techniques use internal historical data to forecast future demand. It is used based on an assumption that historical patterns can predict future patterns. ------------------------------------------------------------------------------------------------------------ Question #: 98 Which of the following statements is best about inventory management:
A) Inventories and production must be managed together. B) Inventory is not important at the production planning level. C) Inventories are usually insignificant on the balance sheet. D) Inventory does not cost much to carry.
Correct Answer is: A Inventory helps in production (work in process inventory) and also results from production (component, subassemblies and end item inventories). Hence inventories and production must be managed together. Inventory is important at production planning

BSCM – Sample Test (Solutions) 353
Institute of Manufacturing Resource Management of India
level and also the subsequent planning levels. Inventories are reflected on the balance sheet and they incur carrying costs. ------------------------------------------------------------------------------------------------------------ Question #: 99 What are the materials used in the production process but that do not become a part of the product called :
A) Raw materials B) Work-in-process C) Finished goods
D) Maintenance, Repair and Operating supplies Correct Answer is: D Raw material, work in process and finished goods, also called the direct materials, become a part of the product. There are also certain products also called the indirect materials which help in the manufacturing process but do not become a part of the product, these are classified as the maintenance, repair and operational (MRO) supplies ------------------------------------------------------------------------------------------------------------ Question #: 100 What is the name given to the inventories of items that are purchased or manufactured in quantities greater than needed immediately :
A) Fluctuation inventory. B) Lot size inventory. C) Transportation inventory.
D) Scheduled receipts. Correct Answer is: B For economies of scale, inventories are generally ordered in lots and these result in quantities greater than the immediate requirement. ------------------------------------------------------------------------------------------------------------ Question #: 101 Which of the following are costs of carrying inventory:
A) Capital costs and production control costs. B) Capital costs and storage costs. C) Production control costs and purchase costs. D) Storage costs and purchasing costs.
Correct Answer is: B Production control costs and purchasing costs form part of ordering costs. Capital and storage costs are part of carrying costs. ------------------------------------------------------------------------------------------------------------

BSCM – Sample Test (Solutions) 354
Institute of Manufacturing Resource Management of India
Question #: 102 Which of the following are considered ordering costs:
A) Production control costs. B) Capital costs. C) Risk costs. D) Obsolescence costs.
Correct Answer is: A Capital costs, risk costs and obsolescence costs are part of inventory carrying costs. Production control costs are part of inventory ordering costs. ------------------------------------------------------------------------------------------------------------ Question #: 103 Which of the following statements is best?
A) Order Point = DDLT + SS. B) Average inventory = (Q + SS)/2. C) Safety stock is always needed. D) Safety stock = order point + order quantity.
Correct Answer is: A Order point = demand during lead time + safety stock. ------------------------------------------------------------------------------------------------------------ Question #: 104 Which of the following is an advantage of cycle counting:
A) Timely detection and correction of problems. B) Reduction of direct labor costs. C) Use of spare labor. D) Replenishment of inventory.
Correct Answer is: A Cycle counting is carried out to detect and correct inventory problems in a timely manner. ------------------------------------------------------------------------------------------------------------ Question #: 105 Which of the following statements is true regarding JIT?
A) It is a philosophy that relates to the way in which a manufacturing company
organizes and operates its business. B) It involves in getting the goods to the customer as fast as possible at all costs. C) It is a culturally based method of management.

BSCM – Sample Test (Solutions) 355
Institute of Manufacturing Resource Management of India
D) It is concerned with adding cost to the product. Correct Answer is: A JIT is a philosophy relating to the way manufacturing companies must operate and it is not culturally based and does not recommend adding costs to product or process. ------------------------------------------------------------------------------------------------------------ Question #: 106 Which of the following statements is best regarding employee empowerment?
A) Management is relieved of the responsibility for decisions the company makes. B) Employees are empowered to set their wage rates and hours of work. C) Line employees are given more authority to make decisions. D) Decision-making power is concentrated in a small upper level management
group. Correct Answer is: C Employee empowerment emphasizes the idea of making the shop floor / line employees more empowered by giving them more authority to make the required decisions. ------------------------------------------------------------------------------------------------------------ Question #: 107 Which of the following is an advantage of work cells:
A) Maximum machine utilization. B) Simplified production activity control. C) Larger batches and lower unit costs. D) Reduced worker skills required.
Correct Answer is: B Work cells enable more process and machine flexibility which in turn help in simplified production activity. ------------------------------------------------------------------------------------------------------------ Question #: 108 Which of the following statements is best:
A) If we wish to forecast demand, past sales must be used for the forecast. B) Forecasts made in Rupees for total sales should be used by manufacturing. C) Forecasts should be made for all items, models, and options offered. D) The circumstances relating to demand data should be recorded.
Correct Answer is: D It is very important to understand the circumstances under which the data is recorded. This helps in adopting better forecasting techniques and accounting for the circumstances leading to the demand.
BSCM – Sample Test (Solutions) 356
Institute of Manufacturing Resource Management of India
------------------------------------------------------------------------------------------------------------ Question #: 109 If the opening inventory is 100 units, sales are 500 units, and the ending inventory is 200 units, what will manufacturing produce:
A) 300 units. B) 400 units. C) 500 units. D) 600 units.
Correct Answer is: D Opening inventory is 100 units, ending inventory is 200 units and the demand is 500 units. To satisfy the demand and inventory requirements, manufacturing must be equal to “demand + (ending inventory – opening inventory). Therefore manufacturing must produce 500 + (200 – 100) = 600 units ------------------------------------------------------------------------------------------------------------ Question #: 110 The information needed to develop a master production schedule will come from which of the following:
A) Capacity Requirements Plan. B) Forecast of individual end items. C) Production Activity Control. D) Material Requirements Plan.
Correct Answer is: B Information required to develop a MPS will come from the production plan, Forecasts, customer orders, back orders of end items. MRP is an output of MPS, PAC is an output of MRP and CRP evaluates the capacity requirements of MRP. ------------------------------------------------------------------------------------------------------------
