- breakeven analysis.ppt
TRANSCRIPT

www.rsb.edu.in
www.rsb.edu.in
Program :
Faculty :
Course :
Trimester :
Session/s :
Week :
11
4
PGDM - 01
Prof.Dr.P.R.Ramakrishnan
Introduction to Managerial Accounting
II
www.rsb.edu.in
LEARNING OBJECTIVES
• Breakeven point – one parameter
• Breakeven point – two alternatives
• Payback period analysis
www.rsb.edu.in
Breakeven Point
• The parameter (or variable) can be an amount of revenue, cost, supply, demand, etc. for one project or between two alternatives
One project - Breakeven point is identified as QBE. Determined using linear or non-linear math relations for revenue and cost
• Between two alternatives - Determine one of the parameters P, A, F, i, or n with others constant
• Solution is by one of three methods:
– Direct solution of relations
– Trial and error
– Spreadsheet functions or tools (Goal Seek or Solver)
Value of a parameter that makes two elements equal
www.rsb.edu.in
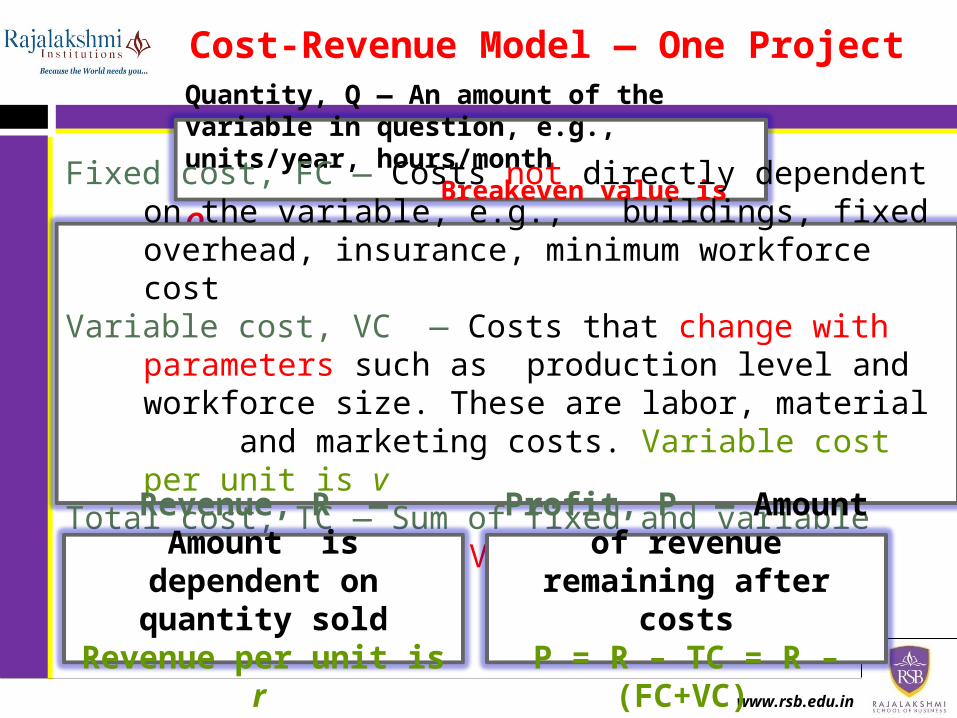
Cost-Revenue Model ― One Project
Quantity, Q — An amount of the variable in question, e.g., units/year, hours/month Breakeven value is QBE
Fixed cost, FC — Costs not directly dependent on the variable, e.g., buildings, fixed overhead, insurance, minimum
workforce costVariable cost, VC — Costs that change with parameters such as
production level and workforce size. These are labor, material and marketing costs. Variable cost per unit is v
Total cost, TC — Sum of fixed and variable costs, TC = FC + VC
Revenue, R — Amount is dependent on quantity sold
Revenue per unit is r
Profit, P — Amount of revenue remaining after costs
P = R – TC = R – (FC+VC)
www.rsb.edu.in
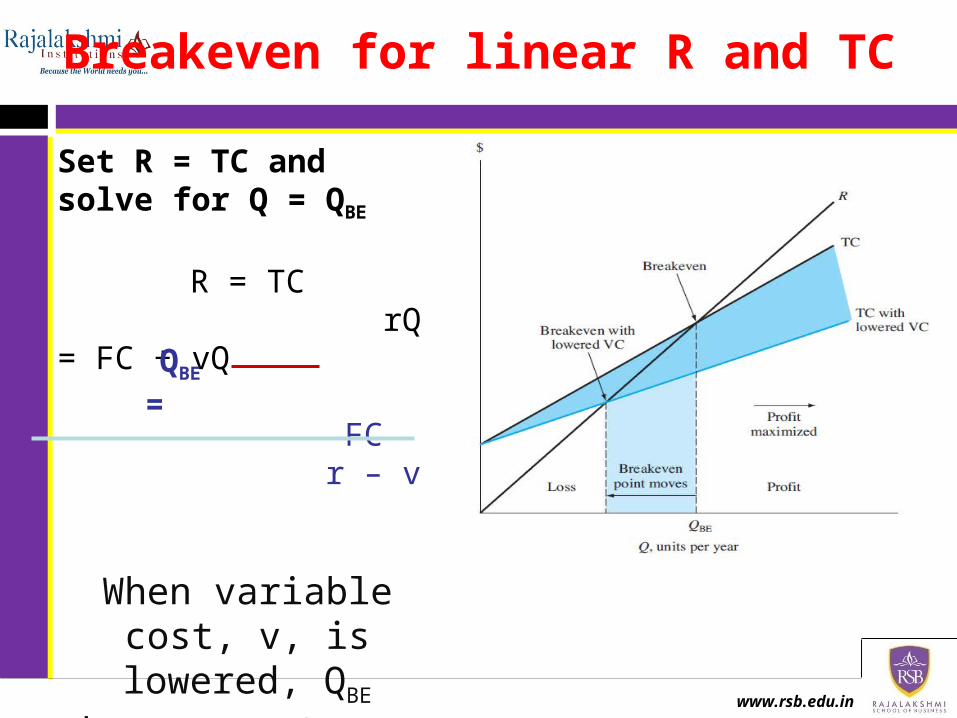
Breakeven for linear R and TC
Set R = TC and solve for Q = QBE
R = TC rQ = FC + vQ
FC r – v
When variable cost, v, is lowered, QBE decreases
(moves to left)
QBE =
www.rsb.edu.in
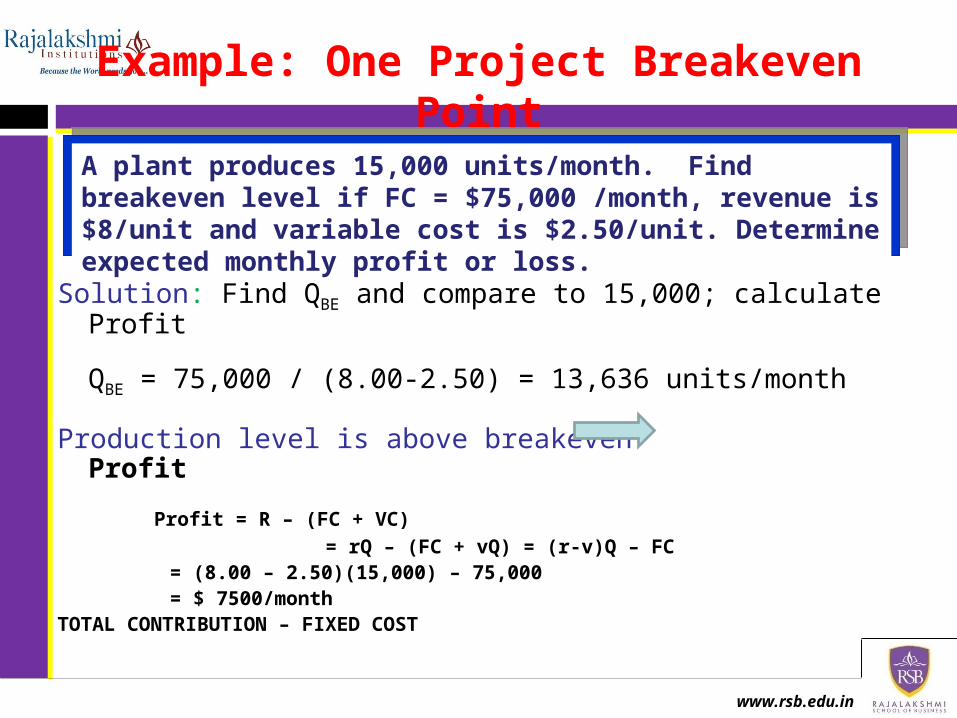
Example: One Project Breakeven Point
Solution: Find QBE and compare to 15,000; calculate Profit
QBE = 75,000 / (8.00-2.50) = 13,636 units/month
Production level is above breakeven Profit
Profit = R – (FC + VC)
= rQ – (FC + vQ) = (r-v)Q – FC = (8.00 – 2.50)(15,000) – 75,000
= $ 7500/monthTOTAL CONTRIBUTION – FIXED COST
A plant produces 15,000 units/month. Find breakeven level if FC = $75,000 /month, revenue is $8/unit and variable cost is $2.50/unit. Determine expected monthly profit or loss.
www.rsb.edu.in
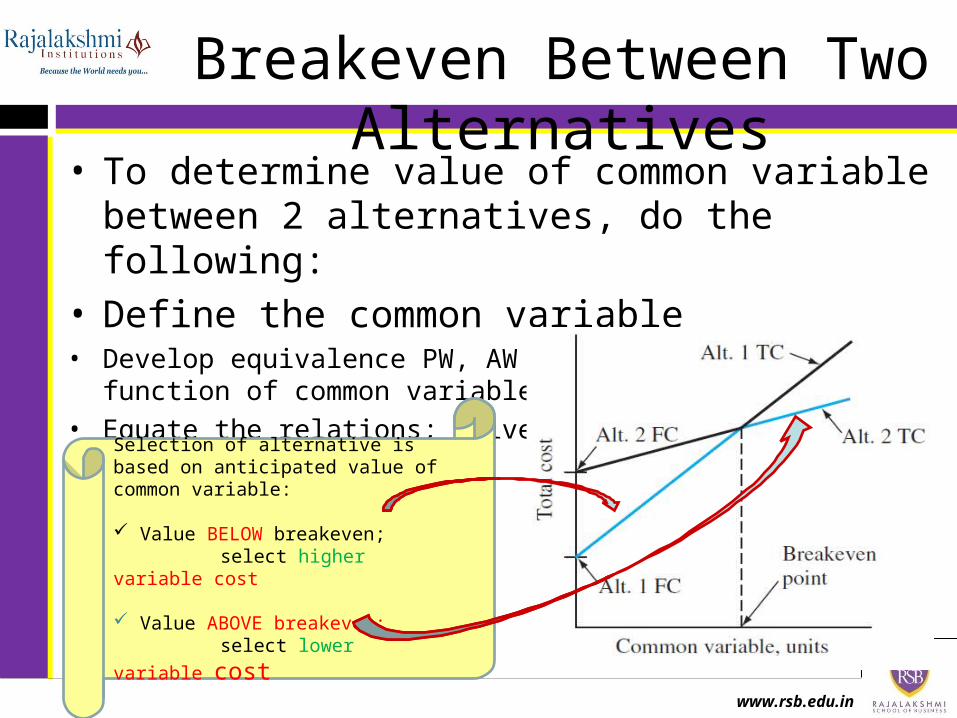
Breakeven Between Two Alternatives
• To determine value of common variable between 2 alternatives, do the following:
• Define the common variable• Develop equivalence PW, AW or FW relations as function of common
variable for each alternative• Equate the relations; solve for variable. This is breakeven value
Selection of alternative is based on anticipated value of common variable:
Value BELOW breakeven; select higher variable cost
Value ABOVE breakeven;
select lower variable cost
www.rsb.edu.in
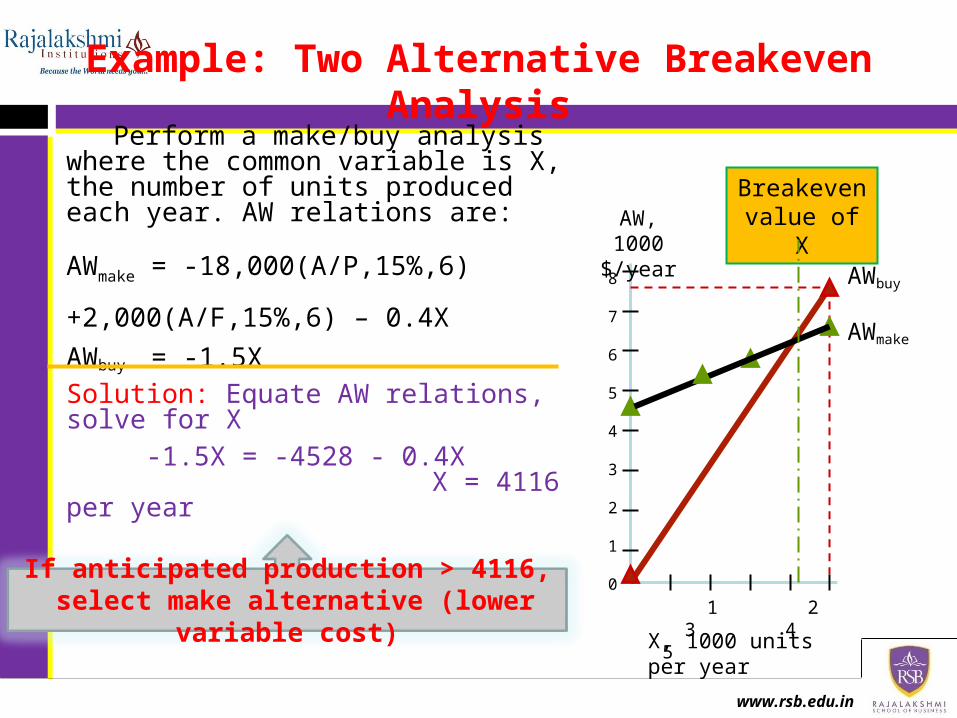
Example: Two Alternative Breakeven Analysis
Perform a make/buy analysis where the common variable is X, the number of units produced each year. AW relations are:
AWmake = -18,000(A/P,15%,6) +2,000(A/F,15%,6) – 0.4X
AWbuy = -1.5XSolution: Equate AW relations, solve for X
-1.5X = -4528 - 0.4X X = 4116 per year
X, 1000 units per year
Breakeven value of X
1 2 3 4 5
AWbuy
AWmake
If anticipated production > 4116, select make alternative (lower variable
cost)
AW, 1000 $/year
8
7
6
5
4
3
2
1
0
www.rsb.edu.in
Breakeven Analysis Using Goal Seek Tool
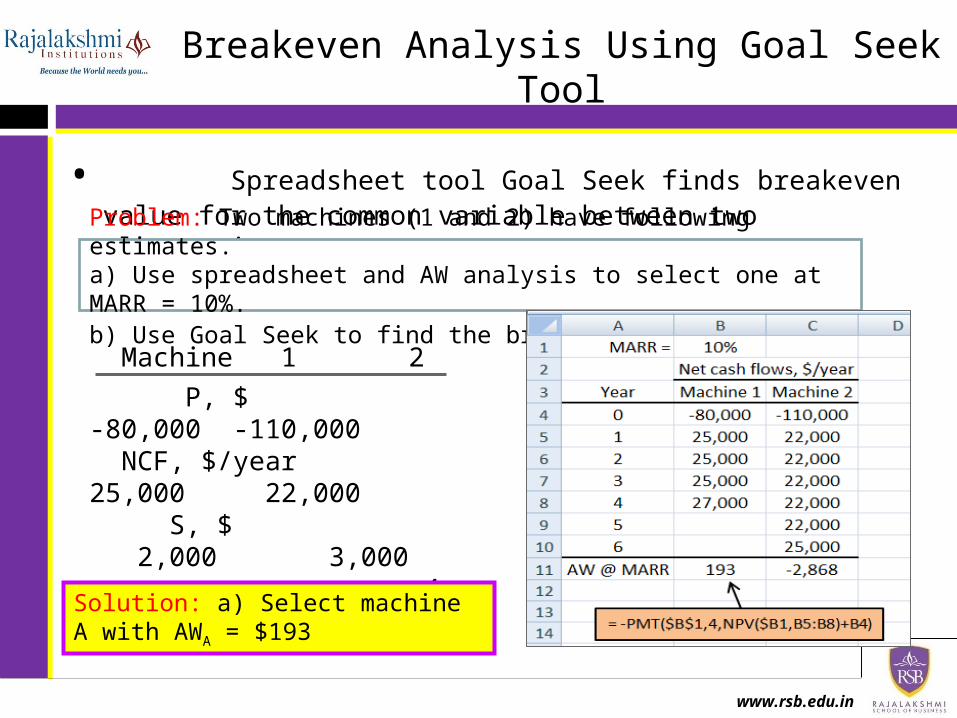
• Spreadsheet tool Goal Seek finds breakeven value for the common variable between two alternatives
Problem: Two machines (1 and 2) have following estimates. a) Use spreadsheet and AW analysis to select one at MARR = 10%.b) Use Goal Seek to find the breakeven first cost.
Machine 1 2
P, $ -80,000 -110,000 NCF, $/year 25,000 22,000 S, $ 2,000 3,000 n, years 4 6
Solution: a) Select machine A with AWA = $193
www.rsb.edu.in
Breakeven Analysis Using Goal Seek Tool
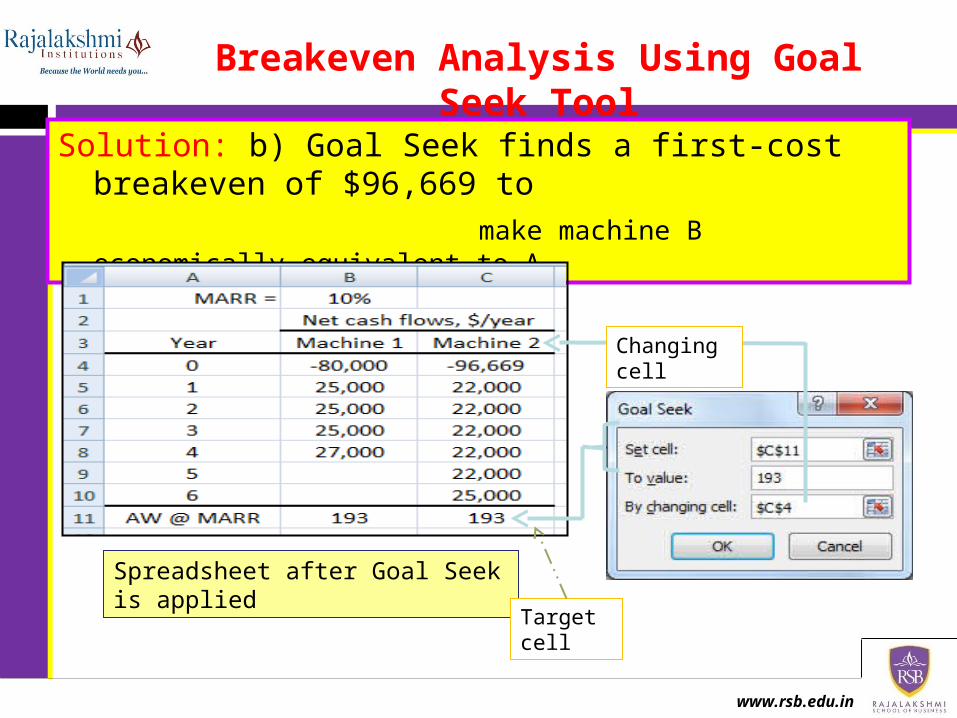
Solution: b) Goal Seek finds a first-cost breakeven of $96,669 to
make machine B economically equivalent to A
Spreadsheet after Goal Seek is applied
Changing cell
Target cell
www.rsb.edu.in
Payback Period Analysis
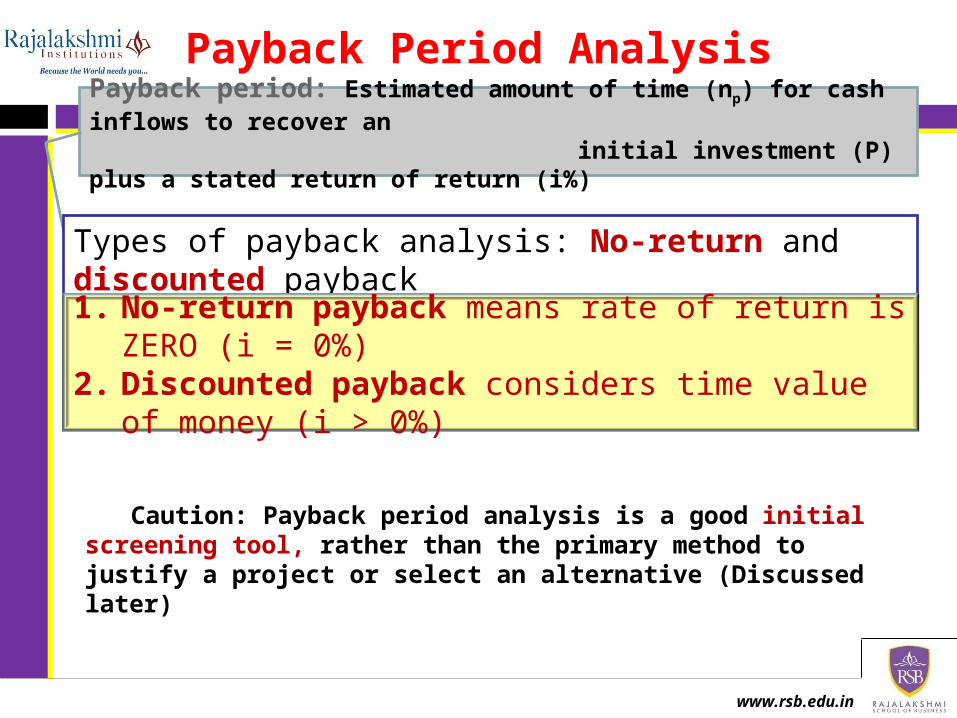
Caution: Payback period analysis is a good initial screening tool, rather than the primary method to justify a project or select an alternative (Discussed later)
Payback period: Estimated amount of time (np) for cash inflows to recover an initial investment (P) plus a stated return of return (i%)
Types of payback analysis: No-return and discounted payback1. No-return payback means rate of return is ZERO (i =
0%)2. Discounted payback considers time value of money (i
> 0%)
www.rsb.edu.in
Payback Period Computation
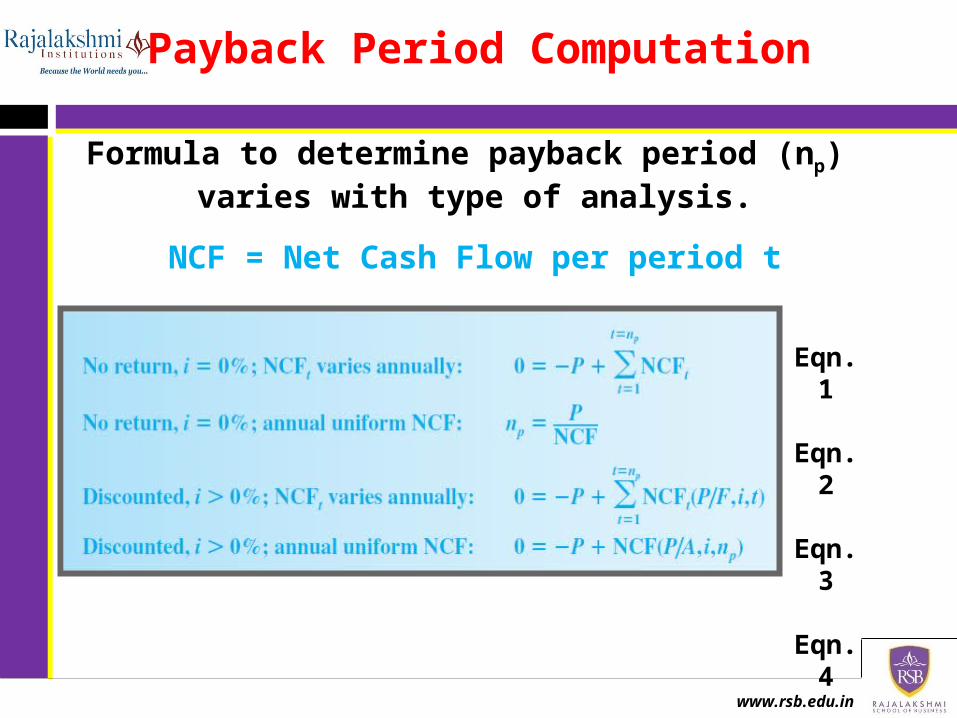
Formula to determine payback period (np) varies with type of analysis.
NCF = Net Cash Flow per period t
Eqn. 1
Eqn. 2
Eqn. 3
Eqn. 4
www.rsb.edu.in
Points to Remember About Payback Analysis
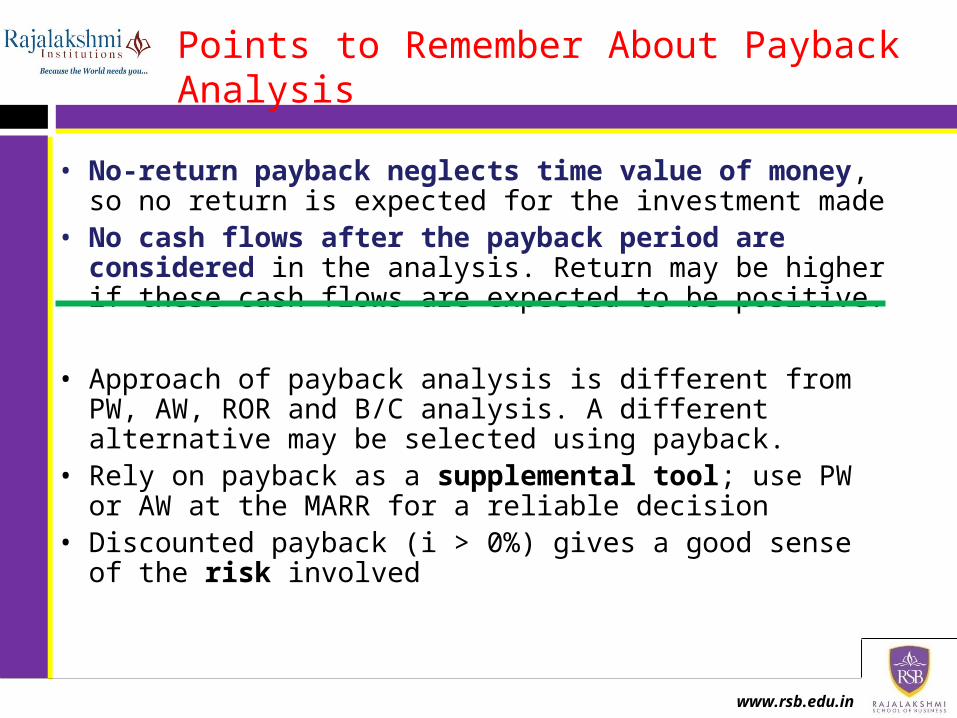
• No-return payback neglects time value of money, so no return is expected for the investment made
• No cash flows after the payback period are considered in the analysis. Return may be higher if these cash flows are expected to be positive.
• Approach of payback analysis is different from PW, AW, ROR and B/C analysis. A different alternative may be selected using payback.
• Rely on payback as a supplemental tool; use PW or AW at the MARR for a reliable decision
• Discounted payback (i > 0%) gives a good sense of the risk involved
www.rsb.edu.in
Example: Payback Analysis
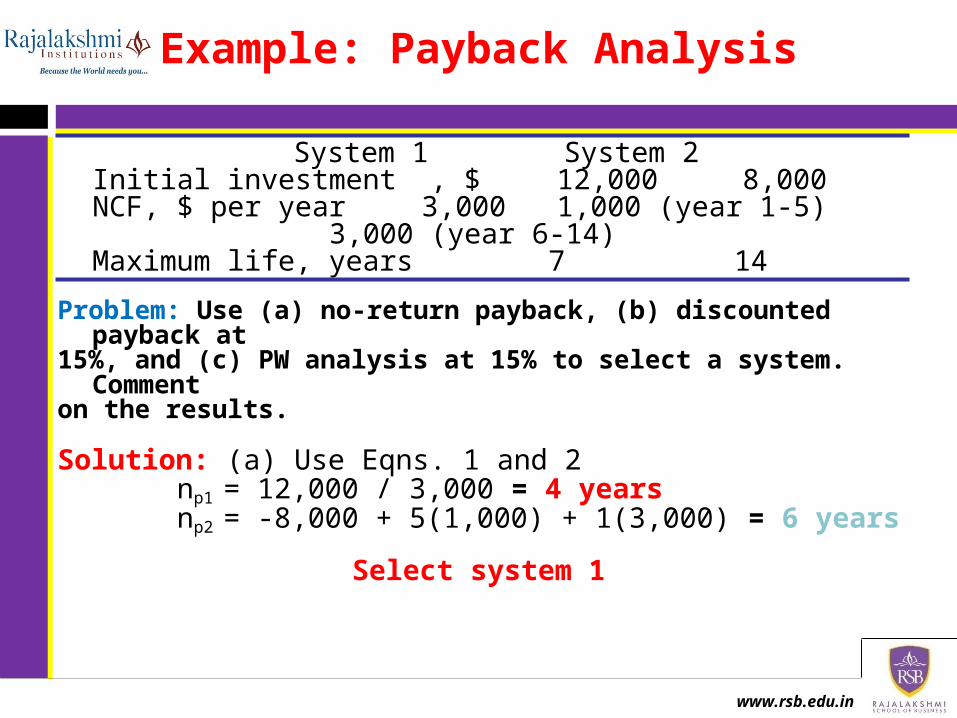
System 1 System 2Initial investment , $ 12,000 8,000NCF, $ per year 3,000 1,000 (year 1-5)
3,000 (year 6-14)Maximum life, years 7 14
Problem: Use (a) no-return payback, (b) discounted payback at15%, and (c) PW analysis at 15% to select a system. Commenton the results.
Solution: (a) Use Eqns. 1 and 2 np1 = 12,000 / 3,000 = 4 years np2 = -8,000 + 5(1,000) + 1(3,000) = 6 years
Select system 1
www.rsb.edu.in
Example: Payback Analysis (continued)
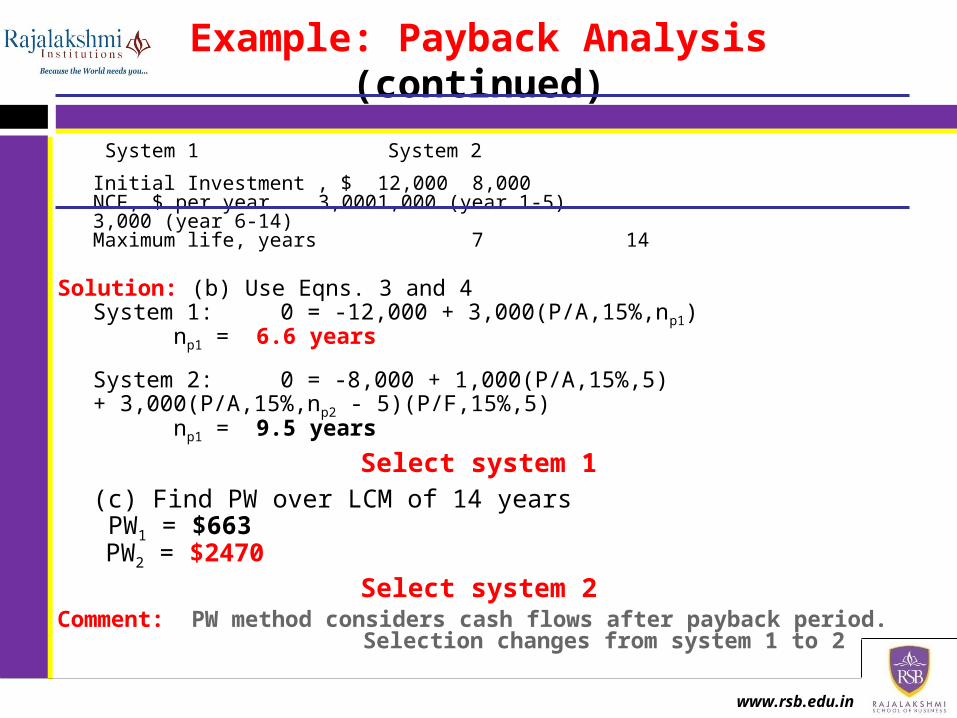
System 1 System 2
Initial Investment , $ 12,000 8,000NCF, $ per year 3,000 1,000 (year 1-5)
3,000 (year 6-14)Maximum life, years 7 14
Solution: (b) Use Eqns. 3 and 4System 1: 0 = -12,000 + 3,000(P/A,15%,np1)
np1 = 6.6 years
System 2: 0 = -8,000 + 1,000(P/A,15%,5) + 3,000(P/A,15%,np2 - 5)(P/F,15%,5)
np1 = 9.5 years
Select system 1(c) Find PW over LCM of 14 years
PW1 = $663 PW2 = $2470
Select system 2Comment: PW method considers cash flows after payback period.
Selection changes from system 1 to 2
www.rsb.edu.in
LEARNING OUTCOME
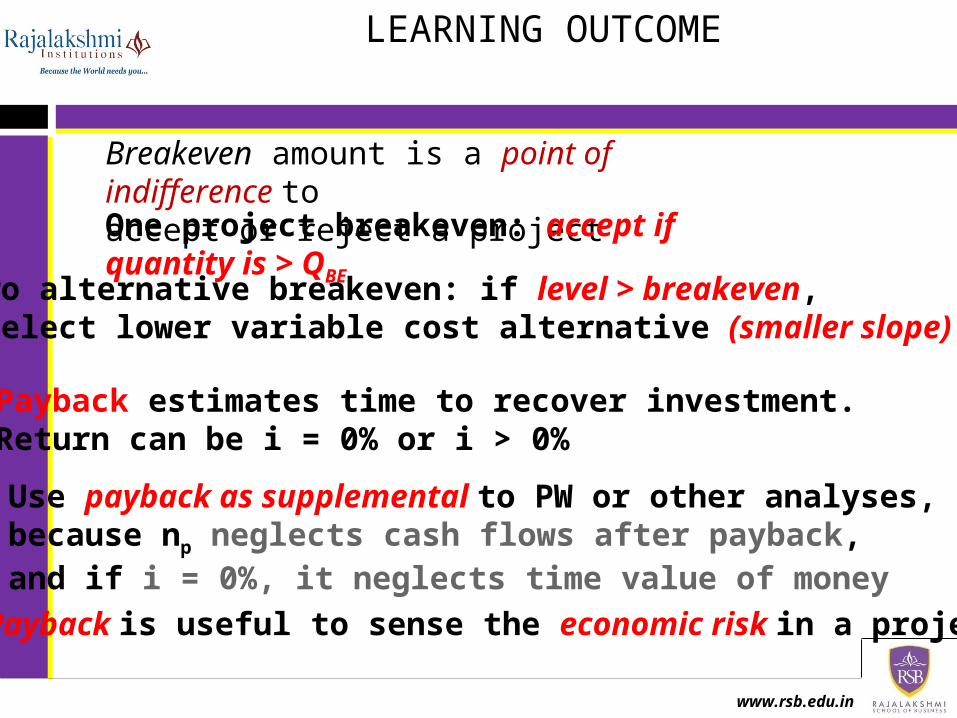
Breakeven amount is a point of indifference to accept or reject a projectOne project breakeven: accept if quantity is > QBE
Two alternative breakeven: if level > breakeven, select lower variable cost alternative (smaller slope)
Payback estimates time to recover investment.Return can be i = 0% or i > 0%
Use payback as supplemental to PW or other analyses, because np neglects cash flows after payback, and if i = 0%, it neglects time value of money
Payback is useful to sense the economic risk in a project