( awo x • q awo ) in
DESCRIPTION
( b x • Q b ) in. - PowerPoint PPT PresentationTRANSCRIPT
© From J. G. Webster (ed.), Medical instrumentation: application and design. 3rd ed. New York: John Wiley & Sons, 1998.
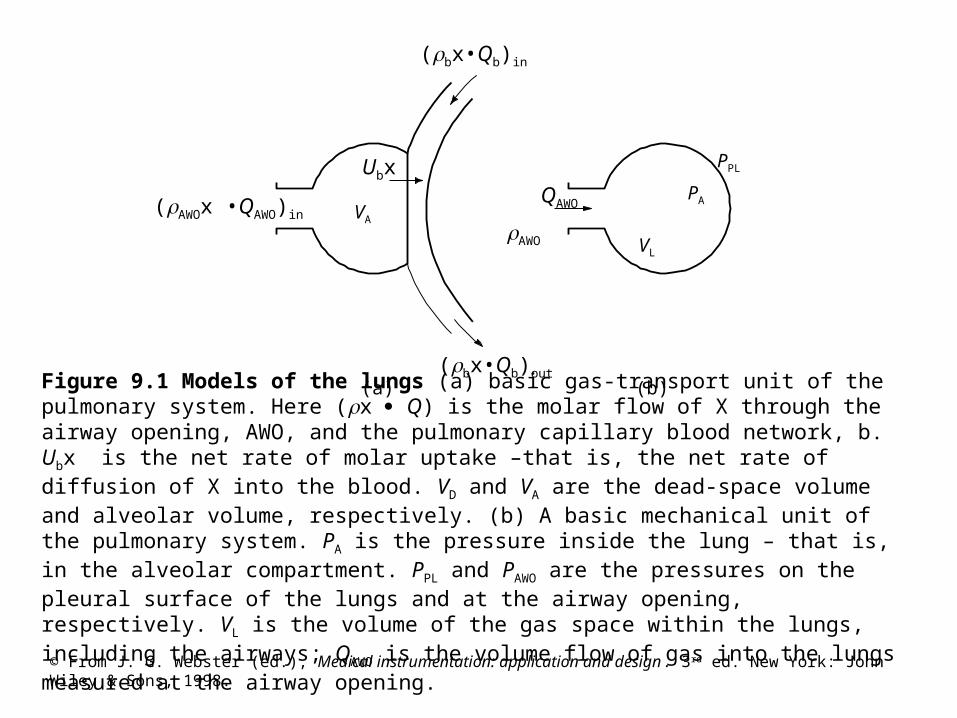
Figure 9.1 Models of the lungs (a) basic gas-transport unit of the pulmonary system. Here (x Q) is the molar flow of X through the airway opening, AWO, and the pulmonary capillary blood network, b. Ubx is the net rate of molar uptake –that is, the net rate of diffusion of X into the blood. VD and VA are the dead-space volume and alveolar volume, respectively. (b) A basic mechanical unit of the pulmonary system. PA is the pressure inside the lung – that is, in the alveolar compartment. PPL and PAWO are the pressures on the pleural surface of the lungs and at the airway opening, respectively. VL is the volume of the gas space within the lungs, including the airways; QAWO is the volume flow of gas into the lungs measured at the airway opening.
(AWOx •QAWO)in
VL
VA
PA
PPL
(a) (b)
(bx•Qb)in
AWO
QAWO
(bx•Qb)out
Ubx
© From J. G. Webster (ed.), Medical instrumentation: application and design. 3rd ed. New York: John Wiley & Sons, 1998.
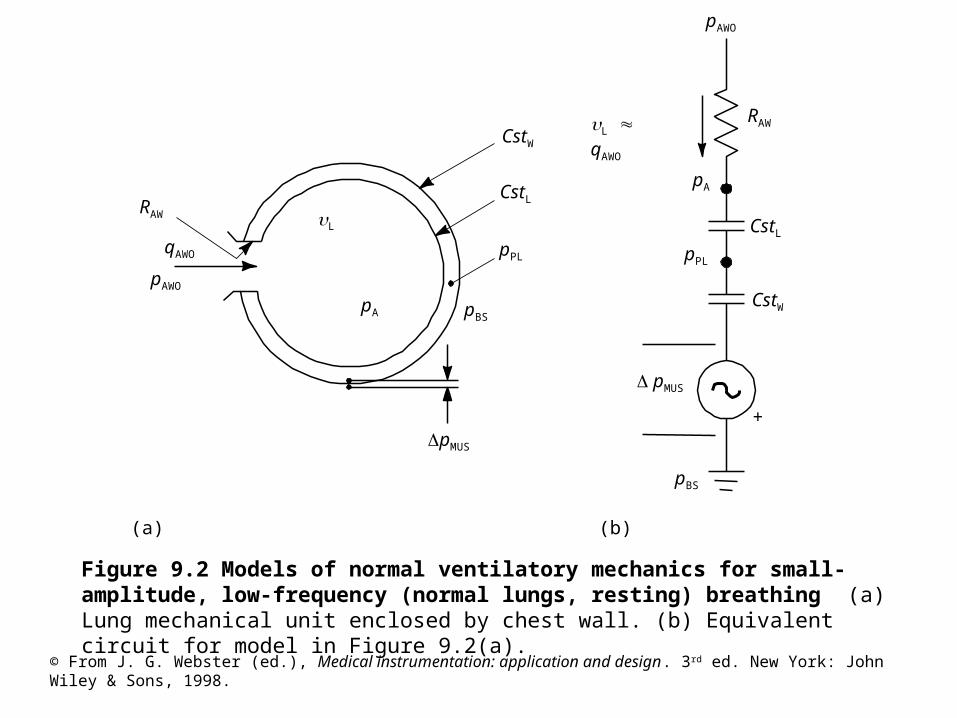
Figure 9.2 Models of normal ventilatory mechanics for small-amplitude, low-frequency (normal lungs, resting) breathing (a) Lung mechanical unit enclosed by chest wall. (b) Equivalent circuit for model in Figure 9.2(a).
CstW
pPL
pA
pMUS
L qAWO
pMUS
CstL
pPL
RAW L
pA
qAWO
pAWO
pBS
pAWO
RAW
CstL
(b)(a)
+
pBS
CstW
© From J. G. Webster (ed.), Medical instrumentation: application and design. 3rd ed. New York: John Wiley & Sons, 1998.
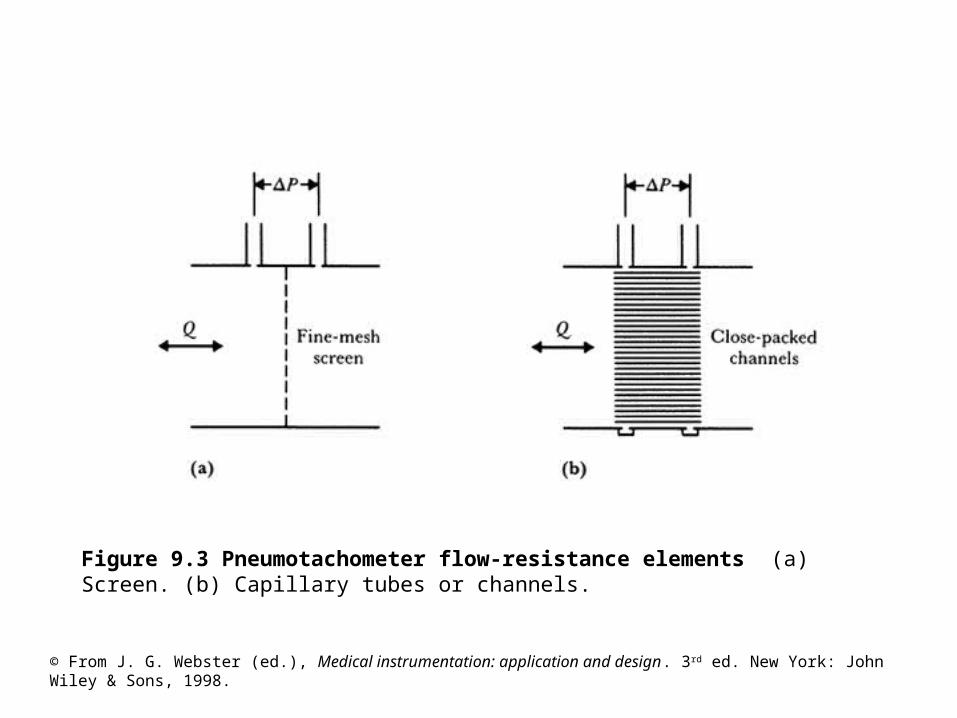
Figure 9.3 Pneumotachometer flow-resistance elements (a) Screen. (b) Capillary tubes or channels.
© From J. G. Webster (ed.), Medical instrumentation: application and design. 3rd ed. New York: John Wiley & Sons, 1998.
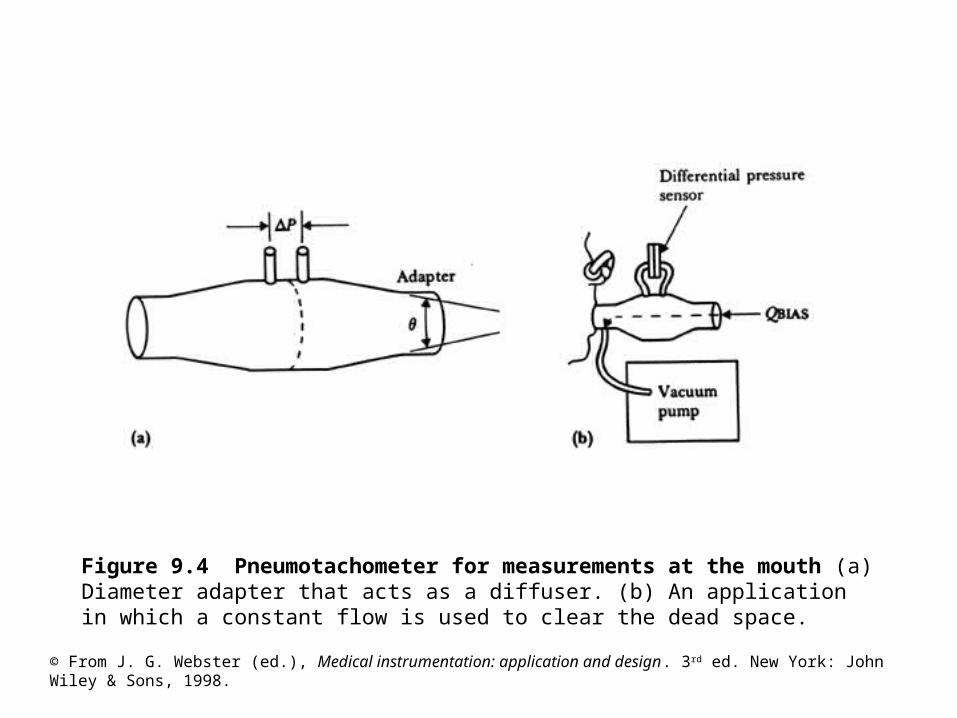
Figure 9.4 Pneumotachometer for measurements at the mouth (a) Diameter adapter that acts as a diffuser. (b) An application in which a constant flow is used to clear the dead space.
© From J. G. Webster (ed.), Medical instrumentation: application and design. 3rd ed. New York: John Wiley & Sons, 1998.
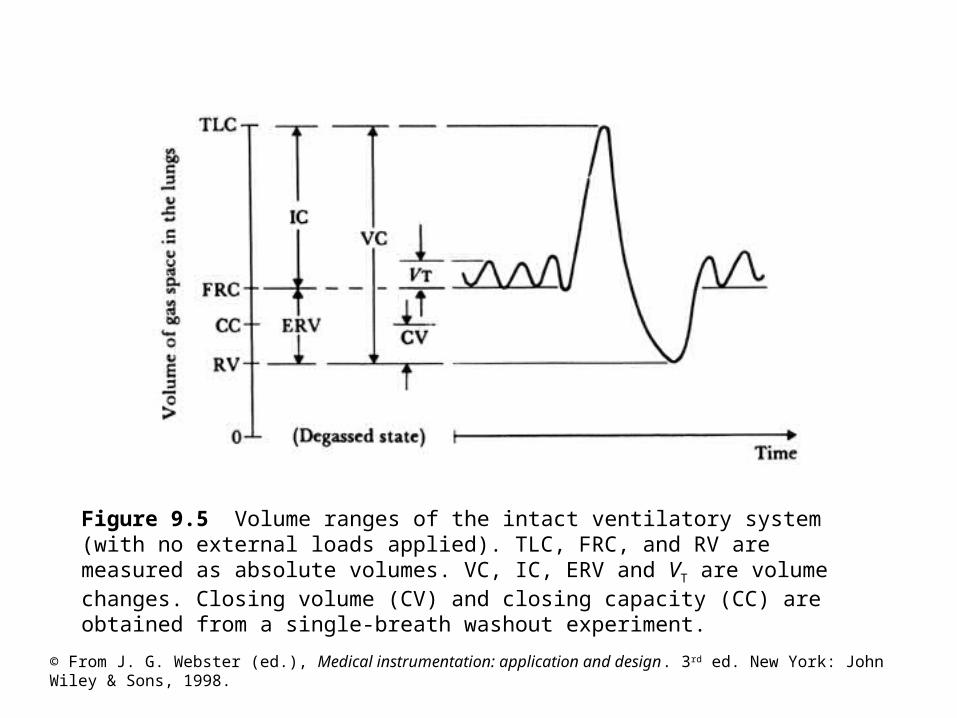
Figure 9.5 Volume ranges of the intact ventilatory system (with no external loads applied). TLC, FRC, and RV are measured as absolute volumes. VC, IC, ERV and VT are volume changes. Closing volume (CV) and closing capacity (CC) are obtained from a single-breath washout experiment.
© From J. G. Webster (ed.), Medical instrumentation: application and design. 3rd ed. New York: John Wiley & Sons, 1998.
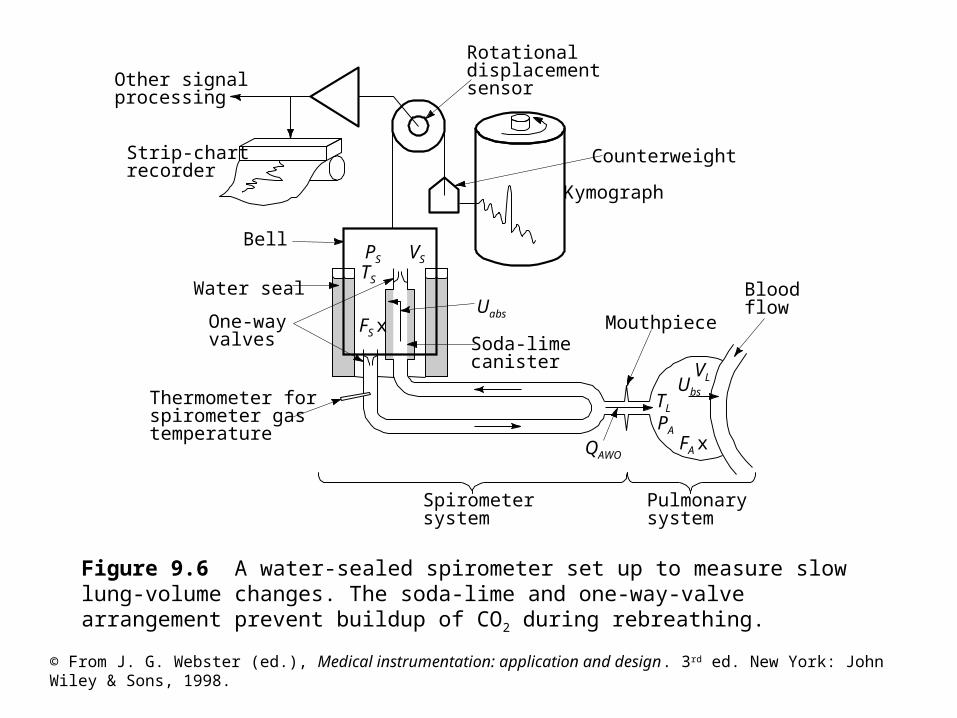
Figure 9.6 A water-sealed spirometer set up to measure slow lung-volume changes. The soda-lime and one-way-valve arrangement prevent buildup of CO2 during rebreathing.
VL
TL
PA
Other signalprocessing
Strip-chartrecorder
Thermometer forspirometer gastemperature
One-wayvalves
Water seal
Bell
Uabs
Soda-limecanister
Pulmonarysystem
Spirometersystem
Mouthpiece
QAWO
Bloodflow
Kymograph
Counterweight
Rotationaldisplacementsensor
PS VS
TS
FS x
FA x
Ubs
© From J. G. Webster (ed.), Medical instrumentation: application and design. 3rd ed. New York: John Wiley & Sons, 1998.
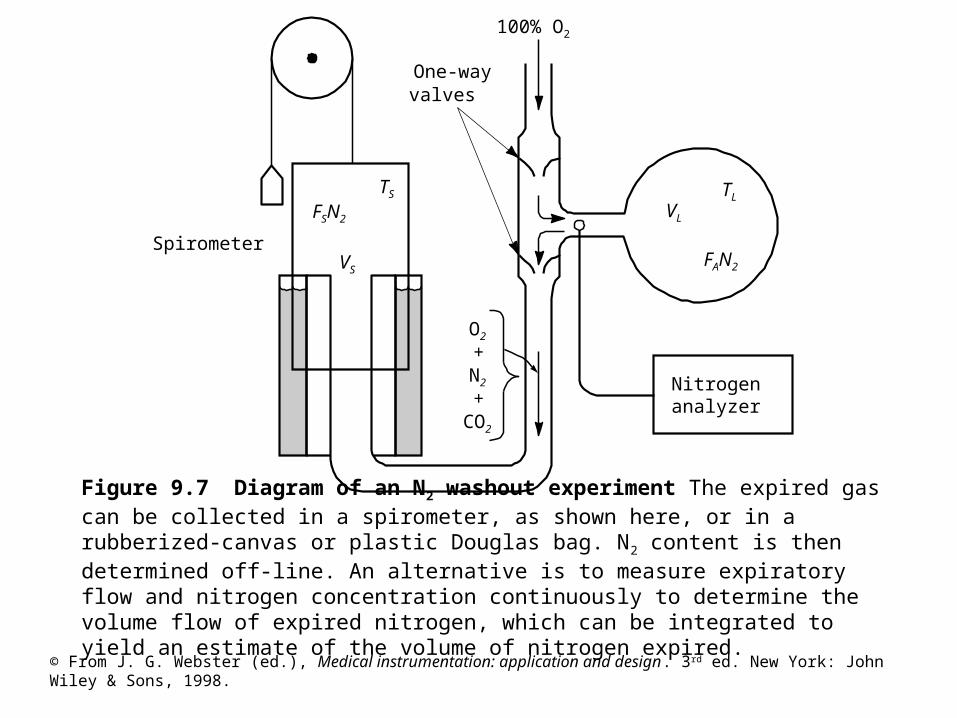
Figure 9.7 Diagram of an N2 washout experiment The expired gas can be collected in a spirometer, as shown here, or in a rubberized-canvas or plastic Douglas bag. N2 content is then determined off-line. An alternative is to measure expiratory flow and nitrogen concentration continuously to determine the volume flow of expired nitrogen, which can be integrated to yield an estimate of the volume of nitrogen expired.
Nitrogenanalyzer
100% O2
O2
+N2
+CO2
VL
TL
FAN2
TS
VS
Spirometer
One-wayvalves
FSN2
© From J. G. Webster (ed.), Medical instrumentation: application and design. 3rd ed. New York: John Wiley & Sons, 1998.
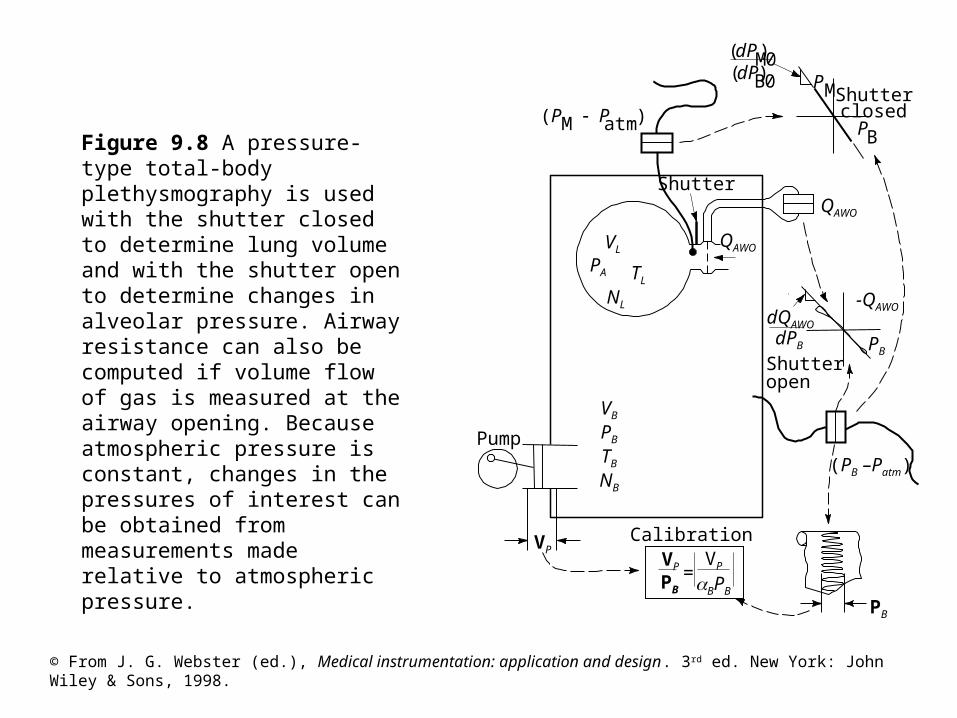
Figure 9.8 A pressure-type total-body plethysmography is used with the shutter closed to determine lung volume and with the shutter open to determine changes in alveolar pressure. Airway resistance can also be computed if volume flow of gas is measured at the airway opening. Because atmospheric pressure is constant, changes in the pressures of interest can be obtained from measurements made relative to atmospheric pressure.
Pump
Shutter
(PM Patm )
Shutteropen
Calibration
=
PB
Shutterclosed
VB
VP
PB BPB
QAWO
QAWO
-QAWO
VL
(dPM)0(dPB)0
PB
PB
PM
PB
PA
TB
TL
NB
NL
VP
VP
dQAWO
dPB
(PB –Patm)
© From J. G. Webster (ed.), Medical instrumentation: application and design. 3rd ed. New York: John Wiley & Sons, 1998.
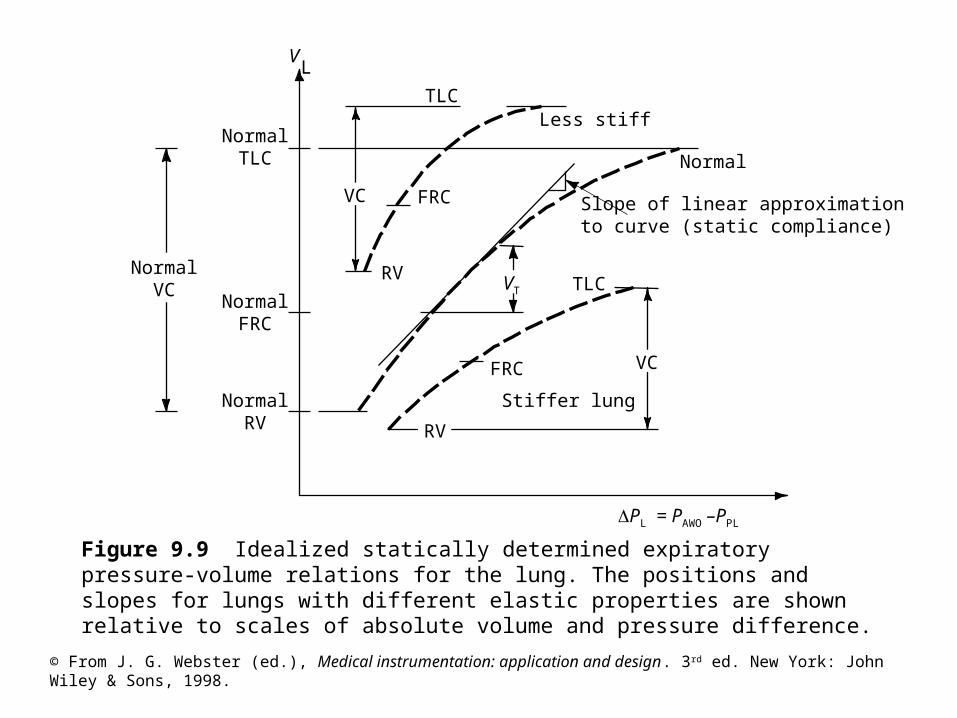
Figure 9.9 Idealized statically determined expiratory pressure-volume relations for the lung. The positions and slopes for lungs with different elastic properties are shown relative to scales of absolute volume and pressure difference.
NormalTLC
TLC
NormalFRC
Slope of linear approximationto curve (static compliance)
VL
Stiffer lung
TLC
FRC
FRC
Less stiff
Normal
RV
NormalRV
NormalVC
VC
VT
RV
VC
PL = PAWO –PPL
© From J. G. Webster (ed.), Medical instrumentation: application and design. 3rd ed. New York: John Wiley & Sons, 1998.
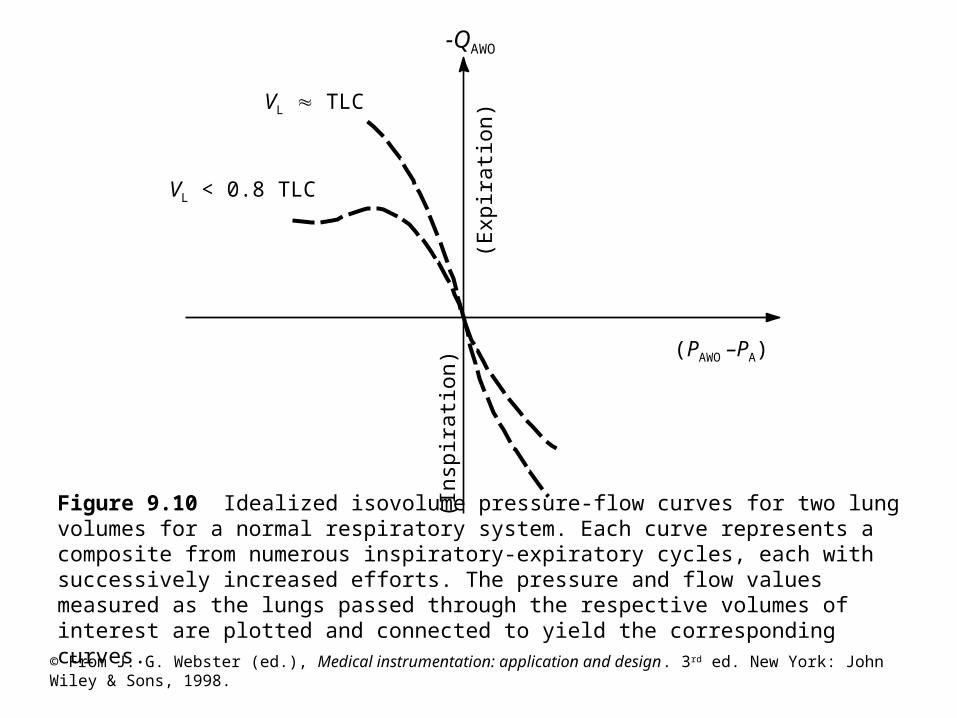
Figure 9.10 Idealized isovolume pressure-flow curves for two lung volumes for a normal respiratory system. Each curve represents a composite from numerous inspiratory-expiratory cycles, each with successively increased efforts. The pressure and flow values measured as the lungs passed through the respective volumes of interest are plotted and connected to yield the corresponding curves.
VL < 0.8 TLC
VL TLC
(PAWO –PA)
-QAWO
(Ins
pira
tion
)
(Exp
irat
ion)
© From J. G. Webster (ed.), Medical instrumentation: application and design. 3rd ed. New York: John Wiley & Sons, 1998.
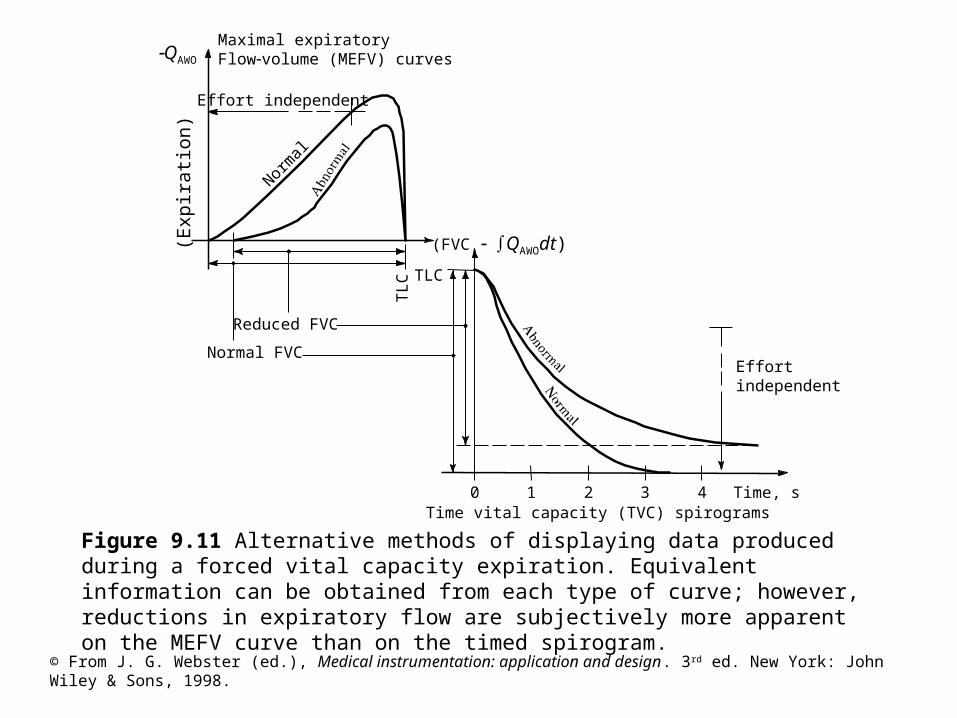
Figure 9.11 Alternative methods of displaying data produced during a forced vital capacity expiration. Equivalent information can be obtained from each type of curve; however, reductions in expiratory flow are subjectively more apparent on the MEFV curve than on the timed spirogram.
Maximal expiratoryFlowvolume (MEFV) curves
Effortindependent
Time vital capacity (TVC) spirograms0 1 2 3 4 Time, s
TLC
(FVC QAWOdt)
Normal FVC
Reduced FVC
Normal
Effort independent
TL
C
QAWO
(Exp
irat
ion)
© From J. G. Webster (ed.), Medical instrumentation: application and design. 3rd ed. New York: John Wiley & Sons, 1998.
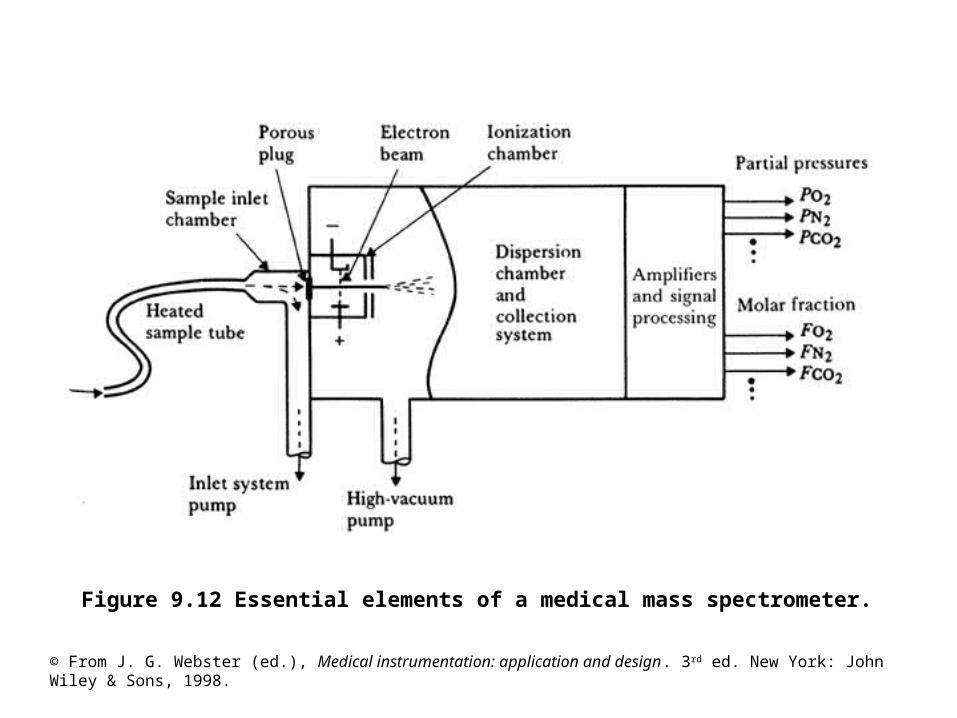
Figure 9.12 Essential elements of a medical mass spectrometer.
© From J. G. Webster (ed.), Medical instrumentation: application and design. 3rd ed. New York: John Wiley & Sons, 1998.
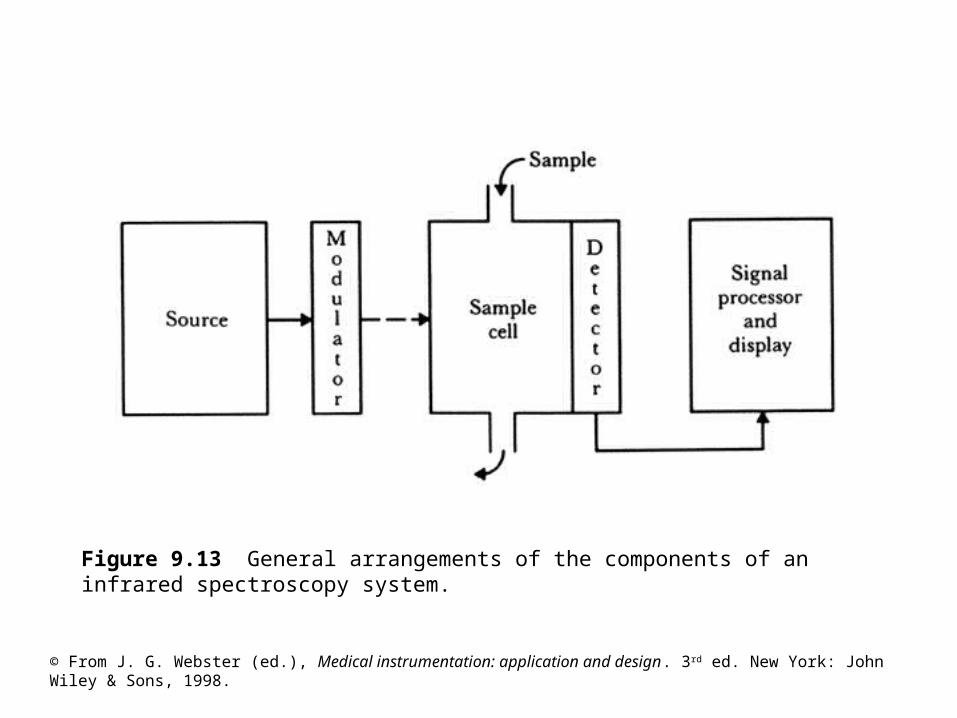
Figure 9.13 General arrangements of the components of an infrared spectroscopy system.
© From J. G. Webster (ed.), Medical instrumentation: application and design. 3rd ed. New York: John Wiley & Sons, 1998.
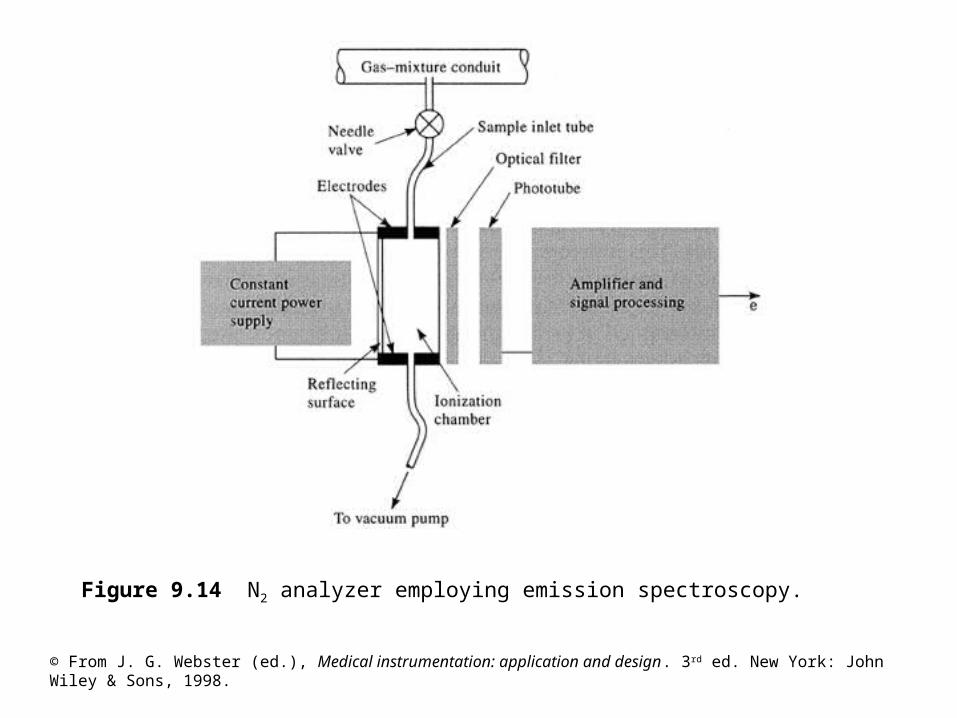
Figure 9.14 N2 analyzer employing emission spectroscopy.
© From J. G. Webster (ed.), Medical instrumentation: application and design. 3rd ed. New York: John Wiley & Sons, 1998.
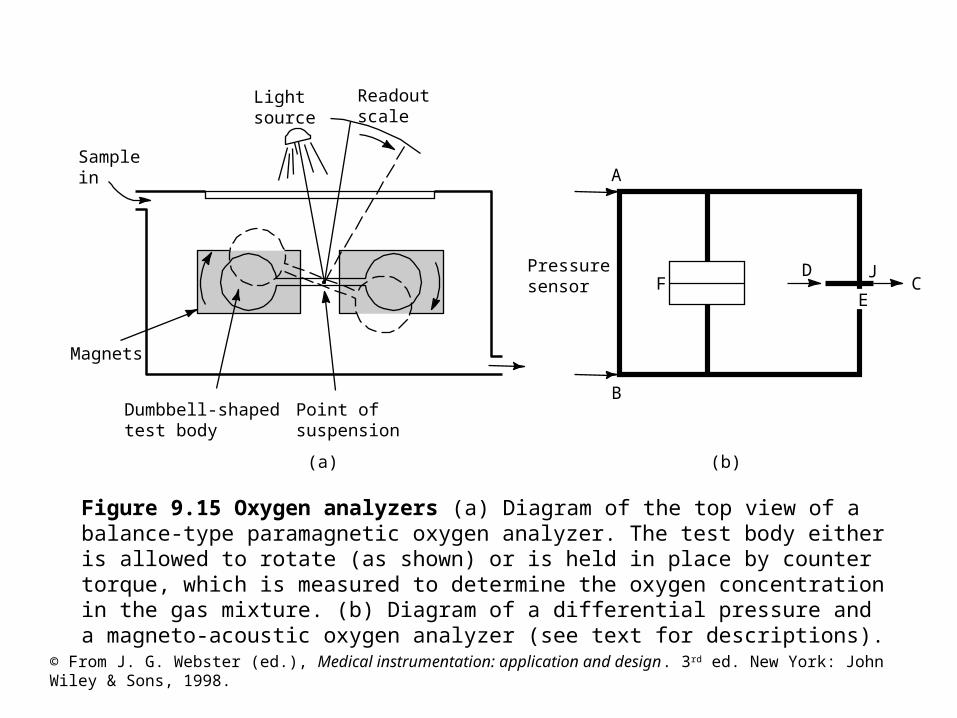
Figure 9.15 Oxygen analyzers (a) Diagram of the top view of a balance-type paramagnetic oxygen analyzer. The test body either is allowed to rotate (as shown) or is held in place by counter torque, which is measured to determine the oxygen concentration in the gas mixture. (b) Diagram of a differential pressure and a magneto-acoustic oxygen analyzer (see text for descriptions).
Pressuresensor F
A
Readoutscale
(a) (b)
Point ofsuspension
Dumbbell-shapedtest body
Samplein
Magnets
Lightsource
B
D JC
E
© From J. G. Webster (ed.), Medical instrumentation: application and design. 3rd ed. New York: John Wiley & Sons, 1998.
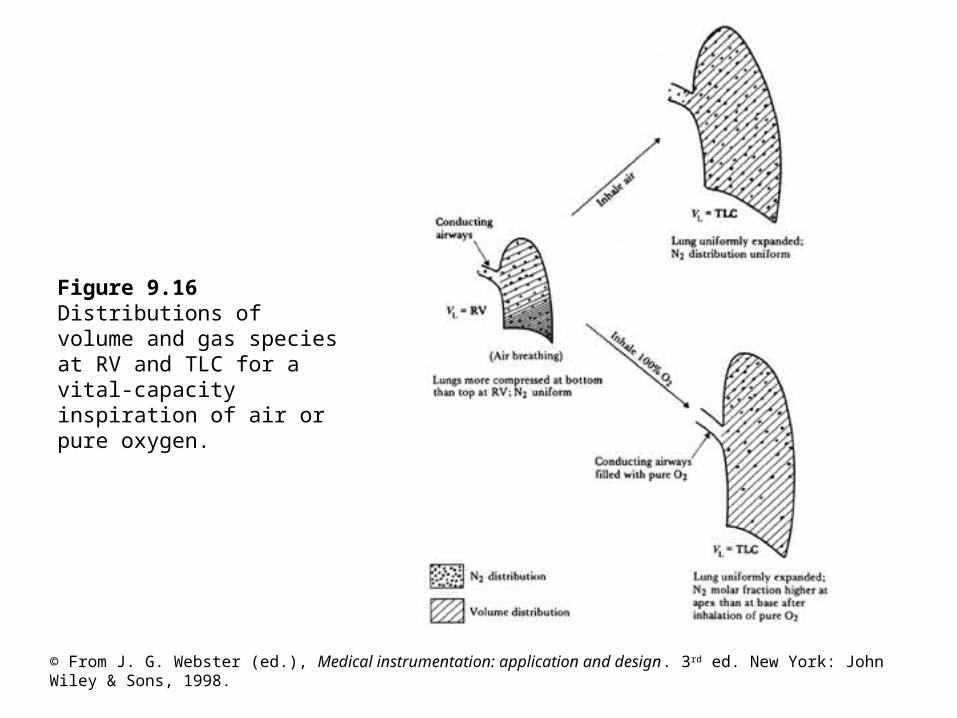
Figure 9.16 Distributions of volume and gas species at RV and TLC for a vital-capacity inspiration of air or pure oxygen.
© From J. G. Webster (ed.), Medical instrumentation: application and design. 3rd ed. New York: John Wiley & Sons, 1998.
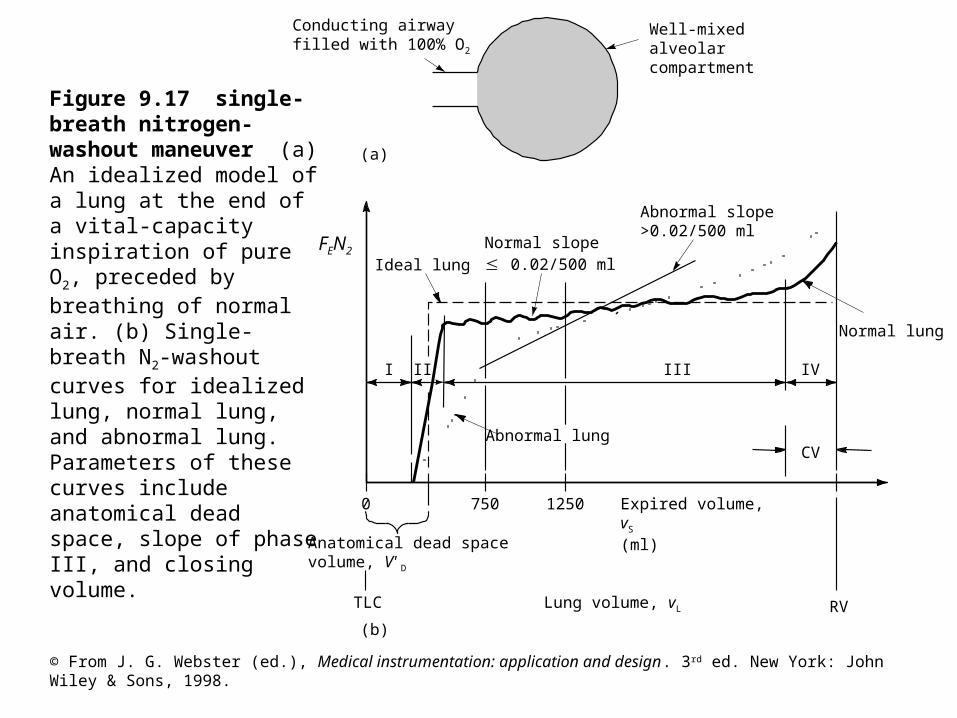
Figure 9.17 single-breath nitrogen-washout maneuver (a) An idealized model of a lung at the end of a vital-capacity inspiration of pure O2, preceded by breathing of normal air. (b) Single-breath N2-washout curves for idealized lung, normal lung, and abnormal lung. Parameters of these curves include anatomical dead space, slope of phase III, and closing volume.
Normal slope 0.02/500 ml
Abnormal slope>0.02/500 ml
Anatomical dead spacevolume, V' D
CV
TLC RV
0 750 1250
Lung volume, vL
Expired volume, vS
(ml)
IVIIIIII
Ideal lung
Well-mixed alveolarcompartment
Conducting airwayfilled with 100% O2
Normal lung
Abnormal lung
(a)
(b)
FEN2