– a survey - capgemini the way we see it preface 3 1 introduction of commodity risk management 6...
TRANSCRIPT
Commodity risk mitigation – A survey

The survey and the report are prepared by:
Roel Delnooz, Michael Heeren, Jan Jaap Hoegee, Lia Josten, Henk Jan Meints, Dennis Pronk and Peter Tielemans
The survey and the report are prepared by:The survey and the report are prepared by:The survey and the report are prepared by:
Roel Delnooz, Michael Heeren, Jan Jaap Hoegee, Roel Delnooz, Michael Heeren, Jan Jaap Hoegee, Roel Delnooz, Michael Heeren, Jan Jaap Hoegee, Lia Josten, Henk Jan Meints, Dennis Pronk and Lia Josten, Henk Jan Meints, Dennis Pronk and Lia Josten, Henk Jan Meints, Dennis Pronk and Peter Tielemans Peter Tielemans
1
the way we see it
Commodity risk mitigation - A survey
Utrecht, March 2014

2 Commodity risk mitigation – A survey2
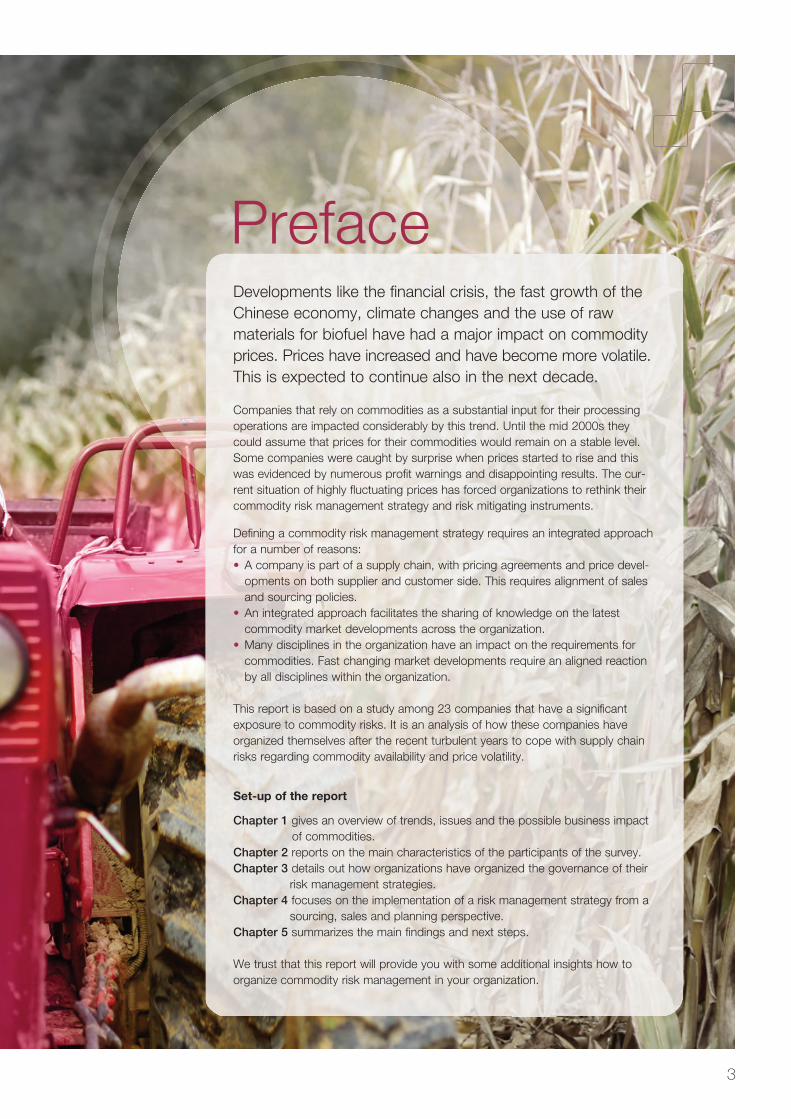
Developments like the financial crisis, the fast growth of the Chinese economy, climate changes and the use of raw materials for biofuel have had a major impact on commodity prices. Prices have increased and have become more volatile.This is expected to continue also in the next decade.
Companies that rely on commodities as a substantial input for their processing operations are impacted considerably by this trend. Until the mid 2000s they could assume that prices for their commodities would remain on a stable level. Some companies were caught by surprise when prices started to rise and this was evidenced by numerous profit warnings and disappointing results. The cur-rent situation of highly fluctuating prices has forced organizations to rethink their commodity risk management strategy and risk mitigating instruments.
Defining a commodity risk management strategy requires an integrated approach for a number of reasons:• A company is part of a supply chain, with pricing agreements and price devel-
opments on both supplier and customer side. This requires alignment of sales and sourcing policies.
• An integrated approach facilitates the sharing of knowledge on the latestcommodity market developments across the organization.
• Many disciplines in the organization have an impact on the requirements for commodities. Fast changing market developments require an aligned reaction by all disciplines within the organization.
This report is based on a study among 23 companies that have a significant exposure to commodity risks. It is an analysis of how these companies have organized themselves after the recent turbulent years to cope with supply chain risks regarding commodity availability and price volatility.
Set-up of the report
Chapter 1 gives an overview of trends, issues and the possible business impact of commodities.
Chapter 2 reports on the main characteristics of the participants of the survey.Chapter 3 details out how organizations have organized the governance of their
risk management strategies.Chapter 4 focuses on the implementation of a risk management strategy from a
sourcing, sales and planning perspective.Chapter 5 summarizes the main findings and next steps. We trust that this report will provide you with some additional insights how to organize commodity risk management in your organization.
Preface
3
the way we see it

4 Commodity risk mitigation – A survey4 Commodity risk mitigation – A survey
5
the way we see it
Preface 3
1 Introduction of commodity risk management 6Impact on businesses 9Overview of strategies to manage commodity risks 10Introduction of this study 10
2 Characteristics of the participants 11Size and scale of the operations 12Sector, supply chain role and commodity risk exposure 12
3 Governance of commodity risk management 14Strategy & Objectives 15Stakeholders in development of the strategy 16KPIs 17
4 Perspectives on commodity risk management 19Sourcing perspective 20Sales perspective 24Planning perspective 25
5 Key findings and Way forward 30
Contents
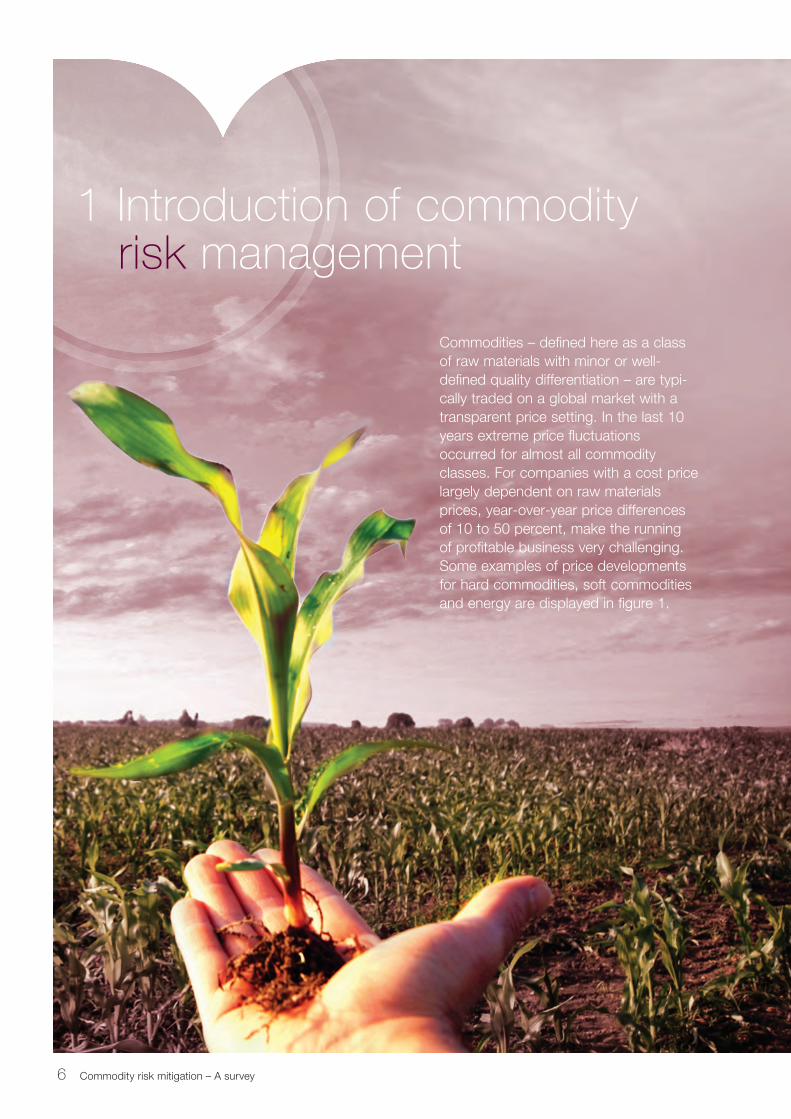
1 Introduction of commodity risk management
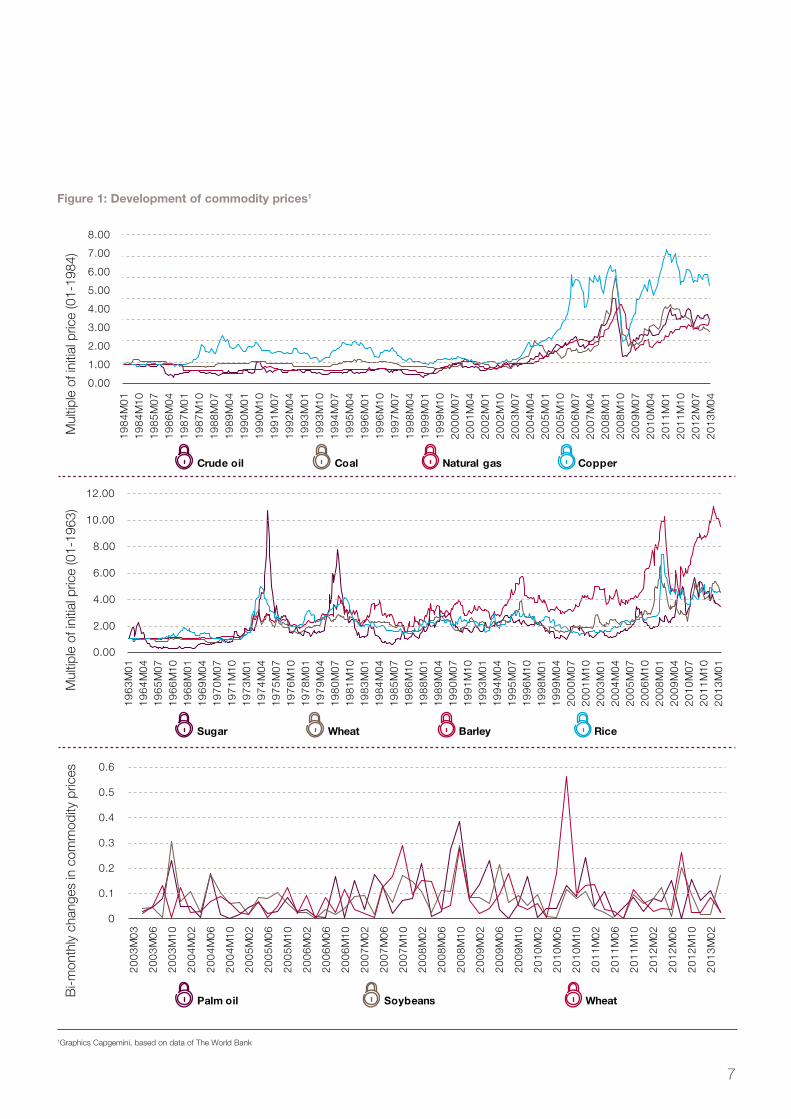
Commodities – defined here as a class of raw materials with minor or well-defined quality differentiation – are typi-cally traded on a global market with a transparent price setting. In the last 10 years extreme price fluctuations occurred for almost all commodityclasses. For companies with a cost price largely dependent on raw materialsprices, year-over-year price differences of 10 to 50 percent, make the runningof profitable business very challenging. Some examples of price developments for hard commodities, soft commodities and energy are displayed in figure 1.
6 Commodity risk mitigation – A survey
0.00
1.00
2.00
3.00
4.00
5.00
6.00
7.00
8.00
19
84
M0
11
98
4M
10
19
85
M0
71
98
6M
04
19
87
M0
11
98
7M
10
19
88
M0
71
98
9M
04
19
90
M0
11
99
0M
10
19
91
M0
71
99
2M
04
19
93
M0
11
99
3M
10
19
94
M0
71
99
5M
04
19
96
M0
11
99
6M
10
19
97
M0
71
99
8M
04
19
99
M0
11
99
9M
10
20
00
M0
72
00
1M
04
20
02
M0
12
00
2M
10
20
03
M0
72
00
4M
04
20
05
M0
12
00
5M
10
20
06
M0
72
00
7M
04
20
08
M0
12
00
8M
10
20
09
M0
72
01
0M
04
20
11
M0
12
01
1M
10
20
12
M0
72
01
3M
04
0.00
2.00
4.00
6.00
8.00
10.00
12.00
19
63
M0
11
96
4M
04
19
65
M0
71
96
6M
10
19
68
M0
11
96
9M
04
19
70
M0
71
97
1M
10
19
73
M0
11
97
4M
04
19
75
M0
71
97
6M
10
19
78
M0
11
97
9M
04
19
80
M0
71
98
1M
10
19
83
M0
11
98
4M
04
19
85
M0
71
98
6M
10
19
88
M0
11
98
9M
04
19
90
M0
71
99
1M
10
19
93
M0
11
99
4M
04
19
95
M0
71
99
6M
10
19
98
M0
11
99
9M
04
20
00
M0
72
00
1M
10
20
03
M0
12
00
4M
04
20
05
M0
72
00
6M
10
20
08
M0
12
00
9M
04
20
10
M0
72
01
1M
10
20
13
M0
1
0
0.1
0.2
0.3
0.4
0.5
0.6
20
03
M0
3
20
03
M0
6
20
03
M1
0
20
04
M0
2
20
04
M0
6
20
04
M1
0
20
05
M0
2
20
05
M0
6
20
05
M1
0
20
06
M0
2
20
06
M0
6
20
06
M1
0
20
07
M0
2
20
07
M0
6
20
07
M1
0
20
08
M0
2
20
08
M0
6
20
08
M1
0
20
09
M0
2
20
09
M0
6
20
09
M1
0
20
10
M0
2
20
10
M0
6
20
10
M1
0
20
11
M0
2
20
11
M0
6
20
11
M1
0
20
12
M0
2
20
12
M0
6
20
12
M1
0
20
13
M0
2
Crude oil Coal Natural gas Copper
Sugar Wheat Barley
Palm oil Soybeans Wheat
Rice
Mul
tiple
of i
nitia
l pric
e (0
1-19
84)
Mul
tiple
of i
nitia
l pric
e (0
1-19
63)
Bi-m
onth
ly c
hang
es in
com
mod
ity p
rices
7
the way we see it
1Graphics Capgemini, based on data of The World Bank
Figure 1: Development of commodity prices1
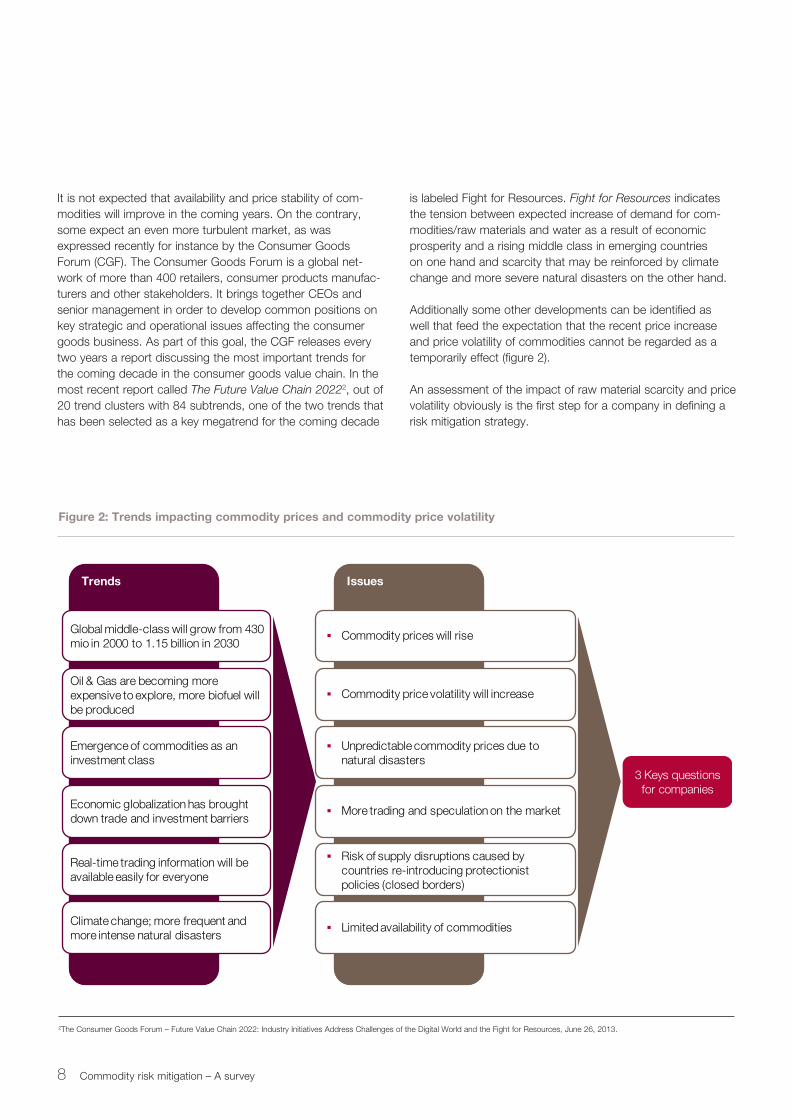
It is not expected that availability and price stability of com-modities will improve in the coming years. On the contrary, some expect an even more turbulent market, as was expressed recently for instance by the Consumer Goods Forum (CGF). The Consumer Goods Forum is a global net-work of more than 400 retailers, consumer products manufac-turers and other stakeholders. It brings together CEOs and senior management in order to develop common positions on key strategic and operational issues affecting the consumer goods business. As part of this goal, the CGF releases every two years a report discussing the most important trends for the coming decade in the consumer goods value chain. In the most recent report called The Future Value Chain 20222, out of 20 trend clusters with 84 subtrends, one of the two trends that has been selected as a key megatrend for the coming decade
Issues
§ Limited availability of commodities
§ Risk of supply disruptions caused bycountries re-introducing protectionistpolicies (closed borders)
§ More trading and speculation on the market
§ Unpredictable commodity prices due tonatural disasters
§ Commodity price volatility will increase
§ Commodity prices will rise
Trends
Global middle-class will grow from 430mio in 2000 to 1.15 billion in 2030
Oil & Gas are becoming moreexpensive to explore, more biofuel willbe produced
Emergence of commodities as aninvestment class
Economic globalization has broughtdown trade and investment barriers
Real-time trading information will beavailable easily for everyone
Climate change; more frequent andmore intense natural disasters
3 Keys questionsfor companies
is labeled Fight for Resources. Fight for Resources indicates the tension between expected increase of demand for com-modities/raw materials and water as a result of economic prosperity and a rising middle class in emerging countries on one hand and scarcity that may be reinforced by climate change and more severe natural disasters on the other hand.
Additionally some other developments can be identified as well that feed the expectation that the recent price increase and price volatility of commodities cannot be regarded as a temporarily effect (figure 2).
An assessment of the impact of raw material scarcity and price volatility obviously is the first step for a company in defining a risk mitigation strategy.
8 Commodity risk mitigation – A survey
2The Consumer Goods Forum – Future Value Chain 2022: Industry Initiatives Address Challenges of the Digital World and the Fight for Resources, June 26, 2013.
Figure 2: Trends impacting commodity prices and commodity price volatility
The potential impact of commodity price volatility on the finan-cial results of a company depends on several factors:• Volatility of commodity prices: the price volatility of the com-
modities used by the company.• Commodity cost share: the percentage of the final product
costs that faces the risk of commodity markets.• Price changes transfer: the ability to transfer the price risk to
customers in a timely manner
The potential impact of commodity volume availability on the financial results of a company depends on the followingfactors:• Supply risk: the potential effect of supply disruptions on a
company’s earnings.• Demand risk: the potential effect of demand disruptions (for
example due to price swings) on a company’s earnings.
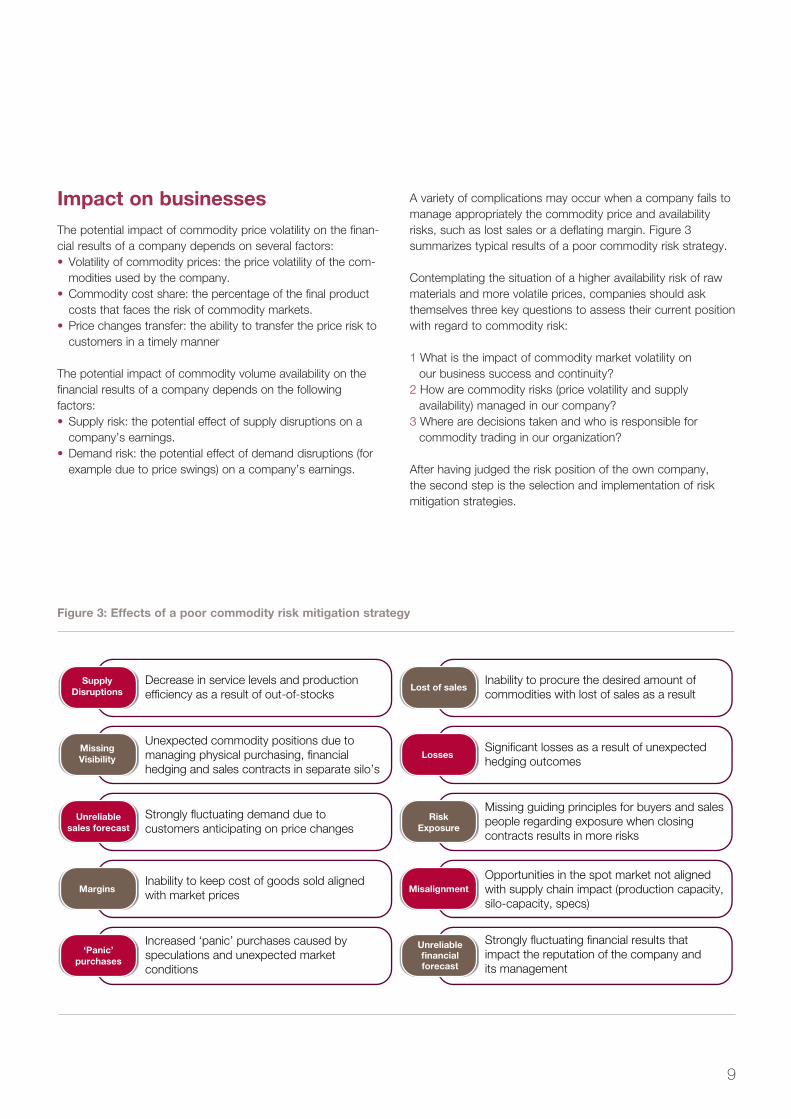
Impact on businesses A variety of complications may occur when a company fails to manage appropriately the commodity price and availability risks, such as lost sales or a deflating margin. Figure 3 summarizes typical results of a poor commodity risk strategy.
Contemplating the situation of a higher availability risk of raw materials and more volatile prices, companies should ask themselves three key questions to assess their current position with regard to commodity risk:
1 What is the impact of commodity market volatility on our business success and continuity?
2 How are commodity risks (price volatility and supplyavailability) managed in our company?
3 Where are decisions taken and who is responsible forcommodity trading in our organization?
After having judged the risk position of the own company,the second step is the selection and implementation of risk mitigation strategies.
9
the way we see it
SupplyDisruptions
MissingVisibility
Unreliablesales forecast
Margins
‘Panic’purchases
Lost of sales
Losses
RiskExposure
Misalignment
Unreliablefinancialforecast
Decrease in service levels and productionefficiency as a result of out-of-stocks
Inability to procure the desired amount ofcommodities with lost of sales as a result
Significant losses as a result of unexpectedhedging outcomes
Missing guiding principles for buyers and salespeople regarding exposure when closingcontracts results in more risks
Opportunities in the spot market not alignedwith supply chain impact (production capacity,silo-capacity, specs)
Strongly fluctuating financial results thatimpact the reputation of the company andits management
Unexpected commodity positions due to managing physical purchasing, financialhedging and sales contracts in separate silo’s
Strongly fluctuating demand due tocustomers anticipating on price changes
Inability to keep cost of goods sold alignedwith market prices
Increased ‘panic’ purchases caused byspeculations and unexpected marketconditions
Figure 3: Effects of a poor commodity risk mitigation strategy
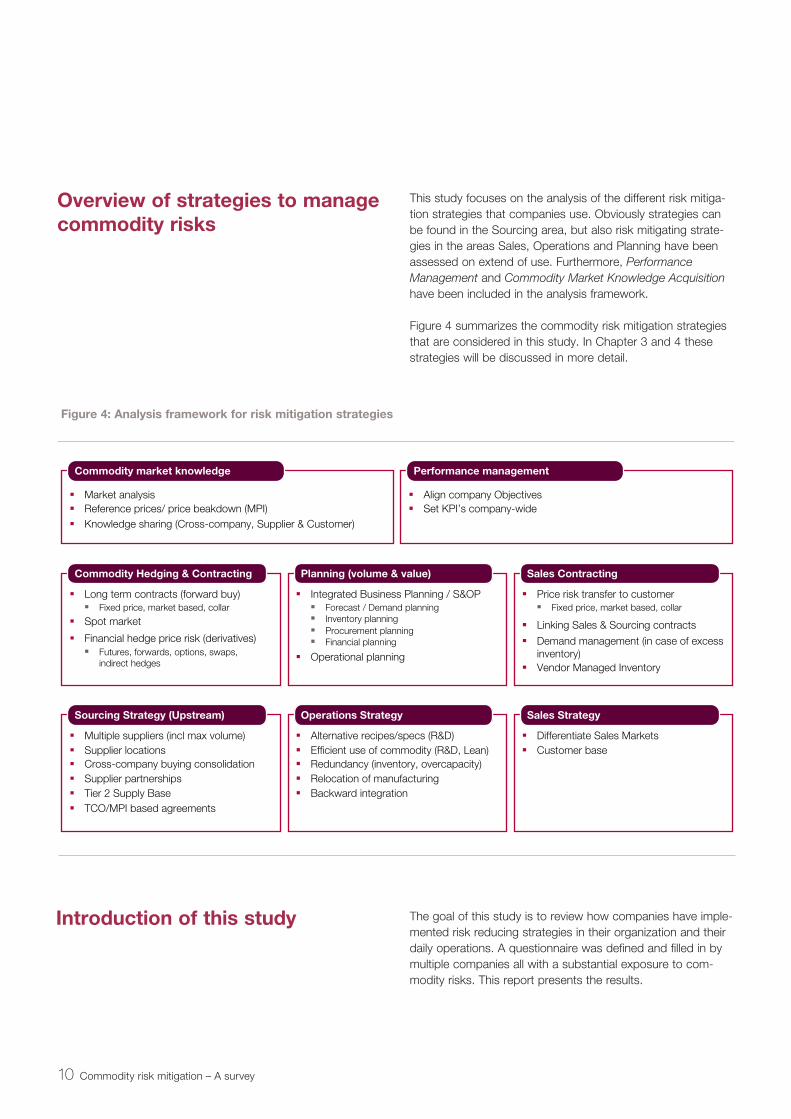
This study focuses on the analysis of the different risk mitiga-tion strategies that companies use. Obviously strategies can be found in the Sourcing area, but also risk mitigating strate-gies in the areas Sales, Operations and Planning have been assessed on extend of use. Furthermore, Performance Management and Commodity Market Knowledge Acquisition have been included in the analysis framework.
Figure 4 summarizes the commodity risk mitigation strategies that are considered in this study. In Chapter 3 and 4 these strategies will be discussed in more detail.
The goal of this study is to review how companies have imple-mented risk reducing strategies in their organization and their daily operations. A questionnaire was defined and filled in by multiple companies all with a substantial exposure to com-modity risks. This report presents the results.
Overview of strategies to manage commodity risks
Introduction of this study
Commodity Hedging & Contracting
§ Long term contracts (forward buy)
§ Spot market
§ Financial hedge price risk (derivatives)
§ Fixed price, market based, collar
§ Futures, forwards, options, swaps,indirect hedges
Planning (volume & value)
§ Integrated Business Planning / S&OP
§ Operational planning
§ Forecast / Demand planning§ Inventory planning§ Procurement planning§ Financial planning
Sales Contracting
§ Price risk transfer to customer
§ Linking Sales & Sourcing contracts
§ Demand management (in case of excessinventory)
§ Vendor Managed Inventory
§ Fixed price, market based, collar
Sourcing Strategy (Upstream)
§ Multiple suppliers (incl max volume)§ Supplier locations§ Cross-company buying consolidation§ Supplier partnerships§ Tier 2 Supply Base§ TCO/MPI based agreements
Operations Strategy
§ Alternative recipes/specs (R&D)§ Efficient use of commodity (R&D, Lean)§ Redundancy (inventory, overcapacity)§ Relocation of manufacturing§ Backward integration
Sales Strategy
§ Differentiate Sales Markets§ Customer base
Commodity market knowledge
§ Market analysis§ Reference prices/ price beakdown (MPI)§ Knowledge sharing (Cross-company, Supplier & Customer)
Performance management
§ Align company Objectives§ Set KPI’s company-wide
10 Commodity risk mitigation – A survey
Figure 4: Analysis framework for risk mitigation strategies
2 Characteristics of the participants
11
the way we see it
A total of 23 companies has participated in this study on commodity risks management. This chapter outlines the main characteristics of the participants.
Size and scale of the operations
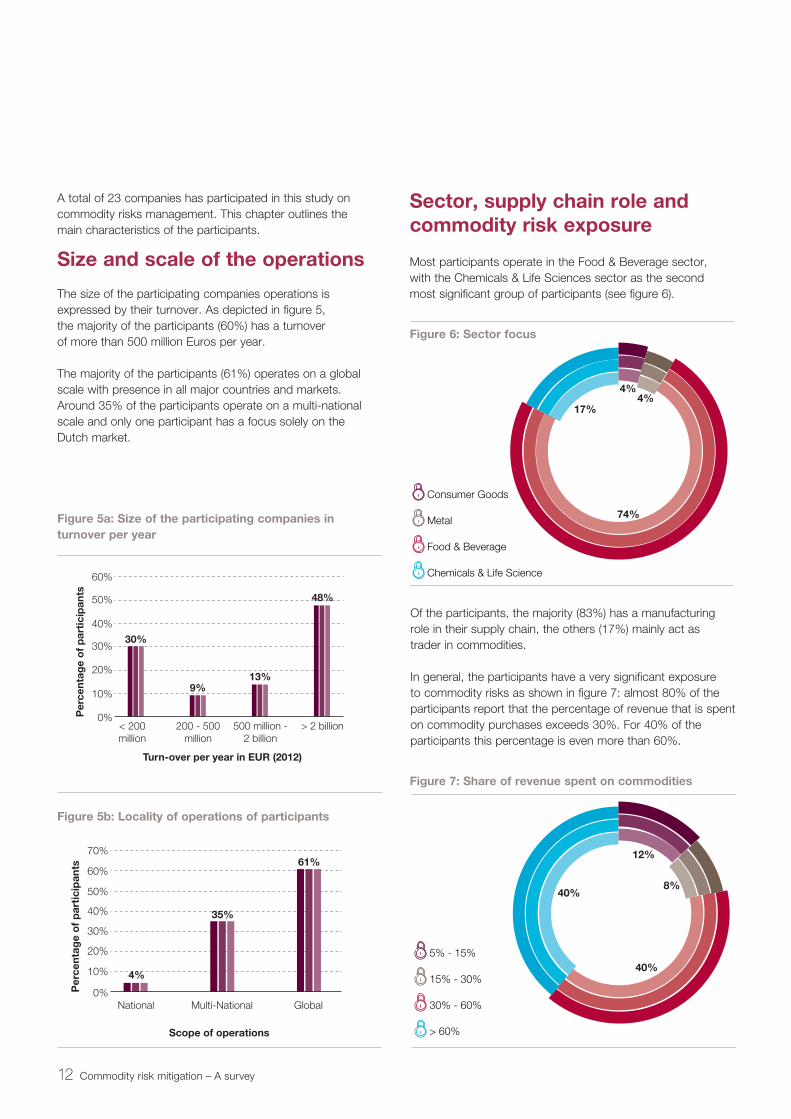
The size of the participating companies operations is expressed by their turnover. As depicted in figure 5, the majority of the participants (60%) has a turnover of more than 500 million Euros per year.
The majority of the participants (61%) operates on a global scale with presence in all major countries and markets. Around 35% of the participants operate on a multi-national scale and only one participant has a focus solely on the Dutch market.
Sector, supply chain role and commodity risk exposure
Most participants operate in the Food & Beverage sector, with the Chemicals & Life Sciences sector as the second most significant group of participants (see figure 6).
0%
10%
20%
30%
40%
50%
60%
30%
9%13%
48%
< 200million
200 - 500million
500 million -2 billion
> 2 billion
Per
cent
age
of
par
tici
pan
ts
Turn-over per year in EUR (2012)
0%
10%
20%
30%
40%
50%
60%
70%
4%
35%
61%
National Multi-National Global
Per
cent
age
of
par
tici
pan
ts
Scope of operations
Of the participants, the majority (83%) has a manufacturing role in their supply chain, the others (17%) mainly act as trader in commodities.
In general, the participants have a very significant exposure to commodity risks as shown in figure 7: almost 80% of the participants report that the percentage of revenue that is spent on commodity purchases exceeds 30%. For 40% of the participants this percentage is even more than 60%.
40%
40%
12%
8%
5% - 15%
15% - 30%
30% - 60%
> 60%
74%
17%
4%4%
Consumer Goods
Metal
Food & Beverage
Chemicals & Life Science
12 Commodity risk mitigation – A survey
Figure 5a: Size of the participating companies in turnover per year
Figure 6: Sector focus
Figure 7: Share of revenue spent on commodities
Figure 5b: Locality of operations of participants
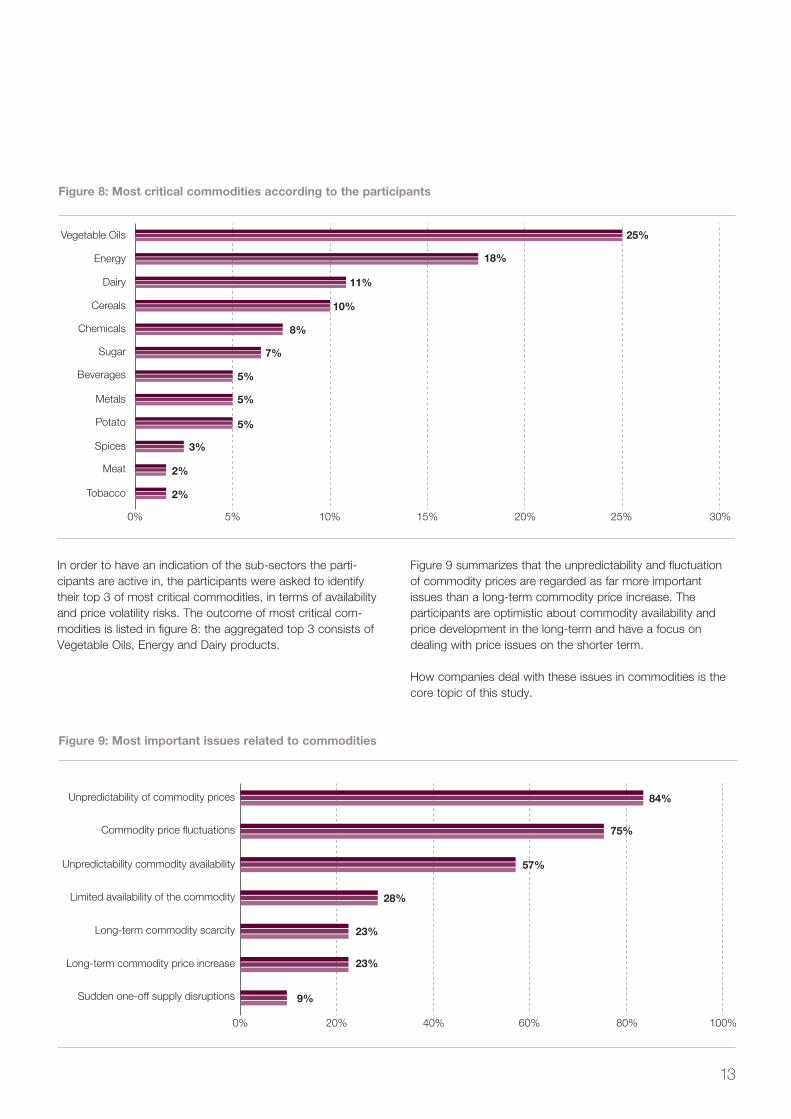
In order to have an indication of the sub-sectors the parti-cipants are active in, the participants were asked to identify their top 3 of most critical commodities, in terms of availability and price volatility risks. The outcome of most critical com-modities is listed in figure 8: the aggregated top 3 consists of Vegetable Oils, Energy and Dairy products.
0% 5% 10% 20%15% 25% 30%
25%
18%
11%
10%
8%
7%
5%
5%
5%
3%
2%
2%
Vegetable Oils
Energy
Dairy
Cereals
Chemicals
Sugar
Beverages
Metals
Potato
Spices
Meat
Tobacco
0% 20% 40% 60% 80% 100%
84%
75%
57%
28%
23%
23%
9%
Unpredictability of commodity prices
Commodity price fluctuations
Unpredictability commodity availability
Limited availability of the commodity
Long-term commodity price increase
Sudden one-off supply disruptions
Long-term commodity scarcity
Figure 9 summarizes that the unpredictability and fluctuation of commodity prices are regarded as far more important issues than a long-term commodity price increase. The participants are optimistic about commodity availability and price development in the long-term and have a focus on dealing with price issues on the shorter term.
How companies deal with these issues in commodities is the core topic of this study.
13
the way we see it
Figure 9: Most important issues related to commodities
Figure 8: Most critical commodities according to the participants
3 Governance of commodity risk management
This chapter focuses on how the commodity risk management is embedded within the organizations. Questions we will deal with in this chapter include: Is a strategy for commodity risk management defined and implemented? What are the main objectives of this strategy? Who is in the lead for the development and execution of the commodity risk management strategy and which KPIs are measured and reported regarding commodity risk management?
14 Commodity risk mitigation – A survey
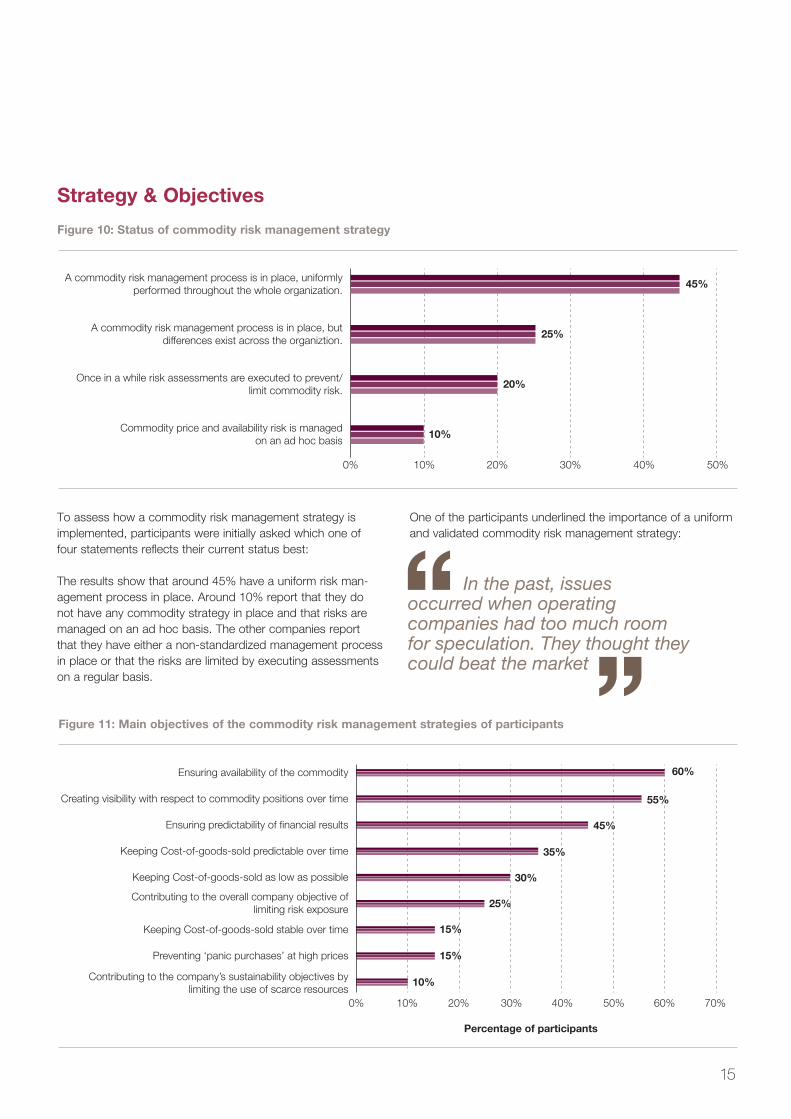
Strategy & Objectives
To assess how a commodity risk management strategy is implemented, participants were initially asked which one of four statements reflects their current status best:
The results show that around 45% have a uniform risk man-agement process in place. Around 10% report that they do not have any commodity strategy in place and that risks are managed on an ad hoc basis. The other companies report that they have either a non-standardized management process in place or that the risks are limited by executing assessments on a regular basis.
0% 10% 20% 30% 40% 50%
45%A commodity risk management process is in place, uniformly
performed throughout the whole organization.
25%A commodity risk management process is in place, but
differences exist across the organiztion.
20%Once in a while risk assessments are executed to prevent/
limit commodity risk.
10%Commodity price and availability risk is managed
on an ad hoc basis
Ensuring availability of the commodity
Percentage of participants
Ensuring predictability of financial results
Creating visibility with respect to commodity positions over time
Keeping Cost-of-goods-sold as low as possible
Keeping Cost-of-goods-sold predictable over time
Keeping Cost-of-goods-sold stable over time
Contributing to the overall company objective oflimiting risk exposure
Preventing ‘panic purchases’ at high prices
Contributing to the company’s sustainability objectives bylimiting the use of scarce resources
0% 10% 20% 30% 40% 50% 60% 70%
60%
55%
45%
35%
30%
25%
15%
15%
10%
One of the participants underlined the importance of a uniform and validated commodity risk management strategy:
15
the way we see it
Figure 10: Status of commodity risk management strategy
Figure 11: Main objectives of the commodity risk management strategies of participants
In the past, issues occurred when operating companies had too much room for speculation. They thought they could beat the market
The main objectives of the strategy in place focus on the identification of commodity issues in a stage early as possible. As figure 11 indicates the strategy focuses primarily on: (1) ensuring the physical availability of commodities, (2) creating visibility to the positions over time (long/short), and (3) ensuring predictability of the financial results.
Of course some of the objectives are not independent; visibility on commodity positions is a prerequisite to be able to antici-pate and ensure the predictability of the financial results of the company. Figure 11 however suggests that securing availability is a more important goal than stabilizing prices.
Only 10% report that there is a connection between the commodity strategy objectives and the company’s sustainability objectives. Maybe this can be interpreted that extreme scarcity for the commodities involved are not foreseen.
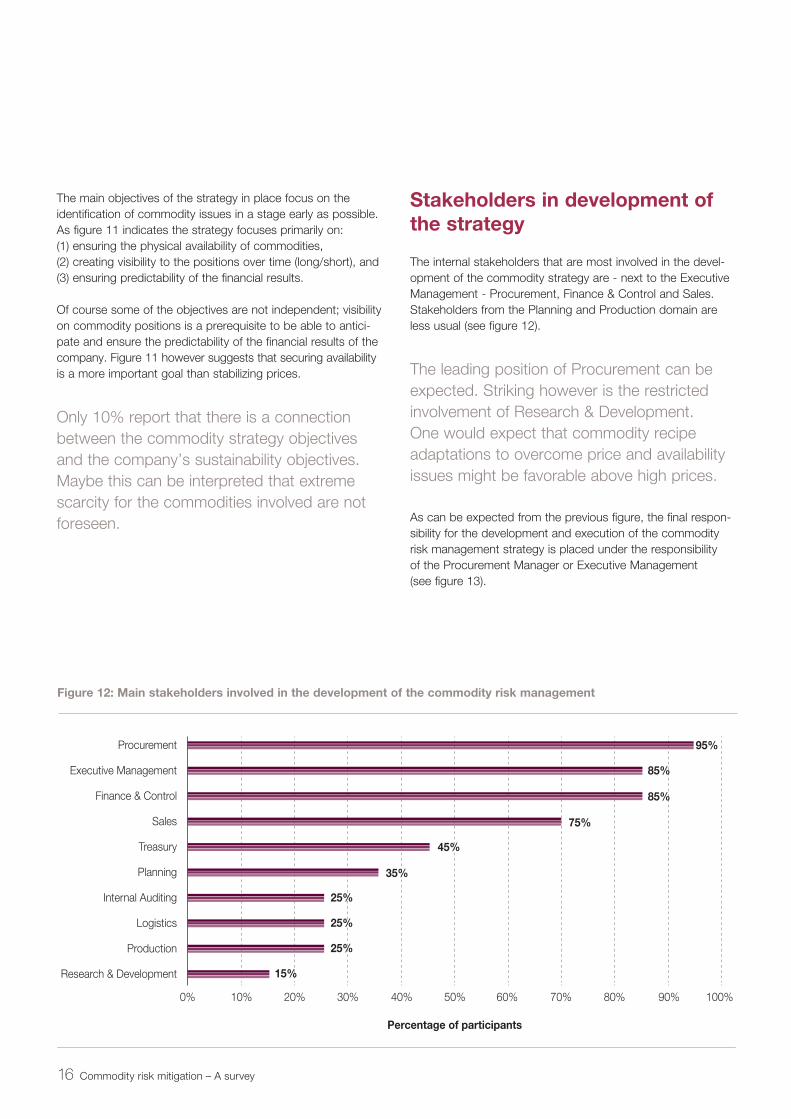
Stakeholders in development of the strategy
The internal stakeholders that are most involved in the devel-opment of the commodity strategy are - next to the Executive Management - Procurement, Finance & Control and Sales. Stakeholders from the Planning and Production domain are less usual (see figure 12).
The leading position of Procurement can be expected. Striking however is the restricted involvement of Research & Development. One would expect that commodity recipe adaptations to overcome price and availability issues might be favorable above high prices.
As can be expected from the previous figure, the final respon-sibility for the development and execution of the commodity risk management strategy is placed under the responsibility of the Procurement Manager or Executive Management (see figure 13).
Procurement
Percentage of participants
Finance & Control
Executive Management
Treasury
Sales
Internal Auditing
Planning
Logistics
Production
Research & Development
0% 10% 20% 30% 40% 50% 60% 70% 80% 90% 100%
95%
85%
85%
75%
45%
35%
25%
25%
25%
15%
16 Commodity risk mitigation – A survey
Figure 12: Main stakeholders involved in the development of the commodity risk management
70%
30%
Executive Management
Procurement
It is remarkable that only in 30% of the participants’ organiza-tions the Executive Management is accountable for the com-modity risk management strategy. To have the final account-ability on the level of the Executive Management makes sense when multiple disciplines in the organization have impact on the commodity risk. For example: Sales committing to fixed sales prices over a longer period in which procurement prices can be expected to fluctuate.
•Across-functionalteamisestablishedtodevelop,maintain and standardize risk management policies and procedures across businesses and geographies.
•Uniformperformancemetricsaredefinedtoensurea cross-functional cooperation with shared terminol-ogy and aligned objectives. This set of uniform per-formance metrics is based on a clear understanding that unaligned performance metrics of Procurement, Planning and Sales will have a negative influence on the risk mitigation.
Leading practices in strategy development for commodity risks:
Source: Aberdeen Enterprise Risk Management: The art of Avoiding Unpleasant Surprises (2009), Oliver Wyman Commodity Hedging – the advent of a new paradigm (2009).
KPIsAround 70% of the participating companies indicate that commodity risk management is part of their company’s performance management system. This means that commodity risk management is evaluated and monitored on a regular basis via KPIs and compared with predefined objectives.
Around 30% of the participants indicate that their commodity risk management performance is not evaluated at all or onlyin a very limited way.
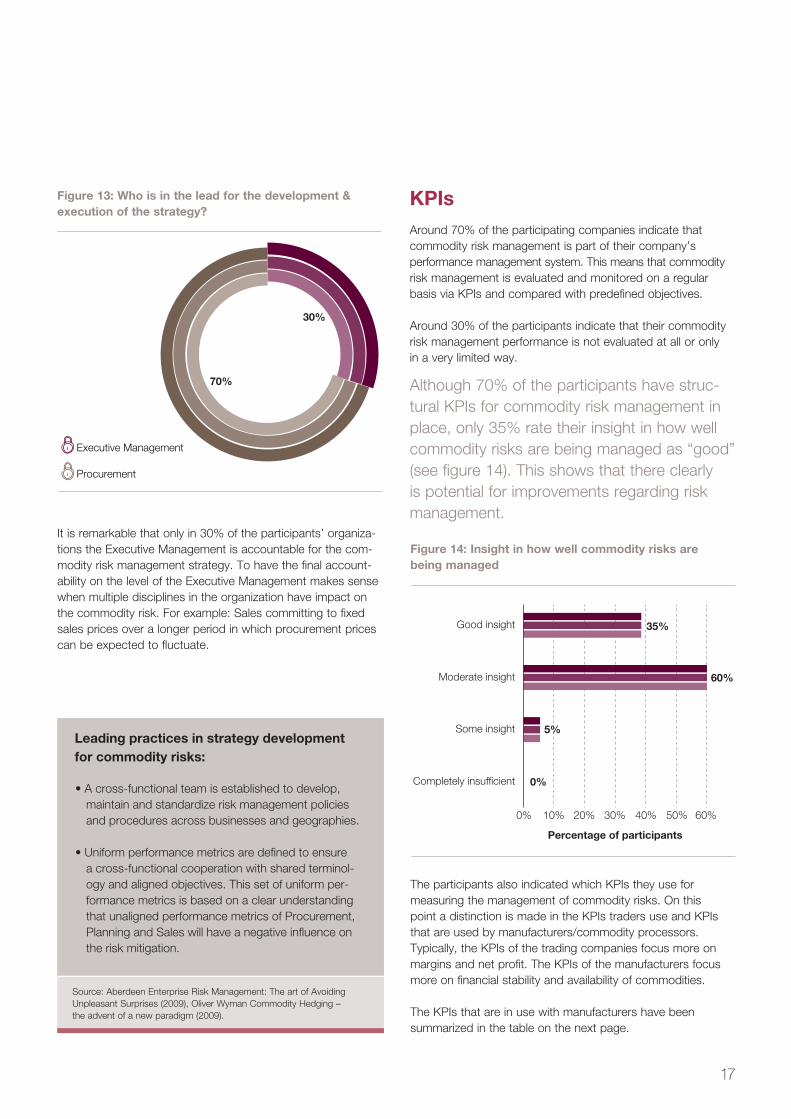
Although 70% of the participants have struc-tural KPIs for commodity risk management in place, only 35% rate their insight in how well commodity risks are being managed as “good” (see figure 14). This shows that there clearlyis potential for improvements regarding risk management.
Figure 14: Insight in how well commodity risks are being managed
Percentage of participants
0% 10% 20% 30% 40% 50% 60%
35%
5%
60%
0%
Good insight
Moderate insight
Some insight
Completely insufficient
The participants also indicated which KPIs they use for measuring the management of commodity risks. On this point a distinction is made in the KPIs traders use and KPIs that are used by manufacturers/commodity processors. Typically, the KPIs of the trading companies focus more on margins and net profit. The KPIs of the manufacturers focus more on financial stability and availability of commodities.
The KPIs that are in use with manufacturers have beensummarized in the table on the next page.
17
the way we see it
Figure 13: Who is in the lead for the development &execution of the strategy?
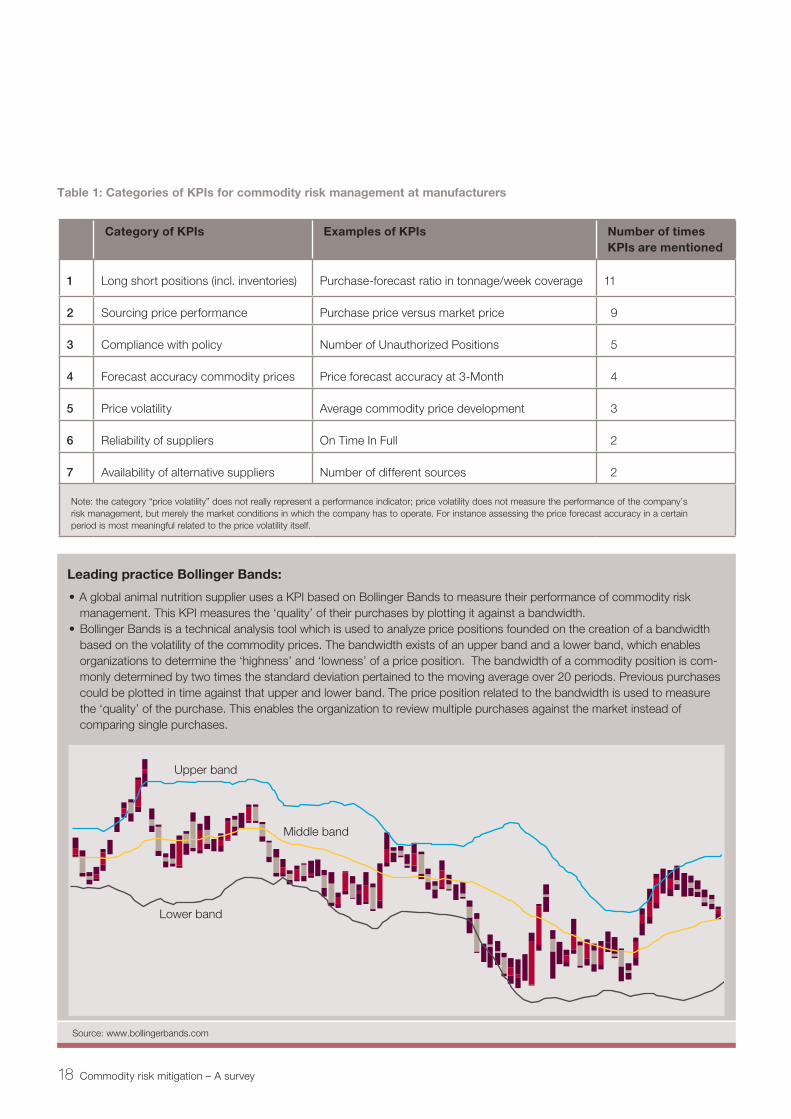
Category of KPIs Examples of KPIs Number of times KPIs are mentioned
1 Long short positions (incl. inventories) Purchase-forecast ratio in tonnage/week coverage 11
2 Sourcing price performance Purchase price versus market price 09
3 Compliance with policy Number of Unauthorized Positions 05
4 Forecast accuracy commodity prices Price forecast accuracy at 3-Month 04
5 Price volatility Average commodity price development 03
6 Reliability of suppliers On Time In Full 02
7 Availability of alternative suppliers Number of different sources 02
Table 1: Categories of KPIs for commodity risk management at manufacturers
Note: the category “price volatility” does not really represent a performance indicator; price volatility does not measure the performance of the company’s risk management, but merely the market conditions in which the company has to operate. For instance assessing the price forecast accuracy in a certain period is most meaningful related to the price volatility itself.
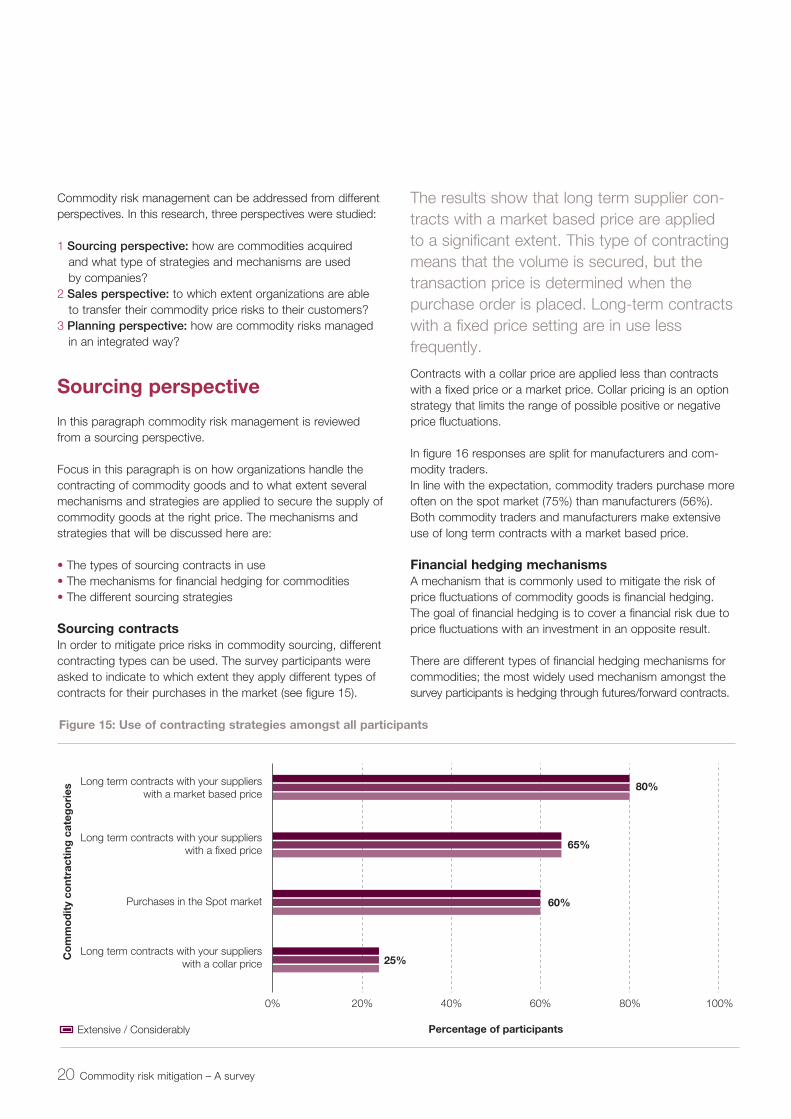
• A global animal nutrition supplier uses a KPI based on Bollinger Bands to measure their performance of commodity risk management. This KPI measures the ‘quality’ of their purchases by plotting it against a bandwidth.
•BollingerBandsisatechnicalanalysistoolwhichisusedtoanalyzepricepositionsfoundedonthecreationofabandwidthbased on the volatility of the commodity prices. The bandwidth exists of an upper band and a lower band, which enables organizations to determine the ‘highness’ and ‘lowness’ of a price position. The bandwidth of a commodity position is com-monly determined by two times the standard deviation pertained to the moving average over 20 periods. Previous purchases could be plotted in time against that upper and lower band. The price position related to the bandwidth is used to measure the ‘quality’ of the purchase. This enables the organization to review multiple purchases against the market instead of comparing single purchases.
Leading practice Bollinger Bands:
Upper band
Middle band
Lower band
Source: www.bollingerbands.com
18 Commodity risk mitigation – A survey

4 Perspectives on commodity risk management
19
the way we see it
Commodity risk management can be addressed from different perspectives. In this research, three perspectives were studied:
1.Sourcing perspective: how are commodities acquired and what type of strategies and mechanisms are used by companies?
2.Sales perspective: to which extent organizations are able to transfer their commodity price risks to their customers?
3.Planning perspective: how are commodity risks managed in an integrated way?
Sourcing perspective
In this paragraph commodity risk management is reviewed from a sourcing perspective.
Focus in this paragraph is on how organizations handle the contracting of commodity goods and to what extent several mechanisms and strategies are applied to secure the supply of commodity goods at the right price. The mechanisms and strategies that will be discussed here are:
• The types of sourcing contracts in use• The mechanisms for financial hedging for commodities• The different sourcing strategies
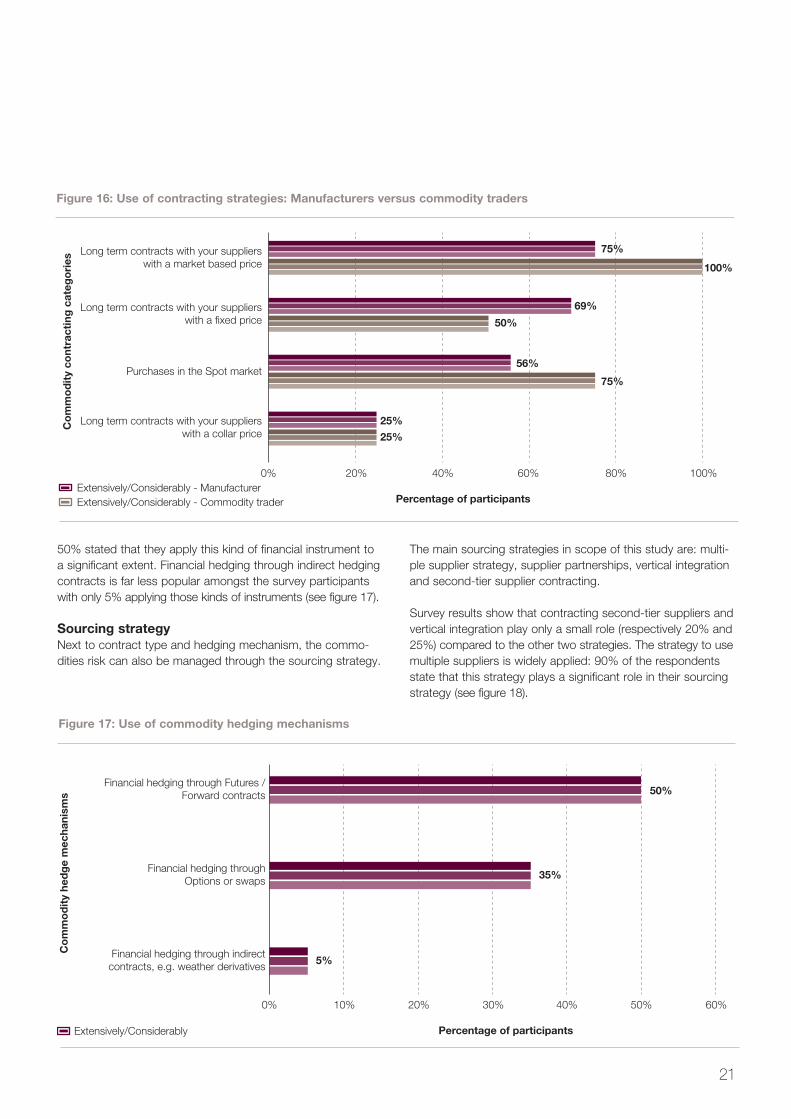
Sourcing contractsIn order to mitigate price risks in commodity sourcing, different contracting types can be used. The survey participants were asked to indicate to which extent they apply different types of contracts for their purchases in the market (see figure 15).
Percentage of participants
0% 20% 40% 60% 80% 100%
80%
60%
65%
25%Co
mm
od
ity
cont
ract
ing
cat
ego
ries
Extensive / Considerably
Long term contracts with your supplierswith a market based price
Long term contracts with your supplierswith a fixed price
Purchases in the Spot market
Long term contracts with your supplierswith a collar price
The results show that long term supplier con-tracts with a market based price are applied to a significant extent. This type of contracting means that the volume is secured, but the transaction price is determined when the purchase order is placed. Long-term contracts with a fixed price setting are in use less frequently.
Contracts with a collar price are applied less than contracts with a fixed price or a market price. Collar pricing is an option strategy that limits the range of possible positive or negative price fluctuations.
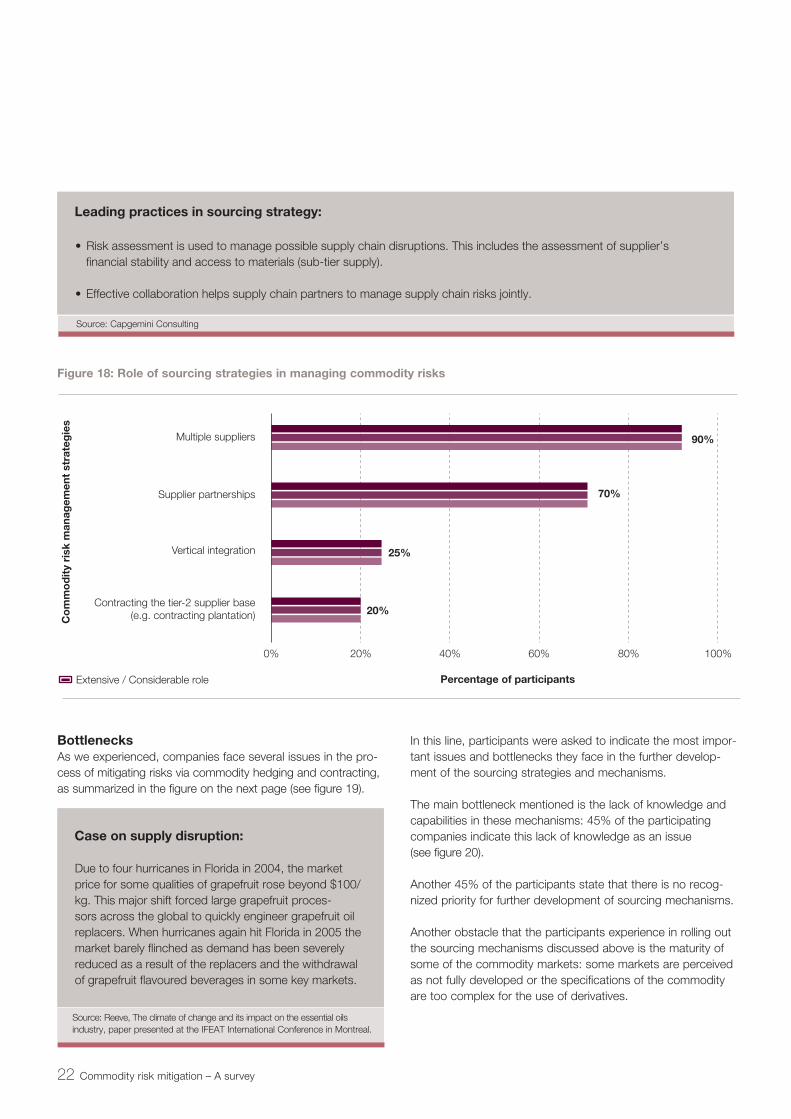
In figure 16 responses are split for manufacturers and com-modity traders. In line with the expectation, commodity traders purchase more often on the spot market (75%) than manufacturers (56%). Both commodity traders and manufacturers make extensive use of long term contracts with a market based price.
Financial hedging mechanisms A mechanism that is commonly used to mitigate the risk of price fluctuations of commodity goods is financial hedging. The goal of financial hedging is to cover a financial risk due to price fluctuations with an investment in an opposite result.
There are different types of financial hedging mechanisms for commodities; the most widely used mechanism amongst the survey participants is hedging through futures/forward contracts.
20 Commodity risk mitigation – A survey
Figure 15: Use of contracting strategies amongst all participants
Long term contracts with your supplierswith a market based price
Percentage of participants
Co
mm
od
ity
cont
ract
ing
cat
ego
ries
Long term contracts with your supplierswith a fixed price
Purchases in the Spot market
Long term contracts with your supplierswith a collar price
Extensively/Considerably - ManufacturerExtensively/Considerably - Commodity trader
0% 20% 40% 60% 80% 100%
75%
75%
56%
25%
25%
69%
50%
100%
Financial hedging through Futures /Forward contracts
Percentage of participants
Financial hedging throughOptions or swaps
Financial hedging through indirectcontracts, e.g. weather derivatives
0% 10% 20% 30% 40% 60%50%
50%
35%
5%
Extensively/Considerably
Co
mm
od
ity
hed
ge
mec
hani
sms
50% stated that they apply this kind of financial instrument to a significant extent. Financial hedging through indirect hedging contracts is far less popular amongst the survey participants with only 5% applying those kinds of instruments (see figure 17).
Sourcing strategyNext to contract type and hedging mechanism, the commo-dities risk can also be managed through the sourcing strategy.
The main sourcing strategies in scope of this study are: multi-ple supplier strategy, supplier partnerships, vertical integration and second-tier supplier contracting.
Survey results show that contracting second-tier suppliers and vertical integration play only a small role (respectively 20% and 25%) compared to the other two strategies. The strategy to use multiple suppliers is widely applied: 90% of the respondents state that this strategy plays a significant role in their sourcing strategy (see figure 18).
21
the way we see it
Figure 16: Use of contracting strategies: Manufacturers versus commodity traders
Figure 17: Use of commodity hedging mechanisms
• Risk assessment is used to manage possible supply chain disruptions. This includes the assessment of supplier’s financial stability and access to materials (sub-tier supply).
•Effectivecollaborationhelpssupplychainpartnerstomanagesupplychainrisksjointly.
Leading practices in sourcing strategy:
Source: Capgemini Consulting
BottlenecksAs we experienced, companies face several issues in the pro-cess of mitigating risks via commodity hedging and contracting, as summarized in the figure on the next page (see figure 19).
Multiple suppliers
Percentage of participants
Supplier partnerships
Vertical integration
Contracting the tier-2 supplier base(e.g. contracting plantation)
0% 20% 40% 60% 80% 100%
90%
25%
70%
20%
Co
mm
od
ity
risk
man
agem
ent
stra
teg
ies
Extensive / Considerable role
Due to four hurricanes in Florida in 2004, the market price for some qualities of grapefruit rose beyond $100/kg. This major shift forced large grapefruit proces-sors across the global to quickly engineer grapefruit oil replacers. When hurricanes again hit Florida in 2005 the market barely flinched as demand has been severely reduced as a result of the replacers and the withdrawal of grapefruit flavoured beverages in some key markets.
Case on supply disruption:
Source: Reeve, The climate of change and its impact on the essential oils industry, paper presented at the IFEAT International Conference in Montreal.
In this line, participants were asked to indicate the most impor-tant issues and bottlenecks they face in the further develop-ment of the sourcing strategies and mechanisms.
The main bottleneck mentioned is the lack of knowledge and capabilities in these mechanisms: 45% of the participating companies indicate this lack of knowledge as an issue (see figure 20).
Another 45% of the participants state that there is no recog-nized priority for further development of sourcing mechanisms.
Another obstacle that the participants experience in rolling out the sourcing mechanisms discussed above is the maturity of some of the commodity markets: some markets are perceived as not fully developed or the specifications of the commodity are too complex for the use of derivatives.
22 Commodity risk mitigation – A survey
Figure 18: Role of sourcing strategies in managing commodity risks
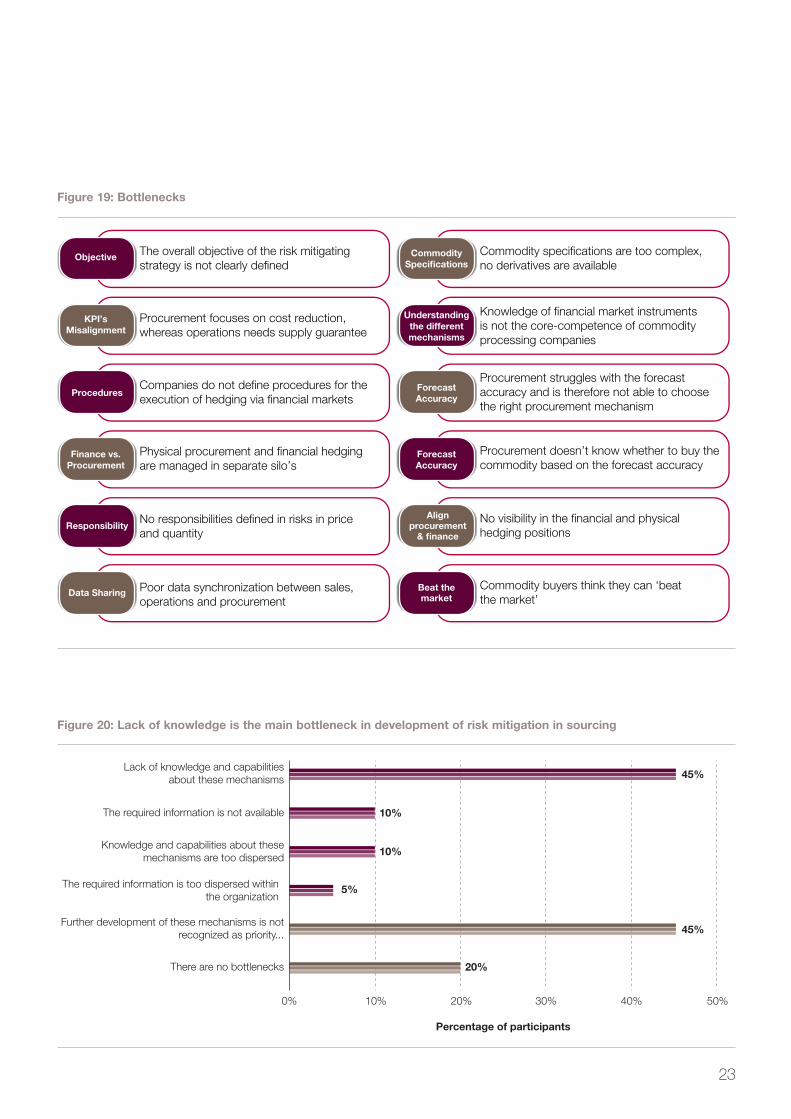
Objective
KPI’sMisalignment
Procedures
Finance vs.Procurement
Responsibility
CommoditySpecifications
Understandingthe differentmechanisms
ForecastAccuracy
ForecastAccuracy
Alignprocurement
& finance
The overall objective of the risk mitigatingstrategy is not clearly defined
Commodity specifications are too complex,no derivatives are available
Knowledge of financial market instrumentsis not the core-competence of commodityprocessing companies
Procurement struggles with the forecastaccuracy and is therefore not able to choosethe right procurement mechanism
Procurement doesn’t know whether to buy the commodity based on the forecast accuracy
No visibility in the financial and physicalhedging positions
Procurement focuses on cost reduction,whereas operations needs supply guarantee
Companies do not define procedures for theexecution of hedging via financial markets
Physical procurement and financial hedgingare managed in separate silo’s
No responsibilities defined in risks in priceand quantity
Data Sharing Beat themarket
Commodity buyers think they can ‘beatthe market’
Poor data synchronization between sales,operations and procurement
23
the way we see it
Lack of knowledge and capabilitiesabout these mechanisms
Percentage of participants
The required information is not available
Knowledge and capabilities about thesemechanisms are too dispersed
The required information is too dispersed withinthe organization
Further development of these mechanisms is notrecognized as priority...
There are no bottlenecks
0% 10% 20% 30% 40% 50%
45%
10%
10%
45%
5%
20%
Figure 20: Lack of knowledge is the main bottleneck in development of risk mitigation in sourcing
Figure 19: Bottlenecks

Sales perspectiveWhen reviewing commodity risk management from a sales perspective, the main element discussed is the ability of organi-zations to transfer commodity price changes to their customers.There are several practices in managing commodity price transferring (see figure 21).
In general the survey results show that only 20% of the parti-cipating organizations have no possibilities to transfer price increases to the customer at all. Renegotiation of sales prices in case of major changes in commodity prices is the most applied practice amongst the participating organization with 55%.
In figure 21 the survey responses of smaller organizations (turnover less than 2 billion) and large organizations (with turn-over above 2 billion) are displayed also separately. As can be expected on all practices mentioned, smaller companies have less bargaining power. For these companies possibilities to share a larger part of the commodity risk with their customers is restricted.
Asking the participants which changes they expect regarding the possibility to transfer commodity price risk towards the customer, the majority indicates that no change is expected (55%). Within the group of participants that do expect a change, the majority is positive about the possibility to transfer a larger part of the commodity price risk to customers (see figure 22).
24 Commodity risk mitigation – A survey
There is room for renegotiation sales price
Percentage of participants
Open sales price calculation
We base our sales contracts on actual purchasecontracts (price and volume)
Long term contracts with commodity market basedsales prices
We have little or no possibility to transfer price increasesto our customers
Long term contracts with collar prices
0% 10% 20% 40%30% 60%50% 100%90%80%70%
55%60%
50%
45%
40%50%
30%
40%50%
30%
20%0%
40%
15%20%
10%
60%30%
Turnover > 2 billionTurnover < 2 billion
All
Figure 21: Transfer of commodity price changes to customers
Same as in current situation
Percentage of participants
Somewhat more than in current situation
Somewhat less than in current situation
Much less than in current situation
0% 10% 20% 30% 40% 60%50%
55%
10%
30%
5%
Figure 22: The possibility to transfer the commodity price risk will slightly increase in the future
Planning perspectiveAn Integrated Business Planning (IBP) or Sales and Operations Planning (S&OP) process focuses on balancing demand and supply with the goal to optimize the financial results on a medium term horizon (6 to 18 months). In the execution of this business planning process, companies often have installed a kind of monthly cycle to review future demand and future sup-ply issues. In case of an imbalance between demand and sup-ply decisions on executive management level are required to resolve those issues. Within the framework of this survey, a key question is how organizations use an IBP or S&OP pro-cess to address commodity risks.
Commodity procurement decisions - both financial and physi-cal - should be aligned with the market conditions, sales expectations, inventory positions, etc. An integrated approach is often required to align the different disciplines and depart-ments in the organization on some key questions, such as:• At what moment should the company procure the forecast-
ed commodity demand and for what time horizon (weeks, months)?
• What are the financial and physical contract levels (today,3 months, 1 year, etc.) and are these contract levels in line with the demand forecast?
• What are the risks of these commodity positions and whois accountable for this risk exposure?
In the S&OP process typically events that require coordinated action and alignment of Sales, Production, Finance and Procurement should be discussed. Some examples of these events related to commodity risks are: 1.Strong deviations in the market prices trigger changes in
demand: market price changes for commodities can influ-ence future demand of finished products. Overall demand can increase or decrease as a result of price changes; or demand for products can shift from one assortment to another.
2.Limited availability of commodities: when a possible scarcity of a commodity is foreseen, coordinated action is required:it can mean that sales needs to focus her attention on prod-ucts which are not affected by this scarcity. Customer demand may increase in short term when customers antici-pate on expected scarcity.
3.Recipe changes: as a result of deviations in price or scarcity, some manufacturing companies have the possibility to change their recipes without changing the specifications of their finished products. The recipe changes often have an impact on production efficiency and inventory planning, which needs to be aligned and understood before an opti-mized recipe can be taken into production. In some cases, customers have to be informed in advance about changesin ingredients.
This paragraph describes in what way companies apply an integrated and structural approach to deal with the key ques-tions and specific events.
Market intelligenceOne of the essentials in executing a risk reducing strategy is to have up-to-date knowledge of the commodity market. This often requires dedicated resources for analysis and a review process across all areas of business and geographies. This commodity market intelligence serves as input to determine the most effective strategy to deal with the market conditions.
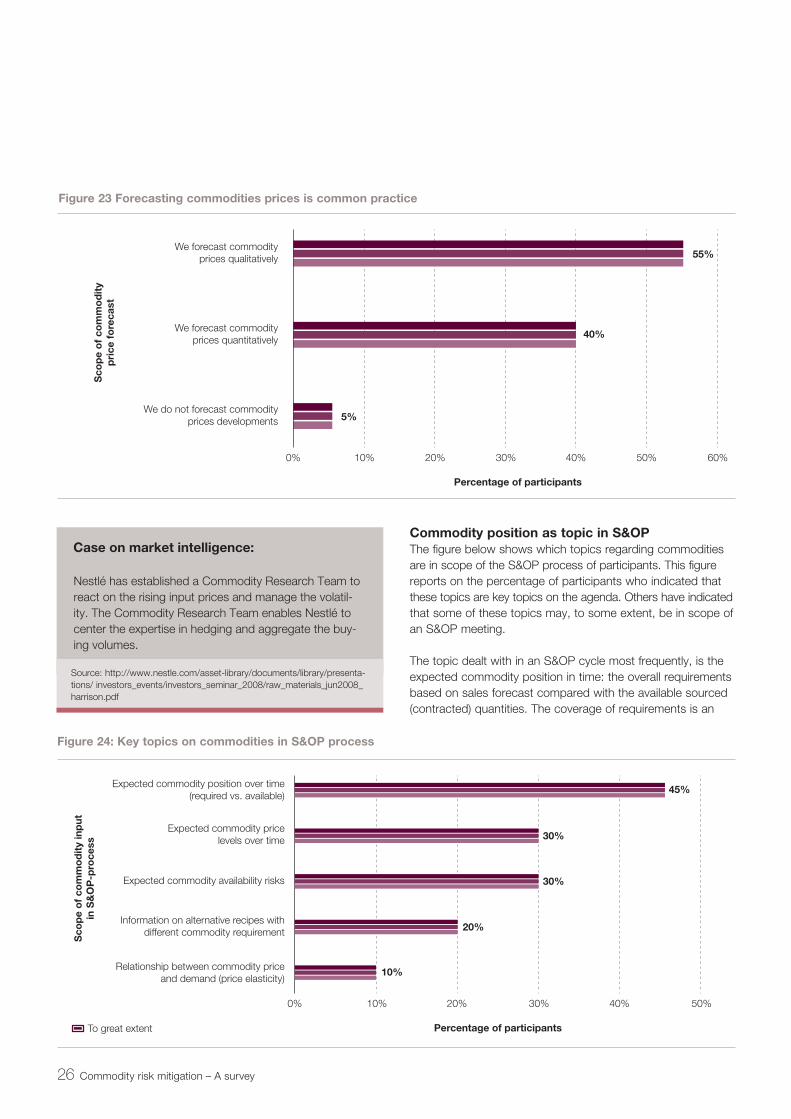
In this study, participants were asked to what extent they actually forecast the price development over time for key com-modities. The results are shown in figure 23.
Apparently almost every organization uses some kind of estimation of the commodity price developments. For those organizations that make a quantitative price forecast, 50% indicated that they forecast a price range per chosen time bucket: for example June €12-12.50 / July €12.50-13.00. The other 50% make a best-guess for the commodity price per chosen time bucket.
Companies that forecast commodity price developments only qualitatively typically give indications as “up” or “down” with respect to expected price developments.
The company’s accuracy in forecasting the developments of prices and availability in key commodity markets was generally rated as being “moderate” to “good”.
Leading practice on commodity management in S&OP
Source: Capgemini Consulting
Use the Sales & Operations Planning process as astructural way to: •shareknowledgeoncommoditymarketdevelop-
ments;• identifyandsharecommodityprice,volumerisksand
actual position, followed by coordinated actions and decisions;
• sharetheuncertaintyinthesalesforecastandtrans-lating that into the appropriate procurement and hedging decisions;
• takebuy/selldecisionsforcriticalcommodities.
25
the way we see it
We forecast commodityprices qualitatively
Percentage of participants
We forecast commodityprices quantitatively
We do not forecast commodityprices developments
0% 10% 20% 30% 40% 60%50%
55%
40%
5%
Sco
pe
of
com
mo
dit
yp
rice
fo
reca
st
Expected commodity position over time(required vs. available)
Percentage of participants
Expected commodity pricelevels over time
Expected commodity availability risks
Information on alternative recipes withdifferent commodity requirement
Relationship between commodity priceand demand (price elasticity)
0% 10% 20% 40%30% 50%
45%
30%
30%
20%
10%
Sco
pe
of
com
mo
dit
y in
put
in S
&O
P-p
roce
ss
To great extent
Commodity position as topic in S&OP The figure below shows which topics regarding commodities are in scope of the S&OP process of participants. This figure reports on the percentage of participants who indicated that these topics are key topics on the agenda. Others have indicated that some of these topics may, to some extent, be in scope of an S&OP meeting.
The topic dealt with in an S&OP cycle most frequently, is the expected commodity position in time: the overall requirements based on sales forecast compared with the available sourced (contracted) quantities. The coverage of requirements is an
Nestlé has established a Commodity Research Team to react on the rising input prices and manage the volatil-ity. The Commodity Research Team enables Nestlé to center the expertise in hedging and aggregate the buy-ing volumes.
Case on market intelligence:
Source: http://www.nestle.com/asset-library/documents/library/presenta-tions/ investors_events/investors_seminar_2008/raw_materials_jun2008_harrison.pdf
26 Commodity risk mitigation – A survey
Figure 23 Forecasting commodities prices is common practice
Figure 24: Key topics on commodities in S&OP process
important parameter for the business to optimize taking into account shifting market conditions. Although almost every company makes some kind of commodity price forecast, this price forecast is only considered a key S&OP topic in 30% of the participating companies.
As figure 24 also indicates, for 70% of the participants com-modity scarcity is not a regular topic that is addressed in the S&OP cycle. Probably scarcity issues are dealt with on a more ad hoc basis.
Finally price elasticity is generally not considered as a key S&OP topic: either price elasticity is not relevant for most parti-cipating companies or its impact is not understood sufficiently yet to include it in the decision making.
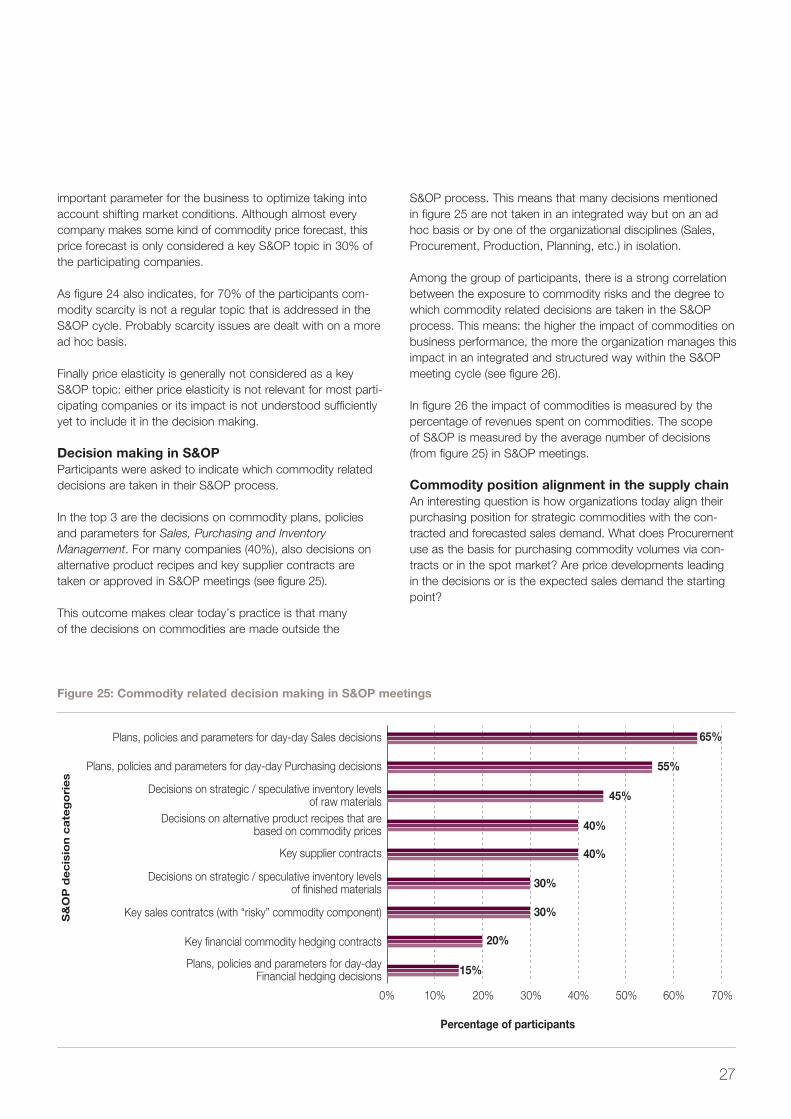
Decision making in S&OP Participants were asked to indicate which commodity related decisions are taken in their S&OP process.
In the top 3 are the decisions on commodity plans, policies and parameters for Sales, Purchasing and Inventory Management. For many companies (40%), also decisions on alternative product recipes and key supplier contracts are taken or approved in S&OP meetings (see figure 25).
This outcome makes clear today’s practice is that manyof the decisions on commodities are made outside the
Plans, policies and parameters for day-day Sales decisions
Percentage of participants
Plans, policies and parameters for day-day Purchasing decisions
Decisions on strategic / speculative inventory levelsof raw materials
Decisions on alternative product recipes that arebased on commodity prices
Key supplier contracts
Decisions on strategic / speculative inventory levelsof finished materials
Key sales contratcs (with “risky” commodity component)
Key financial commodity hedging contracts
Plans, policies and parameters for day-dayFinancial hedging decisions
0% 10% 30%20% 40% 50% 60% 70%
65%
55%
45%
40%
40%
30%
30%
20%
15%
S&
OP
de
cis
ion
ca
teg
ori
es
S&OP process. This means that many decisions mentionedin figure 25 are not taken in an integrated way but on an ad hoc basis or by one of the organizational disciplines (Sales, Procurement, Production, Planning, etc.) in isolation.
Among the group of participants, there is a strong correlation between the exposure to commodity risks and the degree to which commodity related decisions are taken in the S&OPprocess. This means: the higher the impact of commodities on business performance, the more the organization manages this impact in an integrated and structured way within the S&OP meeting cycle (see figure 26).
In figure 26 the impact of commodities is measured by thepercentage of revenues spent on commodities. The scopeof S&OP is measured by the average number of decisions (from figure 25) in S&OP meetings.
Commodity position alignment in the supply chain An interesting question is how organizations today align their purchasing position for strategic commodities with the con-tracted and forecasted sales demand. What does Procurement use as the basis for purchasing commodity volumes via con-tracts or in the spot market? Are price developments leadingin the decisions or is the expected sales demand the starting point?
27
the way we see it
Figure 25: Commodity related decision making in S&OP meetings
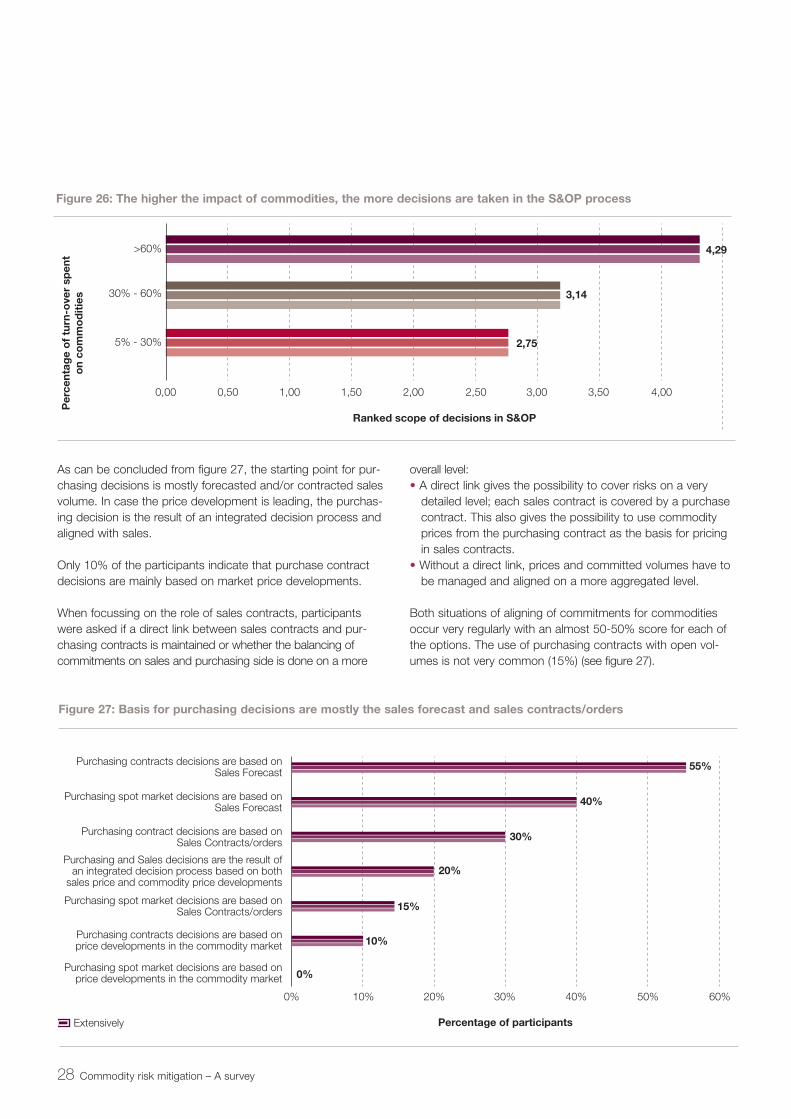
As can be concluded from figure 27, the starting point for pur-chasing decisions is mostly forecasted and/or contracted sales volume. In case the price development is leading, the purchas-ing decision is the result of an integrated decision process and aligned with sales.
Only 10% of the participants indicate that purchase contract decisions are mainly based on market price developments.
When focussing on the role of sales contracts, participants were asked if a direct link between sales contracts and pur-chasing contracts is maintained or whether the balancing of commitments on sales and purchasing side is done on a more
>60%
Ranked scope of decisions in S&OP
30% - 60%
5% - 30%
0,00 0,50 1,00 1,50 2,00 2,50 3,00 3,50 4,00
4,29
3,14
2,75
Per
cent
age
of
turn
-ove
r sp
ent
on
com
mo
dit
ies
Purchasing contracts decisions are based onSales Forecast
Percentage of participants
Purchasing spot market decisions are based onSales Forecast
Purchasing contract decisions are based onSales Contracts/orders
Purchasing and Sales decisions are the result ofan integrated decision process based on both
sales price and commodity price developments
Purchasing spot market decisions are based onSales Contracts/orders
Purchasing contracts decisions are based onprice developments in the commodity market
Purchasing spot market decisions are based onprice developments in the commodity market
0% 10% 30%20% 40% 50% 60%
55%
40%
30%
20%
15%
10%
0%
Extensively
overall level:• A direct link gives the possibility to cover risks on a very
detailed level; each sales contract is covered by a purchase contract. This also gives the possibility to use commodity prices from the purchasing contract as the basis for pricing in sales contracts.
• Without a direct link, prices and committed volumes have to be managed and aligned on a more aggregated level.
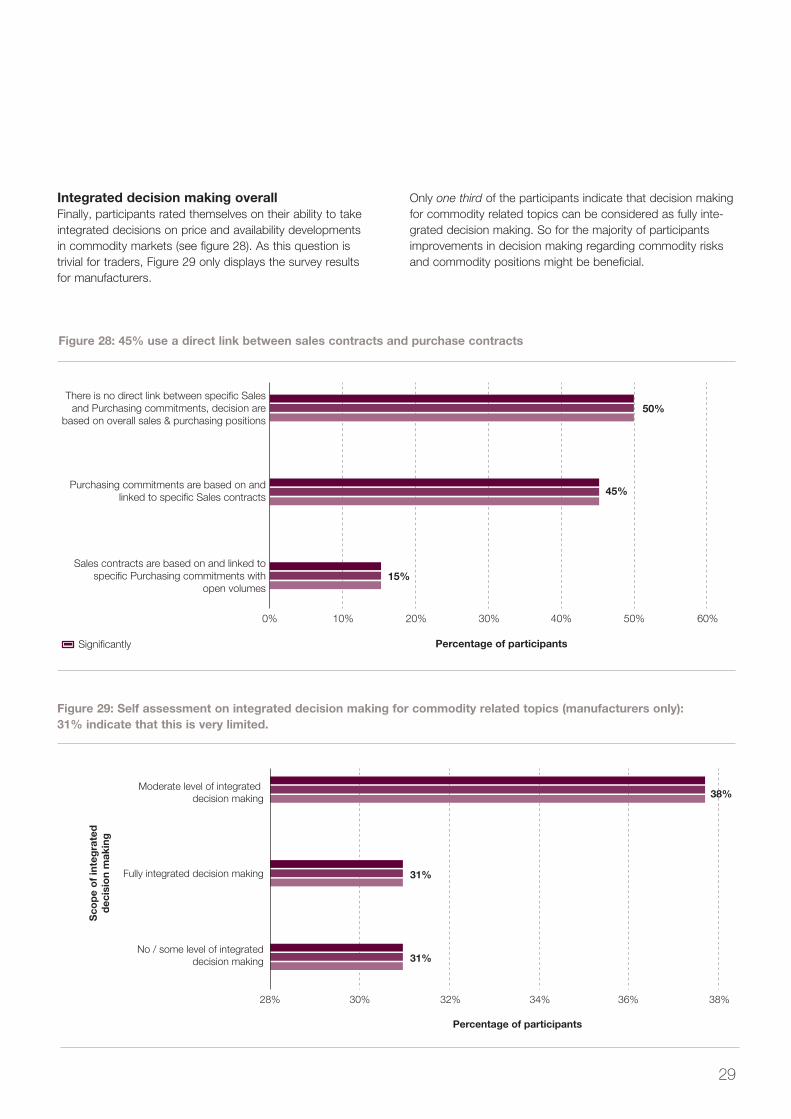
Both situations of aligning of commitments for commodities occur very regularly with an almost 50-50% score for each of the options. The use of purchasing contracts with open vol-umes is not very common (15%) (see figure 27).
28 Commodity risk mitigation – A survey
Figure 26: The higher the impact of commodities, the more decisions are taken in the S&OP process
Figure 27: Basis for purchasing decisions are mostly the sales forecast and sales contracts/orders
There is no direct link between specific Salesand Purchasing commitments, decision are
based on overall sales & purchasing positions
Percentage of participants
Purchasing commitments are based on andlinked to specific Sales contracts
Sales contracts are based on and linked tospecific Purchasing commitments with
open volumes
0% 10% 20% 30% 40% 60%50%
50%
45%
15%
Significantly
Moderate level of integrated decision making
Percentage of participants
Sco
pe
of
inte
gra
ted
dec
isio
n m
akin
g
Fully integrated decision making
No / some level of integrateddecision making
28% 30% 32% 34% 38%36%
38%
31%
31%
Integrated decision making overallFinally, participants rated themselves on their ability to take integrated decisions on price and availability developmentsin commodity markets (see figure 28). As this question istrivial for traders, Figure 29 only displays the survey resultsfor manufacturers.
Only one third of the participants indicate that decision making for commodity related topics can be considered as fully inte-grated decision making. So for the majority of participants improvements in decision making regarding commodity risks and commodity positions might be beneficial.
29
the way we see it
Figure 28: 45% use a direct link between sales contracts and purchase contracts
Figure 29: Self assessment on integrated decision making for commodity related topics (manufacturers only): 31% indicate that this is very limited.

5 Key findings and way forward
Historical data show a significant increase in commodity prices and its volatility. The expected scarcity of commodi-ties might lead to more supply disruptions in the future. Organizations that depend on the processing and con-sumption of commodity goods are exposed to an increas-ing risk regarding commodity sourcing and require a more innovative than traditional strategy to mitigate this risk.
30 Commodity risk mitigation – A survey
For that reason, the key question of this study was: how do organizations today prepare themselves to cope with the increasing risks related to availability and price volatility of com-modities? This paragraph presents the key findings of the survey that was executed to answer this question. The companies partici-pating in this study have a very significant exposure to commodity risks: almost 80% spend more than 30% of their revenue on commodities
Commodity risks and issues of participants• The top 3 of important issues in dealing with commodities
for the companies is: uncertainty in availability, strong price fluctuations, and the unpredictability of commodity prices.
Governance of commodity risk management• Only in 30% of the organizations, the executive management
is considered to be in the lead for the development &execution of the commodity risk strategy. In the other 70%, Procurement is in the lead.
• There is potential for improvement on commodity risk man-agement: 70% of the companies have structural KPIs for commodity risk management in place, but only 35% rate their insight in how well commodity risks are being managed as “good”.
• The KPIs on the long/short position are the most widely implemented indicators for insight into the commodity risks of the companies.
Managing commodity risks from a sourcingperspective• For organizations it is common practice to procure their
commodities against a market based price, either through long term contracts (80%) or through purchases on the spot market (60%). The risks organizations take with market based prices are mitigated using hedging mechanisms:50% of the participating companies use financial hedging through futures / forward contracts in a significant way.
• The multiple supplier strategy and the supplier partnerships strategy are applied extensively by respectively 90% and 70% of the organizations.
• The lack of knowledge and capabilities about sourcing mechanisms is indicated as the main bottleneck for further development. This holds for 45% of the organizations.
Managing commodity risks from a sales perspective• Larger companies are more able to transfer commodity price
changes to their customers when customers have a smaller bargaining power because of their limited size.
• 55% of the companies expect that their ability to transfer price changes of commodities to customers will remain unchanged in the near future.
Sourcing perspective
Percentage of participants
Co
mm
od
ity
Ris
kM
anag
emen
t p
ersp
ecti
ve
Sales perspective
Planning perspective
Extensively important
To a certain extent important
0% 10% 20% 30% 40% 50% 60% 70% 80% 100%90%
72%
28%
17%
83%
11%
89%
Figure 30: Current perception: Importance of the different perspectives
31
the way we see it
Managing commodity risks from a planning per-spective• 95% of the companies make estimations for the develop-
ment of commodity prices; for 40% this is a quantitative forecast of commodity prices.
• There is a strong correlation between the exposure to com-modity risks and the degree to which commodity related decisions are taken in an S&OP process. When the impact of commodities on business results is higher, organizations manage this impact more frequently in an integrated and structured way using the S&OP process.
• Of all commodity related topics, the expected commodity position over time (required versus available) is the most common topic on the agenda of the S&OP meeting.
• But on a more tactical planning level, almost one third indi-cates that integrated decision making on commodity related topics is very limited at this moment. The possible conse-quences, like unnecessary commodity risks or missed opportunities, will have to be assessed on individual com-pany level.
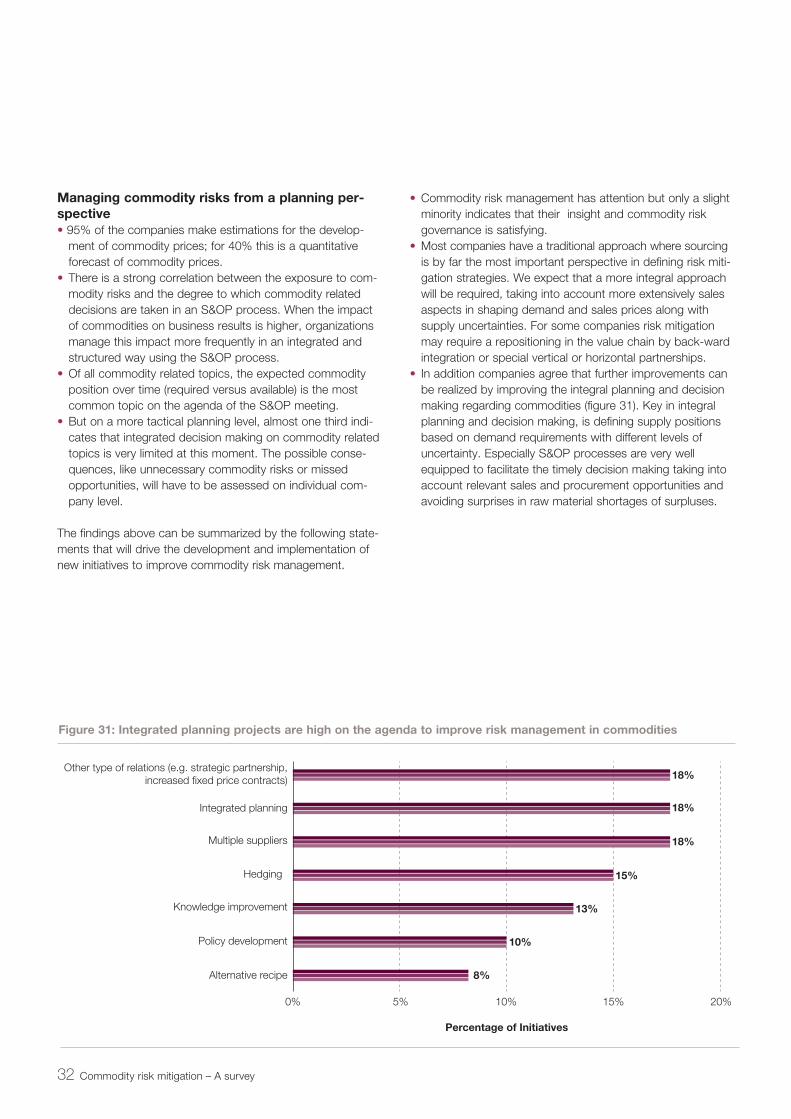
The findings above can be summarized by the following state-ments that will drive the development and implementation of new initiatives to improve commodity risk management.
Other type of relations (e.g. strategic partnership,increased fixed price contracts)
Percentage of Initiatives
Integrated planning
Multiple suppliers
Hedging
Knowledge improvement
Policy development
Alternative recipe
0% 5% 10% 15% 20%
18%
18%
18%
15%
13%
10%
8%
Figure 31: Integrated planning projects are high on the agenda to improve risk management in commodities
• Commodity risk management has attention but only a slight minority indicates that their insight and commodity risk governance is satisfying.
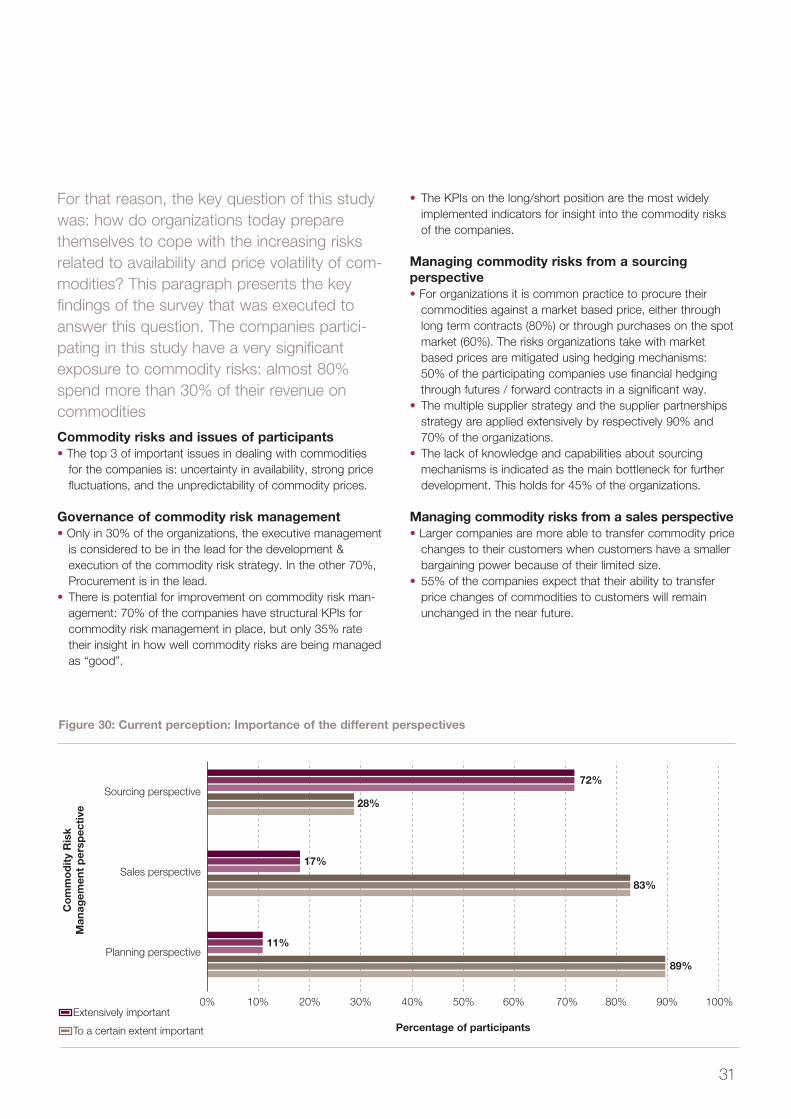
• Most companies have a traditional approach where sourcing is by far the most important perspective in defining risk miti-gation strategies. We expect that a more integral approach will be required, taking into account more extensively sales aspects in shaping demand and sales prices along with supply uncertainties. For some companies risk mitigation may require a repositioning in the value chain by back-ward integration or special vertical or horizontal partnerships.
• In addition companies agree that further improvements can be realized by improving the integral planning and decision making regarding commodities (figure 31). Key in integral planning and decision making, is defining supply positions based on demand requirements with different levels of uncertainty. Especially S&OP processes are very well equipped to facilitate the timely decision making taking into account relevant sales and procurement opportunities and avoiding surprises in raw material shortages of surpluses.
32 Commodity risk mitigation – A survey
With more than 130,000 people in over 40 countries, Capgemini is one of the world’s foremost providers of consulting, technology and outsourcing services. The Group reported 2013 global revenues of EUR 10.1 billion. Together with its clients, Capgemini creates and delivers business and technology solutions that fi t their needs and drive the results they want. A deeply multicultural organization, Capgemini has developed its own way of working, the Collaborative Business Experience™, and draws on Rightshore®, its worldwide delivery model.
Rightshore® is a trademark belonging to Capgemini.
Capgemini Consulting is the global strategy and transformation consulting organization of the Capgemini Group, specializing in advising and supporting enterprises in significant transformation, from innovative strategy to execution and with an unstinting focus on results. With the new digital economy creating significant disruptions and opportunities, our global team of over 3,600 talented individuals work with leading companies and governments to master Digital Transformation, drawing on our understanding of the digital economy and our leadership in business transformation and organizational change.
For more information:www.capgemini-consulting.nl
About Capgemini
IN/0
2-00
1.14
/ © S
hutt
erst
ock
33
the way we see it
Capgemini Consulting is the strategy and transformation consulting brand of Capgemini Group Copyright © 2014 Capgemini. All rights reserved.
Colophon
Capgemini ConsultingP.O. Box 2575 - 3500 GN UtrechtThe NetherlandsTel. + 31 30 689 0000www.capgemini-consulting.nl
Advice, design and production: Marketing & Communications: Nicole Hartung