© 2015 ihs ihs automotive automotive industry outlook: navigating a volatile global environment...
TRANSCRIPT
© 2015 IHS
IHS AUTOMOTIVE
Automotive Industry Outlook:
Navigating a Volatile Global Environment
January 2015
Mike WallDirector, Automotive AnalysisIHS Automotive
© 2015 IHS
Information | Analytics | Expertise
© 2015 IHS
IHS AUTOMOTIVE
2
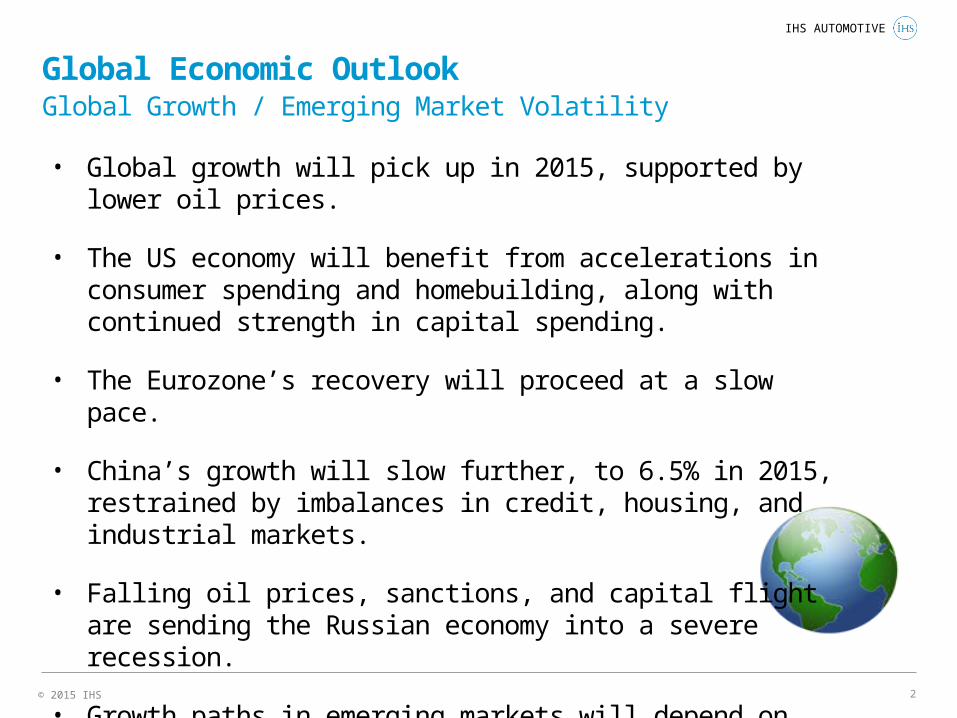
Global Economic OutlookGlobal Growth / Emerging Market Volatility
• Global growth will pick up in 2015, supported by lower oil prices.
• The US economy will benefit from accelerations in consumer spending and homebuilding, along with continued strength in capital spending.
• The Eurozone’s recovery will proceed at a slow pace.
• China’s growth will slow further, to 6.5% in 2015, restrained by imbalances in credit, housing, and industrial markets.
• Falling oil prices, sanctions, and capital flight are sending the Russian economy into a severe recession.
• Growth paths in emerging markets will depend on structural reforms that raise productivity and allocate capital more efficiently.
© 2015 IHS
IHS AUTOMOTIVE
3
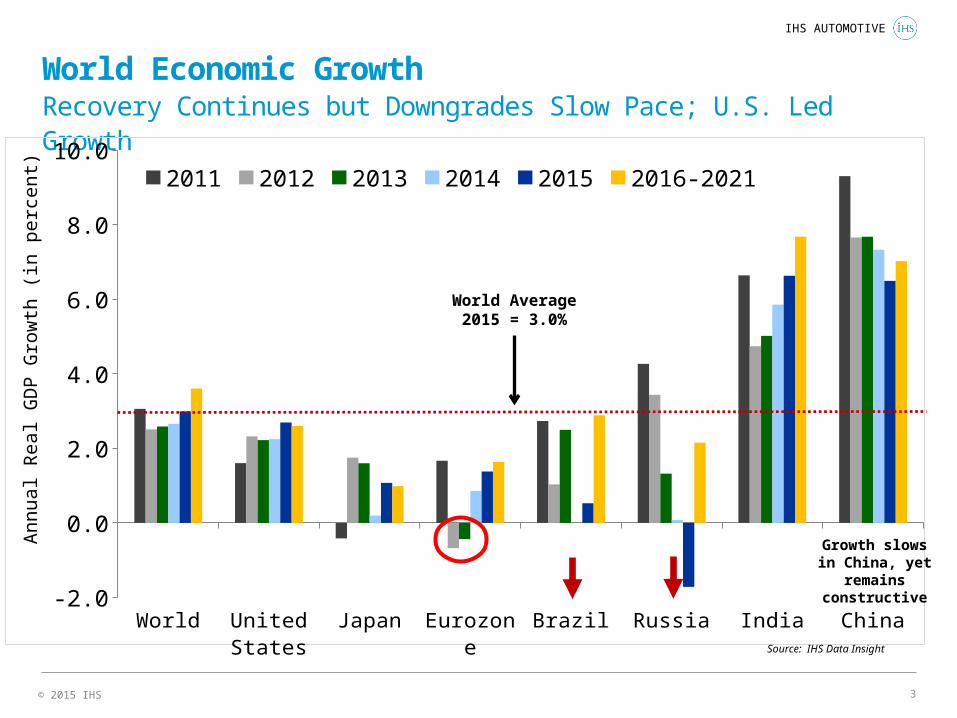
World Economic GrowthRecovery Continues but Downgrades Slow Pace; U.S. Led Growth
World United States
Japan Eurozone Brazil Russia India China-2.0
0.0
2.0
4.0
6.0
8.0
10.02011 2012 2013 2014 2015 2016-2021
Source: IHS Data Insight
Ann
ual R
eal G
DP
Gro
wth
(in
pe
rcen
t)
World Average 2015 = 3.0%
Growth slows in China, yet remains
constructive
© 2015 IHS
IHS AUTOMOTIVE
4
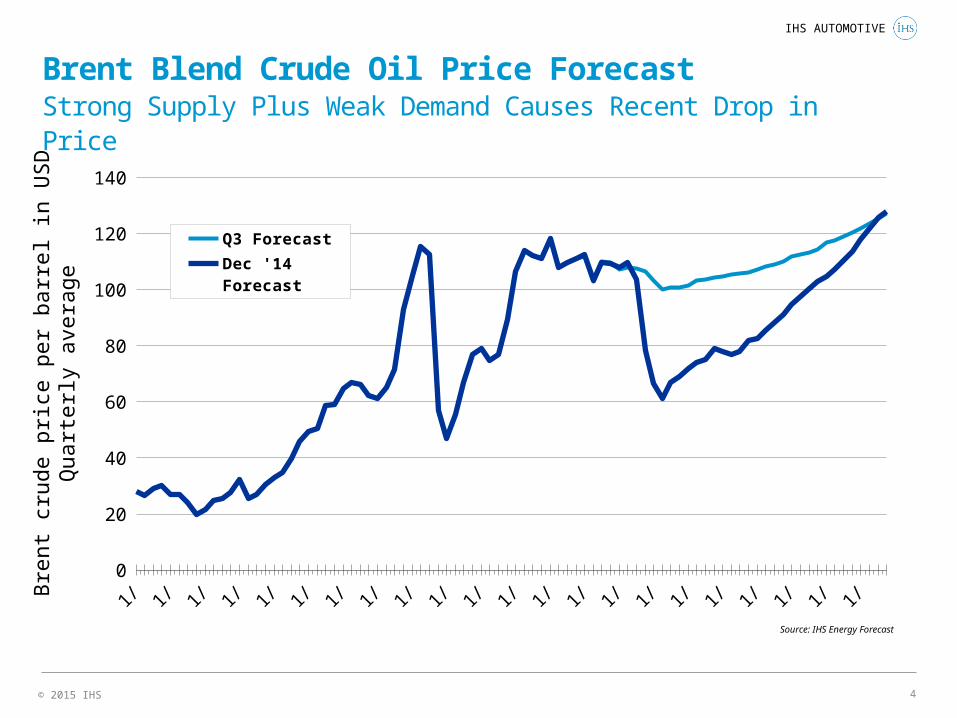
2000 2003 2006 2009 2012 2015 2018 20210
20
40
60
80
100
120
140
Q3 Forecast
Dec '14 Forecast
Brent Blend Crude Oil Price ForecastStrong Supply Plus Weak Demand Causes Recent Drop in Price
Source: IHS Energy Forecast
Bre
nt c
rude
pric
e pe
r ba
rrel
in U
SD
Qua
rter
ly a
vera
ge
© 2015 IHS
IHS AUTOMOTIVE
5
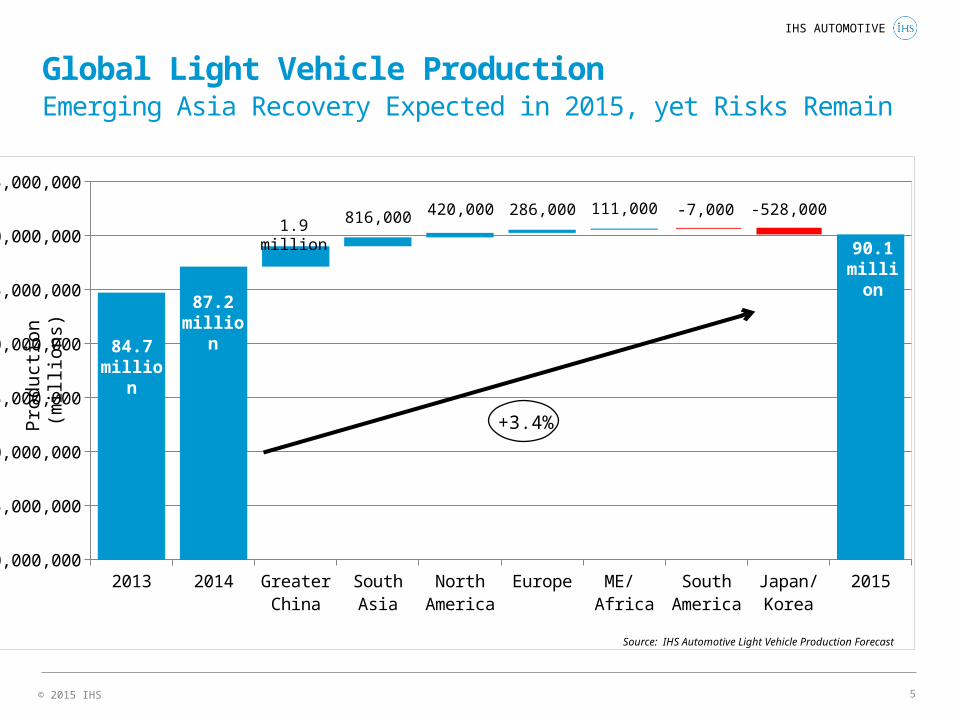
Global Light Vehicle ProductionEmerging Asia Recovery Expected in 2015, yet Risks Remain
2013 2014 Greater China
South Asia
North America
Europe ME/ Africa
South America
Japan/ Korea
201560,000,000
65,000,000
70,000,000
75,000,000
80,000,000
85,000,000
90,000,000
95,000,000
84.7million
87.2million
90.1million
+3.4%
1.9 million 816,000 420,000 286,000 111,000 -7,000 -528,000
Pro
duc
tion
(m
illio
ns)
Source: IHS Automotive Light Vehicle Production Forecast
© 2015 IHS
IHS AUTOMOTIVE
6
2007
2009
2011
2013
2015
2017
2019
2021
50000000
60000000
70000000
80000000
90000000
100000000
110000000
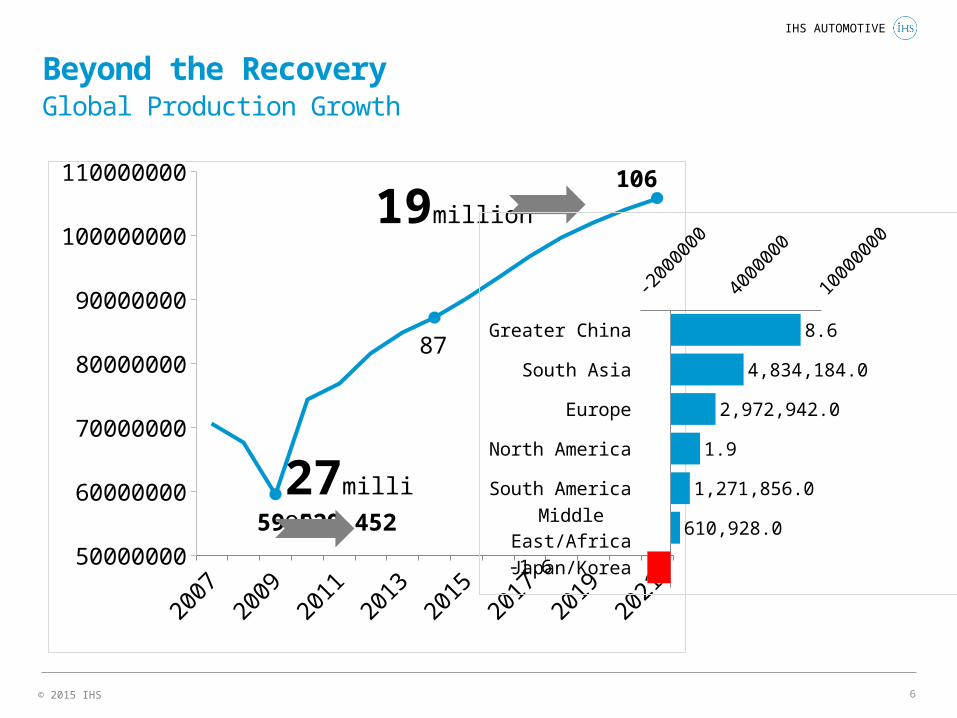
59,529,452
87
106
Beyond the RecoveryGlobal Production Growth
27million
19million
Greater China
South Asia
Europe
North America
South America
Middle East/Africa
Japan/Korea
-2000000
2000000
6000000
10000000
8.6
4,834,184.0
2,972,942.0
1.9
1,271,856.0
610,928.0
-1.6
© 2015 IHS
IHS AUTOMOTIVE
7
20052006
20072008
20092010
20112012
20132014
20152016
20172018
20192020
202110.0
11.0
12.0
13.0
14.0
15.0
16.0
17.0
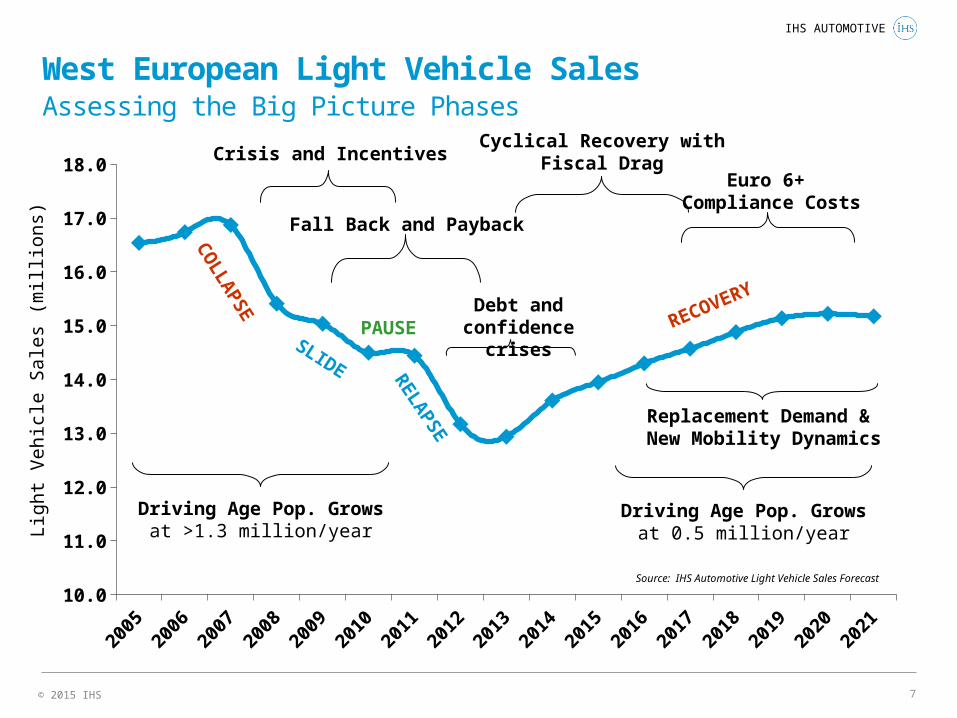
18.0Crisis and Incentives
Fall Back and Payback
Cyclical Recovery with Fiscal Drag
Euro 6+ Compliance Costs
Driving Age Pop. Growsat >1.3 million/year
Driving Age Pop. Growsat 0.5 million/year
Replacement Demand & New Mobility Dynamics
RECOVERY
CO
LLAP
SE
SLIDE
PAUSE
Ligh
t V
ehic
le S
ales
(m
illio
ns)
RELA
PSE
Debt and confidence crises
Source: IHS Automotive Light Vehicle Sales Forecast
West European Light Vehicle SalesAssessing the Big Picture Phases
© 2015 IHS
IHS AUTOMOTIVE
8
2007 2008 2009 2010 2011 2012 2013 2014 2015 2016 2017 2018 2019 2020 20210
5,000,000
10,000,000
15,000,000
20,000,000
25,000,000
-25%
-20%
-15%
-10%
-5%
0%
5%
10%
15%
20%
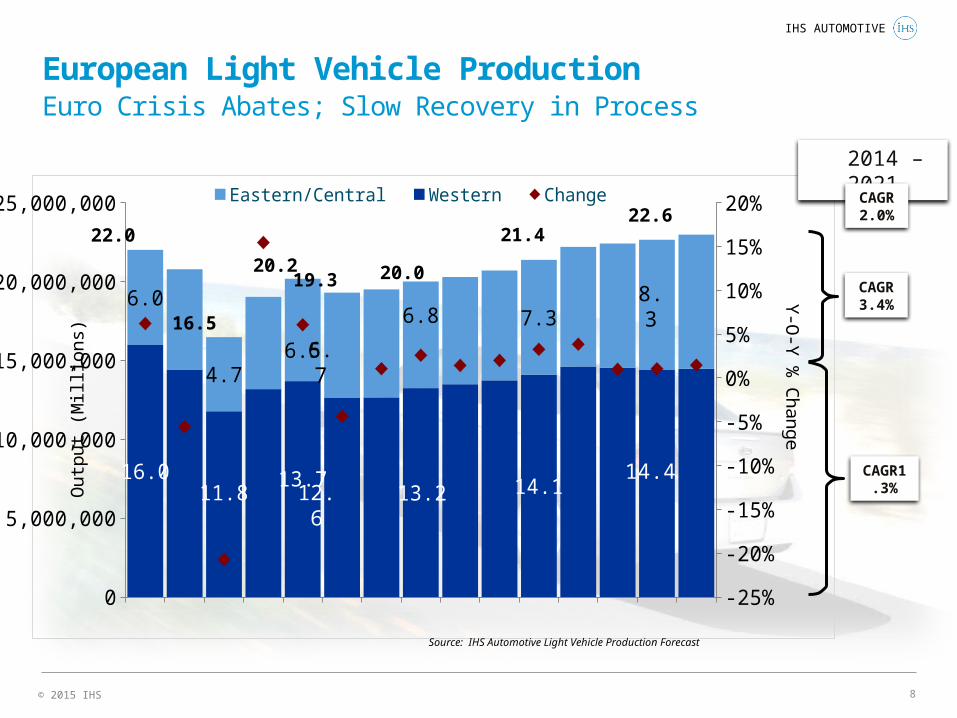
16.011.8
13.713.2 14.1
6.0
4.76.5
6.8 7.3
Eastern/Central Western Change
Ou
tpu
t (M
illio
ns)
Y-O
-Y %
Ch
an
ge
19.3 20.0
21.422.0
16.5
20.2
12.6
6.7
22.6
14.4
8.3 CAGR3.4%
CAGR1.3%
2014 – 2021
CAGR2.0%
Source: IHS Automotive Light Vehicle Production Forecast
European Light Vehicle ProductionEuro Crisis Abates; Slow Recovery in Process
© 2015 IHS
IHS AUTOMOTIVE
9
2010 2011 2012 2013 2014 2015 2016 2017 2018 2019 2020 20210.0
1,000,000.0
2,000,000.0
3,000,000.0
4,000,000.0
5,000,000.0
Production
Sales
Pro
du
cti
on
(M
illio
ns
)
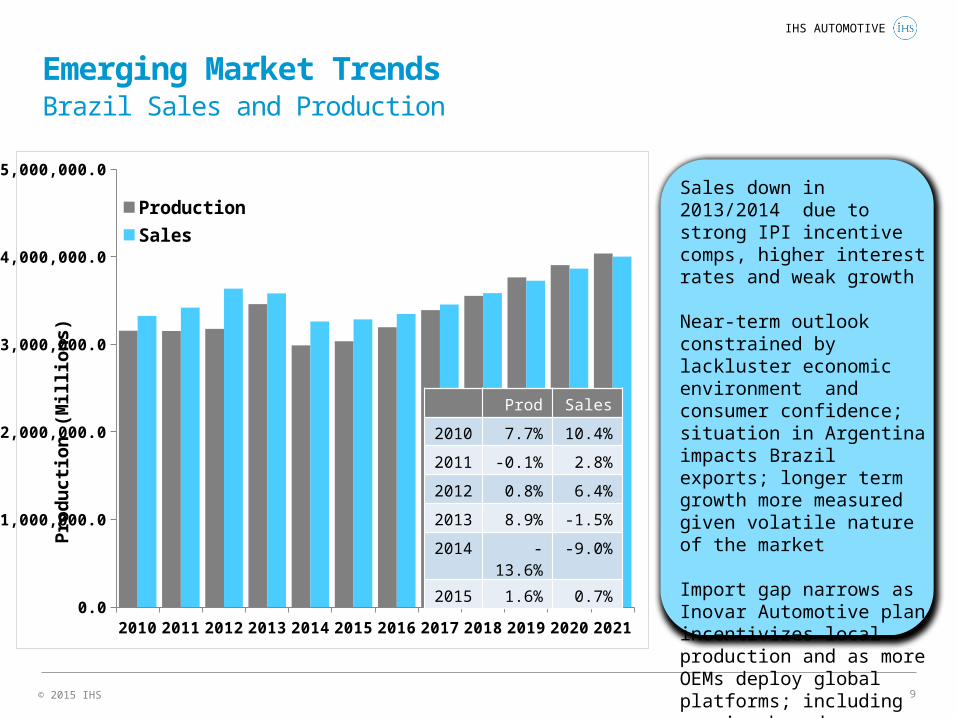
Sales down in 2013/2014 due to strong IPI incentive comps, higher interest rates and weak growth
Near-term outlook constrained by lackluster economic environment and consumer confidence; situation in Argentina impacts Brazil exports; longer term growth more measured given volatile nature of the market
Import gap narrows as Inovar Automotive plan incentivizes local production and as more OEMs deploy global platforms; including premium brands
Prod Sales
2010 7.7% 10.4%
2011 -0.1% 2.8%
2012 0.8% 6.4%
2013 8.9% -1.5%
2014 -13.6% -9.0%
2015 1.6% 0.7%
Emerging Market TrendsBrazil Sales and Production
© 2015 IHS
IHS AUTOMOTIVE
10
2010 2011 2012 2013 2014 2015 2016 2017 2018 2019 2020 20210.0
500,000.0
1,000,000.0
1,500,000.0
2,000,000.0
2,500,000.0
3,000,000.0
3,500,000.0
Production
Sales
Pro
du
cti
on
(M
illio
ns
)
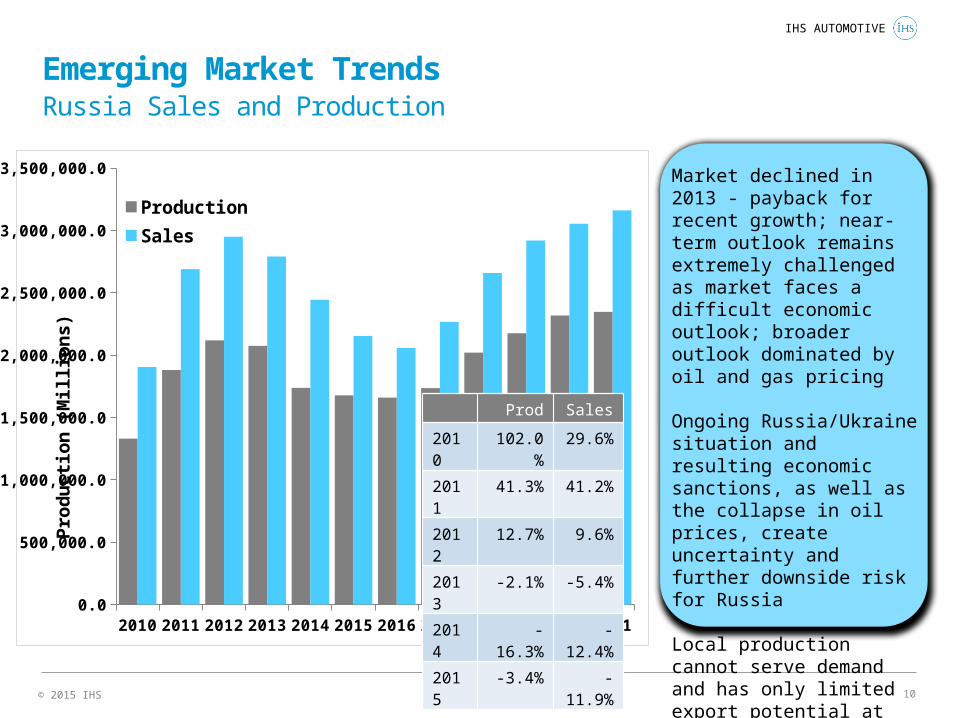
Market declined in 2013 - payback for recent growth; near-term outlook remains extremely challenged as market faces a difficult economic outlook; broader outlook dominated by oil and gas pricing
Ongoing Russia/Ukraine situation and resulting economic sanctions, as well as the collapse in oil prices, create uncertainty and further downside risk for Russia
Local production cannot serve demand and has only limited export potential at this stage
Prod Sales
2010 102.0% 29.6%
2011 41.3% 41.2%
2012 12.7% 9.6%
2013 -2.1% -5.4%
2014 -16.3% -12.4%
2015 -3.4% -11.9%
Emerging Market TrendsRussia Sales and Production
© 2015 IHS
IHS AUTOMOTIVE
11
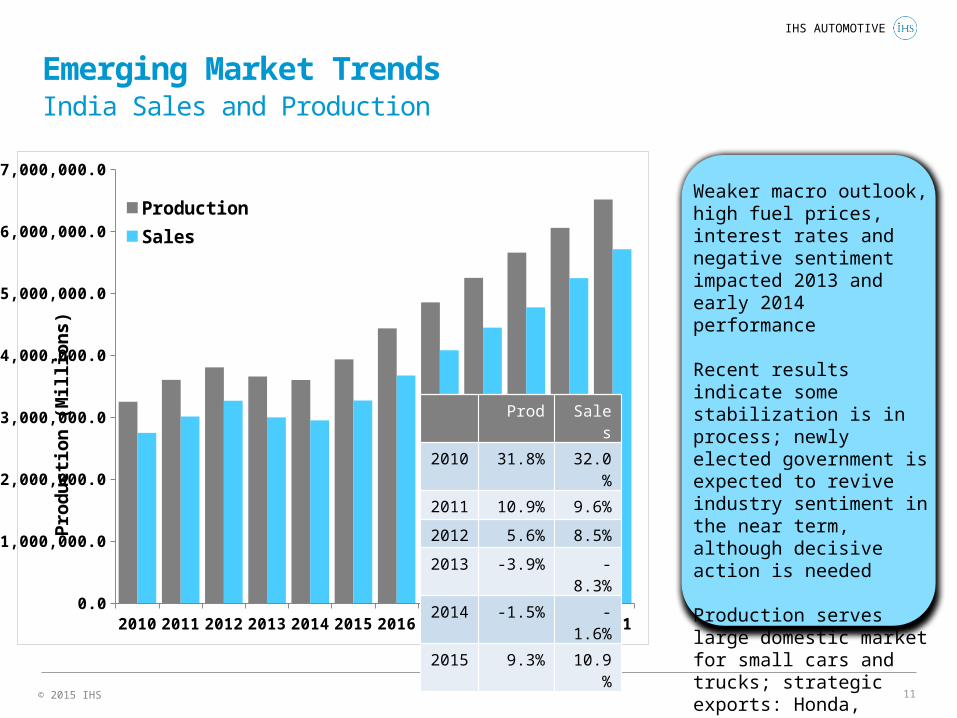
Emerging Market TrendsIndia Sales and Production
2010 2011 2012 2013 2014 2015 2016 2017 2018 2019 2020 20210.0
1,000,000.0
2,000,000.0
3,000,000.0
4,000,000.0
5,000,000.0
6,000,000.0
7,000,000.0
Production
Sales
Pro
du
cti
on
(M
illio
ns
)
Weaker macro outlook, high fuel prices, interest rates and negative sentiment impacted 2013 and early 2014 performance
Recent results indicate some stabilization is in process; newly elected government is expected to revive industry sentiment in the near term, although decisive action is needed
Production serves large domestic market for small cars and trucks; strategic exports: Honda, Hyundai, Nissan and others to follow
Prod Sales
2010 31.8% 32.0%
2011 10.9% 9.6%
2012 5.6% 8.5%
2013 -3.9% -8.3%
2014 -1.5% -1.6%
2015 9.3% 10.9%
© 2015 IHS
IHS AUTOMOTIVE
12
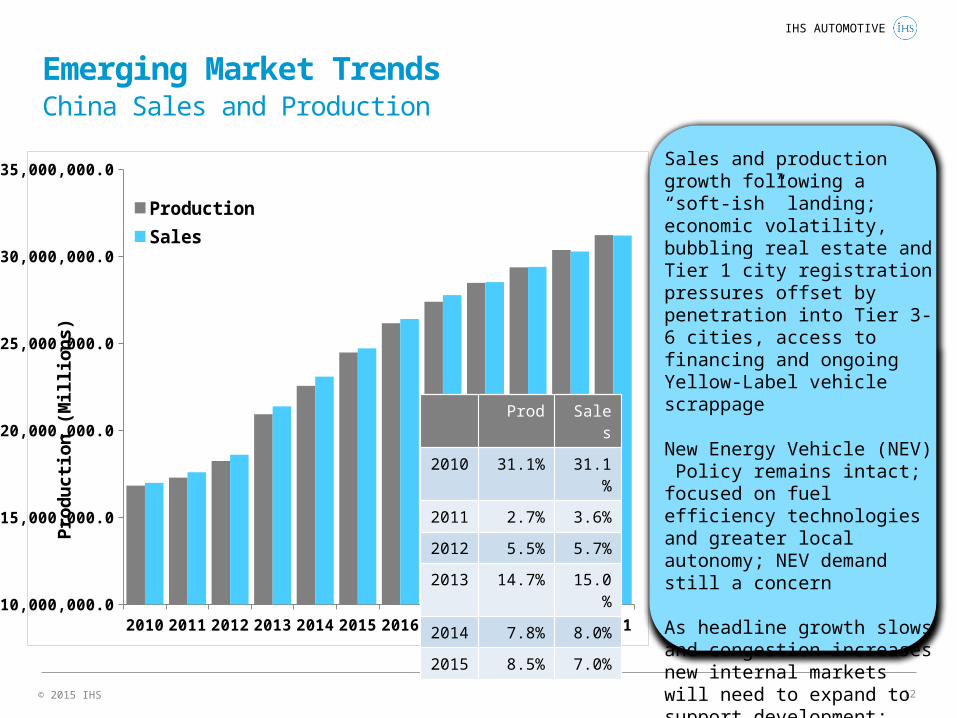
Emerging Market TrendsChina Sales and Production
2010 2011 2012 2013 2014 2015 2016 2017 2018 2019 2020 202110,000,000.0
15,000,000.0
20,000,000.0
25,000,000.0
30,000,000.0
35,000,000.0
Production
Sales
Pro
du
cti
on
(M
illio
ns
)
Prod Sales
2010 31.1% 31.1%
2011 2.7% 3.6%
2012 5.5% 5.7%
2013 14.7% 15.0%
2014 7.8% 8.0%
2015 8.5% 7.0%
Sales and production growth following a “soft-ish” landing; economic volatility, bubbling real estate and Tier 1 city registration pressures offset by penetration into Tier 3-6 cities, access to financing and ongoing Yellow-Label vehicle scrappage
New Energy Vehicle (NEV) Policy remains intact; focused on fuel efficiency technologies and greater local autonomy; NEV demand still a concern
As headline growth slows and congestion increases new internal markets will need to expand to support development; typically served by local OEMs but global players attracted
© 2015 IHS
IHS AUTOMOTIVE
13
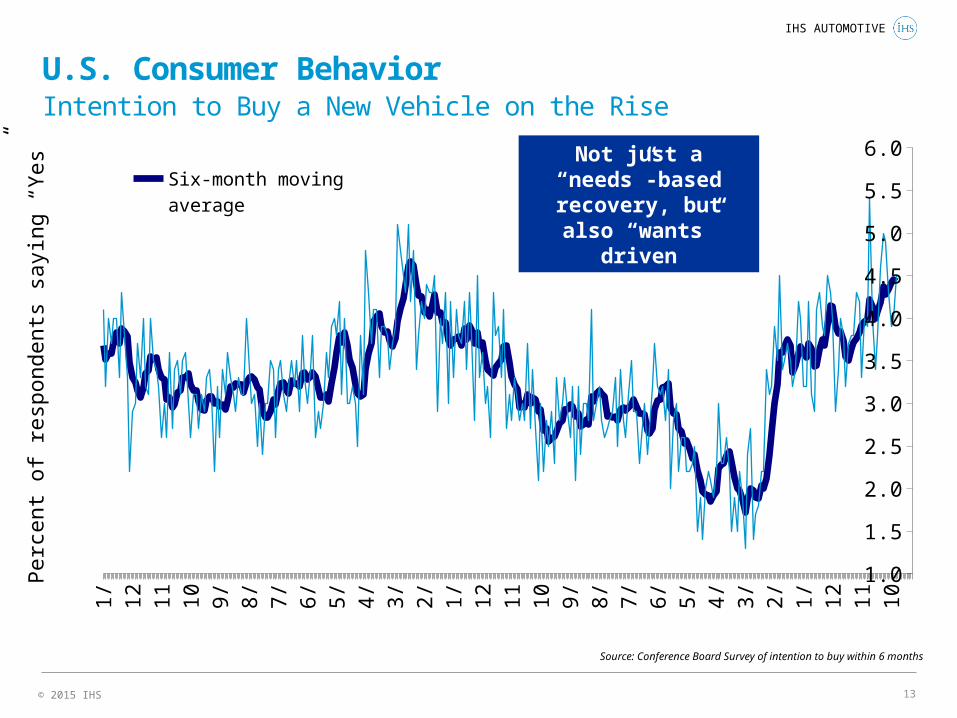
Source: Conference Board Survey of intention to buy within 6 months
Not just a “needs”-based recovery, but also “wants” driven
Per
cent
of r
espo
nden
ts s
ayin
g “Y
es”
19
90
19
91
19
92
19
93
19
94
19
95
19
96
19
97
19
98
19
99
20
00
20
01
20
02
20
03
20
04
20
05
20
06
20
07
20
08
20
09
20
10
20
11
20
12
20
13
20
14
1.0
1.5
2.0
2.5
3.0
3.5
4.0
4.5
5.0
5.5
6.0Six-month moving average
Actual
U.S. Consumer BehaviorIntention to Buy a New Vehicle on the Rise
© 2015 IHS
IHS AUTOMOTIVE
14
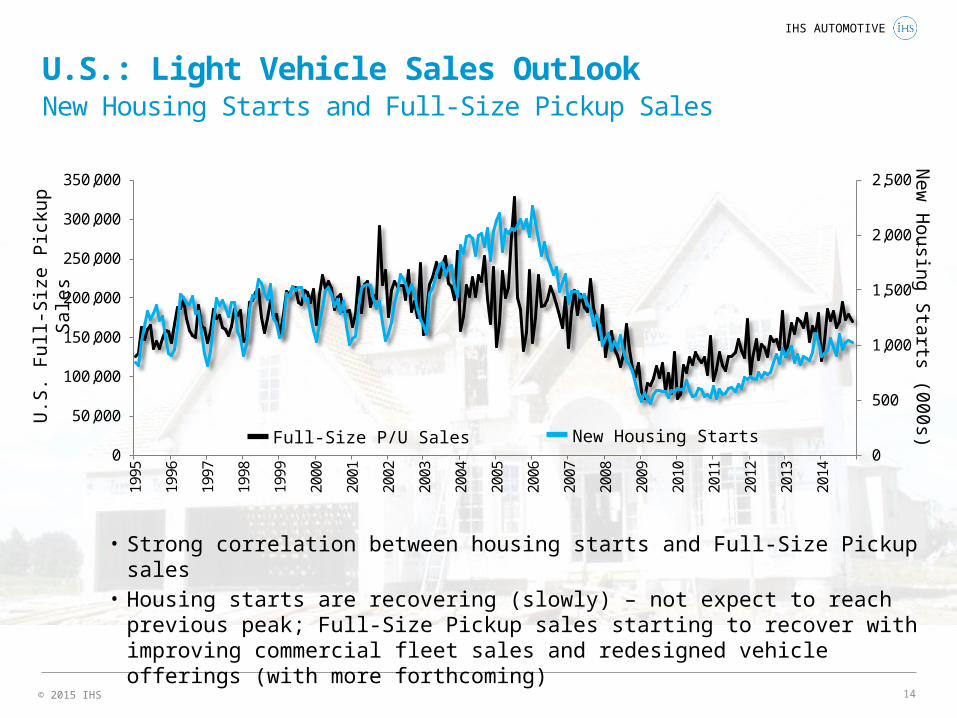
U.S.: Light Vehicle Sales OutlookNew Housing Starts and Full-Size Pickup Sales
0
500
1,000
1,500
2,000
2,500
0
50,000
100,000
150,000
200,000
250,000
300,000
350,000
1995
1996
1997
1998
1999
2000
2001
2002
2003
2004
2005
2006
2007
2008
2009
2010
2011
2012
2013
2014
Thou
sand
s
U.S
. F
ull-
Siz
e P
icku
p S
ales
New
Housing S
tarts (000s)
New Housing StartsFull-Size P/U Sales
• Strong correlation between housing starts and Full-Size Pickup sales• Housing starts are recovering (slowly) – not expect to reach previous peak; Full-Size
Pickup sales starting to recover with improving commercial fleet sales and redesigned vehicle offerings (with more forthcoming)
© 2015 IHS
IHS AUTOMOTIVE
15
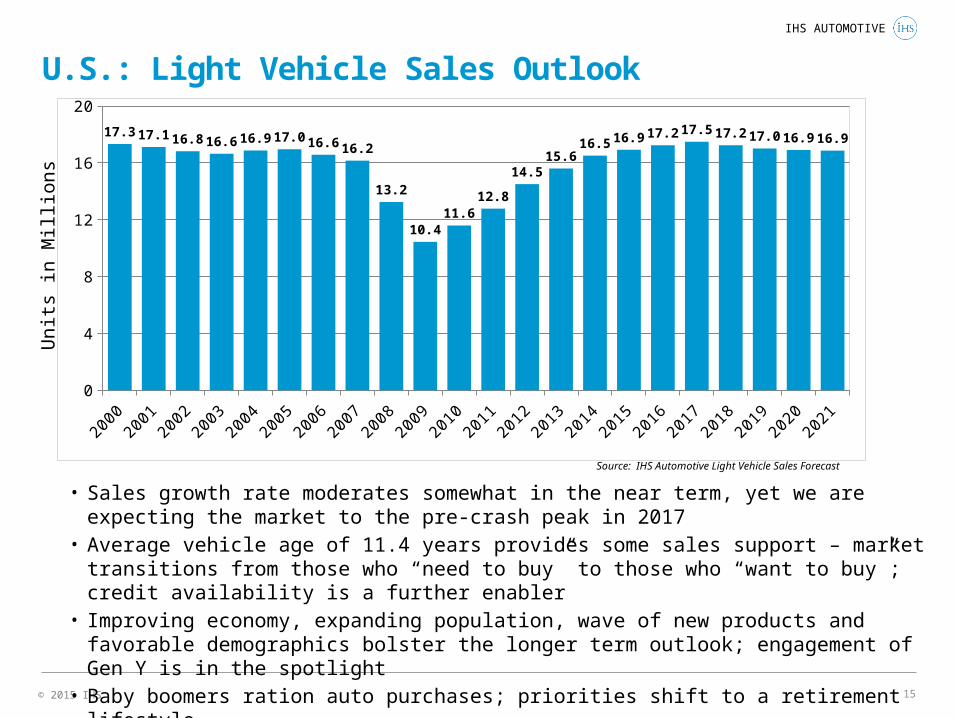
• Sales growth rate moderates somewhat in the near term, yet we are expecting the market to the pre-crash peak in 2017
• Average vehicle age of 11.4 years provides some sales support – market transitions from those who “need to buy” to those who “want to buy”; credit availability is a further enabler
• Improving economy, expanding population, wave of new products and favorable demographics bolster the longer term outlook; engagement of Gen Y is in the spotlight
• Baby boomers ration auto purchases; priorities shift to a retirement lifestyle
2000
2001
2002
2003
2004
2005
2006
2007
2008
2009
2010
2011
2012
2013
2014
2015
2016
2017
2018
2019
2020
2021
0
4
8
12
16
20
17.3 17.1 16.8 16.6 16.9 17.0 16.6 16.2
13.2
10.411.6
12.8
14.515.6
16.5 16.9 17.2 17.5 17.2 17.0 16.9 16.9
Uni
ts in
Mill
ions
Source: IHS Automotive Light Vehicle Sales Forecast
U.S.: Light Vehicle Sales Outlook
© 2015 IHS
IHS AUTOMOTIVE
16
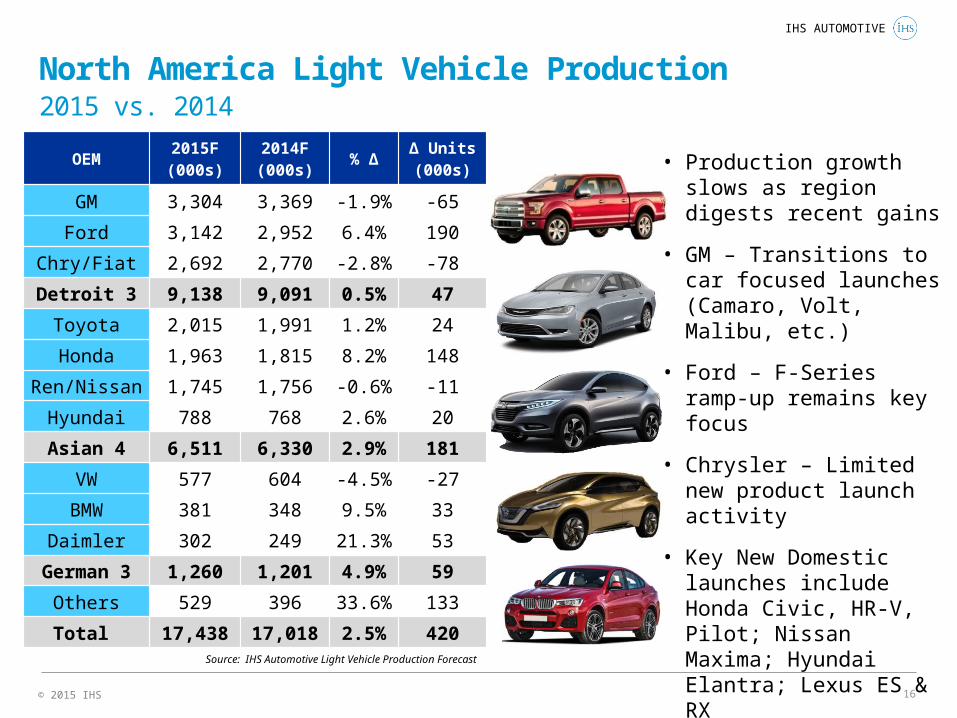
North America Light Vehicle Production2015 vs. 2014
OEM2015F(000s)
2014F(000s)
% ∆∆ Units (000s)
GM 3,304 3,369 -1.9% -65
Ford 3,142 2,952 6.4% 190
Chry/Fiat 2,692 2,770 -2.8% -78
Detroit 3 9,138 9,091 0.5% 47
Toyota 2,015 1,991 1.2% 24
Honda 1,963 1,815 8.2% 148
Ren/Nissan 1,745 1,756 -0.6% -11
Hyundai 788 768 2.6% 20
Asian 4 6,511 6,330 2.9% 181
VW 577 604 -4.5% -27
BMW 381 348 9.5% 33
Daimler 302 249 21.3% 53
German 3 1,260 1,201 4.9% 59
Others 529 396 33.6% 133
Total 17,438 17,018 2.5% 420
• Production growth slows as region digests recent gains
• GM – Transitions to car focused launches (Camaro, Volt, Malibu, etc.)
• Ford – F-Series ramp-up remains key focus
• Chrysler – Limited new product launch activity
• Key New Domestic launches include Honda Civic, HR-V, Pilot; Nissan Maxima; Hyundai Elantra; Lexus ES & RX
• Mexico capacity additions ramp up in advance of next wave in 2016/2017Source: IHS Automotive Light Vehicle Production Forecast
© 2015 IHS
IHS AUTOMOTIVE
17
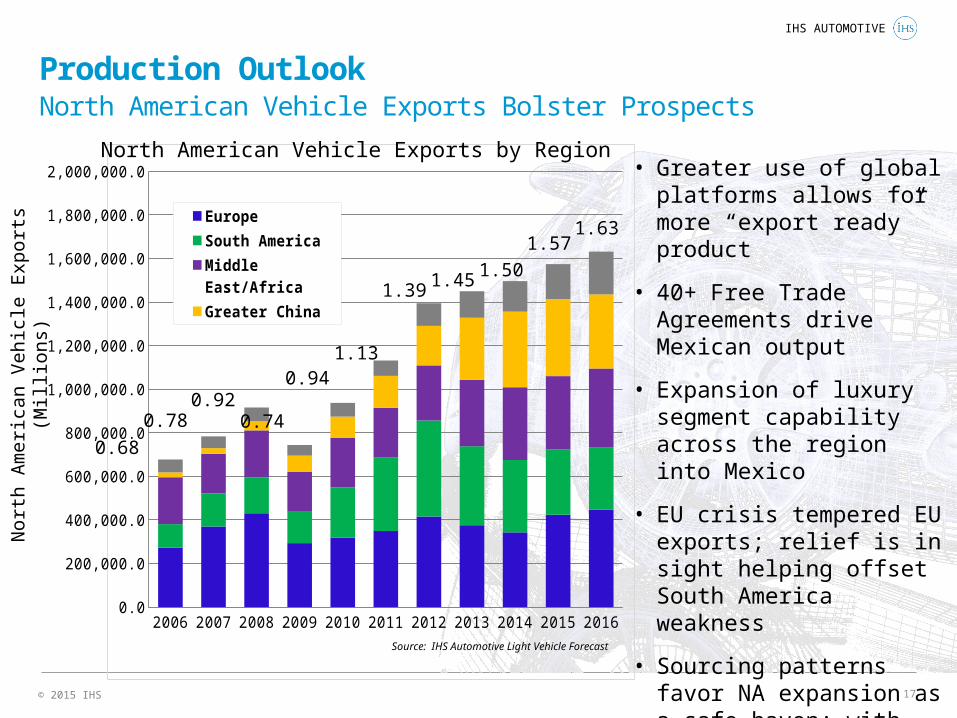
Production OutlookNorth American Vehicle Exports Bolster Prospects
2006 2007 2008 2009 2010 2011 2012 2013 2014 2015 20160.0
200,000.0
400,000.0
600,000.0
800,000.0
1,000,000.0
1,200,000.0
1,400,000.0
1,600,000.0
1,800,000.0
2,000,000.0
Europe
South America
Middle East/Africa
Greater China
Other
Nor
th A
mer
ican
Veh
icle
Exp
orts
(M
illio
ns)
North American Vehicle Exports by Region
0.68
0.920.74
0.94
0.78
1.13
1.39 1.45 1.50
1.57
• Greater use of global platforms allows for more “export ready” product
• 40+ Free Trade Agreements drive Mexican output
• Expansion of luxury segment capability across the region into Mexico
• EU crisis tempered EU exports; relief is in sight helping offset South America weakness
• Sourcing patterns favor NA expansion as a safe haven; with currency hedge & export prospects
1.63
Source: IHS Automotive Light Vehicle Forecast
© 2015 IHS
IHS AUTOMOTIVE
18
2007 2008 2009 2010 2011 2012 2013 2014 2015 2016 2017 2018 2019 2020 20210
2000000
4000000
6000000
8000000
10000000
12000000
14000000
16000000
18000000
20000000
-40%
-30%
-20%
-10%
0%
10%
20%
30%
40%
50%
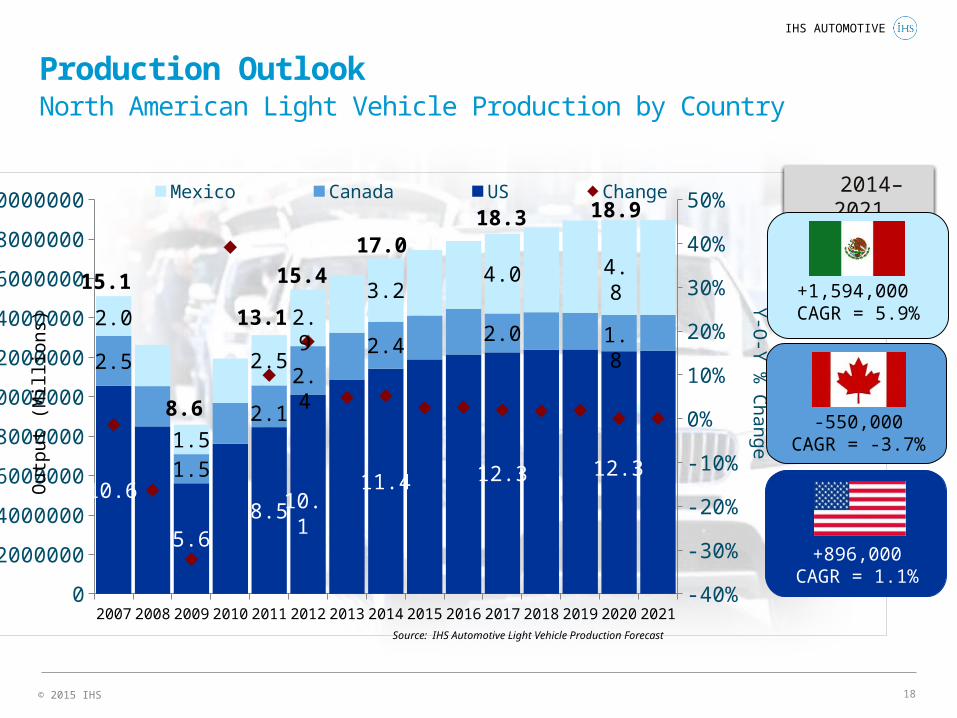
10.6
5.68.5
11.4 12.3
2.5
1.5
2.1
2.42.0
2.0
1.5
2.5
3.24.0
Mexico Canada US Change
Ou
tpu
t (M
illio
ns)
Y-O
-Y %
Ch
an
ge
2014–2021
+896,000CAGR = 1.1%
-550,000CAGR = -3.7%
+1,594,000 CAGR = 5.9%
15.4
17.018.3
15.1
8.6
13.1
10.1
2.4
2.9
18.9
12.3
1.8
4.8
Source: IHS Automotive Light Vehicle Production Forecast
Production OutlookNorth American Light Vehicle Production by Country
© 2015 IHS
IHS AUTOMOTIVE
19
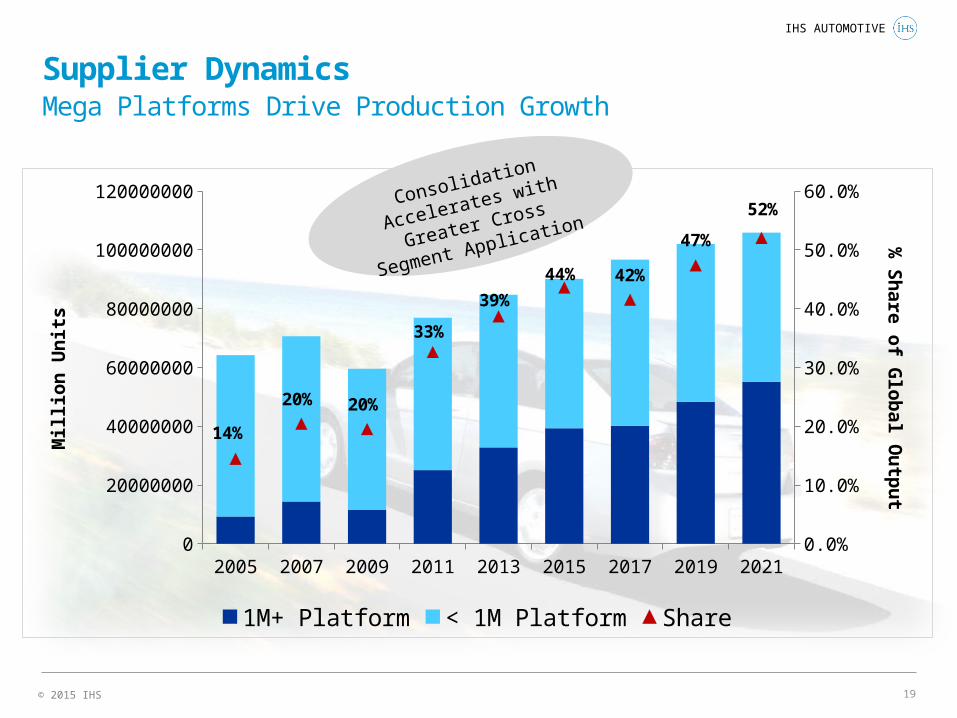
Supplier DynamicsMega Platforms Drive Production Growth
2005 2007 2009 2011 2013 2015 2017 2019 20210
20000000
40000000
60000000
80000000
100000000
120000000
0.0%
10.0%
20.0%
30.0%
40.0%
50.0%
60.0%
14%
20% 20%
33%
39%
44% 42%
47%
52%
1M+ Platform < 1M Platform Share
Mill
ion
Un
its
% S
ha
re o
f Glo
ba
l Ou
tpu
t
Consolidation Accelerates
with Greater Cross
Segment Application
© 2015 IHS
IHS AUTOMOTIVE
20
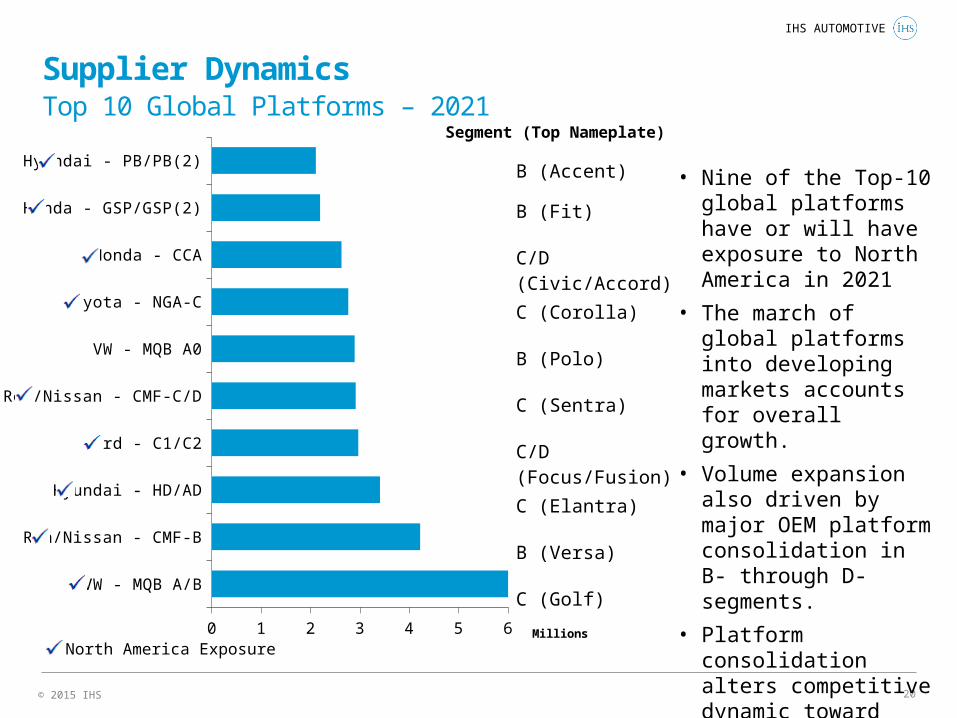
Supplier DynamicsTop 10 Global Platforms – 2021
VW - MQB A/B
Ren/Nissan - CMF-B
Hyundai - HD/AD
Ford - C1/C2
Ren/Nissan - CMF-C/D
VW - MQB A0
Toyota - NGA-C
Honda - CCA
Honda - GSP/GSP(2)
Hyundai - PB/PB(2)
0 1 2 3 4 5 6 Millions
• Nine of the Top-10 global platforms have or will have exposure to North America in 2021
• The march of global platforms into developing markets accounts for overall growth.
• Volume expansion also driven by major OEM platform consolidation in B- through D-segments.
• Platform consolidation alters competitive dynamic toward larger, more diversified players.
Segment (Top Nameplate)
North America Exposure
B (Accent)
B (Fit)
C/D (Civic/Accord)
C (Corolla)
B (Polo)
C (Sentra)
C/D (Focus/Fusion)
C (Elantra)
B (Versa)
C (Golf)
© 2015 IHS
IHS AUTOMOTIVE
21
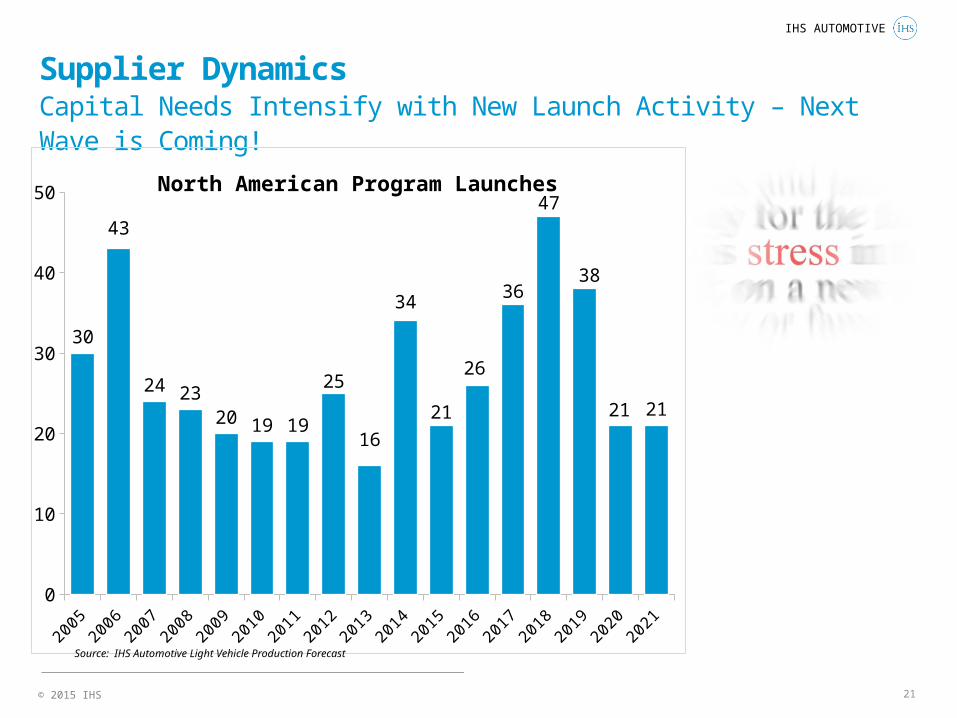
Supplier DynamicsCapital Needs Intensify with New Launch Activity – Next Wave is Coming!
2005
2006
2007
2008
2009
2010
2011
2012
2013
2014
2015
2016
2017
2018
2019
2020
2021
0
10
20
30
40
50
30
43
24 2320 19 19
25
16
34
21
26
36
47
38
21 21
North American Program Launches
Source: IHS Automotive Light Vehicle Production Forecast
© 2015 IHS
IHS AUTOMOTIVE
22
Summary
• North America serves as a critical offset to the volatility and lackluster growth presented by key Emerging Markets
– North American output surges by over 800,000 units in 2014. Growth rate subsides going forward, yet long term production volumes approach 19.0 million units in the longer term.
– Surge of new product offerings creates margin pressure for weaker players – competition will only intensify!
– Emerging market growth varies by country; more measured in near term
• Technology serves as a key differentiator for automakers and suppliers alike
– Opportunities exist in the areas of ADAS, Infotainment, Powertrain and Lightweighting, among others.
• Robust long-term prospects remain
– Local output of all-new entries surges, serving as gateways to secure growth
IHS Customer Care:• Americas: +1 800 IHS CARE (+1 800 447 2273); [email protected] • Europe, Middle East, and Africa: +44 (0) 1344 328 300; [email protected] • Asia and the Pacific Rim: +604 291 3600; [email protected]
© 2015 IHS. No portion of this report may be reproduced, reused, or otherwise distributed in any form without prior written consent, with the exception of any internal client distribution as may be permitted in the license agreement between client and IHS. Content reproduced or redistributed with IHS permission must display IHS legal notices and attributions of authorship. The information contained herein is from sources considered reliable but its accuracy and completeness are not warranted, nor are the opinions and analyses which are based upon it, and to the extent permitted by law, IHS shall not be liable for any errors or omissions or any loss, damage or expense incurred by reliance on information or any statement contained herein. For more information, please contact IHS at Customer Care (see phone numbers and email addresses above). All products, company names or other marks appearing in this publication are the trademarks and property of IHS or their respective owners.
Thank You!
Mike Wall Director, Automotive AnalysisIHS Automotive
[email protected]+1 616 222 4480 Direct+1 616 446 6885 Mobile
IHS Customer Care:• Americas: +1 800 IHS CARE (+1 800 447 2273); [email protected] • Europe, Middle East, and Africa: +44 (0) 1344 328 300; [email protected] • Asia and the Pacific Rim: +604 291 3600; [email protected]
© 2015 IHS. No portion of this report may be reproduced, reused, or otherwise distributed in any form without prior written consent, with the exception of any internal client distribution as may be permitted in the license agreement between client and IHS. Content reproduced or redistributed with IHS permission must display IHS legal notices and attributions of authorship. The information contained herein is from sources considered reliable but its accuracy and completeness are not warranted, nor are the opinions and analyses which are based upon it, and to the extent permitted by law, IHS shall not be liable for any errors or omissions or any loss, damage or expense incurred by reliance on information or any statement contained herein. For more information, please contact IHS at Customer Care (see phone numbers and email addresses above). All products, company names or other marks appearing in this publication are the trademarks and property of IHS or their respective owners.
DISCLAIMER This written material (“Material”) was produced by IHS Automotive and/or its subsidiaries and affiliates (collectively known as “IHS”). The Material contains information and analysis of IHS (“IHS Information”), and is based on information collected within the public domain and on assessments by IHS. IHS conducted its analysis and prepared this Material utilizing reasonable care and skill in applying methods of analysis consistent with normal industry practice. All results are based on information available at the time of review. Other information, including government sources, trade associations or marketplace participants, may have provided some of the information on which the analyses or data is based. IHS may have utilized such information without verification and accepts no liability for errors or inaccuracies. Changes in factors upon which the analysis is based could affect the results. Forecasts are inherently uncertain because of events or combinations of events that cannot reasonably be foreseen including the actions of government, individuals, third parties and marketplace participants. IHS shall not be liable for any claims whatsoever, whether caused by negligence, errors, omissions, strict liability, or contribution. NO IMPLIED WARRANTY OF MERCHANTABILITY OR FITNESS FOR A PARTICULAR PURPOSE SHALL APPLY. IHS MAKES NO GUARANTY OR WARRANTY AND ASSUMES NO LIABILITY AS TO USE. IHS Information is provided for the sole benefit of client and, unless otherwise approved in advance in writing by IHS, are non-transferrable, non-assignable, and are for clients’ internal use only. All intellectual property rights including copyrights in or to the IHS information are owned by, vest in, inure to, and shall remain with IHS. Any third party in possession of IHS Information or analyses i) may not incorporate IHS Information into a registration statement, securities related filing, prospectus, public or private debt issue documentation, any bond issue documentation or other offering document; ii) may not rely on the conclusions contained in the Material and iii) uses such IHS Information at its own risk. Possession of IHS Information does not carry with it the right of publication. The name of IHS, or any trade name, trademark, service mark, or symbol owned by IHS may not be used in advertising, publicity, or to represent, directly or indirectly, that any product has been approved or endorsed by IHS.